
Characterization of Bubble Transport in Porous Media Using a Microfluidic Channel

Department of Civil and Environmental Engineering, University of Nebraska-Lincoln, Lincoln, NE 68588, USA
*
Author to whom correspondence should be addressed.
Water 2023, 15(6), 1033; https://doi.org/10.3390/w15061033
Submission received: 1 February 2023
/
Revised: 5 March 2023
/
Accepted: 7 March 2023
/
Published: 9 March 2023
(This article belongs to the Special Issue Natural and Engineered Phenomena Impacting the Fate, Transport and Treatment of Environmental Contaminants)
Abstract
:This study investigates the effect on varying flow rates and bubble sizes on gas–liquid flow through porous media in a horizontal microchannel. A simple bubble generation system was set up to generate bubbles with controllable sizes and frequencies, which directly flowed into microfluidic channels packed with different sizes of glass beads. Bubble flow was visualized using a high-speed camera and analyzed to obtain the change in liquid holdup. Pressure data were measured for estimation of hydraulic conductivity. The bubble displacement pattern in the porous media was viscous fingering based on capillary numbers and visual observation. Larger bubbles resulted in lower normalized frequency of the bubble breakthrough by 20 to 60 percent. Increasing the flow rate increased the change in apparent liquid holdup during bubble breakthrough. Larger bubbles and lower flow rate reduced the relative permeability of each channel by 50 to 57 percent and 30 to 64 percent, respectively.
1. Introduction
Understanding bubble transport in porous media is important to many engineering applications [1,2,3]. In the field of environmental engineering, bubble flow was used as a tool to remove contaminants from soils and groundwater [4,5]. In situ caps for sediments usually consist of multiple layers of porous media. Gas ebullition, or generation and penetration of bubbles in sediment caps, may induce the failure of capping [6]. Foam flooding, another form of bubble technique, is widely used for enhancing oil recovery in petroleum engineering [7]. Recently, hydrogen storage in deep underground became an important technique for energy storage. Understanding how hydrogen bubbles move in porous media is essential to the success of such technology [8].
Bubble transport in porous media is influenced by various factors, such as flow velocity [9], porous media property [10], composition of liquid in pores [11], and the sizes of bubbles [12]. The majority of available experimental works focused on continuum scale [11,13,14,15]. While studies on continuum scale can provide a lot of useful information, the behavior of bubbles cannot be directly observed. A few studies reported the effect of fundamental variables on air bubble transport in porous media using computational models or microfluidic devices [16,17,18]. For instance, some studies demonstrated the mechanisms of foam generation in microchannels [19,20]. Another work [21] found that the roughness of pore can provide extra resistance when bubbles penetrate the pore-throats based on direct observations in microfluidic flow channels. Tourvieille et al. studied the effects of flow velocity and liquid viscosity on foam flow pattern in a microreactor packed with spheres [22]. A subset of studies focused on bubble trapping and removal in porous media using micromodels [23,24,25]. Phenomenological models have been proposed for bubble mechanics in horizontal multiphase flow with ideal fluids in packed microchannels [26,27,28].
Although the sizes and bubble frequency are important to their transport, these parameters were not typically considered in most studies. Bubble characteristics are well known to affect mass transfer and flow characteristics of multiphase flow [29,30]. However, experimental results of these parameters through porous media at the microscale are rare. Small bubble generation methods are not trivial. They typically involve microchannel machining methods such as fabricating a polymethylmethacrylate (PMMA) device to make T junctions for bubble formation [31,32,33,34] and need to use complex fluid flow control equipment [35,36].
In this study, we evaluated the effect of varying flow rates and bubble sizes on gas–liquid flow through porous media in a horizontal microchannel. For each experiment, we used a simple syringe pump and commercially available microchannels to generate gas bubbles, a novel method that requires no complex equipment. We controlled bubble size by adjusting air and water flow rates. The bubble generation system can be easily connected with another microfluidic channel to perform a series of bubble transport experiments. Bubble breakthrough and bubble displacement pattern in porous media were visualized across the entire channel, generating data not usually available in this type of study. We also utilized measured pressure data in situ to analyze the effects of pore size, bubble size, and flow rate on the bubble transport process.
2. Materials and Methods
2.1. Bubble Generation System
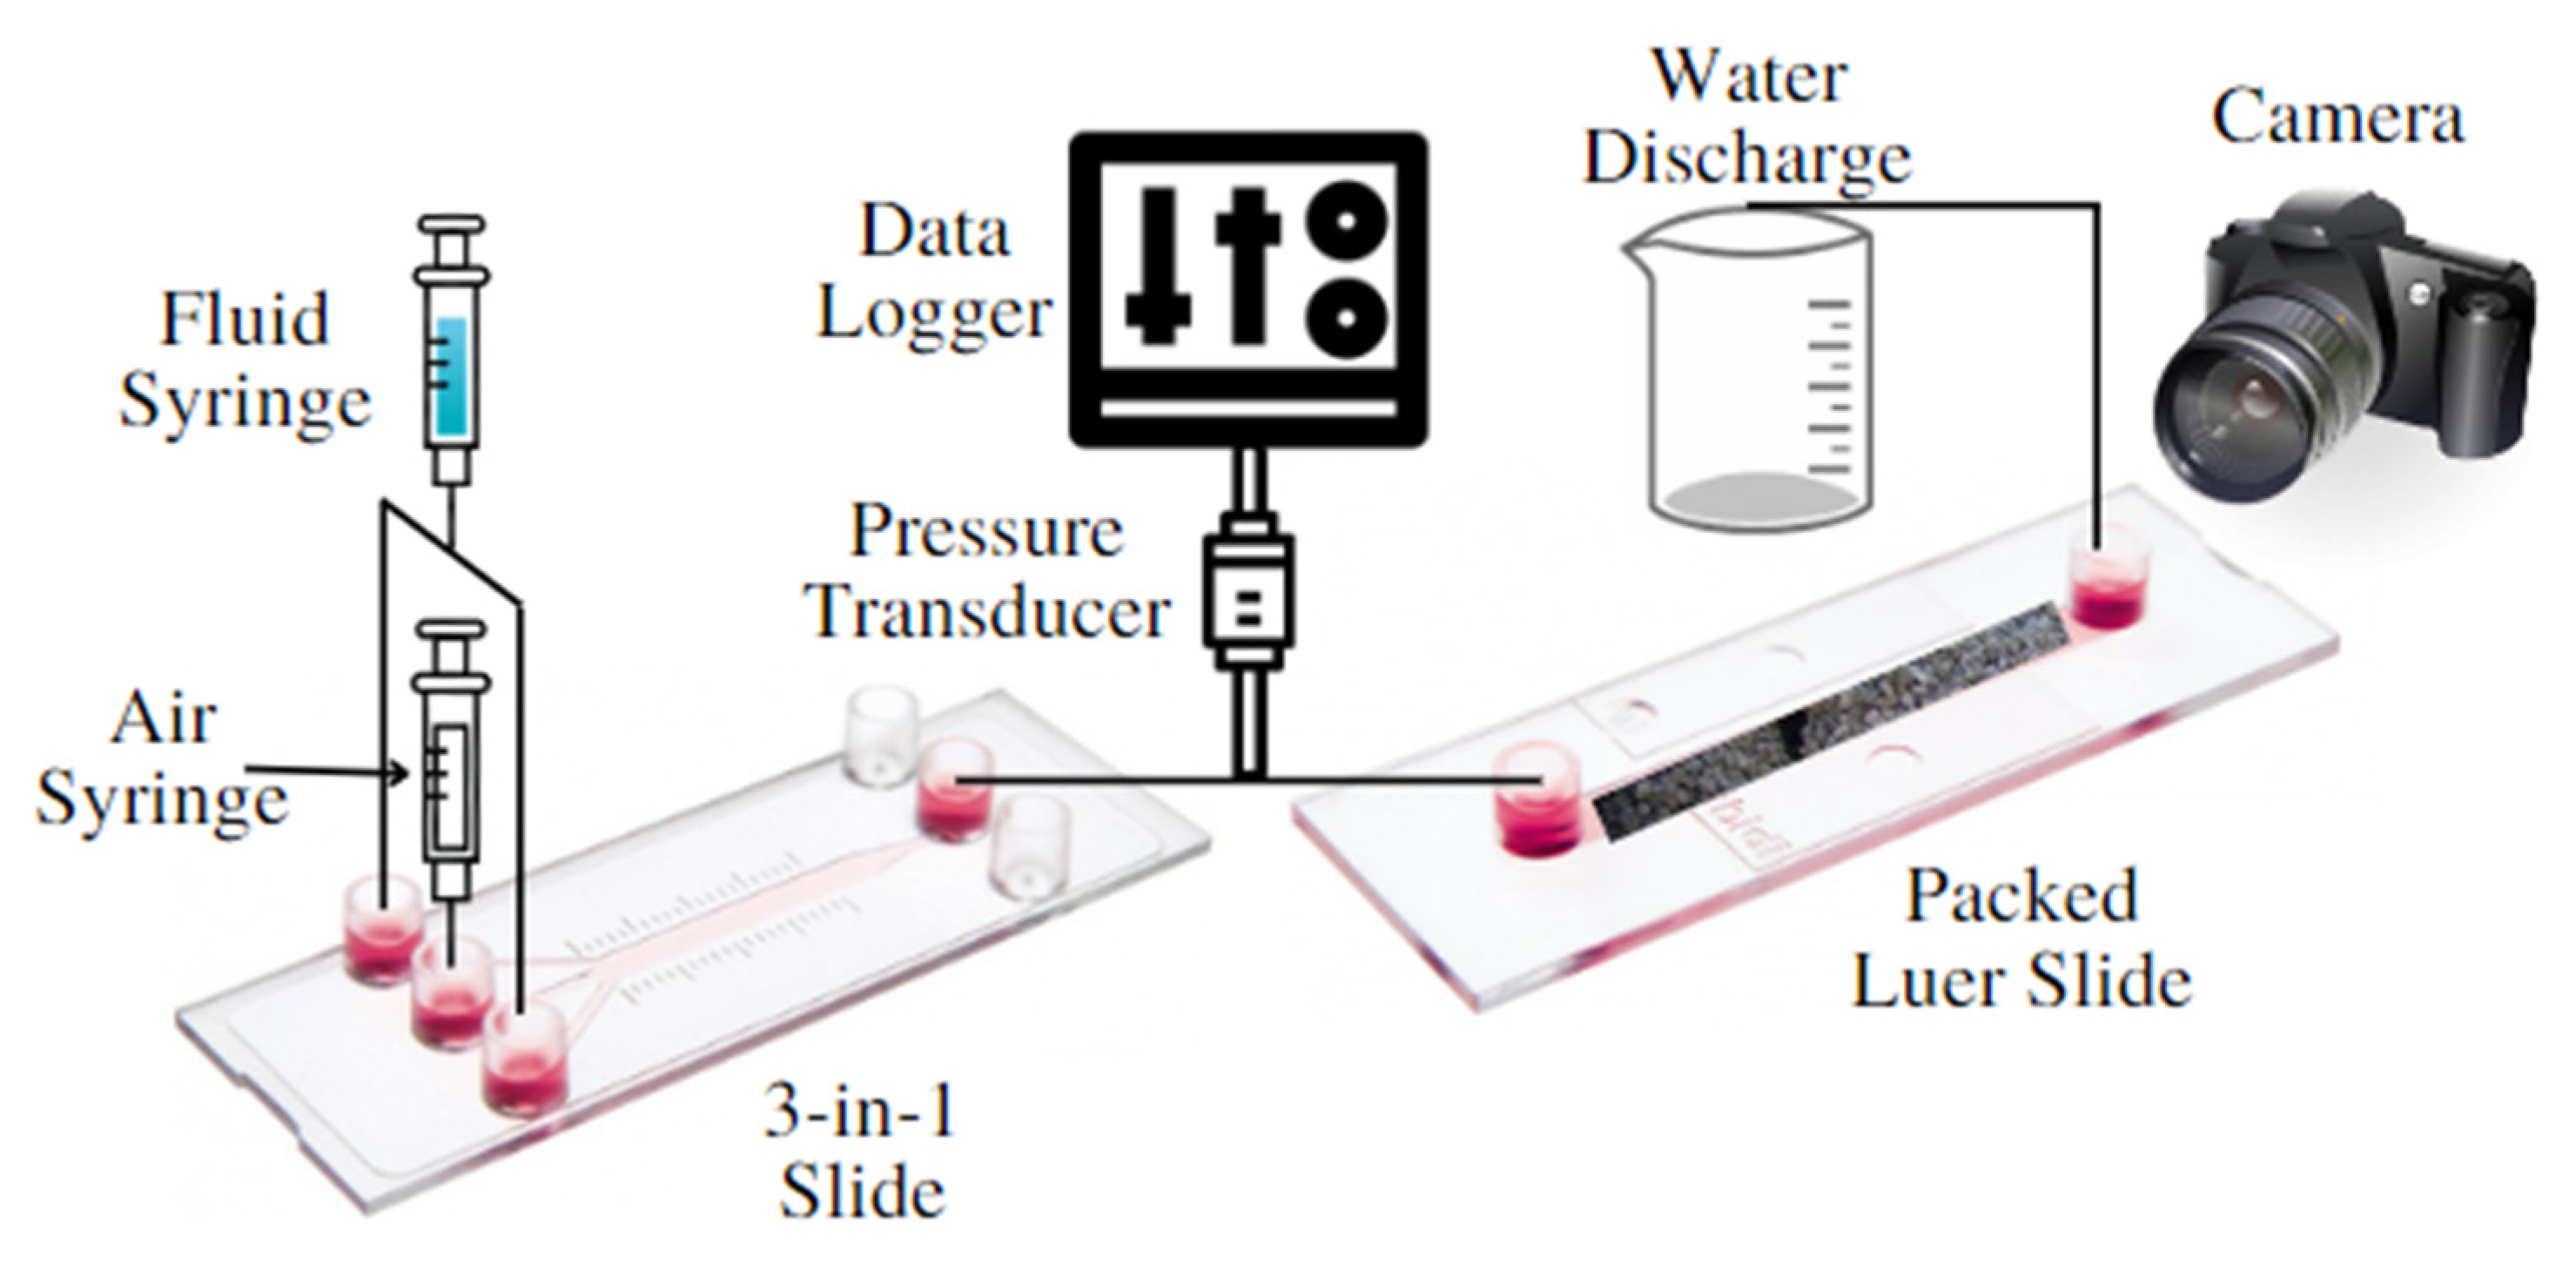
The scheme of the experimental set-up is shown in Figure 1. A bubble generation system and a microfluidic device were built to conduct bubble transport experiments. The bubble generation system was made with a dual rate syringe pump (Harvard Apparatus, Holliston, MA, USA) and a µ-Slide ibidi 3-in-1 microslide (ibidi, Martinsreid, Germany) with a height of 0.4 mm. Liquid solution was injected through the two outer input ports in the 3-in-1 microslide, and air was injected through the middle port. A 10 mL syringe was used for the liquid injection. A volume of 2 mL of toluidine blue dye was added to 80 mL of DI water to help distinguish liquid phase from air phase. To increase bubble stability, 50 µL of surfactant, cocamidopropyl betaine, was added in the injected solution. Air was used for the gas phase. A syringe pump produces volumetric flow; therefore, a 1 mL syringe was used for the air injection to reduce the effect of air compressibility on the bubble generation. The syringe pump was used to control the injection rate of the two phases (liquid and gas). Through this method, the liquid flow would “pinch off” air bubbles from the middle inlet.
The sizes and frequency of the bubbles were controlled by adjusting the injection rates of two phases. To calibrate the frequency and the size of generated bubbles, multiple combinations of liquid flow rate (ql) and air flow rate (qa) were tested for the bubble generation system. A ql to qa ratio in the range of 1 to 60 was applied to generate bubbles of different sizes, as ql varies from 0.2 to 1 mL/min and qa varies from 0.01 to 0.2 mL/min.
2.2. Bubble Transport Experiments
The bubble generation system was connected to an ibidi Luer microchannel packed with glass beads for the transport experiment. Three heights, 0.4, 0.6, and 0.8 mm, of ibidi I-shape Luer microslides (length 50 mm, width 5 mm) were used, and packed with barium titanate glass beads (Cospheric, Goleta, CA, USA) of three sizes, 300–355, 500–600, and 710–790 µm, respectively. A steel mesh was placed in the outlet of the packed microchannel to prevent the glass beads from moving out of the channel. A pressure transducer (PX309-100GV, OMEGA, Norwalk, CT, USA) was installed at the inlet of the packed microchannel and connected to a Data Acquisition System (DAQ970A, Keysight, Colorado Springs, CO, USA) for pressure monitoring in the microchannel. Bubble transport in the packed microchannel was recorded by a Nikon D3300 camera.
Initially, the microchannel was flooded only with the liquid injection solution for 5 min, and a baseline of pressure was established during this period. Once the microchannel stabilized and reached saturation, the bubble generation system was placed at the inlet of the microchannel. The desired flow combination was applied using the syringe pump to run transport experiments for around 10 min. The pressure data were continuously monitored with the pressure transducer every 0.5 s. Visual data of bubble transport were acquired through the camera with a resolution of 1280 × 70 pixels and the speed of 60 frames per second. This process avoids problems of limited view with in situ sensors in a small device and allows us to observe the entire microchannel. Finally, the pressure and video data were transmitted to a computer for analysis.
Hydraulic conductivity for each test was estimated using Darcy’s Law. For a horizontal channel, it is given by
where K is the hydraulic conductivity [m/s], Q [m3/s] is the water flow rate, ρ [kg/m3] is the density of the fluid, g [m/s2] is the gravitational constant, L [m] is the channel length, A [m2] is the cross-sectional area of the channel, and Δp [Pa] is the pressure difference between the inlet and outlet. For all channels, L, ρ, and g were constant. Q and A were varied for each water flow rate and channel combination, and Δp was determined experimentally from the pressure data by averaging the measured pressure over time. Prior to the bubble transport experiments, baseline experiments with saturated water flow were conducted and saturated K was estimated based on those experiments.
2.3. Video Analysis
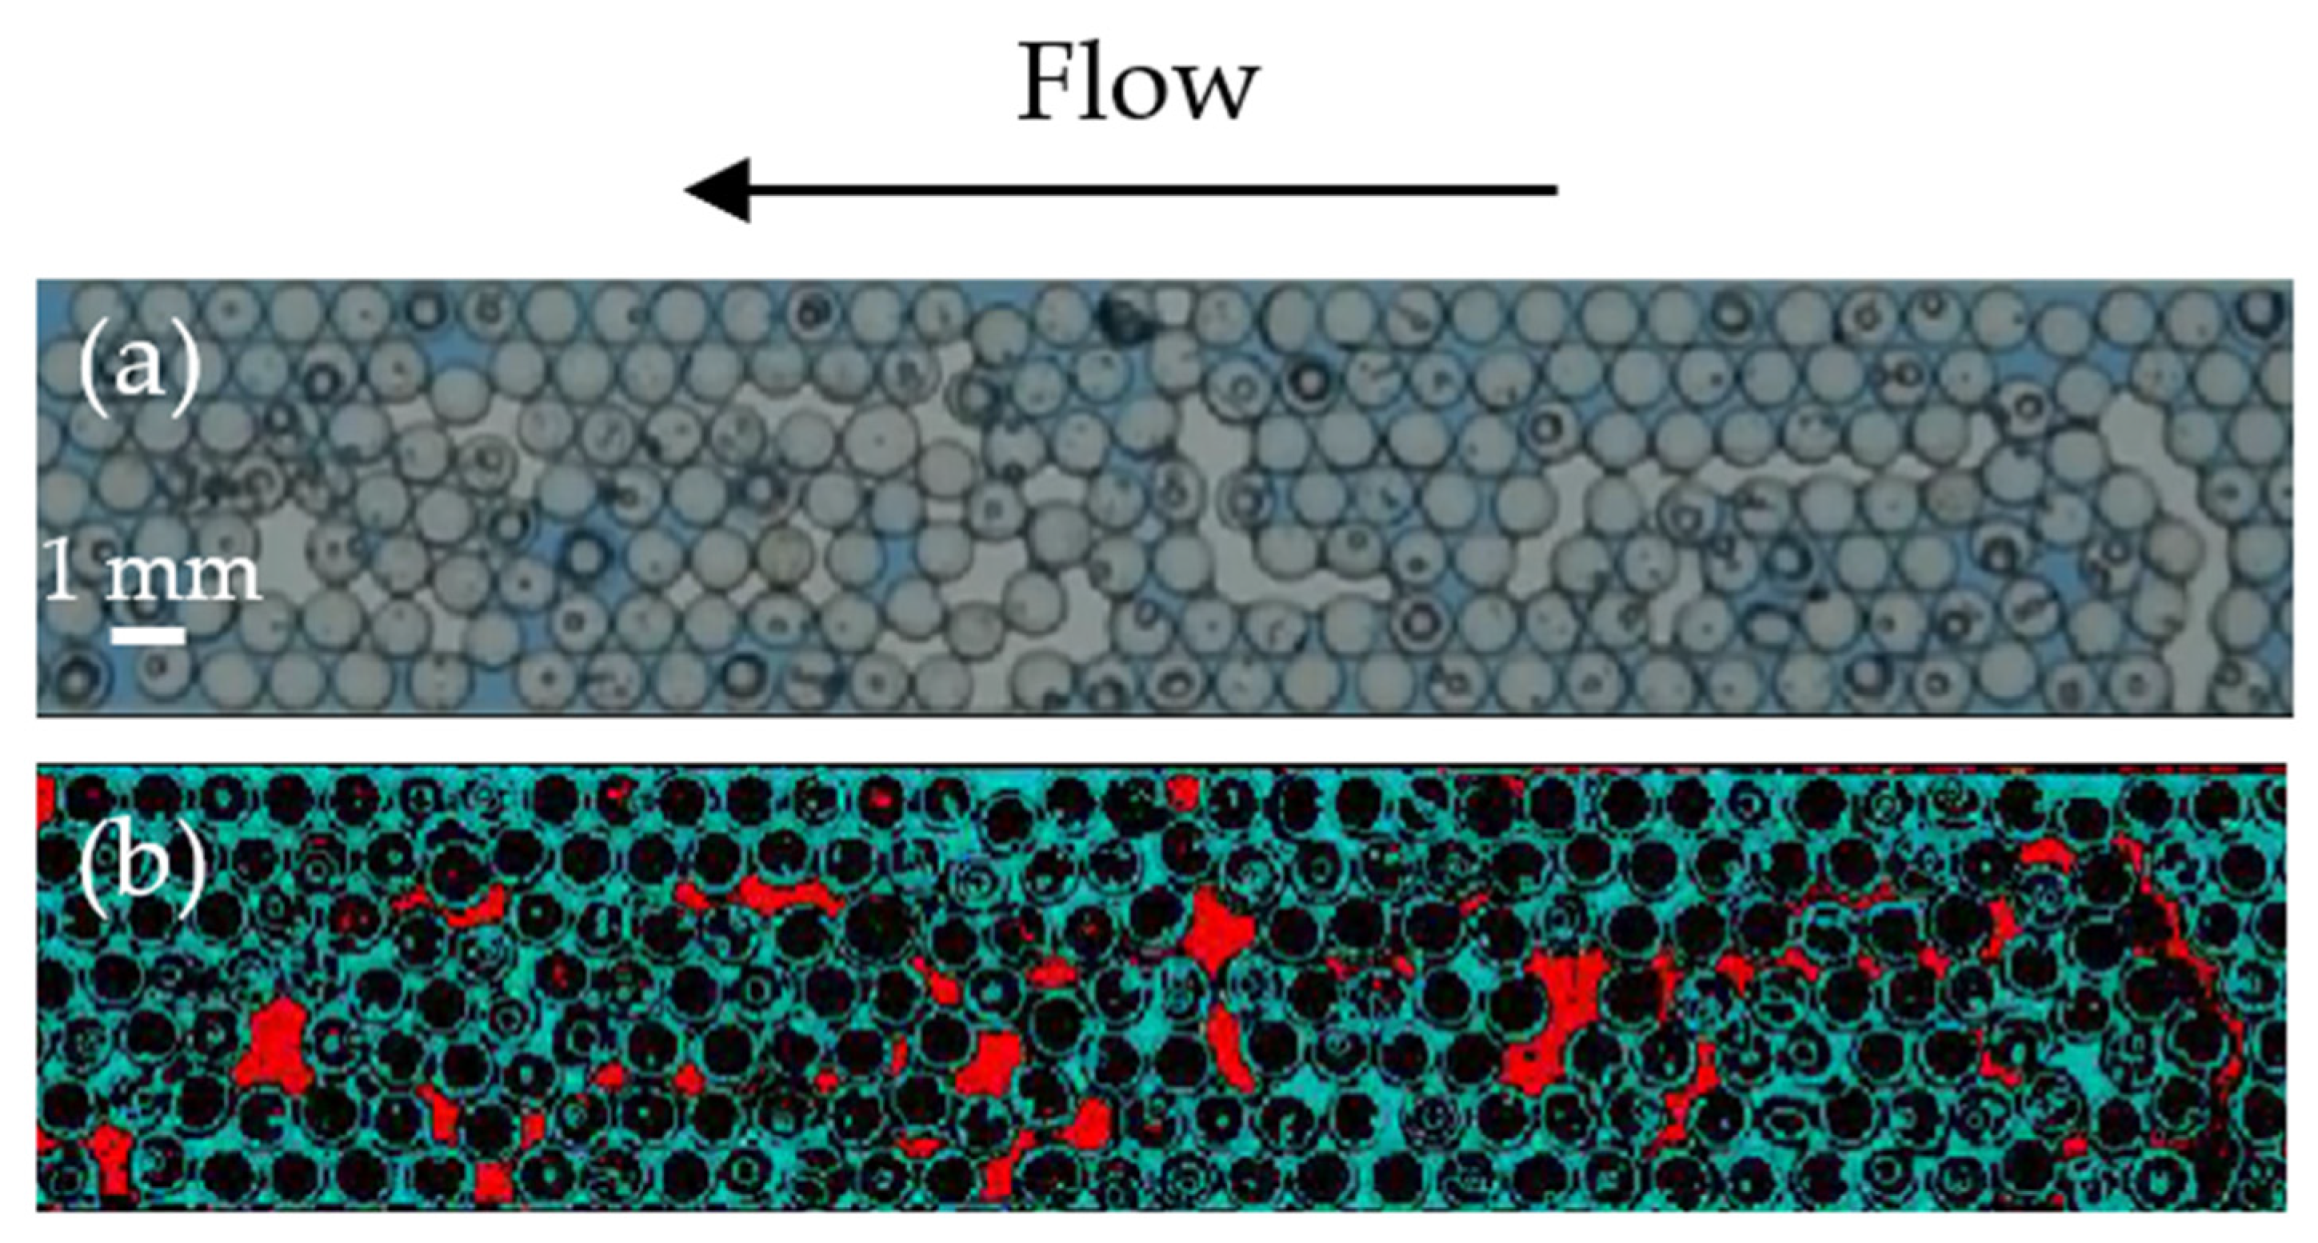
Visual data analysis was performed in MATLAB (2022a) (Natick, MA, USA). Pixels were classified as air phase, liquid phase, and porous medium for each frame of a video by RGB value distinction. The percentage of each phase was calculated based on the total number of pixels. This analysis gives the area percentage of liquid in the channel from a top-down perspective, or an apparent liquid holdup, instead of the actual volume percentage of the whole channel over the time. The apparent liquid holdup is an underestimation of the real liquid holdup due to a top-down observation for a three-dimensional porous media. In this analysis, we focused on using the liquid phase data, because the liquid phase was much easier to distinguish than the air phase from the porous medium by RGB value distinction. The solid phase does not change over time; therefore, the air phase saturation can be obtained based on the data from water phase and solid phase. Once each pixel was classified, the raw video frame could also be converted to an RGB class video frame for visual inspection representing either liquid, air, or porous media. An example of a raw video frame and its corresponding RGB class representation is shown in Figure 2.
3. Results and Discussion
3.1. Bubble Generation
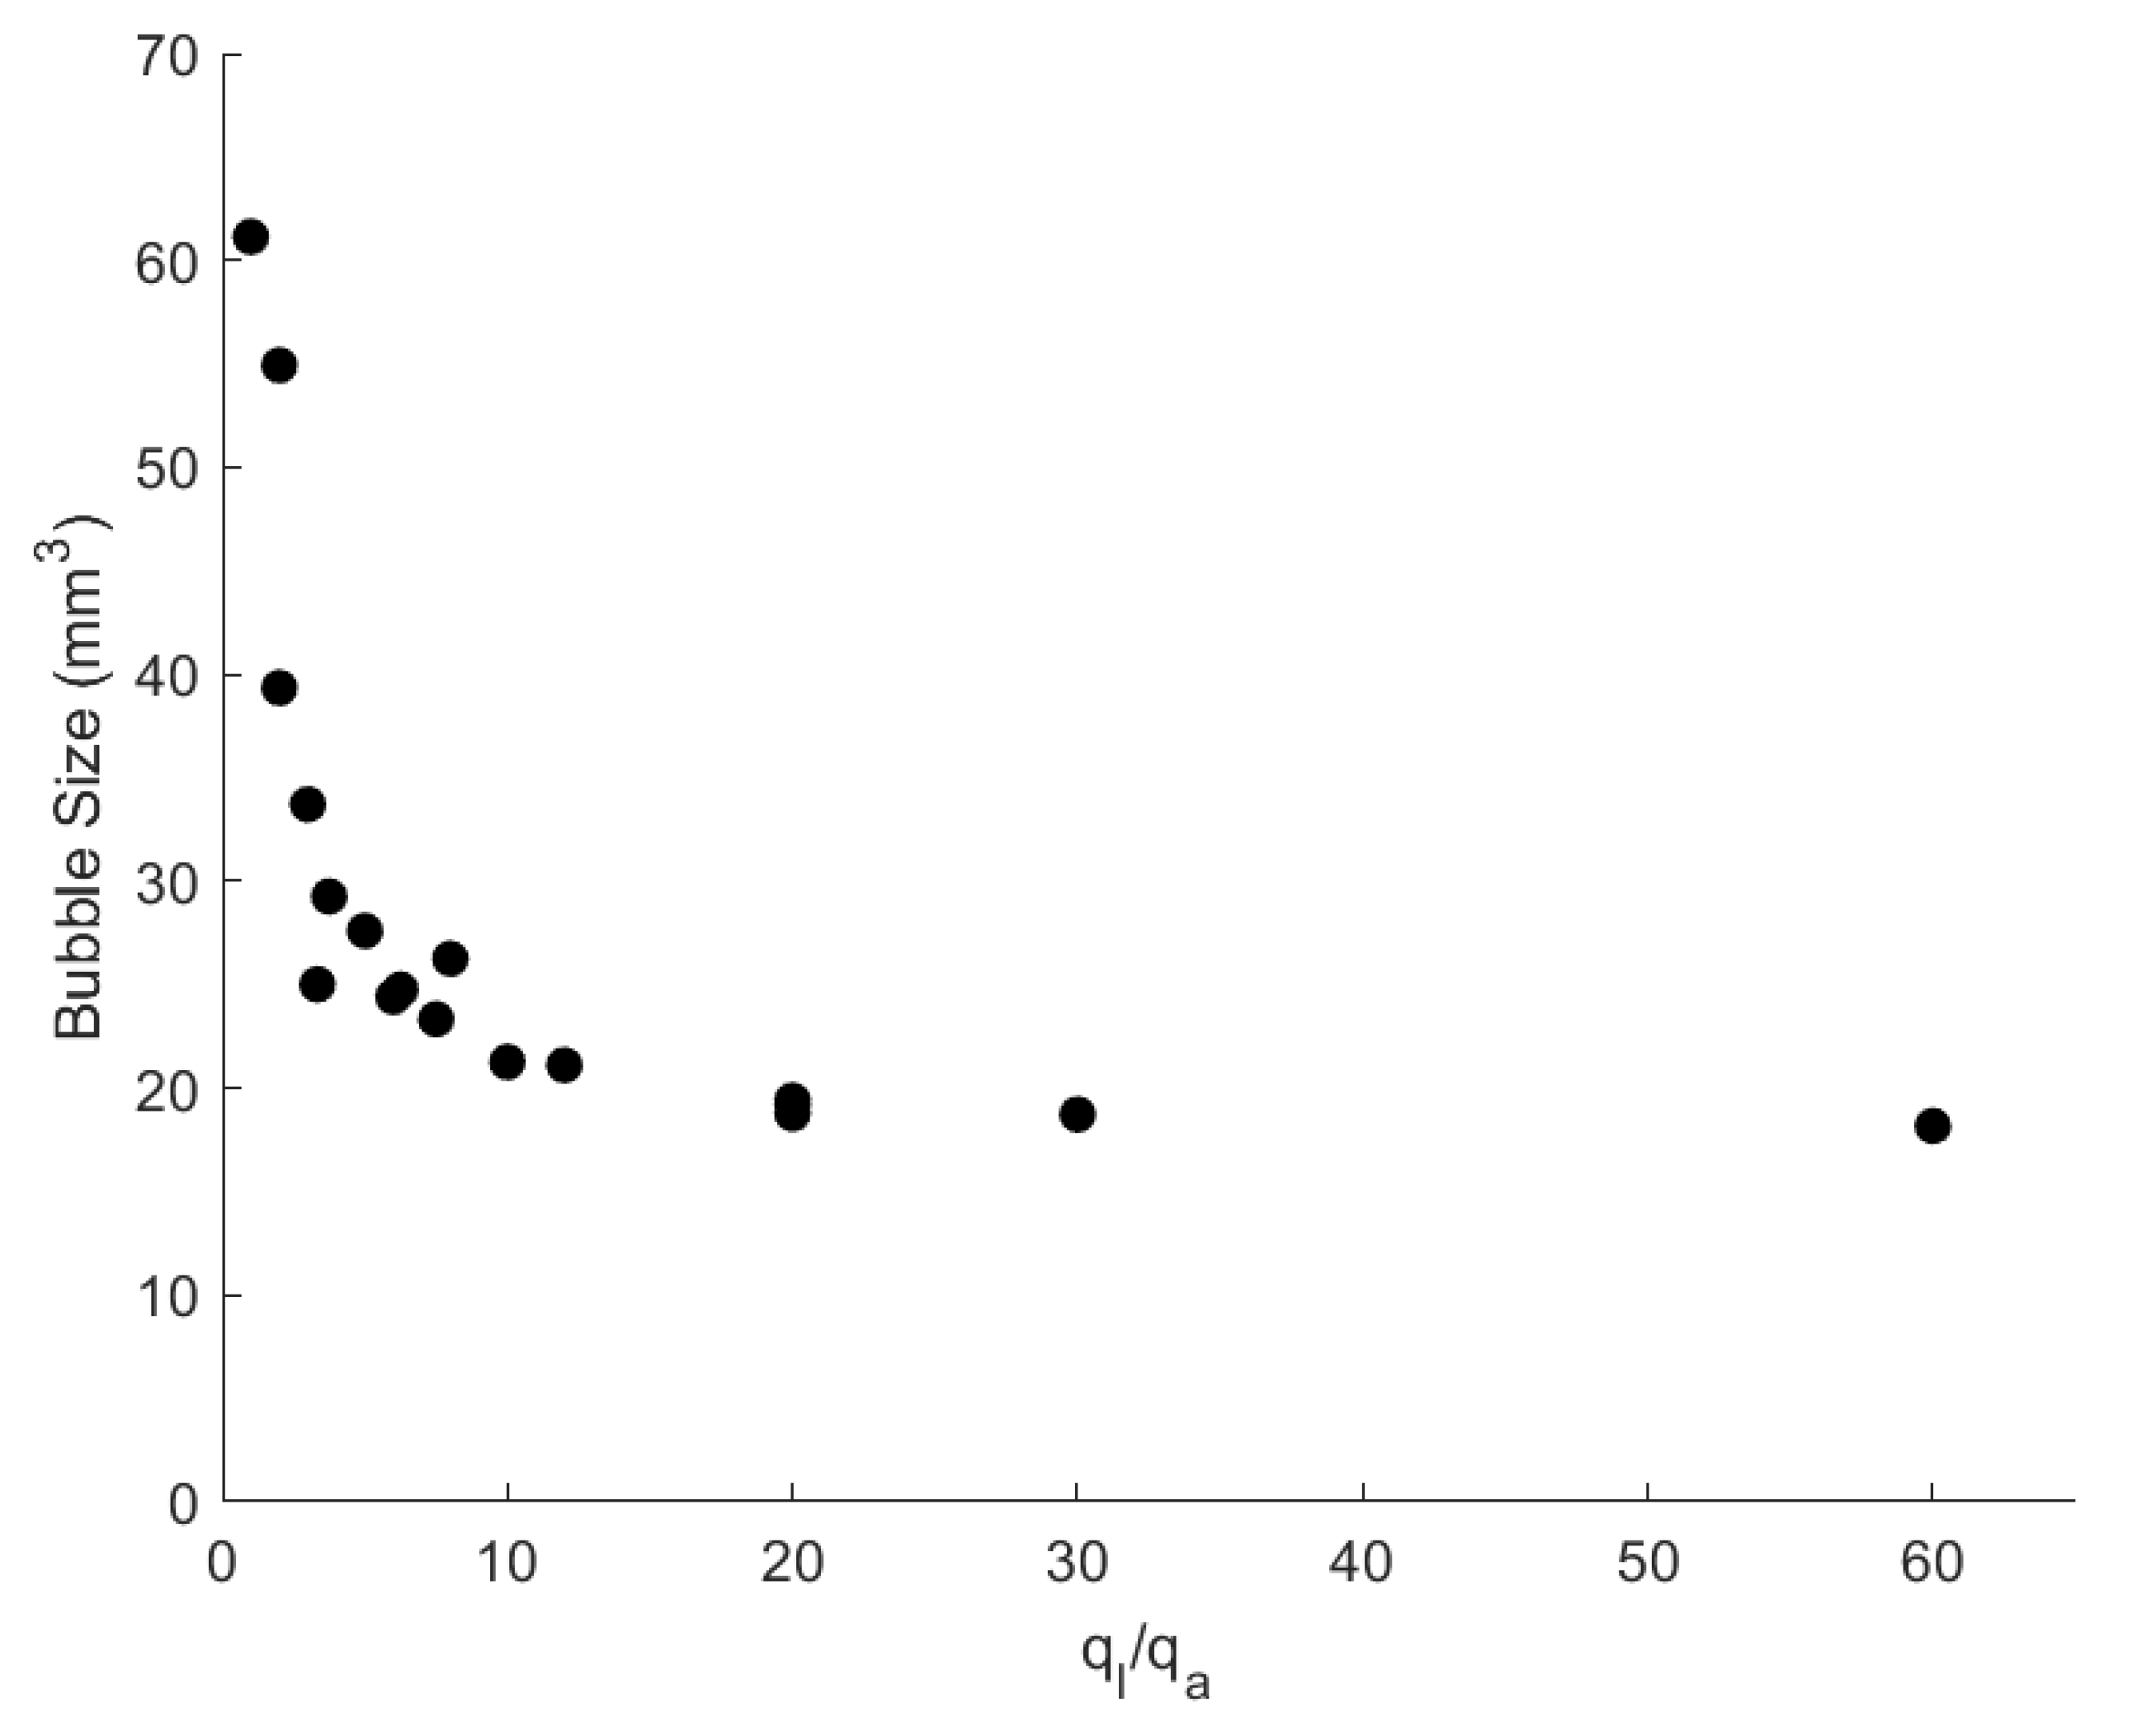
The characteristics of generated bubbles were investigated using the bubble generation system. Figure 3 provides the relationship between the sizes of generated bubble and the liquid/air flow rate ratio. Bubble generation frequencies under these flow conditions were determined experimentally, which are reported in Section S1 of the Supporting Information (SI) document (Figure S1). As shown in Figure 3, a small ql/qa flow ratio results in large bubble sizes. Increasing the flow ratio rapidly decreases bubble sizes until a lower threshold is reached. Larger sized bubbles were generated when ql/qa is smaller than 10. When ql/qa is larger than 20, the increase in air flow rate does not have an obvious impact on the bubble size.
We chose two flow conditions, i.e., ql/qa = 26.6 and 30, to generate similar bubbles with the average size of 19 mm3 and investigate the influence of water flow rate on the transport of bubbles of the same size. Another flow condition of ql/qa = 7.5 was chosen to produce larger sized bubbles with the average size of 24 mm3. This ratio allows us to maintain a flow rate like the two other conditions that generate smaller bubbles, so that impact of bubble sizes on their transport can be studied. The selected bubble size (i.e., 3.2 and 3.6 mm in equivalent diameter) in this work is within the range of bubble sizes observed from gas ebullition in sediments of water reservoir and shallow aquifer [37,38,39], which ranged from around 2 to 7 mm. Moreover, the bubbles generated in some types of gas–liquid rector have similar size to what we selected, and they are used widely in industrial applications [40,41]. The bubble generation frequency is about 5 bubbles per minute for a bubble size of 19 mm3, and 15 bubbles per minute for a bubble size of 24 mm3 as the result of the higher air flow injection rate.
3.2. Flow Regime
Based on the bubble generation results, three sets of conditions were chosen to conduct bubble transport experiments. The first set (i.e., experiments 1–3 in Table 1) has a water flow rate ql of 0.4 mL/min and bubble sizes of 19 mm3. The second set (i.e., experiments 4–6 in Table 1) has a water flow rate of 0.6 mL/min and bubble sizes of 19 mm3. These two experiments will provide information on how bubbles with similar sizes transport differently under different flow rates. The third set (i.e., experiments 7–9 in Table 1) has a water flow rate of 0.6 mL/min and bubble sizes of 24 mm3. Comparing the second and third sets of experiments will provide insight on how bubble sizes impact their transport under same flow conditions. These three combinations were then applied to three channel heights, 0.4, 0.6, and 0.8 mm, packed with glass beads.
The displacement patterns of bubbles during experiments were analyzed by capillary numbers. Regarding the two flow rates used in the experiments, the corresponding capillary numbers, Nca, were calculated following the equation,
where U is flow velocity [m/s], is given by U = ql/(h∙w∙φ). h and w are the height and width of microchannel; µ is the wetting-phase (liquid) viscosity of liquid [Pa·s], which is 0.001 Pa·s in this work; and σ is the interfacial tension [N/m], whose value was estimated to be 0.036 N/m by considering the effect of the surfactant [42]. The porosity (φ) was calculated to be around 0.5 from the visual data analysis. The calculated Nca for each experiment are listed in Table 1.
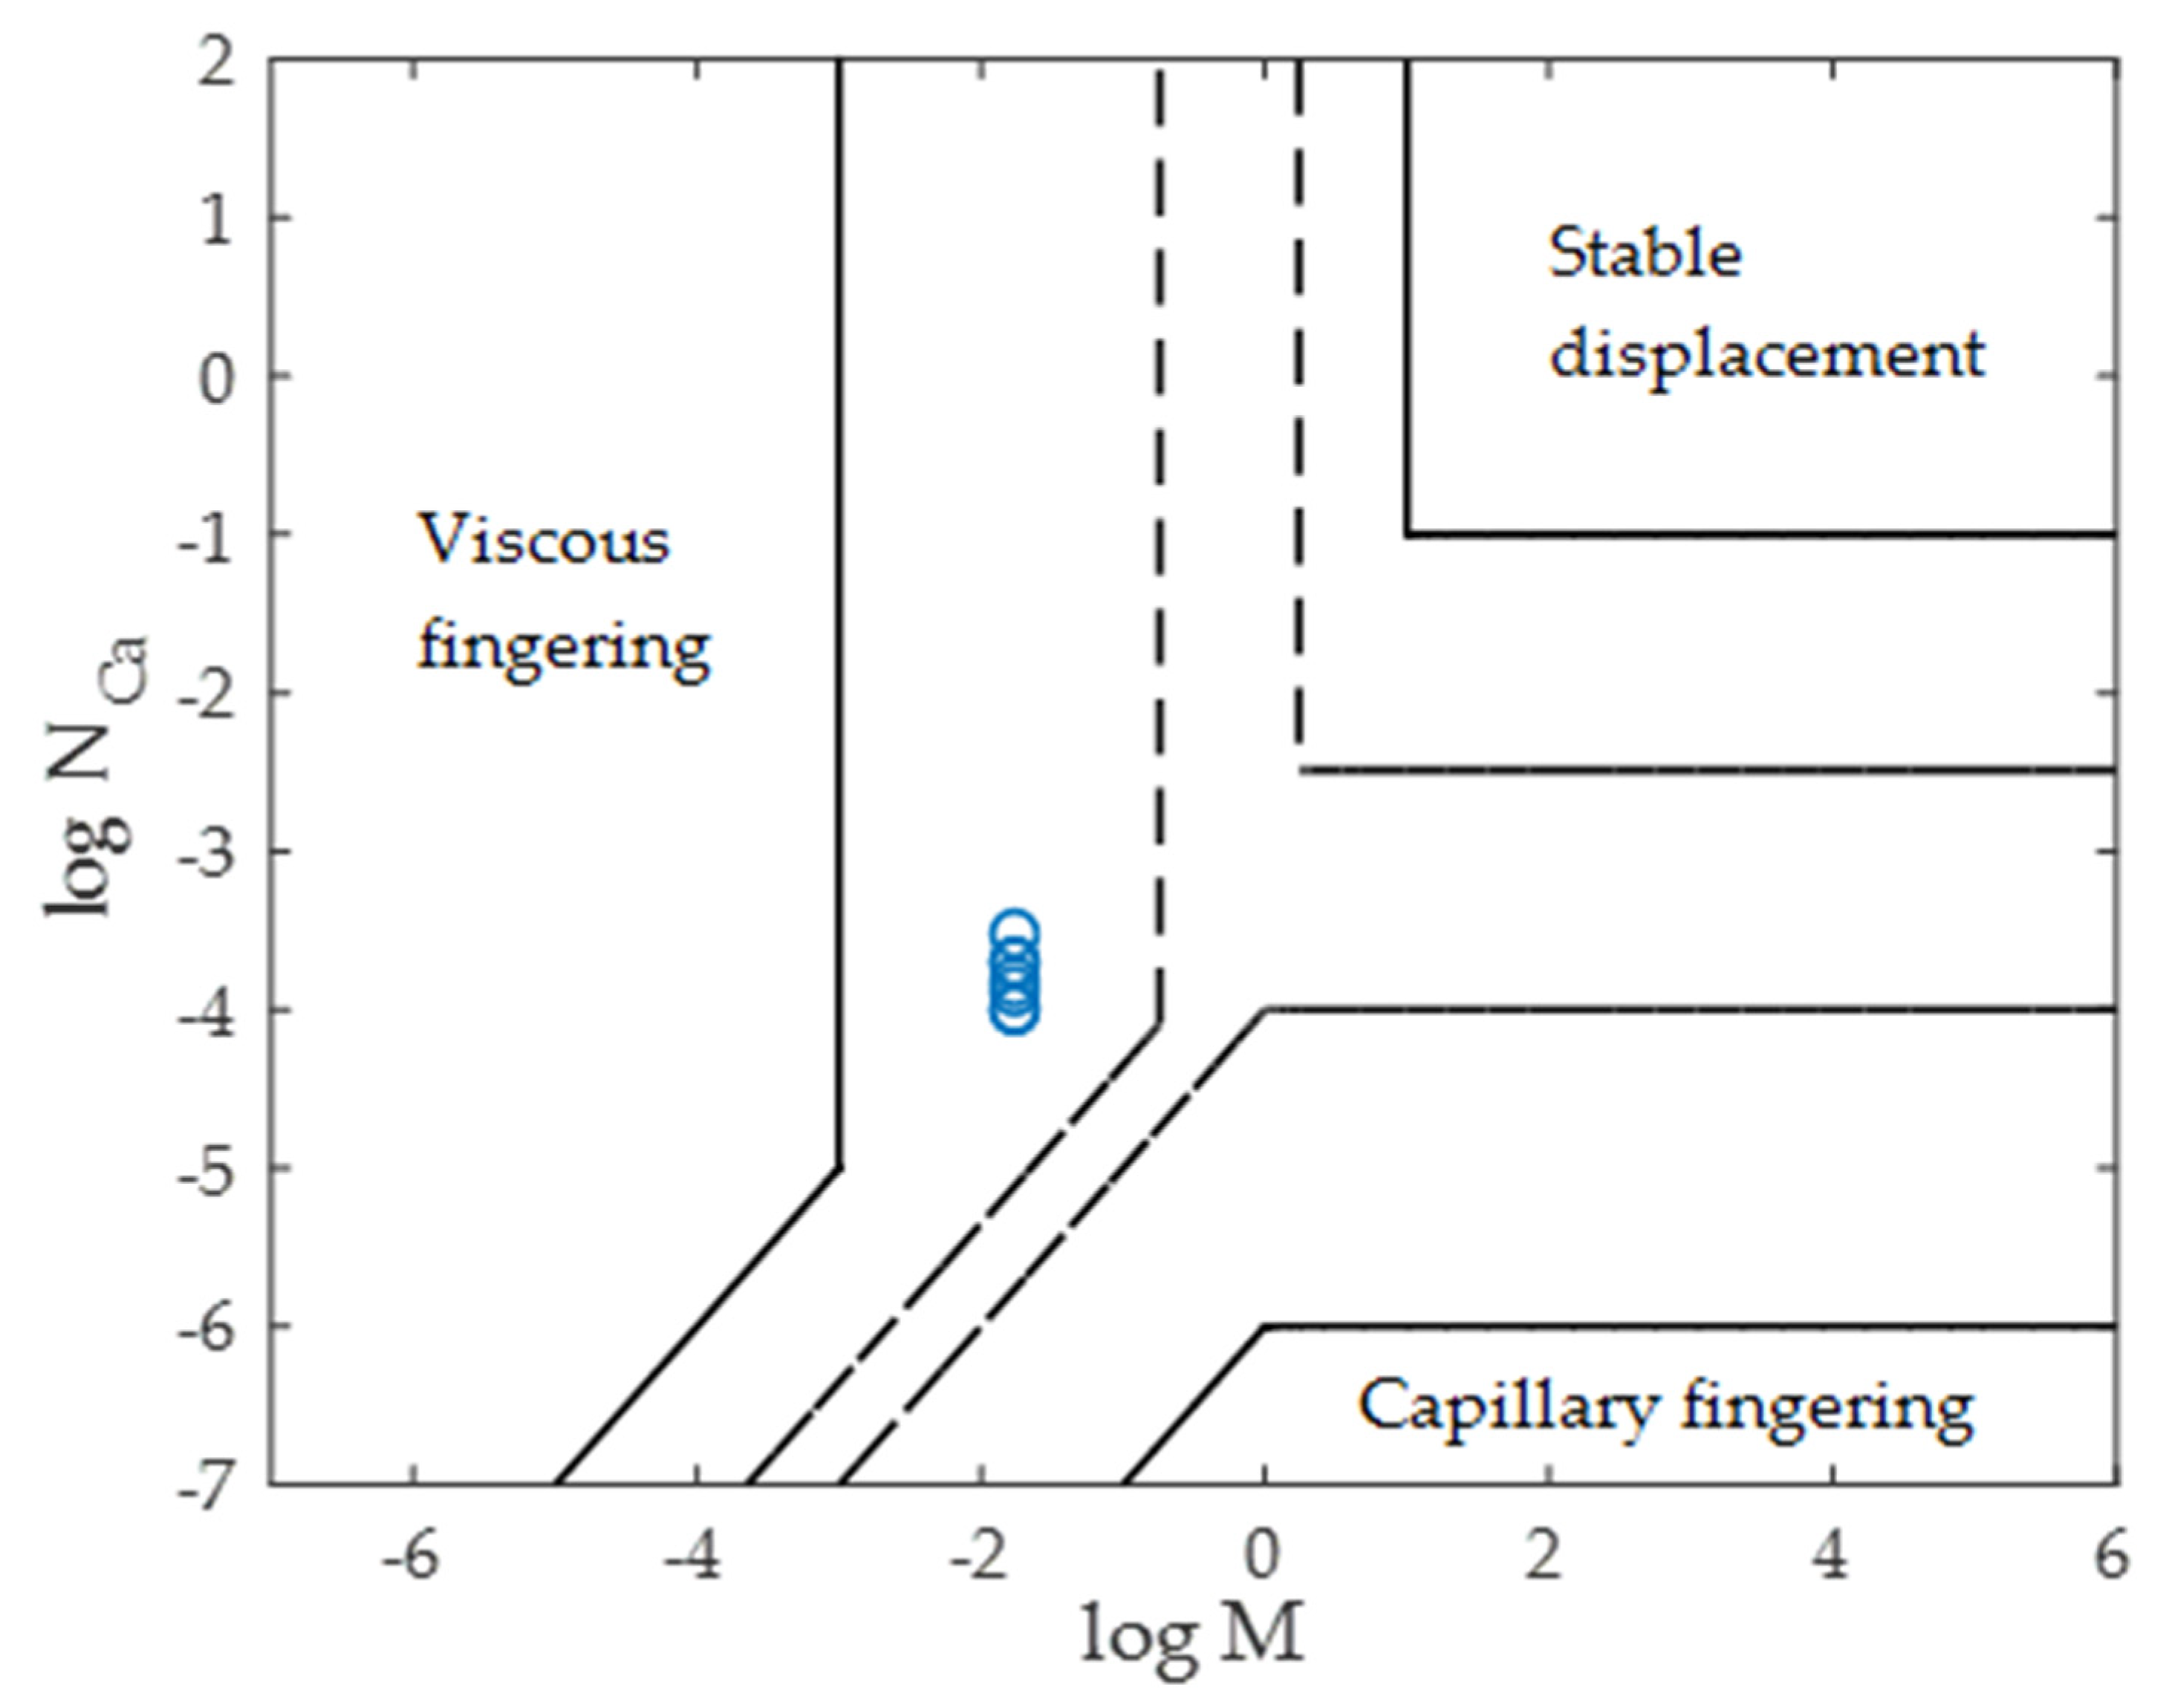
Figure 4 shows the logNCa vs. logM phase diagram and the flow conditions correspond to the reported experiments. M is the viscosity ratio of the invading fluid (air) to the defending fluid (liquid), which is 1.8 × 10⁻² in this work. The logNCa vs. logM phase diagram shows that bubble flow conditions in all experiments are in the viscous fingering regime for flow in micromodels. Viscous fingering is the formation of finger-like instabilities at the interface of two fluids during the displacement of a high-viscosity resident fluid by injecting low-viscosity fluid, particularly in a porous medium [43,44,45,46]. When a fluid displaces another fluid with a higher viscosity, the displacing fluid moves more easily than the displaced one and tends to penetrate the high-viscosity fluid, at last intruding into it in the form of fingers. In our experiments, the displacing fluid air bubbles have a viscosity of 1.8 × 10⁻⁵ Pa·s, which is much smaller than the viscosity of water (i.e., 1 × 10⁻³ Pa·s). Viscous fingering is mainly caused by the local pressure difference created by the perturbation at the interface of displacing fluid and displaced fluid [47]. With the local increase in fluid speed and pressure gradients, it forces fingers to grow and expand.
3.3. Bubble Transport in Pore Spaces
The movement of bubble in porous media was investigated with visual data. Figure 5 presents five snap shots where the flow with bubbles transport through a 0.8 mm height channel. As indicated, the bubble flow direction is from right to left. We focused on examining a part of microchannel field close to the inlet, and the images were taken every two seconds from 2:57 min to 3:05 min after the test started. Figure 5a presents the distribution of several trapped bubbles in the field of view, which were previously formed during the experiment. These trapped bubbles blocked the pore spaces and created certain preferential pathways for air flow. Several bubbles had just entered the area of the view from the right side. In Figure 5b, as new incoming bubbles entered the field of view from right side, the expansion of areas with trapped bubbles was observed. Some small bubble area was generated in situ around the area of air bubbles as the injected bubbles flowed through. Examples of such bubbles are indicated by the yellow arrows in Figure 5. Two areas marked by blue dashed squares showed some interesting patterns of bubble displacement. As moving bubbles entered the area, they tended to follow the pathway as previously trapped bubbles. Therefore, as time went on, trapped bubbles were expanded in the direction of flow. After the moving bubble left the area, the trapped bubbles were left behind (Figure 5d,e). The observation is consistent with viscous fingering: incoming bubbles followed the pathway connecting those trapped bubbles and coalesced with them. Finally, as some bubbles moved out of the field of view (Figure 5e), the large, trapped bubbles (bubbles numbered with 1 and 2 in Figure 5) remained stationary and stayed at their original place from before the bubble entered. This is due to the Jamin effect, which is the presence of these bubbles blocking the flow pathway [50]; therefore, the driving force provided by the syringe pump is not enough to reach the critical pressure that it is necessary to push large bubbles through the pore throat.
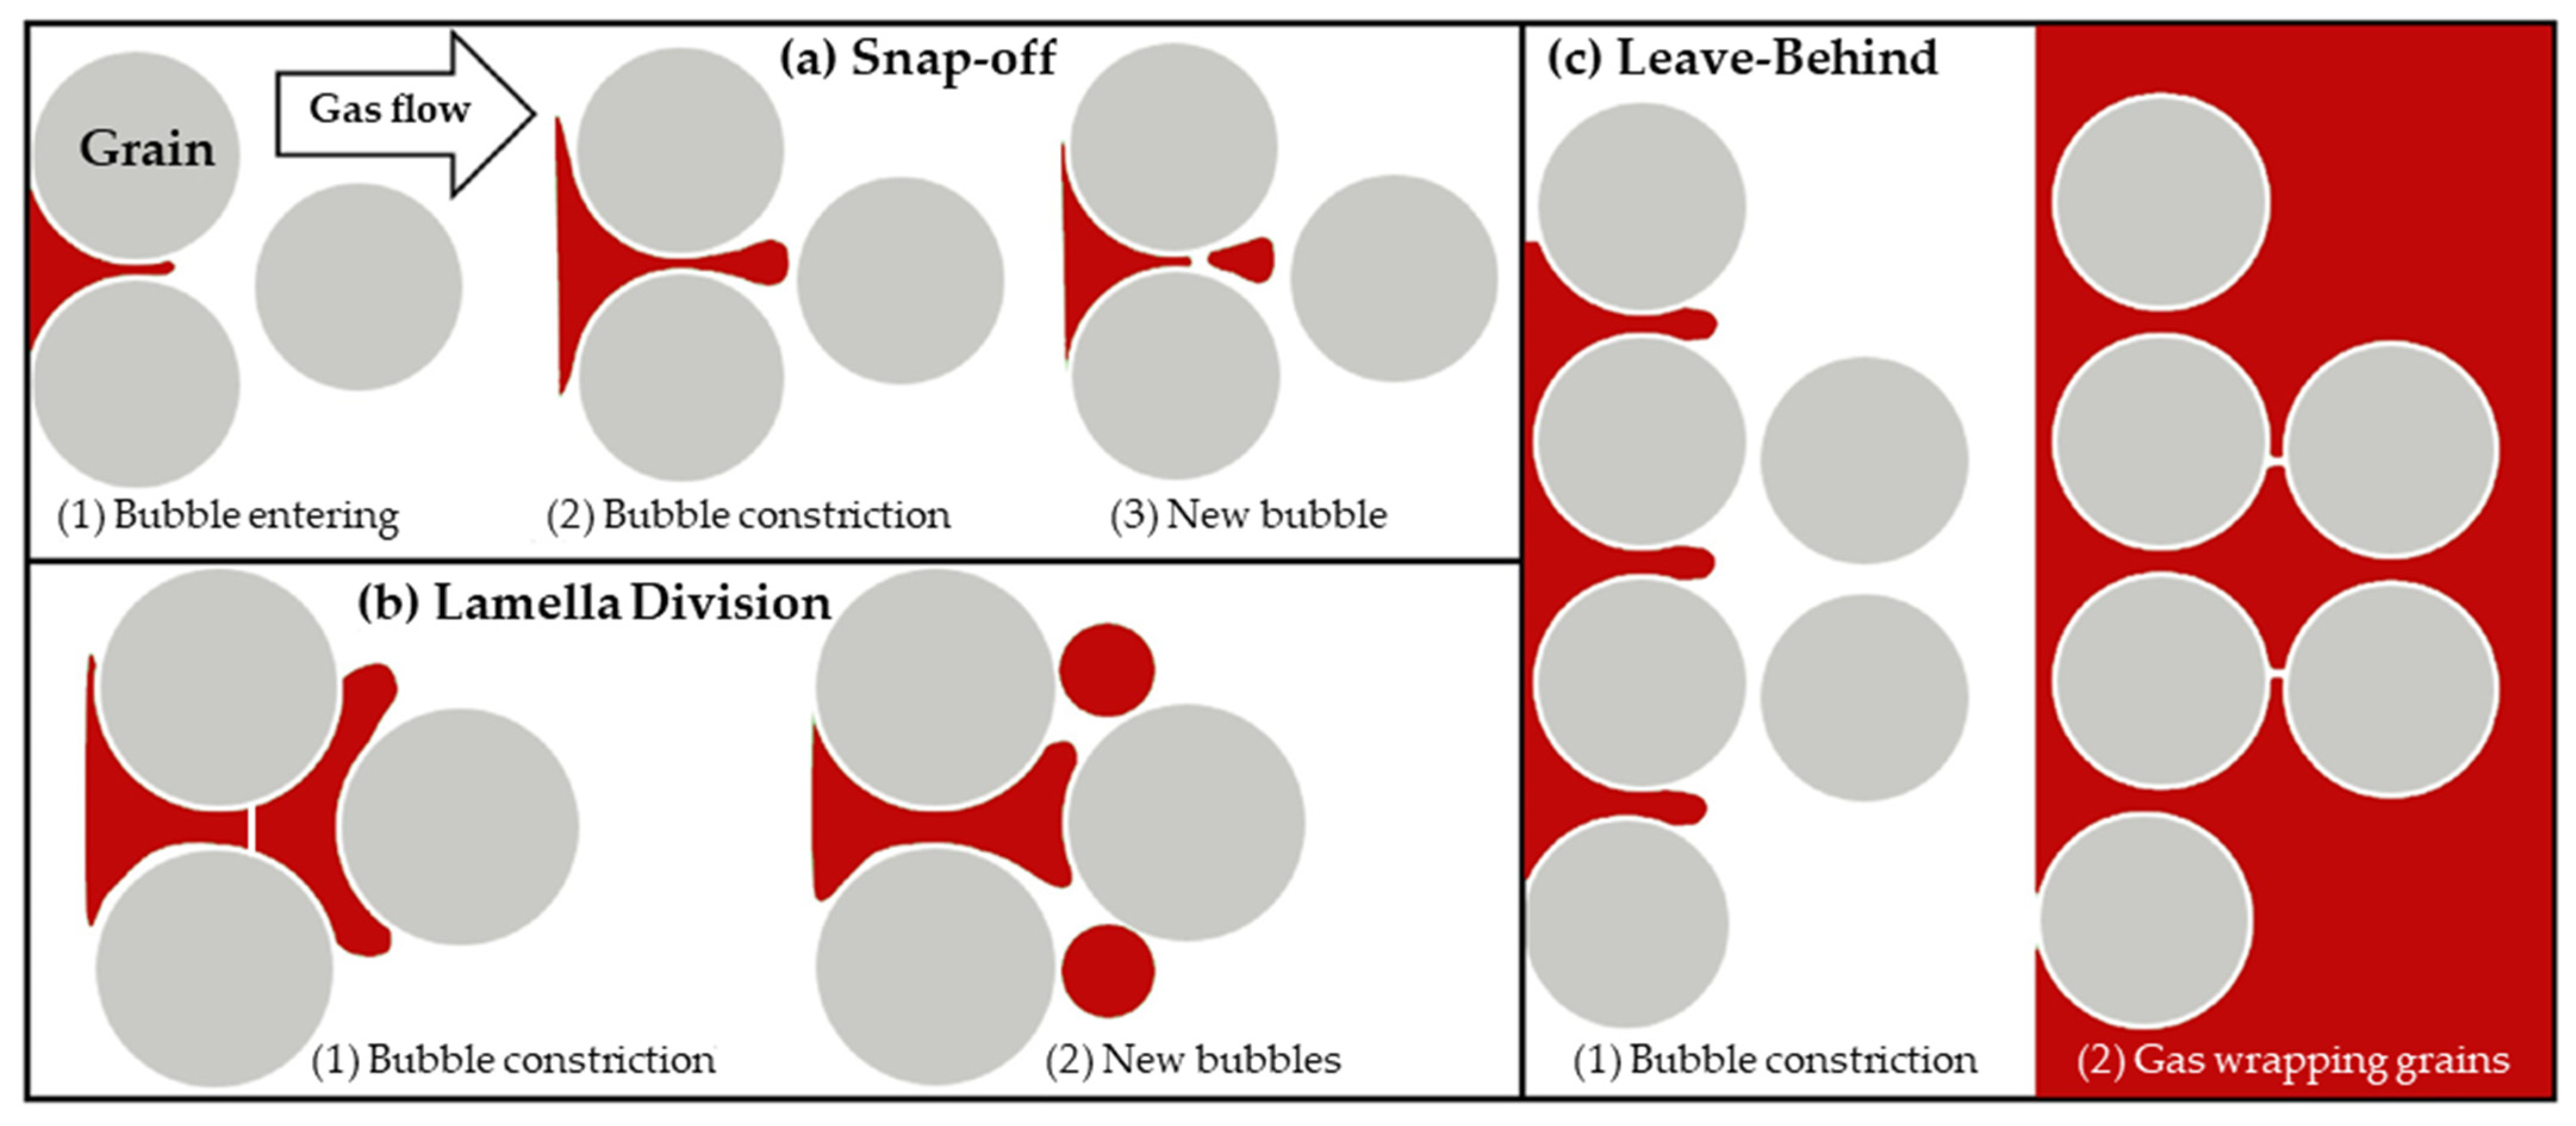
Furthermore, we observed some bubbles generated in situ during the transport in porous media. There are three main mechanisms of in-situ bubble generation induced by the presence of a pore throat [51,52,53]: snap-off, lamella division, and leave-behind. Snap-off occurs when gas flows through a pore-throat, the liquid phase forms collars in the constriction that forces a forepart of the gas to separate into a bubble (Figure 6a). In bubble transport, bubbles are separated by thin wetting liquid films, called lamella. The lamella division mechanism (Figure 6b) occurs when a bubble approaches a branching point, and a lamella must exist. The lamella and the front bubble flow into two pathways where one bubble is divided into two bubbles as well as lamella. Leave-behind (Figure 6c) takes place when gas enters a porous medium initially saturated with liquid, the gas front squeezes out the liquid and wraps around the grains.
In ours work, two mechanisms of snap-off and leave-behind were observed locally under the experimental condition. As shown in Figure 5, two white arrows indicate the place where bubbles formed by snap-off mechanisms due to the existence of narrow constriction. One in part (a) and the other one in part (e) are at the pore-throats. We also noticed some small bubbles (indicated by the white dashed circle) exist at the gap between the top of beads and top of channel formed by snap-off. During the period that injected bubbles passed through, the leave-behind was found at the flow pathway as indicated by green arrow in Figure 5. As it is possible to see, the air front approached a bead and wrapped around it.
3.4. Bubble Breakthrough Frequency
By monitoring the liquid holdup over time, we quantify bubble breakthrough frequency. As an example, Figure 7 shows the changes in apparent liquid holdup over time under the three flow combinations for the 0.6 mm channel. Additional liquid holdup change figures are provided in the Supporting information (Figure S3). The downward spikes in these figures represent the rapid change in the apparent liquid holdup, which indicates bubbles passing through the channel.
As shown in Figure 7, a higher water flow led to an increased size of the liquid holdup change during bubble breakthrough. The change in apparent liquid holdup is reflected by the size of spikes in Figure 7. A larger spike indicates a bigger change in apparent liquid holdup. The flow rate of 0.6 mL/min has large spikes (i.e., change in liquid holdup) in comparison to the 0.4 mL/min flow rate. At higher liquid flow rates, smaller, trapped bubbles in porous media will be washed out of pores, which results in more liquid holdup drop.
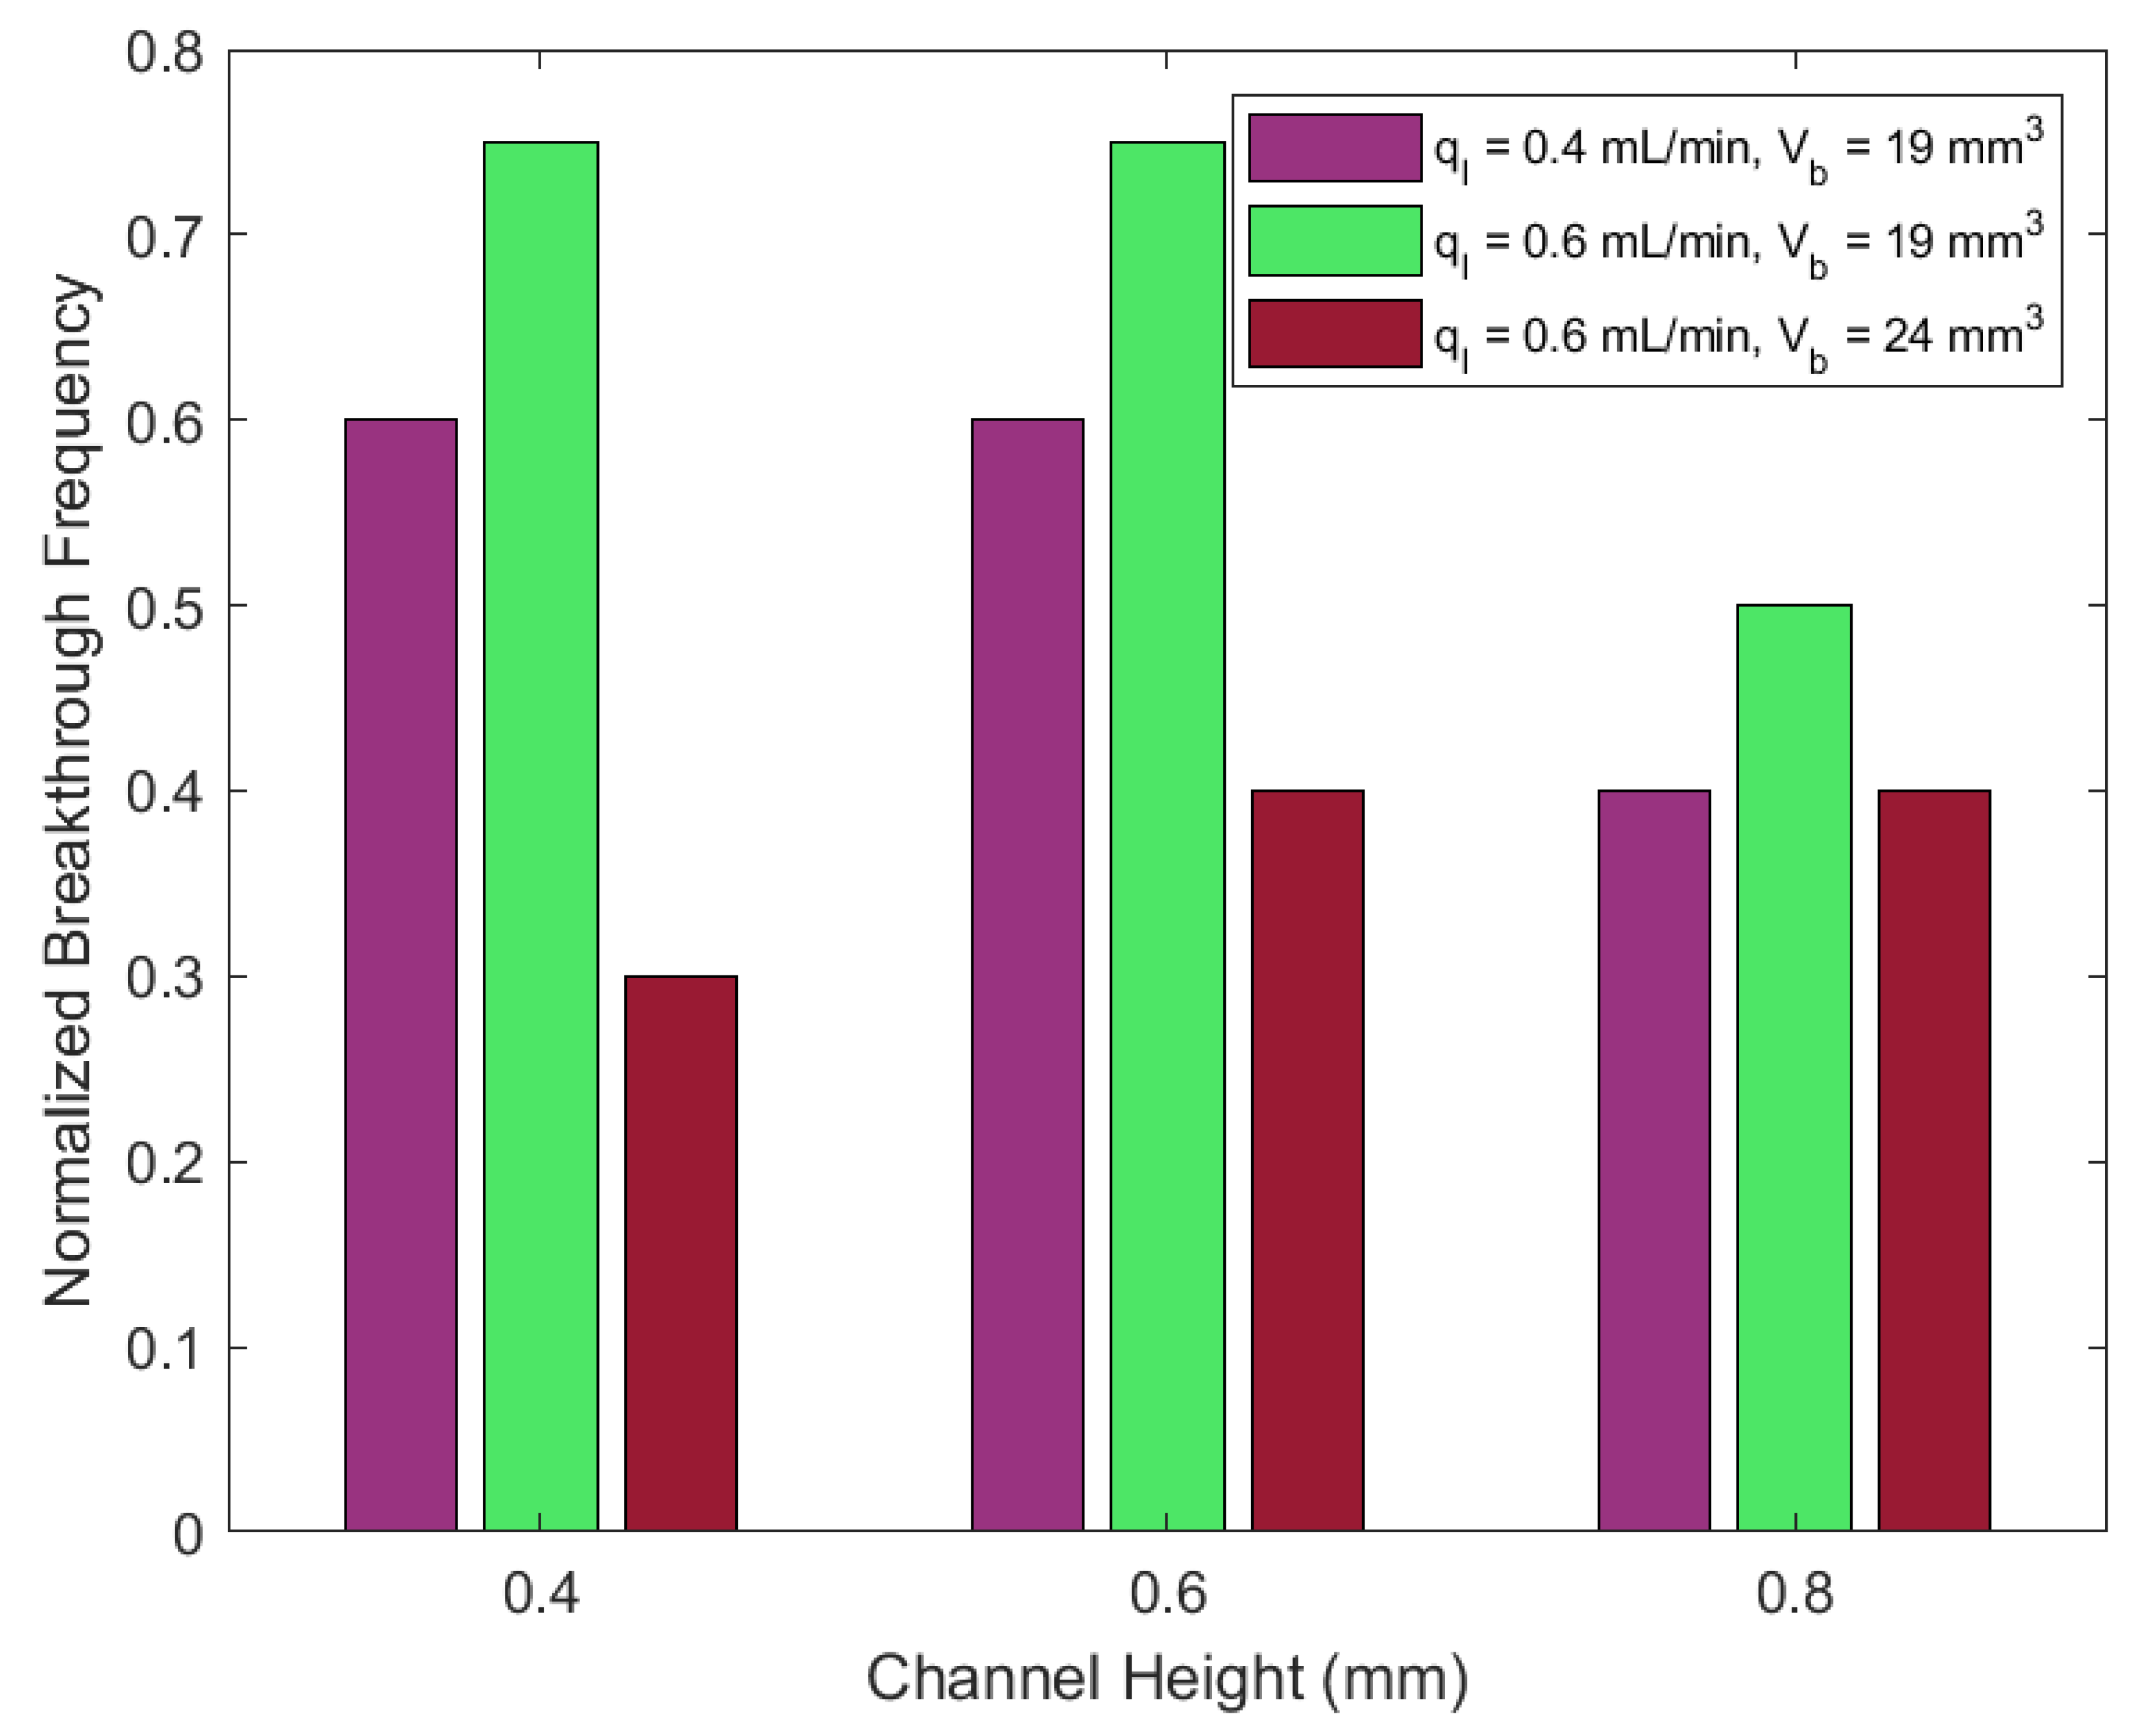
The number of spikes represents the frequency of bubble breakthrough within a certain period. Table 1 shows quantitative results of bubble breakthrough frequency for all channel heights. As noted in Table 1, the generation frequencies are different for two bubble sizes, about 4–5 bubbles per minute for 19 mm3 bubbles and about 15 bubbles per minute for the bubble size of 24 mm3. To be consistent, we normalized the bubble breakthrough frequency by bubble generation frequency. Figure 8 presents normalized bubble breakthrough frequencies for all three channels. For all channels, normalized bubble breakthrough frequency is slightly higher at the higher flow rate. This is expected, as the higher water flow rate may accelerate the movement of bubbles. In all channels, larger bubbles have smaller normalized breakthrough frequency. This observation can be explained by the Jamin effect, or resistance to liquid flow through pore throats. The Jamin effect occurs when large bubbles pass through a pore space due to the difference between bubble size and pore size [50]. At the same liquid flow rate, when a large bubble transports in the porous medium, it blocks more area of liquid flow path than a small bubble. Therefore, large bubbles take longer to break through as they need more driving force to move through the pore throats. This is consistent with other results that have demonstrated that larger bubbles increase flow resistance (thus decreasing the bubble breakthrough frequency) [12,55]. Furthermore, for both bubble sizes, bubbles have smaller normalized breakthrough frequency in the 0.8 mm channel than the other two channels. Filled with coarser glass beads, the 0.8 mm channel has the largest void space among these channels and requires more volume of air to fill into pores; therefore, it lowers the breakthrough frequency of air bubbles.
3.5. Relative Permeability
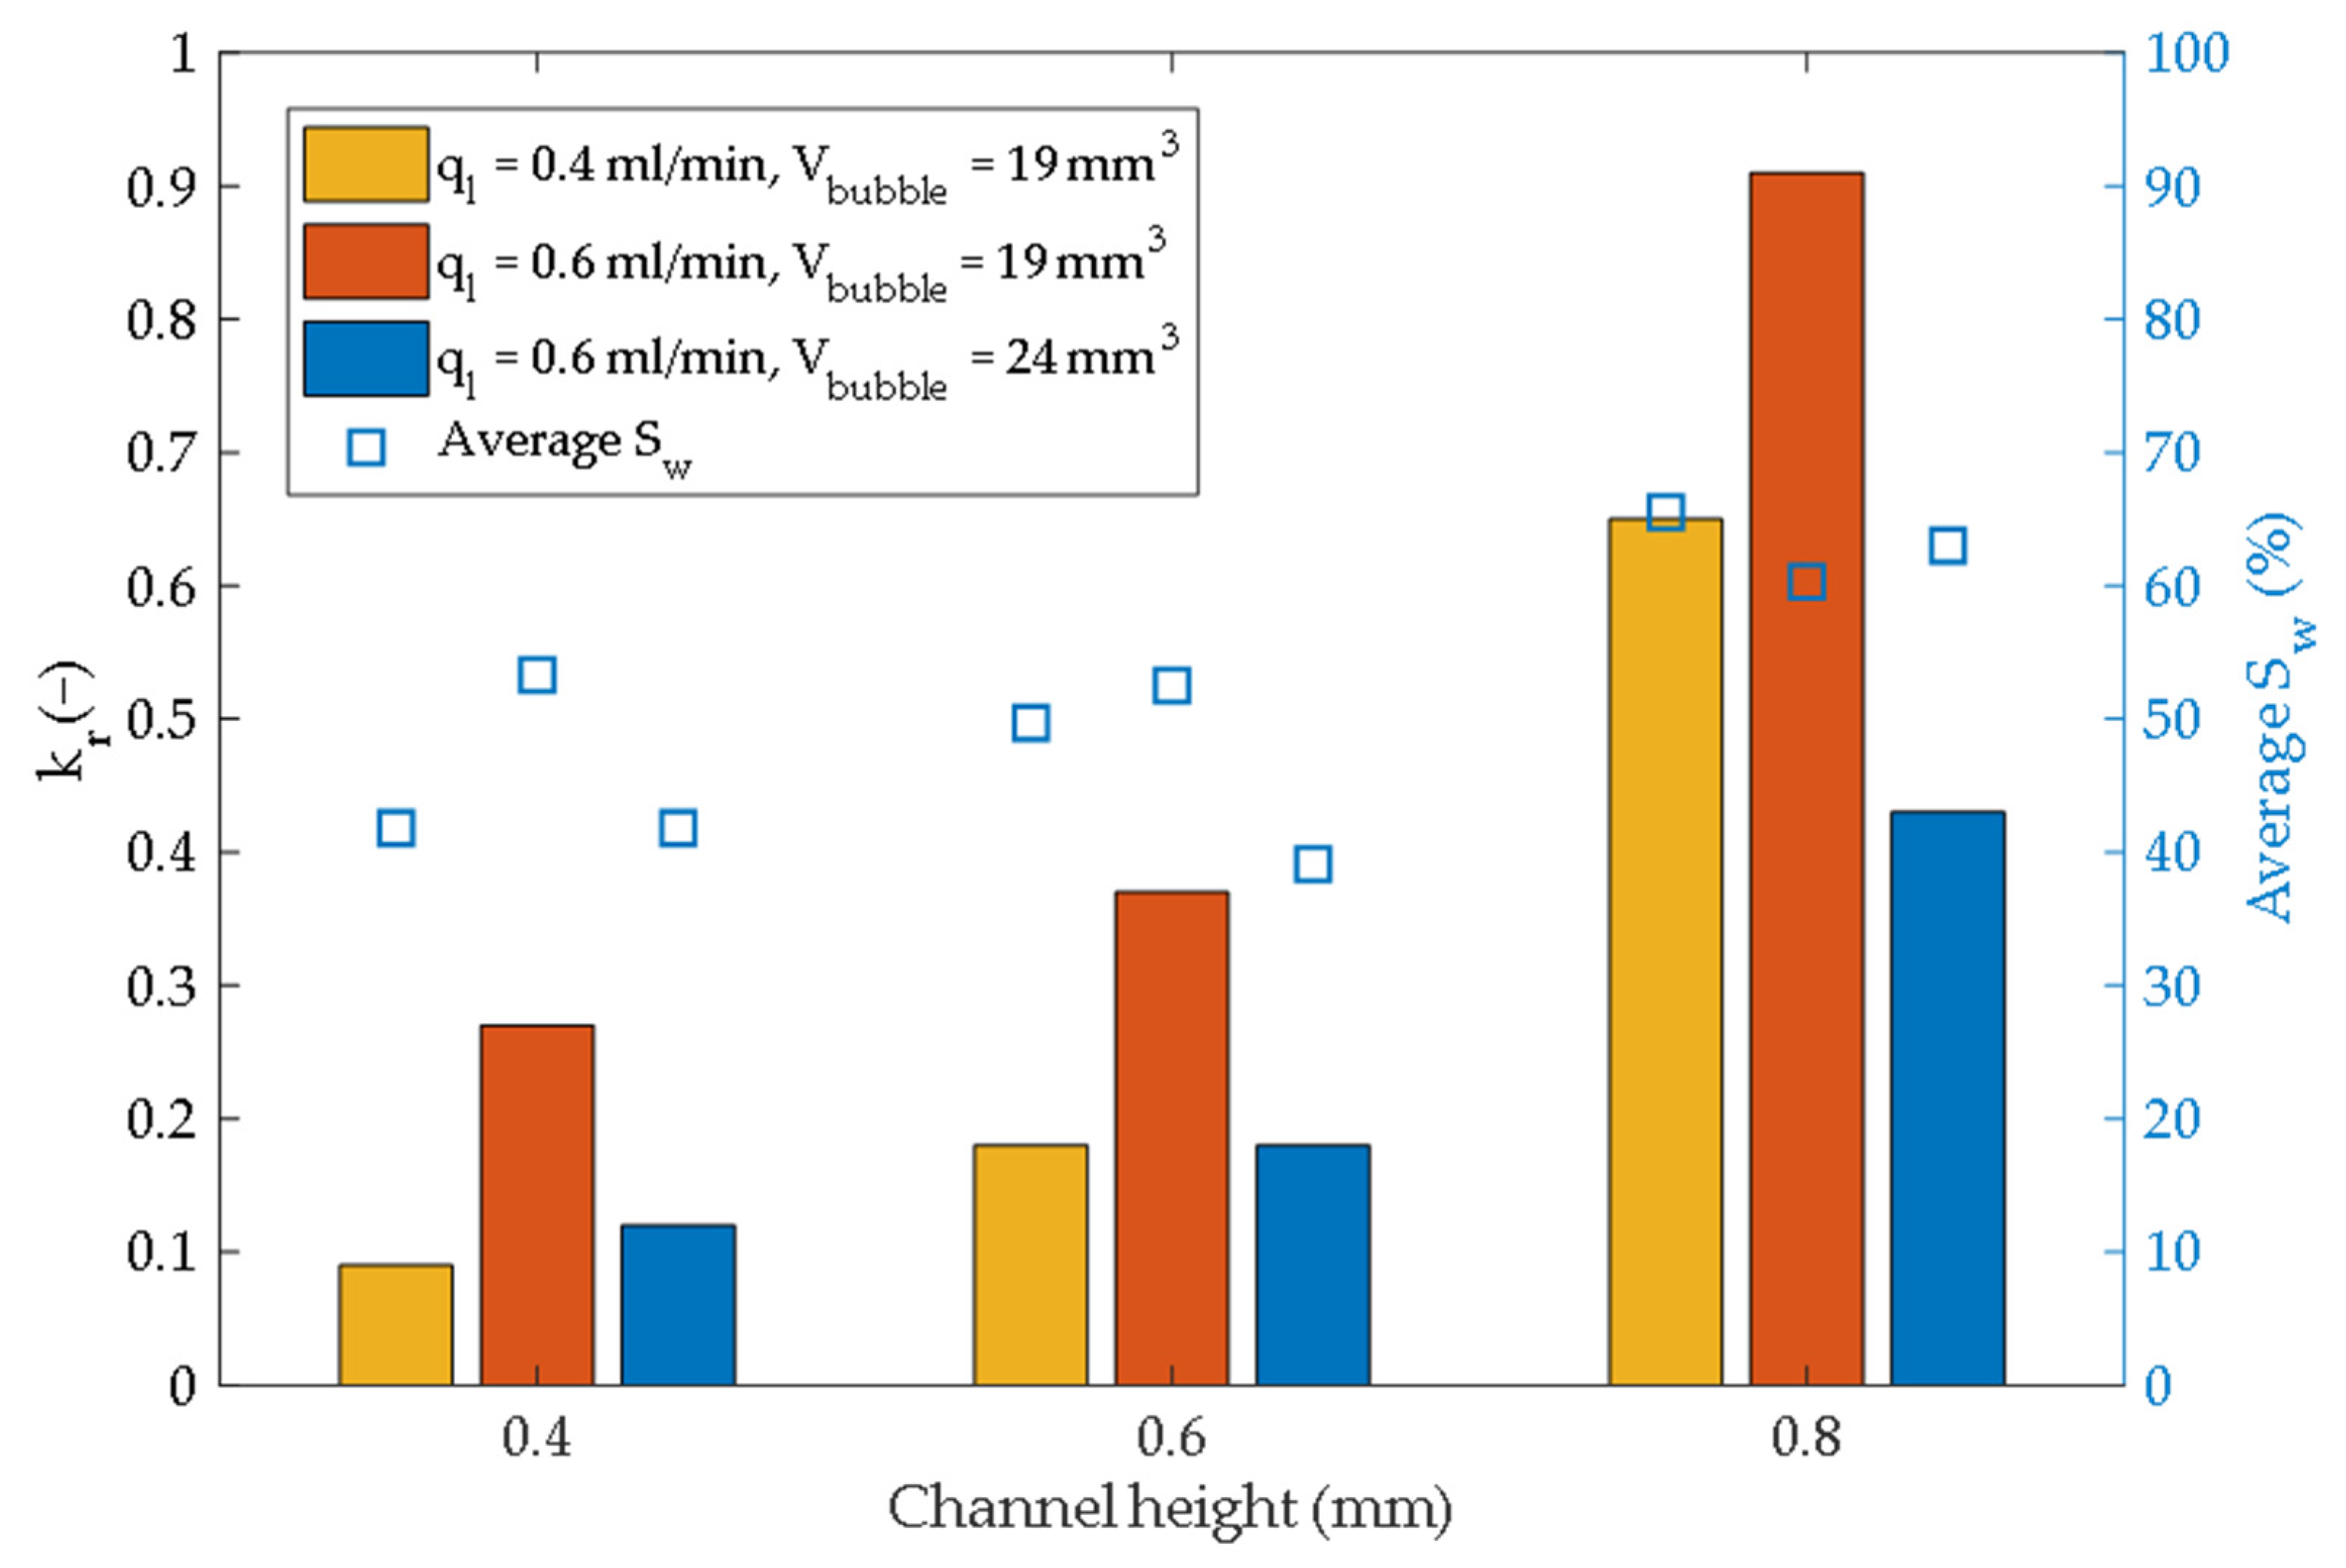
Figure 9 shows the relative permeability for each channel and flow combination, which is defined as the ratio of the hydraulic conductivity with a given saturation to the hydraulic conductivity under the fully saturated condition. For each height size of channel, the hydraulic conductivity for the saturated condition (or no air bubbles) was obtained from the pressure baseline test, while the hydraulic conductivity for air-liquid flow was determined from the bubble transport test. Multiphase pressure data is reported in Figure S2. Relative permeability is a widely used parameter to define the ability of water flow in unsaturated porous media [14,15].
In each case, the hydraulic conductivity for the bubble flow was lower than the saturated hydraulic conductivity. Therefore, the relative permeability is smaller than 1 for all experiments. As shown in Figure 5, the structure of pore spaces is highly heterogeneous even though the channel was packed by relatively uniform glass beads. Water advancement is non-uniform and air bubbles trapped at the flow front, and some remained trapped. The overall ability of the porous media to allow water flow is smaller with the presence of bubbles.
For each flow condition, the relative permeability is higher for larger channels. This is because coarser glass beads were packed in the larger channel. Under the same flow condition, impacts of bubbles in the coarser porous media are relatively smaller than that in the finer porous media. In other words, the hydraulic permeability of finer porous media was more easily impacted by bubble flow than coarser porous media.
Considering the effect of liquid flow rate, we compared the results from the experiments with same injected bubble size but under different flow rates. First, for all channel types, under the same ql condition, larger bubble flow caused lower relative permeability. It is obvious that large bubbles occupy more pores than small bubbles when they move through porous media, which reduced the number of potential flow paths for the liquid phase.
For all channel types, relative permeability values are lower at the smaller flow rate for the same bubble size. Theoretically, relative permeability should not be a function of water flow rate. However, multiple previous experiments have also reported that the relative permeability can depend on flow rate [47,56]. Some researchers [47] believe that, for an intermediate wettability medium, aSt low flow rates, the non-wetting phase would stay in the center of pores and block the water flow. At higher flow rates, water flow would be forced through the throats, and push trapped bubbles out of porous media.
We further analyzed the trend of water saturation during transport experiments for each channel height. As shown in Figure 9, relative permeability values highly depend on the degree of average water saturation. For both the 0.6 mm and 0.4 mm channels, higher water saturation led to higher relative permeability. This is consistent with the typical water saturation and relative permeability relationship [57,58]. In the 0.8 mm channel with 19 mm3 bubble size, however, the two experiments with different water flow rates have about the same water saturation close to 60%, but the experiment with higher water flow rate (ql = 0.6 mL/min) has a larger relative permeability than the experiment with a lower water flow rate (ql = 0.4 mL/min). This indicates that although relative permeability is dependent on the water saturation, the relationship is not linear. Under a similarly high saturation condition, higher water flow has a higher water relative permeability.
4. Conclusions
This study explored transport characteristics of bubbles in porous media using microfluidics to better understand the effects of varying bubble size and flow rate on bubble transport behavior in porous media. Microfluidic channels packed with glass beads were connected to a simple bubble generation system that is controllable for the size and frequency of the bubbles. This work demonstrates the viability of a simplistic microfluidic apparatus that is useful for modeling behavior of multiphase flow in porous systems of natural and industrial importance, such as water infiltration or enhanced oil recovery. The process of bubble transport was monitored by a camera. The visual data analysis was processed through MATLAB to obtain apparent liquid holdup data for each channel. The relative permeability was evaluated from in situ pressure data. The results of the analysis on bubble breakthrough and movement in porous media are summarized as follows:
- The displacement pattern of bubbles under our experimental conditions is viscous fingering based on the calculated capillary number. From the examination of bubble transport, two main mechanisms of bubble in situ generation, leave-behind and snap-off, were observed at pore scale. The Jamin effect played an important role in the bubble movement;
- The normalized frequency of bubble breakthrough at the channel is influenced by the bubble size and flow rate. Large bubbles can result in low normalized frequency of bubble breakthrough. Increasing the flow rate increases the apparent liquid holdup drop during bubble breakthrough. Fine grains mitigate the bubble breakthrough due to its narrow pore throats. Bubble flow can significantly lower the hydraulic conductivity of porous media. Large bubble size and low flow rate can reduce the relative permeability. The average water saturation is subject to the flow conditions, and low permeability indicates low water saturation.
Supplementary Materials
The following supporting information can be downloaded at: https://www.mdpi.com/article/10.3390/w15061033/s1.
Author Contributions
Conceptualization, R.H. and Y.L.; methodology, R.H.; software, R.H.; validation, R.H., D.Z. and Y.L.; formal analysis, R.H.; investigation, R.H.; resources, R.H.; data curation, R.H. and D.Z.; writing—original draft preparation, R.H., D.Z., Y.L. and J.E.; writing—review and editing, R.H., D.Z., Y.L. and J.E.; supervision, Y.L.; funding acquisition, Y.L. All authors have read and agreed to the published version of the manuscript.
Funding
The project is partially funded by the University of Nebraska Collaborative Initiative, National Science Foundation CBET- # 1836799 and NSF CBET-2154788.
Data Availability Statement
Data can be made available upon request.
Acknowledgments
The authors are thankful to You (Joe) Zhou from Morrison Microscopy Core Research Facility at the University of Nebraska-Lincoln for all his help in microscopy.
Conflicts of Interest
The authors declare no conflict of interest.
References
- Naudts, L.; Greinert, J.; Artemov, Y.; Beaubien, S.E.; Borowski, C.; De Batist, M. Anomalous Sea-Fl Oor Backscatter Patterns in Methane Venting Areas, Dnepr Paleo-Delta, NW Black Sea. Mar. Geol. 2008, 251, 253–267. [Google Scholar] [CrossRef] [Green Version]
- Mottaghi, M.; Kuhn, S. Numerical Investigation of Well-Structured Porous Media in a Milli-Scale Tubular Reactor. Chem. Eng. Sci. 2019, 208, 115146. [Google Scholar] [CrossRef]
- Thomas, S. Enhanced Oil Recovery—An Overview. Oil Gas Sci. Technol.-Rev. De L’ifp 2008, 63, 9–19. [Google Scholar] [CrossRef] [Green Version]
- Kerfoot, W.B. Microbubble Ozone Sparging for Chlorinated Ethene Spill Remediation; American Chemical Society: Washington, DC, USA, 2002; pp. 86–108. [Google Scholar] [CrossRef]
- Kerfoot, W.B. Coated Ozone Micro-Bubbles: Speed Groundwater Cleanup. Pollut. Eng. 2007, 39, 26–31. [Google Scholar]
- Yuan, Q.; Valsaraj, K.T.; Reible, D.D.; Willson, C.S. A Laboratory Study of Sediment and Contaminant Release during Gas Ebullition. J. Air Waste Manag. Assoc. 2007, 57, 1103–1111. [Google Scholar] [CrossRef]
- Hosseini-Nasab, S.M.; Zitha, P.L.J. Investigation of Chemical-Foam Design as a Novel Approach toward Immiscible Foam Flooding for Enhanced Oil Recovery. Energy Fuels 2017, 31, 10525–10534. [Google Scholar] [CrossRef] [PubMed] [Green Version]
- Lysyy, M.; Ersland, G.; Fernø, M. Pore-Scale Dynamics for Underground Porous Media Hydrogen Storage. Adv. Water Resour. 2022, 163, 104167. [Google Scholar] [CrossRef]
- Costantini, M.; Jaroszewicz, J.; Kozoń, Ł.; Szlązak, K.; Święszkowski, W.; Garstecki, P.; Stubenrauch, C.; Barbetta, A.; Guzowski, J. 3D-Printing of Functionally Graded Porous Materials Using On-Demand Reconfigurable Microfluidics. Angew. Chem.-Int. Ed. 2019, 58, 7620–7625. [Google Scholar] [CrossRef]
- Omirbekov, S.; Davarzani, H.; Colombano, S.; Ahmadi-Senichault, A. Experimental and Numerical Upscaling of Foam Flow in Highly Permeable Porous Media. Adv. Water Resour. 2020, 146, 103761. [Google Scholar] [CrossRef]
- Bai, M.; Liu, Z.; Zhan, L.; Yuan, M.; Yu, H. Effect of Pore Size Distribution and Colloidal Fines of Porous Media on the Transport Behavior of Micro-Nano-Bubbles. Colloids Surfaces A Physicochem. Eng. Asp. 2023, 660, 130851. [Google Scholar] [CrossRef]
- Kovscek, A.R.; Bertin, H.J. Foam Mobility in Heterogeneous Porous Media. Transp. Porous Media 2003, 52, 17–35. [Google Scholar] [CrossRef]
- Hamamoto, S.; Takemura, T.; Suzuki, K.; Nishimura, T. Effects of PH on Nano-Bubble Stability and Transport in Saturated Porous Media. J. Contam. Hydrol. 2018, 208, 61–67. [Google Scholar] [CrossRef] [PubMed]
- Hamamoto, S.; Nihei, N.; Ueda, Y.; Moldrup, P.; Nishimura, T. Effects of Flow Rate and Gas Species on Microbubble and Nanobubble Transport in Porous Media. J. Environ. Eng. 2017, 143, 1–7. [Google Scholar] [CrossRef]
- Aranda, R.; Davarzani, H.; Colombano, S.; Laurent, F.; Bertin, H. Experimental Study of Foam Flow in Highly Permeable Porous Media for Soil Remediation. Transp. Porous Media 2020, 134, 231–247. [Google Scholar] [CrossRef]
- Tallakstad, K.T.; Knudsen, H.A.; Ramstad, T.; Løvoll, G.; Måløy, K.J.; Toussaint, R.; Flekkøy, E.G. Steady-State Two-Phase Flow in Porous Media: Statistics and Transport Properties. Phys. Rev. Lett. 2009, 102, 100–103. [Google Scholar] [CrossRef] [PubMed] [Green Version]
- Yi, T.; Yang, G.; Wang, B.; Zhuan, R.; Huang, Y.; Wu, J. Dynamics of a Gas Bubble Penetrating through Porous Media. Phys. Fluids 2022, 34, 012103. [Google Scholar] [CrossRef]
- Wang, C.; Mehmani, Y.; Xu, K. Capillary Equilibrium of Bubbles in Porous Media. Proc. Natl. Acad. Sci. USA 2021, 118, e2024069118. [Google Scholar] [CrossRef]
- Liontas, R.; Ma, K.; Hirasaki, G.J.; Biswal, S.L. Neighbor-Induced Bubble Pinch-off: Novel Mechanisms of in Situ Foam Generation in Microfluidic Channels. Soft Matter 2013, 9, 10971–10984. [Google Scholar] [CrossRef]
- Wei, B.; Wang, Y.; Wen, Y.; Xu, X.; Wood, C.; Sun, L. Bubble Breakup Dynamics and Flow Behaviors of a Surface-Functionalized Nanocellulose Based Nanofluid Stabilized Foam in Constricted Microfluidic Devices. J. Ind. Eng. Chem. 2018, 68, 24–32. [Google Scholar] [CrossRef]
- Ansari, S.; Nobes, D.S. Effect of the Pore Geometry on the Driving Pressure across a Bubble Penetrating a Single Pore. Fluids 2022, 7, 333. [Google Scholar] [CrossRef]
- Tourvieille, J.N.; Philippe, R.; de Bellefon, C. Milli-Channel with Metal Foams under an Applied Gas-Liquid Periodic Flow: Flow Patterns, Residence Time Distribution and Pulsing Properties. Chem. Eng. Sci. 2015, 126, 406–426. [Google Scholar] [CrossRef]
- Fei, K.; Hong, C.W. All-Angle Removal of CO2 Bubbles from the Anode Microchannels of a Micro Fuel Cell by Lattice-Boltzmann Simulation. Microfluid. Nanofluid. 2007, 3, 77–88. [Google Scholar] [CrossRef]
- Lan, Q.; Ye, D.; Zhu, X.; Chen, R.; Liao, Q. Enhanced Gas Removal and Cell Performance of a Microfluidic Fuel Cell by a Paper Separator Embedded in the Microchannel. Energy 2022, 239, 122098. [Google Scholar] [CrossRef]
- Xu, J.; Vaillant, R.; Attinger, D. Use of a Porous Membrane for Gas Bubble Removal in Microfluidic Channels: Physical Mechanisms and Design Criteria. Microfluid. Nanofluid. 2010, 9, 765–772. [Google Scholar] [CrossRef] [Green Version]
- Zhang, Z.; Wu, R.; Zhao, C. Pore-Scale Study of Buoyancy-Driven Gas Bubble Migration, Breakup, Trapping, and Coalescence in the near Injection Region of Liquid Saturated Porous Media. Ind. Eng. Chem. Res. 2021, 60, 12419–12428. [Google Scholar] [CrossRef]
- Serres, M.; Zanota, M.; Philippe, R.; Vidal, V. On the Stability of Taylor Bubbles inside a Confined Highly Porous Medium. Int. J. Multiph. Flow 2016, 85, 157–163. [Google Scholar] [CrossRef]
- Serres, M.; Maison, T.; Philippe, R.; Vidal, V. International Journal of Multiphase Flow A Phenomenological Model for Bubble Coalescence in Confined Highly Porous Media. Int. J. Multiph. Flow 2018, 105, 134–141. [Google Scholar] [CrossRef]
- Yao, C.; Zhao, Y.; Ma, H.; Liu, Y.; Zhao, Q.; Chen, G. Two-Phase Flow and Mass Transfer in Microchannels: A Review from Local Mechanism to Global Models. Chem. Eng. Sci. 2021, 229, 116017. [Google Scholar] [CrossRef]
- Zhang, K.; Cui, Z.; Field, R.W. Effect of Bubble Size and Frequency on Mass Transfer in Flat Sheet MBR. J. Memb. Sci. 2009, 332, 30–37. [Google Scholar] [CrossRef]
- Busser, T.; Serres, M.; Philippe, R.; Vidal, V. Hydrodynamics of Gas-Liquid Co-Current Flow through a Thin Sheet of Highly Porous Open Cell Solid Foam. Chem. Eng. Sci. 2020, 226, 115811. [Google Scholar] [CrossRef]
- Sheng, L.; Chen, Y.; Wang, K.; Deng, J.; Luo, G. General Rules of Bubble Formation in Viscous Liquids in a Modified Step T-Junction Microdevice. Chem. Eng. Sci. 2021, 239, 116621. [Google Scholar] [CrossRef]
- Chen, Y.; Sheng, L.; Deng, J.; Luo, G. Geometric Effect on Gas-Liquid Bubbly Flow in Capillary-Embedded T-Junction Microchannels. Ind. Eng. Chem. Res. 2021, 60, 4735–4744. [Google Scholar] [CrossRef]
- Sain, S.; Rajesh, V.M.; Gupta, K.; Sinha Roy, S. Effect of Inlet Contactors of Splitting Distributors for Parallel Microchannels. Ind. Eng. Chem. Res. 2021, 60, 16682–16700. [Google Scholar] [CrossRef]
- Sobieszuk, P.; Cygański, P.; Pohorecki, R. Bubble Lengths in the Gas-Liquid Taylor Flow in Microchannels. Chem. Eng. Res. Des. 2010, 88, 263–269. [Google Scholar] [CrossRef]
- Ju Lee, H.; Yong Lee, S. Pressure Drop Correlations for Two-Phase Flow within Horizontal Rectangular Channels with Small Heights. Int. J. Multiph. Flow 2001, 27, 783–796. [Google Scholar] [CrossRef]
- Delsontro, T.; McGinnis, D.F.; Wehrli, B.; Ostrovsky, I. Size Does Matter: Importance of Large Bubbles and Small-Scale Hot Spots for Methane Transport. Environ. Sci. Technol. 2015, 49, 1268–1276. [Google Scholar] [CrossRef] [PubMed]
- Liu, L.; Wilkinson, J.; Koca, K.; Buchmann, C.; Lorke, A. The Role of Sediment Structure in Gas Bubble Storage and Release. J. Geophys. Res. Biogeosci. 2016, 121, 1992–2005. [Google Scholar] [CrossRef]
- Tušer, M.; Picek, T.; Sajdlová, Z.; Jůza, T.; Muška, M.; Frouzová, J. Seasonal and Spatial Dynamics of Gas Ebullition in a Temperate Water-Storage Reservoir. Water Resour. Res. 2017, 53, 8266–8276. [Google Scholar] [CrossRef]
- Kulkarni, A.A. Mass Transfer in Bubble Column Reactors: Effect of Bubble Size Distribution. Ind. Eng. Chem. Res. 2007, 46, 2205–2211. [Google Scholar] [CrossRef]
- Bi, R.; Tang, J.; Wang, L.; Yang, Q.; Zuo, M.; Chen, C.; Xiang, S. Experimental Study on Bubble Size Distribution in Gas-Liquid Reversed Jet Loop Reactor. Int. J. Chem. React. Eng. 2020, 18. [Google Scholar] [CrossRef]
- El-Dossoki, F.I.; Abdalla, N.S.Y.; Gomaa, E.A.; Hamza, O.K. An Insight into Thermodynamic and Association Behaviours of Cocamidopropyl Betaine (CAPB) Surfactant in Water and Water–Alcohol Mixed Media. SN Appl. Sci. 2020, 2, 690. [Google Scholar] [CrossRef] [Green Version]
- Saffman, P.G.; Taylor, G.I. The penetration of a fluid into a porous medium or Hele-Shaw cell containing a more viscous liquid. Proc. R. Soc. Lond. Ser. A Math. Phys. Sci. 2017, 245, 312–329. [Google Scholar]
- Rabbani, H.S.; Or, D.; Liu, Y.; Lai, C.Y.; Lu, N.B.; Datta, S.S.; Stone, H.A.; Shokri, N. Suppressing Viscous Fingering in Structured Porous Media. Proc. Natl. Acad. Sci. USA 2018, 115, 4833–4838. [Google Scholar] [CrossRef] [PubMed] [Green Version]
- Pinilla, A.; Asuaje, M.; Ratkovich, N. Experimental and Computational Advances on the Study of Viscous Fingering: An Umbrella Review. Heliyon 2021, 7, e07614. [Google Scholar] [CrossRef] [PubMed]
- Homsy, G.M. Viscous Fingering in Porous Media. Annu. Rev. Fluid Mech. 1987, 19, 271–311. [Google Scholar] [CrossRef]
- Heaviside, J.; Brown, C.E.; Gamble, I.J.A. Relative Permeability for Intermediate Wettability Reservoirs. In Proceedings of the SPE Annual Technical Conference and Exhibition, Dallas, TX, USA, 27–30 September 1987; SPE-16968-MS. [Google Scholar]
- Lenormand, R.; Touboul, E.; Zarcone, C. Numerical Models and Experiments on Immiscible Displacements in Porous Media. J. Fluid Mech. 1988, 189, 165–187. [Google Scholar] [CrossRef]
- Zhang, C.; Oostrom, M.; Wietsma, T.W.; Grate, J.W.; Warner, M.G. Influence of Viscous and Capillary Forces on Immiscible Fluid Displacement: Pore-Scale Experimental Study in a Water-Wet Micromodel Demonstrating Viscous and Capillary Fingering. Energy Fuels 2011, 25, 3493–3505. [Google Scholar] [CrossRef]
- Smith, W.O.; Crane, M.D. The Jamin Effect in Cylindrical Tubes. J. Am. Chem. Soc. 1930, 389, 385–389. [Google Scholar] [CrossRef]
- Ransohoff, T.C.; Radke, C.J. Mechanisms of Foam Generation in Glass Bead Packs. SPE Reservoir Eng. 1986, 2, 573–585. [Google Scholar] [CrossRef] [Green Version]
- Kovscek, A.R.; Radke, C.J.; Schramm, L.L. Foams: Fundamentals and Applications in the Petroleum Industry; ACS American Chemical Society: Washington, DC, USA, 1994; Volume 242. [Google Scholar]
- Almajid, M.M.; Kovscek, A.R. Pore Network Investigation of Trapped Gas and Foam Generation Mechanisms. Transp. Porous Media 2020, 131, 289–313. [Google Scholar] [CrossRef]
- Abdelgawad, K.Z.; Adebayo, A.R.; Isah, A.; Muhammed, N.S. A Literature Review of Strength and Stability of Foam and Their Relationship with the Absolute Permeability of Porous Media. J. Pet. Sci. Eng. 2022, 211, 110195. [Google Scholar] [CrossRef]
- Kovscek, A.R.; Patzek, T.W.; Radke, C.J. Mechanistic Foam Flow Simulation in Heterogeneous and Multidimensional Porous Media. SPE J. 1997, 2, 511–526. [Google Scholar] [CrossRef] [Green Version]
- Akin, S.; Demiral, M.R.B. Effect of Flow Rate on Imbibition Three-Phase Relative Permeabilities and Capillary Pressures. In Proceedings of the SPE Annual Technical Conference and Exhibition, San Antonio, TX, USA, 5–8 October 1997; SPE-38897-MS. [Google Scholar]
- Muskat, M.; Wyckoff, R.D.; Botset, H.G.; Merres, M.W. Flow of Gas-Liquid Mixtures through Sands. Aircr. Eng. Aerosp. Technol. 1979, 51, 6–11. [Google Scholar] [CrossRef]
- Fetter, C.W. Contaminant Hydrogeology; Prentice Hall: Upper Saddle River, NJ, USA, 1992. [Google Scholar]
Figure 1.
The bubble generation system and the experimental set-up for visualizing bubble flow in a packed microchannel. Microslide images are µ-Slide III 3in1 (left) and µ-Slide I Luer (right) from ibidi (ibidi, Martinsried, Germany).
Figure 1.
The bubble generation system and the experimental set-up for visualizing bubble flow in a packed microchannel. Microslide images are µ-Slide III 3in1 (left) and µ-Slide I Luer (right) from ibidi (ibidi, Martinsried, Germany).

Figure 2.
Visual data analysis. (a) An example frame from the 0.8 mm microchannel. (b) The corresponding visual data RGB analysis result. Blue represents water, red represents air, and black represents porous media.
Figure 2.
Visual data analysis. (a) An example frame from the 0.8 mm microchannel. (b) The corresponding visual data RGB analysis result. Blue represents water, red represents air, and black represents porous media.

Figure 3.
The relationship between bubble size and liquid/air flow rate ratio.

Figure 4.
logNCa vs logM phase diagram shows the three flow regimes of viscous fingering, stable displacement, and capillary fingering. The blue open circles locate experiments performed in this work. The solid black line indicates the original proposed boundaries [48], and the dashed lines represent the proposed boundaries for micromodel [49]. M is viscosity ratio of invading fluid (air) to defending fluid (liquid), it is 1.8 × 10⁻² in this work.

Figure 5.
Images of porous medium microchannel taken during bubble transport experiment under ql = 0.6 mL/min and qa = 0.08 mL/min in 0.8 mm height microchannel (Exp. No. 9). these five images were taken at (a) t = 2:57 min, (b) t = 2:59 min, (c) t = 3:01 min, (d) t = 3:03 min, and (e) t = 3:05 min. The bubble started to enter the channel at (b) time point. The black arrow at top indicates the flow direction. The red outlines represent the air phase area. The white arrows and white dashed circle indicate the bubble formed by snap-off; the green arrow indicate the bubble formed by leave-behind. The yellow arrows indicate the small bubbles generated in situ where the incoming bubble moving through. The area enclosed by light blue dashed squares indicates where the pattern of bubble displacement can be observed.

Figure 6.
Three mechanisms of in situ bubble generation: (a) snap-off; (b) lamella division; and (c) leave-behind. The red region indicates the gas phase. Adapted with permission from Abdelgawad et al. [54]. 2022, Elsevier.
Figure 6.
Three mechanisms of in situ bubble generation: (a) snap-off; (b) lamella division; and (c) leave-behind. The red region indicates the gas phase. Adapted with permission from Abdelgawad et al. [54]. 2022, Elsevier.

Figure 7.
The change in liquid holdup over the time in the 0.6 mm channel under three flow conditions.
Figure 7.
The change in liquid holdup over the time in the 0.6 mm channel under three flow conditions.

Figure 8.
The normalized breakthrough frequencies (breakthrough frequency/generation frequency) for each experiment. Vb is the bubble volume.
Figure 8.
The normalized breakthrough frequencies (breakthrough frequency/generation frequency) for each experiment. Vb is the bubble volume.

Figure 9.
The relative permeabilities (kr) and average water saturation (Sw) for each channel and flow combination.
Figure 9.
The relative permeabilities (kr) and average water saturation (Sw) for each channel and flow combination.


Table 1.
Conditions applied during the experiments and their corresponding capillary numbers.
| Exp. No. | ql 1 (mL/min) | qa 2 (mL/min) | ql/qa | H 3 (mm) | φ 4 | Bubble Sizes (mm3) | fg 5 (Bubbles /min) | fb 6 (Bubbles /min) | Log (Nca) 7 | K (m/s) | kr 8 | Average Sw 9 (%) |
|---|---|---|---|---|---|---|---|---|---|---|---|---|
| 1 | 0.4 | 0.015 | 26.6 | 0.4 | 0.48 | 19 | 5 | 3 | −3.72 | 10.2 | 0.09 | 41.8 |
| 2 | 0.4 | 0.015 | 26.6 | 0.6 | 0.49 | 19 | 5 | 3 | −3.90 | 18.5 | 0.18 | 49.7 |
| 3 | 0.4 | 0.015 | 26.6 | 0.8 | 0.48 | 19 | 5 | 2 | −4.02 | 39.1 | 0.65 | 65.5 |
| 4 | 0.6 | 0.02 | 30.0 | 0.4 | 0.48 | 19 | 4 | 3 | −3.54 | 28.9 | 0.27 | 53.3 |
| 5 | 0.6 | 0.02 | 30.0 | 0.6 | 0.49 | 19 | 4 | 3 | −3.72 | 42.7 | 0.37 | 52.5 |
| 6 | 0.6 | 0.02 | 30.0 | 0.8 | 0.48 | 19 | 4 | 2 | −3.84 | 66.3 | 0.91 | 60.3 |
| 7 | 0.6 | 0.08 | 7.5 | 0.4 | 0.48 | 24 | 15 | 5 | −3.54 | 12.6 | 0.12 | 41.8 |
| 8 | 0.6 | 0.08 | 7.5 | 0.6 | 0.49 | 24 | 15 | 6 | −3.72 | 20.1 | 0.18 | 39.1 |
| 9 | 0.6 | 0.08 | 7.5 | 0.8 | 0.48 | 24 | 15 | 6 | −3.84 | 31.3 | 0.43 | 63.0 |
Note(s): 1, 2 ql and qa denote the flow rate of liquid solution and air, respectively. 3, 4 h stands for the height and estimated porosity of each channel, respectively. 5, 6 fg and fb represent the generation frequency of injected bubble and breakthrough frequency of flowing bubble, respectively. 7 It indicates the logarithm of capillary numbers for each experiment. 8 kr represents the relative permeability of liquid phase. 9 Average Sw is defined as average water saturation of the porous medium during the bubble transport experiment.
Disclaimer/Publisher’s Note: The statements, opinions and data contained in all publications are solely those of the individual author(s) and contributor(s) and not of MDPI and/or the editor(s). MDPI and/or the editor(s) disclaim responsibility for any injury to people or property resulting from any ideas, methods, instructions or products referred to in the content. |
© 2023 by the authors. Licensee MDPI, Basel, Switzerland. This article is an open access article distributed under the terms and conditions of the Creative Commons Attribution (CC BY) license (https://creativecommons.org/licenses/by/4.0/).
Share and Cite
MDPI and ACS Style
Haggerty, R.; Zhang, D.; Eun, J.; Li, Y. Characterization of Bubble Transport in Porous Media Using a Microfluidic Channel. Water 2023, 15, 1033. https://doi.org/10.3390/w15061033
AMA Style
Haggerty R, Zhang D, Eun J, Li Y. Characterization of Bubble Transport in Porous Media Using a Microfluidic Channel. Water. 2023; 15(6):1033. https://doi.org/10.3390/w15061033
Chicago/Turabian StyleHaggerty, Ryan, Dong Zhang, Jongwan Eun, and Yusong Li. 2023. "Characterization of Bubble Transport in Porous Media Using a Microfluidic Channel" Water 15, no. 6: 1033. https://doi.org/10.3390/w15061033
Note that from the first issue of 2016, this journal uses article numbers instead of page numbers. See further details here.