
Comprehensive Comparison of Various Microplastic Sampling Methods in Sea Water: Implications for Data Compilation
1
State Key Laboratory of Estuarine and Coastal Research, East China Normal University, 500 Dongchuan Road, Shanghai 200241, China
2
Department of Chemical Engineering, Imperial College London, London SW7 2AZ, UK
3
Marine and Environmental Sciences, Northeastern University, 360 Huntington Avenue, Boston, MA 02115, USA
*
Authors to whom correspondence should be addressed.
Water 2023, 15(6), 1035; https://doi.org/10.3390/w15061035
Submission received: 13 February 2023
/
Revised: 6 March 2023
/
Accepted: 8 March 2023
/
Published: 9 March 2023
(This article belongs to the Special Issue The Microplastics in Aquatic Environments: Sources, Distribution and Effects)
Abstract
:The problem of plastic and microplastic (MP, <5 mm in size) pollution has received widespread attention globally, with its widespread presence being reported in various environmental media. However, a lack of standard sampling and analysis methods is making it difficult to compare data across studies and understand the source and fate of plastics and MPs. Common sampling strategies used in studies of MP in natural waters include Manta net and pump filtering using different mesh sizes, but the impact of these sampling technologies on the final MP abundance and characteristics is not well understood. This study used common sampling devices, including a Manta trawl net, shallow-water plankton pump (SPP), deep-water plankton pump (DPP), and submersible pump with on-site filtration using 50 and 330 µm aperture size meshes, to sample MP in natural coastal water. The results showed that while Manta trawl and plankton pumps produced similar MP abundance (2.0–6.0 n/m3), the MP characterization was significantly different, with fibers being the dominant MP in plankton samples (>70%) and only 14.2% in Manta trawl samples. Submersible pump sampling using a 50 µm mesh retained a higher percentage of fibers, with a two magnitude higher abundance of MPs (357 ± 119 and 553 ± 19 n/m3 for 330 µm and 50 µm mesh, respectively) attributed to the floating debris encountered during sampling and the shallower sampling depth as well as smaller sampling volume. This study highlights the key factors that impact MP abundance and characteristics as well as the challenges to harmonizing MPs sampling methods in aquatic environments, which is also helpful for data compilation across studies.
1. Introduction
The issue of marine plastic pollution has gained significant attention in recent years due to an increasing number of reports on the subject worldwide. In 2016, the world’s plastic production reached 367 million tons [1]. Once ending in the environment, these plastics tend to break down into smaller particles through physical processes (such as ultraviolet rays), chemical processes (such as oxidation), and biological processes (such as being ingested by organisms) [2]. Particles smaller than 5 mm are referred to as microplastics and have received extensive attention from researchers because of their small size, ubiquitous distribution, hydrophobic nature, and ability to adhere to microorganisms and absorb persistent organic pollutants [3].
The field of MP surveys in natural environments has been expanding exponentially in the past ten years, yet the lack of standardized methods remains a significant knowledge gap, making cross-study data comparisons difficult and hindering our understanding of the source and fate of MPs [4]. The sampling of MPs in aquatic environments can be categorized into two main large-volume-based method groups: net sampling and direct pump sampling [5]. Net sampling methods vary in terms of the type of net used and its mesh size, with commonly used net types including Manta trawl, Neuston net [6,7], Ring net [8], Bongo plankton net for deep-water MP sampling [9], and bottom trawl [10]. This method accounted for more than half of MP field survey studies in river water, with the mesh pore size varied from 100 µm to 335 µm [5]. Direct pump sampling methods include submersible pump sampling with on-deck filtration [11,12] and plankton pump with in situ filtration [13,14]. The submersible pump has limitations on the depth it can sample due to cable and tube length constraints, while the plankton pump can directly filter underwater and can be deployed down to 6000 m [13]. The diversity of these MP sampling methods has resulted in issues with data comparison and compilation. However, the impact of different sampling methods on MP abundance and characteristics is not well understood. Especially to our best knowledge, direct data comparison of those sampling methods in the natural water environment is still very limited.
Besides the sampling methods, the sampling condition when the samples were collected could also impact the MP survey results. Different from the dissolved pollutants, plastics and MPs are particles that cannot be well mixed. Their distribution is highly impacted by physical factors, such as wind, current, tides, upwelling, etc. Those factors will lead to the uneven distribution of plastic and MPs in the surface water as well as in the water column [15]. Zhao et al. (2019) found a patchy distribution of MPs in the coastal East China Sea; the abundance of MPs in one area could be more than 10 times higher than in the adjacent area despite the higher similarity in geological scale [12]. Wang et al. (2022) further proposed the theory that ocean and estuarine fronts could play important roles in accumulating plastics [15]. However, the real-time impacts of the “floated debris hotspot” on the sampling results have not been deployed and reported.
To address the above knowledge gaps, we conducted in situ sampling of MPs in the water column using various sampling devices, including the Manta trawl net, shallow-water plankton pump (SPP), deep-water plankton pump (DPP), and a submersible pump with on-site filtration, using different filtration mesh sizes in Zhoushan Fishing Ground, a typical coastal area heavily impacted by human activities. During the submersible pump sampling, a large number of debris floated by, providing us with the opportunity to evaluate the impact of these “floating debris hotspots”. Our objectives were: (1) to compare the results of MPs sampling obtained with the plankton pump and Manta net; (2) to assess the repeatability of the SPP and DPP for MPs sampling in the water column (from the surface to the bottom layer); (3) to investigate the impact of “floating debris hotspots” on MPs survey results; and (4) to examine the effects of using 50 µm and 300 µm mesh sizes on MPs survey results.
This study had two novel aspects. Firstly, we compared the effectiveness of different MP sampling methods, including the Manta net and various types of plankton pumps, through a direct in situ comparison. While plankton pumps have been suggested as a new method for MP sampling, their results have not been previously compared to those of the Manta net in natural aquatic environments. Secondly, we assessed the impact of uneven MP distribution on the final MP results, which enhanced our understanding of the challenges in harmonizing MP sampling methods and compiling data across multiple studies.
2. Materials and Methods
2.1. Study Area and Sampling Methods
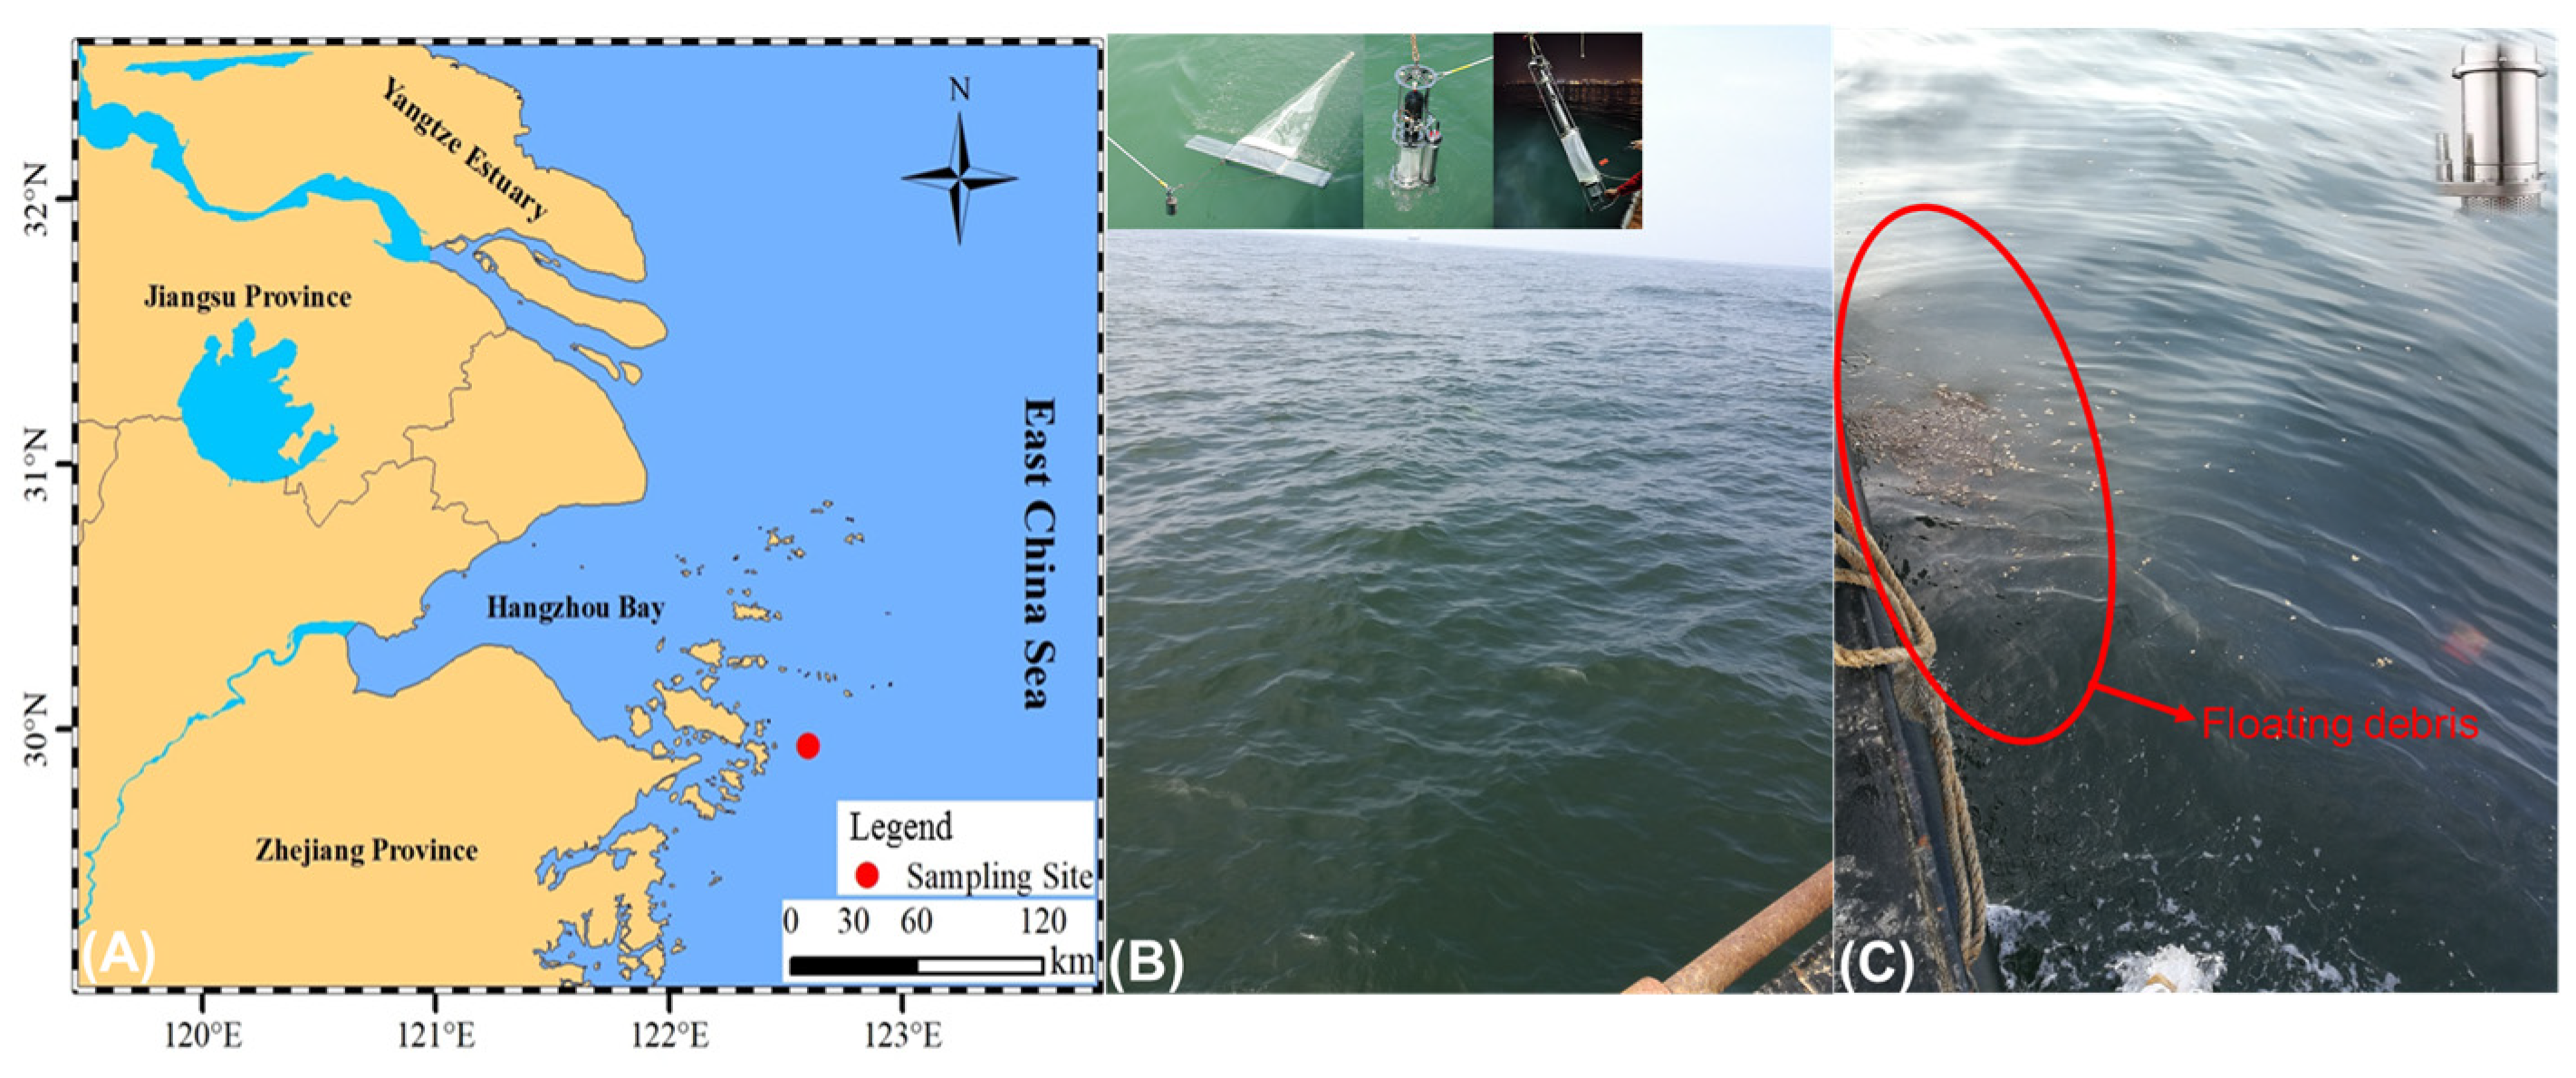
The sampling site for our study is located at the Zhoushan Fishing Ground in the East China Sea (Figure 1A). As the most well-known and extensive fishing ground in China, this region boasts abundant marine resources and intensive fishing activities. Additionally, the Zhoushan Fishing Ground is situated near the highly populated cities of Shanghai and Zhejiang Province and is impacted by land-based plastic and MP waste exportation from the Yangtze River Estuary and the Qiantangjiang Estuary, both of which are significant sources of plastic waste [16]. Given these factors, the Zhoushan Fishing Ground serves as an ideal location to study the methodology of MPs and provides valuable baseline data and reference for MPs data compiled in the area.
Our study was conducted on RV “Zhepu Yu 04126” in September 2018. Manta trawl net, SPP, DP, and submersible pump with on-site filtration using 50 and 330 µm pore size meshes were used to collect MP samples both in the water surface and water column (Figure 1B,C). Operation details of different sampling methods are described as follows.
2.1.1. Manta Net Sampling
The Manta trawl used in this study has a 61 cm × 16 cm opening and a 3 m long net with a standard mesh size of 330 µm (Figure 1B). One sample was collected. It was deployed on the side of the boat and towed horizontally along the water surface for a duration of 30 min while the vessel was traveling at a speed of 2–3 knots. The filtered water volume was quantified by a flow meter (KC Denmark No. 23.091) which was fixed at the mouth of the net. Following the completion of the sample collection, the exterior of the net and removal bottom bag was rinsed thoroughly with seawater. The contents in the removal bag of the trawl were then carefully extracted and transferred to a pre-cleaned 1 L HDPE bottle.
2.1.2. Plankton Pumps
Plankton pumps have been deployed in MP studies recently [13,14]. They can pump and filter the water directly in the water column. This not only reduces extra filtration procedures, reducing the chances of contamination, but also makes it applicable for MPs sampling in deep water. Furthermore, meshes of the plankton pump are easily replaceable, which makes it possible to replace the most commonly used 330 µm mesh with meshes with smaller pore sizes down to 50 µm.
In this study, both SPP and DPP (KC Denmark A/S, Denmark, Figure 1B) were applied for MP sampling in surface (1 m), medium (13 m), and bottom (23 m) water layers. One sample was collected at each water level using SPP and DPP, respectively. The mesh size used was 150 µm. The shallow-water plankton pump was equipped with a cable, which enabled it to work automatically after reaching the sampling water layer. After manually setting the delay time and working time, the deep-water plankton pump automatically began the MP sampling of different water layers when it arrived at the sampling site. Each layer of water was sampled for 10 min. In total, The SPP and DPP filtered 5 m3 (30 m3/h) and 3 m3 (18 m3/h) of water, respectively. The outer layer of the plankton pumps was washed with seawater three times after the sample collection was completed, and samples were transferred from the plankton pump collecting bottles to 1 L pre-cleaned HDPE bottles.
2.1.3. Submersible Pumps
The other deployed method involved utilizing a submersible pump to gather surface water. Specifically, 100 L of the top 50 cm of the water were pumped onto the deck and filtered on site through two different mesh sizes: 50 µm and 330 µm (These mesh sizes are referred to as the 50 µm and 330 µm meshes in subsequent texts). After filtration, the samples were carefully packaged in pre-combusted aluminum foil and placed in a zip bag. Three duplicates of each sample were collected for each mesh size. All samples were collected within one day and stored at 5 °C before laboratory analysis.
Specifically, the sea conditions were different during the sampling. The surface water was clear, and no obvious debris was noted when the Manta trawl and plankton pumps were deployed for sampling (Figure 1B). However, there was a mass of debris floating over the sampling area when the submersible pump was pumping water (Figure 1C). This scenario gave us a unique chance to evaluate the impacts of floating debris hotspots on MPs’ uneven distribution at the ocean surface.
The salinity of the seawater while sampling was simultaneously measured by a self-logging turbidity-temperature monitor (OBS-3A, Campbell Scientific, Inc., Logan, UT, USA; sampling interval: 1.0 min).
2.2. Laboratory Analysis
All the plastic particles, including MPs collected by the sample devices, were included in this study. The sampling procedure followed steps established by our lab [12,17]. Samples were firstly poured or rinsed thoroughly through 5 mm and 0.25 mm stacked sieves. Material collected on the 5 mm sieves was transferred to a clean petri dish with stainless steel tweezers.
Material retained on the 0.25 mm sieve was washed into a clean beaker, and 30% H2O2 solution and an appropriate amount of acidic ferrous sulfate solution were slowly added to the remaining liquid. The sample was covered with combusted foil and kept in a thermostatic water bath at 60 °C until the solution was clear in appearance.
After digestion, the samples were then filtered onto a glass fiber filter (GF/A Whatman, 47 mm diameter with 1.6 µm pore size) via a vacuum system. Finally, the filter was carefully transferred to a pre-combusted glass petri dish and stored in a desiccator for further analysis.
2.3. Sample Identification
All the filter papers were examined visually under a stereo microscope (Leica M165FC, Wetzlar, Germany) equipped with a camera (Leica DFC450C). All the potential plastic and MP samples were recorded by images and further analyzed and recorded their size, shape, and color. The size of plastics was measured using ImageJ software.
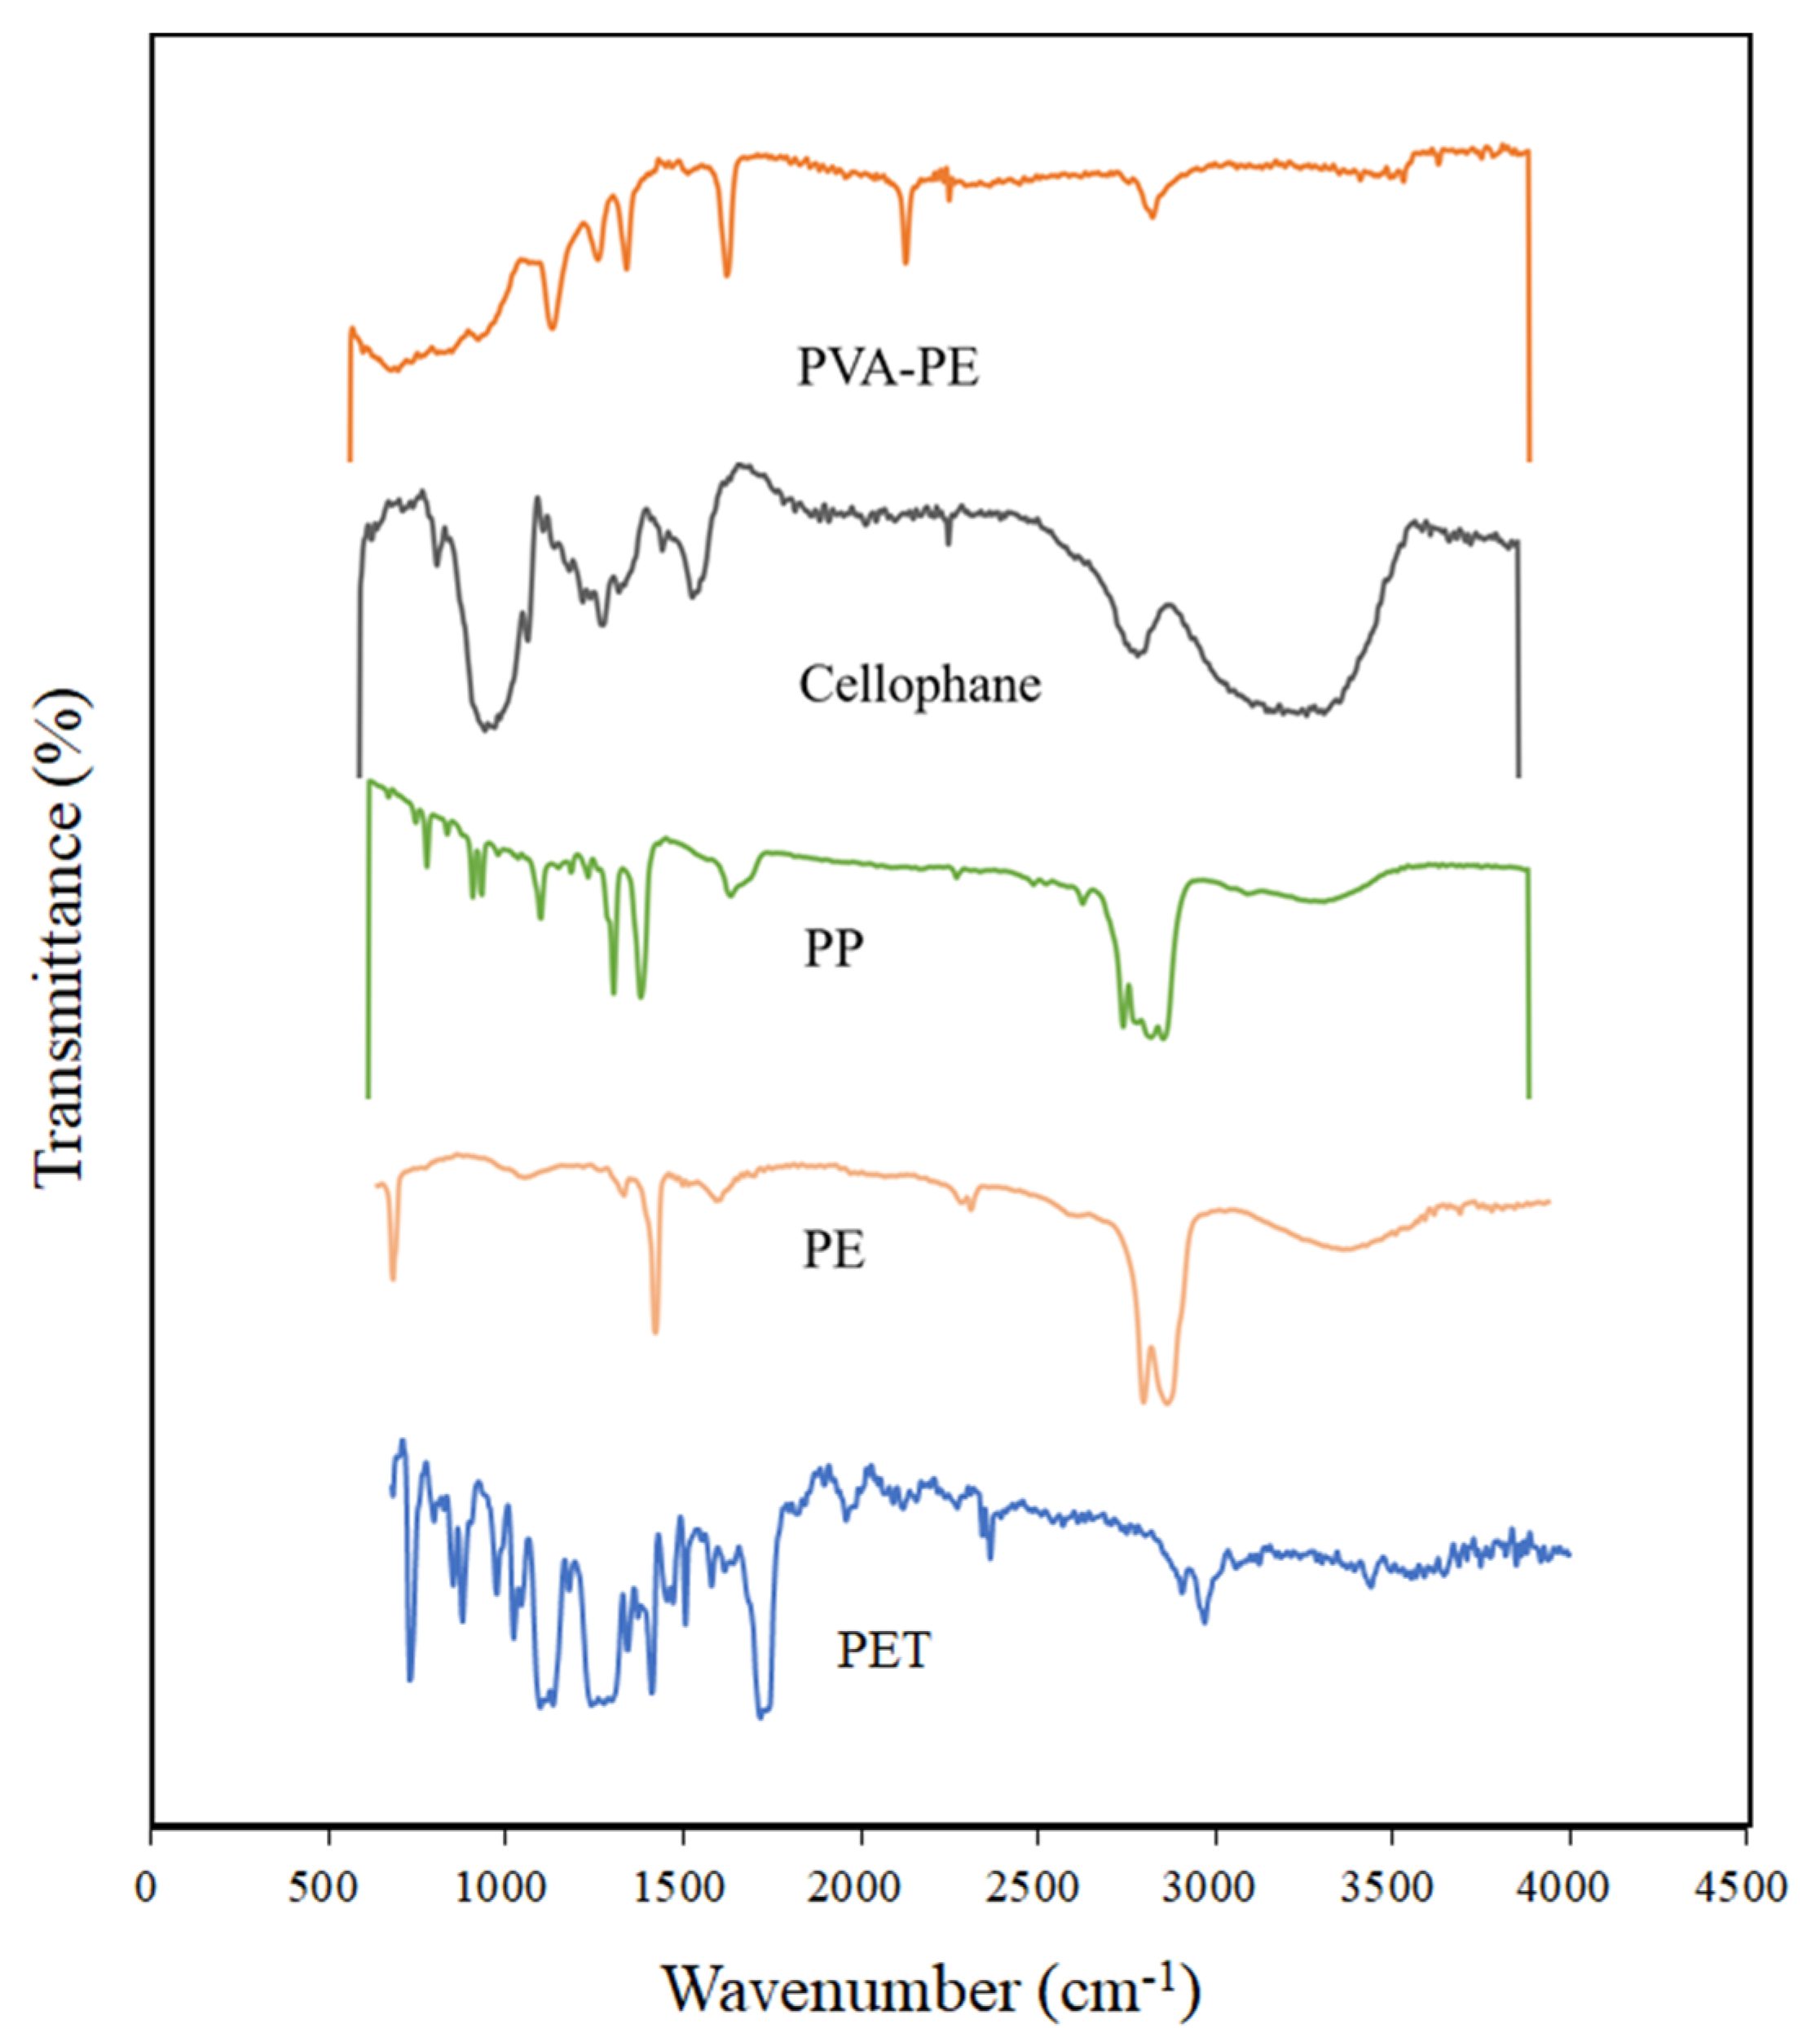
To identify their chemical composition, plastics larger than 1 mm were identified using a Fourier transform infrared spectrometer (Thermo Fisher Scientific Nicolet iS5, Waltham, MA, USA) equipped with an iD7 type attenuated total reflection probe, while plastics smaller than 1 mm were identified using micro-Fourier transform infrared spectrometer in transmission mode (micro-FTIR, Thermo Scientific iN10 MX). Each scan was accumulated as the average of 32 scans in the spectral range of 600–4000 cm−1 at a resolution of 4 cm−1. Each spectrum was compared against a database from ThermoFisher (OMNIC Picta) to verify the polymer type. Matching spectra with a quality index above 70% were accepted. Individual FTIR spectra of MPs do not demonstrate any characteristics correlated with sampling conditions, including sampling depth, sampling methods, etc. Representative FTIR spectra of MPs extracted from the samples are shown in Figure 2.
2.4. Contamination Prevention
In order to avoid air MP pollution, all personnel were equipped with pure cotton laboratory clothing and NBR gloves during the experiment. Sample bottles were cleaned by soaking in dilute 10% HCl overnight and rinsed thoroughly with Milli-Q water. All glassware was washed with distilled water, dried, wrapped in aluminum foil, and then combusted at 450 °C for at least 4 h. All liquids used (Fe (II) solution and 30% H2O2) were filtered using a 0.7 µm glass fiber filter (Whatman GF/F) with a vacuum pump. During the procedure, the clean glassware was covered with combusted foil wherever and whenever possible. Steel tweezers were washed with Milli-Q water and sterilized under a flame prior to use. Clean petri dishes and filter paper exposed to the air were used to determine whether there was any additional contamination from the air during isolation, observation, and validation processes.
2.5. Statistical Analysis
Data statistics were performed using Microsoft Office Excel 2016, data analysis was performed using SPSS software, and drawing was performed using Origin 2017, R 3.5.1.
3. Results and Discussions
3.1. MP Abundance
No MPs were identified in the blank samples. The final plastic and MP abundance and characters were summarized in Table 1. A total of 507 plastic particles were identified from the samples. The MP abundance collected by the Manta trawl is 2.31 n/m3, while the MP abundance in the surface water collected by SPP and DPP was 2.00 n/m3 and 6.00 n/m3, respectively. In the water column, the MPs abundance is 1.00 n/m3 and 1.67 n/m3 in the medium water layer and 0.80 n/m3 and 3.00 n/m3 in the bottom water layer, collected by SPP and DPP, respectively. But the fiber composition collected by SPP is 20% and 25% in the medium and bottom layer, significantly lower than 66.7% and 94.9% identified in the DPP samples. The MPs abundance collected by the submersible pump is significantly two orders of magnitude higher than the results obtained by the Manta trawl and plankton pumps. The average MP abundance was 357 ± 119 n/m3 and 553 ± 19 n/m3 for 330 µm, and 50 µm filter mesh size. The fiber composition is 71% and 94.9%, respectively.
3.2. Characteristics of MP
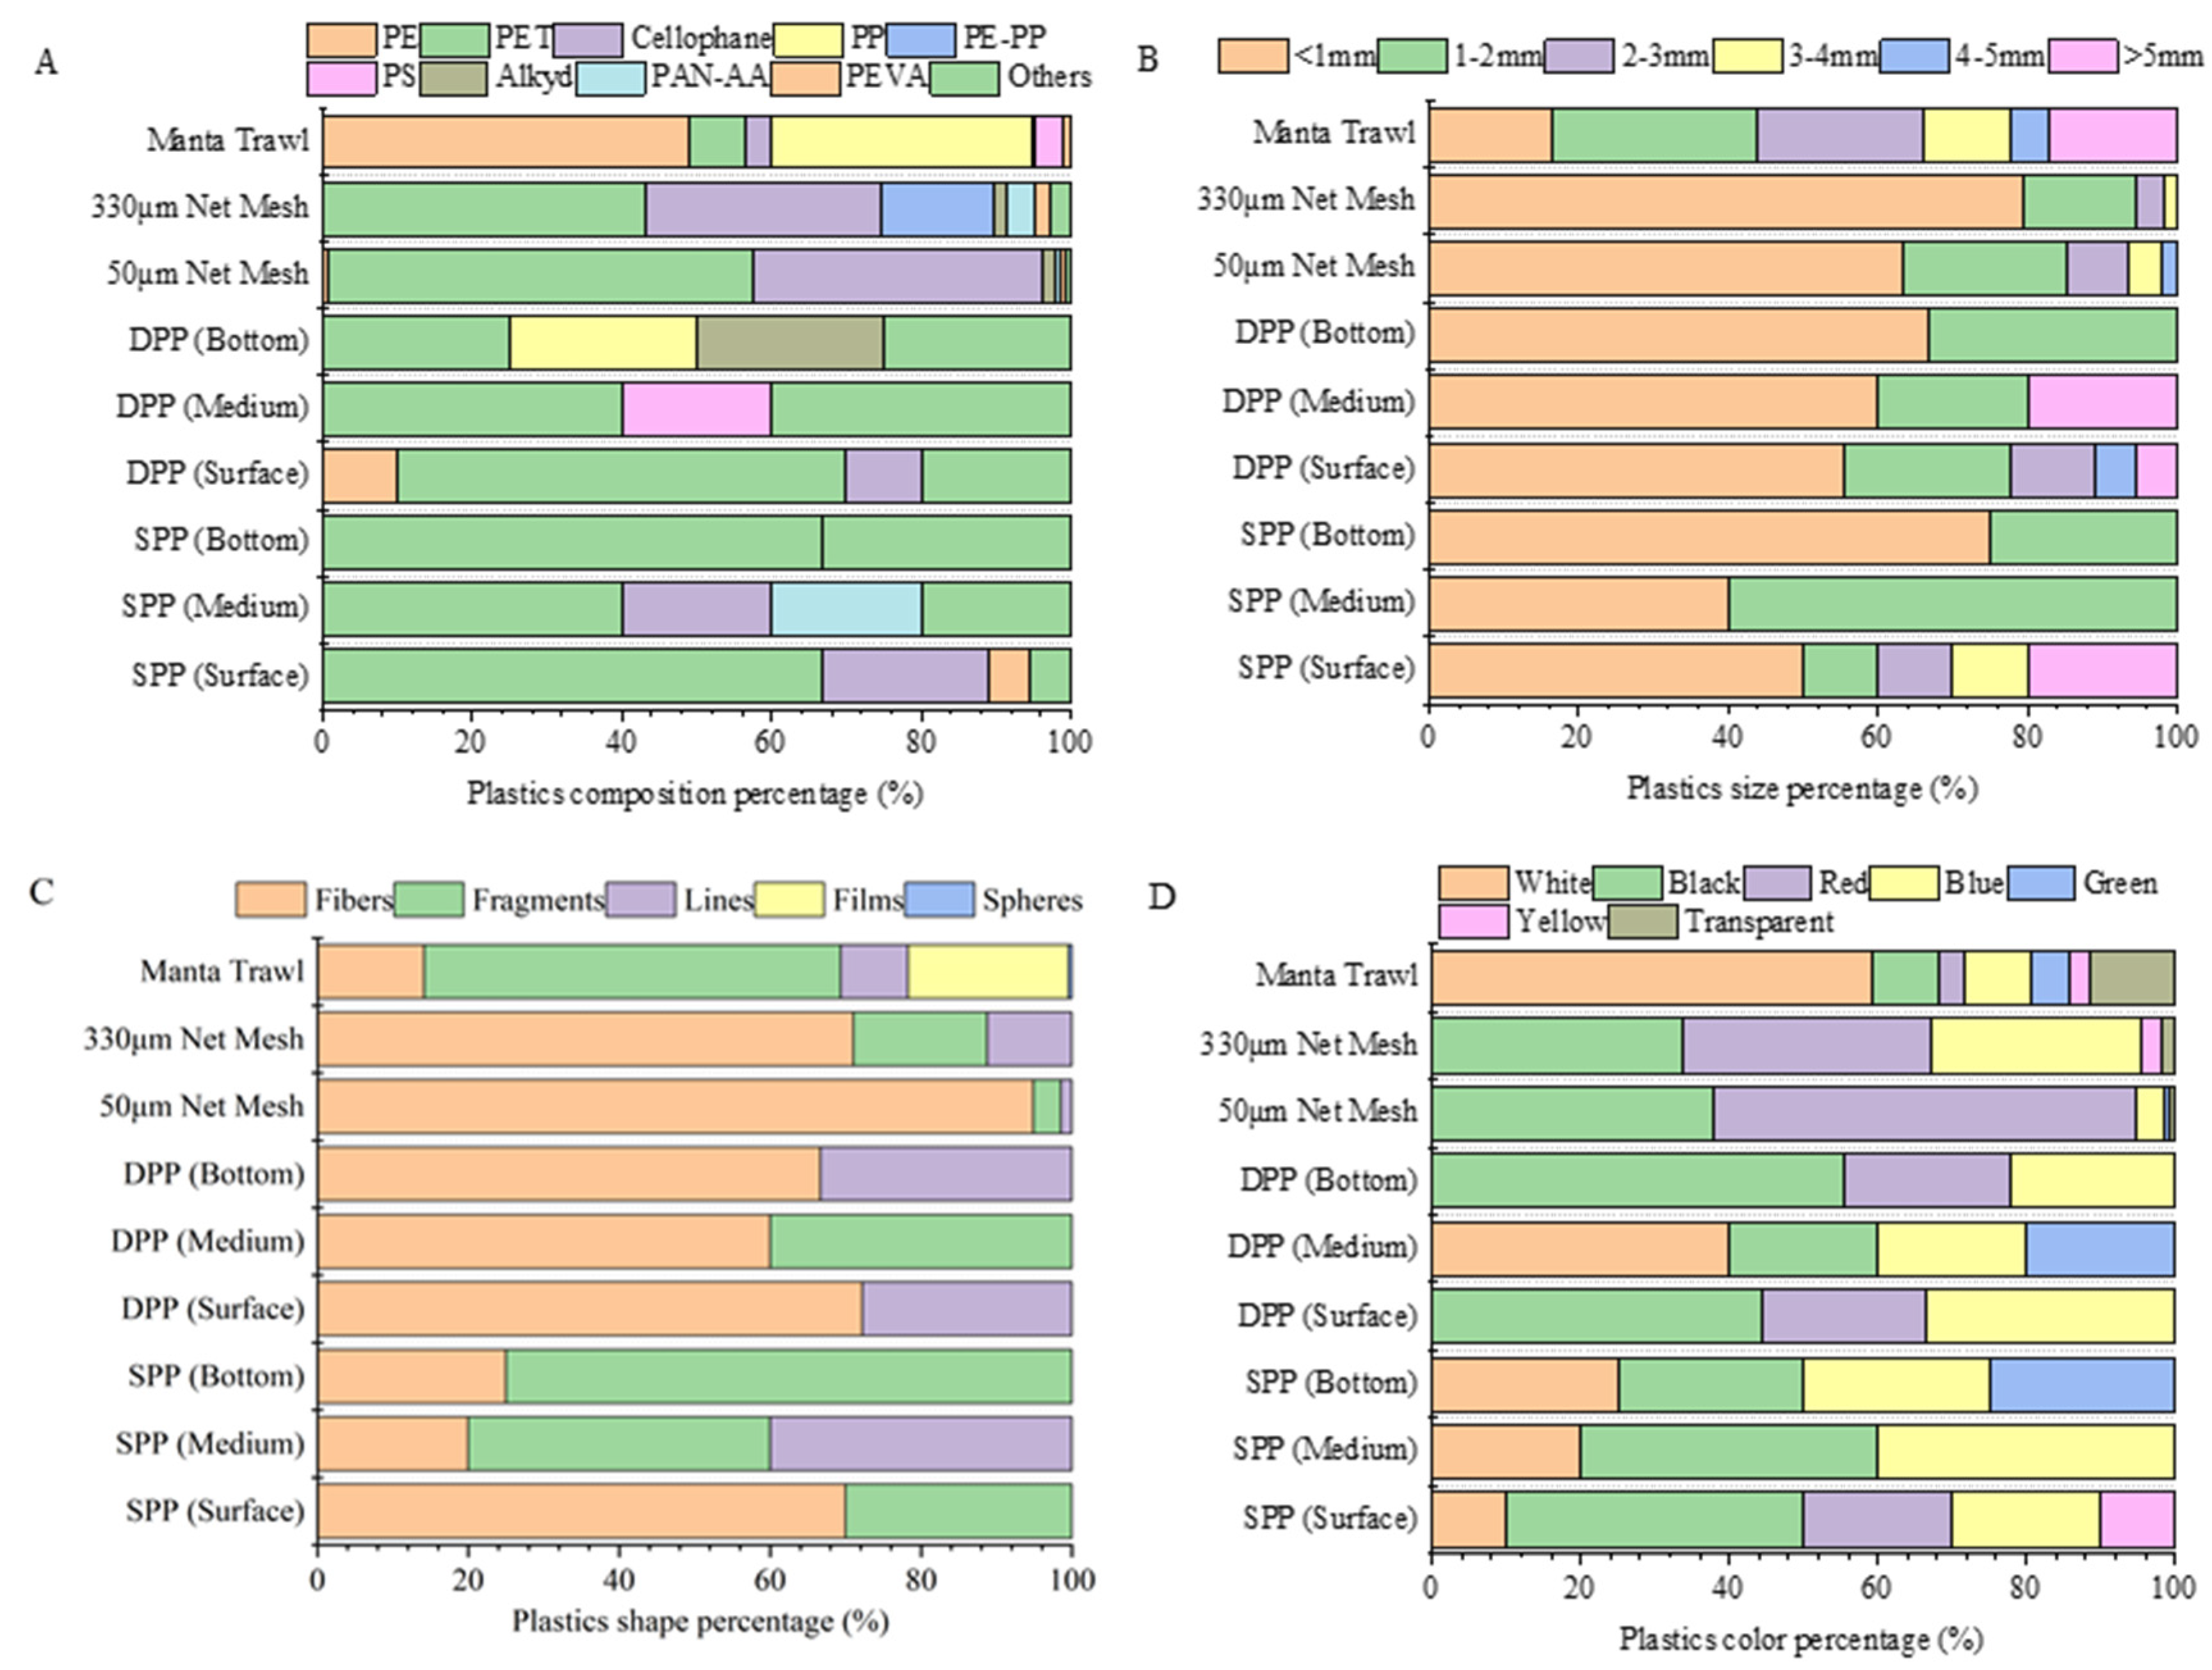
Plastic chemical type, size, shape, and color were common characteristics that were used to describe MP properties. The characteristics of plastic particles identified in this study using different methods are shown in Figure 3.
Overall, FTIR confirmed that plastics in the sample consisted of 18 types of plastic polymer, including polyethylene (PE), polyethylene terephthalate (PET), cellophane, alkyd resin (Alkyd), polypropylene (PP), polystyrene (PS), poly (acrylonitrile: acrylic acid) (PAN-AA), ethylene/vinyl acetate copolymer (PEVA), poly (ethylene: propylene) (PE-PP) and others (Figure 3A). Among these plastics, polyethylene terephthalate (PET) was of the greatest amount (33.33%), followed by polyethylene (PE) (20.91%) (Figure 3A). PE and PP account for the highest proportion of total plastics due to their massive production and consumption (Plastics Europe, 2021) and their low density (Density of PE: 0.92–0.97g/cm3; Density of PP: 0.90–0.91g/cm3). The land source of these plastic wastes may include intentional or unintentional dumping of garbage to riverbanks [18], surface runoff from urban regions [19], coast [20], and even from the atmosphere [21]. Marine sources of these plastic wastes may include shipping, fishing, aquaculture, offshore mining, illegal dumping, and other maritime activities [22].
The size of the collected plastic particles was separated into six groups: <1 mm, 1–2 mm, 2–3 mm, 3–4 mm, 4–5 mm, and >5 mm. Overall, the percentages of these six size groups are 45.96%, 22.98%, 13.19%, 7.02%, 2.98%, and 7.87%, respectively.
In terms of shapes and colors, Plastic particles were separated into five shape categories: fiber (52.66%), block (29.78%), strip (8.48%), film (8.88%), and spherical (0.20%). Fibers are the dominant plastic type (Figure 3C). These plastic particles collected can be divided into seven color categories: white (25.84%), black (25.25%), red (25.44%), blue (13.41%), green (2.76%), transparent (5.33%), and yellow (1.97%) (Figure 3D).
3.3. MPs Data Comparison between the Manta Trawl and Plankton Pump
Direct data comparison between plankton pumps and other sampling methods is still very scarce. In this study, the sampling conducted by plankton pumps and Manta trawl was in similar sea conditions (Figure 1B).
Overall, the MP abundance in the surface water collected using the Manta trawl, SPP, and DPP was at the same magnitude (2.00–6.00 n/m3) (Table 1). The abundance of surface MPs in samples collected by DPP and SPP was 5.67 n/m3 and 1.60 n/m3, respectively. In the study of Xu et al. (2018), the MPs in the Yangtze River estuary and the East China Sea region were abundant, and the degree was 2.31 ± 1.82 n/m3 [11]; the MPs’ abundance was at similar levels.
There was a significant composition difference in the MPs’ characteristics among the samples collected by different sampling methods. In the Manta trawl, fibers only accounted 14.15% of the total plastic particles, while fibers composed more than 70% in SPP and DPP samples. The fiber percentage is comparable to the previous results [23]. The most common shape in Manta trawl samples was fragment (55.19%). Fibers and small particles are easier to escape from Manta trawl compared to the pump sampling as the larger mesh size and higher water pressure [5]. Previous studies also suggested that the 330 µm mesh size may cause the outflow of fibers [24]. This can be further supported by the size composition. In Manta trawl samples, only 16.51% of plastic particles are less than 1 mm. However, this percentage was at least 40% in the pump sampling methods (Figure 3B).
Fibric plastics are mainly derived from clothing [25], and plastic groups with a wide range of usage may result from the breakdown of large-scale items [26]. The most common chemical composition of fibers is PET and cellophane, which made those two polymers the dominant polymers in plankton pump samples. PE (49.06%) was the most abundant in the Manta trawl samples collected by Manta trawls, followed by PP (34.91%), while in the plankton pump samples, the highest PE percentage was 7.14% in DPP surface water samples (Figure 3A,C). Most of those PE MPs in Manta trawl were white spherical plastics which were most likely from personal care products [27]. This also makes the majority of plastic particles in the Manta trawl samples white (59.43%). Our results collected by the Manta net were highly similar to other results applying Manta trawls [23,28], as well as results obtained using the Neuston net [29].
There are a couple of key factors that could affect the results collected by the Manta trawl and plankton pump. First, the sampling depth was different. The Manta trawl collects samples from the near-surface layer (0–16 cm), while the plankton pumps were deployed at 1 m depth due to the pump’s working limitation. This could result in the polymer composition difference because of their density differences [30]. The component with the highest abundance in plastic samples collected by Manta trawl was PE with a density of 0.91–0.96 g/cm3; While the component with the highest abundance in plastic samples collected by pumps was PET, density of which is 1.38 g/cm3. Second, the mesh size difference might also lead to plastic result differences. A previous study found that fibers collected using an 80 µm mesh size net were up to five orders of magnitude higher than those using a 450 µm mesh size net [31]. Dris et al. (2015) reported that a plankton net with a 100 µm mesh size collected 100 times higher MPs compared with that using a 330 µm Manta net [32]. The mesh size impacts were also explored in this study, and the results are discussed in Section 3.5.
3.4. MPs Distribution in the Water Column
Taking advantage of the plankton pumps, we also explored the MPs distribution in the water profile (1–23) using SPP and DPP. The results were also compared (Table 1 and Figure 3). Studies have indicated that MPs decay exponentially with depth [33,34].
In total, the plastic particles in the samples collected by DPP and SPP were 32 and 19, respectively. The DPP has a bit higher MP abundance in all three layers compared to SPP (Table 1). However, the MP composition is pretty similar. The dominant polymer, shape, and color were PET, fiber, and black respectively, regardless of sampling water layers (surface, middle, or bottom) (Figure 3B). Teflon (Polytetrafluoroethylene), a relatively dense plastic (density: 2.2 g/cm3) with excellent thermostability, high chemical stability, and low water absorption, was collected in the sample collected by shallow-water plankton pumps at a depth of 13 m, proving the sampling efficiency of plankton pumps.
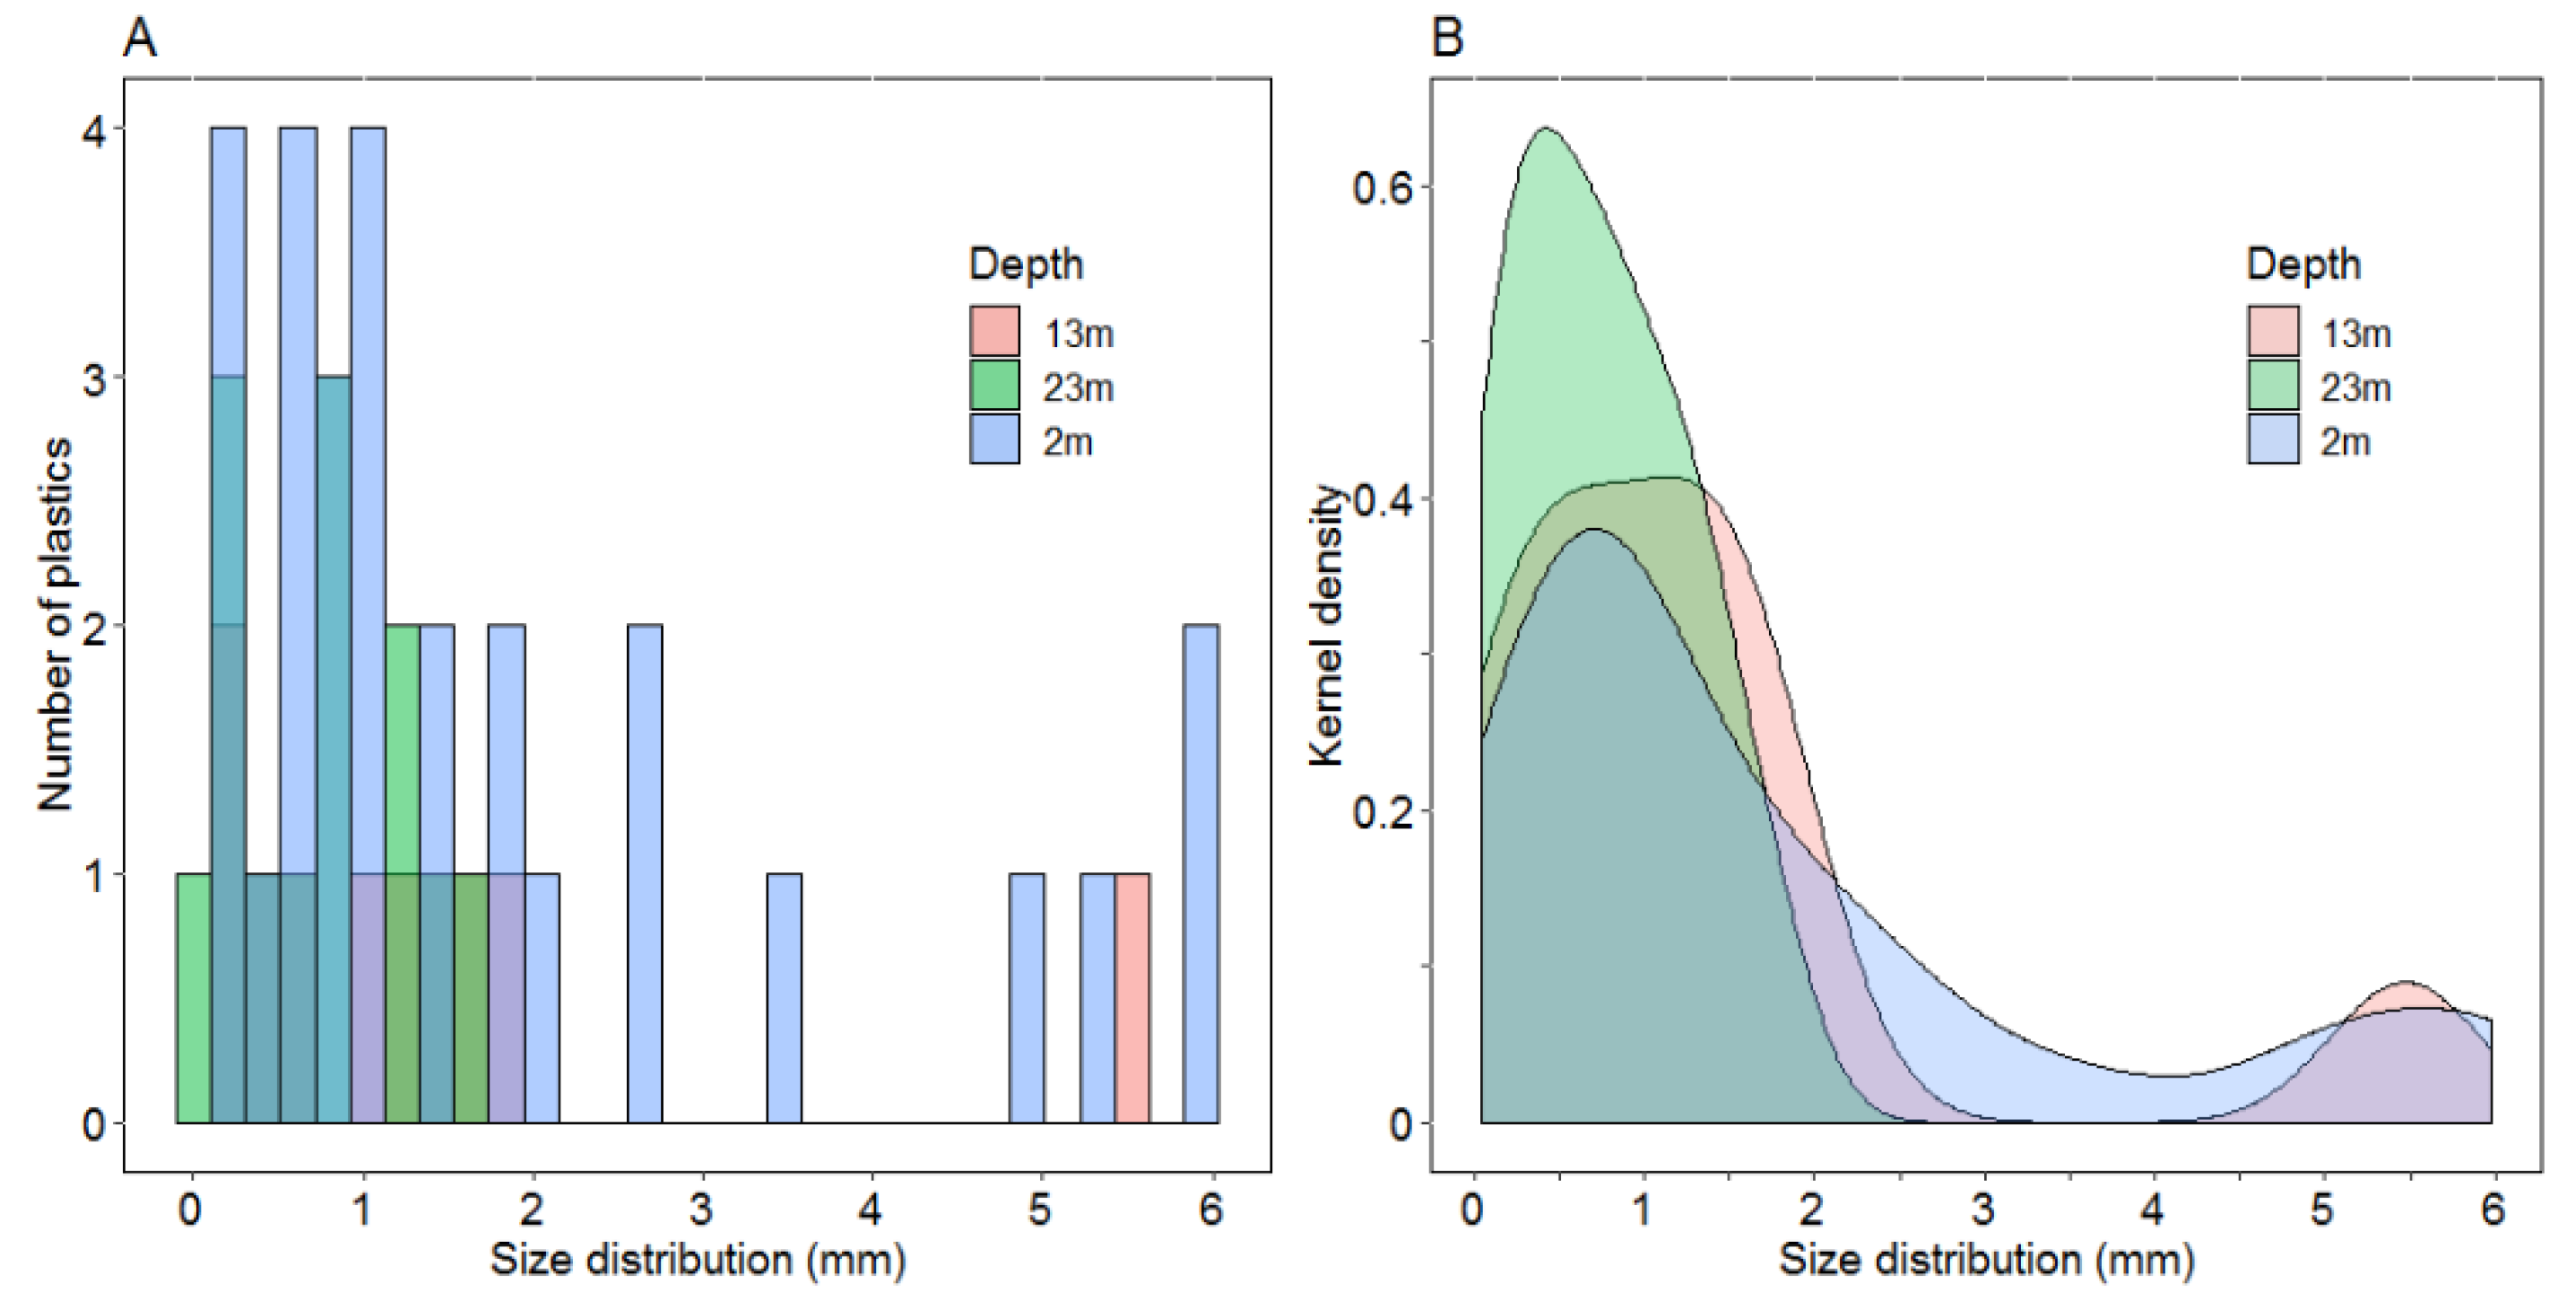
The results showed that the number of plastics in the surface layer was relatively high, accounting for 54.90%, followed by bottom-layer plastics (25.49%) and middle-layer plastics (19.61%), which indicated that nearly half of the plastic was suspended in the water below the surface layer. The suspension of MPs in the water column is caused by the impact of polymer density, wind, and marine organisms on the vertical distribution of plastics [33]. Our results also indicated that surface sampling could not sufficiently measure the abundance of plastic waste in marine environments, and the assessment of the fate of MPs should include measurements of vertical distributions of water columns [34]. The average salinity of the surface layer (1 m), middle layer (13 m), and bottom layer (23 m) was 30.32, 33.38, and 33.57, respectively. Salinities presented a gradually increasing trend with increasing depth. Hence, the medium and bottom layers had a higher density than the surface. This could have some impacts on the MPs’ distribution, but the extent needs further exploration.
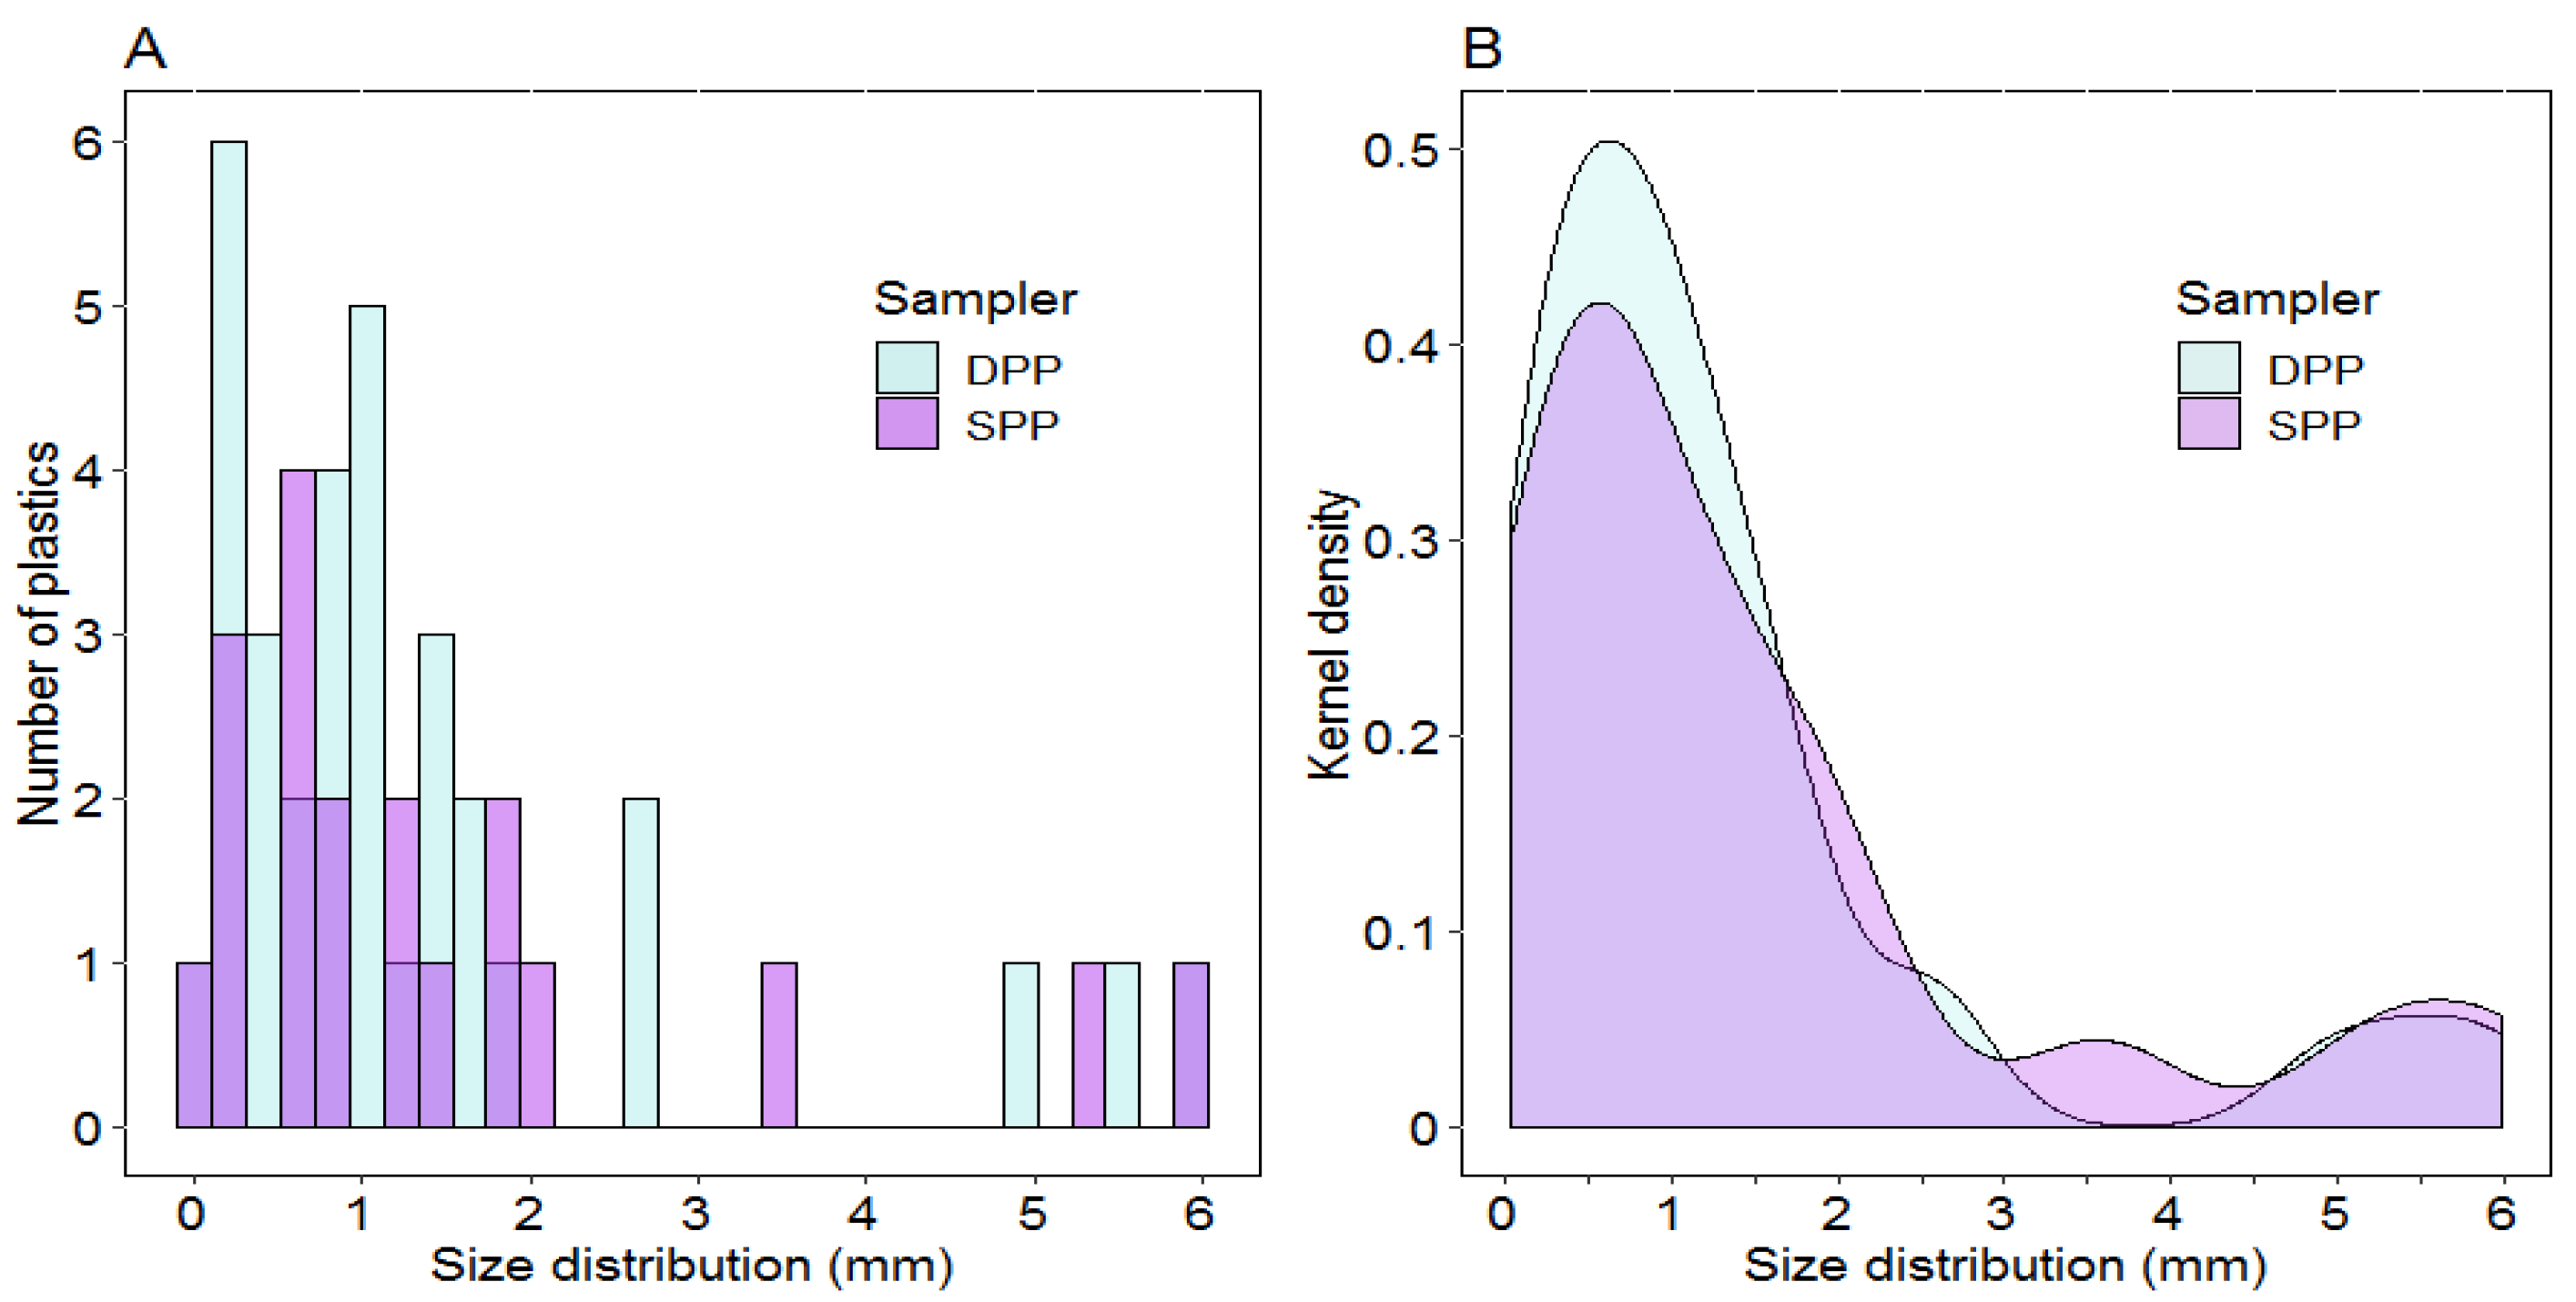
We compared the size distribution of the MPs samples collected by SPP and DPP (Figure 4 and Figure 5). Overall, the MP samples collected by the deep-water and shallow-water plankton pumps shared the same size distribution (Figure 4). At each water layer, most of the MPs were at a smaller size, especially for the samples collected at the bottom layer. But the size distributions of the surface layer and the middle layer had strong similarities (Figure 5).
3.5. Impacts of Mesh Size and Floating Debris Hotspot on Microplastics Collection
A mass of debris floated across the sampling area when the submersible pump was deployed at the sea surface (Figure 1C), which is a hotspot of MP pollution. We evaluated the impacts of this “float debris hotspot” on MP pollution. Meanwhile, we also compared the data obtained using 330 µm and 50 µm pore size filtering meshes. These two mesh sizes have been widely used in the literature [5].
The MPs abundances collected by the submersible pumps were two orders of magnitude higher than the results obtained by the Manta trawl and plankton pumps (Table 1), indicating the significant impacts of the “float debris hotspot” on the MP distribution. Even though the MPs’ abundance is much higher, the MPs’ composition of the submersible pump is pretty similar to the results collected by plankton pumps at surface water (Figure 3). This indicates that the physical convergent process can accumulate the MPs but does not necessarily change their properties.
Another potential reason that resulted in the high MPs’ abundance in submersible pump samples is the small water volume sampled. A large sampling volume will reduce the randomness of sampling. Liu et al. (2019) found the MPs’ abundance will decrease exponentially with the sampling volume increase [14]. In our study, only 100 L water was filtered using a submersible pump, while in the plankton pump and Manta trawl sampling, the sampling volume varied from 3 m3 to 91.85 m3.
In the field, 50 µm meshes had a significantly higher retention effect than 330 µm meshes. With the same amount of water (100 L) and triplicate sampling, 137 MPs were identified in 50 µm meshes filtered samples, while 107 MPs were filtered out by 330 µm meshes. The final MPs’ abundance also showed that 50 µm mesh samples have a higher abundance with a much smaller standard deviation than 330 µm mesh samples (Table 1).
MPs collected from meshes with two different pore sizes shared similar properties. As shown in Figure 3, PET and fiber were the most abundant polymer and shapes in samples collected by 50 µm and 330 µm meshes, similar to the sample collected by the plankton pump. 50 µm mesh intended to retain much more fibers compared to the 330 µm mesh. 94% of the MPs in the 50 µm mesh samples were fibers compared to 71% in the 330 µm mesh samples. For the 330 µm mesh, the content of fragmental MPs was significantly higher than the 50 µm mesh sample (3.79%), reaching a total of 21.59%. The lower proportion of fibrous MPs (71.03%) was likely due to the difference in mesh pore size, as some fibrous MPs escaped from the large mesh aperture. Studies have shown that fibrous MP had the highest proportion in pump samples from coastal waters, lakes, and estuaries [11,12]. Red and black were the dominant color in both samples (Figure 3D).
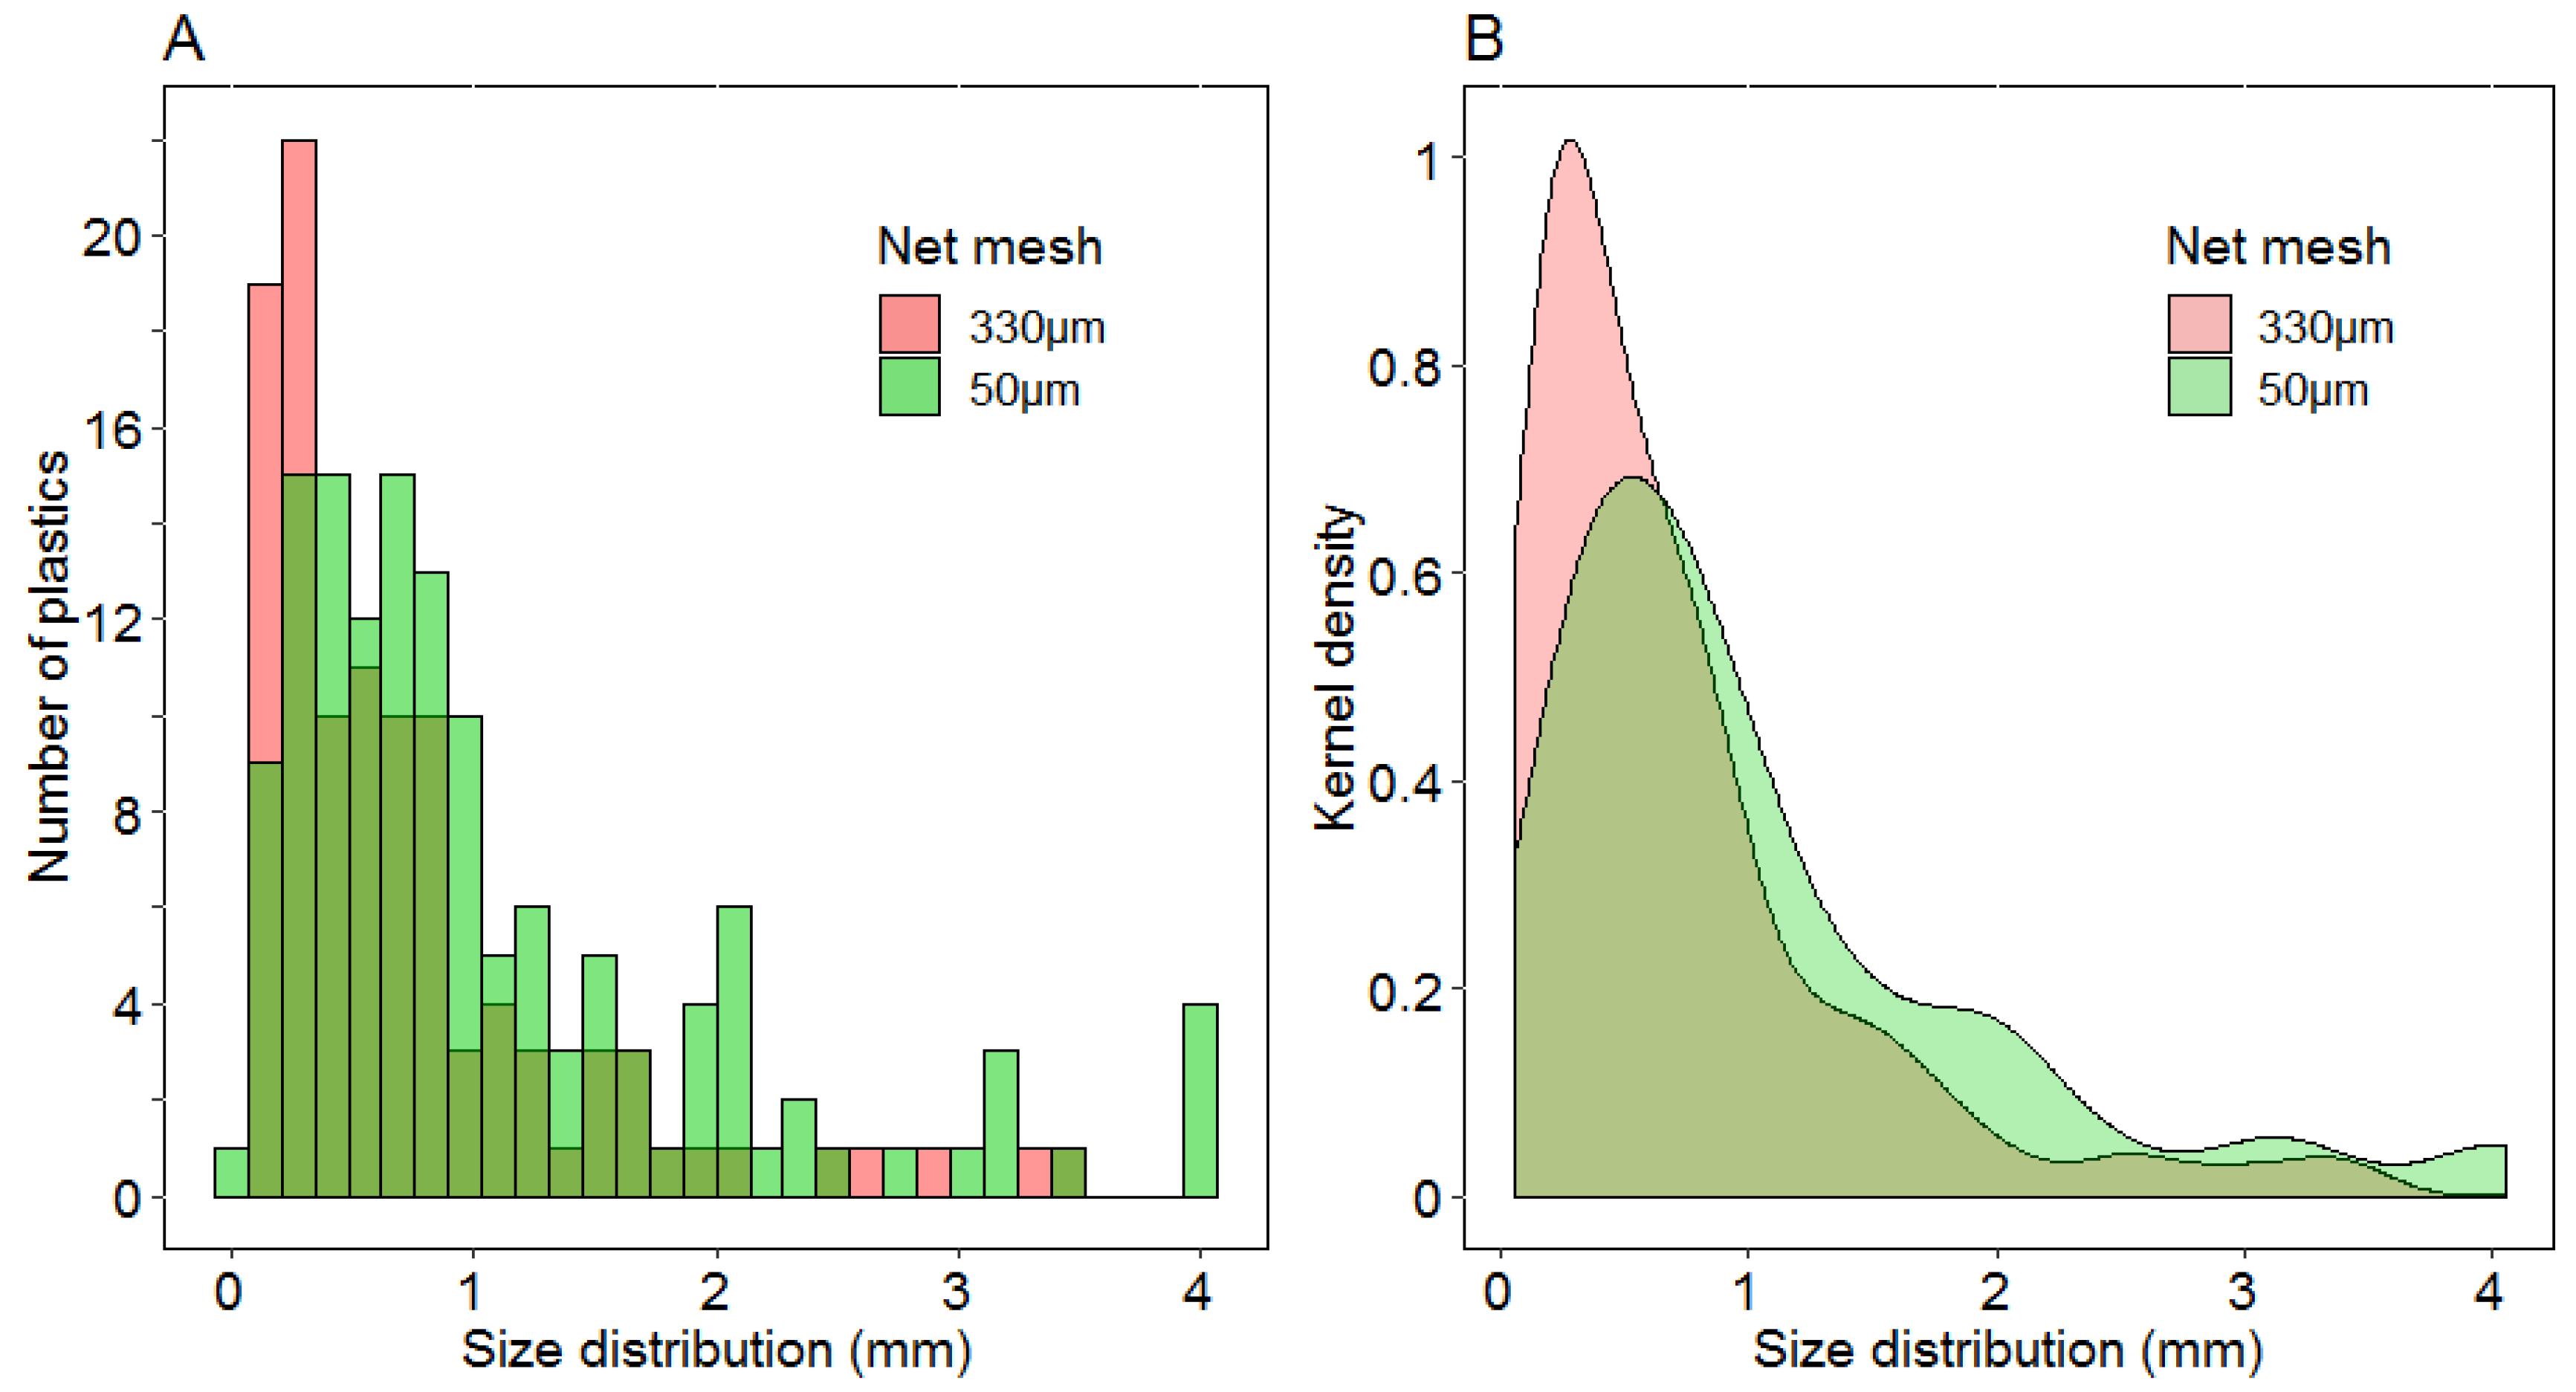
Figure 6 further demonstrates the size distribution of MP samples collected by 50 µm and 330 µm meshes. The two mesh sizes showed similar size patterns. However, we did not see 50 µm meshes retaining significantly more small-sized MPs, as reported by other studies [32]. This might be the impact of the “float debris hotspot” or the lack of small-size MPs in the sampling region. Our results further indicate the complexity of MPs’ surveys in the natural environment.
4. Conclusions
The standardization of monitoring methods and the compilation of data across studies remain major obstacles in the study of MPs. There is still limited in situ data comparison of different MPs’ sampling methods in an aquatic environment, especially comparisons among plankton pumps and Manta nets. This study deployed various aquatic MP sampling methods in typical coastal water under varying sea conditions. Results showed that while the Manta trawl and plankton pumps yielded similar MPs abundance, the characteristics of the MPs were distinct, with plankton pumps retaining a higher percentage of plastic fibers and smaller particles. The study also found that while surface water had higher MPs concentration, a significant number of MPs were present in the water column and should not be overlooked in evaluating plastic pollution. MPs’ abundance was two orders of magnitude higher when sampling was conducted in the “floating debris hotspots”, indicating the significant impacts of the uneven distribution of MPs in the surface water. Additionally, the study found a higher abundance of MPs in smaller mesh-size samples but with no significant difference in the percentage of smaller MPs.
This study provides a comprehensive analysis and comparison of various MPs’ sampling methods and may aid in promoting harmonization and data-compiling processes, but it also highlights the complexity and challenges of these efforts.
Author Contributions
Conceptualization, L.Z. and D.L.; Methodology, X.W. and L.Z.; Software, H.S. and X.W.; Formal analysis, H.S. and X.W.; Investigation, X.W. and L.Z.; Data curation, H.S., X.W. and L.Z.; Writing—original draft, H.S. and X.W.; Writing—review & editing, L.Z. and D.L.; Visualization, X.W. and L.Z.; Supervision, L.Z. and D.L.; Project administration, D.L. All authors have read and agreed to the published version of the manuscript.
Funding
This study was financially supported by grants from the Shanghai Science and Technology Committee (22dz1202800), China National Science Foundation (42271085, 42206154), China Postdoctoral Science Foundation (2021M691022), and the National Key Research and Development Program (2016YFC1402205). We also would like to thank the editor and four anonymous reviewers for their useful comments on the manuscript.
Data Availability Statement
The data presented in this study are available on request from the corresponding author.
Conflicts of Interest
The authors declare that they have no known competing financial interests or personal relationships that could have appeared to influence the work reported in this paper.
References
- PlasticsEurope. Plastics-the-Facts-2021. 2021. Available online: https://plasticseurope.org/knowledge-hub/plastics-the-facts-2021/ (accessed on 5 May 2022).
- Zhu, L.; Zhao, S.; Bittar, T.B.; Stubbins, A.; Li, D. Photochemical dissolution of buoyant microplastics to dissolved organic carbon: Rates and microbial impacts. J. Hazard. Mater. 2020, 383, 121065. [Google Scholar] [CrossRef] [PubMed]
- Law, K.L. Plastics in the Marine Environment. Annu. Rev. Mar. Sci. 2017, 9, 205–229. [Google Scholar] [CrossRef] [Green Version]
- GESAMP. Guidelines for the Monitoring and Assessment of Plastic Litter in the Ocean; Kershaw, P.J., Turra, A., Galgani, F., Eds.; GESAMP Joint Group of Experts on the Scientific Aspects of Marine Environmental Protection: London, UK, 2019. [Google Scholar]
- Bai, M.; Lin, Y.; Hurley, R.R.; Zhu, L.; Li, D. Controlling Factors of Microplastic Riverine Flux and Implications for Reliable Monitoring Strategy. Environ. Sci. Technol. 2022, 56, 48–61. [Google Scholar] [CrossRef] [PubMed]
- Moore, C.J.; Moore, S.L.; Leecaster, M.K.; Weisberg, S.B. A comparison of plastic and plankton in the north Pacific central gyre. Mar. Pollut. Bull. 2001, 42, 1297–1300. [Google Scholar] [CrossRef]
- Isobe, A.; Uchida, K.; Tokai, T.; Iwasaki, S. East Asian seas: A hot spot of pelagic microplastics. Mar. Pollut. Bull. 2015, 101, 618–623. [Google Scholar] [CrossRef]
- Day, R.H.; Shaw, D.G. Patterns in the abundance of pelagic plastic and tar in the north pacific ocean, 1976–1985. Mar. Pollut. Bull. 1987, 18, 311–316. [Google Scholar] [CrossRef]
- Anastasopoulou, A.; Mytilineou, C.; Smith, C.J.; Papadopoulou, K.N. Plastic debris ingested by deep-water fish of the Ionian Sea (Eastern Mediterranean). Deep. Sea Res. Part I Oceanogr. Res. Pap. 2013, 74, 11–13. [Google Scholar] [CrossRef]
- Christopher, K.P.; Eva, R.L.; Claudia, H.S.A.; Teresa, A.; Melanie, B.; Miquel, C.; Joan, B.C.; Jaime, D.; Gerard, D.; François, G.; et al. Marine litter distribution and density in European seas, from the shelves to deep basins. PLoS ONE 2014, 9, e95839. [Google Scholar]
- Xu, P.; Peng, G.; Su, L.; Gao, Y.; Gao, L.; Li, D. Microplastic risk assessment in surface waters: A case study in the Changjiang Estuary, China. Mar. Pollut. Bull. 2018, 133, 647–654. [Google Scholar] [CrossRef]
- Zhao, S.; Wang, T.; Zhu, L.; Xu, P.; Wang, X.; Gao, L.; Li, D. Analysis of suspended microplastics in the Changjiang Estuary: Implications for riverine plastic load to the ocean. Water Res. 2019, 161, 560–569. [Google Scholar] [CrossRef]
- Li, D.; Liu, K.; Li, C.; Peng, G.; Andrady, A.L.; Wu, T.; Zhang, Z.; Wang, X.; Song, Z.; Zong, C.; et al. Profiling the Vertical Transport of Microplastics in the West Pacific Ocean and the East Indian Ocean with a Novel in Situ Filtration Technique. Environ. Sci. Technol. 2020, 54, 12979–12988. [Google Scholar] [CrossRef]
- Liu, K.; Zhang, F.; Song, Z.; Zong, C.; Wei, N.; Li, D. A novel method enabling the accurate quantification of microplastics in the water column of deep ocean. Mar. Pollut. Bull. 2019, 146, 462–465. [Google Scholar] [CrossRef]
- Wang, T.; Zhao, S.; Zhu, L.; McWilliams, J.C.; Galgani, L.; Amin, R.M.; Nakajima, R.; Jiang, W.; Chen, M. Accumulation, transformation and transport of microplastics in estuarine fronts. Nat. Rev. Earth Environ. 2022, 3, 795–805. [Google Scholar] [CrossRef]
- Lebreton, L.C.M.; Van, D.Z.J.; Damsteeg, J.; Slat, B.; Andrady, A.; Reisser, J. River plastic emissions to the world′s oceans. Nat. Commun. 2017, 8, 15611. [Google Scholar] [CrossRef] [PubMed] [Green Version]
- Li, C.; Wang, X.; Liu, K.; Zhu, L.; Wei, N.; Zong, C.; Li, D. Pelagic microplastics in surface water of the Eastern Indian Ocean during monsoon transition period: Abundance, distribution, and characteristics. Sci. Total Environ. 2021, 755, 142629. [Google Scholar] [CrossRef] [PubMed]
- Rech, S.; Macaya, C.V.; Pantoja, J.F.; Rivadeneira, M.M.; Jofre, M.D.; Thiel, M. Rivers as a source of marine litter—A study from the SE Pacific. Mar. Pollut. Bull. 2014, 82, 66–75. [Google Scholar] [CrossRef] [PubMed]
- Gasperi, J.; Dris, R.; Bonin, T.; Rocher, V.; Tassin, B. Assessment of floating plastic debris in surface water along the Seine River. Environ. Pollut. 2014, 195, 163–166. [Google Scholar] [CrossRef] [Green Version]
- Zhao, S.; Zhu, L.; Li, D. Microplastic in three urban estuaries, China. Environ. Pollut. 2015, 206, 597–604. [Google Scholar] [CrossRef]
- Liu, K.; Wu, T.; Wang, X.; Song, Z.; Zong, C.; Wei, N.; Li, D. Consistent Transport of Terrestrial Microplastics to the Ocean through Atmosphere. Environ. Sci. Technol. 2019, 53, 10612–10619. [Google Scholar] [CrossRef]
- Bai, M.; Zhu, L.; An, L.; Peng, G.; Li, D. Estimation and prediction of plastic waste annual input into the sea from China. Acta Oceanol. Sin. 2018, 37, 26–39. [Google Scholar] [CrossRef]
- Zhang, W.; Zhang, S.; Wang, J.; Wang, Y.; Mu, J.; Wang, P.; Lin, X.; Ma, D. Microplastic pollution in the surface waters of the Bohai Sea, China. Environ. Pollut. 2017, 231, 541–548. [Google Scholar] [CrossRef]
- Dris, R.; Imhof, H.; Sanchez, W.; Gasperi, J.; Galgani, F.O.; Tassin, B.; Laforsch, C. Beyond the ocean: Contamination of freshwater ecosystems with (micro-)plastic particles. Environ. Chem. 2015, 12, 539. [Google Scholar] [CrossRef]
- Dris, R.; Gasperi, J.; Saad, M.; Mirande, C.; Tassin, B. Synthetic fibers in atmospheric fallout: A source of microplastics in the environment? Mar. Pollut. Bull. 2016, 104, 290–293. [Google Scholar] [CrossRef]
- Thompson, R.C.; Olsen, Y.; Mitchell, R.P.; Davis, A.; Rowland, S.J.; John, A.W.; McGonigle, D.; Russell, A.E. Lost at sea: Where is all the plastic? Science 2004, 304, 838. [Google Scholar] [CrossRef] [PubMed]
- Fendall, L.S.; Sewell, M.A. Contributing to marine pollution by washing your face: Microplastics in facial cleansers. Mar. Pollut. Bull. 2009, 58, 1225–1228. [Google Scholar] [CrossRef]
- Pan, Z.; Guo, H.; Chen, H.; Wang, S.; Sun, X.; Zou, Q.; Zhang, Y.; Lin, H.; Cai, S.; Huang, J. Microplastics in the Northwestern Pacific: Abundance, distribution, and characteristics. Sci. Total Environ. 2019, 650, 1913–1922. [Google Scholar] [CrossRef]
- Isobe, A.; Kubo, K.; Tamura, Y.; Kako, S.I.; Nakashima, E.; Fujii, N. Selective transport of microplastics and mesoplastics by drifting in coastal waters. Mar. Pollut. Bull. 2014, 89, 324–330. [Google Scholar] [CrossRef] [PubMed]
- Lusher, A.L.; Hernandezmilian, G.; O’Brien, J.; Berrow, S.; O′Connor, I.; Officer, R. Microplastic and macroplastic ingestion by a deep diving, oceanic cetacean: The True’s beaked whale Mesoplodon mirus. Environ. Pollut. 2015, 199, 185. [Google Scholar] [CrossRef]
- Norén, F. Small Plastic Particles in Coastal Swedish Waters; KIMO Report; KIMO: Esbjerg, Denmark, 2007; pp. 1–11. [Google Scholar]
- Dris, R.; Gasperi, J.; Rocher, V.; Saad, M.; Renault, N.; Tassin, B. Microplastic contamination in an urban area: A case study in Greater Paris. Environ. Chem. 2015, 12, 592. [Google Scholar] [CrossRef]
- Kukulka, T.; Proskurowski, G.; Morét, F.S.; Meyer, D.W.; Law, K.L. The effect of wind mixing on the vertical distribution of buoyant plastic debris, Geophys. Res. Lett. 2012, 39, 7. [Google Scholar] [CrossRef] [Green Version]
- Reisser, J.; Slat, B.; Noble, K.; du Plessis, K.; Epp, M.; Proietti, M.; de Sonneville, J.; Becker, T.; Pattiaratchi, C. The vertical distribution of buoyant plastics at sea: An observational study in the North Atlantic Gyre. Biogeosciences 2015, 12, 1249–1256. [Google Scholar] [CrossRef] [Green Version]
Figure 1.
Sampling site in the East China Sea ((A), 122°35′46″ E, 29°56′16″ N) and the sea surface conditions when the sampling was conducted. (B) Clear sea surface when Manta trawl, shallow-water plankton pump (SPP), and deep-water plankton pump (DPP) were deployed; (C) A mass of debris floated over when the submersible pump was deployed using 50 µm and 300 µm mesh. Photos of the sampling devices here were taken in other sampling campaigns and used here just for illustration.

Figure 2.
FTIR spectrum of some typical plastic particles collected in this study.

Figure 3.
The percentage distribution of chemical composition (A), size (B), shape (C), and color (D) of plastic and microplastic samples collected by 4 sampling methods. SPP represented shallow-water plankton pump; DPP represented deep-water plankton pump (DPP).
Figure 3.
The percentage distribution of chemical composition (A), size (B), shape (C), and color (D) of plastic and microplastic samples collected by 4 sampling methods. SPP represented shallow-water plankton pump; DPP represented deep-water plankton pump (DPP).

Figure 4.
Size distribution (A) and kernel density (B) for plastic samples collected by deep-water and shallow-water plankton pumps. SPP represented shallow-water plankton pump; DPP represented deep-water plankton pump (DPP).
Figure 4.
Size distribution (A) and kernel density (B) for plastic samples collected by deep-water and shallow-water plankton pumps. SPP represented shallow-water plankton pump; DPP represented deep-water plankton pump (DPP).

Figure 5.
Size distribution (A) and kernel density (B) for plastic samples in different water depths.
Figure 5.
Size distribution (A) and kernel density (B) for plastic samples in different water depths.

Figure 6.
Size distribution (A) and kernel density (B) for plastic samples collected by 50 µm and 330 µm pore size meshes.
Figure 6.
Size distribution (A) and kernel density (B) for plastic samples collected by 50 µm and 330 µm pore size meshes.


Table 1.
Abundance of plastic samples collected by the 4 sampling methods. SPP represented shallow-water plankton pump; DPP represented deep-water plankton pump (DPP).
Table 1.
Abundance of plastic samples collected by the 4 sampling methods. SPP represented shallow-water plankton pump; DPP represented deep-water plankton pump (DPP).
| Sampling Method | Depth (m) | Mesh Size (µm) | Filtered Volume (m3) | Abundance (n/m3) | Fiber (%) |
|---|---|---|---|---|---|
| Manta trawl | 0.16 | 330 | 91.85 | 2.31 | 14.2 |
| SPP (Surface) | 1 | 150 | 5 | 2.00 | 70.0 |
| SPP (Medium) | 13 | 150 | 5 | 1.00 | 20.0 |
| SPP (Bottom) | 23 | 150 | 5 | 0.80 | 25.0 |
| DPP (Surface) | 1 | 150 | 3 | 6.00 | 72.2 |
| DPP (Medium) | 13 | 150 | 3 | 1.67 | 66.7 |
| DPP (Bottom) | 23 | 150 | 3 | 3.00 | 94.9 |
| Submersible Pump | 1 | 330 | 0.1 | 357 ± 119 a | 71.0 |
| Submersible Pump | 1 | 50 | 0.1 | 553 ± 19 a | 94.9 |
Note: a Triplicate sampling, the results were presented as average ± standard deviation (n = 3).
Disclaimer/Publisher’s Note: The statements, opinions and data contained in all publications are solely those of the individual author(s) and contributor(s) and not of MDPI and/or the editor(s). MDPI and/or the editor(s) disclaim responsibility for any injury to people or property resulting from any ideas, methods, instructions or products referred to in the content. |
© 2023 by the authors. Licensee MDPI, Basel, Switzerland. This article is an open access article distributed under the terms and conditions of the Creative Commons Attribution (CC BY) license (https://creativecommons.org/licenses/by/4.0/).
Share and Cite
MDPI and ACS Style
Shi, H.; Wang, X.; Zhu, L.; Li, D. Comprehensive Comparison of Various Microplastic Sampling Methods in Sea Water: Implications for Data Compilation. Water 2023, 15, 1035. https://doi.org/10.3390/w15061035
AMA Style
Shi H, Wang X, Zhu L, Li D. Comprehensive Comparison of Various Microplastic Sampling Methods in Sea Water: Implications for Data Compilation. Water. 2023; 15(6):1035. https://doi.org/10.3390/w15061035
Chicago/Turabian StyleShi, Haochen, Xiaohui Wang, Lixin Zhu, and Daoji Li. 2023. "Comprehensive Comparison of Various Microplastic Sampling Methods in Sea Water: Implications for Data Compilation" Water 15, no. 6: 1035. https://doi.org/10.3390/w15061035
Note that from the first issue of 2016, this journal uses article numbers instead of page numbers. See further details here.