
Interannual Variation of Ichthyoplankton Community Structure in the Yellow River Estuary, China
Shandong Provincial Key Laboratory of Restoration for Marine Ecology, Shandong Marine Resource and Environment Research Institute, Yantai 264006, China
*
Authors to whom correspondence should be addressed.
Water 2023, 15(6), 1040; https://doi.org/10.3390/w15061040
Submission received: 30 January 2023
/
Revised: 2 March 2023
/
Accepted: 7 March 2023
/
Published: 9 March 2023
(This article belongs to the Special Issue Aquatic Species Interactions under Global Environmental Changes)
Abstract
:To understand the community structure dynamics of fish eggs and larvae in the Yellow River estuary, four trawl surveys were annually conducted between 2011 and 2014, including at 13 stations in 2011 and 18 stations between 2012 and 2014. A total of 2540 eggs and 143 larvae were collected during the four surveys, comprising 25 species, 8 orders, 16 families, and 20 genera. During the survey period, species numbers of eggs first decreased and then increased, while abundances first increased and then decreased. Larval species numbers exhibited the same trends as for eggs, while larval abundances fluctuated across the four years of the study. The primary species represented by the eggs were Konosirus punctatus, Sillago sihama, and Cynoglossus joyeri, while the larval species primarily comprised Amblychaeturichthys hexanema, Chaeturichthys stigmatias, and Engraulis japonicus. Cluster analysis of species compositions for eggs and larvae revealed the presence of four groups, wherein groups 1–3 comprised communities from 12, 3, and 2 stations, respectively, that were primarily distributed in the eastern part of the estuary. In contrast, group four only comprised communities from one station at the western part of the estuary near Bohai Bay. All biodiversity indices were lowest in 2012 and biodiversity of fish egg and larval communities were most correlated with the water depth among the parameters that were measured. Overall, interannual variation in the distribution and diversity of fish egg and larval communities in the Yellow River estuary reflected the responses of fish to environmental variability.
1. Introduction
Estuaries are unique ecosystems and important settings that connect land and ocean ecosystems as necessary routes for runoff to enter the sea, while also serving important roles in human survival and societal development [1]. Estuaries are the most productive ecosystem on the earth, an important source of nutrients for marine organisms, and also one of the most sensitive and important biological habitats. Many important marine economic species have completed part or all of their life histories here, especially as an important foraging, breeding, and habitat locations for many fish [2,3]. Indeed, estuaries have been considered nutrient “producers”, illustrating the high fertility and productivity of their ecosystem. Concomitantly, estuaries are also areas that are acutely responsive to human activities and environmental changes [4]. In recent decades, increased human activities and the development of various water projects have led to significant changes in the environmental conditions of global estuarine ecosystems, leading to increased research attention [5,6]. Fish eggs and larvae represent important populations in estuarine ecosystems and are important for the survival of fish populations, resource replenishment, and ecological balance. Moreover, their survival and standing stock sizes play critical roles in determining the sizes of fish resource replenishment [7,8]. Understanding egg and larval dynamics in estuaries is fundamental for understanding early fish development, fish population dynamics, and trophic dynamics [9,10]. During the important period of fish breeding in summer, it is of great theoretical and practical significance to carry out the research on the annual changes of the structure of fish eggs and larvae for a more comprehensive understanding of the structure and function of the estuarine ecosystem, a timely grasp of the impact of human activities on estuarine resources, and the search for protection strategies.
The Yellow River is the sandiest river in the world, the fifth longest river in the world, and the second longest river in China. It also features highly dynamic inter-annual and intra-annual variation in runoff characteristics [11,12]. The Yellow River estuary is located at the confluence of the Laizhou and Bohai Bays, located at the northern edge of the warm temperate zone, and is an important estuary of China [13]. The rich nutrient waters carried by runoff from the Yellow River into the sea lead to high primary productivity and attract biodiversity in the Yellow River estuary. The area is consequently a spawning, nursery, and feeding ground for various fish species. It is also a passage for a variety of anadromous and descending migratory fish species, representing a highly important region for fish population reproduction [14,15]. However, the ecology of the sea near the mouth of the Yellow River has been greatly altered by both natural factors and human activities [16,17]. For example, the flow of runoff and sand transport of the Yellow River into the sea have significantly decreased in recent years, resulting in changes of the Yellow River Delta shoreline that have altered the circulation of the adjacent sea and, thereby, affected fishery resources. Moreover, increased human activities near the Yellow River estuary, including large-scale reclamation of mudflats, construction of sea enclosures, coastal engineering, and construction of offshore oil extraction platforms have also brought serious negative impacts on the environment of the estuary and its adjacent seas [11,12]. The bioecology of eggs and larvae in the Yellow River estuary have been investigated since the 1980s. However, since few research stations are present in the Yellow River estuary, historical reference information is limited [18,19,20]. Several recent studies have attempted to quantify the species composition and quantitative distribution of eggs and larvae in the Yellow River estuary waters [13], although gaps regarding interannual changes of the community structures of eggs and larvae in the Yellow River estuary waters remain.
By analyzing the species composition, distribution, and diversity of fish eggs and larvae in the Yellow River estuary, the annual changes of the community structure of fish eggs and larvae in the sea area are discussed, which can accumulate basic data for the study of the regeneration and supplement of fishery resources in the ecosystem of the Yellow River estuary.
2. Materials and Methods
2.1. Survey Area and Stations
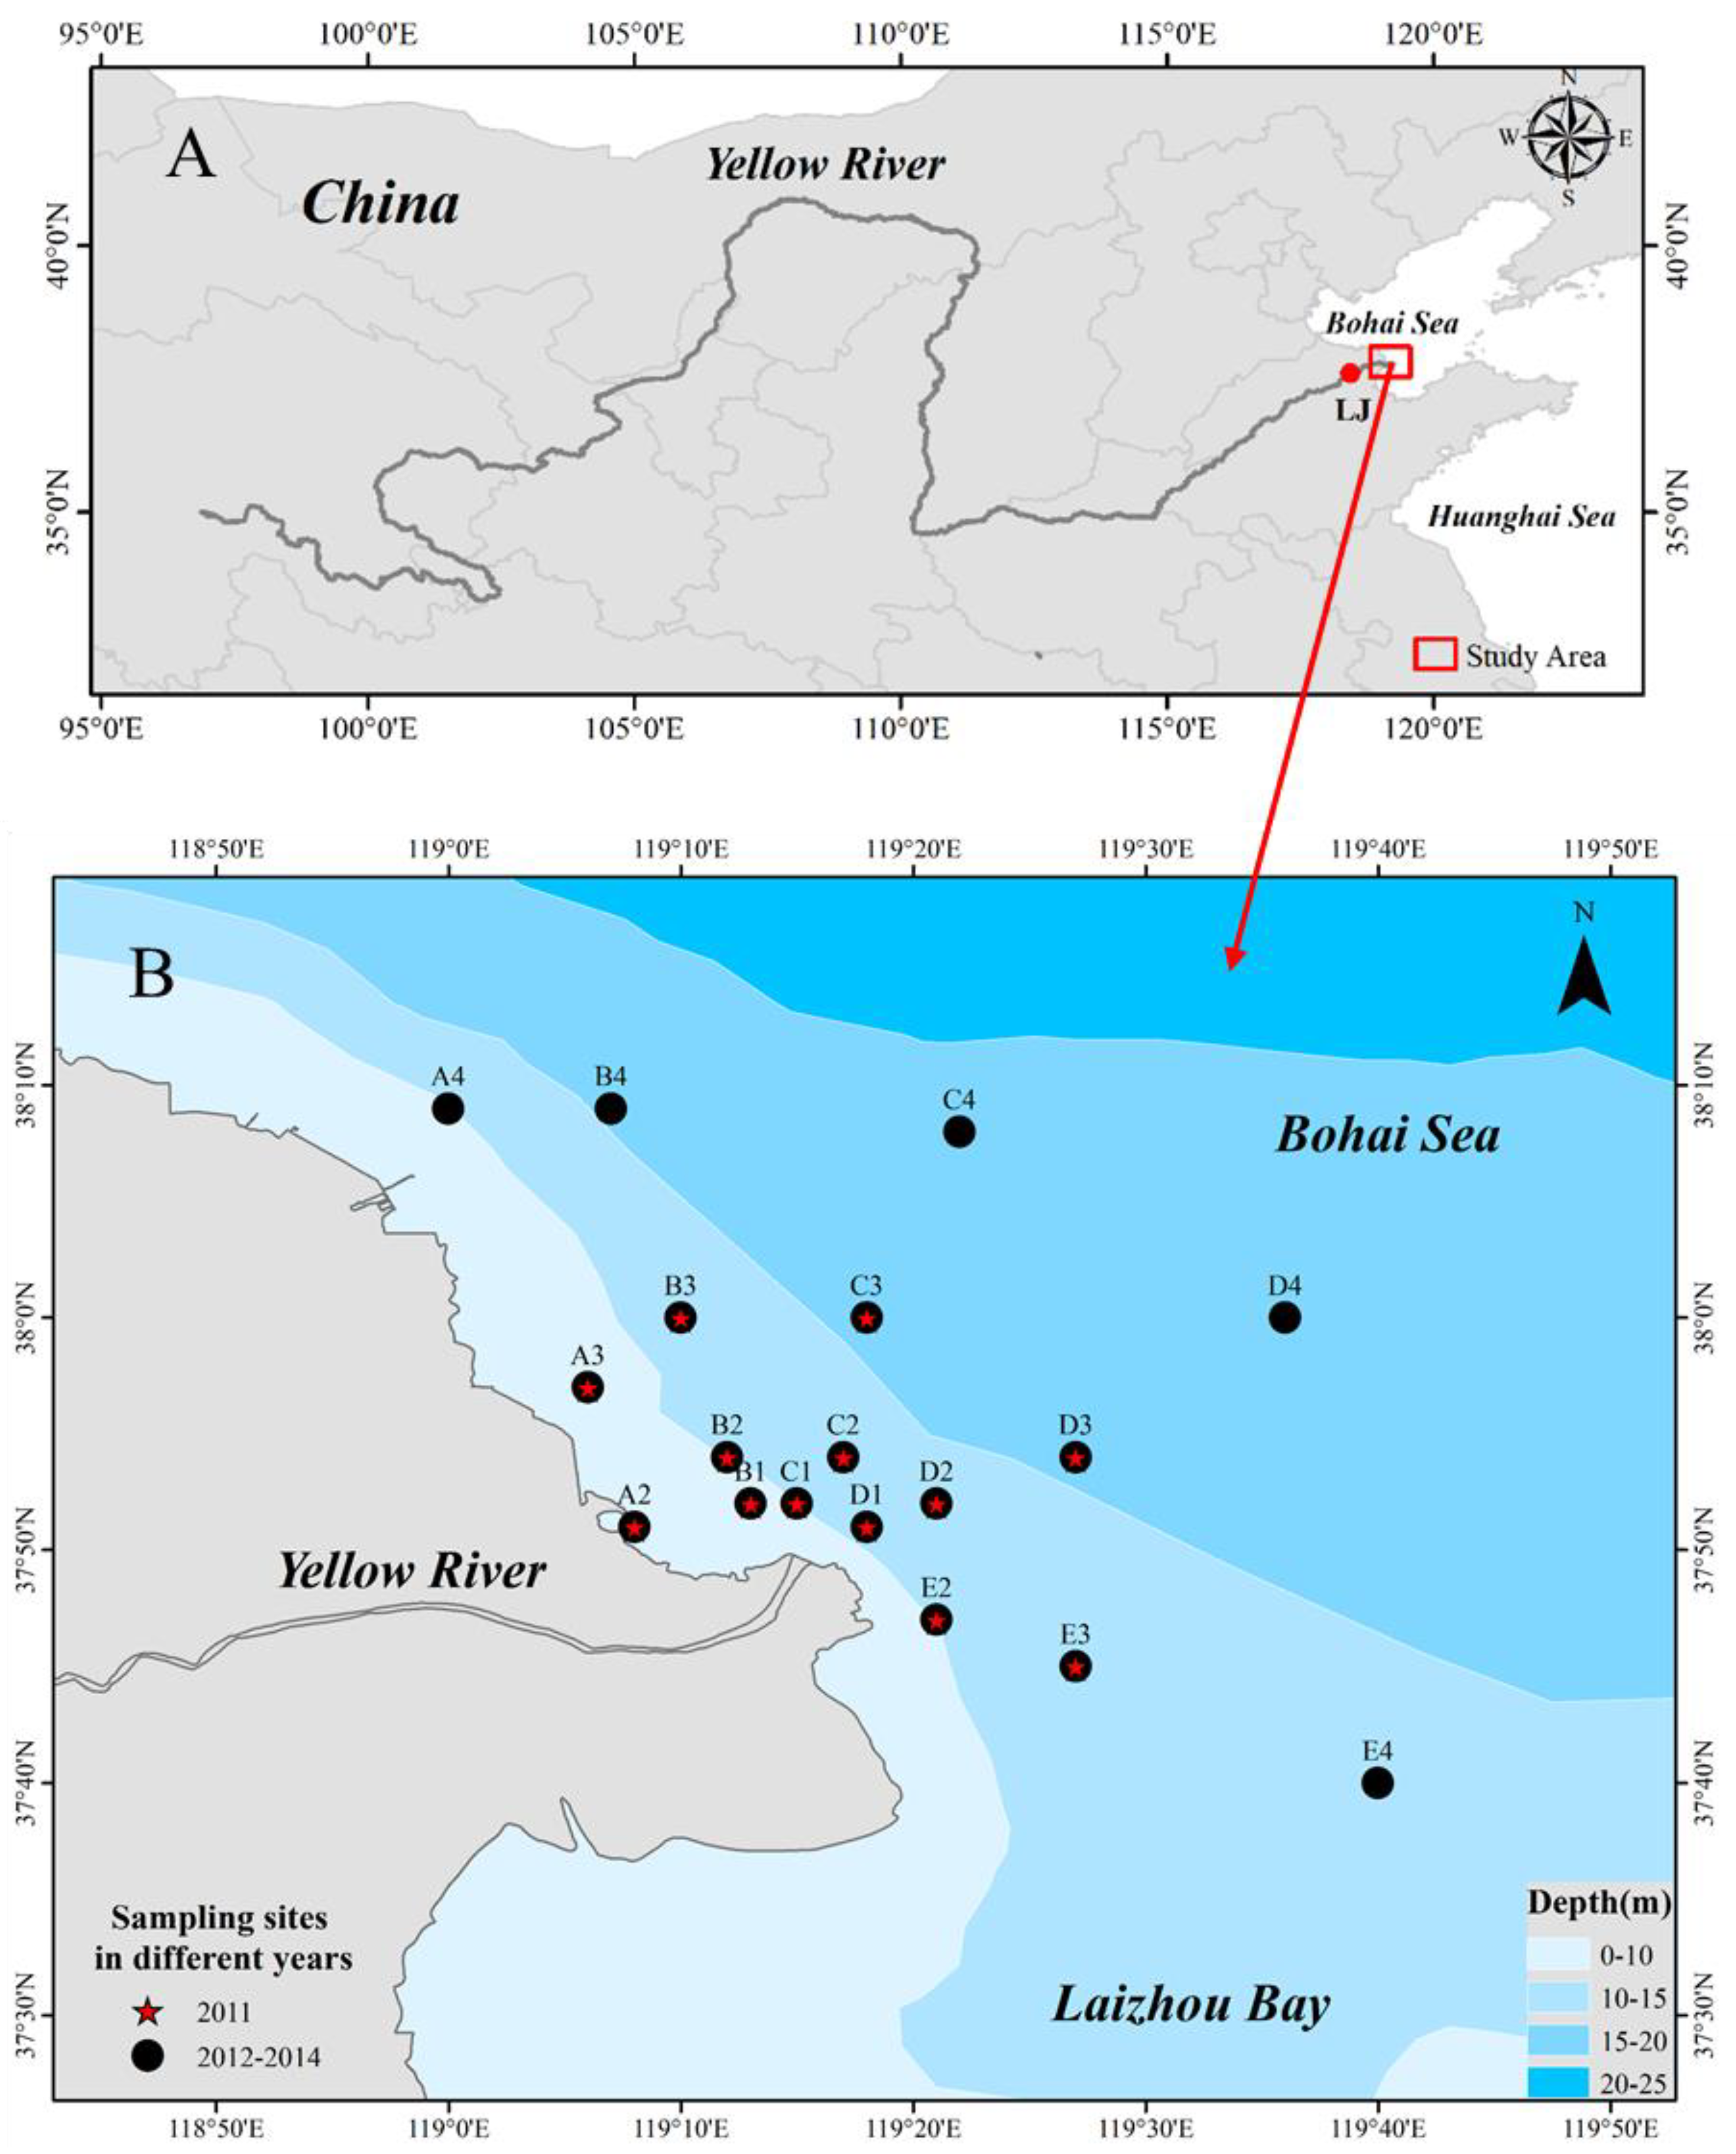
The survey area of this study was located between 37.60 and 38.87° N and between 119.11 and 119.67° E, at a water depth of ≤20 m near the Yellow River estuary. Four surveys of ichthyoplankton were annually conducted in June of 2011–2014. Samples were carried out annually (once a year), all in the month of June from 2011 to 2014. A total of 13 samples were collected in 2011 and 18 samples were collected every year from 2012 to 2014. During the survey, stations based on distance from the Yellow River estuary were established, with section I (stations B1, C1, and D1) 5 km from the estuary, section II (stations A2, B2, C2, D2, and E2) 10 km from the entrance of the sea, section III (stations A3, B3, C3, D3, and E3) 20 km from the entrance of the sea, and section IV (stations A4, B4, C4, D4, and E4) 40 km from the entrance of the sea. A total of three cross-sections and 13 stations were used in the 2011 survey, while four cross-sections and 18 stations were established in the 2012–2014 survey (Figure 1).
2.2. Sample Collection, Processing, and Analysis
Fish egg and larval samples were collected using a large plankton net (80 cm diameter, 280 cm length, and 0.505 mm mesh size) and the samples were horizontally trawled from station to station for 10 min at a towing speed of 2 n miles/h. Samples were preserved in 5% formalin seawater solution and brought back to the laboratory. Species identification was then conducted based on the morphological characteristics of fish eggs and larvae using an anatomical microscope, as previously described [21,22]. Morphological metrics included the external morphology of fish eggs and larvae in addition to the individual morphologies of tissues, organs, and taxonomic characteristics for different developmental stages. Quantitative information was obtained from the horizontal net collection data, with the numbers of fish eggs and larvae per net (individuals) used as indicators to calculate fish egg and larval densities (inds./station).
The environmental factors of sea surface temperature (SST), sea surface salinity (SSS), depth (DEP), acidity (pH), dissolved oxygen (DO), and chlorophyll–a (Chl–a) were measured on site using an XR–420 CTD. Suspended particle matter (SPM) samples were collected and brought back to the laboratory for analysis.
2.3. Statistical Analyses
The Index of Relative Importance (IRI) [23] was used to indicate the dominance of species of each year and was calculated as follows:
where N% is the percentage of the number of a certain species in the total number of fish eggs or larvae collected and F% is the percentage of stations where a species occurs in relation to the total number of stations surveyed. Species with IRI values > 1000 are considered dominant species.
IRI = N% × F% × 104
Cluster analysis of community structure was conducted using the vegan and cluster packages for the R software suite (version 4.1.0). The number of fish eggs and larvae collected were analyzed and logarithm transformations were used to reduce the skewness.
Firstly, the Bray–Curtis dissimilarity coefficient matrix was used for grouping. Then, the feasibility of grouping was verified by drawing the change diagram of fusion level value. The similarity percentage analysis (SIMPER) method was used to assess the taxonomic groups that contributed to group differences.
The Margalef richness index (D) [24], Shannon–Wiener diversity index (H′) [25], and Pielou evenness index (J′) [26] were calculated in the Primer software (version 5.0) and used to represent species diversity of ichthyoplankton in the Yellow River estuary waters.
The Margalef richness index (D) was calculated as follows:
The Shannon–Wiener diversity index (H′) was calculated as follows:
The Pielou evenness index (J′) was calculated as follows:
where Pi is the proportion of individuals in a sample unit belonging to species i and S is the abundance of the identified species.
The biodiversity indices of eggs and larvae at each station during each year of the survey were analyzed using Pearson correlation of parameters, including SST, SSS, DEP, pH, DO, Chl–a, and SPM, that were simultaneously monitored. The Pearson correlations between factors were plotted using the vegan and other program packages of R software (version 4.1.0).
The relationships between fish egg and larval community structure and the above environmental factors were analyzed using Canoco 5.0. The species data were firstly subjected to de-trended correspondence analysis (DCA), and the appropriate sorting method was selected according to the length of the gradient (LGA) of each axis. When LGA was <3, redundancy analysis (RDA) or canonical correspondence analysis (CCA) were both possible; when LGA was >4, canonical correspondence analysis (CCA) was applied [27]. According to the results of DCA analysis, the linear model CCA analysis was used in this study. The abundance data of fish eggs and larvae were not transformed, and the environmental data were log transformed, with the exception of pH. In order to facilitate analysis, the collected species were numbered alphabetically in chronological order and only the IRI value of species greater than 50 were selected for analysis. In the CCA ranking diagram drawn using Canoco 5.0, environmental factors are represented by line segments with arrows. The length of the arrow represents the intensity of the impact of the environmental factor on the community change. The angle between the arrow and the coordinate axis represents the correlation between the environment factor and the coordinate axis. The smaller the angle, the higher the correlation. This angle was used to judge the correlation between environmental factors and ichthyoplankton. The vertical distance from the sample point to the environmental factor arrow and its extension line indicate the impact of the environmental factor on the sample. The closer the sample point is to the arrow, the stronger the impact of the environmental factor on the sample. When the sample is located in the same direction as the arrow, this indicates that the environmental factors are positively correlated with the changes of the sample species community; when the sample is located in the opposite direction of the arrow, this indicates that the environmental factors are negatively correlated with the changes of the sample species community. Relevant literature for fish taxonomy [28] was used as a reference to classify spawning stock into warm temperate species (WT), warm water species (WW), and cold temperate species (CT). The types of spawning parental habitats in the Yellow River estuary and adjacent waters were used to classify fish as continental shelf demersal fish (CD), continental shelf reef-associated fish (CRA), continental shelf pelagic-neritic fish (CPN), continental shelf benthopelagic fish (CBD), oceanic pelagic fish (OEP), oceanic bathydemersal fish (OMP), marine straggler fish (MS), estuarine sedentary fish (ES), marine migratory fish (MM), catadromous fish (CA), and anadromous migratory fish (AM) [29].
3. Results
3.1. Annual Change in Environmental Factors
3.1.1. Interannual Variation of Water and Sediment Flux into the Sea of the Yellow River
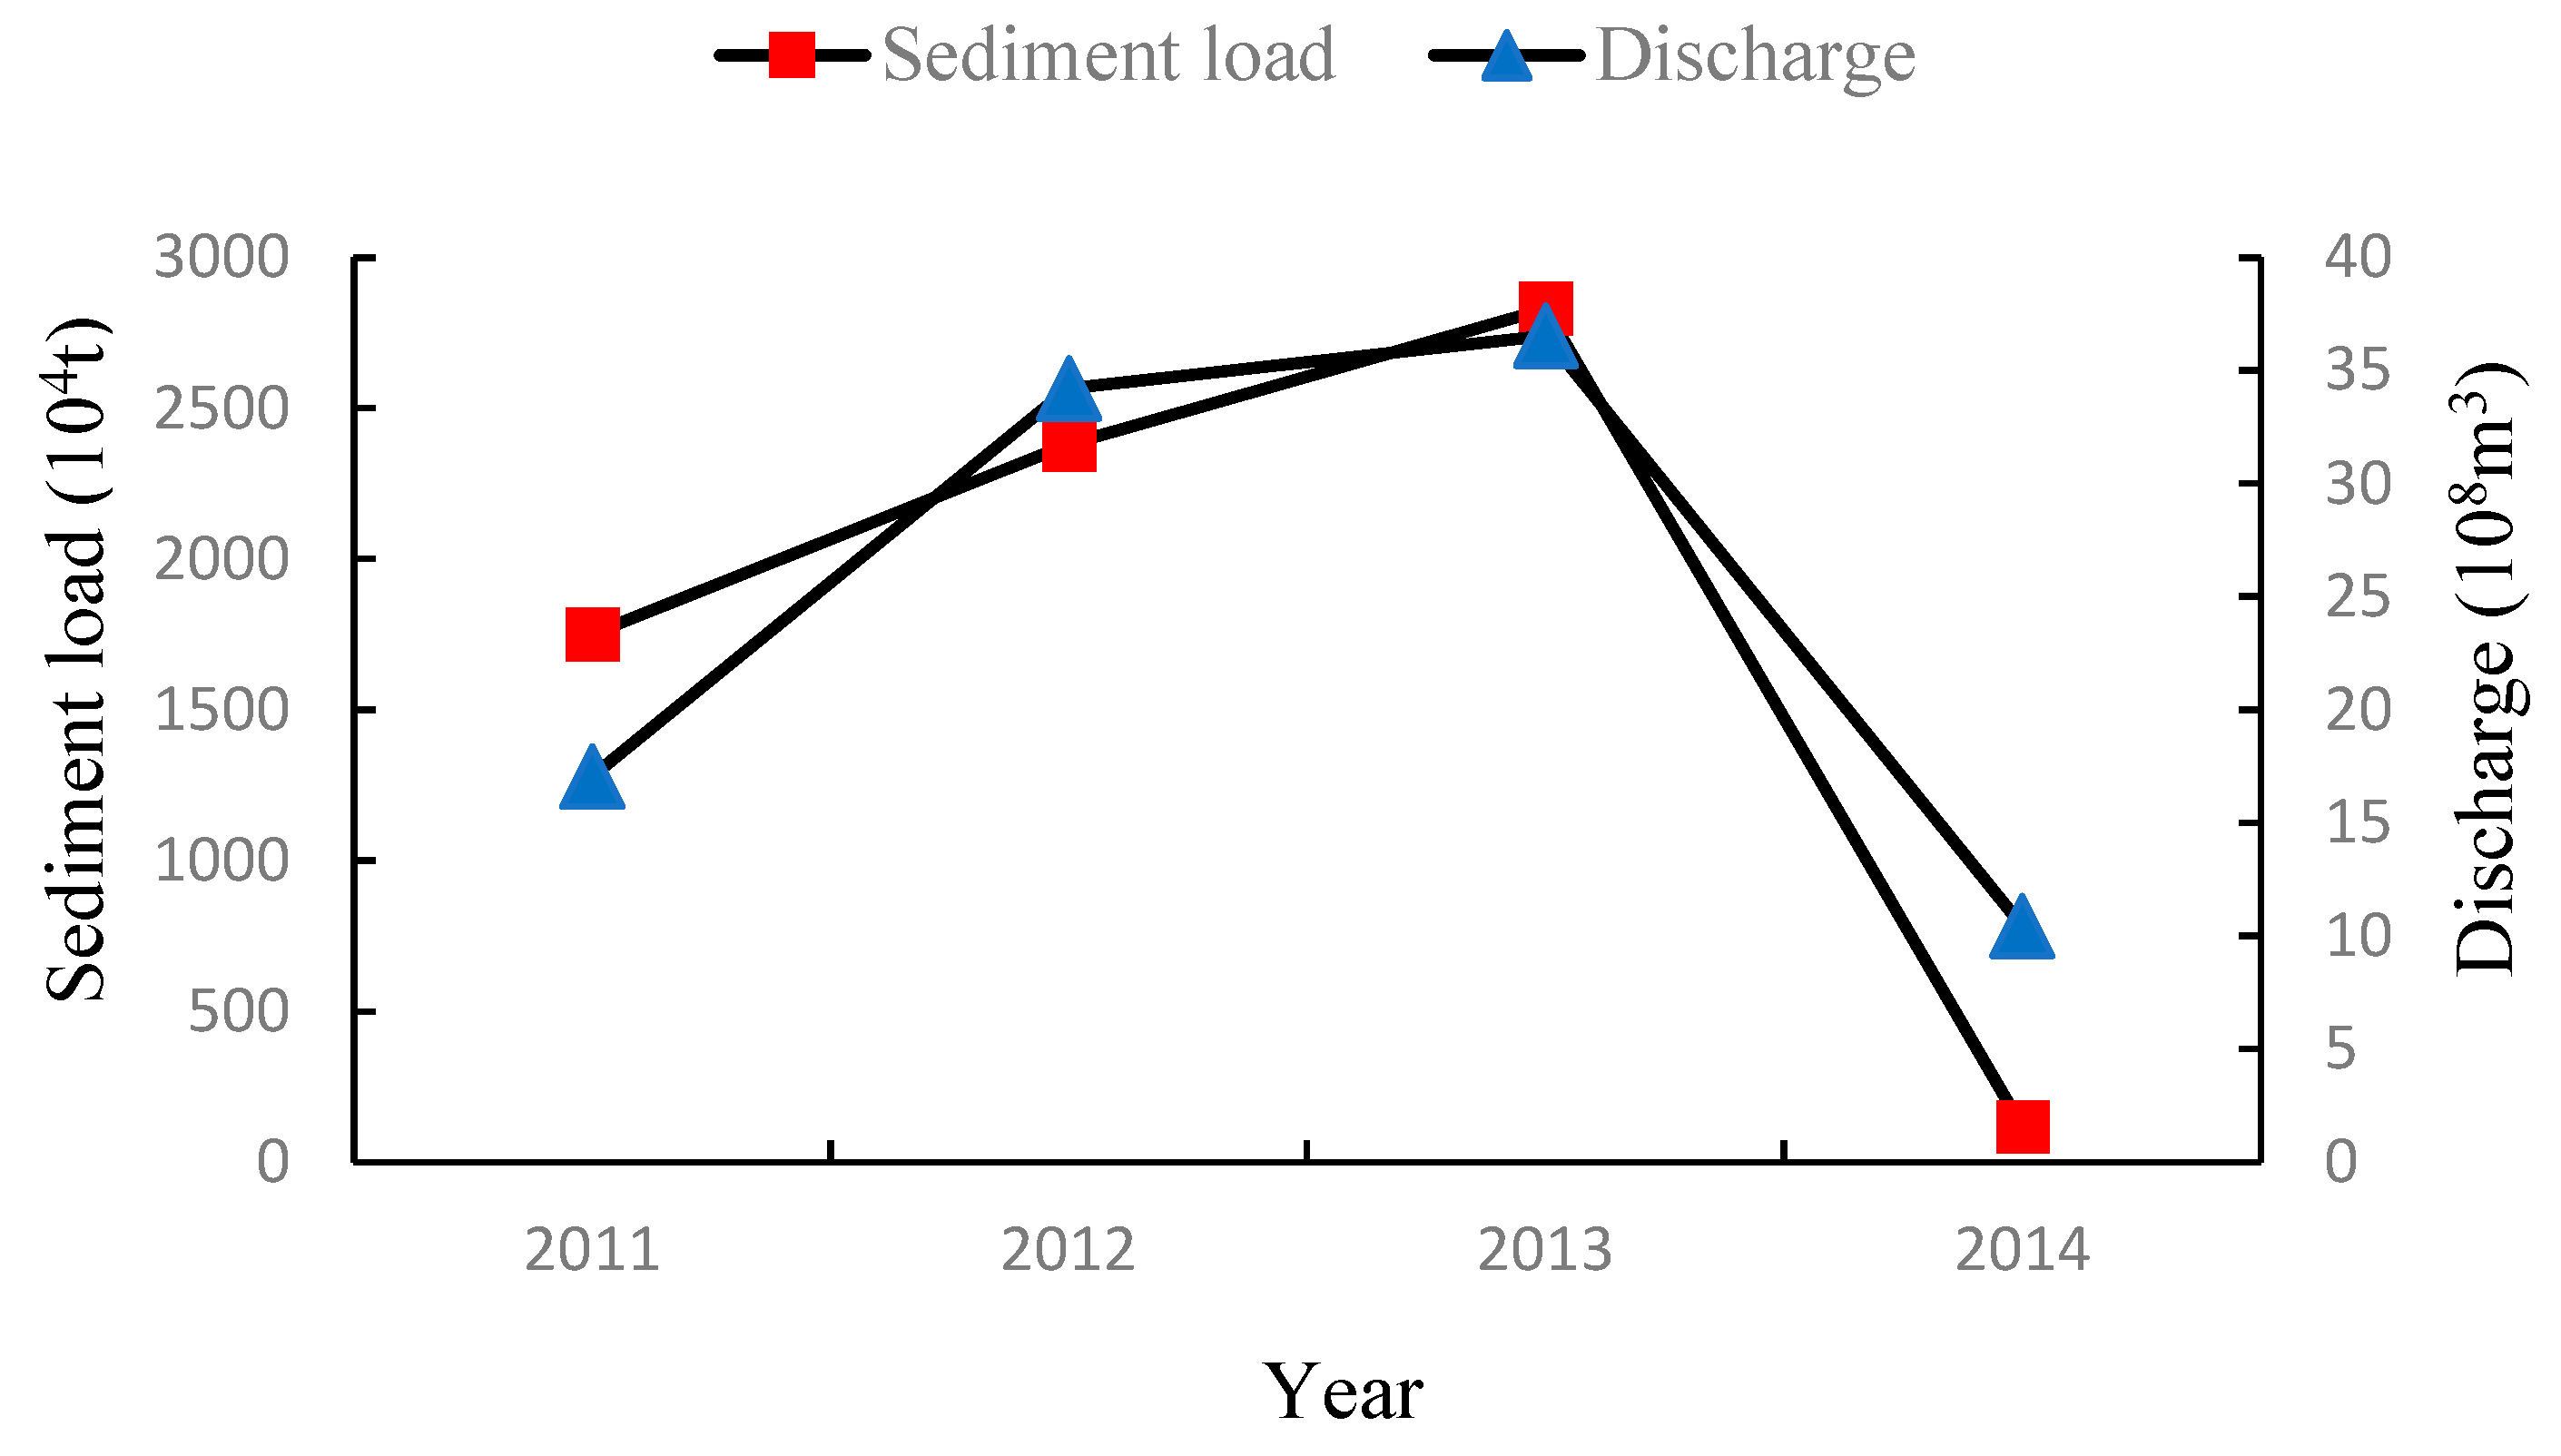
The average monthly runoff volume and average monthly sand transport from June 2011 to June 2014 at the Yellow River Lijin Station exhibit large fluctuations. Specifically, the average monthly runoff volume in June 2013 was 36.55 × 10⁸ m3 and the average monthly sand transport volume was 2830 × 104 t. Both values were highest across the four years of the study. The average monthly runoff volume in June 2014 was 10.45 × 10⁸ m3 and the average monthly sand transport was 118 × 104 t. Both values were the lowest across the four years of the study. The difference between the highest and lowest monthly average runoff volume years was 26.10 × 10⁸ m3 and the difference between the highest and lowest monthly average sand transport volume was 2612 × 104 t (Figure 2).
3.1.2. Analysis of Environmental Parameter
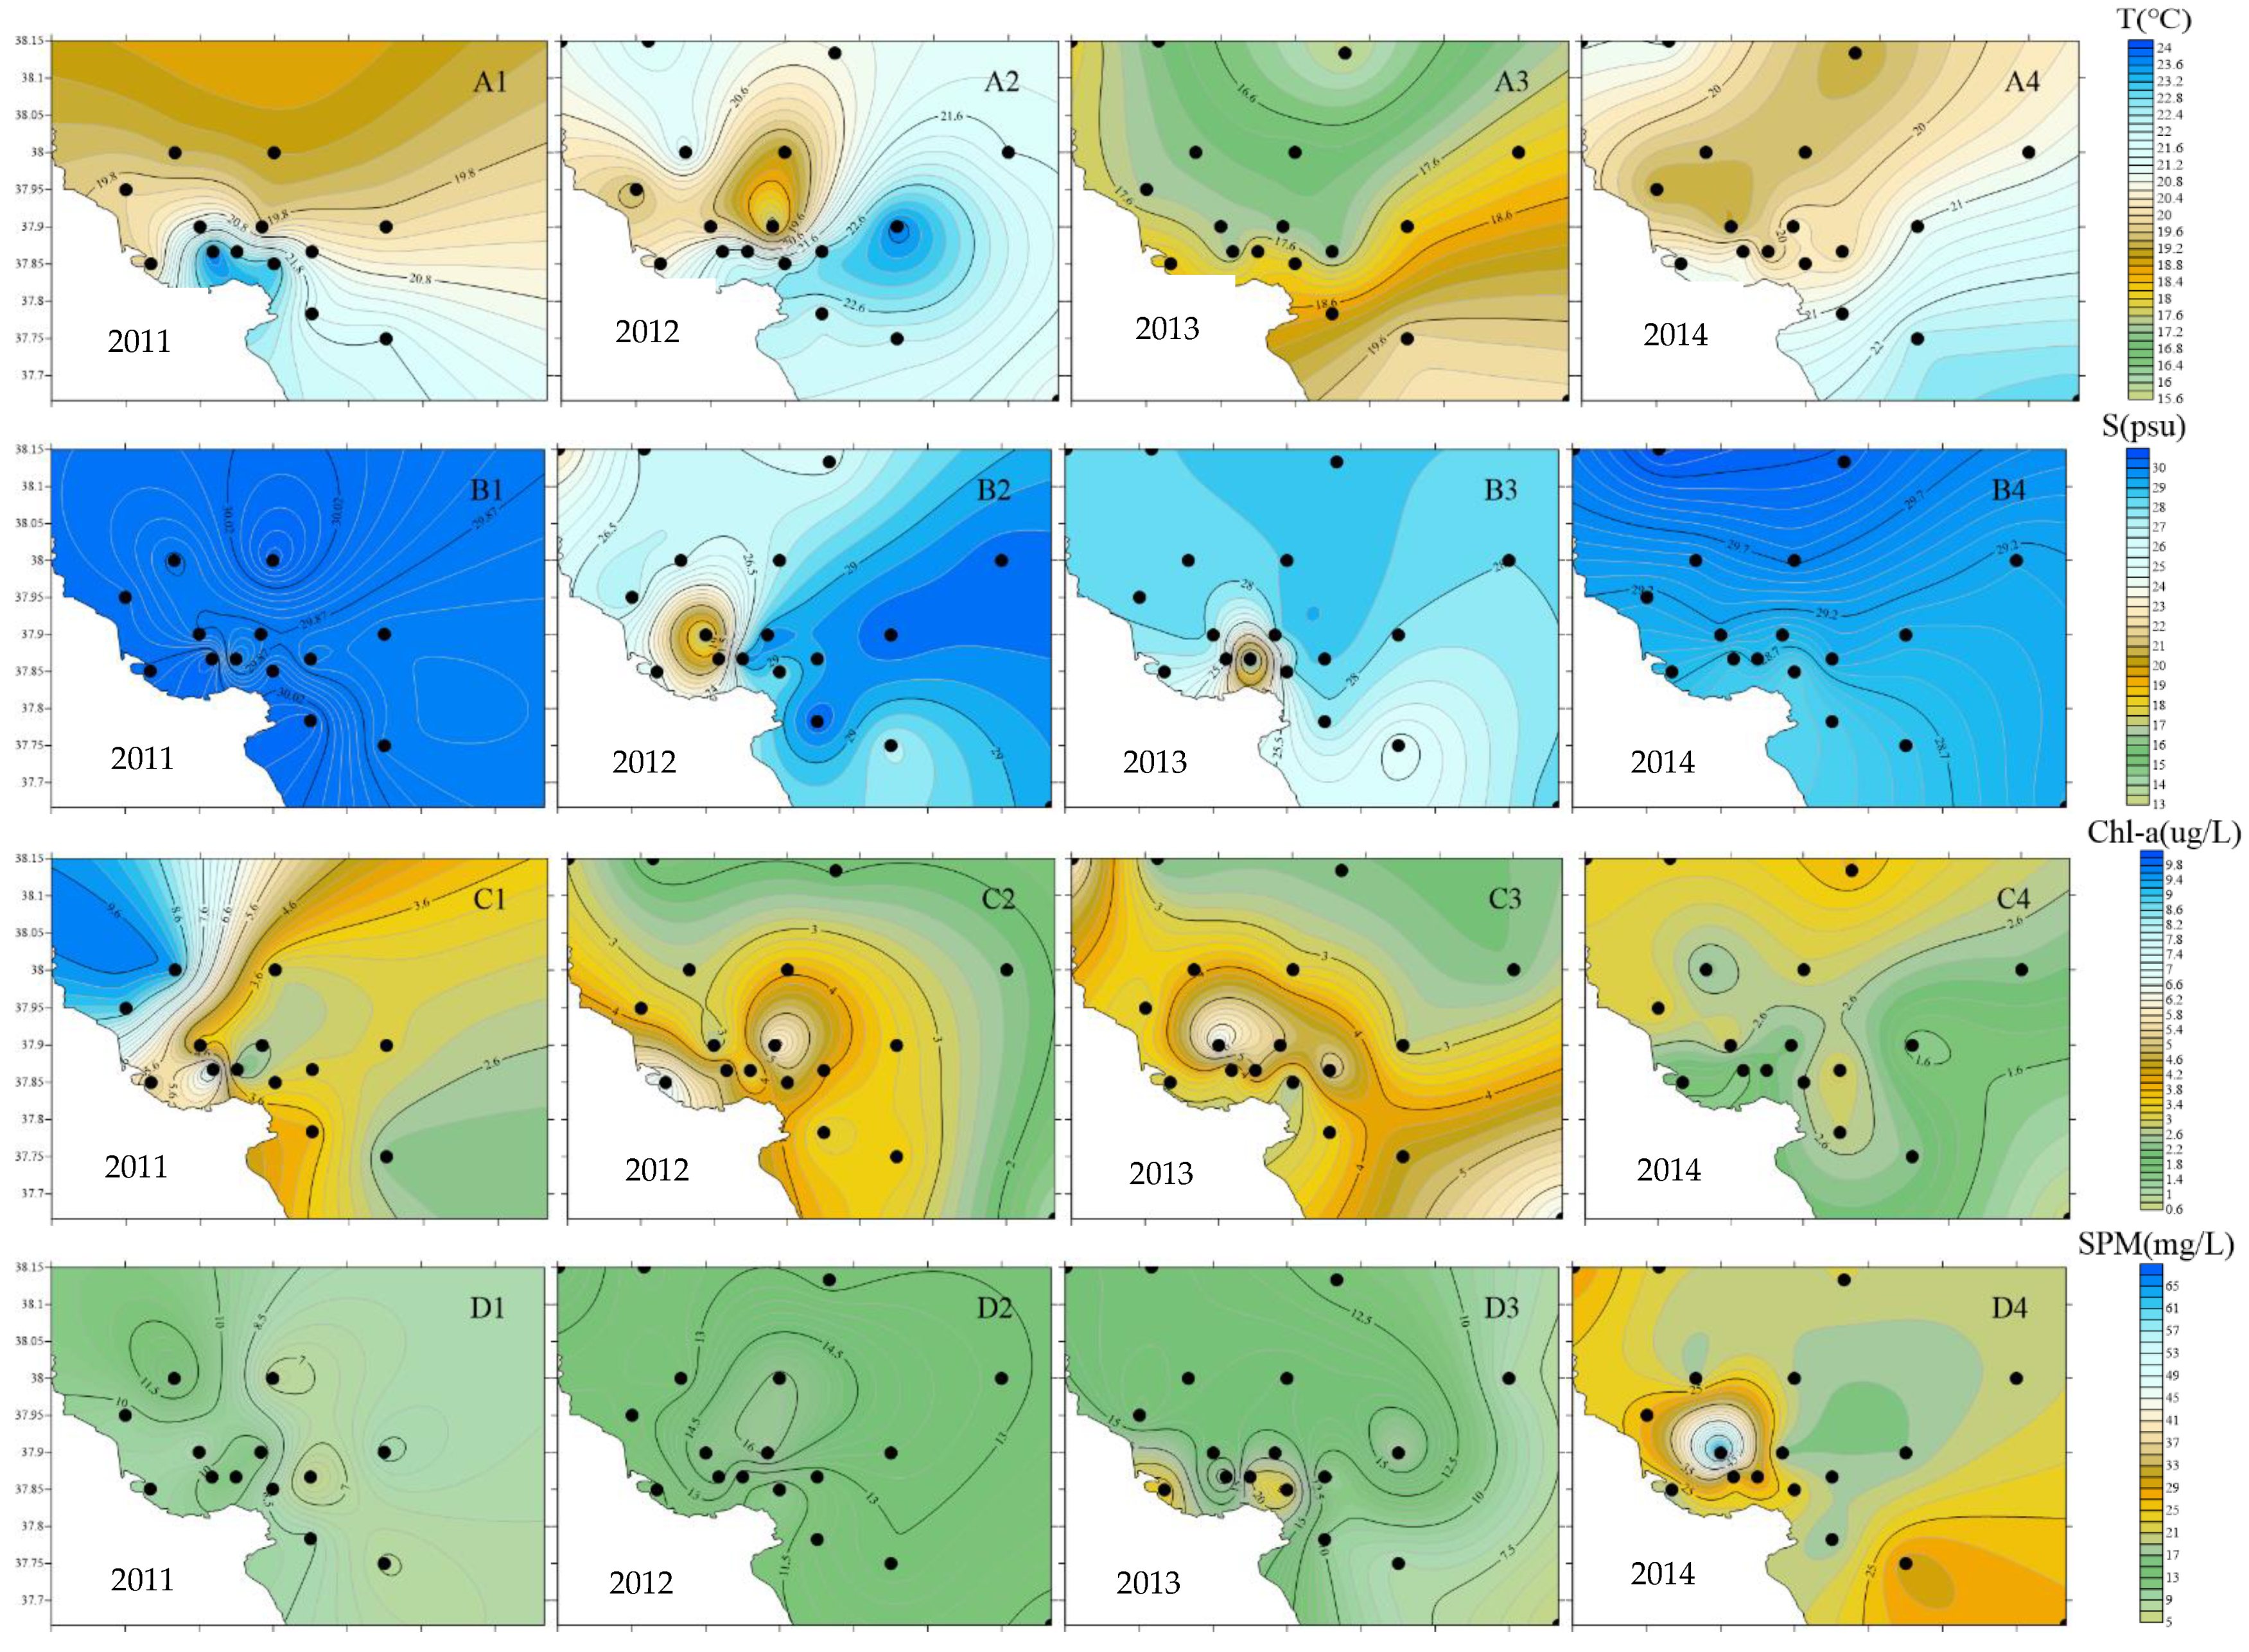
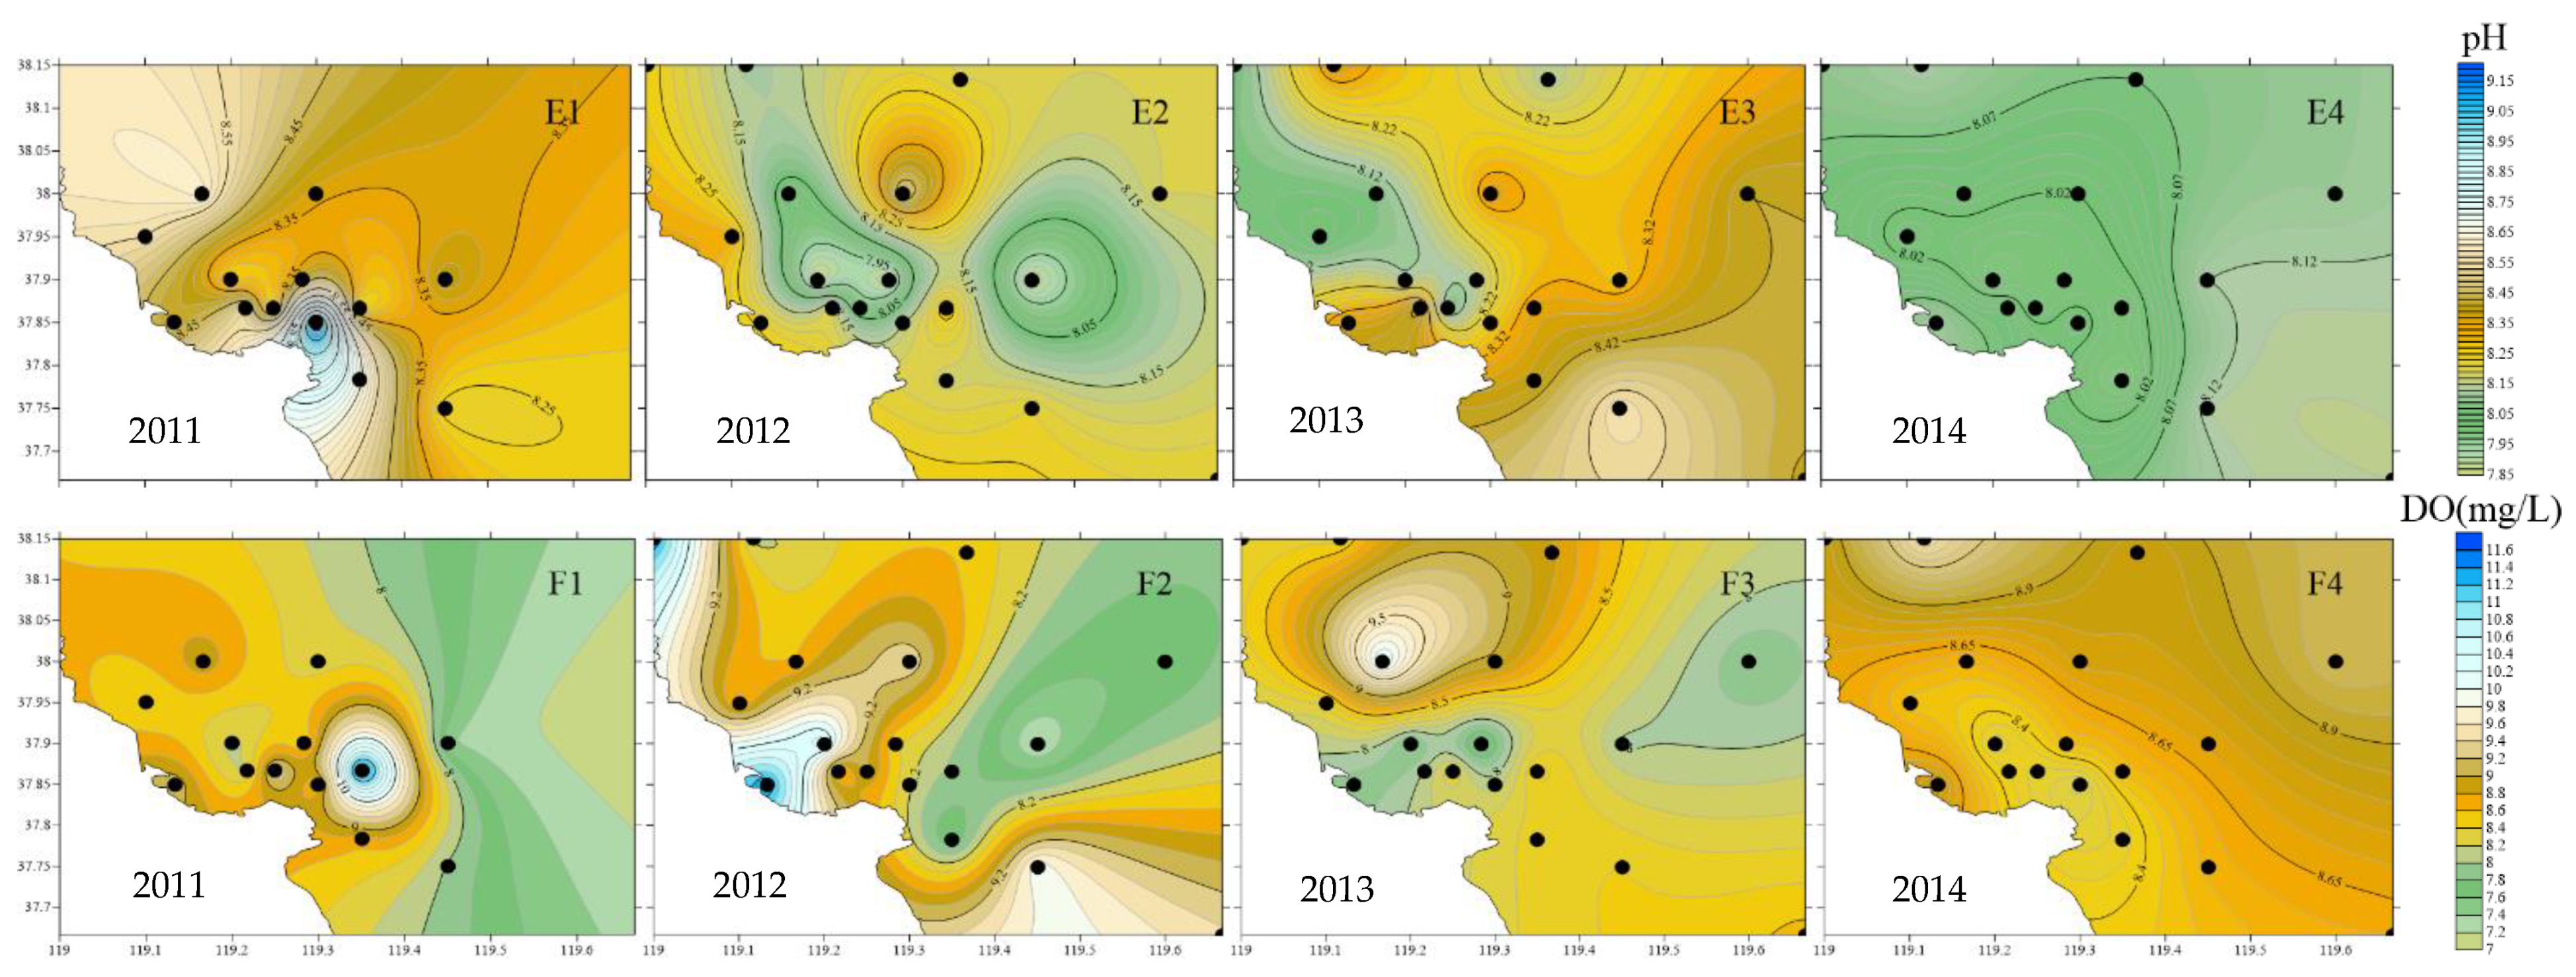
As shown in Figure 3, SST showed an overall trend of being high in the south of the estuary and being low in the north; SST in estuarine waters was generally higher than offshore, among which, the average SST in 2013 was the lowest in four years. The gradient of SSS change in 2011 and 2014 was small, the average value of SSS at each station was around 29, and an obvious low–salinity area was formed in the northern part of the estuary in 2012 and 2013. From 2011 to 2013, the Chl–a concentration showed a trend of high estuary and low offshore and mostly formed a high value area in the northern part of the estuary, with the average Chl–a concentration of each station exceeding 3.5 µg/L; in 2014, the Chl–a concentration in the estuary was lower than offshore, with the average concentration of each station being only 2.5 µg/L: the lowest in four years. From 2011 to 2013, the gradient of SPM concentration was low, with the average concentration at each station fluctuating between 8.65 and 13.96 mg/L; in 2014, high values were formed in the northwest and southeast of the estuary, and the average concentration at each station was the highest in four years, with a value of about 25 mg/L. The pH concentration showed an overall trend of high estuarine waters and low offshore waters, with the average pH value of each station being the lowest in 2014 and the highest in 2011. The overall DO concentration in the northern part of the estuary was higher than that in the southern part of the estuary; high-value areas were formed in the eastern, western, and northwestern parts of the estuary from 2011 to 2013, respectively. The gradient of DO change in 2014 was small, and the DO concentration of each station fluctuated between 8.18 and 9.05mg/L (Figure 3, Table 1).
3.2. Species Composition and Interannual Variation of Eggs and Larvae
A total of 2540 eggs and 143 larvae were collected during the four surveys and belonged to eight orders, 16 families, 20 genera, and 25 species (Table 2). Among temperature adapted groups, warm-temperature species were predominant, followed by warm-water species. Continental shelf pelagic-neritic fish and continental shelf demersal fish were dominant among habitat adapted groups, while marine migratory fish and estuarine sedentary fish were dominant among migratory types.
Between 2011 and 2014, the species richness of eggs in the Yellow River estuary first decreased and then increased, with richness reaching a minimum in 2012 and then increasing slightly every year. The numbers of eggs first increased and then decreased, increasing each year between 2011 and 2013, then decreasing sharply in 2014 (Table 3). The number of larval species exhibited the same trend as that of eggs, dropping to the lowest point in 2012 with two species of larvae. It then increased year by year, reaching four species in 2013 and five species in 2014. The number of larvae fluctuated during the four years, dropping to the lowest point in 2012, increasing to the highest point in 2013, and then, decreasing again (Table 3).
3.3. Spatial Distribution of Eggs and Larvae
In 2011, the average density of eggs was 20.8 individuals (inds.)/station, which were mainly distributed in the coastal waters of the northern Yellow River estuary. Konosirus punctatus represented an important species among eggs. In 2012, only six stations harbored fish eggs, with an average density of 35.8 inds./station. Most of the stations that harbored fish eggs were in the northern waters of the Yellow River estuary. In 2013, Sillago sihama was the dominant species represented by eggs, with an average density of 60.1 inds./station, representing the highest value across four years. The egg density at the E2 station in the southern waters of the Yellow River estuary reached 912 inds./station. In 2014, the average density of eggs was 34.1 inds,/station. An area of high egg density was observed in the coastal waters of the northern Yellow River estuary. Cynoglossus joyeri was the dominant species at these sites, while K. punctatus and Eupleurogrammus muticus were also important species (Figure 4).
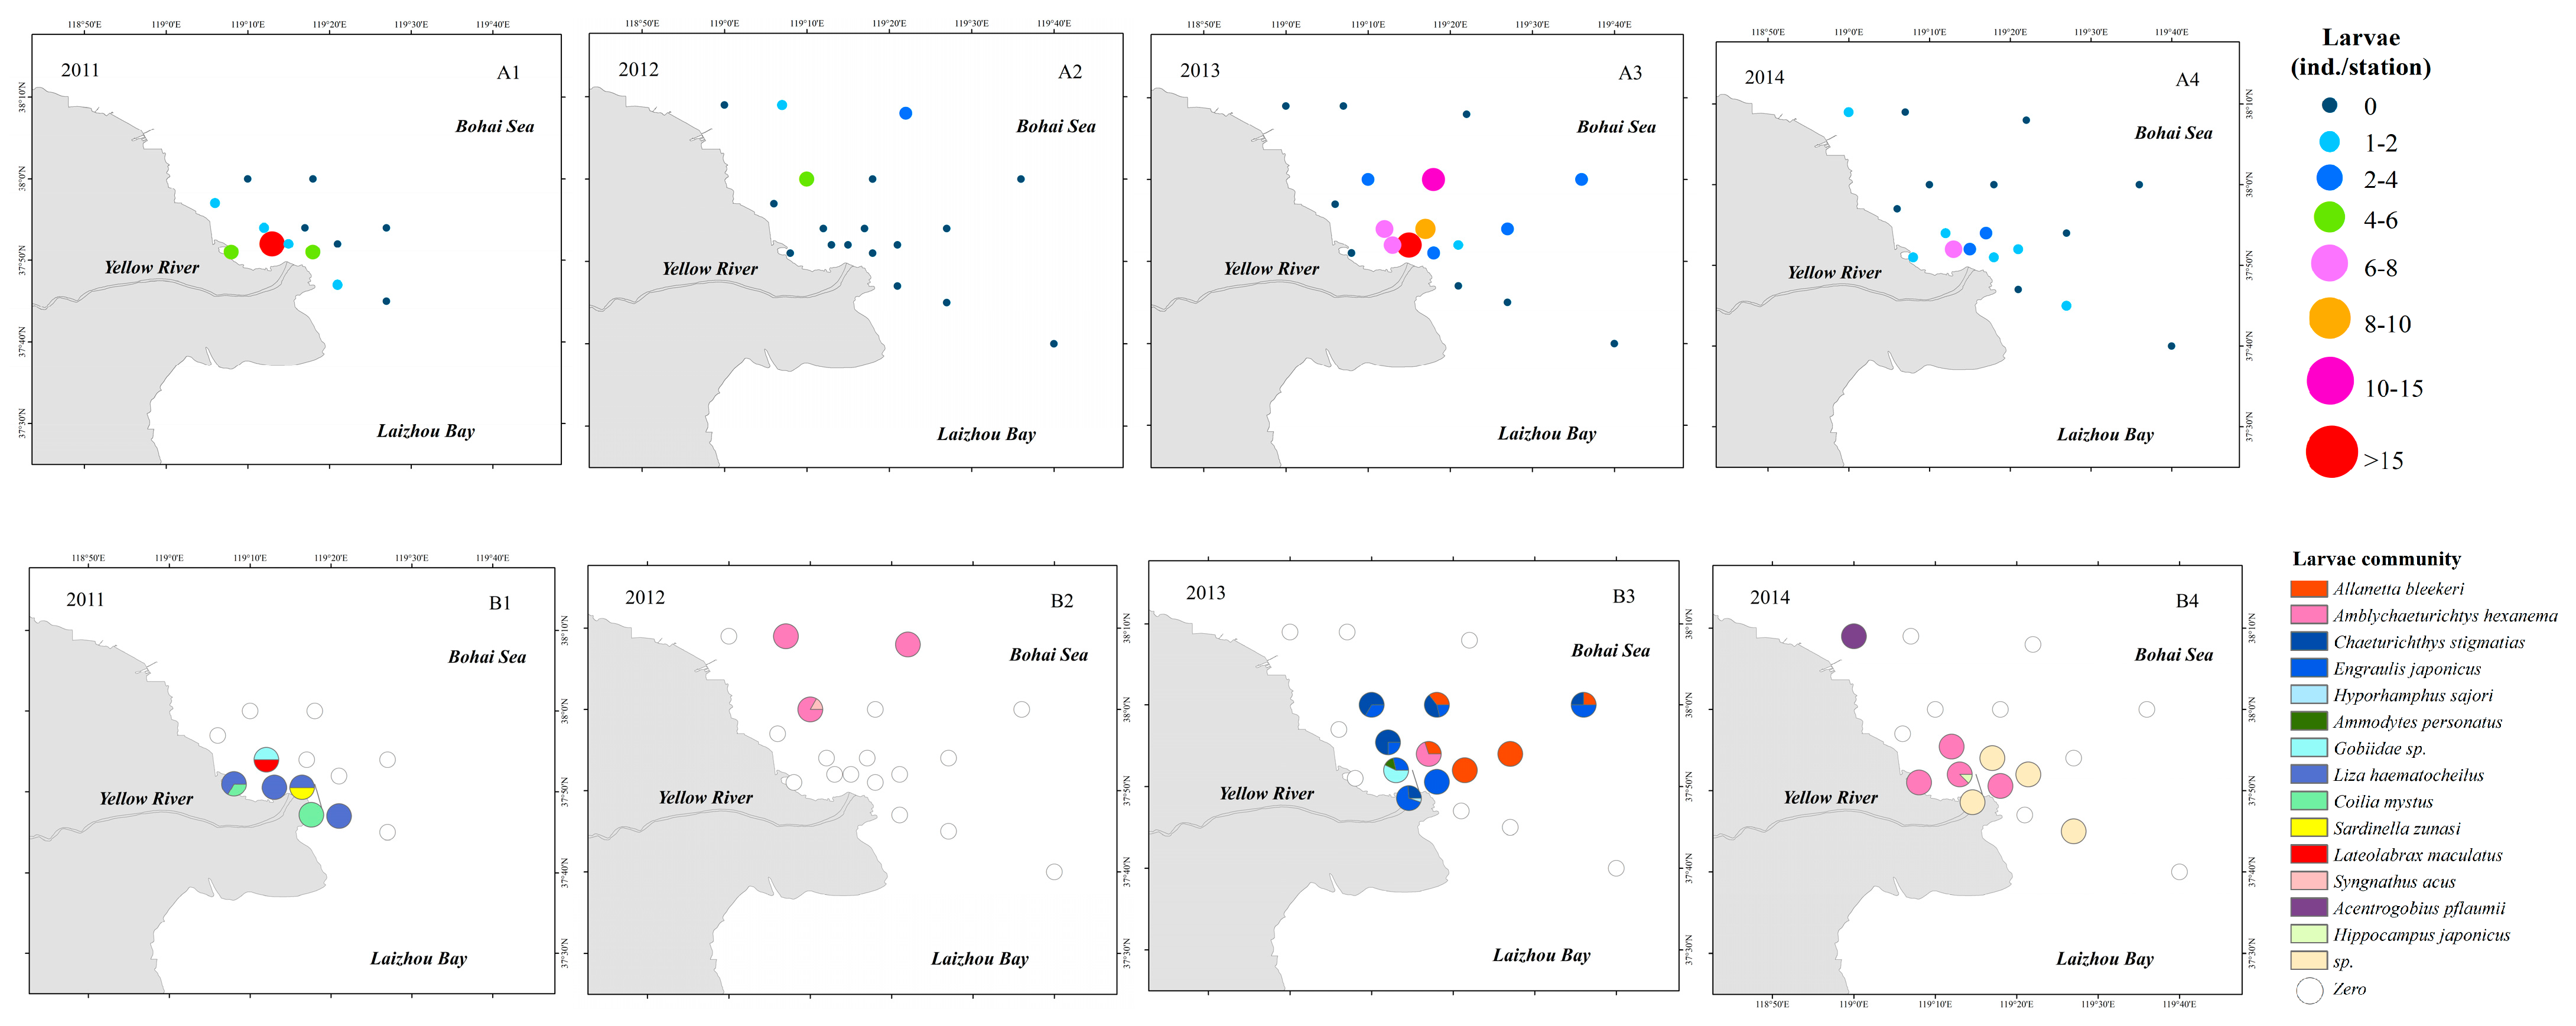
In 2011, the average density of larvae was 2.8 inds./station, and the larval density at station B1 in the northern waters of the Yellow River estuary reached 20 inds./station. The primary species at B1 were Engraulis japonicus, Liza haematocheila, and Coilia mystus. In 2012, larvae were only collected from three stations, with an average density of 0.6 inds./station. The stations where larvae were collected were all distributed in the northern Yellow River estuary and Chaeturichthys hexanema was the dominant species among collected larvae. In 2013, the average density was 4.1 inds./station, and these were primarily distributed in the northern Yellow River estuary. E. japonicus was the dominant population at these stations, while Chaemrichthys stigmatias and Allanetta bleekeri were also abundant. In 2014, the average density was 1.2 inds./station. Most of the larvae were collected from stations in the northern Yellow River estuary. C. hexanema was the dominant species among these stations (Figure 5).
3.4. Community Structure Analysis
CLUSTER analysis showed that egg and larvae community structure could be divided into four groups at 22% similarity level in the summer of 2011–2014, and the grouping was tested as feasible by plotting the change in fusion level values. Group 1, comprising 12 stations (the A3, E3, C4, B4, E2, B3, C3, B2, C1, B1, D1, and A2 communities), was primarily derived from the northern region of the estuary. Group 2 only comprised three stations (D2, C2, and D3) and was primarily collected from the eastern region of the estuary near the sea, closer to the entrance of the sea at sections II and III. Group 3 only comprised two stations (E4 and D4); these were primarily distributed in the eastern region of the estuary near the sea, far from the entrance of the sea in section IV. Lastly, group 4 only comprised one station (A4) from the western region of the Yellow River estuary near the Bohai Bay (Figure 6). SIMPER analysis indicated that the primary species that differentiated groups 1/2, groups 2/4, and groups 2/3 was C. joyeri, while the main species that differentiated groups 1/4 and groups 4/3 was E. muticus. Lastly, the main species that differentiated groups 1/3 was K. punctatus.
3.5. Biodiversity Levels
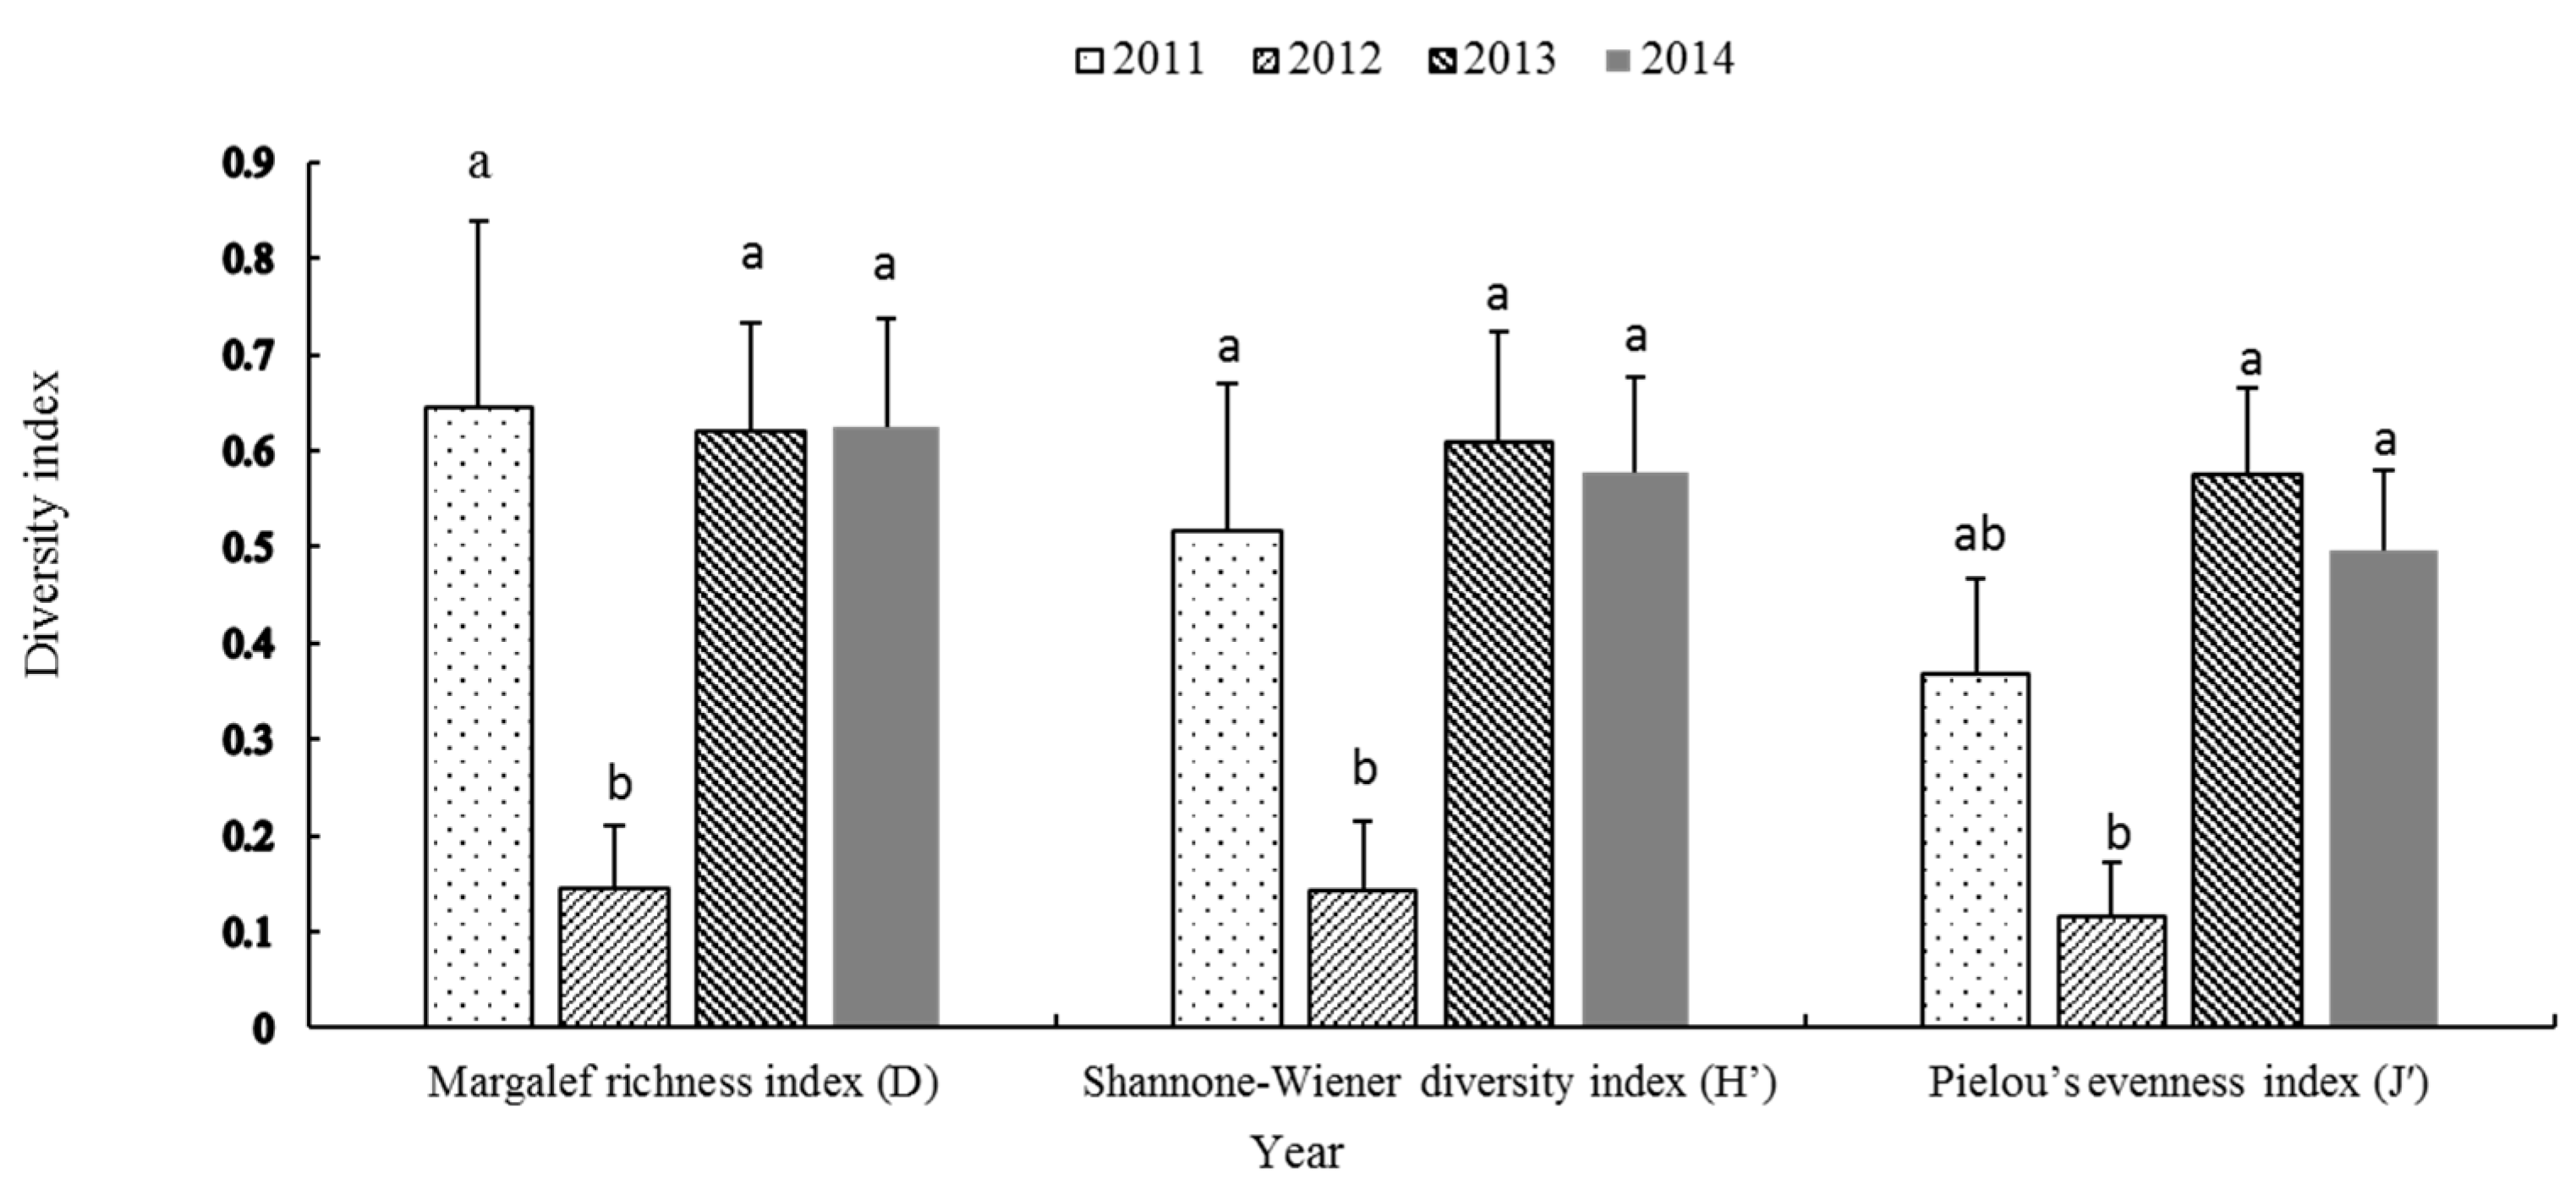
The community diversity of eggs and larvae in the Yellow River estuary and adjacent waters exhibited a decreasing trend, followed by an increase trend across the four years. The species richness (D), diversity (H′), and evenness (J′) indices for 2012 were the lowest among the four years. Among them, the species richness index (D) and diversity index (H′) in 2012 were significantly lower than those in 2011, 2013, and 2014 (p = 0.008), and the evenness index (J′) was significantly lower than those in 2013 and 2014 (p = 0.001) (Figure 7).
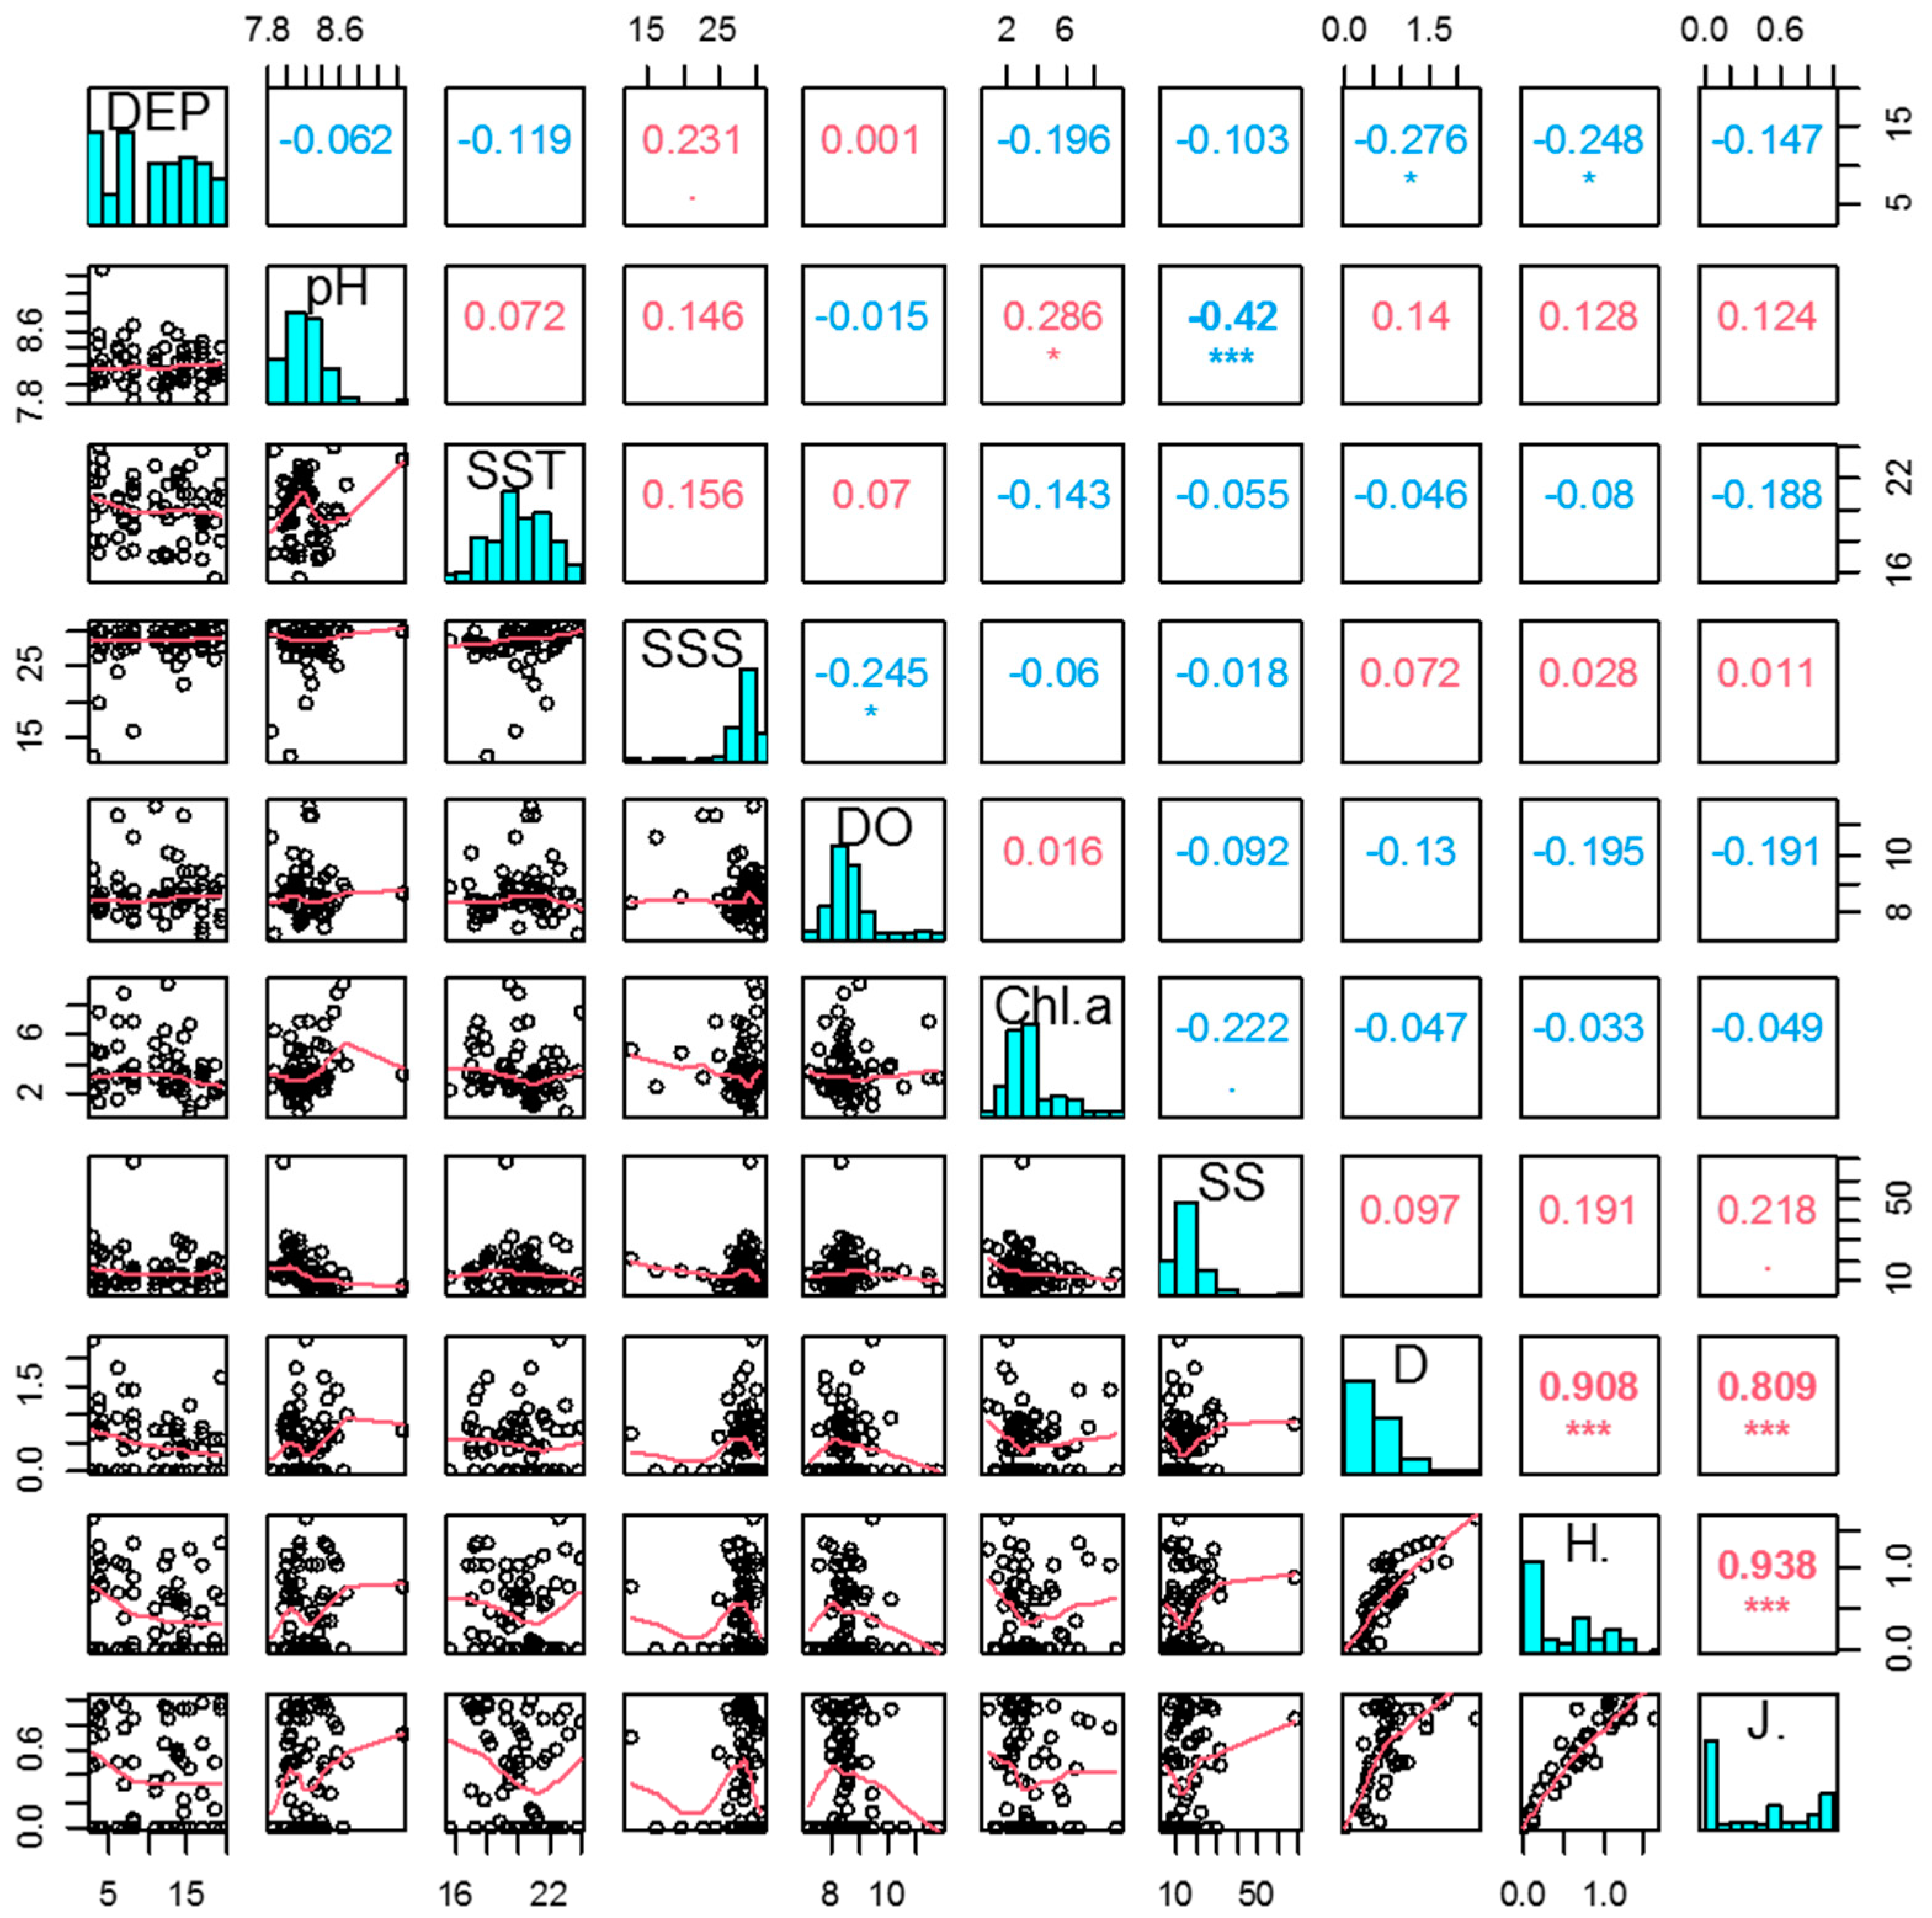
Correlation analysis between diversity indices and environmental factors revealed significant negative correlations between the species richness (D) and diversity (H′) indices with water depth (p < 0.05). Significant correlations with other environmental factors were not observed (Figure 8)
3.6. Analysis of the Relationship between Community Structure and Environmental Factors
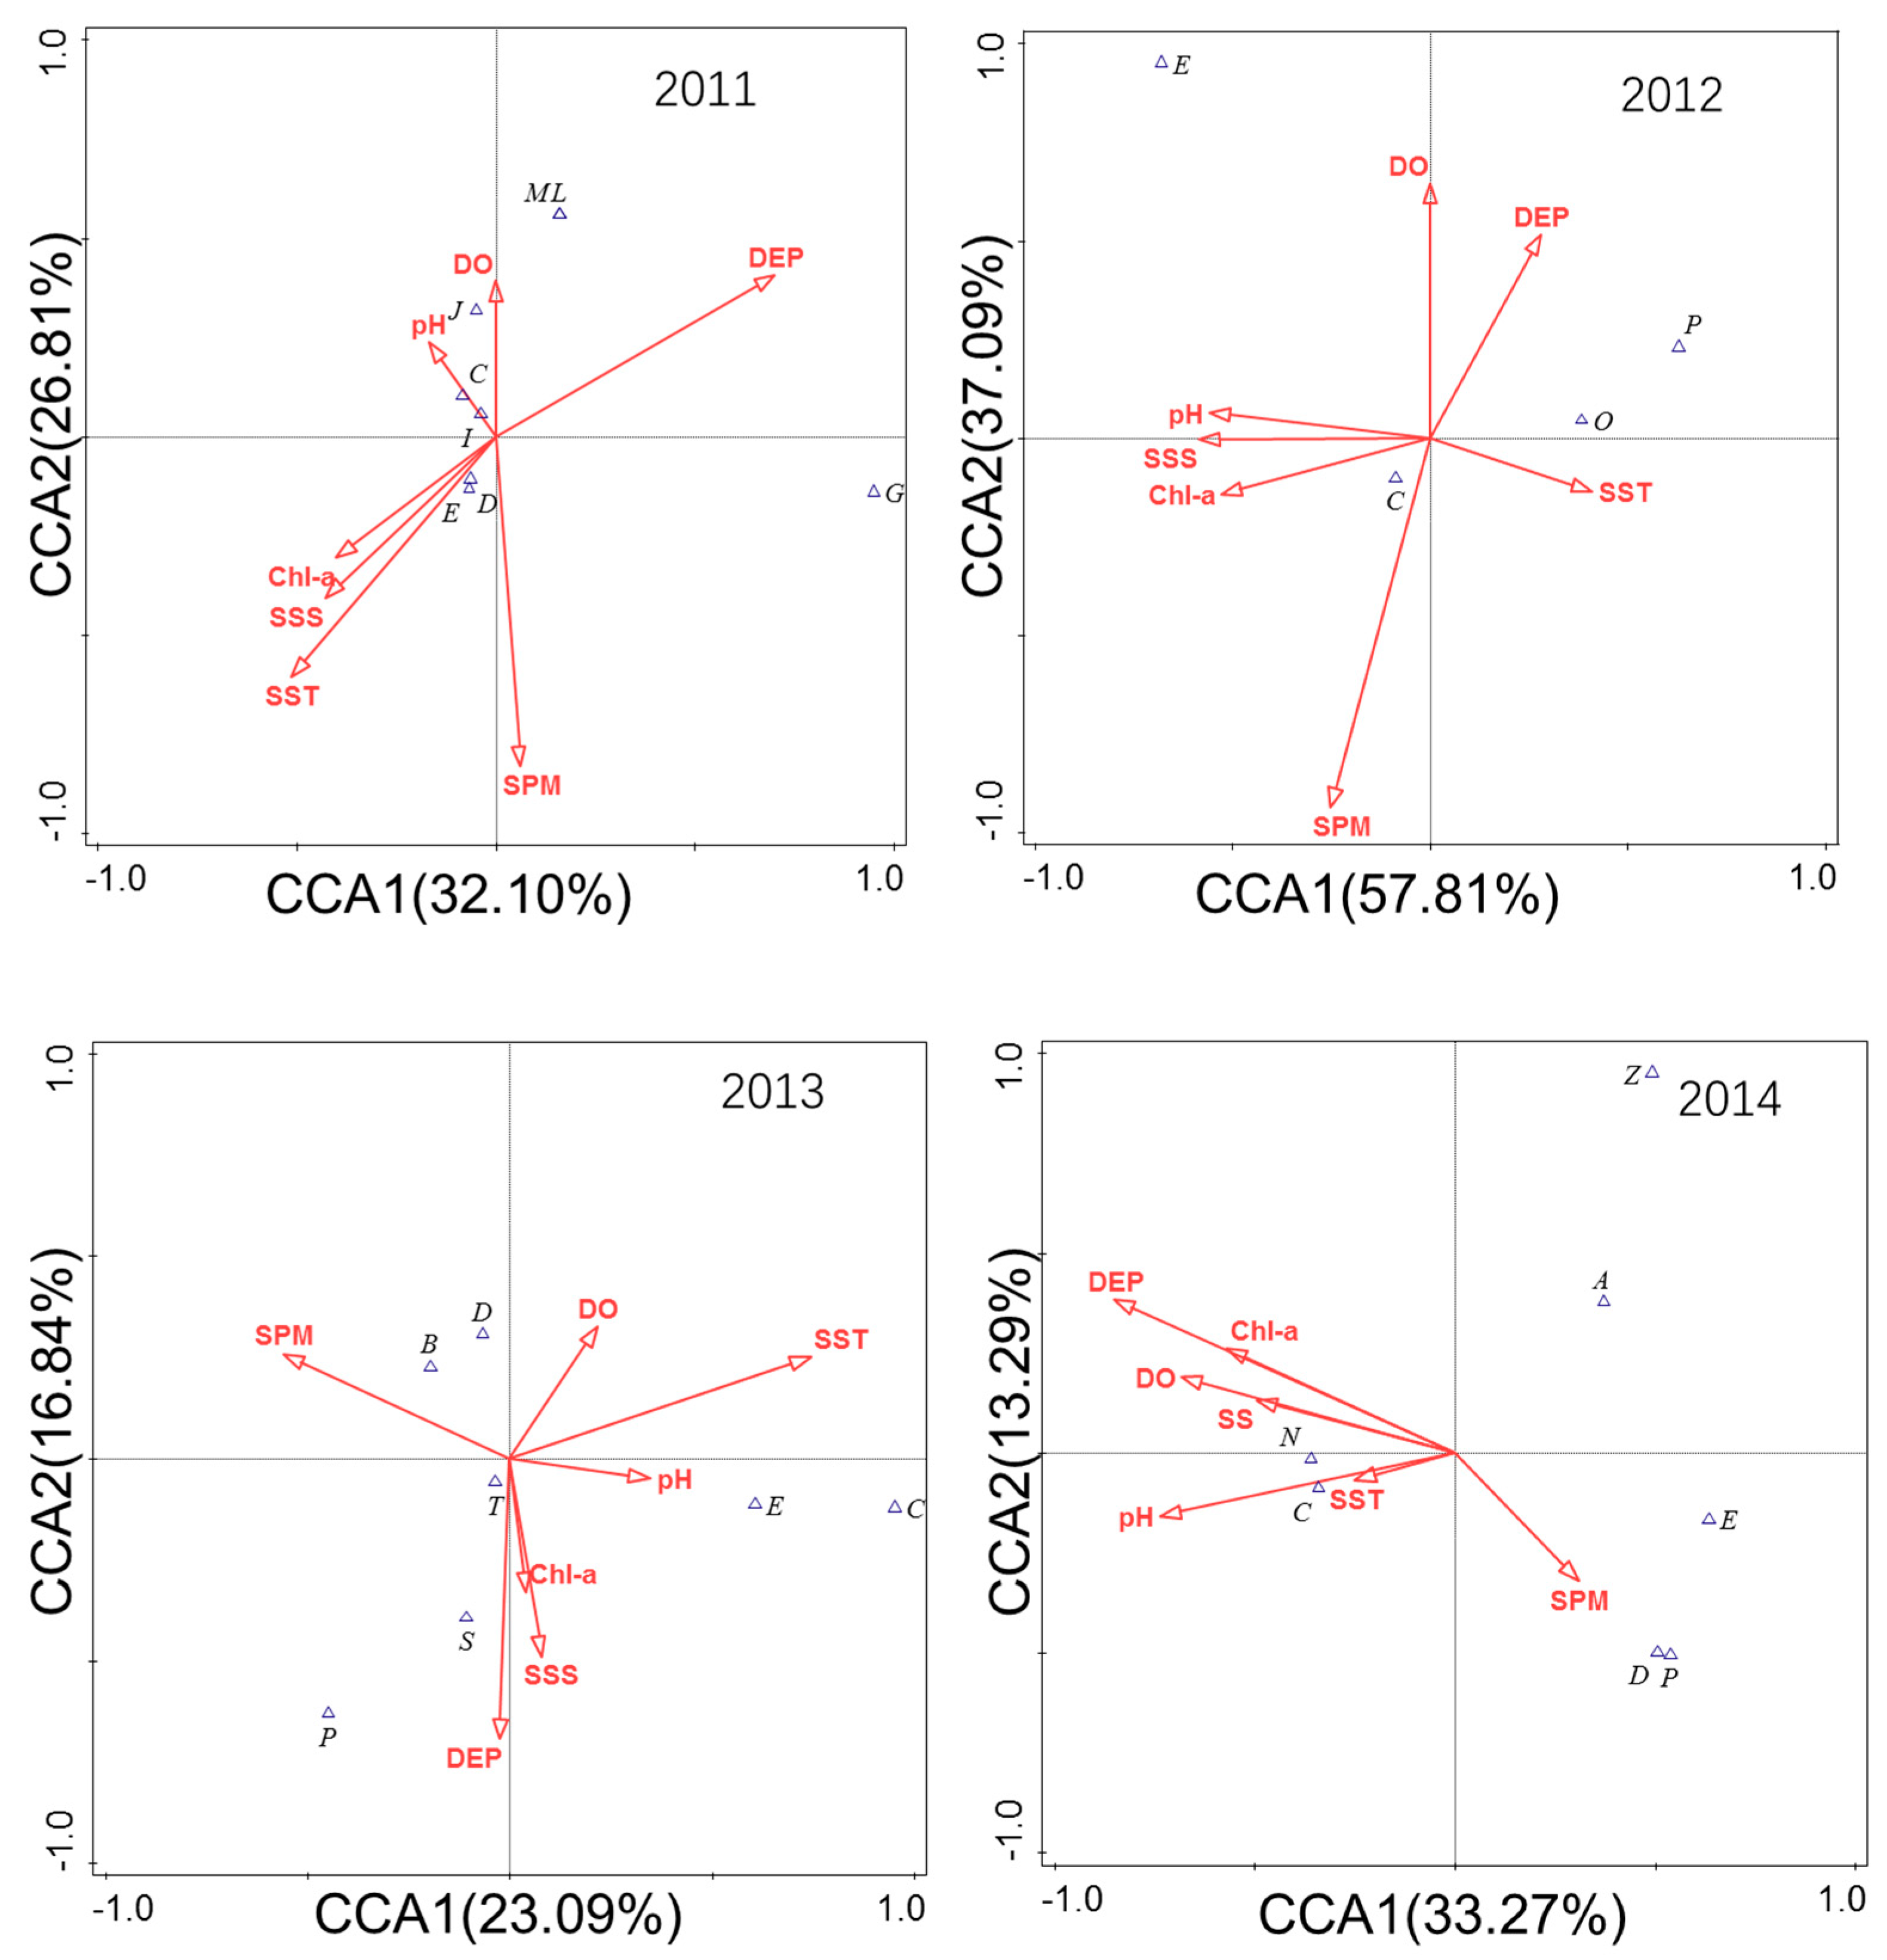
In 2011, the environmental factors that had a great impact on the community structure of fish eggs and larvae were DEP, SPM, and SST. The two ranking axes explained the variation of 58.91% of the main fish composition, in which DEP was positively correlated with the first ranking axis, and SST, SSS, and Chl–a were significantly negatively correlated with the first ranking axis. The eggs and larvae of E. japonicus, K. punctatus, and other fish were significantly affected by SST; L. haematocheilus and S. sihama were significantly affected by the pH value; C. mystus was greatly affected by DO (Figure 9).
In 2012, the environmental factors that greatly affected the community structure were SPM, DO, and DEP. The two ranking axes explained the variation of 94.90% of the main fish composition, in which SST and DEP were significantly positively correlated with the first ranking axis. SSS, Chl–a, and pH value were significantly negatively correlated with the first ranking axis. The eggs and larvae of S. sihama were significantly affected by SPM (Figure 9).
In 2013, the environmental factors that had a great impact on the community structure were SST, DEP, and SPM. The two ranking axes explained the 33.93% variation of the main fish composition, in which SST was significantly positively correlated with the first ranking axis, SPM was significantly negatively correlated with the first ranking axis, and the bottom fish, such as C. stigmatias and S. elongate, were significantly affected by SPM (Figure 9).
In 2014, the environmental factors that had a great impact on the community structure were DEP, pH value, and DO. The two ranking axes explained the variation of 46.56% in the composition of main fish, in which SPM was significantly negatively correlated with the first ranking axis. SST, SSS, and DO were significantly negatively correlated with the first ranking axis, and the eggs and larvae of S. sihama and C. joyeri were significantly affected by SST and pH value (Figure 9).
4. Discussion
4.1. Species Composition and Population Distributions
The Yellow River estuary is an important area for fish breeding during spring and summer, with migratory fish and estuarine sedentary species returning from their wintering grounds and deep waters to spawn in the nearshore area at this time. In this study, 25 species were represented by eggs and larvae collected across 2011–2014, accounting for 71% of the total number of species that have been recorded in the area throughout the year [18,28,29]. Some differences were observed in the composition of the dominant species represented among the eggs and larvae that were collected. The primary species identified among the eggs were S. sihama, K. punctatus, and C. joyeri, while the larvae were primarily represented by C. hexanema, C. stigmatias, and E. japonicus. The observations of the latter were associated with the spawning times of parent individuals.
Evaluation of annual changes in species composition revealed that all species appeared in alternate years except K. punctatus and S. sihama. For example, E. muticus was collected in 2011 but was absent in 2012 and 2013. Then, it was recollected in 2014. In addition, C. joyeri was collected in 2012–2014, but not 2011. E. japonicus was not collected in 2012 and only appeared in 2011, in addition to 2013–2014. Other species were only collected in single years, including C. mystus in 2011; Johnius belangerii in 2014, and Tanakius kitaharae, Paralichthys olivaceus, Hyporhamphus sajori, Ammodytes personatus; Allanetta bleekeri in 2013; and Liza haematocheilus, only in 2011. The interannual succession of fish egg and larval species compositions are related to normal species variation of spawning parents. Considering the unique estuarine ecological environment of the surveyed waters, habitat conditions are likely more complex and variable than for seas. For example, differences in average runoff volume during the survey ranged up to 26 × 108 m3 and differences in the average sand transport volume ranged to over 26 × 106 t. Further, differences in the average surface water temperature were >3 °C and differences in surface salinity were close to 4‰. In addition, DO, SPM, and Chl–a values also fluctuated. Thus, fluctuation in habitat conditions may have influenced the interannual variation of fish species [30,31]. In order to adapt to the fluctuation of habitat conditions, the fish population will make some self-regulation, resulting in the disappearance of some species of fish in the estuary waters and the emergence of some species.
The distribution of eggs collected in this study was patchy, while the larval distribution was relatively concentrated at inshore waters. Eggs do not have locomotor ability. Thus, their distribution is primarily related to the habits of spawning parents and ocean characteristics like currents [32]. In contrast, larvae tend to live in shallow inshore areas that have sufficient food resources and few predators, because they already exhibit some swimming ability [32,33,34]. The highest abundances of fish eggs during the four years were mostly concentrated in sections III and IV that were relatively far from the Yellow River estuary. However, the salinity, current speed, and temperature of seas during the spawning period would likely influence the distribution of spawning parents [15]. Sections III and IV were relatively far from the estuary. Thus, they are less affected by freshwater entering the sea; there was no low-salt area with suitable salinity. This area is less disturbed by the runoff into the sea, and the water flow is relatively slow. The number of fish eggs carried and passively diffused by the water flow is relatively small, which is more suitable for fish habitat and spawning. In addition, the inability of eggs to move leads to the necessity of being carried by currents and passive spreading before hatching. Their distribution is closely related to ocean characteristics like currents [35,36,37]. The area is influenced by three circulation systems including the clockwise circulation system south of the Yellow River estuary, the clockwise circulation system off Xianhe, and the counterclockwise circulation system north of the Yellow River estuary. Consequently, dense areas of fish eggs mostly occur at the tail of residual flows [37,38]. High numbers of larvae were primarily concentrated in sections I and II near the Yellow River estuary. This is so that the larvae can move closer to the shore with the change of hydrological conditions in the feeding water area. The suspended sediment concentrations of the nearshore area near the estuary were relatively high in (16.45 in sections I and II, in addition to 15.17 in sections III and IV). Moreover, the high turbidity and complex hydrographic conditions of the shallow water zone result in fewer carnivorous fish inhabiting the area and fewer predators of larvae, thereby increasing their survival chances [39]. On the other hand, these dynamics are also related to environmental conditions and the materials of the Yellow River estuary. The Yellow River waters are most abundant in summer, and runoff volume significantly increases after June. The Yellow River flushes fresh water, bringing abundant nutrients to the near-shore shallow water area, leading to the production of rich food resources and providing sufficient materials for larval growth and development. In addition, disturbance conditions caused by runoff into the sea greatly increase the probability that larvae will encounter food because it is more accessible (we have not collected lecito trophic larvae) [13,40].
4.2. Interannual Variation of Community Diversity
Biodiversity indices in 2012 were 25–33% lower than those observed in 2011, 2013, and 2014. Thus, low population balances of eggs and larvae were observed in the Yellow River estuary in 2012 and the population distributions were unevenly represented among species. These trends were related to decreased numbers of species represented by eggs and larvae in 2012 relative to 2011, 2013, and 2014 (50% lower numbers in 2012 relative to other years), thereby leading to decreased community richness (D) and diversity (H′) [41,42]. Decreased community diversity is also closely related to changes in abiotic environmental conditions and disturbances [43]. The runoff volume into the sea at the Lijin station of the Yellow River in June 2012 was 34.21 ×10⁸ m3. Sand transport reached 23.8 × 10⁶ t. Both values were the highest levels during the four-year period. Higher runoff volume and sand transport will lead to altered environmental conditions like salinity and temperature in the Yellow River estuary. For example, in 2012, the average water temperature was 21.14 °C and the average dissolved oxygen was 8.925 mg/L: both of which were the highest in four years. However, the salinity was 26.82, which was the lowest in four years. Concomitantly, disturbance caused by runoff and sand transport into the sea would very likely significantly increase. Thus, the combination of changes in biotic environmental conditions overlaid with changes in abiotic environmental conditions and some undetermined interference factors led to the lowest observed community diversity values in 2012 among all four years [44,45]. In addition, the richness (D) and diversity (H′) indices were significantly related to water depth in this study, and the analysis is also related to the difference in the degree of disturbance caused by different water depth stations due to different distances from the estuary.
4.3. Community Structure Changes
The Yellow River estuary has been historically rich in fishery resources and has been the baiting and breeding grounds for many migratory fish. However, several factors in recent years have led to serious negative impacts on the environment and ecology of the Yellow River estuary including overfishing, sea pollution, reduction of inlet runoff, large-scale reclamation of mudflats, construction of sea enclosures, port construction, and fragmentation of estuarine habitat. These influences have resulted in significant changes in the community structures of fishery resources, in addition to their replenishment [13]. In terms of habitat type, small pelagic fish like K. punctatus and E. japonicus, as well as reef fish like S. sihama and low−value demersal fish like Gobiidae fish, dominate the Yellow River estuary waters. In contrast, the eggs and larvae of the primary economic species that spawned in the estuary waters in the 1960s, such as Stromateoides argenteus, Trichiurus haumela, Larimichthys polyactis, and Ilisha elongate, were entirely absent. This is despite the fact that the latter three are major economic fish of the Yellow River estuary. Eggs and larvae of Coilia mystus and Paralichthys olivaceus were harvested in this study, but only comprised very small numbers. For example, only one egg of C. mystus was collected at station A3, one larva of C. mystus was collected at station A2 in 2011, and five eggs of P. olivaceus were collected at station E3.
The absence of these economic species and significant declines in their numbers are partly due to the waters of the Yellow River having undergone a major change from a period with replete fish and shrimp resources that coincides with over 30 years of predatory exploitation [13,40]. Moreover, the compositions of fish communities in the area have considerably changed, leading to corresponding changes in supplementary egg and larvae fish resources. Furthermore, some of the spawning parents of economic species require spawning grounds with lower salinity, although low−salinity water areas in the Bohai and Laizhou Bays have shrunk and salinity has significantly increased in recent decades due to reduced Yellow River runoff into the sea. Indeed, a survey of the Bohai Sea from 1978 to 2008 revealed that the salinity of seawater in the central Bohai Sea has increased by 1.262−fold over 31 years [20,46]. Thus, the waters have become unfavorable for species that depend on low−salt water for reproduction, like I. elongate and T. haumela, or for the many species that require low−salinity waters as shelter for young juveniles.
5. Conclusions
(1) Surveys of this study revealed that 2540 eggs and 143 larvae were collected from four voyages, comprising a total of 25 species. Eggs and larvae from the Yellow River estuary primarily comprised warm-temperate species, followed by warm-water species, and to a lesser extent, cold-temperate species, consistent with being a warm temperate zone region.
(2) The primary species observed in the Yellow River estuary were small pelagic fish such as K. punctatus and E. japonicus, in addition to rocky reef fish like S. sihama and low-value demersal fish like Gobiidae fish. The number of high economic value species that were harvested was very small, while S. argenteus, T. shaumela, and L. polyactis were not observed, likely due to overfishing and decreased low salinity waters present in the Bohai Sea in recent years.
(3) The biodiversity of fish eggs and larvae in the waters near the Yellow River estuary were altered by changing environmental conditions such as sediment inflow and runoff of the Yellow River, leading to diversity index values that fluctuated every year.
Author Contributions
Conceptualization, F.L. and Y.Y.; drew the Figure, F.L. and M.Z.; methodology, F.L., B.S. and B.W.; formal analysis, F.L., W.C. and Y.Y.; investigation, F.L. and B.W; data curation, F.L. and Y.Y.; writing–original draft preparation, F.L. and Y.Y.; writing–review and editing, F.L., Y.Y. and B.W.; visualization, F.L. and Y.Y.; supervision, F.L. and Y.Y.; project administration, F.L. and B.W.; funding acquisition, F.L. and Y.Y. All authors have read and agreed to the published version of the manuscript.
Funding
This research was funded by the Natural Science Foundation of Shandong Province (ZR2020KE050), the Yantai Science and Technology Innovation Development Program (2021XDHZ053, 2020MSGY056 and 2020MSGY061), and Science and Technology Innovation Program of the Laoshan Laboratory (LSKJ202203800).
Data Availability Statement
Data are not available due to non-disclosure agreements.
Conflicts of Interest
The authors declare no conflict of interest.
References
- Zhuang, P.; Wang, Y.H.; Li, S.F.; Deng, S.M.; Li, C.S.; Ni, Y. Fishes of the Yangtze Estuary; Shanghai Scientific and Technical Publishers: Shanghai, China, 2006. [Google Scholar]
- Wingard, G.L.; Lorenz, J.J. Integrated conceptual ecological model and habitat indices for the southwest Florida coastal wetlands. Ecol. Ind. 2014, 44, 92–107. [Google Scholar] [CrossRef]
- Luo, B.Z. Estuarine Ecology and Environment before Impoundment of the Three Gorges Project; Ocean Press: Beijing, China, 2015. [Google Scholar]
- Strokal, M.; Kroeze, C.; Li, L.L.; Luan, S.J.; Wang, H.Z.; Yang, S.S.; Zhang, Y.S. Increasing dissolved nitrogen and phosphorus export by the Pearl River (Zhujiang): A modeling approach at the sub-basin scale to assess effective nutrient management. Biogeochemistry 2015, 125, 221–242. [Google Scholar] [CrossRef] [Green Version]
- Roubeix, V.; Rousseau, V.; Lancelot, C. Diatom succession and silicon removal from freshwater in estuarine mixing zones: From experiment to modelling. Estuar. Coast Shelf Sci. 2008, 78, 14–26. [Google Scholar] [CrossRef]
- Shan, X.J.; Sun, P.F.; Jin, X.S.; Li, X.S.; Dai, F.Q. Long-term changes in fish assemblage structure in the Yellow River Estuary ecosystem. Mar. Coast. Fish. 2013, 5, 65–78. [Google Scholar] [CrossRef]
- Berasategui, A.D.; Acha, E.M.; Araoz, F.N.C. Spatial patterns of ichthyoplankton assemblages in the Río de la Plata Estuary (Argentina–Uruguay). Estuar. Coast. Shelf Sci. 2004, 60, 599–610. [Google Scholar] [CrossRef]
- Hou, G.; Wang, J.R.; Liu, L.M.; Chen, Y.Y.; Pan, C.H.; Li, J.B.; Zhang, H. Assemblage Structure of the ichthyoplankton and its Relationship with environmental factors in spring and autumn off the Pearl River estuary. Front. Mar. Sci. 2021, 8, 732970. [Google Scholar] [CrossRef]
- Wan, R.J.; Zhou, F.; Shan, X.J.; Sun, S. Impacts of variability of habitat factors on species composition of ichthyoplankton and distribution of fish spawning ground in the Changjiang River estuary and its adjacent waters. Acta Ecol. Sin. 2010, 30, 155–165. [Google Scholar]
- Hernandez, F.J., Jr.; Powers, S.P.; Graham, W.M. Seasonal variability in ichthyoplankton abundance and assemblage composition in the northern Gulf of Mexico off Alabama. Fish. Bull. 2010, 108, 192–206. [Google Scholar]
- Bertone, E.; Sahin, O.; Richards, R.; Roiko, A. Extreme events, water quality and health a participatory Bayesian risk assessment tool for managers of reservoirs. J. Clean. Prod. 2016, 135, 657–667. [Google Scholar] [CrossRef] [Green Version]
- Chambers, R.C. Environmental influences on egg and propagule sizes in marine fishes. In Early Life History and Recruitment in Fish Populations; Chambers, R.C., Trippel, E.A., Eds.; Chapman & Hall: London, UK, 1997. [Google Scholar]
- Bian, X.D.; Zhang, X.M.; Gao, T.X.; Wan, R.J.; Zhang, P.D. Category composition and distributional patterns of ichthyoplankton in the Yellow River estuary during spring and summer 2007. J. Fish Sci. Chin. 2010, 17, 815–827. [Google Scholar]
- Deng, J.Y.; Jin, X.S. Study on fishery biodiversity and its conservation in Laizhou Bay and Yellow River Estuary. Zool. Res. 2000, 21, 76–82. [Google Scholar]
- Jin, X.S.; Deng, J.Y. Variations in community structure of fishery resources and biodiversity in the Laizhou Bay, Shandong. Biodivers. Sci. 2000, 8, 65–72. [Google Scholar]
- Shabanzadeh-Khoshrody, M.; Azadi, H.; Khajooeipour, A.; Nabavi-Pelesaraei, A. Analytical investigation of the effects of dam construction on the productivity and efficiency of farmers. J. Clean. Prod. 2016, 135, 549–557. [Google Scholar] [CrossRef]
- Wu, H.P.; Chen, J.; Xu, J.J.; Zeng, G.M.; Sang, L.H.; Liu, Q.; Yin, Z.J.; Dai, J.; Yin, D.; Liang, J. Effects of dam construction on biodiversity: A review. J. Clean. Prod. 2019, 221, 480–489. [Google Scholar] [CrossRef]
- Yang, J.M.; Li, J. Progress of Chinese marine ichthyology in the last 15 years. Stud. Mar. Sin. 1995, 36, 297–310. [Google Scholar]
- Zhu, X.H.; Miao, F.; Liu, D.; Xian, W.W. Spatiotemporal pattern and dominant component of fish community in the Yellow River estuary and its adjacent waters. Stud. Mar. Sin. 2001, 43, 141–151. [Google Scholar]
- Jiao, Y.M.; Zhang, X.H.; Li, H.X. Influence on fish diversity in the sea area off the Huanghe River estuary by the cutoff of water supply. Trans. Oceanol. Limnol. 1998, 4, 48–53. [Google Scholar]
- Muneo, O. An Atlas of the Early Stage Fishes in Japan; Tokai University Press: Tokyo, Japan, 1988. [Google Scholar]
- Zhao, C.Y.; Zhang, R.Z. Fish Eggs and Larvae in the Coastal Waters of China; Shanghai Scientific & Technical Publishers: Shanghai, China, 1985. [Google Scholar]
- Pianka, E.R. Ecology of the agamid lizard Amphibolurus isolepis in Western Australia. Copeia 1971, 3, 527–536. [Google Scholar] [CrossRef]
- Margalef, R. Information theory in ecology. Gen. System. 1958, 3, 36–71. [Google Scholar]
- Wilhm, J.L. Use of biomass units in Shannon’s formula. Ecology 1968, 49, 153–156. [Google Scholar] [CrossRef]
- Pielou, E.C. Ecological Diversity; Wiley: New York, NY, USA, 1975. [Google Scholar]
- Lepš, J.; Šmilauer, P. Multivariate Analysis of Ecological Data Using CANOCO; Cambridge University Press: Cambridge, UK, 2003. [Google Scholar]
- Tian, M.C.; Sun, B.L.; Yang, J.M. Analysis of the fish fauna of the Bohai Sea. Stud. Mar. Sin. 1993, 34, 157–167. [Google Scholar]
- Liu, J.; Ning, P. Species composition and faunal characteristics of fishes in the Yellow Sea. Biodivers. Sci. 2011, 19, 764–769. [Google Scholar]
- Bauchot, M.L.; Pras, A. Guia de Los Peces de Mar de Espafiay de Europa; Ediciones Omega: Bracelona, Spain, 1987. [Google Scholar]
- Zhang, C.N.; Wang, J.; Zhou, A.H.; Ye, Q.; Feng, Y.Y.; Wang, Z.L.; Wang, S.D.; Xu, G.H.; Zou, J.X. Species-specific effect of microplastics on fish embryos and observation of toxicity kinetics in larvae. J. Hazard. Mater. 2021, 403, 123948. [Google Scholar] [CrossRef] [PubMed]
- Shapiro, D.Y.; Hensley, D.A.; Appeldoorn, R.S. Pelagic spawning and egg transport in coral-reef fishes: A skeptical overview. Environ. Biol. Fish. 1988, 22, 3–14. [Google Scholar] [CrossRef]
- Downie, A.T.; Llling, B.; Faria, A.M.; Rummer, J.L. Swimming performance of marine fish larvae: Review of a universal trait under ecological and environmental pressure. Rev. Fish Biol. Fish. 2020, 30, 93–108. [Google Scholar] [CrossRef]
- Formicki, K.; Korzelecka-Orkisz, A.; Tański, A. The effect of an anthropogenic magnetic field on the early developmental stages of fishes—A review. Int. J. Mol. Sci. 2021, 22, 1210. [Google Scholar] [CrossRef] [PubMed]
- Amini Chermahini, M.; Shabani, A.; Naddafi, R.; Ghorbani, R.; Rabbaniha, M.; Noorinejad, M. Diversity, distribution, and abundance patterns of ichthyoplankton assemblages in some inlets of the northern Persian Gulf. J. Sea Res. 2021, 167, 101981. [Google Scholar] [CrossRef]
- Castillo-Rivera, M.; Zavala-Hurtado, J.A. Exploration of spatial and temporal patterns of fish diversity and composition in a tropical estuarine system of Mexico. Rev. Fish Boil. Fish. 2002, 12, 167–177. [Google Scholar] [CrossRef]
- Huang, D.J.; Su, J.L. The effects of the Huanghe River Delta on the circulation and transportation of larvae. Haiyang Xuebao 2002, 24, 104–111. [Google Scholar]
- Jjiang, M.; Shen, X.Q.; Wang, Y.L.; Yuan, Q.; Chen, L.F. Species of fish eggs and larvae and distribution in Changjiang Estuary and vicinity waters. Haiyang Xuebao 2006, 28, 171–174. [Google Scholar]
- Azeiteiro, U.M.; Bacelar-Nicolau, L.; Resende, P.; Goncalves, F.; Pereira, M.J. Larval fish distribution in shallow coastal waters off North Western Iberia (NE Atlantic). Estuar. Coast Shelf Sci. 2006, 69, 554–566. [Google Scholar] [CrossRef] [Green Version]
- Shan, X.J.; Jin, X.S. Diversity of fish community structure in the spring-time offshore waters at the Yangtze river estuary. Oceanol. Et Limngia Sin. 2011, 42, 32–40. [Google Scholar]
- Zhao, M.M.; Xu, Z.L. Species composition, temporal and spatial distributions and diversity of hoplocarida and decapods shrimps in summer and winter in Sanmen Bay. Chin. J. Zool. 2012, 46, 11–18. [Google Scholar]
- Yang, Y.Y.; Zhu, M.M.; Xu, B.Q.; Li, F.; Gao, Y.J.; Sun, C.X.; Wei, X.; Wang, B. Seasonal variation of community structure and diversity of ichthyoplankton in the Laizhou Bay. Haiyang Xuebao 2021, 43, 59–70. [Google Scholar]
- Connell, J.H. Diversity in tropical rainforests and coral reefs. Science 1978, 199, 1302–1310. [Google Scholar] [CrossRef] [Green Version]
- Sanders, H.L. Marine benthic diversity: A comparative study. Am. Nat. 1968, 102, 243–282. [Google Scholar] [CrossRef]
- Zhai, L.; Xu, B.D.; Ji, Y.P.; Ren, Y.P. Spatial pattern of fish assemblage and the relationship with environmental factors in Yellow River Estuary and its adjacent waters in summer. Chin. J. Appl. Ecol. 2015, 26, 2852–2858. [Google Scholar]
- Liu, F.; Chen, S.L.; Peng, J.; Chen, G.Q. Multi-scale variability of flow discharge and sediment load of Yellow River to sea and its impacts on the Estuary during the past 60 years. Acta Geogr. Sin. 2011, 3, 313–323. [Google Scholar]
Figure 1.
Sampling sites in the Yellow River estuary. (A): Location of the Yellow River and the Bohai Sea. (B): Study area and sampling sites for the summer surveys from 2011 to 2014. ABCDE in B panel represent the station numbers, and the number behind the station number represents the distance from the sea entrance.

Figure 2.
Interannual variation of freshwater discharge and sediment load at Lijin station.

Figure 3.
Changes in environmental factors in the Yellow River estuary waters from 2011 to 2014 (A1–F4).
Figure 3.
Changes in environmental factors in the Yellow River estuary waters from 2011 to 2014 (A1–F4).


Figure 4.
Spatial distribution of fish eggs collected in this study. (A1–A4), Fish egg abundances. (B1–B4), Fish egg communities.
Figure 4.
Spatial distribution of fish eggs collected in this study. (A1–A4), Fish egg abundances. (B1–B4), Fish egg communities.

Figure 5.
Spatial distribution of larvae collected in this study. (A1–A4), Larval abundances. (B1–B4), Larval communities.
Figure 5.
Spatial distribution of larvae collected in this study. (A1–A4), Larval abundances. (B1–B4), Larval communities.

Figure 6.
Cluster analysis of community structures of fish eggs and larvae in the Yellow River estuary across seasons.
Figure 6.
Cluster analysis of community structures of fish eggs and larvae in the Yellow River estuary across seasons.

Figure 7.
Species diversity index values of fish eggs and larvae collected from the Yellow River estuary in this study. a, b: the significant difference between groups.
Figure 7.
Species diversity index values of fish eggs and larvae collected from the Yellow River estuary in this study. a, b: the significant difference between groups.

Figure 8.
Pearson correlation matrix showing comparisons of the diversity of fish eggs, larvae, and environmental factors. *: p < 0.05, ***: p < 0.001. Histogram shows the frequency distribution of factors, black circles indicate bivariate plots, and red lines indicates smoothing curves for bivariate plots. SST = sea surface temperature, SSS = sea surface salinity, DEP = depth, DO = dissolved oxygen, Chl–a = chlorophyll–a, SPM = suspended particle matter, pH = acidity.

Figure 9.
CCA ranking of the main species of fish eggs and larvae with environmental factors. SST = sea surface temperature, SSS = sea surface salinity, DEP = depth, DO = dissolved oxygen, Chl–a = chlorophyll–a, SPM = suspended particle matter, pH = acidity.
Figure 9.
CCA ranking of the main species of fish eggs and larvae with environmental factors. SST = sea surface temperature, SSS = sea surface salinity, DEP = depth, DO = dissolved oxygen, Chl–a = chlorophyll–a, SPM = suspended particle matter, pH = acidity.


Table 1.
Composition of environmental factors in the Yellow River estuary.
| Parameters | Range and Mean Values (±sd) | 2011 | 2012 | 2013 | 2014 |
|---|---|---|---|---|---|
| SST (°C) | Range | 19.20–24.00 | 19.00–23.80 | 15.74–20.08 | 19.16–22.97 |
| mean values (±sd) | 21.05 ± 1.52 | 21.14 ± 1.54 | 17.80 ± 1.05 | 20.49 ± 1.08 | |
| SSS‰ | Range | 29.70–30.17 | 16.28–30.36 | 12.65–28.56 | 28.21–30.44 |
| mean values (±sd) | 29.93 ± 0.16 | 26.82 ± 3.88 | 26.97 ± 3.69 | 29.12 ± 0.61 | |
| Chl-a µg/L | Range | 1.93–9.49 | 1.14–6.92 | 2.15–6.83 | 0.67–3.83 |
| mean values (±sd) | 4.42 ± 2.58 | 3.49 ± 1.50 | 3.95 ± 1.54 | 2.48 ± 0.83 | |
| SPM (mg/L) | Range | 5.60–13.10 | 10.30–15.80 | 5.4–23.40 | 17.0–68.80 |
| mean values (±sd) | 8.96 ± 2.06 | 13.16 ± 1.81 | 13.65 ± 5.44 | 25.18 ± 11.99 | |
| pH | Range | 8.22–9.26 | 7.85–8.50 | 8.02–8.56 | 7.97–8.14 |
| mean values (±sd) | 8.48 ± 0.28 | 8.15 ± 0.17 | 8.27 ± 0.16 | 8.05 ± 0.06 | |
| DO (mg/L) | Range | 7.44–11.73 | 7.19–11.42 | 7.73–10.08 | 8.18–9.05 |
| mean values (±sd) | 8.73 ± 1.05 | 8.93 ± 1.23 | 8.32 ± 0.57 | 8.61 ± 0.30 |
Table 2.
Species of fish eggs and larvae in the Yellow River estuary.
| Family | Species | Developmental Stage | Ecological Type | Letter Number | |||
|---|---|---|---|---|---|---|---|
| Eggs | Larvae | Temperature Suitability | Type of Migration | Habitat Type | |||
| Clupeidae | Konosiruspunctatus | + | + | WT | MM | CPN | E |
| Sardinella zunasi | + | WT | MM | CPN | K | ||
| Engraulidae | Engraulis japonicus | + | + | WT | MM | CPN | D |
| Coilia mystus | + | + | WT | AM | CPN | J | |
| Thryssa kammalensis | + | WW | MM | CPN | H | ||
| Thrissa mystax | + | + | WW | MM | CPN | G | |
| Synodidae | Saurida elongata | + | WT | MS | CD | B | |
| Mugilidae | Liza haematocheilus | + | + | WT | ES | CPN | I |
| Serranidae | Lateolabraxjaponicus | + | WT | ES | CRA | M | |
| Sciaenidae | Johnius belengerii | + | WW | MM | CBD | W | |
| Atherinidae | Allanetta bleekeri | + | WW | MM | CPN | S | |
| Hemiramphidae | Hyporhamphus sajori | + | WT | ES | CPN | U | |
| Sillaginidae | Sillago sihama | + | WW | MM | CRA | C | |
| Trichiuridae | Eupleurogrammus muticus | + | + | WT | ES | CBD | A |
| Cynoglossidae | Cynoglossus joyneri | + | CT | ES | CD | N | |
| Pleuronectidae | Tanakius kitaharae | + | CT | MM | CD | Q | |
| Paralichthyidae | Paralichthys olivaceus | + | WT | MM | CD | R | |
| Syngnathidae | Syngnathus acus | + | WT | MM | CD | O | |
| Hippocampus coronatus | + | WT | MM | CD | Y | ||
| Salangidae | Protosalanx hyalocranius | + | WT | AM | CPN | v | |
| Gobiidae | Acentrogobius pflaumii | + | WT | ES | CD | X | |
| Amblychaeturichthys hexanema | + | WT | ES | CD | P | ||
| Chaeturichthys stigmatias | + | WT | ES | CD | T | ||
| Gobiidae sp. | + | L | |||||
| Unidentified species | + | F | |||||
Notes: CD: Continental shelf fish; CBD: Continental shelf benthopelagic fish; CPN: Continental shelf pelagic-neritic fish; CRA: Continental shelf reef-associated fish; WT: warm-temperate species; WW: warm-water species; CT: cold-temperate species. MS: marine stragglers fish; ES: estuarine sedentary fish; MM: marine migratory fish; CA: catadromous fish; AM: anadromous migratory fish.
Table 3.
Variation in the abundances of fish eggs and larvae.
| Year | Number of Fish Eggs (inds) | Species of Fish Eggs (kinds) | Number of Larvae (inds) | Species of Larvae (kinds) |
|---|---|---|---|---|
| 2011 | 270 (9.31 ± 27.25) | 7 | 37 (1.28 ± 3.15) | 5 |
| 2012 | 608 (25.33 ± 52.51) | 3 | 11 (0.46 ± 1.22) | 2 |
| 2013 | 1082 (28.47 ± 145.38) | 5 | 73 (1.85 ± 2.79) | 4 |
| 2014 | 580 (13.81 ± 27.92) | 6 | 22 (0.52 ± 1.29) | 5 |
Disclaimer/Publisher’s Note: The statements, opinions and data contained in all publications are solely those of the individual author(s) and contributor(s) and not of MDPI and/or the editor(s). MDPI and/or the editor(s) disclaim responsibility for any injury to people or property resulting from any ideas, methods, instructions or products referred to in the content. |
© 2023 by the authors. Licensee MDPI, Basel, Switzerland. This article is an open access article distributed under the terms and conditions of the Creative Commons Attribution (CC BY) license (https://creativecommons.org/licenses/by/4.0/).
Share and Cite
MDPI and ACS Style
Li, F.; Zhu, M.; Chen, W.; Su, B.; Yang, Y.; Wang, B. Interannual Variation of Ichthyoplankton Community Structure in the Yellow River Estuary, China. Water 2023, 15, 1040. https://doi.org/10.3390/w15061040
AMA Style
Li F, Zhu M, Chen W, Su B, Yang Y, Wang B. Interannual Variation of Ichthyoplankton Community Structure in the Yellow River Estuary, China. Water. 2023; 15(6):1040. https://doi.org/10.3390/w15061040
Chicago/Turabian StyleLi, Fan, Mingming Zhu, Wei Chen, Bo Su, Yanyan Yang, and Bin Wang. 2023. "Interannual Variation of Ichthyoplankton Community Structure in the Yellow River Estuary, China" Water 15, no. 6: 1040. https://doi.org/10.3390/w15061040
Note that from the first issue of 2016, this journal uses article numbers instead of page numbers. See further details here.