
Ocean Recreation and the Economic Contributions of Visitation in and around Gray’s Reef National Marine Sanctuary

School of Natural Resources, West Virginia University, Morgantown, WV 26506, USA
*
Author to whom correspondence should be addressed.
Water 2023, 15(6), 1054; https://doi.org/10.3390/w15061054
Submission received: 8 February 2023
/
Revised: 1 March 2023
/
Accepted: 7 March 2023
/
Published: 10 March 2023
(This article belongs to the Special Issue The Blue Economy: Evaluating the Human Benefits from and Pressures on Marine and Coastal Environments, Volume II)
Abstract
:Providing demonstrable and quantifiable evidence to substantiate the value of Marine Protected Areas like National Marine Sanctuaries is important for understanding their role in the blue economy, as well as gaining management and financial support for their protection. This study employs economic contribution analysis to estimate the economic contributions of ocean recreation spending of visitors to Gray’s Reef National Marine Sanctuary (GRNMS) and the coastal Georgia region. Employing economic contribution analysis is found to be more useful in influencing stakeholder decisions, and can therefore be a useful tool in providing inputs for management decisions related to marine protected areas. This study shows that visitors to coastal Georgia spent about USD 1.4 billion on ocean recreation activities in a single year. This translates to a total economic contribution of 18,950 jobs, USD 603 million labor income, USD 938 million value added, and USD 1.8 billion output. About USD 123 million of the total visitor spending can be attributed to GRNMS, contributing 1702 total jobs, USD 54 million in total labor income, USD 84 million in total value added, and USD 159 million in total output. This study highlights the importance of coastal Georgia and GRNMS as economic drivers of the region’s economy, supporting the need for continued management and investment in the Sanctuary and its resources.
1. Introduction
Marine sanctuaries are a type of Marine Protected Area (MPA) designated with the intent of balancing human activities with environmental concerns [1]. MPAs are globally important management tools that provide protection from the effects of human exploitation [2]. Limitations on human activities are placed on these areas because of their ecological, cultural, and economic significance. The regulation of activities is dictated by the marine protection legislation of the country where the sanctuary is located. For example, in the United States (US), the National Marine Sanctuaries Act is the enabling federal legislation that protects marine sanctuaries in the country. This legislation “authorizes the Secretary of Commerce to designate and protect areas of the marine environment with special national significance due to their conservation, recreational, ecological, historical, scientific, cultural, archeological, educational, or esthetic qualities as national marine sanctuaries” [3]. The entire network protected by this legislation contains 15 marine sanctuaries and two marine monuments across the country, which cover over 600,000 square miles of marine and Great Lake aquatic habitats. These areas are also protected because of their role in the blue economy, specifically in promoting economic development in local economies, particularly from fisheries and tourism. For example, in the US the country’s blue economy is worth nearly USD 373 billion [4], and in Canada about USD 30 billion a year is generated from ocean-dependent industries [5]. In addition to direct economic benefits, marine sanctuaries also provide indirect economic benefits that stem from ecosystem services such as carbon sequestration, water quality, aesthetics and spiritual values.
Management and policies focusing on the environment (e.g., green innovations) have been proven beneficial to local communities as well as to the financial performance of organizations. For example, improving nature conservation tax laws (e.g., green tax incentives), promoting green investment, and implementing environmentally friendly policies can help reduce environmental deterioration and promote sustainable development goals [6,7]. In addition, companies investing in green programs will not only mitigate environmental problems but will also help to generate perpetual returns [8]. Similarly, investing in protecting MPAs can be beneficial to the economic performance of local communities and the blue economy in general. In order to sustain and grow the contribution of marine sanctuaries to the blue economy, there is a need for continued commitment to the protection of these resources because the benefit to local economies is highly dependent on the health of these sanctuaries. Effective management fueled by adequate financing is essential [9]; however, insufficient funding for management activities and the expansion of MPAs such as marine sanctuaries remain a challenge. Both the public and the private sector will need to invest considerably to make the management of these areas effective, which is an idea often debated. Therefore, the need exists to better understand the economic value of marine sanctuaries to justify the considerable investments needed to protect these resources. Measuring the economic contribution of MPAs to connected local economies more comprehensively helps to ensure sufficient funding, so operations and management can be secured [10].
“Economic studies can contribute to the debate about MPAs as a management option by evaluating their benefits and costs to society” [9]. There are different approaches in evaluating the value of marine sanctuaries, such as cost–benefit analysis, economic impact/contribution analysis, cost effectiveness analysis, and natural resource damage assessment. The choice of a method to use should align with the information that decision makers prioritize [11]. Several studies have estimated the cost of establishing MPAs. For example, the income required to achieve MPA management objectives has been estimated [12], as well as opportunity costs to fishing economies [13] and trade-offs to different sectors and local communities [14,15]. Other studies have focused on looking at both the benefits and costs of establishing or expanding MPAs. For example, the global costs and benefits of MPA expansion were estimated by Brander et al. [16]. Another study estimated the cost and benefits of protecting 30% of the world’s planet as MPAs [17]. An average annual investment of USD 140 billion in MPAs through 2030 could lead to USD 250 billion in increased economic output annually and USD 350 billion in improved ecosystem services annually compared to the status quo. While the global assessment of MPA benefits and costs is an important input for developing a global management approach to protecting these resources, country-level estimates are necessary to assess and seek appropriate funding [18]. A study in New Zealand’s Leigh Marine Reserve showed that species diversity in the area provided an ecotourism value of NZD 8 million [19]. Another study showed that residents of New Zealand’s Taputeranga and Kapiti Marine reserves were willing to pay NZD 22.50 and NZD 16.88 per household, respectively, for the management of these reserves [20]. Scuba divers in Mexico were willing to pay USD 5–USD 10 more per day to visit a dive site in the Loreto Bay National Park that had higher diversity coral reef species due to the site’s designation as a protected area [21]. The recreational and conservation value of coral reefs in Lingayen Gulf in the Philippines provides a net annual benefit of USD 4.7 million [22], while that of Malaysia’s Radang Island Marine Park provides a value of USD 1.32 million [23]. While most of these studies employ cost–benefit analysis, cost effectiveness analysis or resource damage assessment in estimating either the tangible (e.g., recreation and tourism) or ecosystem service values of MPAs, this study employs economic contribution analysis to illustrate the economic value of a marine sanctuary. Economic contribution is the gross change in economic activity associated with an industry, event or policy change [24]. For example, it tracks the gross economic activity linked with actions such as recreation in a marine sanctuary as dollars (e.g., from visitor spending) cycle through a region’s economy. This approach is particularly useful if the interest is determining the financial contribution to the local economy [25]. In addition, this tool is identified as influential for stakeholder and management decisions because it is more effective in communicating economic value, especially providing job contribution information. This is an important input in gaining support from investors [26] and the public alike.
Economic contributions in terms of jobs and revenue to local sites associated with MPAs are less well understood [26] because of the lack of studies employing this technique. While economic contribution analysis is useful in assessing the importance of MPAs, limited studies have employed this approach, particularly in marine sanctuaries. For example, this approach has been used in estimating the economic contributions of Canada’s marine sectors to its economy [27]. Specifically, marine sectors in Canada generated 298,333 jobs and contributed USD 36.1 billion in GDP to Canada’s economy. With regard to studies focusing on marine sanctuaries only, this approach has been employed in estimating the economic contribution of whale watching to the regional economies of the Hawaiian Islands Humpback Whale National Marine Sanctuary, Stellwagen Bank National Marine Sanctuary, and Channel Islands National Sanctuary [28,29,30]. The economic contribution of visitor spending on both land-based and water-based recreation has also been estimated for Florida Keys National Marine Sanctuary [31,32,33,34]. More recently, the visitation-derived economic contribution specifically focusing on ocean recreation alone was estimated for the same sanctuary [35]. The study shows that ocean recreation visitors in 2019 spent an estimated USD 1.7 billion on ocean recreation and tourism. This amount yields a contribution of 19,688 total jobs, USD 752 million for total labor income, USD 1.2 billion for total value added, and total output to the region valued at USD 2 billion. The present paper extends the previous study on another important marine sanctuary in the US—Gray’s Reef National Marine Sanctuary (GRNMS). While one study looked at the economic impact related to private boat recreational fishing in the area [36], no study currently exists that quantifies the overall economic value of the sanctuary for ocean recreation and tourism. While a relatively small sanctuary (57 km2), GRNMS has rich biodiversity that supports a number of recreational ventures [37] that have the potential to contribute to the economic development of the local economy.
This study addresses the magnitude of the contribution of Gray’s Reef National Marine Sanctuary (GRNMS) to the region’s economy from ocean recreation and tourism-related expenditures to understand its economic value to the region. Specific objectives are outlined and evaluated below:
- Identify expenditure trends for visitors related to ocean recreation and tourism activities in and around GRNMS.
- Estimate economic contributions in and around the local economy for visitation expenditures associated with ocean recreation activities in GRNMS.
Providing demonstrable and quantifiable evidence to substantiate the value of MPAs such as marine sanctuaries is important in engaging the support of stakeholders for effective resourcing in terms of manpower, finance and technology [38]. This is particularly important in gaining support for policies that protect these areas. It will allow policy makers and other stakeholders to determine the magnitude of financial support that should be allocated to these areas. Studies such as this not only help policy makers, practitioners, and funders better understand the value of protecting MPAs, but also the financial implications or the opportunity costs of ambitious protection commitments [18].
2. Materials and Methods
2.1. Study Area
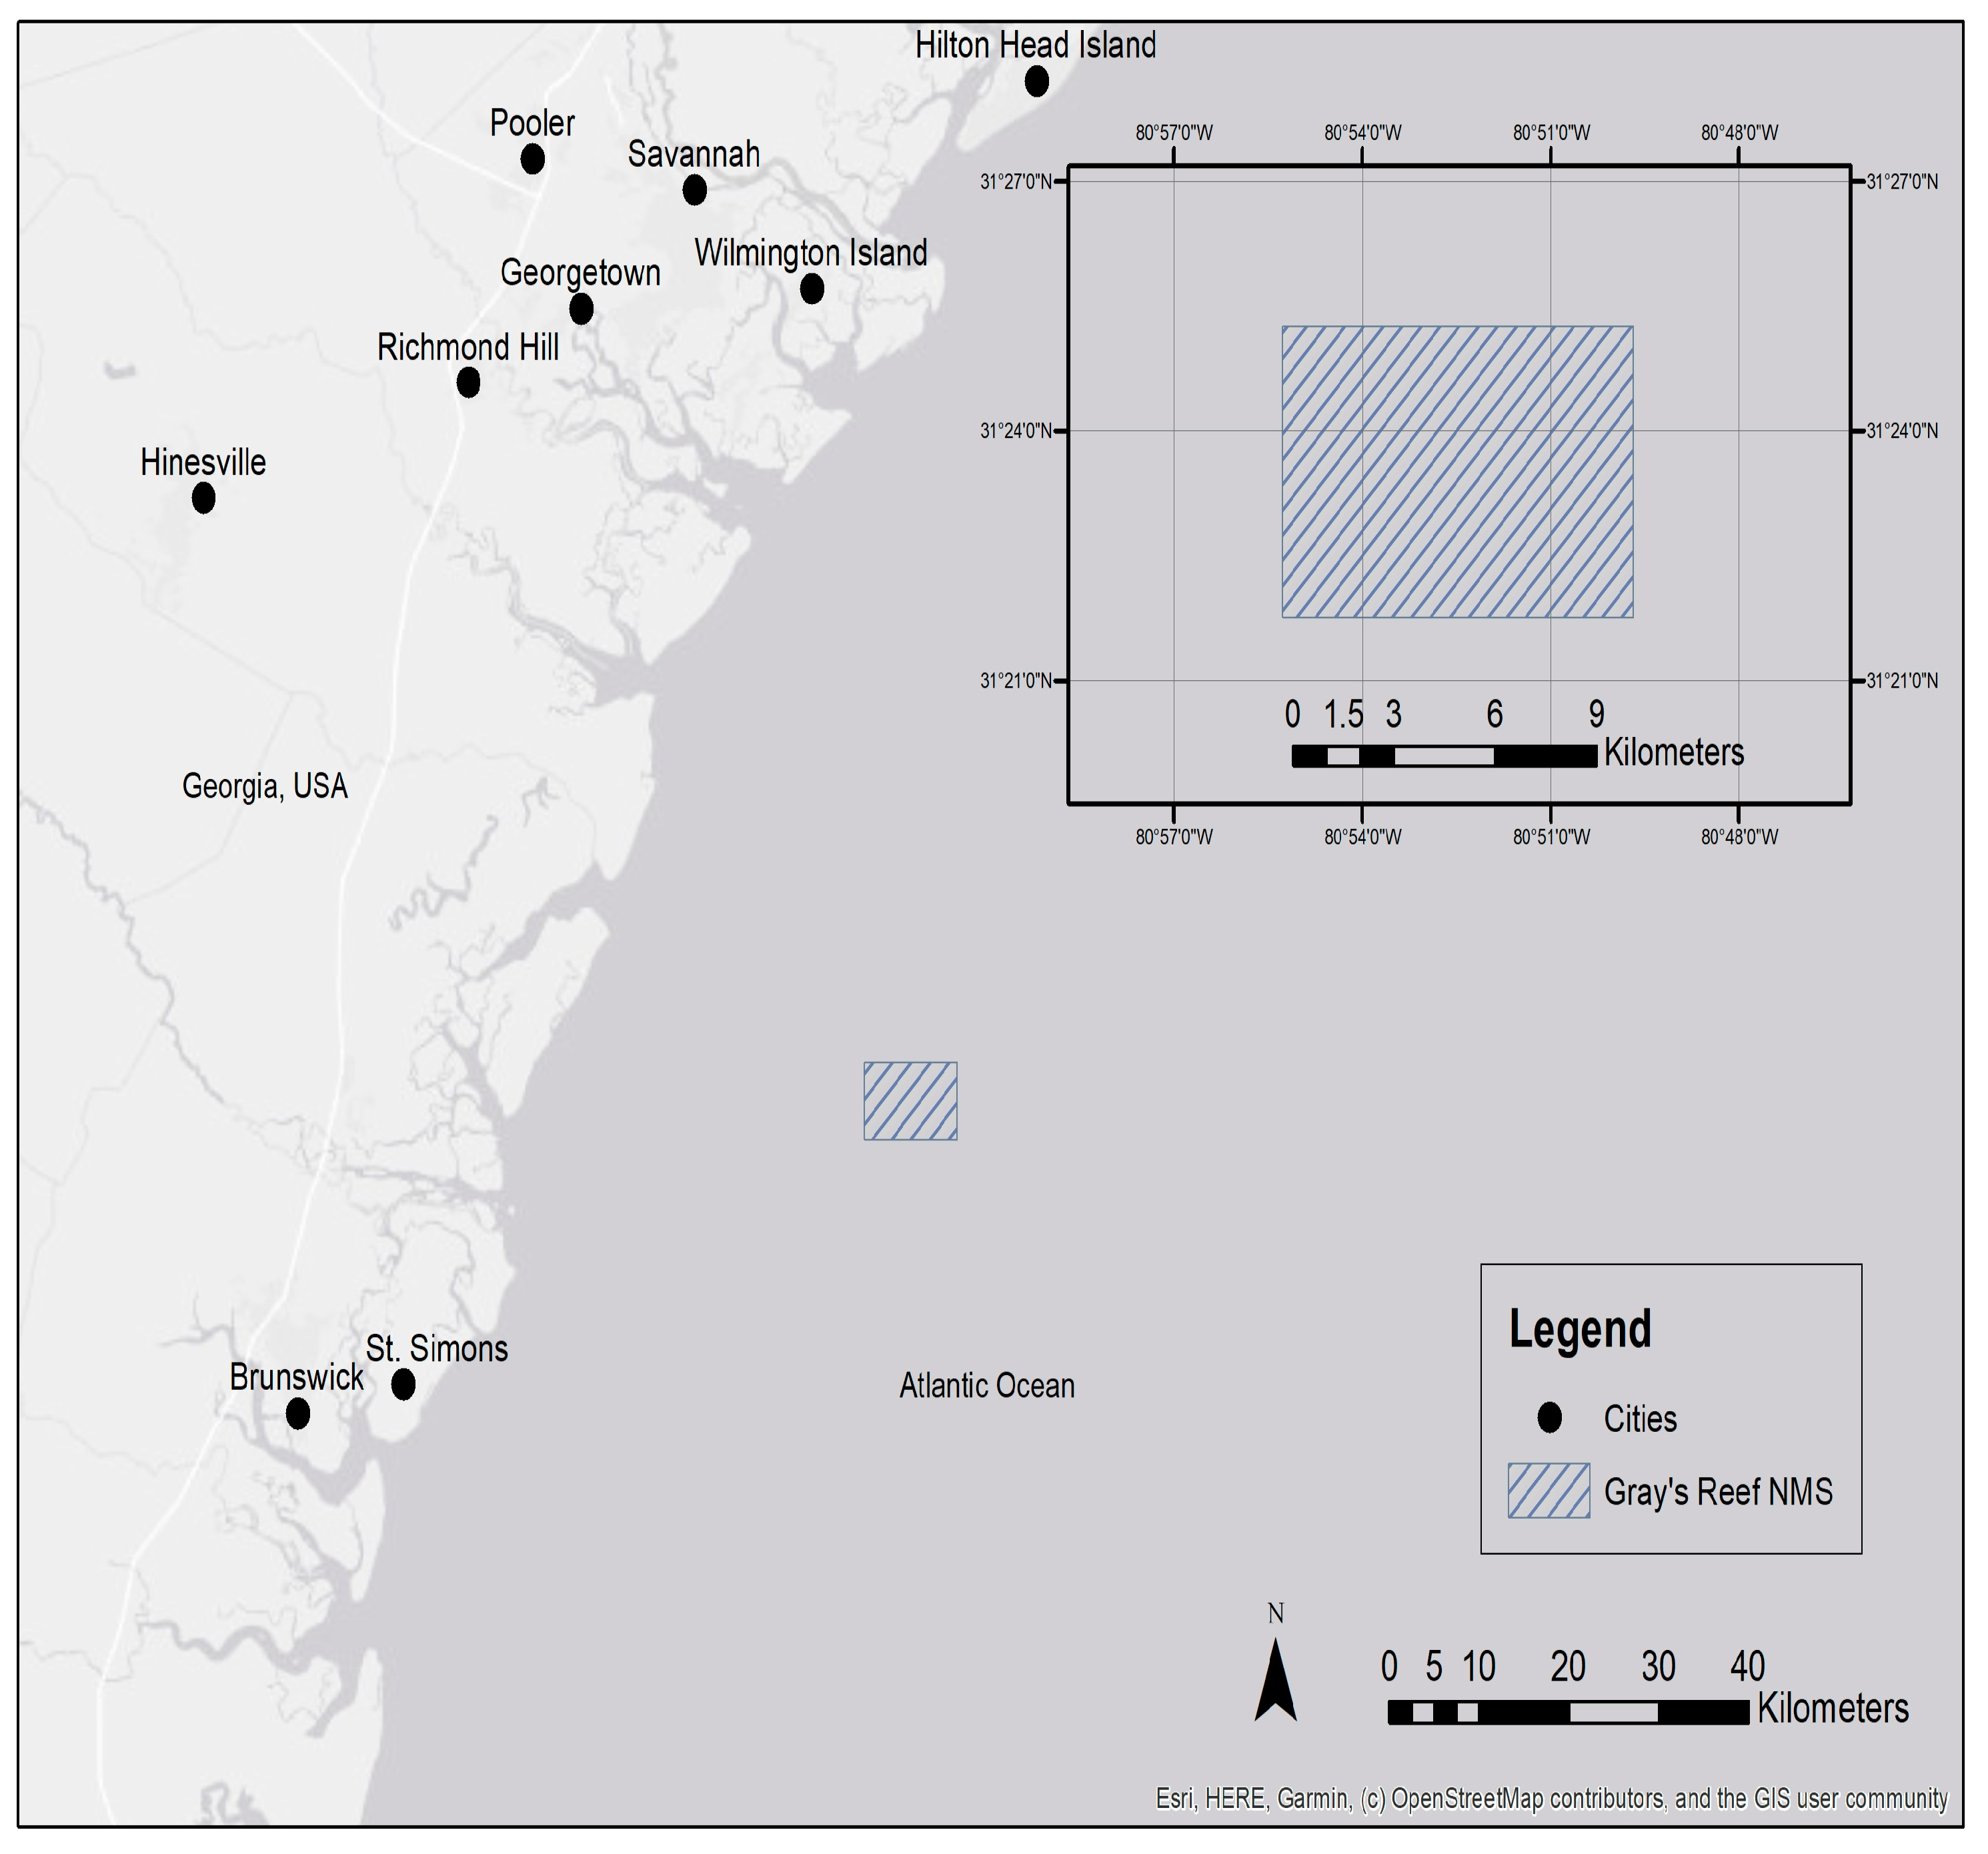
The study area is Gray’s Reef National Marine Sanctuary, which is one of the 15 national marine sanctuaries in the US. GRNMS is located off the coast of Georgia and is considered as one of the largest near-shore “live-bottom” reefs of the Southeastern US [39]. It is currently the only protected natural reef area on the continental shelf off the Georgia coast, and one of only a few natural MPAs between Cape Hatteras, NC and Cape Carnival, FL. It is only approximately 57 square kilometers in size and yet its value is recognized nationally and internationally as a natural marine habitat. Figure 1 shows the location of GRNMS.
2.2. Economic Contribution Analysis
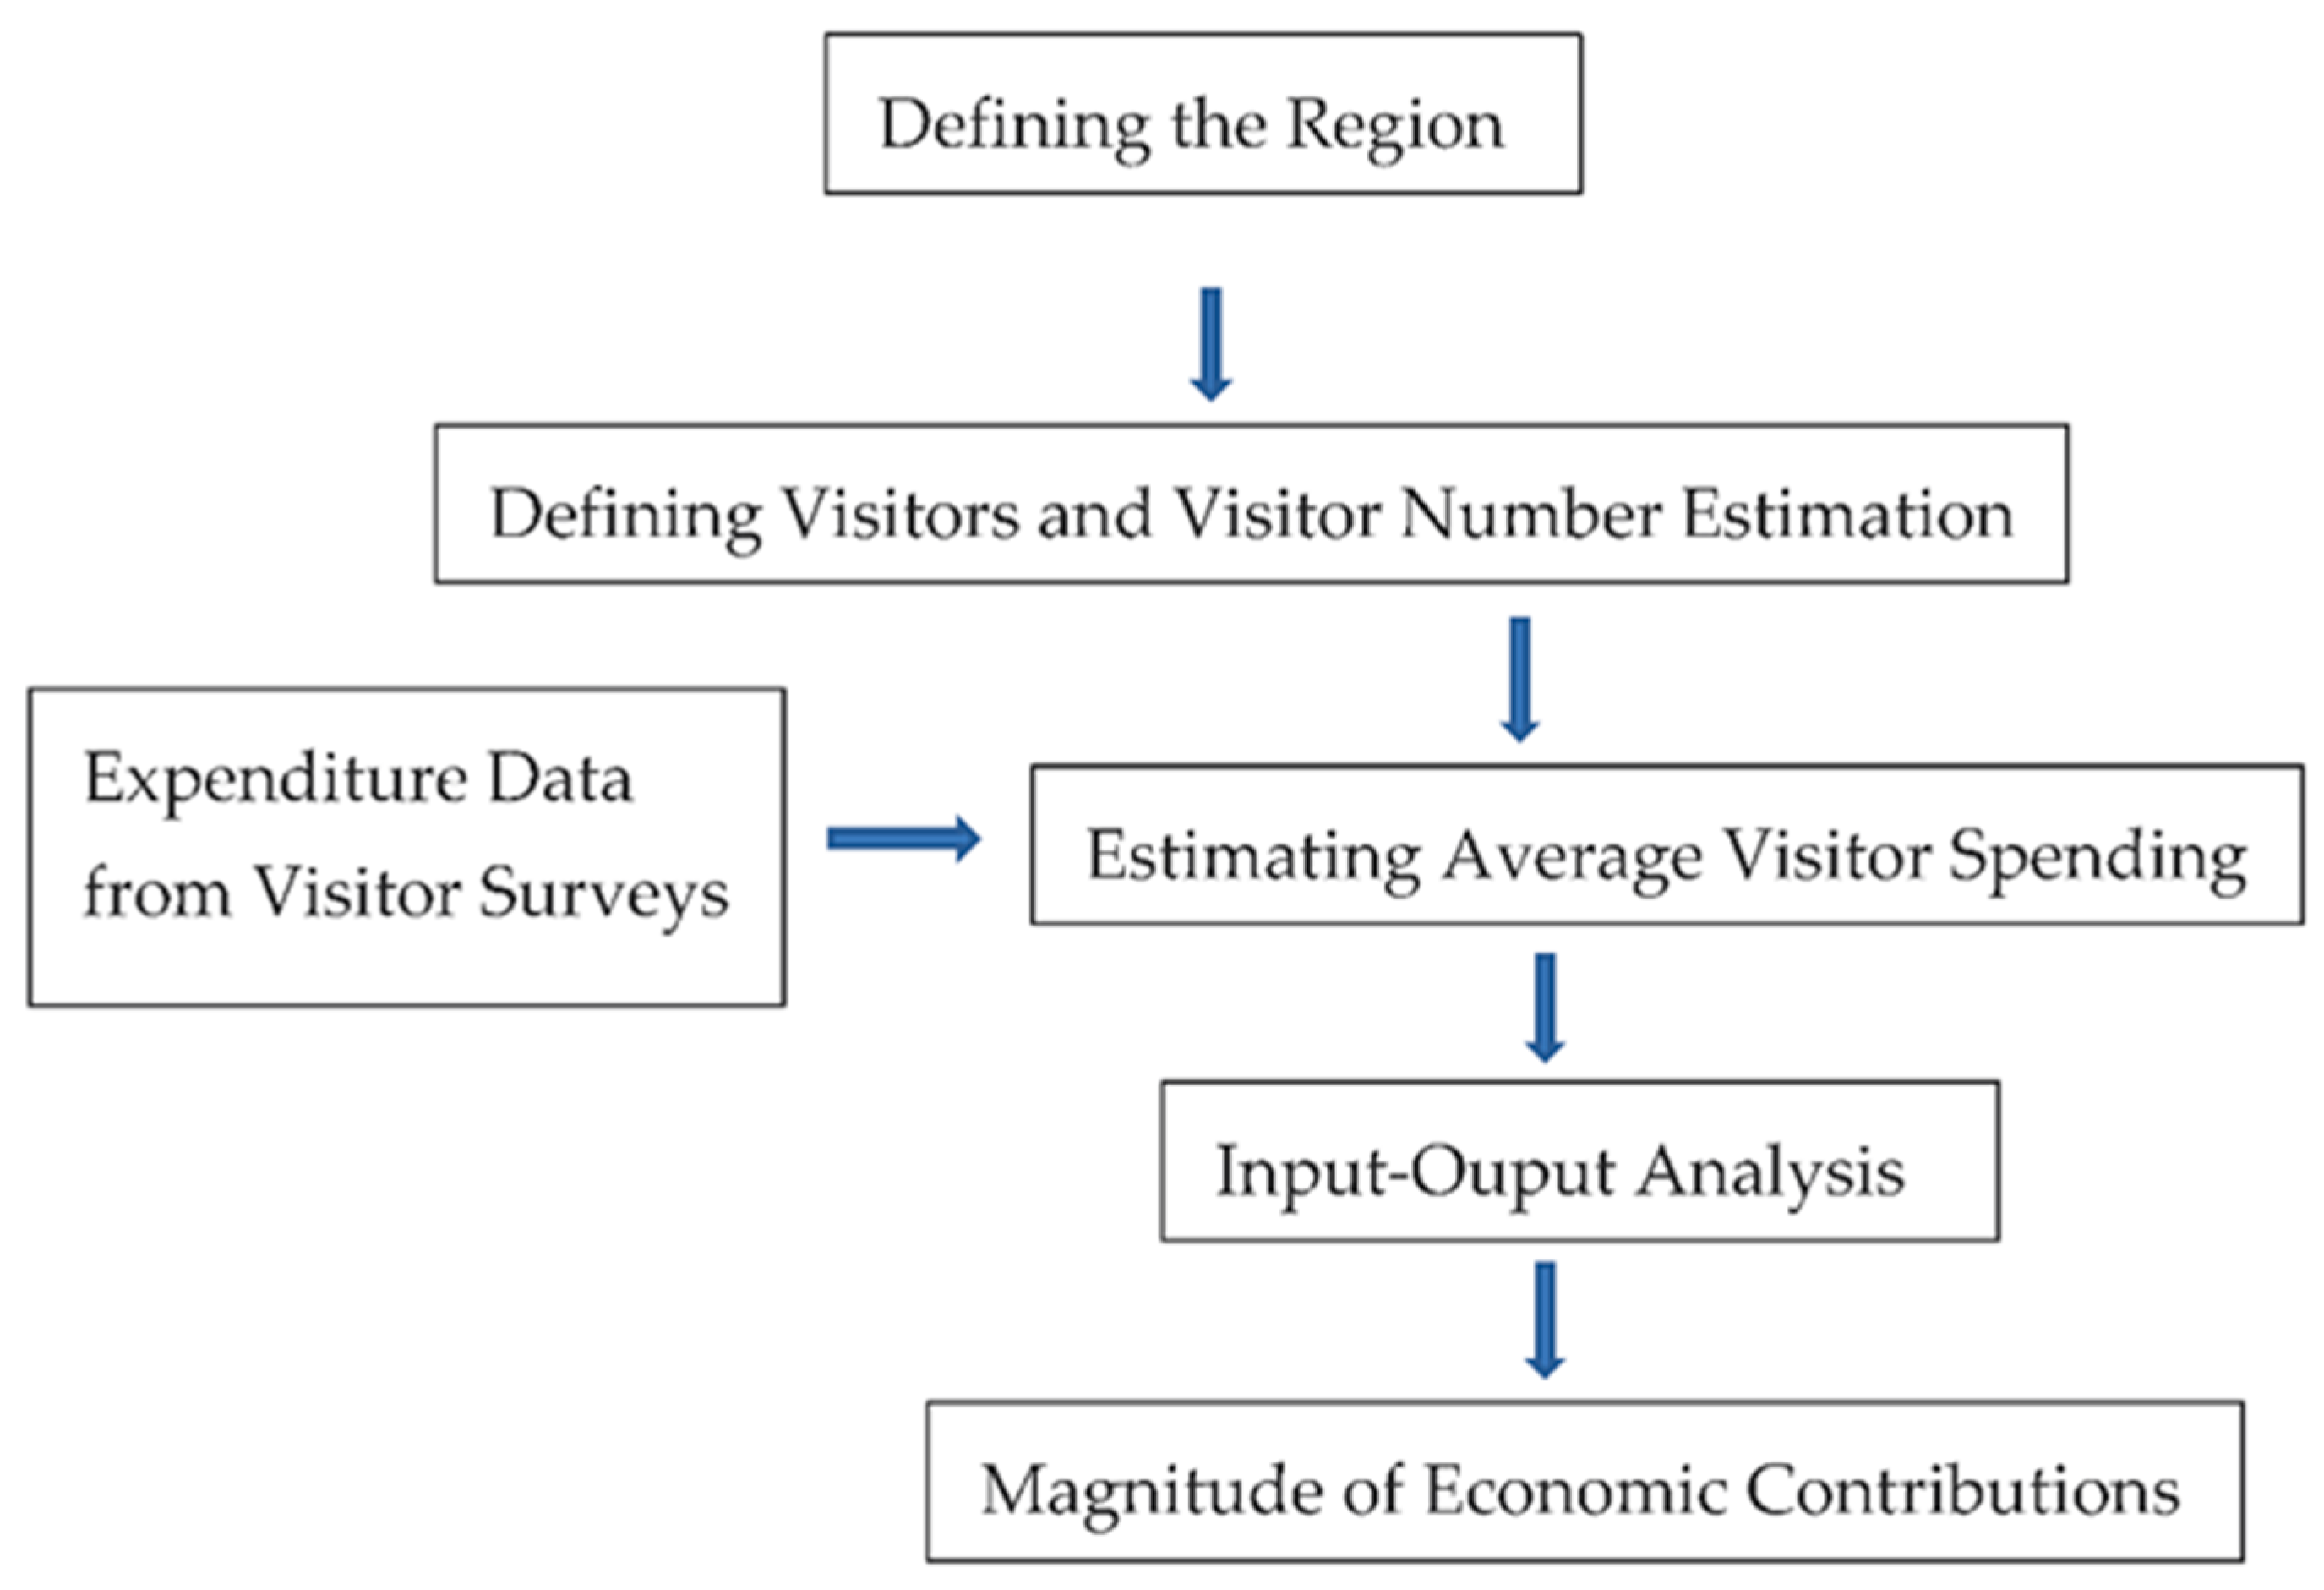
This study employs the economic contribution analysis methodology as illustrated in Figure 2 [35,40,41].
2.2.1. Region
As illustrated in Figure 2, defining the region is the first step in economic contribution analysis. GRNMS is located in the coastal Georgia region. This region is made up of 10 counties in Georgia, which include Bryan, Bulloch, Camden, Chatham, Effingham, Glynn, Liberty, Long, McIntosh, and Screven. Thus, the region of analysis will be this 10 county region.
2.2.2. Visitor Volume Estimation
For this study, “visitors” include both local and non-local people in coastal Georgia who participated in ocean recreation activities. This may include residents with permanent, seasonal, and/or temporary status in the region. For this study, “ocean recreation activities” include things such as diving, fishing, and boating. Based on a recent study, coastal Georgia received about 13.7 million overnight visitors annually [42]. However, these include all visitors in the area, not just those who participated in ocean-based recreation. Around 27% of the total visitors in coastal Georgia participated in ocean recreation in 2019 [43], which corresponds to about 3.75 million visitors who participated in ocean recreation for use in the economic contribution analyses.
2.2.3. Expenditure Data
Expenditure data were collected from a survey of people who indicated participation in any ocean recreation activities. The survey instrument provided information about visitor monitoring and visitor volume within marine protected areas that are remote and not always easily accessible for on-site counting of visitation. Surveys were designed to fit the context of the NMS-COUNT process [44] that sought to identify general use characteristics associated with visitation patterns, trip characteristics, and expenditures. The survey was distributed online through the Qualtrics survey platform. The distribution methods used recommendations from Dillman [45], which details preferred online survey methods in order to minimize bias and potential error. Surveys were distributed beginning in June 2020 to identify 2019 expenditure data. Surveys were distributed via email addresses sent to contacts obtained from the Georgia Department of Natural Resources from natural resource license and/or permit sales connected to ocean recreation (e.g., fishing, crabbing, boating, etc.) for the 2019–2020 calendar year. For each email contact, the email included a personal link to the survey, along with a brief explanation of the project purpose and survey collection methods. Additional email contacts were sent the survey in subsequent weeks, with a maximum of two reminder messages sent to each round of potential survey respondents following initial contact if the survey was not completed. All survey distribution was completed by September 2020. A maximum of 32,870 potential contacts based upon available email addresses was identified across all online survey distribution efforts. From this total, some email addresses were not legitimate or deactivated, causing some deliveries to fail or other emails to bounce. Following practices outlined in the Dillman method, reminders were sent to unfinished or unopened survey respondents once per week for a maximum of two weeks following initial contact. Following the filtration of false emails and reminder completions, 609 effective survey contacts were established. Effective survey contacts are defined as recipients that received the survey invitation email at a legitimate email address and opened the email (e.g., it was not sent to junk or spam mail folders, etc.). Out of the 609 effective survey contacts we obtained 369 completed surveys, creating an effective response rate of 60.6%.
Mean expenditure levels for visitors in the region were computed using the survey data from expenditure-related questions. Survey respondents provided group expenditure data, so per capita expenditures per trip for ocean recreation were calculated by dividing the mean group expenditures by mean group size, which was about four people. Mean categorical expenditures were computed across categories reported by survey respondents. Expenditures in responses for the survey category “Other Expenses”, were allocated to an appropriately detailed category (e.g., food, fuel, lodging, etc.) based upon additional descriptions provided by the respondents. Identifying expenditures in specific categories is required for appropriate economic contribution analyses. Since these expenditure data are for Coastal Georgia, expenditure data for GRNMS need to be estimates since this study is also interested in estimating the economic contribution attributed to GRNMS alone. However, expenditure data by spending category are not available for GRNMS, although results of the visitor survey indicate that about 9% of total spending in Coastal Georgia can be attributed to GRNMS alone. The estimated total spending attributed to GRNMS was then allocated to the different spending categories based on the assumption that the proportion of spending per category is similar to that of spending in Coastal Georgia. These expenditure data by spending category were therefore used to estimate the economic contribution attributed to GRNMS.
Mean visitor expenditures by season and by location in the coastal Georgia region were calculated and compared using ANOVA and Tukey’s HSD test.
2.2.4. Input–Output Analysis
Analyses of economic inputs and outputs using the IMPLAN economic modeling software were performed to estimate economic contributions. The IMPLAN input–output modeling system is based on the Leontief model, which utilizes the buy–sell relationships of economic sectors such as industry, households, and municipalities in the local and regional economy using annual data. This allows users to predict impacts from economic changes on specific regional economies or estimate previous or current activities related to economic fluctuations [46]. The IMPLAN software modeling builds upon traditional input–output models by incorporating connections among industries and institutions and also between institutions themselves, therefore capturing all potential transactions in a specified time period for what is known as the Social Accounting Matrix (SAM) model [47]. Using the relationships defined in the SAM, models are constructed using custom selection of IMPLAN datasets, regional purchasing coefficients, and the transactions within the SAM itself for the input–output model. Models may be further defined using any suitable number of a potential 536 unique IMPLAN economic sectors. Sectors defined for each model align with one or more North America Industrial Classification System (NAICS) sectors.
Economic input–output model results report across direct, indirect, and induced effects. Directs effects are defined as effects made within a primary industry of study with respect to operations that meet the demand for production. Effects are considered indirect if they are created through inter-industry activity in response to demand for production and input by the primary industry. Finally, induced effects are created from the spending of personal income by employees and owners of commercial operations in the primary and/or secondary industries of study. The sum of direct, indirect, and induced effects is considered the total effect (or gross change) in a regional economy that is attributable to the primary industry of study. Direct, indirect, and induced effects are reported by IMPLAN for the following measures of industry-specific activity:
- Employment: total number of jobs (both full and part time);
- Output: dollar (USD) value of production/sales in industry;
- Value Added: the difference between an industry’s output and the cost of its intermediate inputs, which consists of employee compensation, proprietor income, indirect business taxes, and other property type income.
Through SAM, IMPLAN I-O models are built upon Type SAM multipliers. These represent the relationship the industry has with the broader overall economy of the model region. They not only take into account direct and indirect effects of an industry’s operations, but they also include the induced effects that arise from the spending of income that originates from the industry by institutions such as households and governments. Type SAM multipliers are a more comprehensive representation of the magnitude of the “ripple effects” that are created in the broader economy by the direct industry activity. They are calculated as follows:
Type SAM Multiplier = Total effects/Direct effects
3. Results
This section presents results for visitor expenditure, spending patterns in terms of area and season, and economic contributions of visitor spending associated with marine aquatic recreational activities in Coastal Georgia and GRNMS.
Table 1 presents results of expenditures identified in the visitor survey for participants of aquatic recreation activities, such as fishing, boating, diving, snorkeling and other ocean-based recreation activities. IMPLAN sectors for the corresponding expenditure category are also presented. The average visitor spending per trip of a person doing ocean-based recreation in the coastal Georgia region is about USD 365.32, or about USD 1.37 billion in total in terms of all visitors to the region.
3.1. Visitor Expenditures
The visitor survey indicates that about 9% of this can be attributed to spending in GRNMS or about US 32.85 per visitor or USD 123.3 million for all visitors. The largest expenditure category is lodging (25%). Visitors in the area typically stay an average of 3 days. The next-largest expenditure categories are food at restaurants (13%) and sightseeing and entertainment (13%). Another significant expenditure is for fees for charter diving/snorkeling, at 11% of the total expenditure. Visitors only spent about 1% on local transportation.
3.2. Other Spending Patterns of Visitors
Spending patterns of visitors by area and season are presented in Table 2 and Table 3. There are several popular areas in the region that are attractive to visitors. The results show that spending is significantly higher in Brunswick and other areas (e.g., St. Simons, Jekyll Island, St. Mary’s), averaging about USD 78 and USD 70 per person, respectively. This is followed by spending in the city of Savannah and Tybee Island, averaging about USD 55 and USD 45 per person, respectively. Visitors engaged in ocean recreation spent significantly less in the Shellman Bluff and Richmond Hill areas, averaging USD 33 and USD 30 per person, respectively.
Spending across time showed some patterns, with a significantly higher amount of visitor spending in the summer months, averaging about USD 134 per person per trip. Visitors spent significantly less during the fall, spring, and winter seasons, ranging from USD 55 to 71 per person per trip.
3.3. Economic Contributions
Economic contributions of visitors to the coastal Georgia region related to recreation activities in the ocean are presented in Table 4. This visitation expenditure total contributed 18,950 jobs to the region, which contains 10 counties of coastal Georgia, and approximately USD 603 million in total labor income. Total value added was approximately USD 938 million, with a total output of USD 1.8 billion. The value of the SAM multiplier for type, or the “ripple effects” that direct industry activity can create for all visitor categories, are below the value of 2. For example, such an output multiplier value of 1.69 estimates that a USD 1 increase in sales will return a total increase of USD 1.69 in output to the region.
With regard to the economic contributions that can be attributed to visitor spending in GRNMS alone (Table 5), ocean recreation contributed about 1705 total jobs to the region. With respect to total labor income, value added, and output, GRNMS visitors contributed about USD 54 million, USD 84 million, and USD 159 million, respectively. These estimates are based on the assumption that about 9% of visitor spending in coastal Georgia is spent on ocean-related recreation in GRNMS.
4. Discussion
In addition to a vibrant workforce, thriving industry and advanced infrastructure, the blue economy of the United States depends upon the natural resources of the nation’s coastal zones [48]. These coastal resources have the potential to boost the local economies through tourism and recreation. In fact, tourism and recreation account for 72% of the US ocean economy’s total employment and 31% of its GDP, and coastal counties alone employ more than 54.6 million people and generate USD 7.9 trillion towards the nation’s GDP [48]. Visitors to Georgia spent about USD 28 billion in 2021 and close to USD 4 billion was spent in the coastal Georgia region [26]. This study specifically examines visitor spending in ocean recreation in coastal Georgia and GRNMS, and the corresponding economic contributions to the local region. While visitor spending data has been collected for coastal Georgia [43], no study has quantified the economic contribution of ocean–based recreation in the area, or in GRNMS specifically. Quantifying the economic importance of the sanctuary in terms of jobs created and economic output to the region is important to justify management and investment.
The study shows that coastal Georgia receives about 3.75 million visitors who are engaged in ocean recreation. This is about 40% of ocean recreation visitors in the South Atlantic region [49], highlighting the popularity of coastal Georgia as a tourist destination regionally. With respect to spending, the results of the study show that visitors in coastal Georgia who are engaged in ocean recreation spent a total of USD 1.4 billion. This is about 35% of the total visitor spending in the region [42], indicating that ocean-based recreation such as fishing, boating, and diving are relatively important in the region. With regard to GRNMS, about USD 123 million of the USD 1.4 billion visitor spending can be attributed to the sanctuary. This is, relatively, less than what visitors have spent in other marine sanctuaries. For example, visitors in the Florida Keys National Marine Sanctuary (FKNMS) spent about USD 1.7 billion in ocean recreation [35]. This can be attributed to the smaller size of the sanctuary and its relatively lower accessibility. GRNMS is only 0.06% the size of the FKNMS, and requires much longer travel distances via boat to enter. Nonetheless, it is an important tourist attraction in the region. With respect to spending across categories, visitors spent the most on lodging, or about 25% of the total spending, followed by spending on food from restaurants and grocery stores (22%). These findings are consistent with visitor spending patterns in other MPAs/marine sanctuaries in the US [26,33,34,35]. In terms of spending by area, visitors spent the most in Brunswick, the city of Savannah and other areas (e.g., St. Simons, Jekyll Island, St. Mary’s) because these areas are the most popular among visitors to the region. In fact, these areas are reported in the top five destinations among non-Georgia residents. Shellman Bluff and Richmond Hill are not as popular to tourists, as reflected in the magnitude of visitor spending in these areas. With regard to seasonal spending, it is clear that visitors spend the most during the summer season. This is expected, as there are more opportunities to engage in ocean recreation during the summer season and it coincides with the vacation period of most tourists in the US This season, therefore, plays a significant role in stimulating the economy of the region [35]. Thus, investments in enhancing visitor experiences can further help in improving the economic contributions to the region.
This study shows that coastal Georgia and GNRMS can be important economic drivers for the region in terms of ocean recreation and tourism. The expenditures of visitors can support a wide range of manufacturing, transportation and service sectors that can drive the local economy [33]. For example, the USD 1.4 billion spending of the 3.75 million visitors who come to coastal Georgia for ocean-based recreation creates approximately USD 1.8 billion in total economic output for the region. This is comparable to other MPAs in the US, with economic contributions ranging from USD 46 million to USD 2 billion [26,35], and makes up about 3% of the total output sales generated by the South Atlantic Region [49]. The economic contributions of GRNMS alone in the region are about USD 159 million. While this is a relatively small sanctuary with a size of only about 22 square miles, its economic contribution to the coastal Georgia region cannot be ignored. This information is an important input for decision makers and other stakeholders when making decisions about management and funding for the sanctuary.
Since economic contribution analyses rely on accurate visitor expenditure estimates, one of the limitations of this study is the remote data collection that was employed. This increases the likelihood of visitors inaccurately reporting their expenses. While an initial effort was made to conduct onsite interviews, surveys were eventually distributed remotely because of the COVID-19 pandemic.
5. Conclusions
This study contributes to an overall understanding of the economic significance of National Marine Sanctuaries and their potential role in the nation’s blue economy. The study shows that GRNMS, although a relatively small sanctuary, can be an important driver to the region’s economy. Specifically, the results show that ocean recreation and tourism play a big role for contributing jobs, output, and value-added income in the region. Recreational activities such as fishing, boating, diving, snorkeling and other ocean-based activities drive tourists to the area, and their spending in the region helps to stimulate the local economy. In order to continue to attract visitors to the area, policy and management efforts should focus on improving visitor experiences. In addition, government and private investments should focus on sectors that are involved in providing services to ocean-based tourism, either directly or indirectly. To continue attracting visitors and maintain demand for ocean recreation in the region, policy efforts should also focus on protecting and maintaining the sanctuary by allocating sufficient funding for its effective management. The need to protect and manage MPAs such as GRNMS is becoming increasingly important not only for ecological reasons, but for economic reasons as well. “MPAs boost the Blue Economy, as well as fisheries, aquaculture, tourism and coastal areas” [48]. Thus, studies such as this, which quantify the benefits and costs of MPAs, are necessary to support the decisions and actions of policy makers and other stakeholders to justifying funding and the opportunity costs of protection.
This study highlights the economic importance of a National Marine Sanctuary in the US, extending previous work that was conducted in FKNMS [35]. Future efforts should continue quantifying the economic contribution of the US National Marine Sanctuary System to understand its role in the nation’s economy. Such information will provide a basis for justifying funding to continue to protect and maintain the different values (e.g., economic and ecological) provided by the sanctuary system. This becomes even more important as the government and other stakeholders continue to make difficult choices in budget allocation, considering limited funds. This study only focused on the economic contribution based on the current activities and spending of tourists who come to the area for ocean recreation. For future studies, it will also be interesting to measure the economic impacts of tourism investment in the region so local officials will have a better understanding of how potential investments in the region can boost the local economy.
Author Contributions
Conceptualization, K.G., R.A. and R.C.B.; methodology, K.G. and R.A.; software, K.G.; validation, K.G., R.A. and R.C.B.; formal analysis, K.G.; investigation, K.G., R.A. and R.C.B.; resources, R.C.B.; data curation, K.G. and R.A.; writing—original draft preparation, K.G.; writing—review and editing, K.G., R.A. and R.C.B.; visualization, K.G.; supervision, R.C.B.; project administration, R.C.B.; funding acquisition, R.C.B. All authors have read and agreed to the published version of the manuscript.
Funding
This research was funded in part by the National Science Foundation Convergence Accelerator program, with award number 2137826, and also in part by the National Marine Sanctuary Foundation, award number 19-04-B-210.
Institutional Review Board Statement
The data collection in this study was conducted in accordance with University IRB protocol 1902446184 for human subjects survey research.
Informed Consent Statement
Informed consent was obtained from all subjects involved in the study.
Data Availability Statement
The data are not publicly available due to privacy concerns of participants.
Acknowledgments
The authors would like to thank staff at the NOAA Office of National Marine Sanctuaries for their helpful support of the project.
Conflicts of Interest
The funders had no role in the design of the study; in the collection, analyses, or interpretation of data; in the writing of the manuscript, or in the decision to publish the results.
References
- National Geographic Society. National Geographic Society Homepage. Available online: https://education.nationalgeographic.org/resource/marine-sanctuary (accessed on 3 January 2023).
- Marcos, C.; Diaz, D.; Fietz, K.; Forcada, A.; Ford, A.; Garcia-Charton, J.A.; Goni, R.; Lenfant, P.; Mallol, S.; Mouillot, D.; et al. Reviewing the Ecosystem Services, Societal Goods, and Benefits of Marine Protected Areas. Front. Mar. Sci. 2021, 8, 504. [Google Scholar] [CrossRef]
- National Oceanic and Atmospheric Administration. National Marine Sanctuaries Home Page. Available online: https://sanctuaries.noaa.gov/about/legislation/ (accessed on 3 January 2023).
- National Oceanic and Atmospheric Administration. National Ocean Service Web Page. Available online: https://oceanservice.noaa.gov/economy/blue-economy-strategy/ (accessed on 3 January 2023).
- West Coast Environmental Law. Environmental Law Alert Blog. Available online: https://www.wcel.org/blog/marine-protected-areas-are-central-our-blue-economy (accessed on 3 January 2023).
- Raman, M.; Abbasi, K.R.; Saman, A.; Dagar, V.; Alvarado, R.; Kagzi, M. Towards the Dream of Go Green: An Empirical Importance of Green Innovation and Financial Depth for Environmental Neutrality in the World’s Top 10 Greenest Economies. Technol. Forcast. Soc. Chang. 2023, 189, 122370. [Google Scholar] [CrossRef]
- Shafi, M.; Ramos-Meza, C.; Jain, V.; Salman, A.; Kamal, M.; Shabbir, M.S.; Rehman, M. The Dynamic Relationship Between Green Tax Incentives and Environmental Change. Environ. Sci. Pollut. Res. 2023, 1–9. [Google Scholar] [CrossRef]
- Ali, Q.; Salman, A.; Parveen, S. Evaluating the Effects of Environmental Management Practices on Environmental and Financial Performance of Firms in Malaysia: The Mediating Role of ESG Disclosure. Heliyon 2022, 8, e12486. [Google Scholar] [CrossRef] [PubMed]
- Pascal, N.; Brathwaite, A.; Bladon, A.; Claudet, J.; Clua, E. Impact Investment in Marine Conservation. Ecosyst. Serv. 2021, 48, 101248. [Google Scholar] [CrossRef]
- Sumaila, U.R.; Walsh, M.; Hoareau, K.; Cox, A.; The, L.; Abdallah, P.; Akpalu, W.; Anna, Z.; Benzaken, D.; Crona, B.; et al. Financing a Sustainable Ocean Economy. Nat. Commun. 2021, 12, 3259. [Google Scholar] [CrossRef]
- Letson, D. Methods of Economic Analysis. In Florida Coastal Environmental Resources: A Guide to Economic Valuation and Impact Analysis; Letson, D., Milon, J.W., Eds.; Florida Sea Grant College Program: Gainesville, FL, USA, 2002; ISBN 0-916287-52-1. [Google Scholar]
- Gravestock, P.; Roberts, C.; Baile, A. The Income Requirements of Marine Protected Areas. Ocean Coast. Manag. 2008, 51, 272–283. [Google Scholar] [CrossRef]
- Sumaila, R.; Lam, V.; Miller, D.; Teh, L.; Watson, R. Winners and Losers in a World Where the High Seas is Closed to Fishing. Sci. Rep. 2015, 5, 8481. [Google Scholar] [CrossRef] [PubMed] [Green Version]
- Davis, T.E.; Epstein, G.; Aguilera, S.E.; Brooks, C.M.; Cox, M.; Evans, L.S. Assessing Trade-Offs in Large Marine Protected Areas. PLoS ONE 2018, 4, e0195760. [Google Scholar] [CrossRef] [Green Version]
- Sala, E.; Mayorga, J.; Bradley, D.; Cabral, R.B.; Atwood, T.B.; Auber, A. Protecting the Global Ocean for Biodiversity, Food and Climate. Nature 2021, 592, 397–402. [Google Scholar] [CrossRef]
- Brander, L.M.; Beukering, P.; Nijsten, L.; McVittie, A.; Baulcomb, C.; Eppink, F.V. The Global Costs and Benefits of Expanding Marine Protected Areas. Mar. Policy 2020, 116, 103953. [Google Scholar] [CrossRef]
- Waldron, A.; Adams, V.; Allan, J.; Arnell, A.; Abrantes, J.P.; Asner, G. Protecting 30 Percent of the Planet: Costs, Benefits and Economic Implications. Campaign. Nat. 2020. [Google Scholar]
- McGowan, J.; Gammage, S.; Escovar-Fadul, X.; Weis, S.; Hansen, A.; Arlington, G.M. (Eds.) Sea Change: Costs and Benefits of Marine Protected Areas; The Nature Conservancy: Arlington, VA, USA, 2022; 36p. [Google Scholar]
- Costello, M.J. Long Live Marine Reserves: A Review of Experiences and Benefits. Biol. Conserv. 2014, 176, 289–296. [Google Scholar] [CrossRef]
- Rojas-Nazar, U.; Gardner, J.; Rouchon, A.; Cullen, R. Valuing Marine Reserves: A Case Study from Two Locations in Central New Zealand. Mar. Policy 2022, 140, 105051. [Google Scholar] [CrossRef]
- Weilgus, J.; Bennett, J. Including Risk in Stated-Preference Economic Valuations: Experiments on Choices for Marine Recreation. J. Environ. Manag. 2009, 90, 3401–3409. [Google Scholar] [CrossRef]
- Ahmed, M.; Umali, G.M.; Mary, C.K.R.; Garcia, M.C. Valuing Recreational and Conservation Benefits of Coral Reefs: The Case of Bolinao, Philippines. Ocean Coast Manag. 2007, 50, 103–118. [Google Scholar] [CrossRef]
- Yacob, M.R.; Radam, A.; Awang, K.W. Economic Valuation of Marine Parks Ecotourism Malaysia—The Case of Redang Island Marine Park; Universiti Putra Malaysia Press: Selangor, Malaysia, 2008. [Google Scholar]
- Watson, P.; Wilson, J.; Thilmany, D.; Winter, S. Determining the Economic Contribution and Impacts: What is the Difference and Why Do We Care? J. Reg. Anal. Policy 2007, 37, 140–146. [Google Scholar]
- Saayman, M.; Saayman, A. Estimating the Economic Contribution of Visitor Spending in the Kruger National Park to the Regional Economy. J. Sustain. Tour. 2006, 14, 67–81. [Google Scholar] [CrossRef]
- Stokes-Cawley, O.; Stroud, H.; Lyons, D.; Wiley, P.; Goodhue, C. Economic Contribution Analysis of National Estuarine Research Reserves. Water 2021, 13, 1596. [Google Scholar] [CrossRef]
- Ganter, S.; Crawford, T.; Irwin, C.; Robichaud, V.; De-Maio-Sukic, A.; Wang, J.; Andrews, J.; Larocque, H.; Canada’s Ocean and the Economic Contribution of Marine Sectors. Statistics Canada, Catalog No. 16-002-x. Available online: https://www150.statcan.gc.ca/n1/pub/16-002-x/2021001/article/00001-eng.htm (accessed on 26 February 2023).
- Utech, D. Valuing Hawai`i’s Humpback Whales: The Economic Impact of Humpbacks on Hawai`i’s Ocean Tour Boat Industry. In The Economic Contribution of Whalewatching to Regional Economies: Perspectives From Two National Marine Sanctuaries; Marine Sanctuaries Conservation Series MSD-00-2; U.S. Department of Commerce, National Oceanic and Atmospheric Administration, Marine Sanctuaries Division: Silver Spring, MD, USA, 2000. [Google Scholar]
- Hoagland, P.; Meeks, A.E. The Demand for Whalewatching at Stellwagen Bank National Marine Sanctuary. In The Economic Contribution of Whalewatching to Regional Economies: Perspectives from Two National Marine Sanctuaries; Marine Sanctuaries Conservation Series MSD-00-2; U.S. Department of Commerce, National Oceanic and Atmospheric Administration, Marine Sanctuaries Division: Silver Spring, MD, USA, 2000. [Google Scholar]
- Shea, R.; Schwarzmann, D.; Leeworthy, V.; Hastings, S.; Knapp, L.; Tracy, S. Whale Watching in Channel Islands National Marine Sanctuary: Understanding Passengers and Their Economic Contributions; National Marine Sanctuaries Conservation Series ONMS-21-08; U.S. Department of Commerce, National Oceanic and Atmospheric Administration, Office of National Marine Sanctuaries: Washington, DC, USA, 2021.
- Leeworthy, V.R.; Loomis, D.K.; Paterson, S.K. Visitor Profiles: Florida Keys/Key West 2007–2008. In Linking the Economy and the Environment of Florida Keys/Key West; National Oceanic and Atmospheric Administration, National Ocean Service, Office of National Marine Sanctuaries: Silver Spring, MD, USA, 2010. [Google Scholar]
- Leeworthy, V.R. Visitor Study: Selected Comparisons 1995-06 and 2007-08. In Linking the Economy and the Environment of Florida Keys/Key West; National Oceanic and Atmospheric Administration, National Ocean Service, Office of National Marine Sanctuaries: Silver Spring, MD, USA, 2010. [Google Scholar]
- Leeworthy, V.R.; Ehler, R. Economic Contribution of Recreating Visitors to the Florida Keys/Key West 2007-08. In Linking the Economy and the Environment of Florida Keys/Key West; National Oceanic and Atmospheric Administration, National Ocean Service, Office of National Marine Sanctuaries: Silver Spring, MD, USA, 2010. [Google Scholar]
- TBD Economics, LLC. TBD Economics Home Page. Available online: https://www.tbdeconomics.com/projects (accessed on 20 August 2021).
- Gazal, K.A.; Andrew, A.; Burns, R. Economic Contributions of Visitor Spending in Ocean Recreation in the Florida Keys National Marine Sanctuary. Water 2022, 14, 198. [Google Scholar] [CrossRef]
- Eller, R. Economic Analysis of the Proposed Gray’s Reef National Marine Sanctuary Research Area; Office of National Marine Sanctuaries, NOAA: Silver Springs, MD, USA, 2009.
- National Oceanic and Atmospheric Administration. National Marine Sanctuaries Webpage. Available online: https://sanctuaries.noaa.gov/science/socioeconomic/factsheets/graysreef.html (accessed on 11 January 2023).
- Glenn, H.; Wattage, P.; Mardle, S.; Rensburg, T.V.; Grehan, A.; Foley, N. Marine Protected Areas—Substantiating their Worth. Mar. Policy 2010, 34, 421–430. [Google Scholar] [CrossRef]
- National Oceanic Atmospheric Administration. Gray’s Reef National Marine Sanctuary Webpage. Available online: https://graysreef.noaa.gov/ (accessed on 11 January 2023).
- Munn, I.A.; Hussain, A.; Spurlock, S.; Henderson, J.E. Economic Impact of Fishing, Hunting, and Wildlife-Associated Recreation Expenditures on the Southeast U.S. Regional Economy: An Input-Output Analysis. Hum. Dimens. Wildl. 2010, 15, 433–449. [Google Scholar] [CrossRef]
- Crompton, J.L. The Fundamental Principles of Economic Impact Studies. In Measuring the Economic Impact of Park and Recreation Services; National Recreation and Park Association: Ashburn, VA, USA, 2010. [Google Scholar]
- Longwoods International. Georgia Overnight Visitor Profile: State and Regions. Explore Georgia Webpage. 2021. Available online: https://industry.exploregeorgia.org/resource/2021-georgia-overnight-visitor-profile-state-and-regions (accessed on 11 January 2023).
- Allers, C. Georgia’s Coast: Interest, Knowledge & Attitudes Survey Report; Advantage Consulting, LLC: Stone Mountain, GA, USA, 2019. [Google Scholar]
- Burns, R.C.; Andrew, R.G.; Allen, M.E.; Schwarzmann, D.; Cardozo, M.J. Conceptualizing the National Marine Sanctuary Visitor Counting Process for Marine Protected Areas. J. Ecotourism 2020, 19, 362–372. [Google Scholar] [CrossRef]
- Dillman, D.A.; Bowker, D.K. The Web Questionnaire Challenge to Survey Methodologists. In Dimensions of Internet Science; Reips, U.D., Bosnjak, M., Eds.; Pabst Science Publishers: Lengerich, Germany, 2001. [Google Scholar]
- Clouse, C. IMPLAN Home Page. Available online: https://support.implan.com/hc/en-us/articles/360038285254-How-IMPLAN-Works (accessed on 12 January 2023).
- Henderson, J.E.; Joshi, O.; Tanger, S.M.; Boby, L.; Hubbard, W.; Pelkki, M.; Hughes, D.W.; McConnell, E.; Miller, W.; Nowak, J.; et al. Standard Procedures and Methods for Economic Impact and Contribution Analysis in the Forest Products Sector. J. For. 2017, 115, 112–116. [Google Scholar] [CrossRef]
- Coastal States Organization. Coastal Zone Management Programs and the Blue Economy. Available online: https://www.coastalstates.org/wp-content/uploads/2018/10/coastal-zone-managment (accessed on 16 January 2022).
- Kosaka, R.; Steinback, S. 2012 National Ocean Recreation Expenditure Survey; National Report U.S. Department of Commerce, NOAA Tech. Memo.; National Marine Fisheries Service: Silver Spring, MD, USA, 2018.
Figure 1.
Location of Gray’s Reef National Marine Sanctuary along the East Coast of the United States. The sanctuary is approximately 30 km to the east of the U.S. mainland. The inset map with latitude and longitude gridlines shows a detailed view of the Sanctuary boundary, with reference for the scale of the 57 square kilometer Sanctuary area in the Atlantic Ocean.


Table 1.
Individual expenditures per trip of visitors who engaged in ocean recreation activities in Coastal Georgia and GRNMS, 2019.
Table 1.
Individual expenditures per trip of visitors who engaged in ocean recreation activities in Coastal Georgia and GRNMS, 2019.
| Expenditure Category | Coastal Georgia | GRNMS | IMPLAN Sector |
|---|---|---|---|
| Lodging (hotel, condo, rental, camping, etc.) | USD 93.01 | USD 8.36 | 499 |
| Gift shop items/souvenirs | USD 25.82 | USD 2.32 | 405 |
| Food at restaurants | USD 47.42 | USD 4.26 | 501 |
| Food at grocery stores | USD 31.86 | USD 2.86 | 400 |
| Local fuel expenses | USD 36.58 | USD 3.29 | 402 |
| Local automobile transportation | USD 5.92 | USD 0.53 | 412 |
| Sightseeing and entertainment | USD 46.65 | USD 4.19 | 496 |
| Equipment for personal/private recreation | USD 11.98 | USD 1.08 | 404 |
| Fees for charter fishing | USD 23.86 | USD 2.15 | 414 |
| Fees for charter diving/snorkeling | USD 42.22 | USD 3.80 | 414 |
| Total | USD 365.32 | USD 32.85 |
Table 2.
Individual expenditures per trip for ocean recreation by area in the Coastal Georgia region, 2019.
Table 2.
Individual expenditures per trip for ocean recreation by area in the Coastal Georgia region, 2019.
| Area | Average Expenditure 1 |
|---|---|
| Other Location | USD 77.89 a |
| Brunswick Area | USD 70.17 a |
| City of Savannah | USD 55.48 ab |
| Tybee Island Area | USD 45.53 ab |
| Shellman Bluff Area | USD 33.33 b |
| Richmond Hill Area | USD 29.74 b |
Note: 1 Means with same letter are not significantly different at α = 0.10.
Table 3.
Individual expenditures per trip by season of visitors who engaged in ocean recreation in the Coastal Georgia Region, 2019.
Table 3.
Individual expenditures per trip by season of visitors who engaged in ocean recreation in the Coastal Georgia Region, 2019.
| Area | Average Expenditure 1 |
|---|---|
| Summer (June–August) | USD 134.24 a |
| Fall (September–November) | USD 70.75 b |
| Spring (March–May) | USD 66.69 b |
| Winter (December–February) | USD 54.81 b |
Note: 1 Means with the same letter are not significantly different at α = 0.10.
Table 4.
Economic contributions of visitors who engaged in ocean recreation activities in the Coastal Georgia region (Results in 2020 US Dollars).
Table 4.
Economic contributions of visitors who engaged in ocean recreation activities in the Coastal Georgia region (Results in 2020 US Dollars).
| Impact Type | Employment | Labor Income (USD MM) | Value Added (USD MM) | Output (USD MM) |
|---|---|---|---|---|
| Direct Effect | 13,550 | 388.7 | 558.5 | 1046.3 |
| Indirect Effect | 2881 | 115.7 | 181.6 | 381.3 |
| Induced Effect Total Effect | 2519 18,950 | 98.3 602.7 | 197.9 938.1 | 341.5 1769.10 |
| Type SAM Multipliers | 1.40 | 1.55 | 1.68 | 1.69 |
Table 5.
Economic contributions of visitors who engaged in ocean recreation activities in GRNMS (Results in 2020 US Dollars).
Table 5.
Economic contributions of visitors who engaged in ocean recreation activities in GRNMS (Results in 2020 US Dollars).
| Impact Type | Employment | Labor Income (USD MM) | Value Added (USD MM) | Output (USD MM) |
|---|---|---|---|---|
| Direct Effect | 1217 | 34.9 | 50.2 | 94.0 |
| Indirect Effect | 259 | 10.4 | 16.3 | 34.3 |
| Induced Effect Total Effect | 226 1702 | 8.8 54.2 | 17.8 84.3 | 30.7 159.0 |
| Type SAM Multipliers | 1.40 | 1.55 | 1.68 | 1.69 |
Disclaimer/Publisher’s Note: The statements, opinions and data contained in all publications are solely those of the individual author(s) and contributor(s) and not of MDPI and/or the editor(s). MDPI and/or the editor(s) disclaim responsibility for any injury to people or property resulting from any ideas, methods, instructions or products referred to in the content. |
© 2023 by the authors. Licensee MDPI, Basel, Switzerland. This article is an open access article distributed under the terms and conditions of the Creative Commons Attribution (CC BY) license (https://creativecommons.org/licenses/by/4.0/).
Share and Cite
MDPI and ACS Style
Gazal, K.; Andrew, R.; Burns, R.C. Ocean Recreation and the Economic Contributions of Visitation in and around Gray’s Reef National Marine Sanctuary. Water 2023, 15, 1054. https://doi.org/10.3390/w15061054
AMA Style
Gazal K, Andrew R, Burns RC. Ocean Recreation and the Economic Contributions of Visitation in and around Gray’s Reef National Marine Sanctuary. Water. 2023; 15(6):1054. https://doi.org/10.3390/w15061054
Chicago/Turabian StyleGazal, Kathryn, Ross Andrew, and Robert C. Burns. 2023. "Ocean Recreation and the Economic Contributions of Visitation in and around Gray’s Reef National Marine Sanctuary" Water 15, no. 6: 1054. https://doi.org/10.3390/w15061054
Note that from the first issue of 2016, this journal uses article numbers instead of page numbers. See further details here.