
Integrated GIS, Remote Sensing, and Electrical Resistivity Tomography Methods for the Delineation of Groundwater Potential Zones in Sangaw Sub-Basin, Sulaymaniyah, KRG-Iraq

Abstract
:1. Introduction
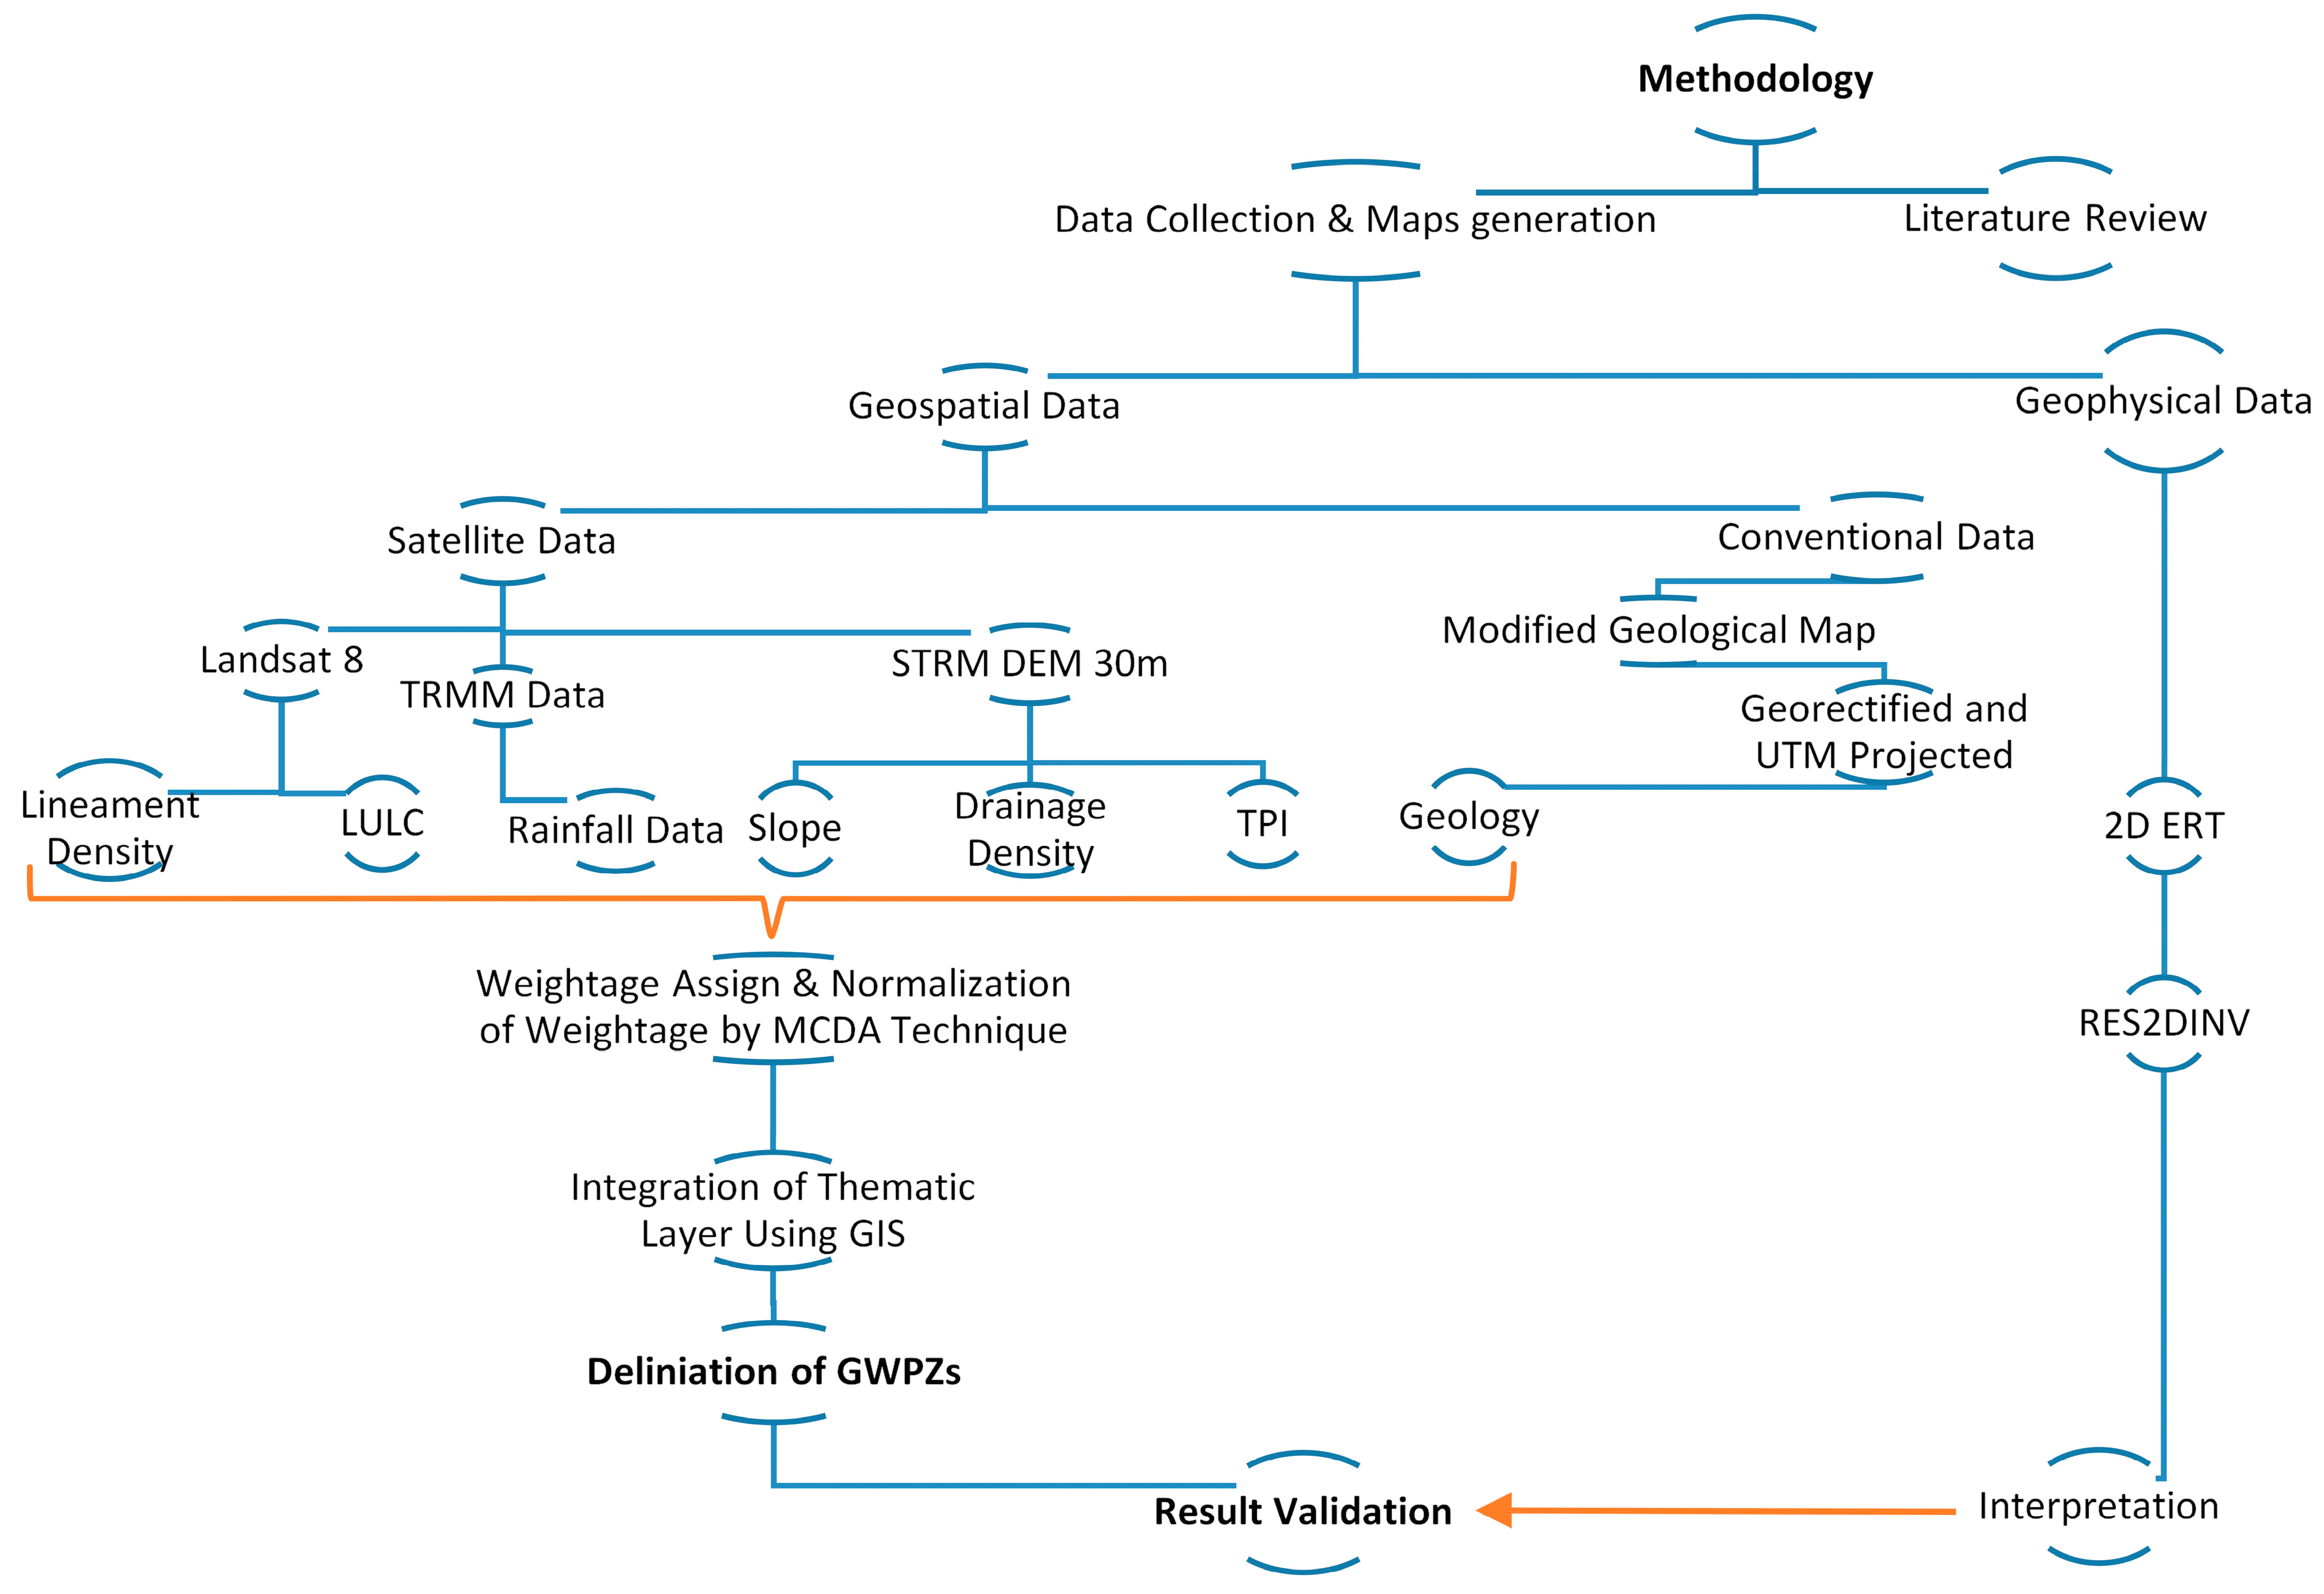
2. Materials and Methods
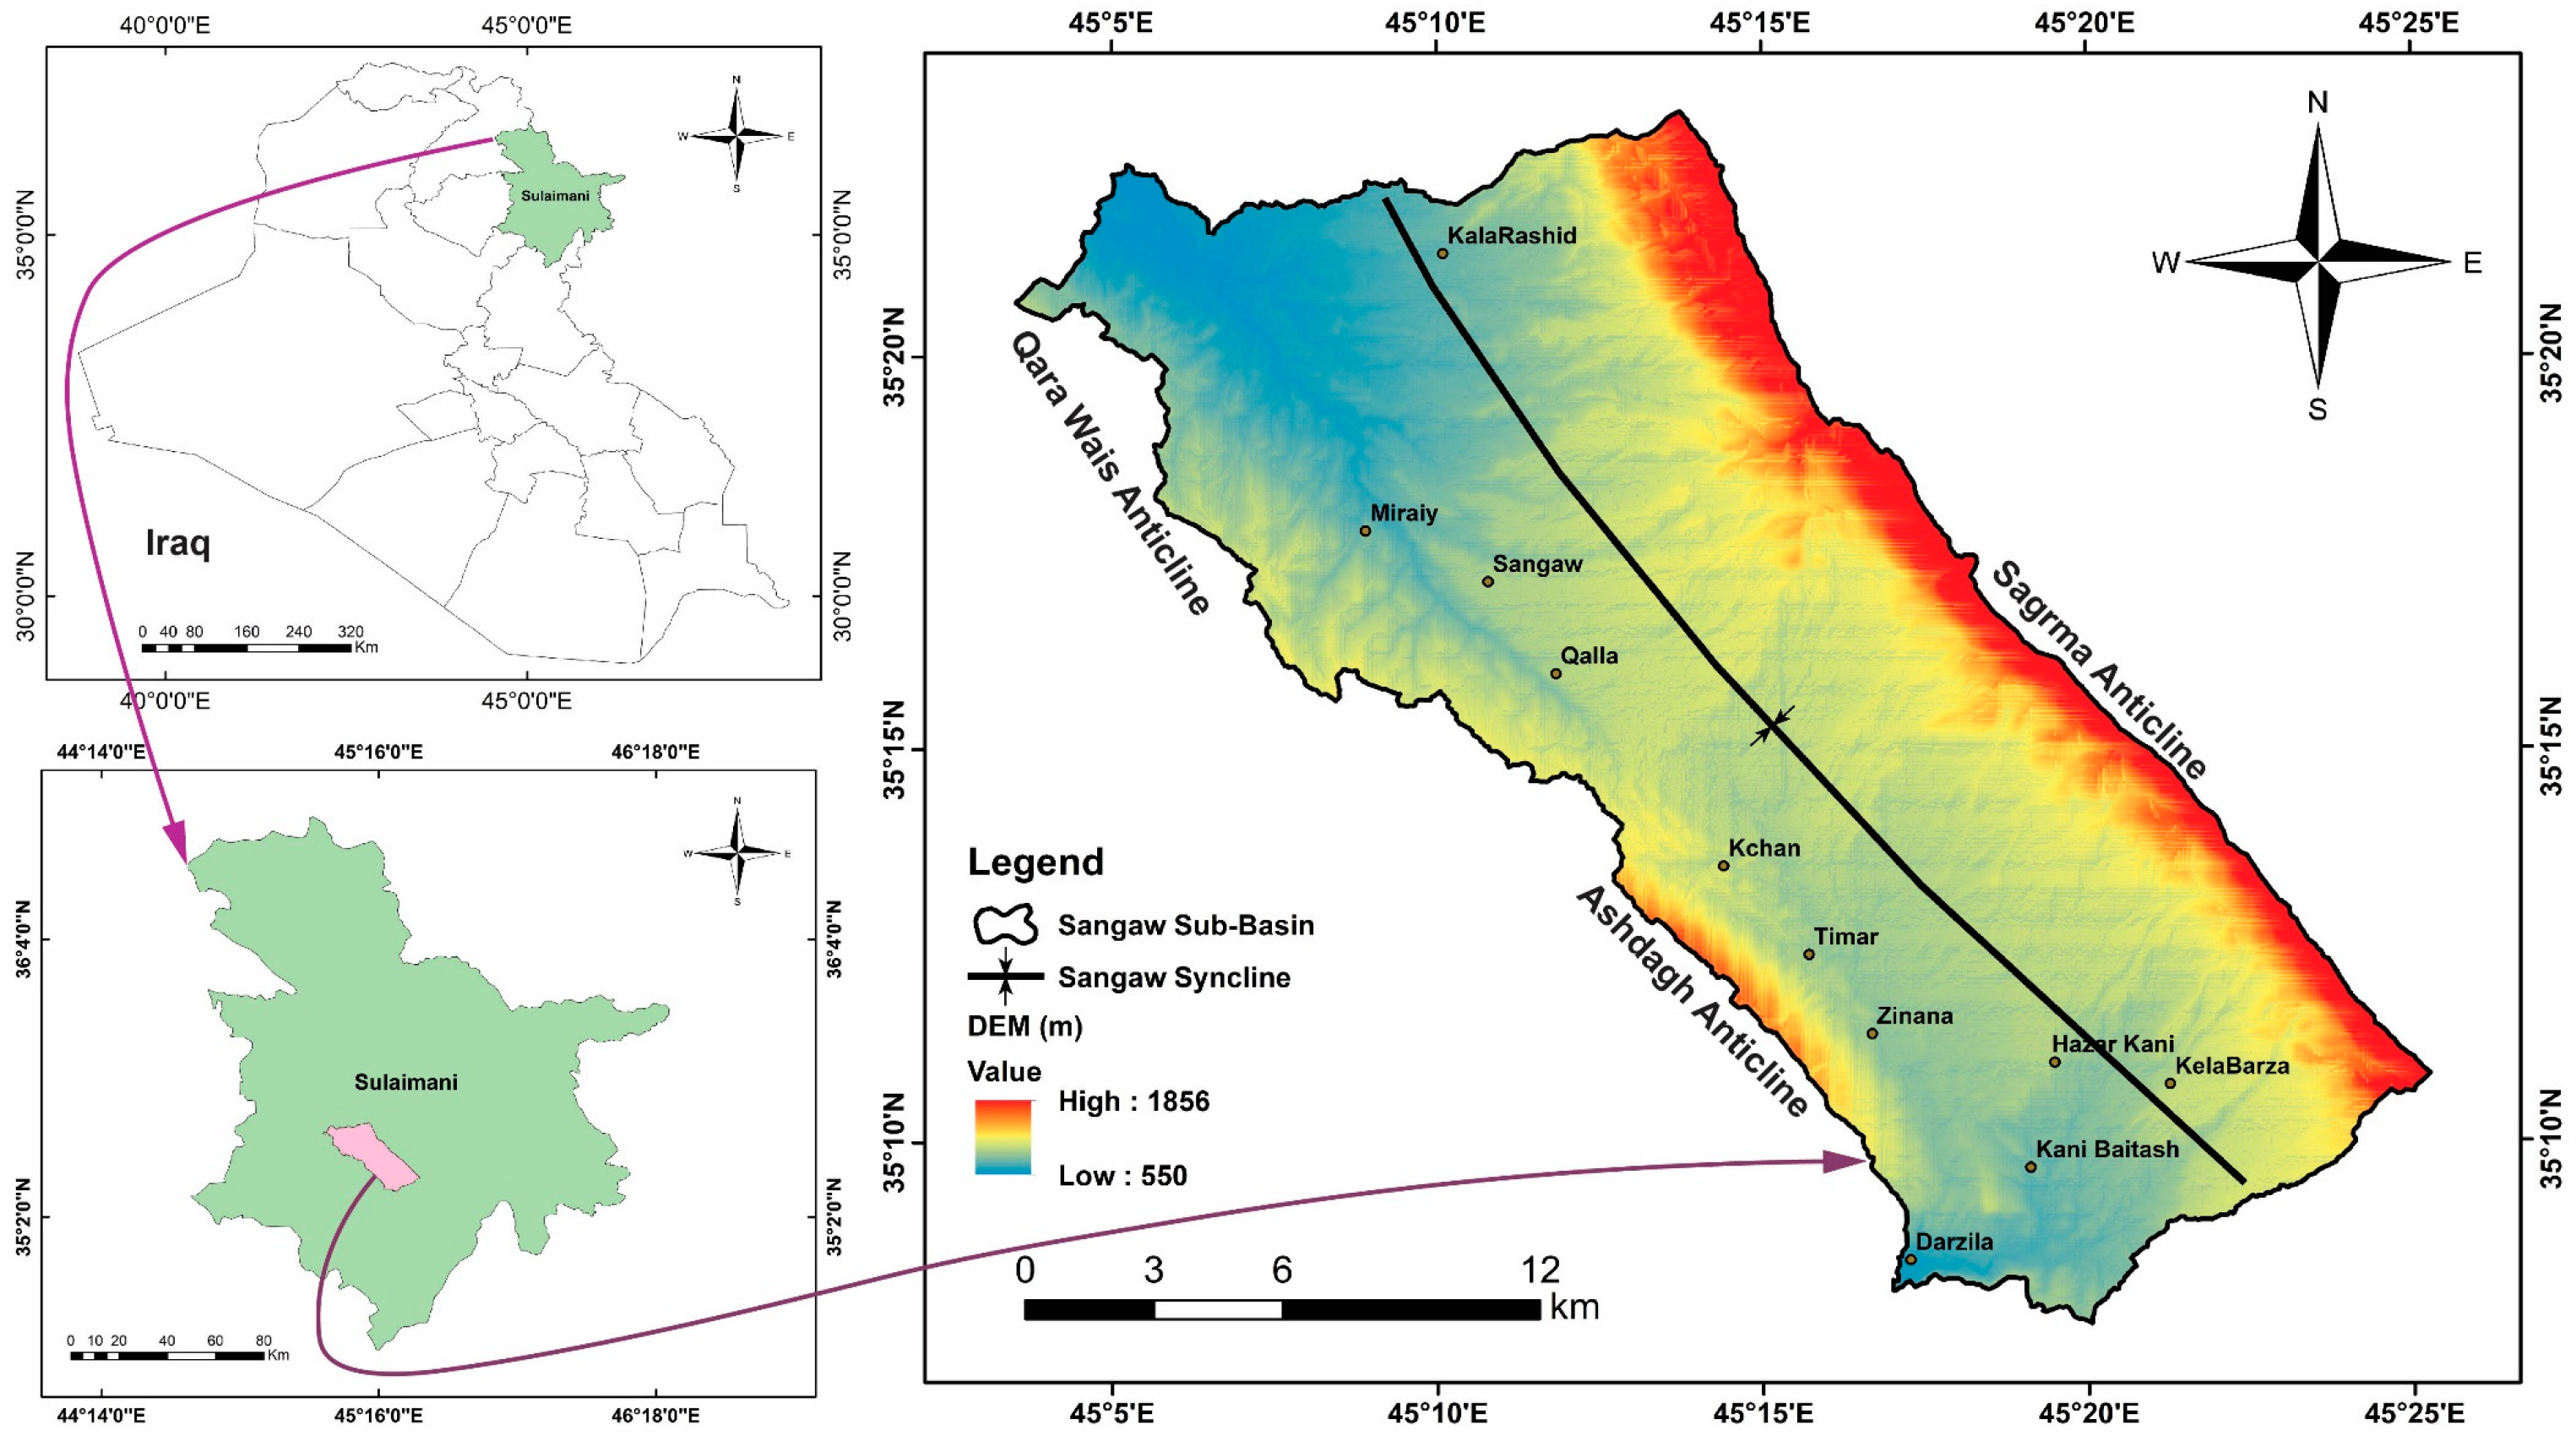
2.1. Area of Study
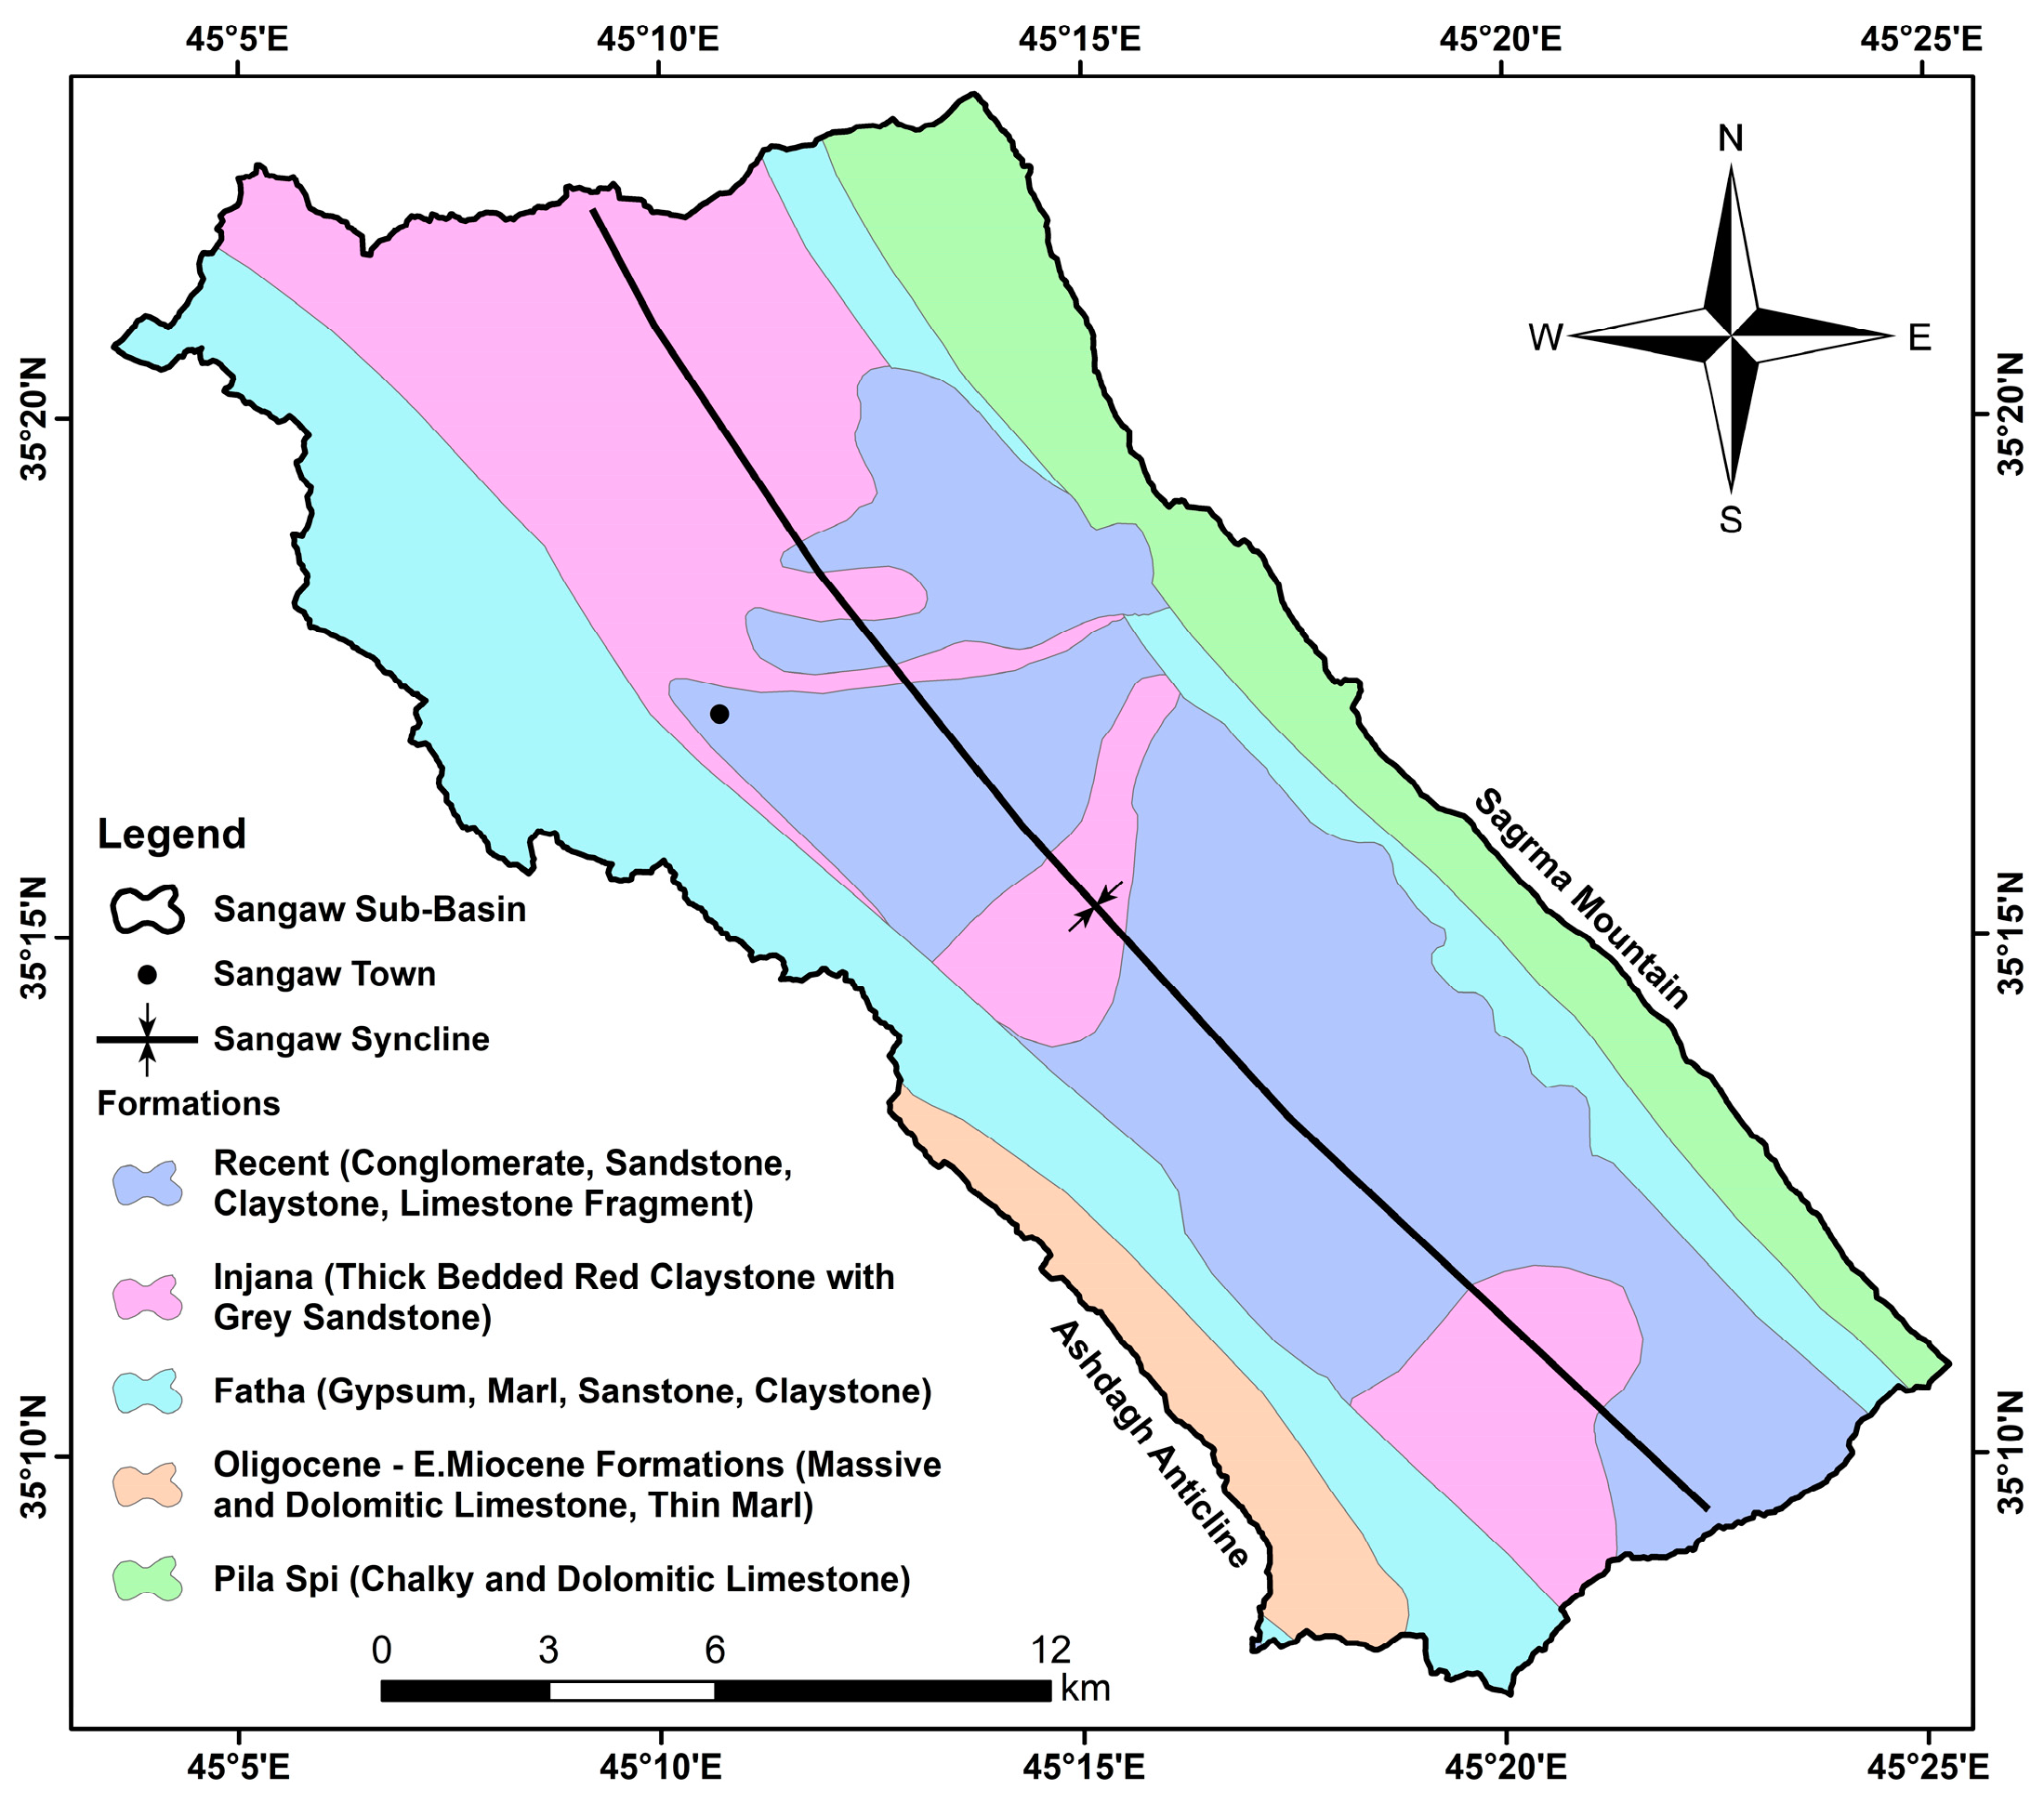
2.2. Geological and Hydrogeological Settings
2.3. Used Data Set and Thematic Layers Preparation
2.4. Assignment and Normalization of Weights
2.5. Normalized Weights for Thematic Maps
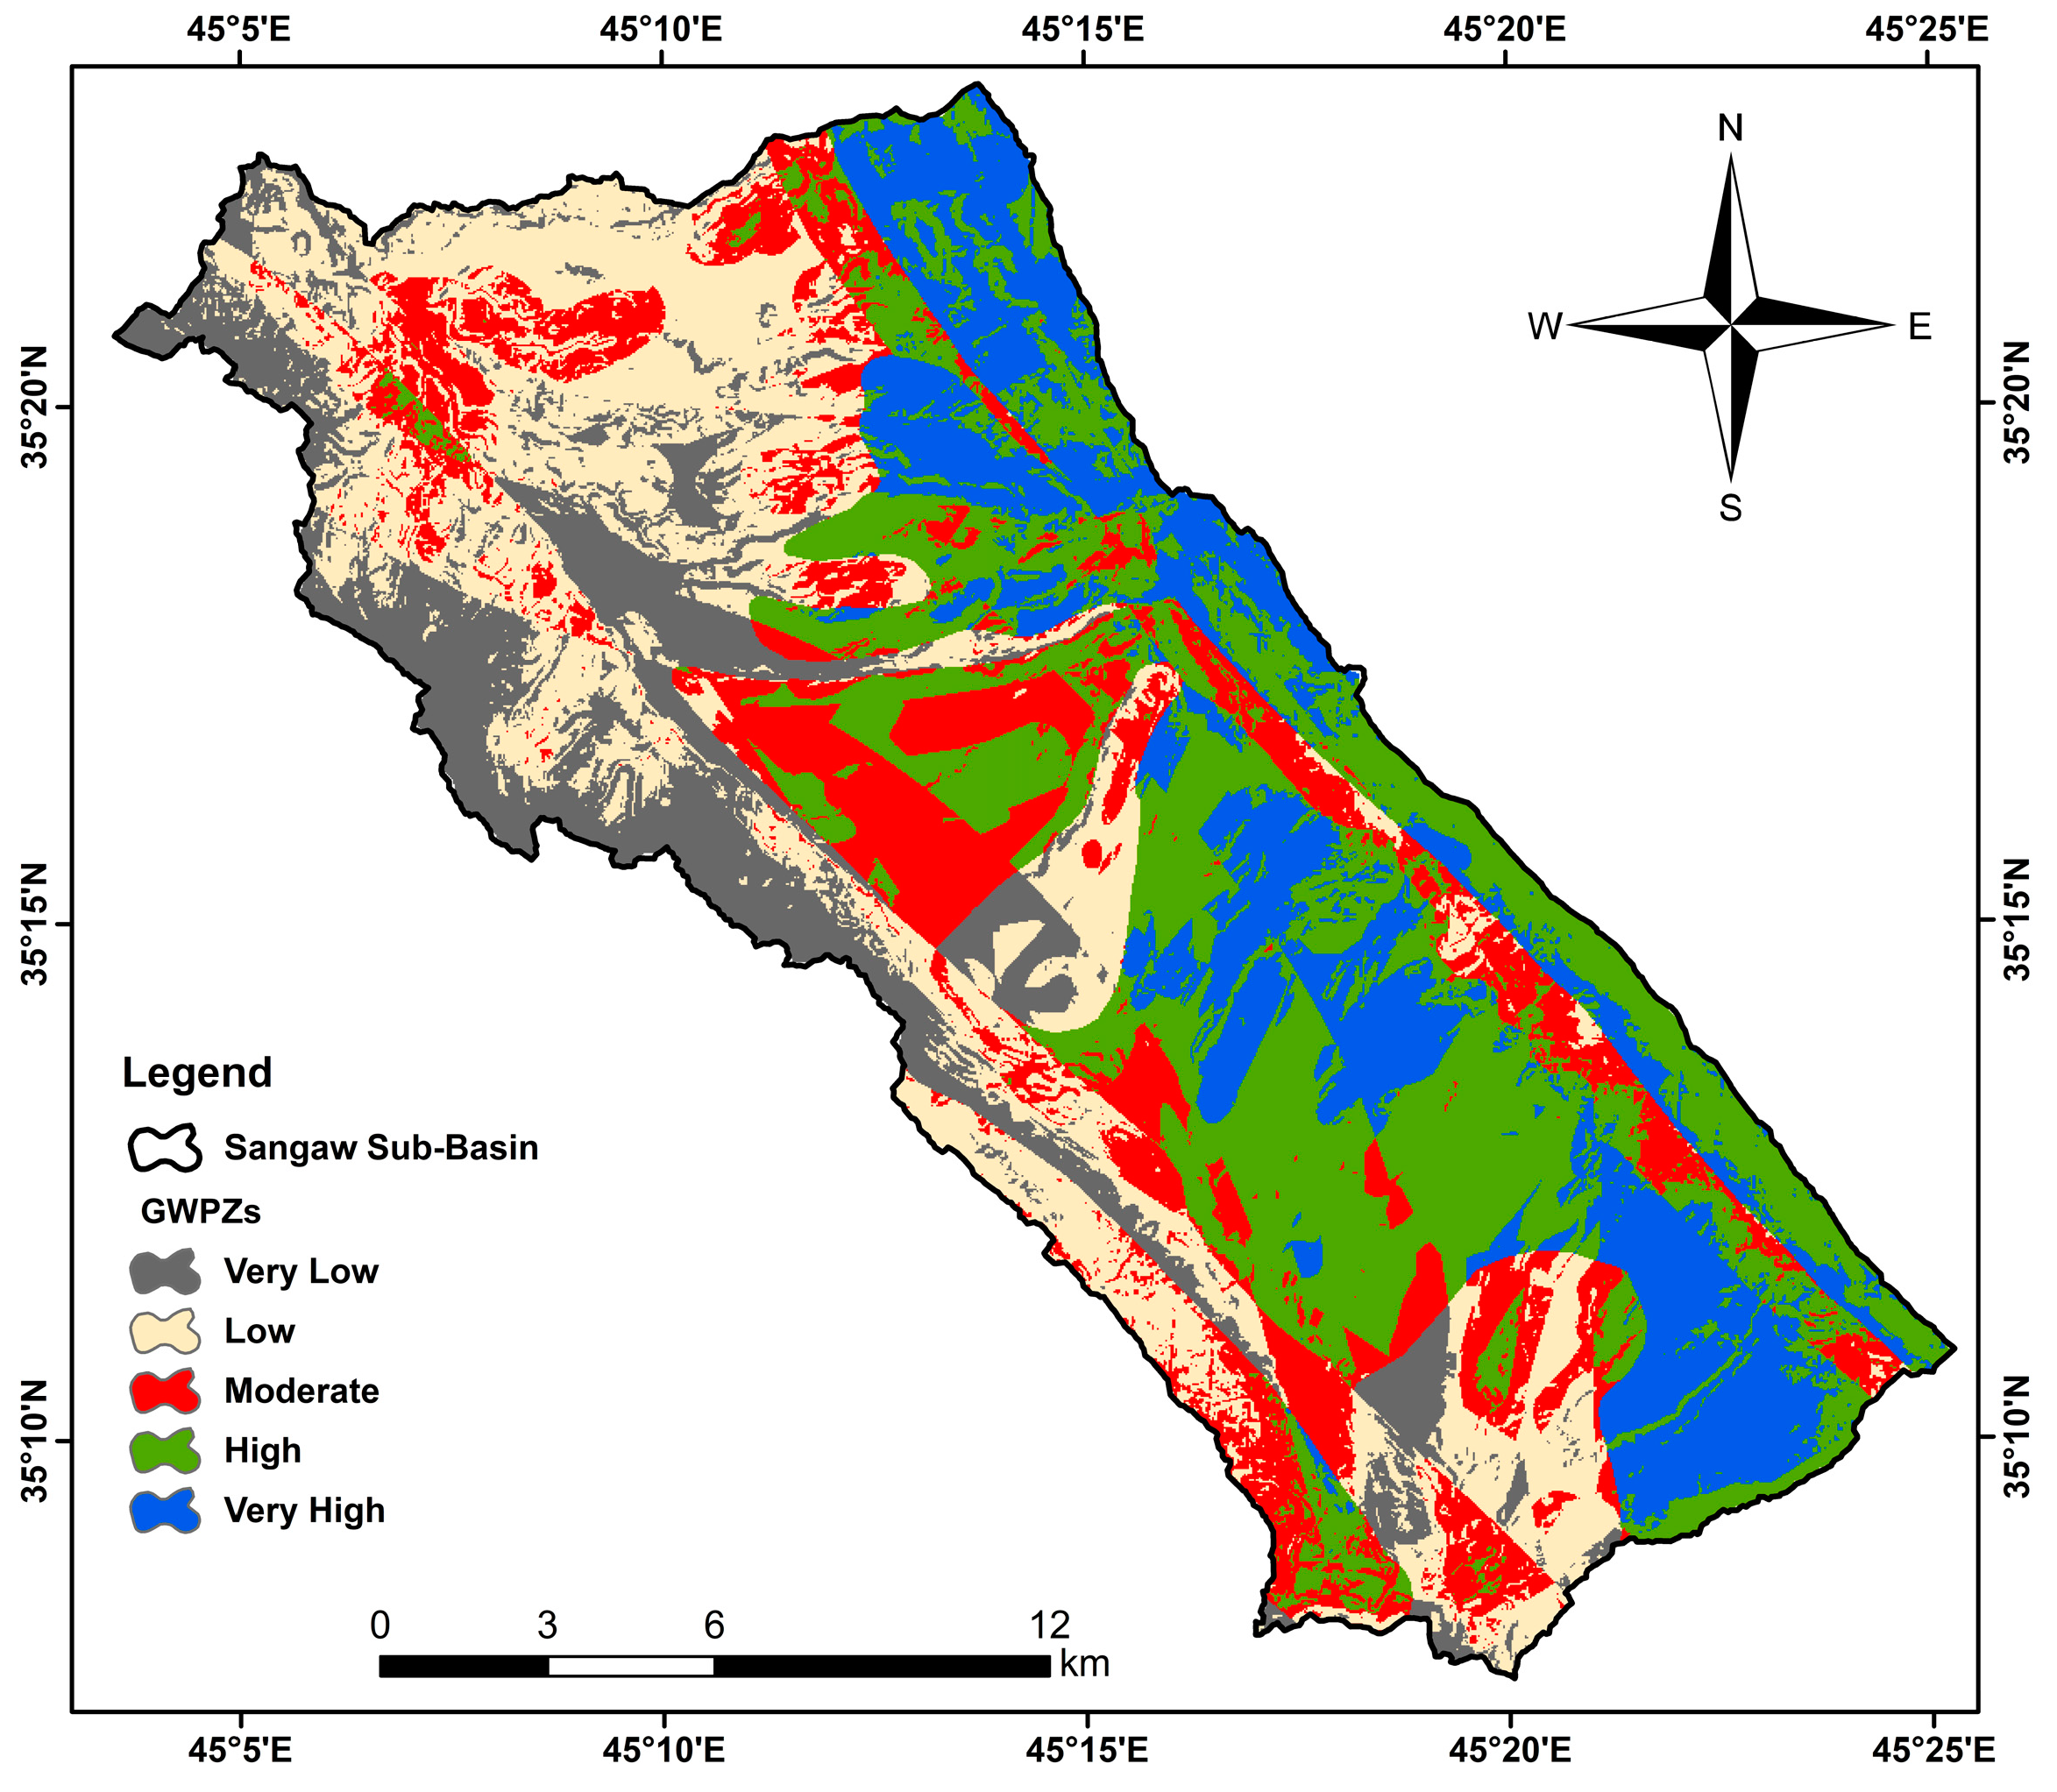
2.6. Groundwater Potential Zones Identification
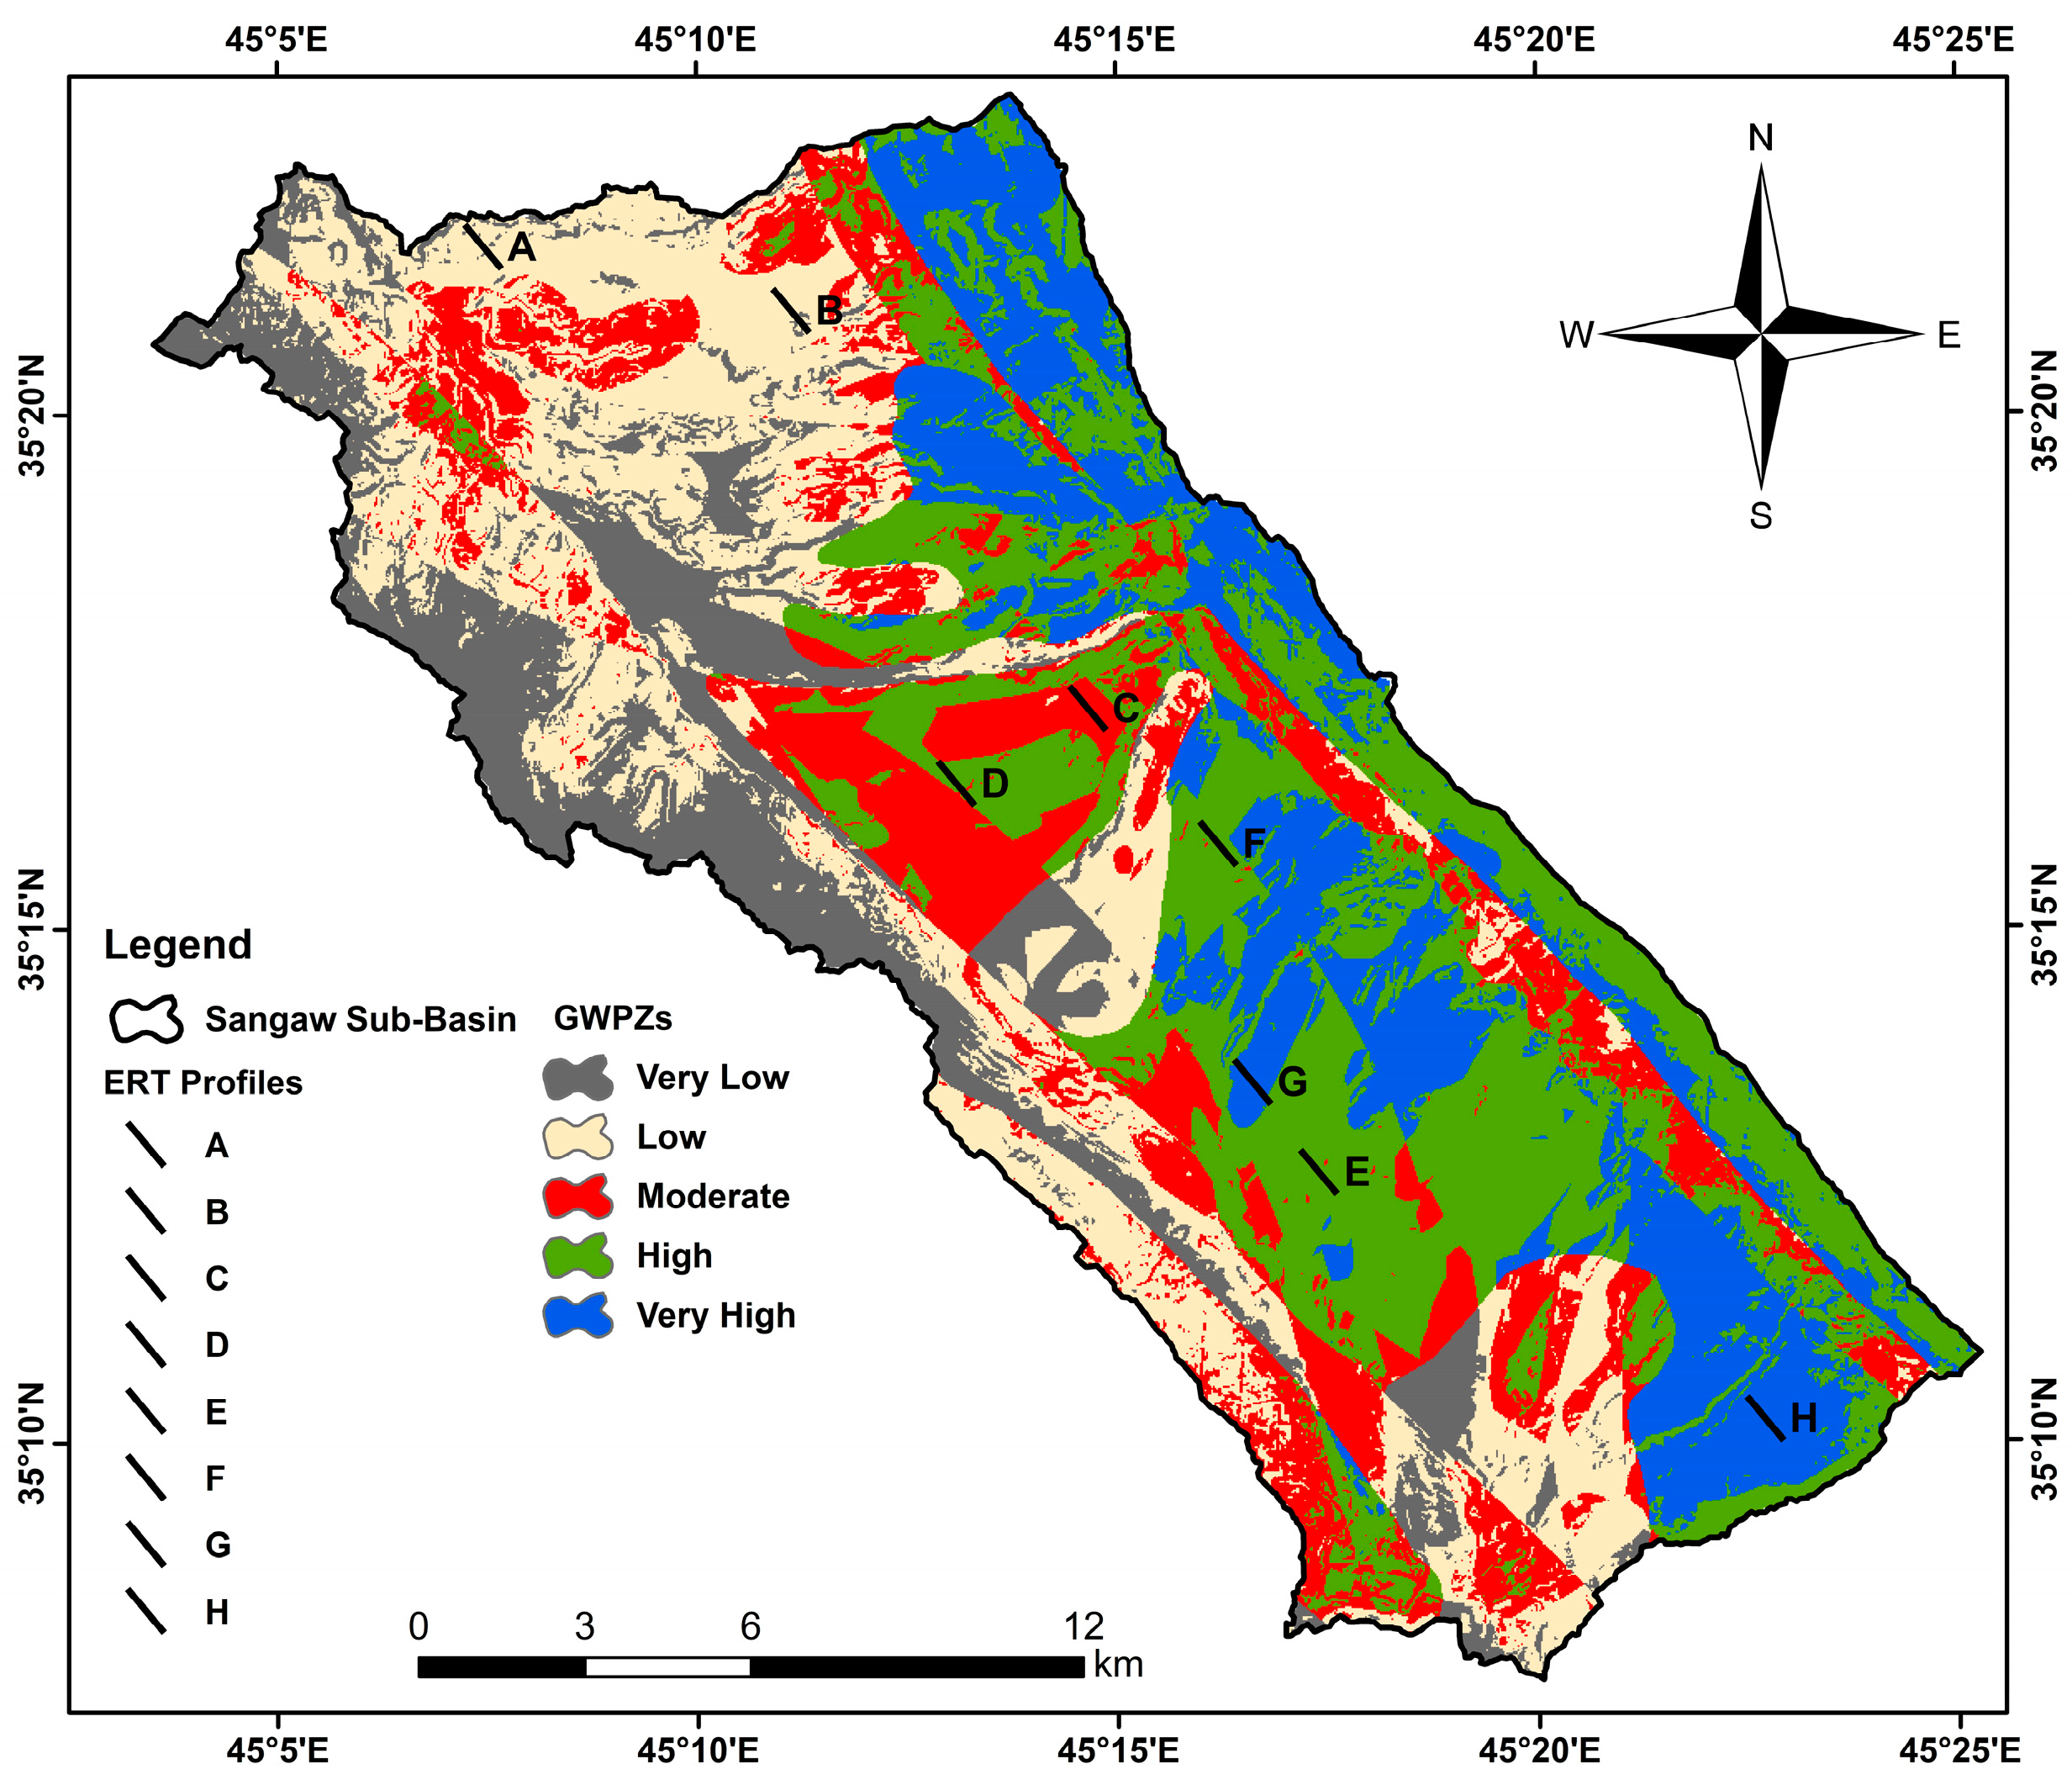
2.7. Validation of Groundwater Potential Map
3. Results
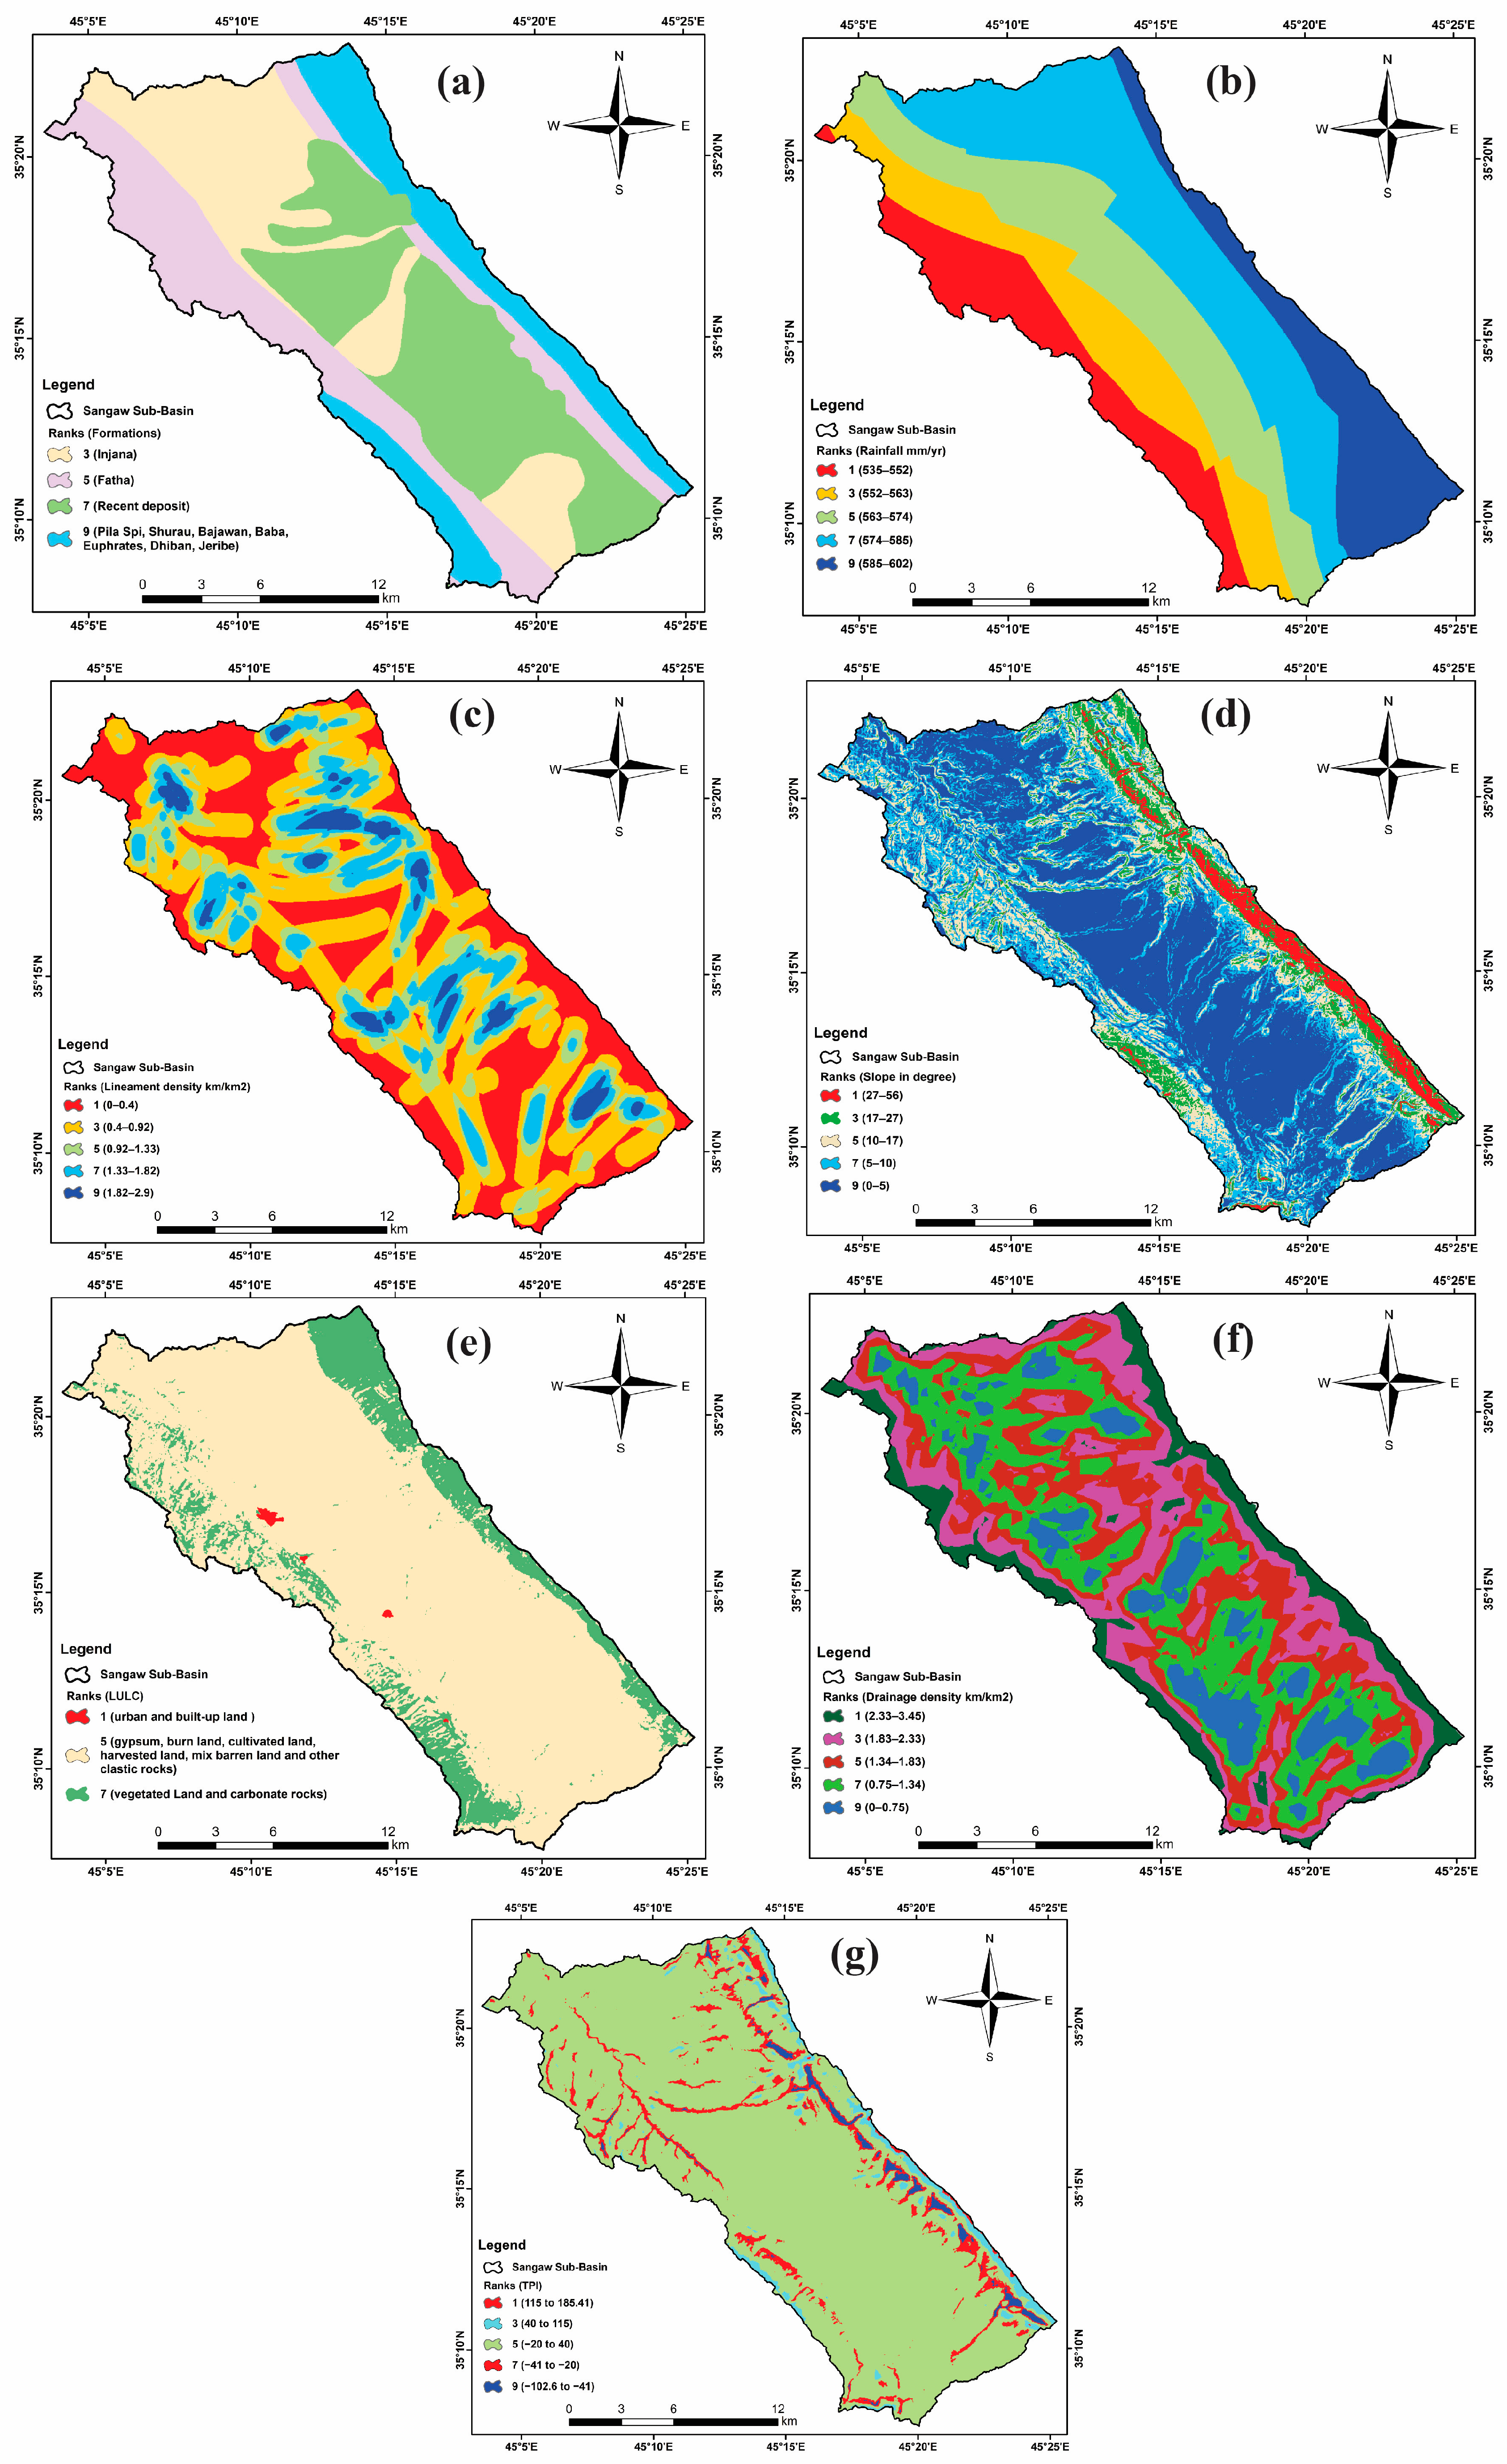
3.1. Thematic Layers for GWPZ Mapping in the Study Area
3.1.1. Geology
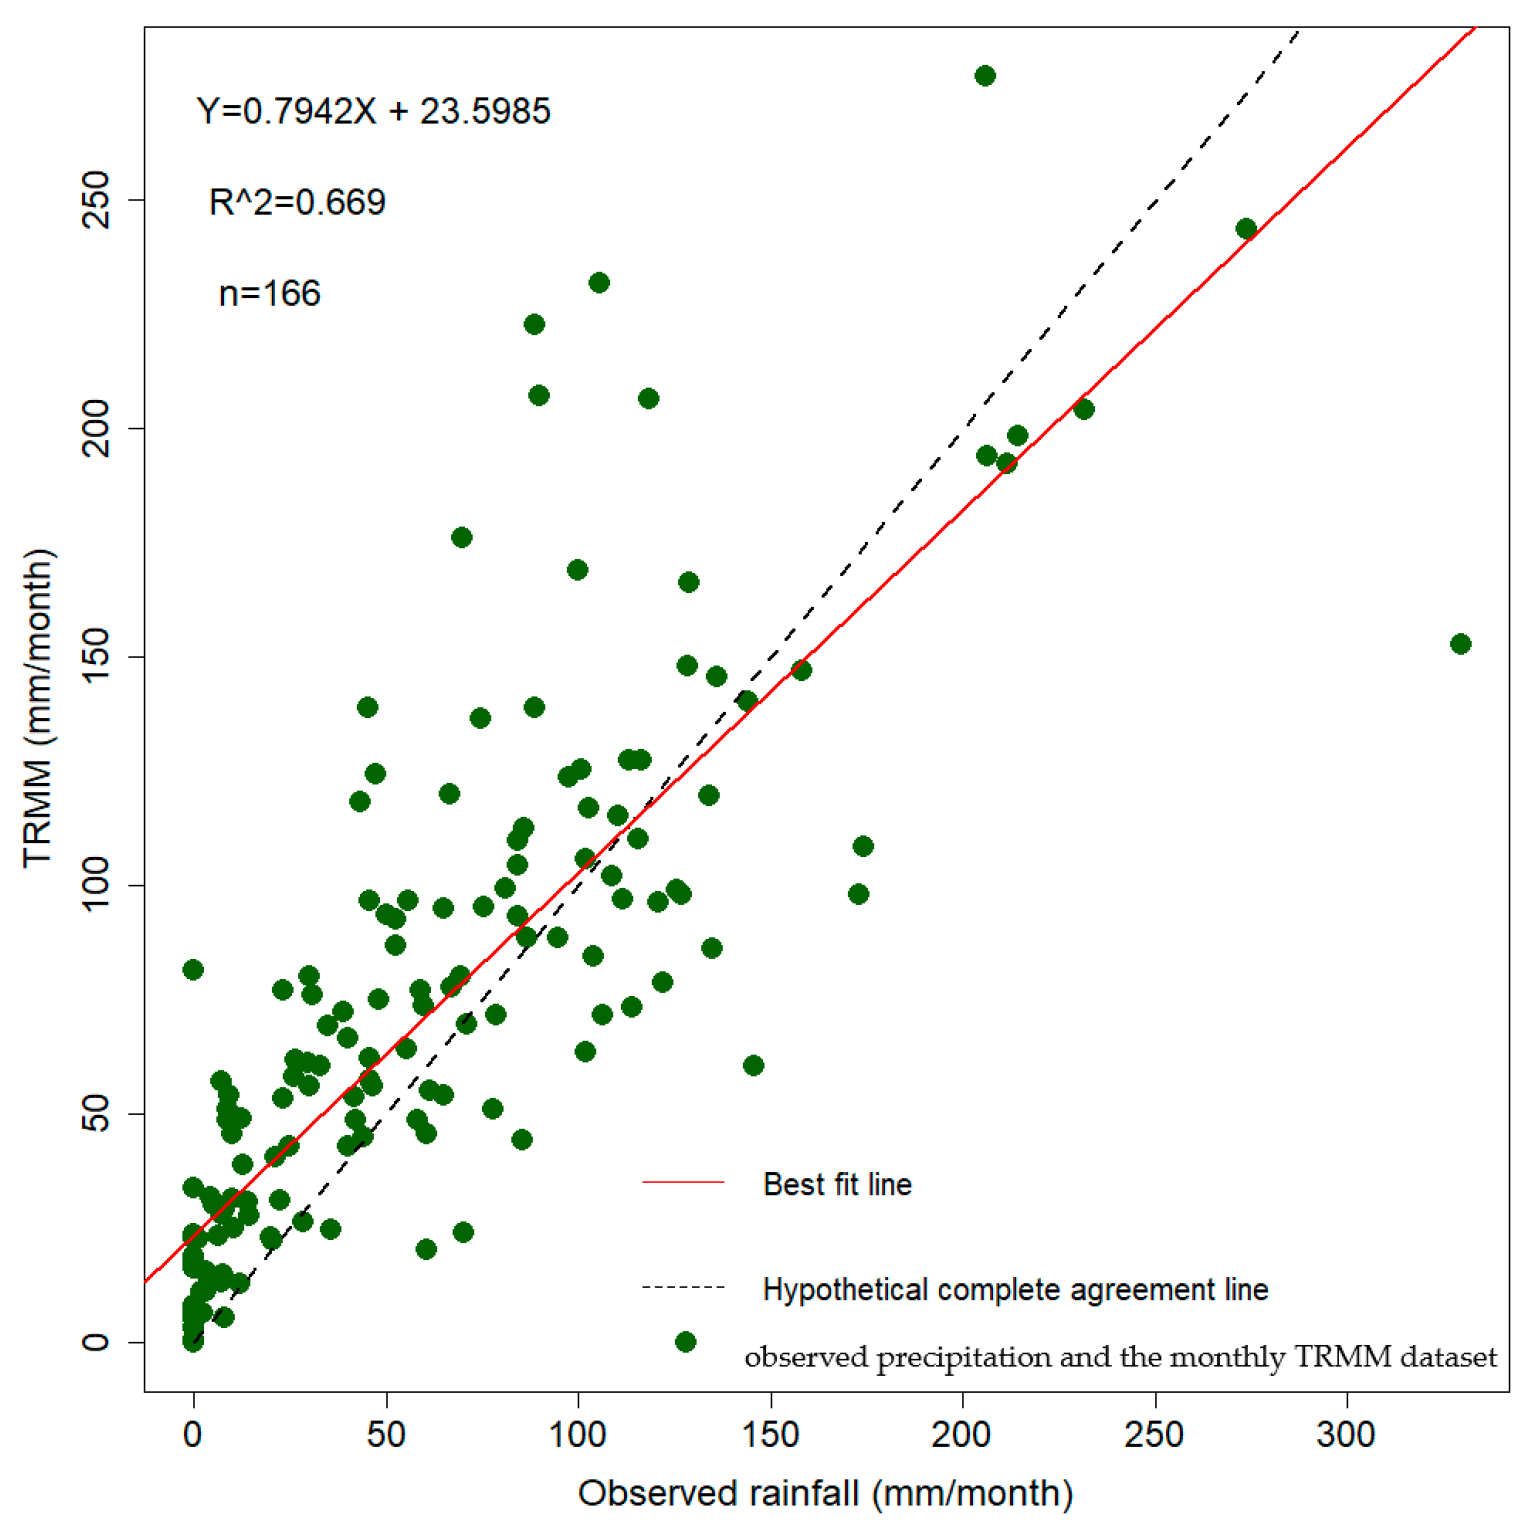
3.1.2. Rainfall
3.1.3. Lineament Density
3.1.4. Slope
3.1.5. Land Use/Land Cover
3.1.6. Drainage Density
3.1.7. Topographic Position Index (TPI)
4. Discussion
4.1. Delineation of GWPZs
4.2. Validation of GWPZs
5. Conclusions
Author Contributions
Funding
Institutional Review Board Statement
Informed Consent Statement
Data Availability Statement
Acknowledgments
Conflicts of Interest
References
- Mogaji, K.A.; Lim, H.S.; Abdullah, K. Regional Prediction of Groundwater Potential Mapping in a Multifaceted Geology Terrain Using GIS-Based Dempster–Shafer Model. Arab. J. Geosci. 2015, 8, 3235–3258. [Google Scholar] [CrossRef]
- Todd, D.K.; Mays, L.W. Groundwater Hydrology, 3rd ed.; John Wiley and Sons, Inc.: Hoboken, NJ, USA, 2005. [Google Scholar]
- Pandey, K.; Kumar, S.; Malik, A.; Kuriqi, A. Artificial Neural Network Optimized with a Genetic Algorithm for Seasonal Groundwater Table Depth Prediction in Uttar Pradesh, India. Sustainability 2020, 12, 8932. [Google Scholar] [CrossRef]
- Jha, M.K.; Chowdary, V.M.; Chowdhury, A. Groundwater Assessment in Salboni Block, West Bengal (India) Using Remote Sensing, Geographical Information System and Multi-Criteria Decision Analysis Techniques. Hydrogeol. J. 2010, 18, 1713–1728. [Google Scholar] [CrossRef]
- Foster, S.S.D.; Chilton, P.J. Groundwater: The Processes and Global Significance of Aquifer Degradation. Philos. Trans. R. Soc. London. Ser. B Biol. Sci. 2003, 358, 1957–1972. [Google Scholar] [CrossRef] [PubMed] [Green Version]
- Nivesh, S.; Patil, J.P.; Goyal, V.C.; Saran, B.; Singh, A.K.; Raizada, A.; Malik, A.; Kuriqi, A. Assessment of Future Water Demand and Supply Using WEAP Model in Dhasan River Basin, Madhya Pradesh, India. Environ. Sci. Pollut. Res. 2022, 1–14. [Google Scholar] [CrossRef]
- Khafaji, M.S.A.; Alwan, I.A.; Khalaf, A.G.; Bhat, S.A.; Kuriqi, A. Potential Use of Groundwater for Irrigation Purposes in the Middle Euphrates Region, Iraq. Sustain. Water Resour. Manag. 2022, 8, 157. [Google Scholar] [CrossRef]
- Kuriqi, A.; Ali, R.; Pham, Q.B.; Gambini, J.M.; Gupta, V.; Malik, A.; Linh, N.T.T.; Joshi, Y.; Anh, D.T.; Nam, V.T.; et al. Seasonality shift and streamflow flow variability trends in central India. Acta Geophys. 2020, 68, 1461–1475. [Google Scholar] [CrossRef]
- Kuriqi, A.; Pinheiro, A.N.; Sordo-Ward, A.; Garrote, L. Water-Energy-Ecosystem Nexus: Balancing Competing Interests at a Run-of-River Hydropower Plant Coupling a Hydrologic–Ecohydraulic Approach. Energy Convers. Manag. 2020, 223, 113267. [Google Scholar] [CrossRef]
- Bastani, M.; Kholghi, M.; Rakhshandehroo, G.R. Inverse Modeling of Variable-Density Groundwater Flow in a Semi-Arid Area in Iran Using a Genetic Algorithm. Hydrogeol. J. 2010, 18, 1191–1203. [Google Scholar] [CrossRef]
- Arkoprovo, B.; Adarsa, J.; Prakash, S.S. Delineation of Groundwater Potential Zones Using Satellite Remote Sensing and Geographic Information System Techniques: A Case Study from Ganjam District, Orissa, India. Res. J. Recent Sci. 2012, 1, 59–66. [Google Scholar]
- Lee, G.F.; Jones-Lee, A. Evaluation of Surface Water Quality Impacts of Hazardous Chemical Sites. Remediat. J. 1999, 9, 87–113. [Google Scholar] [CrossRef]
- Simeonov, V.; Stratis, J.A.; Samara, C.; Zachariadis, G.; Voutsa, D.; Anthemidis, A.; Sofoniou, M.; Kouimtzis, T. Assessment of the Surface Water Quality in Northern Greece. Water Res. 2003, 37, 4119–4124. [Google Scholar] [CrossRef] [PubMed]
- Maity, D.K.; Mandal, S. Identification of Groundwater Potential Zones of the Kumari River Basin, India: An RS & GIS Based Semi-Quantitative Approach. Environ. Dev. Sustain. 2019, 21, 1013–1034. [Google Scholar]
- Ozdemir, A. GIS-Based Groundwater Spring Potential Mapping in the Sultan Mountains (Konya, Turkey) Using Frequency Ratio, Weights of Evidence and Logistic Regression Methods and Their Comparison. J. Hydrol. 2011, 411, 290–308. [Google Scholar] [CrossRef]
- Madani, A.; Niyazi, B. Groundwater Potential Mapping Using Remote Sensing Techniques and Weights of Evidence GIS Model: A Case Study from Wadi Yalamlam Basin, Makkah Province, Western Saudi Arabia. Environ. Earth Sci. 2015, 74, 5129–5142. [Google Scholar] [CrossRef]
- Park, S.; Hamm, S.-Y.; Jeon, H.-T.; Kim, J. Evaluation of Logistic Regression and Multivariate Adaptive Regression Spline Models for Groundwater Potential Mapping Using R and GIS. Sustainability 2017, 9, 1157. [Google Scholar] [CrossRef] [Green Version]
- Miraki, S.; Zanganeh, S.H.; Chapi, K.; Singh, V.P.; Shirzadi, A.; Shahabi, H.; Pham, B.T. Mapping Groundwater Potential Using a Novel Hybrid Intelligence Approach. Water Resour. Manag. 2019, 33, 281–302. [Google Scholar] [CrossRef]
- Lee, S.; Hong, S.-M.; Jung, H.-S. GIS-Based Groundwater Potential Mapping Using Artificial Neural Network and Support Vector Machine Models: The Case of Boryeong City in Korea. Geocarto Int. 2018, 33, 847–861. [Google Scholar] [CrossRef]
- Naghibi, S.A.; Pourghasemi, H.R. A Comparative Assessment between Three Machine Learning Models and Their Performance Comparison by Bivariate and Multivariate Statistical Methods in Groundwater Potential Mapping. Water Resour. Manag. 2015, 29, 5217–5236. [Google Scholar] [CrossRef]
- Naghibi, S.A.; Pourghasemi, H.R.; Dixon, B. GIS-Based Groundwater Potential Mapping Using Boosted Regression Tree, Classification and Regression Tree, and Random Forest Machine Learning Models in Iran. Environ. Monit. Assess. 2016, 188, 1–27. [Google Scholar] [CrossRef]
- Naghibi, S.A.; Pourghasemi, H.R.; Abbaspour, K. A comparison between ten advanced and soft computing models for groundwater qanat potential assessment in Iran using R and GIS. Theor. Appl. Clim. 2018, 131, 967–984. [Google Scholar] [CrossRef]
- Madrucci, V.; Taioli, F.; de Araújo, C.C. Groundwater Favorability Map Using GIS Multicriteria Data Analysis on Crystalline Terrain, Sao Paulo State, Brazil. J. Hydrol. 2008, 357, 153–173. [Google Scholar] [CrossRef]
- Pietersen, K. Multiple Criteria Decision Analysis (MCDA): A Tool to Support Sustainable Management of Groundwater Resources in South Africa. Water SA 2006, 32, 119–128. [Google Scholar] [CrossRef] [Green Version]
- Rahmati, O.; Nazari Samani, A.; Mahdavi, M.; Pourghasemi, H.R.; Zeinivand, H. Groundwater Potential Mapping at Kurdistan Region of Iran Using Analytic Hierarchy Process and GIS. Arab. J. Geosci. 2015, 8, 7059–7071. [Google Scholar] [CrossRef]
- Saaty, T.L. The Analytical Hierarchy Process: Planning, Priority Setting, Resources Allocation; McGraw-Hill: New York, NY, USA, 1980. [Google Scholar]
- Chowdhury, A.; Jha, M.K.; Chowdary, V.M. Delineation of Groundwater Recharge Zones and Identification of Artificial Recharge Sites in West Medinipur District, West Bengal, Using RS, GIS and MCDM Techniques. Environ. Earth Sci. 2010, 59, 1209–1222. [Google Scholar] [CrossRef]
- Hajkowicz, S.; Higgins, A. A Comparison of Multiple Criteria Analysis Techniques for Water Resource Management. Eur. J. Oper. Res. 2008, 184, 255–265. [Google Scholar] [CrossRef]
- Kaliraj, S.; Chandrasekar, N.; Magesh, N.S. Identification of Potential Groundwater Recharge Zones in Vaigai Upper Basin, Tamil Nadu, Using GIS-Based Analytical Hierarchical Process (AHP) Technique. Arab. J. Geosci. 2014, 7, 1385–1401. [Google Scholar] [CrossRef]
- Murthy, K.S.R.; Mamo, A.G. Multi-criteria Decision Evaluation in Groundwater Zones Identification in Moyale-Teltele Subbasin, South Ethiopia. Int. J. Remote Sens. 2009, 30, 2729–2740. [Google Scholar] [CrossRef]
- Hajkowicz, S.; Collins, K. A Review of Multiple Criteria Analysis for Water Resource Planning and Management. Water Resour. Manag. 2007, 21, 1553–1566. [Google Scholar] [CrossRef]
- Chenini, I.; Mammou, A.B.; El May, M. Groundwater Recharge Zone Mapping Using GIS-Based Multi-Criteria Analysis: A Case Study in Central Tunisia (Maknassy Basin). Water Resour. Manag. 2010, 24, 921–939. [Google Scholar] [CrossRef]
- Andualem, T.G.; Demeke, G.G. Groundwater potential assessment using GIS and remote sensing: A case study of Guna tana landscape, upper blue Nile Basin, Ethiopia. J. Hydrol. Reg. Stud. 2019, 24, 100610. [Google Scholar] [CrossRef]
- Das, B.; Pal, S.C.; Malik, S.; Chakrabortty, R. Modeling groundwater potential zones of Puruliya district, West Bengal, India using remote sensing and GIS techniques. Geol. Ecol. Landscapes 2019, 3, 223–237. [Google Scholar] [CrossRef] [Green Version]
- Jha, M.K.; Chowdhury, A.; Chowdary, V.M.; Peiffer, S. Groundwater Management and Development by Integrated Remote Sensing and Geographic Information Systems: Prospects and Constraints. Water Resour. Manag. 2007, 21, 427–467. [Google Scholar] [CrossRef]
- Kaur, L.; Rishi, M.S.; Singh, G.; Thakur, S.N. Groundwater Potential Assessment of an Alluvial Aquifer in Yamuna Sub-Basin (Panipat Region) Using Remote Sensing and GIS Techniques in Conjunction with Analytical Hierarchy Process (AHP) and Catastrophe Theory (CT). Ecol. Indic. 2020, 110, 105850. [Google Scholar] [CrossRef]
- Shahid, S.; Nath, S.K.; Roy, J. Groundwater potential modelling in a soft rock area using a GIS. Int. J. Remote. Sens. 2000, 21, 1919–1924. [Google Scholar] [CrossRef]
- Arulbalaji, P.; Padmalal, D.; Sreelash, K. GIS and AHP Techniques Based Delineation of Groundwater Potential Zones: A Case Study from Southern Western Ghats, India. Sci. Rep. 2019, 9, 1–17. [Google Scholar] [CrossRef] [PubMed] [Green Version]
- Kumar, D.; Mondal, S.; Warsi, T. Deep Insight to the Complex Aquifer and Its Characteristics from High Resolution Electrical Resistivity Tomography and Borehole Studies for Groundwater Exploration and Development. J. Earth Syst. Sci. 2020, 129, 1–15. [Google Scholar] [CrossRef]
- Chowdary, V.M.; Chakraborthy, D.; Jeyaram, A.; Murthy, Y.V.N.; Sharma, J.R.; Dadhwal, V.K. Multi-Criteria Decision Making Approach for Watershed Prioritization Using Analytic Hierarchy Process Technique and GIS. Water Resour. Manag. 2013, 27, 3555–3571. [Google Scholar] [CrossRef]
- Al-Manmi, D.A.M.; Rauf, L.F. Groundwater Potential Mapping Using Remote Sensing and GIS-Based, in Halabja City, Kurdistan, Iraq. Arab. J. Geosci. 2016, 9, 357. [Google Scholar] [CrossRef]
- Islami, N.; Taib, S.H.; Yusoff, I.; Ghani, A.A. Integrated geoelectrical resistivity and hydrogeochemical methods for delineating and mapping heavy metal zone in aquifer system. Environ. Earth Sci. 2018, 77, 383. [Google Scholar] [CrossRef]
- Karim, H.A.; Al-Manmi, D.A. Integrating GIS-Based and Geophysical Techniques for Groundwater Potential Assessment in Halabja Said Sadiq Sub-Basin, Kurdistan, NE Iraq. Tikrit J. Pure Sci. 2019, 24, 81–92. [Google Scholar] [CrossRef]
- Mogaji, K.A.; Omosuyi, G.O.; Adelusi, A.O.; Lim, H.S. Application of GIS-Based Evidential Belief Function Model to Regional Groundwater Recharge Potential Zones Mapping in Hardrock Geologic Terrain. Environ. Process. 2016, 3, 93–123. [Google Scholar] [CrossRef]
- Mohammed, S. Groundwater Potential Mapping Using Remote Sensing and GIS of a Part of Chamchamal Basin, Sulaimani, Kurdistan Region, Iraq. Master’s Thesis, University of Miskolc, Miskolc, Hungary, 2017; 70p. [Google Scholar]
- Oh, H.-J.; Kim, Y.-S.; Choi, J.-K.; Park, E.; Lee, S. GIS Mapping of Regional Probabilistic Groundwater Potential in the Area of Pohang City, Korea. J. Hydrol. 2011, 399, 158–172. [Google Scholar] [CrossRef]
- Sonkamble, S.; Satishkumar, V.; Amarender, B.; Sethurama, S. Combined Ground-Penetrating Radar (GPR) and Electrical Resistivity Applications Exploring Groundwater Potential Zones in Granitic Terrain. Arab. J. Geosci. 2014, 7, 3109–3117. [Google Scholar] [CrossRef]
- Venkateswaran, S.; Prabhu, M.V.; Karuppannan, S. Delineation of Groundwater Potential Zones Using Geophysical and GIS Techniques in the Sarabanga Sub Basin, Cauvery River, Tamil Nadu, India. Int. J. Curr. Res. Acad. Rev. 2014, 2, 58–75. [Google Scholar]
- Kowalsky, M.B.; Gasperikova, E.; Finsterle, S.; Watson, D.; Baker, G.; Hubbard, S.S. Coupled Modeling of Hydrogeochemical and Electrical Resistivity Data for Exploring the Impact of Recharge on Subsurface Contamination. Water Resour. Res. 2011, 47, 1–22. [Google Scholar] [CrossRef]
- Al-Manmi, D.A.M.A.; Ismaeel, S.B.; Altaweel, M. Reconstruction of palaeoclimate in Shalaii Cave, SE of Sangaw, Kurdistan Province of Iraq. Palaeogeogr. Palaeoclim. Palaeoecol. 2019, 524, 262–272. [Google Scholar] [CrossRef]
- Iurkiewicz, A.A.; Stevanovic, Z.P. Reconnaissance Study of Active Sulfide Springs and Cave Systems in the Southern Part of the Sulaimani Governorate (NE Iraq). Carbonates Evaporites 2010, 25, 203–216. [Google Scholar] [CrossRef]
- Othman, A.A.; Shihab, A.T.; Al-Maamar, A.F.; Al-Saady, Y.I. Monitoring of the Land Cover Changes in Iraq. In Environmental Remote Sensing and GIS in Iraq; Springer: Berlin/Heidelberg, Germany, 2020; pp. 181–203. [Google Scholar]
- Abdullah, H.G.; Collier, R.E.L.; Mountney, N.P. The palaeoshoreline of Early Miocene formations (Euphrates and Jeribe) at the periphery of the Zagros Foreland Basin, Sulaimani Governorate, Kurdistan Region, NE Iraq. Arab. J. Geosci. 2019, 12, 574. [Google Scholar] [CrossRef] [Green Version]
- Jassim, S.Z.; Goff, J.C. Geology of Iraq; DOLIN, sro, distributed by Geological Society of London: London, UK, 2006; ISBN 8070282878. [Google Scholar]
- Khanaqa, P.A.; Karim, K.H. Stratigraphical and Structural Analyses of the Sagrma (Sagerma) Anticline, Sulaimani Area, Iraqi Kurdistan Region. J. Geogr. Geol. 2015, 7, 74. [Google Scholar] [CrossRef] [Green Version]
- Kharajiany, S.O. The Occurrence of Early and Middle Miocene Rocks (Euphrates, Dhiban and Jeribe Formations) In Ashdagh Mountain, Sangaw Area, Sulaimaniyah Vicinity, NE Iraq. Iraqi Bull. Geol. Min. 2014, 10, 21–39. [Google Scholar]
- Kharajiany, S.O.A. Sedimentary Facies of Oligocene Rock Units in Ashdagh Mountain-Sangaw District-Kurdistan Region. Master’s Thesis, University of Sulaimani, Sulaimani, Iraq, 2008. [Google Scholar]
- Al-Manmi, D.A.M.; Aziz, B.Q.; Kareem, A.T.; Othman, H.A.; Mohammed, S.H.; Karim, H.A.; Mustafa, A.I.; Muhammed, H.F. A Study of Mineralized Water Using Geophysical and Hydrogeochemical Approaches in Khwelen Salt Ponds, Sangaw, Sulaymaniyah, NE of Iraq. Tikrit J. Pure Sci. 2021, 25, 47–61. [Google Scholar]
- Stevanovic, Z.; Markovic, M. Hydrogeology of Northern Iraq. Vol. 1. Climate, Hydrology, Geomorphology & Geology. Vol. 2. General Hydrogeology and Aquifer Systems; FAO: Rome, Italy, 2004. [Google Scholar]
- Al-Hafeed, S.B.I. Reconstructing of Paleoclimate through Hydrogeological and Environmental Studies of Shalaii Cave, SE of Sangaw, Iraqi Kurdistan Region, Sulaimani; University of Sulaimani: Sulaimani, Iraq, 2016. [Google Scholar]
- Patra, S.; Mishra, P.; Mahapatra, S.C. Delineation of Groundwater Potential Zone for Sustainable Development: A Case Study from Ganga Alluvial Plain Covering Hooghly District of India Using Remote Sensing, Geographic Information System and Analytic Hierarchy Process. J. Clean. Prod. 2018, 172, 2485–2502. [Google Scholar] [CrossRef]
- Pathmanandakumar, V.; Thasarathan, N.; Ranagalage, M. An Approach to Delineate Potential Groundwater Zones in Kilinochchi District, Sri Lanka, Using GIS Techniques. ISPRS Int. J. Geo-Inf. 2021, 10, 730. [Google Scholar] [CrossRef]
- Ma’ala, K.A. The Geology of Sulaimaniya Quadrangle. Sheet No. Ni-38–3, Scale 1: 250000. Geol. Surv. Iraq 2008, 80. [Google Scholar]
- Sissakian, V.; Geologist, E.P.C.; Fouad, S.F.; General, I.G.S.D. Geological map of Sulaimaniyah quadrangle, at scale of 1: 250,000. J. Zankoy Sulaimani—Part A 2014, GeoKurdist, 151–161. [Google Scholar] [CrossRef]
- GSFC_DAAC Tropical Rainfall Measurement Mission Project (TRMM; 3B43 V7). Available online: https://disc.gsfc.nasa.gov/datasets/TRMM_3B43_7/summary (accessed on 21 January 2023).
- Al-Rubaiay, A.T.; Al-Dulaimi, T.Y. Series of Land Use Land Cover Maps of Iraq Scale 1: 250 000. Sulaimaniya Quadrang. Sheet NI–38–3 (LULCM 10). 2012. Available online: http://iiir-mim.gov.iq/xmlui/handle/123456789/32976 (accessed on 7 November 2022).
- Saaty, T. A scaling method for priorities in hierarchical structures. J. Math. Psychol. 1977, 15, 234–281. [Google Scholar] [CrossRef]
- Rajasekhar, M.; Raju, G.S.; Sreenivasulu, Y.; Raju, R.S. Delineation of Groundwater Potential Zones in Semi-Arid Region of Jilledubanderu River Basin, Anantapur District, Andhra Pradesh, India Using Fuzzy Logic, AHP and Integrated Fuzzy-AHP Approaches. HydroResearch 2019, 2, 97–108. [Google Scholar] [CrossRef]
- Saaty, T.L. Decision Making for Leaders: The Analytic Hierarchy Process for Decisions in a Complex World; RWS publications: Pittsburgh, PA, USA, 1990; ISBN 1888603135. [Google Scholar]
- Ahmadi, H.; Kaya, O.A.; Babadagi, E.; Savas, T.; Pekkan, E. GIS-Based Groundwater Potentiality Mapping Using AHP and FR Models in Central Antalya, Turkey. Environ. Sci. Proc. 2020, 5, 11. [Google Scholar]
- Kumari, A.; Kumar, D.; Warwade, P. Application of Multi-Criteria Decision Making (MCDM) and Electrical Resistivity Tomography (ERT) Techniques for Identification of Groundwater Recharge Zone(s) in Granitic Hard Rock Aquifer. J. Earth Syst. Sci. 2021, 130, 1–17. [Google Scholar] [CrossRef]
- Kumar, V.A.; Mondal, N.C.; Ahmed, S. Identification of Groundwater Potential Zones Using RS, GIS and AHP Techniques: A Case Study in a Part of Deccan Volcanic Province (DVP), Maharashtra, India. J. Indian Soc. Remote. Sens. 2020, 48, 497–511. [Google Scholar] [CrossRef]
- Sapkota, S.; Pandey, V.P.; Bhattarai, U.; Panday, S.; Shrestha, S.R.; Maharjan, S.B. Groundwater potential assessment using an integrated AHP-driven geospatial and field exploration approach applied to a hard-rock aquifer Himalayan watershed. J. Hydrol. Reg. Stud. 2021, 37, 100914. [Google Scholar] [CrossRef]
- Aziz, B.Q. Two Dimension Resistivity Imaging Tomography for Hydrogeological Study in Bazian Basin, West Sulaimani City, NE-Iraq. Ph. D. Thesis, University of Sulaimani, Sulaymaniyah, Iraq, 2005. [Google Scholar]
- Loke, M.H. Rapid 2-D Resistivity & IP Inversion Using the Least-Squares Method; Geoelectrical Imaging 2D & 3D; Geotomo Software: Penang, Malaysia, 2007. [Google Scholar]
- Loke, M.H.; Barker, R.D. Rapid Least-squares Inversion of Apparent Resistivity Pseudosections by a Quasi-Newton Method1. Geophys. Prospect. 1996, 44, 131–152. [Google Scholar] [CrossRef]
- Dahlin, T. 2D resistivity surveying for environmental and engineering applications. First Break. 1996, 14, 275–283. [Google Scholar] [CrossRef] [Green Version]
- Loke, M.H. Electrical Imaging Surveys for Environmental and Engineering Studies. Pract. Guide 1999, 2, 70. [Google Scholar]
- Bhunia, G.S. An Approach to Demarcate Groundwater Recharge Potential Zone Using Geospatial Technology. Appl. Water Sci. 2020, 10, 138. [Google Scholar] [CrossRef]
- Adiat, K.; Nawawi, M.; Abdullah, K. Assessing the accuracy of GIS-based elementary multi criteria decision analysis as a spatial prediction tool—A case of predicting potential zones of sustainable groundwater resources. J. Hydrol. 2012, 440-441, 75–89. [Google Scholar] [CrossRef]
- Razandi, Y.; Pourghasemi, H.R.; Neisani, N.S.; Rahmati, O. Application of Analytical Hierarchy Process, Frequency Ratio, and Certainty Factor Models for Groundwater Potential Mapping Using GIS. Earth Sci. Inform. 2015, 8, 867–883. [Google Scholar] [CrossRef]
- Ahirwar, S.; Malik, M.S.; Ahirwar, R.; Shukla, J.P. Application of Remote Sensing and GIS for Groundwater Recharge Potential Zone Mapping in Upper Betwa Watershed. J. Geol. Soc. India 2020, 95, 308–314. [Google Scholar] [CrossRef]
- Das, S.; Gupta, A.; Ghosh, S. Exploring Groundwater Potential Zones Using MIF Technique in Semi-Arid Region: A Case Study of Hingoli District, Maharashtra. Spat. Inf. Res. 2017, 25, 749–756. [Google Scholar] [CrossRef]
- Ibrahim-Bathis, K.; Ahmed, S. Geospatial technology for delineating groundwater potential zones in Doddahalla watershed of Chitradurga district, India. Egypt. J. Remote. Sens. Space Sci. 2016, 19, 223–234. [Google Scholar] [CrossRef] [Green Version]
- Senarathne, S.L.; Jayawardana, J.; Edirisinghe, E.; Chandrajith, R. Characterization of Groundwater in Malala Oya River Basin, Sri Lanka Using Geochemical and Isotope Signatures. Groundw. Sustain. Dev. 2019, 9, 100225. [Google Scholar] [CrossRef]
- Das, B.; Pal, S.C. Combination of GIS and Fuzzy-AHP for Delineating Groundwater Recharge Potential Zones in the Critical Goghat-II Block of West Bengal, India. HydroResearch 2019, 2, 21–30. [Google Scholar] [CrossRef]
- Sarwar, A.; Ahmad, S.; Rehmani, M.; Javid, M.A.; Gulzar, S.; Shehzad, M.; Dar, J.S.; Baazeem, A.; Iqbal, M.; Rahman, M.; et al. Mapping Groundwater Potential for Irrigation, by Geographical Information System and Remote Sensing Techniques: A Case Study of District Lower Dir, Pakistan. Atmosphere 2021, 12, 669. [Google Scholar] [CrossRef]
- Anderson, G.B.; Barnes, E.A.; Bell, M.L.; Dominici, F. The Future of Climate Epidemiology: Opportunities for Advancing Health Research in the Context of Climate Change. Am. J. Epidemiol. 2019, 188, 866–872. [Google Scholar] [CrossRef] [PubMed]
- Saha, D.; Dhar, Y.R.; Vittala, S.S. Delineation of Groundwater Development Potential Zones in Parts of Marginal Ganga Alluvial Plain in South Bihar, Eastern India. Environ. Monit. Assess. 2010, 165, 179–191. [Google Scholar] [CrossRef]
- Chakrabortty, R.; Pal, S.C.; Malik, S.; Das, B. Modeling and Mapping of Groundwater Potentiality Zones Using AHP and GIS Technique: A Case Study of Raniganj Block, Paschim Bardhaman, West Bengal. Model. Earth Syst. Environ. 2018, 4, 1085–1110. [Google Scholar] [CrossRef]
- De Reu, J.; Bourgeois, J.; Bats, M.; Zwertvaegher, A.; Gelorini, V.; De Smedt, P.; Chu, W.; Antrop, M.; De Maeyer, P.; Finke, P.; et al. Application of the topographic position index to heterogeneous landscapes. Geomorphology 2013, 186, 39–49. [Google Scholar] [CrossRef]
- Jenness, J. Topographic Position Index (Tpi_jen. Avx_extension for Arcview 3. x, v. 1.3 a, Jenness Enterprises [EB/OL]. 2006. Available online: http://www.jennessent.com/arcview/tpi.htm (accessed on 7 June 2022).
- Choubin, B.; Rahmati, O.; Soleimani, F.; Alilou, H.; Moradi, E.; Alamdari, N. Regional Groundwater Potential Analysis Using Classification and Regression Trees. In Spatial Modeling in GIS and R for Earth and Environmental Sciences; Elsevier: Amsterdam, The Netherlands, 2019; pp. 485–498. [Google Scholar]
- Panahi, M.; Sadhasivam, N.; Pourghasemi, H.R.; Rezaie, F.; Lee, S. Spatial Prediction of Groundwater Potential Mapping Based on Convolutional Neural Network (CNN) and Support Vector Regression (SVR). J. Hydrol. 2020, 588, 125033. [Google Scholar] [CrossRef]
- Rizeei, H.M.; Pradhan, B.; Saharkhiz, M.A.; Lee, S. Groundwater Aquifer Potential Modeling Using an Ensemble Multi-Adoptive Boosting Logistic Regression Technique. J. Hydrol. 2019, 579, 124172. [Google Scholar] [CrossRef]
- Sen, Z. Wadi Hydrology; CRC Press: Boca Raton, FL, USA, 2008; ISBN 0429148046. [Google Scholar]
- Chung, C.-J.F.; Fabbri, A.G. Validation of Spatial Prediction Models for Landslide Hazard Mapping. Nat. Hazards 2003, 30, 451–472. [Google Scholar] [CrossRef]
- Saha, S. Groundwater Potential Mapping Using Analytical Hierarchical Process: A Study on Md. Bazar Block of Birbhum District, West Bengal. Spat. Inf. Res. 2017, 25, 615–626. [Google Scholar] [CrossRef]


| Epoch | Formations | Lithological Properties | Coverage Area (%) |
|---|---|---|---|
| Pleistocene | Recent deposit | Conglomerate, Sandstone, claystone, and limestone fragment | 34.1 |
| L. Miocene | Injana | Alternation of thick-bedded red claystone with grey sandstone | 25.2 |
| M. Miocene | Fatha | Alternation of gypsum, marl, sandstone, and claystone | 24.9 |
| Oligocene-E. Miocene | Shurau, Baba, Bajawan, Euphrates, Dhiban, Jeribe | Mostly composed of massive limestone, dolomitized limestone, thin marl | 4.4 |
| L. Eocene | Pila Spi Formation | Chalky and dolomitic Limestone | 11.4 |
| Thematic Layers | Resolution Scale | Data and Source |
|---|---|---|
| Geology (Ge) | 1:250,000 | Provided by Iraqi geological survey maps, [63,64] |
| Rainfall (Rf) | 0.25° 0.25° | TRMM rainfall data, Type-3B43-V7, [65] |
| Lineament density (Ld) | 30 m | Generated from STRM DEM and Landsat 8 |
| Slope (Sp) | 30 m | Generated from STRM DEM |
| Drainage density (Dd) | 30 m | Generated from STRM DEM |
| LULC (Lu) | 30 m | Generated from Landsat 8 and provided by Iraqi Geological Survey [66] |
| Topographic Position Index (TPI) | 30 m | Generated from STRM DEM |
| Thematic Layers | Thematic Layers | ||||||
|---|---|---|---|---|---|---|---|
| Ge | Rf | Ld | Sp | Dd | Lu | TPI | |
| Geology (Ge) | 1.00 | 2.00 | 3.00 | 3.00 | 5.00 | 5.00 | 9.00 |
| Rainfall (Rf) | 0.50 | 1.00 | 2.00 | 2.00 | 3.00 | 3.00 | 7.00 |
| Lineament density (Ld) | 0.33 | 0.50 | 1.00 | 1.00 | 2.00 | 2.00 | 5.00 |
| Slope (Sp) | 0.33 | 0.50 | 1.00 | 1.00 | 2.00 | 2.00 | 5.00 |
| Drainage density (Dd) | 0.20 | 0.33 | 0.50 | 0.50 | 1.00 | 1.00 | 3.00 |
| LULC (Lu) | 0.20 | 0.33 | 0.50 | 0.50 | 1.00 | 1.00 | 3.00 |
| Topographic Position Index (TPI) | 0.11 | 0.14 | 0.20 | 0.20 | 0.33 | 0.33 | 1.00 |
| Column total | 2.68 | 4.81 | 8.20 | 8.20 | 14.33 | 14.33 | 33.00 |
| Thematic Layers | Thematic Layers | Normalized Weights (W) | Percentage Influenced | ||||||
|---|---|---|---|---|---|---|---|---|---|
| Ge | Rf | Ld | Sp | Dd | Lu | TPI | |||
| Geology (Ge) | 0.373 | 0.416 | 0.366 | 0.366 | 0.349 | 0.349 | 0.273 | 0.356 | 35.6 |
| Rainfall (Rf) | 0.187 | 0.208 | 0.244 | 0.244 | 0.209 | 0.209 | 0.212 | 0.216 | 21.6 |
| Lineament density (Ld) | 0.124 | 0.104 | 0.122 | 0.122 | 0.140 | 0.140 | 0.152 | 0.129 | 12.9 |
| Slope (Sp) | 0.124 | 0.104 | 0.122 | 0.122 | 0.140 | 0.140 | 0.152 | 0.129 | 12.9 |
| Drainage density (Dd) | 0.075 | 0.069 | 0.061 | 0.061 | 0.070 | 0.070 | 0.091 | 0.071 | 7.1 |
| LULC (Lu) | 0.075 | 0.069 | 0.061 | 0.061 | 0.070 | 0.070 | 0.091 | 0.071 | 7.1 |
| Topographic Position Index (TPI) | 0.041 | 0.030 | 0.024 | 0.024 | 0.023 | 0.023 | 0.030 | 0.028 | 2.8 |
| Column total | 1.000 | 1.000 | 1.000 | 1.000 | 1.000 | 1.000 | 1.000 | 1.000 | 100.0 |
| Thematic Layers | Features/Classes | Assigned Rank | Groundwater Storage Potentiality | Feature Normalized Weight (Wf) |
|---|---|---|---|---|
| Geology | Injana Formation | 3 | Low | 0.08 |
| Fatha Formation | 5 | Moderate | 0.13 | |
| Recent deposit | 7 | High | 0.18 | |
| Pila Spi and Oligocene Formations | 9 | Very High | 0.24 | |
| Rainfall | 535–552 | 1 | Very Low | 0.04 |
| 552–563 | 3 | Low | 0.12 | |
| 563–574 | 5 | Moderate | 0.20 | |
| 574–585 | 7 | High | 0.28 | |
| 585–602 | 9 | Very High | 0.36 | |
| Lineament density (km/km2) | 0–0.4 | 1 | Very Low | 0.04 |
| 0.4–0.92 | 3 | Low | 0.12 | |
| 0.92–1.33 | 5 | Moderate | 0.20 | |
| 1.33–1.82 | 7 | High | 0.28 | |
| 1.82–2.9 | 9 | Very High | 0.36 | |
| Slope (Degree) | 0–5 | 9 | Very High | 0.36 |
| 5–10 | 7 | High | 0.28 | |
| 10–17 | 5 | Moderate | 0.20 | |
| 17–27 | 3 | Low | 0.12 | |
| 27–56 | 1 | Very Low | 0.04 | |
| Drainage density (km/km2) | 0–0.75 | 9 | Very High | 0.36 |
| 0.75–1.34 | 7 | High | 0.28 | |
| 1.34–1.83 | 5 | Moderate | 0.20 | |
| 1.83–2.33 | 3 | Low | 0.12 | |
| 2.33–3.45 | 1 | Very Low | 0.04 | |
| LULC | Vegetated Land and Carbonate Rocks | 7 | High | 0.16 |
| Burn Land, Cultivated Land, Gypsum, Harvested Land, Mix Barren Land, and other Clastic Rocks | 5 | Moderate | 0.11 | |
| Urban and Built-up Land | 1 | Very Low | 0.02 | |
| TPI | (−)102.6–(−)41 | 9 | Very High | 0.36 |
| (−)41–(−)20 | 7 | High | 0.28 | |
| (−)20–40 | 5 | Moderate | 0.20 | |
| 40–115 | 3 | Low | 0.12 | |
| 115–185.41 | 1 | Very Low | 0.04 |
| Class of GWPZs | Area of Coverage (km2) | Area (%) |
|---|---|---|
| Very Low | 55.4 | 14.7 |
| Low | 90.4 | 24 |
| Moderate | 68.1 | 18.1 |
| High | 100 | 26.6 |
| Very High | 62.4 | 16.6 |
Disclaimer/Publisher’s Note: The statements, opinions and data contained in all publications are solely those of the individual author(s) and contributor(s) and not of MDPI and/or the editor(s). MDPI and/or the editor(s) disclaim responsibility for any injury to people or property resulting from any ideas, methods, instructions or products referred to in the content. |
© 2023 by the authors. Licensee MDPI, Basel, Switzerland. This article is an open access article distributed under the terms and conditions of the Creative Commons Attribution (CC BY) license (https://creativecommons.org/licenses/by/4.0/).
Share and Cite
Sangawi, A.; Al-Manmi, D.A.M.; Aziz, B.Q. Integrated GIS, Remote Sensing, and Electrical Resistivity Tomography Methods for the Delineation of Groundwater Potential Zones in Sangaw Sub-Basin, Sulaymaniyah, KRG-Iraq. Water 2023, 15, 1055. https://doi.org/10.3390/w15061055
Sangawi A, Al-Manmi DAM, Aziz BQ. Integrated GIS, Remote Sensing, and Electrical Resistivity Tomography Methods for the Delineation of Groundwater Potential Zones in Sangaw Sub-Basin, Sulaymaniyah, KRG-Iraq. Water. 2023; 15(6):1055. https://doi.org/10.3390/w15061055
Chicago/Turabian StyleSangawi, Azad, Diary Ali Mohammed Al-Manmi, and Bakhtiar Qader Aziz. 2023. "Integrated GIS, Remote Sensing, and Electrical Resistivity Tomography Methods for the Delineation of Groundwater Potential Zones in Sangaw Sub-Basin, Sulaymaniyah, KRG-Iraq" Water 15, no. 6: 1055. https://doi.org/10.3390/w15061055