
Definition of Rainfall Thresholds for Landslides Using Unbalanced Datasets: Two Case Studies in Shaanxi Province, China

1
College of Geo-Exploration Science and Technology, Jilin University, Changchun 130026, China
2
Department of Civil Engineering, University of Salerno, 84084 Fisciano, Italy
*
Authors to whom correspondence should be addressed.
Water 2023, 15(6), 1058; https://doi.org/10.3390/w15061058
Submission received: 15 February 2023
/
Revised: 6 March 2023
/
Accepted: 7 March 2023
/
Published: 10 March 2023
(This article belongs to the Special Issue Geological Hazards: Landslides Induced by Rainfall and Infiltration)
Abstract
:The Lueyang and Xunyang counties in the Shaanxi province (China) are highly susceptible to rainfall-induced landslides. Rainfall thresholds are the most used tool to predict the occurrence of rainfall-induced landslides over large areas. However, the definition of robust thresholds may be difficult for unbalanced datasets, for which the number of non-landslide observations is much higher than the number of landslide observations. This study aims at defining adequate rainfall thresholds for the two study areas using landslide datasets that are strongly unbalanced in terms of occurrences vs. non-occurrences. Two types of rainfall thresholds are determined using a frequentist method at several non-exceedance and exceedance probabilities, separately considering rainfall events responsible for landslides (positive thresholds) and rainfall events not responsible for landslides (negative thresholds). The comparison between the two sets of thresholds shows that the method based on non-triggering events allows defining rainfall thresholds characterized by lower uncertainties and a better performance than the ones defined considering the triggering events, in both the study areas. In particular, the best-performing thresholds are the negative threshold defined at 15% exceedance probability for the Lueyang county and the negative threshold defined at 20% exceedance probability for the Xunyang county.
1. Introduction
Rainfall-induced landslides are a common hazard that cause casualties and economic losses worldwide. According to the National Geohazards Bulletin of China, from 2014 to 2018, an average of 5148 landslides occurred each year, most of which were triggered by rainfall. Landslide early warning systems (LEWSs) are being increasingly implemented in landslide-prone areas to mitigate landslide risk as non-structural and cost-effective measures at two scales of operation [1,2,3,4]. For LEWSs operational over large areas at regional scale, rainfall thresholds are commonly employed to characterize the functional relationship between rainfall and the triggering of landslides within the warning model [2,3,5,6].
Rainfall thresholds represent rainfall conditions that, when reached or exceeded, are likely to trigger landslides [7,8,9]. Empirical (statistical or historical) and physically based methods can be used to define rainfall thresholds [9,10,11]. Physically based methods simulate the slope stability during rainfall infiltration to define thresholds. Empirical methods analyze the rainfall events that triggered landslides to define thresholds. Since only rainfall records and historic landslide events are required, empirical methods are widely used for analysis over large areas. On the contrary, physically based methods are usually used in small catchments or slopes because the simulation needs detailed soil parameters, which are difficult to obtain at regional scale [12,13].
The quality and quantity of rainfall and landslide data strongly affect the reliability of the empirical rainfall thresholds. For instance, when adequate rainfall records are collected for a relatively long period, e.g., a few decades, during which no landslides have been recorded because a landslide catalogue does not exist for the area of interest, it is difficult to use that dataset because the absence of data on landslides does not necessarily mean that none of the preceding recorded rainfall events triggered landslides [14,15,16,17,18]. In China, the systematic rainfall monitoring started just a few decades ago and often information on landslide occurrences is not available [19], thus landslide datasets for some landslide-prone areas located in mountain areas are characterized by scarce records or records concentrating on a few dates [20,21]. In these cases, the landslide dataset provides quite limited information on triggering events. Therefore, one has to deal with unbalanced landslide datasets and the definition of reliable rainfall thresholds is not straightforward.
Peres and Cancelliere [22] categorized the rainfall event datasets used to define empirical thresholds in three types: (i) only triggering events, (ii) only non-triggering events, and (iii) both triggering and non-triggering events. Most thresholds are defined based on only triggering events by applying the frequentist method [11,23,24]. Brunetti et al. [23] pointed out that the results can be improved when the frequentist method is applied to a large and uniform dataset covering the range of analyzed rainfall events. Some thresholds are defined based on both triggering and non-triggering events. In this case, Bayesian approaches [25] or methods based on a contingency matrix can be applied, considering the balance of true and false predictions to define thresholds [26,27,28,29]. Peres and Cancelliere [22] stressed that these methods require an adequate number of triggering events to define robust thresholds. Methods for threshold identification based on only non-triggering rainfall may have the practical advantage that can in principle be used where limited information on landslide occurrence is available (newly instrumented areas). Peres and Cancelliere [22] compared different sets of thresholds using a synthetic rainfall-landslide dataset and proved that thresholds based on only non-triggering events can have good robustness, low sampling variation, and even better performance than thresholds defined on only triggering events [22]. However, methods based on non-triggering events have been never applied to real unbalanced datasets.
In this study, two counties of southern Shaanxi province with unbalanced landslide datasets are considered as study areas. According to the collected rainfall and landslide records, rainfall events are divided into triggering and non-triggering events using an automatic detection and classification tool. Successively, rainfall thresholds are defined based on the reconstructed rainfall events. Finally, contingencies, related skill scores, and receiver operating characteristic (ROC) curves are employed to assess the performance of the different sets of thresholds in order to determine the best-performing ones [30]. This study may be considered a first attempt to define robust rainfall thresholds in areas where limited information on landslide occurrence is available. Indeed, thresholds determination may start from identifying thresholds from non-triggering events only, subsequently moving to methods considering also the triggering events, when sufficient landslide information become available.
2. Materials and Methods
2.1. Study Area
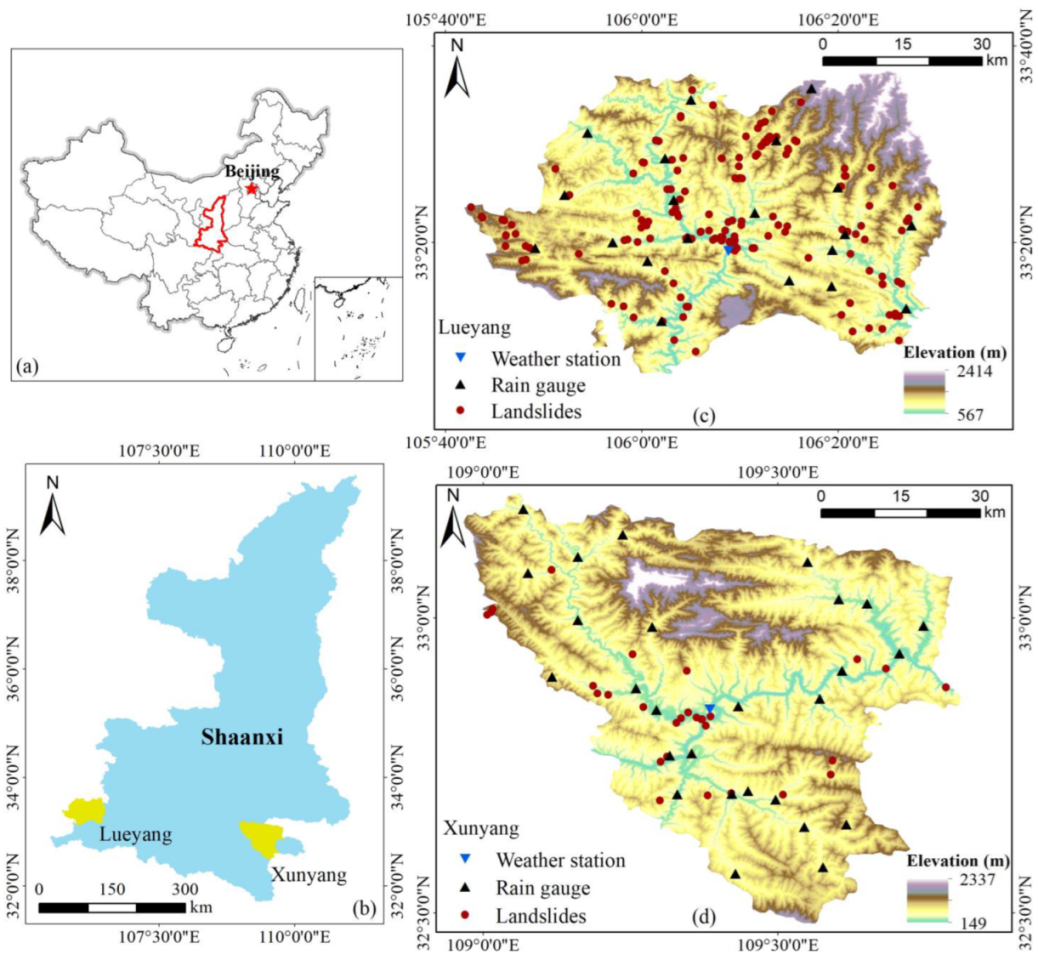
Shaanxi province, located in northwest China, is susceptible to rainfall-induced landslides and debris flows [31] (Figure 1a). Luyang (LY) and Xunyang (XY) counties are located in the southwest and southeast parts of Shaanxi province, respectively (Figure 1b).
Topographically, LY and XY belong to Qinba mountain area, which is a collisional orogenic belt, fault developed, and landslide hotspot zone [32,33,34,35]. The topography of LY and XY is characterized by high mountains and steep valleys. For climate conditions, from north to south of LY, the climate changes from a warm temperate climate to a subtropical climate. The climate of XY is subtropical. According to the records of weather stations available from 1981 to 2021 (http://data.cma.cn/ (accessed on 20 October, 2022)), the average annual precipitation of LY and XY is 826 mm and 758 mm, respectively. Rainfall is concentrated from July to September and features intense or continuous precipitation events. Rainfall-induced landslides and debris flows are widespread in the two counties.
2.2. Datasets
The information on rainfall-induced landslides was collected from the Geo-Environmental Monitoring Center of Shaanxi province. Available information includes occurrence time, geographical coordinates, volume, and consequences. For LY, the landslide dataset comprises 176 rainfall-induced landslides, which occurred in the 5-year period from January 2018 to October 2022. For XY, 29 rainfall-induced landslides from January 2017 to December 2021 (5-year period) were considered. For both datasets, information on the hour of occurrence of the landslides is available. Hourly rainfall records are also available for 20 rain gauges in LY from January 2018 to October 2022 and 28 rain gauges in XY from January 2017 to December 2021 (Figure 1c,d). It should be noted that additional landslides, not recorded in the available dataset, may have occurred during the analyzed periods.
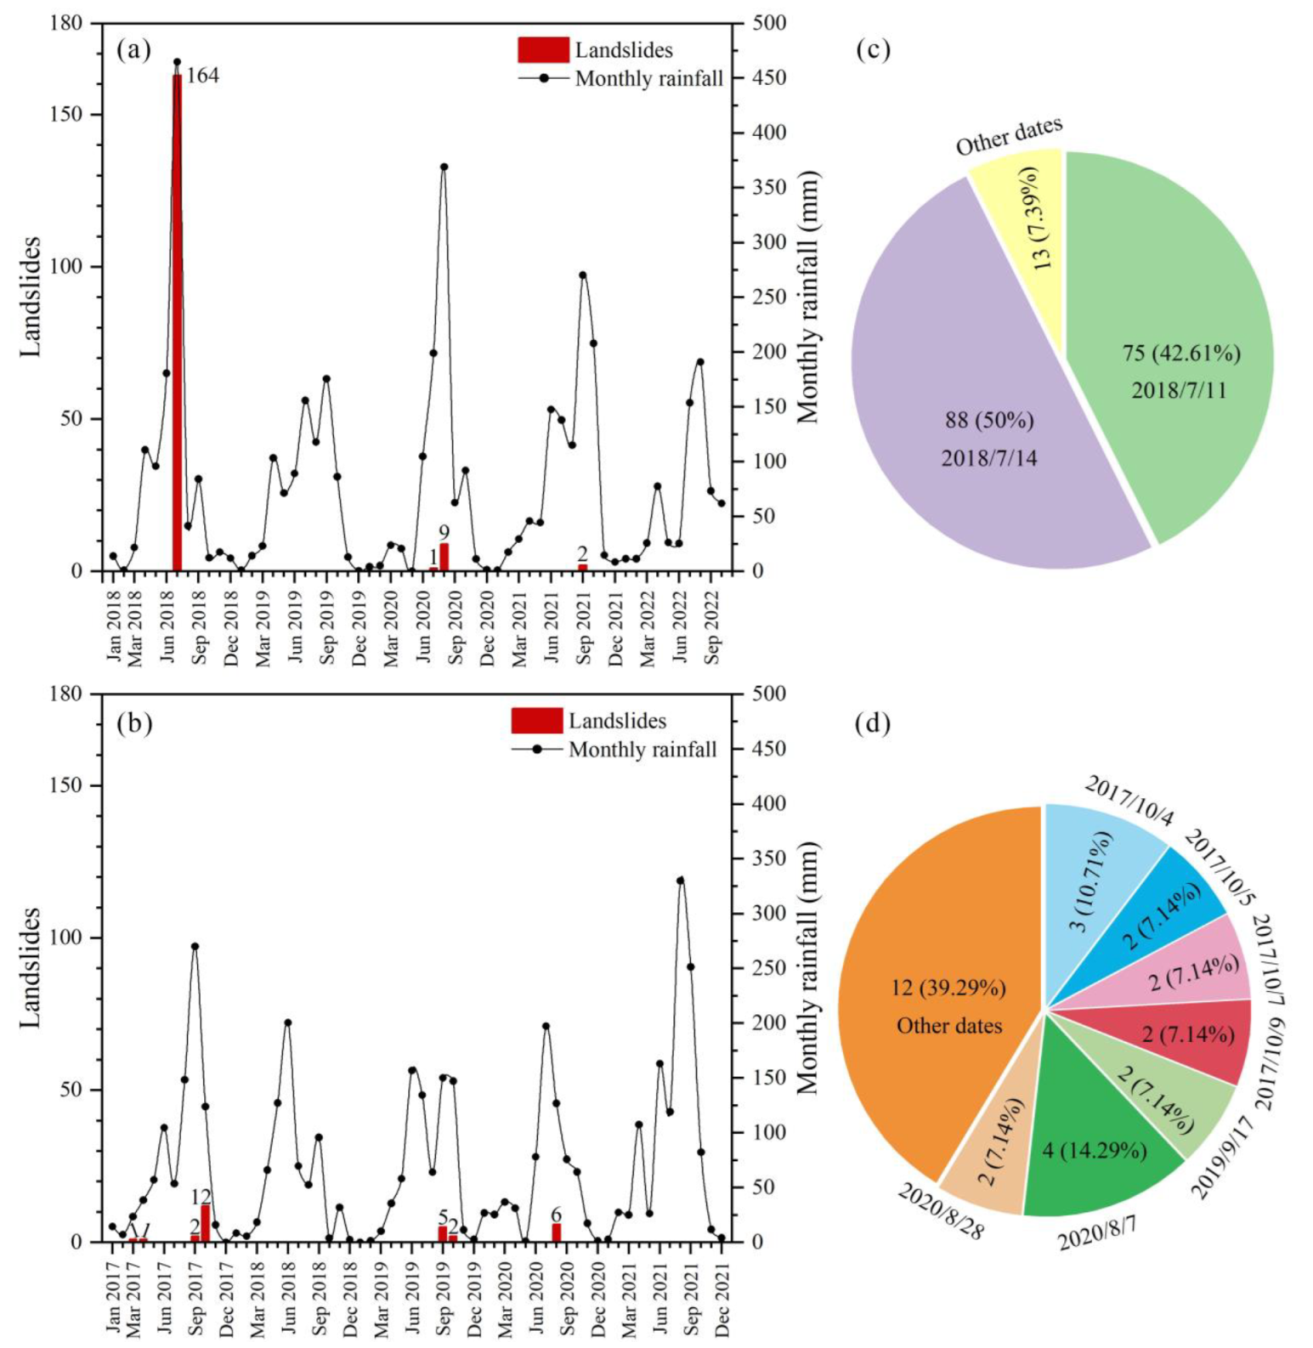
Figure 2a,b show the comparison of monthly rainfall recorded by the weather stations and the collected landslide occurrences in the two counties. As expected, these landslides mainly occurred in the rainy season (Figure 2c,d). For LY, nearly 93% of landslides concentrated on two dates (11 July and 14 of 2018) triggered by a rare heavy rainstorm [36,37]. For XY, nearly 61% of landslides concentrated on a few dates. Thus, the landslide datasets of these two counties are strongly unbalanced, especially for LY.
2.3. Methods
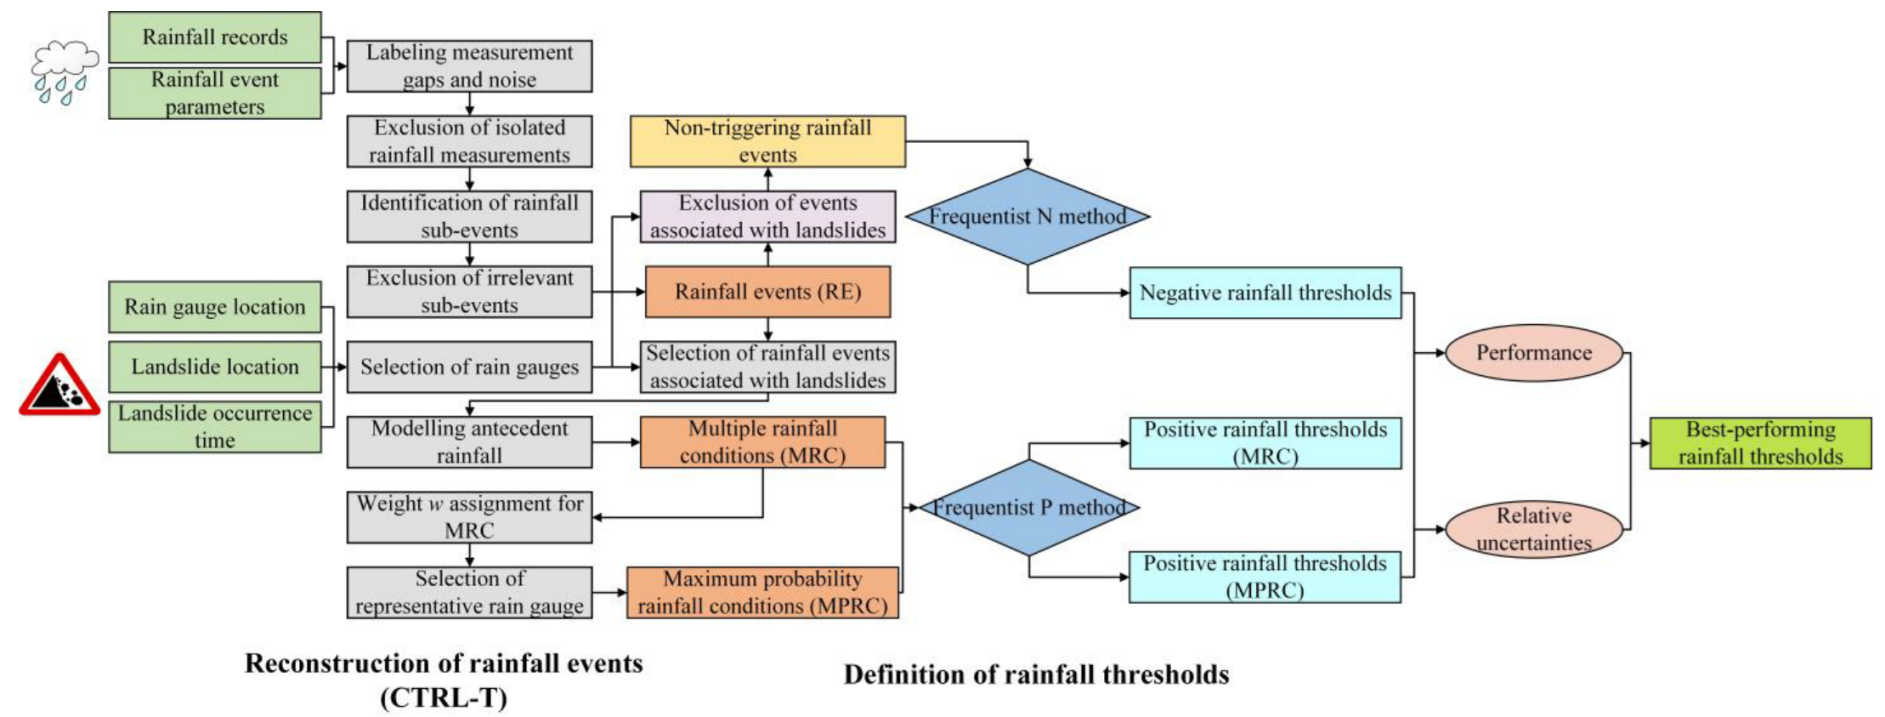
In this study, the methodology can be schematized into two successive phases: reconstruction of rainfall events and definition of rainfall thresholds (Figure 3).
2.3.1. Reconstruction of Rainfall Events
The rainfall measurements were divided in two separate datasets, for calibration and validation purposes. The rainfall measurements from January 2018 to December 2021 in LY, and the measurements from January 2017 to December 2020 in XY were taken to define the calibration set. The rainfall measurements from January to October of 2022 in LY, and the measurements from January to December of 2021 in XY were used to define the validation set.
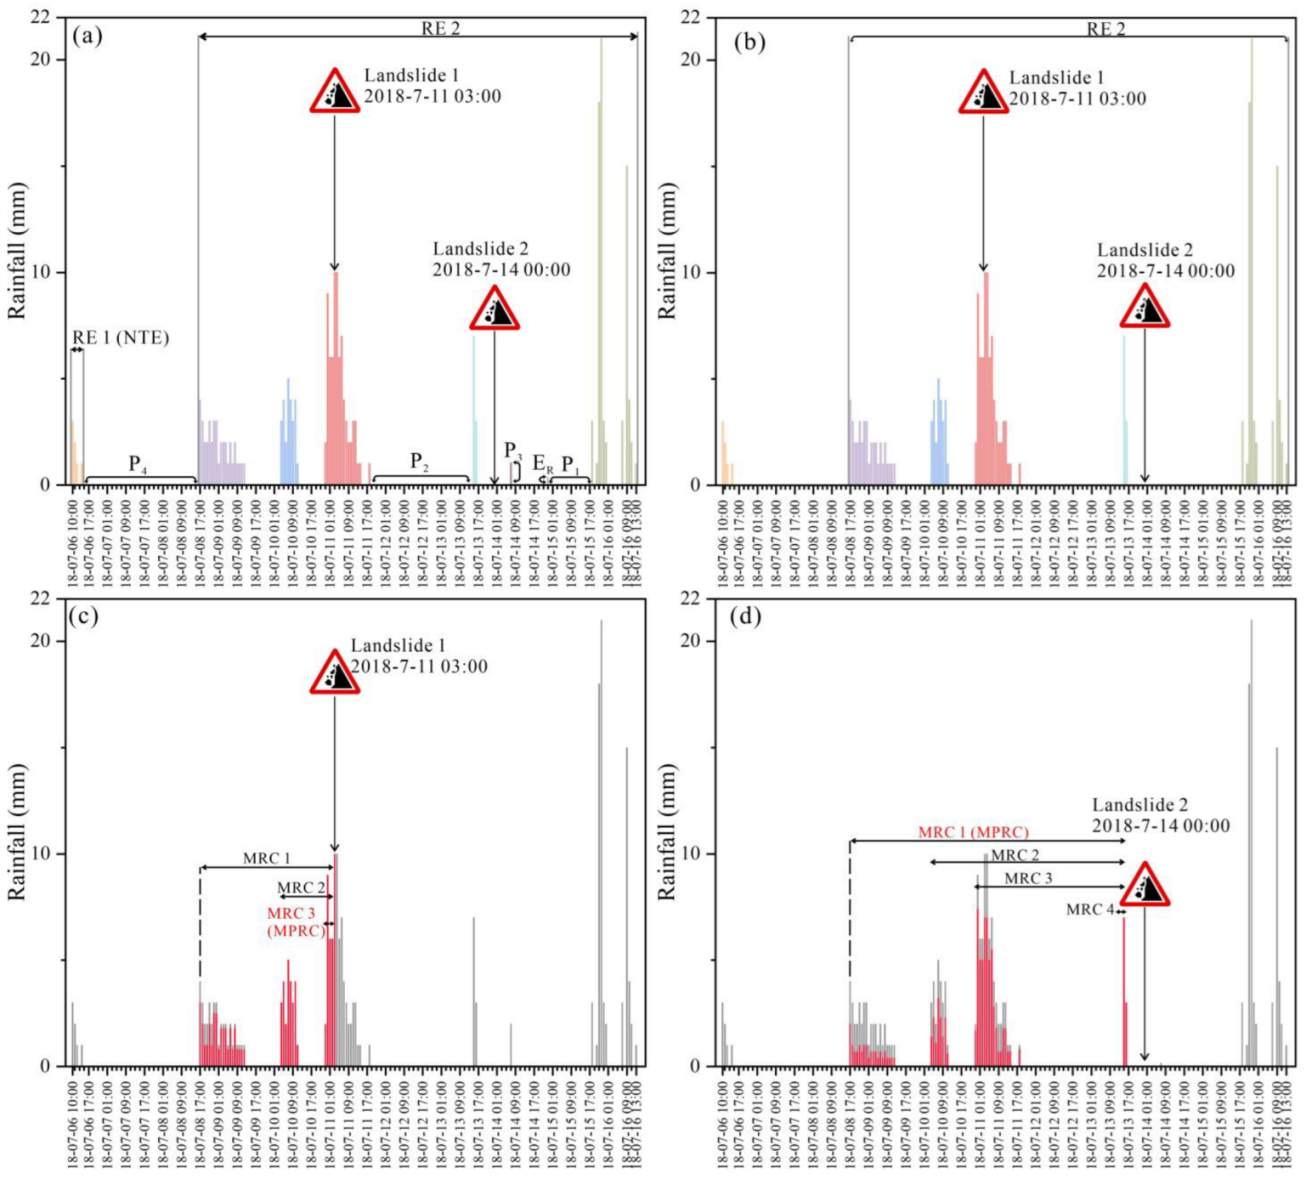
The tool CRTL–T (Calculation of Thresholds for Rainfall-induced Landslides–Tool) developed by Melillo et al. [38,39] was employed to reconstruct the rainfall events adopting the following steps: (a) labelling gaps and noise of the input rainfall records by means of sensitivity parameter (GS); (b) excluding the isolated rainfall measurements, specifying a time period (P1) and minimum cumulated rainfall value (ER); (c) identifying rainfall sub-events adopting another time period parameter (P2); (d) excluding the sub-events irrelevant to landslides, specifying a minimum cumulated event rainfall for isolated events (P3); (e) identifying rainfall events, by means of a third period parameter (P4); (f) for each failure, selecting rain gauges within a circular area of a set radius (Rb), centered on the landslide location; (g) selecting the rainfall events associated with landslides to reconstruct multiple rainfall conditions (MRCs) for landslides, which can be a single rainfall sub-event or a set of two or more sub-events, and to define the associated cumulated rainfalls () and durations (DL); (h) assigning a weight w to each subset of MRCs according to the following formula , where d is the distance between the landslide and the rain gauge; (i) selecting the representative rain gauge and reconstructing the maximum probability rainfall conditions (MPRCs), which is the subset of MRCs with the highest weight w. In this way, rainfall events (REs), MRCs, and MPRCs were reconstructed. Non-triggering events (NTEs) were reconstructed by excluding the rainfall events associated with landslides from the set of identified REs. Figure 4 shows, as an example, a graphical depiction of how the rainfall measures are indeed used to reconstruct REs, NTEs, MRCs, and MPRCs. The values of the input parameters adopted for this study are shown in Table 1. P1, P2, and P4 are different for “warm” (Cw) and “cold” (Cc) periods. The start and the end of Cw and Cc, and the time interval ratio between Cw and Cc, were determined by adopting a monthly soil water balance (MSWB) model [40].
2.3.2. Definition of Rainfall Thresholds
In this study, the power-law function of cumulated rainfall (E, in mm) and rainfall duration (D, in h) was employed to calculate the rainfall thresholds:
where α is the scaling parameter, γ is the shape parameter, and and are the uncertainties (standard deviation) of α and γ.
The calibration sets were used to define the thresholds. Positive thresholds were defined based on reconstructed MPRCs and MRCs, respectively. Identified non-triggering events were used to define negative thresholds. Both positive and negative rainfall thresholds were determined using a frequentist method [23]. Specifically, different positive thresholds were defined starting from a best-fit line of the triggering events, to determine the shape parameter γ, and then changing the scaling parameter α for different values of non-exceedance probabilities (i.e., seeking lower bounds of the dataset). Similarly, negative thresholds were also defined starting from a best-fit line of non-triggering events and then determining the scaling parameter for different exceedance probabilities (i.e., seeking upper bounds of the dataset). The uncertainties were determined by a statistical technique named “bootstrap” [24].
A validation set, computed contingency matrices, four skill scores, and the ROC curve [41] were used to validate the defined thresholds and to assess their performance. The rainfall events from January to October 2022, in the LY study area, and the rainfall events from January to December of 2021 in the XY study area, were considered as no-landslide occurrences. Due to the limitations of the landslide dataset, no available information can be used to reconstruct an independent landslide occurrence set for validation. Thus, the reconstructed MPRCs were taken as landslide occurrences for the validation set. The adopted contingency matrix is illustrated in Table 2. When a threshold is defined, comparing the actual and predicted events produces four outcomes: true positives (TP), false negatives (FN), true negatives (TN), and false positives (FP).
The following four skill scores, derived from the elements of the contingency matrix, were employed in this study:
- Efficiency index (Equation (2));
- True positive rate (also referred to as hit rate, probability of detection rate, and sensitivity (Equation (3)));
- False positive rate (also referred to as probability of false detection (Equation (4)));
- Positive predictive value (also referred to as precision (Equation (5)));
ROC curves were computed and plotted, in a diagram TPR vs. FPR, for each defined threshold. The point with FPR = 0 and TPR = 1 represents the perfect prediction capacity. For each threshold, the distance δ between the point representing the threshold and the perfect point was calculated. The lower the value of δ, the better is the performance of the threshold, accounting for both true and false predictions. As a last step, the optimal rainfall threshold was determined.
3. Results
3.1. Reconstraction of Rainfall Events
For the calibration set, the statistic of reconstructed REs, MPRCs, MRCs, and NTEs are shown in Table 3. For LY, a total of 2467 REs were reconstructed. Among them, 29 REs are associated with landslides and 2438 are NTEs. Furthermore, 465 MRCs and 171 MPRCs were reconstructed from the 29 REs associated with landslides. Given that most landslides are concentrated on two dates, many were triggered by the same rainfall conditions. Thus, 232 repeated MRCs and 97 repeated MPRCs were eliminated, and the values used to define the positive thresholds were 233 and 74, respectively, for MRCs and MPRCs. For XY, 19 RE associated with landslides and 3210 NTEs were reconstructed. From the 19 REs associated with landslides, 45 MRCs and 21 MPRCs were reconstructed.
3.2. Definition of Rainfall Thresholds
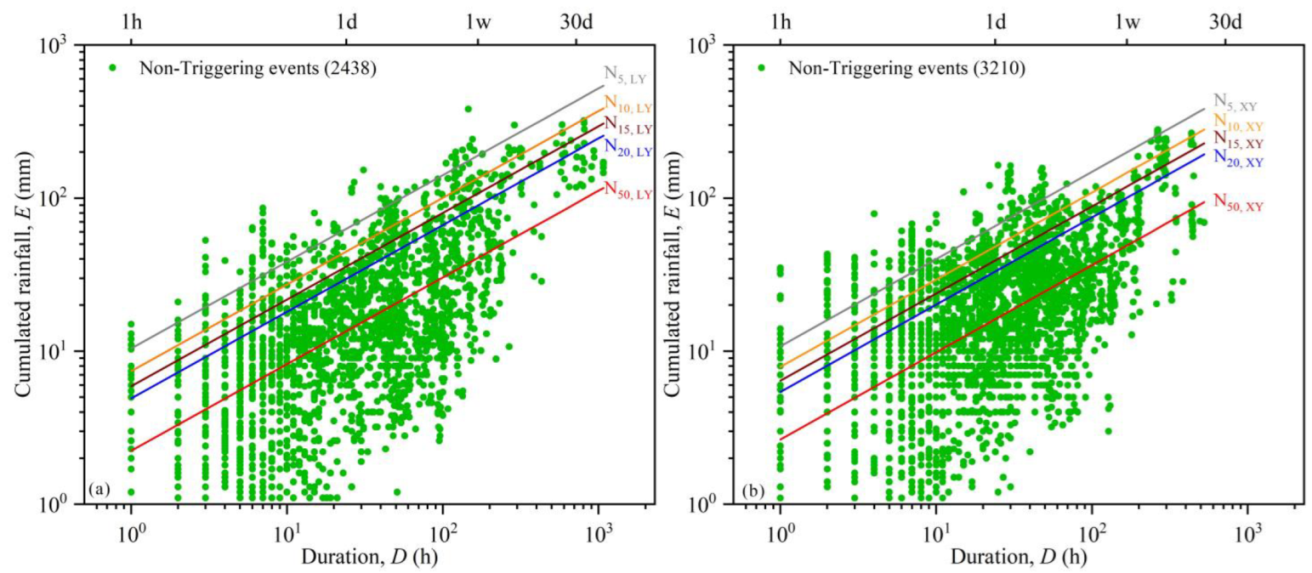
Negative thresholds were defined at 5%, 10%, 15%, and 20% exceedance probabilities for LY and XY (Figure 5). Table 4 illustrates the values of the parameters and their relative uncertainties (△α/α and △γ/γ) for the defined negative thresholds. For negative thresholds, the relative uncertainties on α range from 3% to 4%, while the relative uncertainties on γ are equal to 2%.
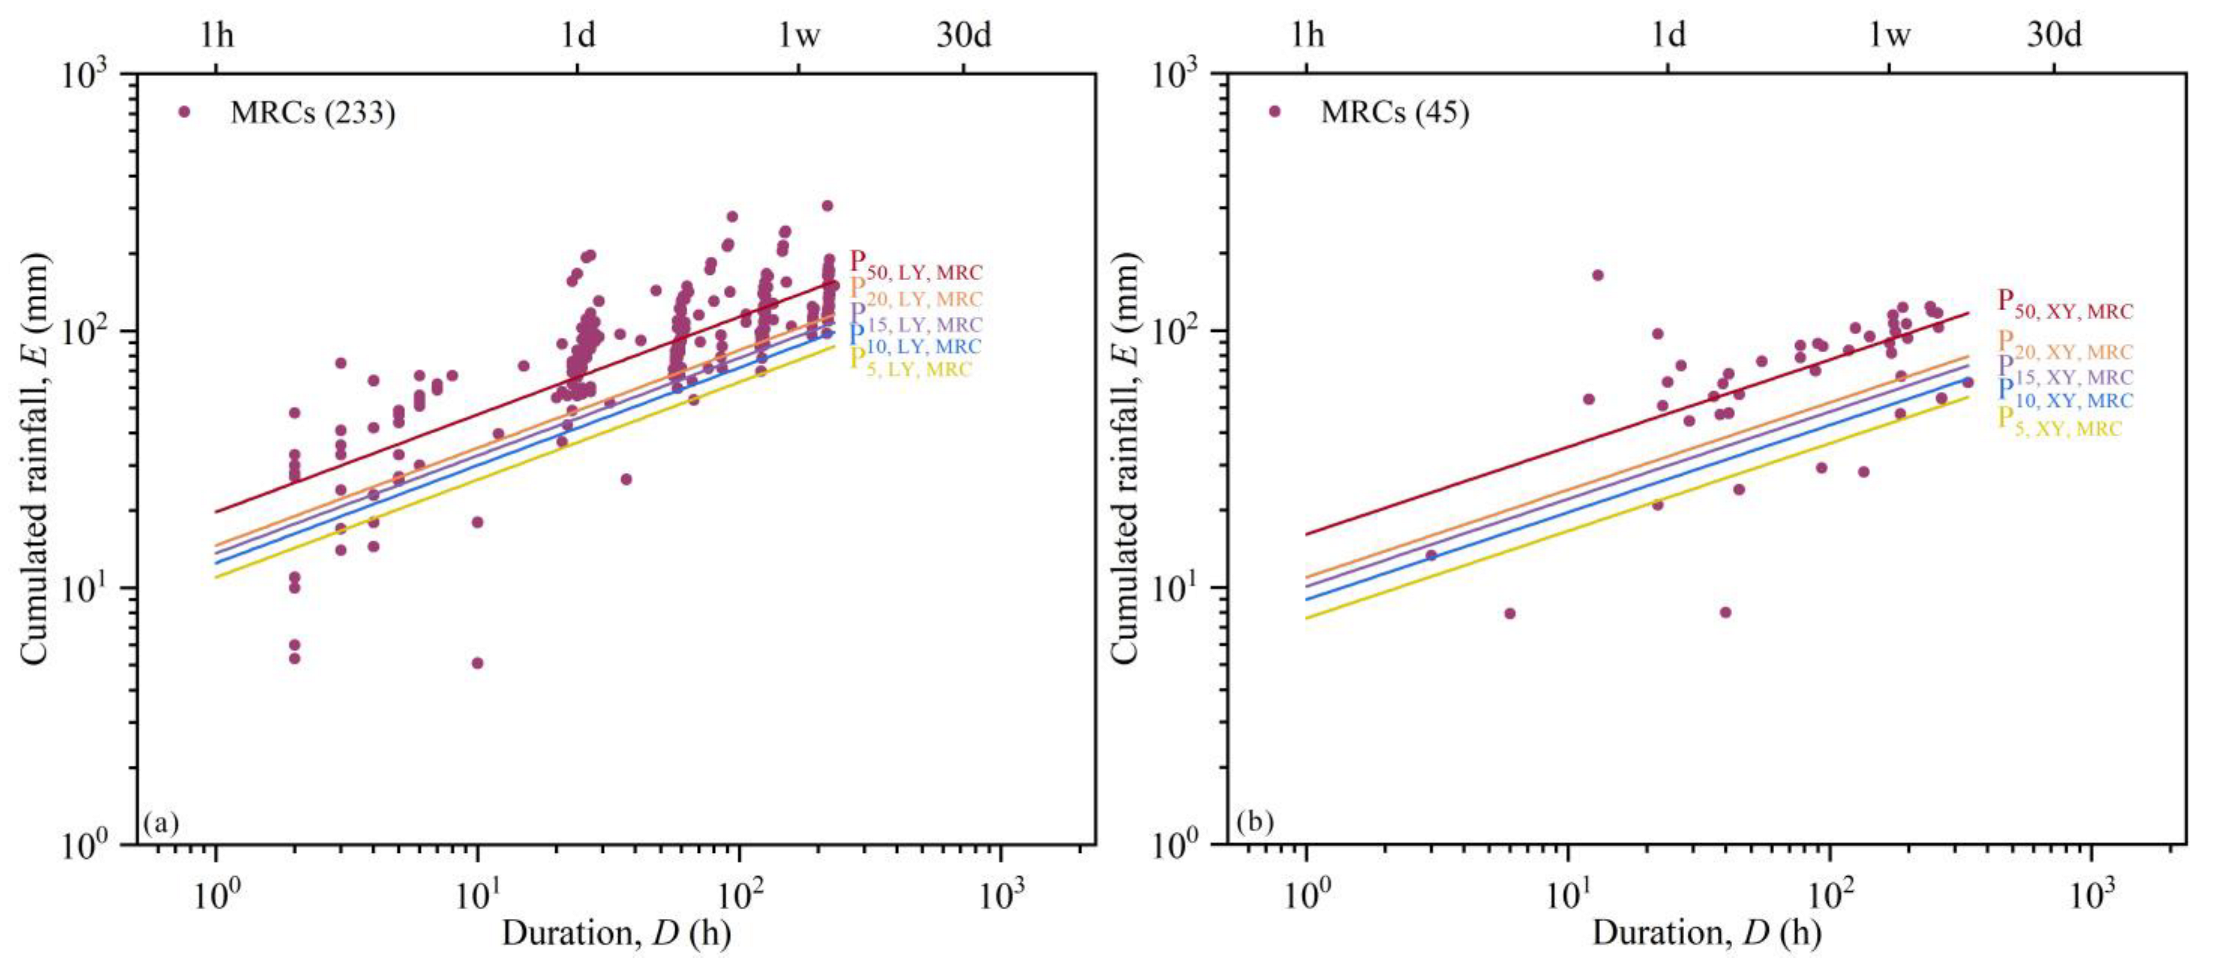
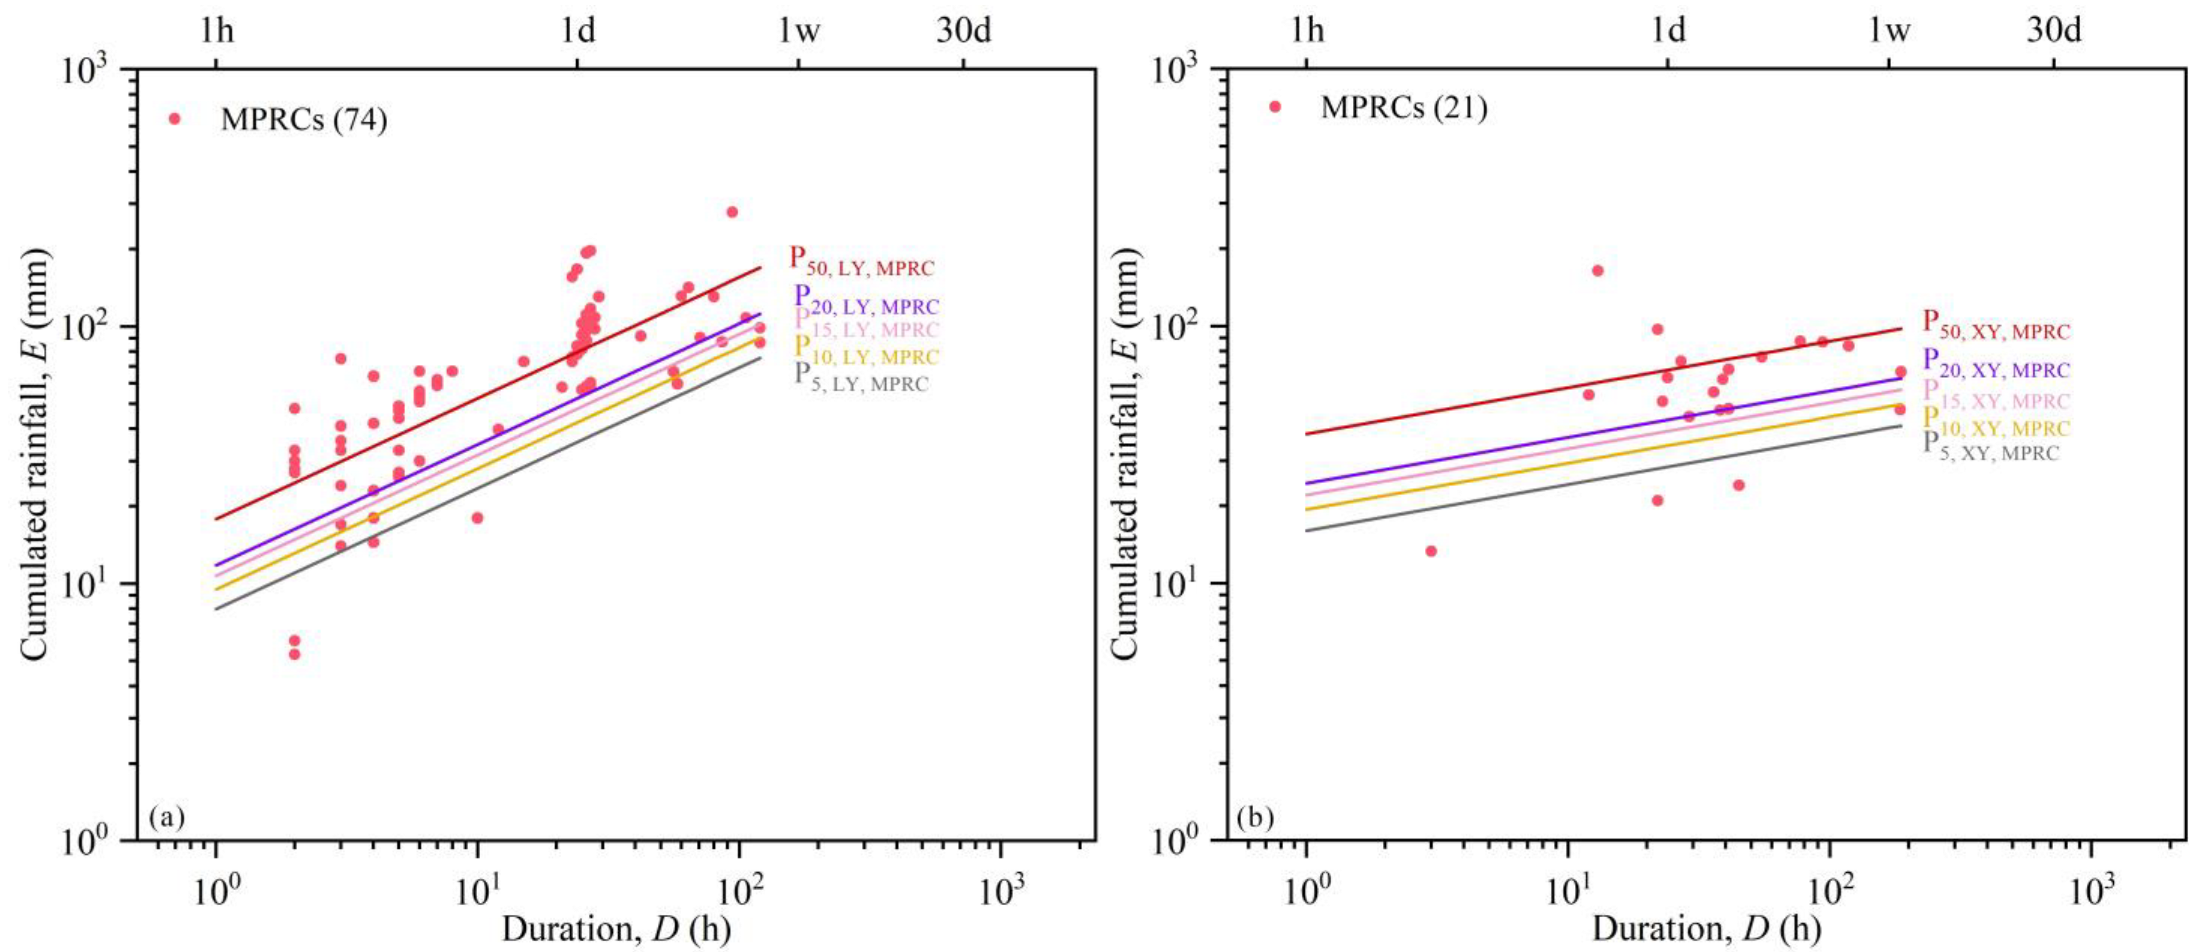
Similarly, positive thresholds were defined at 5%, 10%, 15%, 20%, and 50% non-exceedance probabilities for LY and XY. Figure 6 and Figure 7 show the positive thresholds based on MRCs and MPRCs, respectively. The functions and the parameter relative uncertainties of the positive thresholds are shown in Table 5. For both cases, the relative uncertainties of the positive thresholds are significantly higher than the ones computed for the negative thresholds. Indeed, relative uncertainties for positive thresholds based on MRCs range from 13% to 52% for α and from 8% to 28% for γ, while relative uncertainties for positive thresholds based on MPRCs range from 18% to 88% for α and from 12% to 96% for γ. These results are not surprising, as the triggering events are significantly lower than the non-triggering events. However, the relative uncertainties are quite high also for thresholds based on 233 MRCs reconstructed in LY county, although the number of points in the sample, higher than 200, can be considered adequate for the definition of robust thresholds [22].
3.3. Performance Evaluation
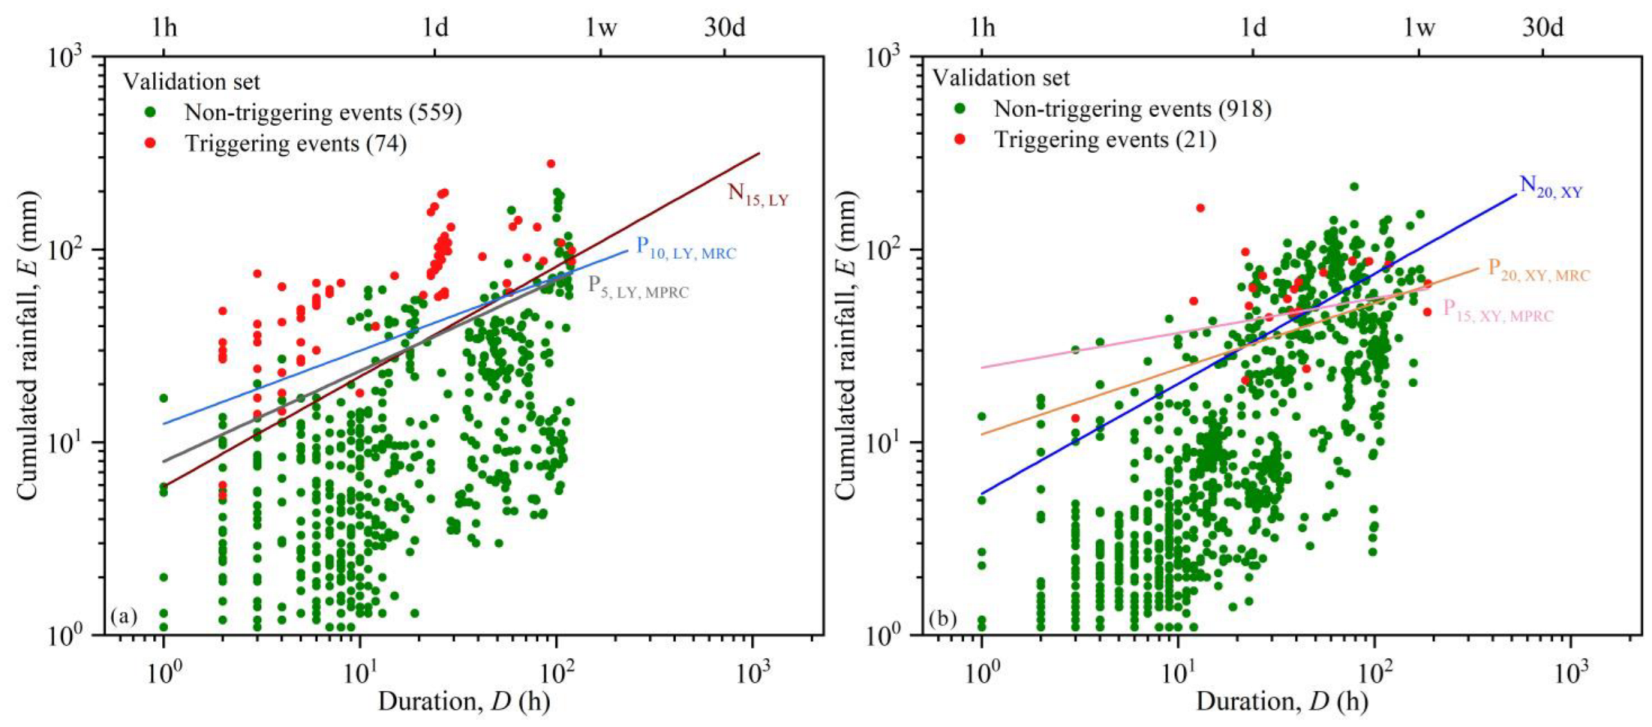
For validation purposes, the following values of the non-triggering rainfall events were considered (green points in Figure 8): 559 rainfall events in the ranges of 1 ≤ D ≤ 120 h and 1.1 ≤ E ≤ 198.3 mm in the period from January to October, 2022 for LY case; 918 rainfall events in the ranges of 1 ≤ D ≤ 187 h and 1.1 ≤ E ≤ 211.6 mm in the period from January to December, 2021 for XY case.
Table 6 and Table 7 report the number of elements of the contingency matrices calculated for the negative and the positive thresholds. The skill scores were derived from these elements (Table 8 and Table 9). For the LY case, the highest number of TP (71) is obtained considering N20,LY, although this results in a significant number of FP (92) when compared to the other thresholds. A better compromise is represented by N15,LY and P5,LY,MPRC, which allow achieving a high number of TP (70), both minimizing the number of FP (60 and 61, respectively). The overall good performance of N15,LY and P5,LY,MPRC is also confirmed considering the skill scores listed in Table 8. Indeed, both the thresholds show high values of the true positive rate (TPR) and low values of the false positive rate (FPR). Looking at the efficiency index (EI), a general increase is observed raising the percentile of the positive thresholds and reducing the percentile of the negative one. The positive predictive value (PPV) shows variations similar to the EI, with values higher than 0.5 for all the thresholds, apart from N20,LY.
For the XY case, the highest numbers of TP (from 17 to 19) are generally obtained considering positive thresholds. The only negative threshold showing a good capability of detecting the occurred landslides is N20,XY, with a TP of 17. It should be observed that the XY case shows sensitively higher values of FP than the LY case. In particular, there is an order of magnitude of difference between FP and TP for the XY case, and of course the difference is also related to the low number of landslides that occurred in XY. The worst performance of the thresholds due to the high number of FP is confirmed by the low values of the PPV (Table 9). Values of the TPR higher than 0.8 are observed for N20,XY and all the positive thresholds, apart from P20,XY,MPRC (0.71). The EI assumes relatively high values due to the significant influence of the TN.
After that, FPR and TPR values of each defined threshold were used to plot the ROC curves (Figure 9). Then, for each threshold, the distance δ from the optimal prediction point was calculated (Table 8 and Table 9). According to the distance δ, for the LY case, the best negative threshold is N15,LY and the best positive threshold is P5,LY,MPRC. The two thresholds show the same distance δ from the perfect point (0.121 in both the cases). For XY, N20,XY is the best among the negative thresholds. P15,XY,MPRC is the best among the positive thresholds. N20,XY is characterized by a slightly shorter distance from the perfect point compared to P15,XY,MPRC (0.276 vs. 0.283).
4. Discussion
For the LY case, according to the skill scores, the performances of P5,LY,MPRC and N15,LY are similar. However, the relative uncertainties of the scaling and shape parameters (△α/α and △γ/γ) for P5,LY,MPRC are 19% and 12%, which are much greater than those for N15,LY, respectively equal to 4% and 2%. For the XY case, the best negative threshold (N20,XY) has a lower FPR and a higher EI than P15,XY,MPRC. The relative uncertainties of P15,XY,MPRC, almost 100% for the shape parameter, are much higher than those associated to N20,XY. Thus, N20,XY clearly shows an overall better performance for the XY case. When comparing the two case studies, the performance of the two sets of negative optimal thresholds is quite similar. Indeed, for both cases, despite the small differences, the best negative thresholds show lower numbers of FP and FN compared to the positive ones. This means that, in case they are employed in an operational warning model, the LEWS would benefit from a better compromise between false and missed alarms. In any case, the key difference between the two sets of thresholds is that the best negative thresholds exhibit significantly lower relative uncertainties of threshold parameters than the positive ones. The uncertainties depend on the number and the distribution of rainfall event points [24,42]. The relative uncertainties are also important for assessing if and how any given rainfall-threshold can be applied in an operational LEWS. Peruccacci et al. [24] stressed that an acceptable value of relative uncertainties is 10% and at least 175 even-distributed (D, E) points are required to limit the relative uncertainties below 10%. Although reconstructing multiple rainfall conditions for one single landslide to define rainfall thresholds can increase the sample number and decrease the relative uncertainties of defined thresholds, the problem of the non-uniform distribution of the sample points determined by the unbalanced dataset cannot be solved. For example, the relative uncertainties of shape parameter for thresholds defined based on 233 MRCs (>175) in the LY case are still greater than 10%. Therefore, for unbalanced datasets, negative thresholds can be considered better than positive ones. As suggested by Peres and Cancelliere [22], the overlooked methods based on rainfall-event that do not trigger landslides deserve wider application.
5. Conclusions
In this study, three groups of rainfall events were reconstructed according to the hourly rainfall measurements and rainfall-induced landslide records of Lueyang and Xunyang counties, southern Shaanxi province (China). ED thresholds at several exceedance and non-exceedance probabilities were defined using statistical methods respectively employing rainfall-events that trigger (positive thresholds) or do not trigger (negative thresholds) landslides. For both study areas, the negative thresholds show a better trade-off between true and false predictions, and relative uncertainties that are significantly lower than the ones computed for the positive thresholds. Although further studies are needed to generalize these results, it seems wise to recommend to analysts using unbalanced rainfall-induced landslide datasets, a very common condition in many areas of the world, to start with identifying rainfall thresholds from non-triggering events. Subsequently, when sufficient information on landslides become available, analysts can also move to methods that consider the triggering events, to refine and improve the already identified thresholds.
Author Contributions
Conceptualization, S.Z. and G.P.; methodology, S.Z. and G.P.; software, S.Z.; validation, G.P. and M.C.; formal analysis, S.Z.; investigation, S.Z. and G.P.; writing—original draft preparation, S.Z.; writing—review and editing, G.P. and M.C.; visualization, S.Z.; supervision, Q.J. and M.C.; funding acquisition, S.Z. and Q.J. All authors have read and agreed to the published version of the manuscript.
Funding
This study was supported by the Satellite Application Technology Center of Shaanxi province and China Scholarship Council (CSC, No. 202206170094).
Data Availability Statement
Not applicable.
Acknowledgments
We appreciate Geo-Environmental Monitoring and Satellite Application Technology Centers of Shaanxi province for providing the landslide and rainfall records. We also thank CNR IRPI for sharing the code of CRTL-T. S.Z. gratefully acknowledges the China Scholarship Council, supporting his visiting study at University of Salerno.
Conflicts of Interest
The authors declare no conflict of interest.
References
- Intrieri, E.; Gigli, G.; Mugnai, F.; Fanti, R.; Casagli, N. Design and Implementation of a Landslide Early Warning System. Eng. Geol. 2012, 147, 124–136. [Google Scholar] [CrossRef] [Green Version]
- Calvello, M. Early Warning Strategies to Cope with Landslide Risk. Riv. Ital. Geotec. 2017, 2, 63–91. [Google Scholar] [CrossRef]
- Piciullo, L.; Calvello, M.; Cepeda, J.M. Territorial Early Warning Systems for Rainfall-Induced Landslides. Earth-Sci. Rev. 2018, 179, 228–247. [Google Scholar] [CrossRef]
- Pecoraro, G.; Calvello, M.; Piciullo, L. Monitoring Strategies for Local Landslide Early Warning Systems. Landslides 2019, 16, 213–231. [Google Scholar] [CrossRef]
- Piciullo, L.; Gariano, S.L.; Melillo, M.; Brunetti, M.T.; Peruccacci, S.; Guzzetti, F.; Calvello, M. Definition and Performance of a Threshold-Based Regional Early Warning Model for Rainfall-Induced Landslides. Landslides 2017, 14, 995–1008. [Google Scholar] [CrossRef]
- Guzzetti, F.; Gariano, S.L.; Peruccacci, S.; Brunetti, M.T.; Marchesini, I.; Rossi, M.; Melillo, M. Geographical Landslide Early Warning Systems. Earth-Sci. Rev. 2020, 200, 102973. [Google Scholar] [CrossRef]
- Caine, N. The Rainfall Intensity-Duration Control of Shallow Landslides and Debris Flows. Geogr. Ann. Ser. A 1980, 62, 23–27. [Google Scholar] [CrossRef]
- Aleotti, P. A Warning System for Rainfall-Induced Shallow Failures. Eng. Geol. 2004, 73, 247–265. [Google Scholar] [CrossRef]
- Guzzetti, F.; Peruccacci, S.; Rossi, M.; Stark, C.P. Rainfall Thresholds for the Initiation of Landslides in Central and Southern Europe. Meteorol. Atmos. Phys. 2007, 98, 239–267. [Google Scholar] [CrossRef]
- Guzzetti, F.; Peruccacci, S.; Rossi, M.; Stark, C.P. The Rainfall Intensity-Duration Control of Shallow Landslides and Debris Flows: An Update. Landslides 2008, 5, 3–17. [Google Scholar] [CrossRef]
- Segoni, S.; Piciullo, L.; Gariano, S.L. A Review of the Recent Literature on Rainfall Thresholds for Landslide Occurrence. Landslides 2018, 15, 1483–1501. [Google Scholar] [CrossRef]
- Gariano, S.L.; Guzzetti, F. Landslides in a Changing Climate. Earth-Sci. Rev. 2016, 162, 227–252. [Google Scholar] [CrossRef] [Green Version]
- Zhang, S.; Jiang, Q.; Xu, X.; Tao, G.; Zhang, Z.; Gao, X.; He, C. Influence of Soil Mechanical and Hydraulic Parameters on the Definition of Rainfall Intensity and Duration Thresholds Based on Transient Rainfall Infiltration and Grid-Based Regional Slope-Stability Model (TRIGRS). Front. Earth Sci. 2022, 10, 971655. [Google Scholar] [CrossRef]
- Gariano, S.L.; Brunetti, M.T.; Iovine, G.; Melillo, M.; Peruccacci, S.; Terranova, O.; Vennari, C.; Guzzetti, F. Calibration and Validation of Rainfall Thresholds for Shallow Landslide Forecasting in Sicily, Southern Italy. Geomorphology 2015, 228, 653–665. [Google Scholar] [CrossRef]
- Nikolopoulos, E.I.; Borga, M.; Creutin, J.D.; Marra, F. Estimation of Debris Flow Triggering Rainfall: Influence of Rain Gauge Density and Interpolation Methods. Geomorphology 2015, 243, 40–50. [Google Scholar] [CrossRef]
- Rossi, M.; Luciani, S.; Valigi, D.; Kirschbaum, D.; Brunetti, M.T.; Peruccacci, S.; Guzzetti, F. Statistical Approaches for the Definition of Landslide Rainfall Thresholds and Their Uncertainty Using Rain Gauge and Satellite Data. Geomorphology 2017, 285, 16–27. [Google Scholar] [CrossRef]
- Peres, D.J.; Cancelliere, A.; Greco, R.; Bogaard, T.A. Influence of Uncertain Identification of Triggering Rainfall on the Assessment of Landslide Early Warning Thresholds. Nat. Hazards Earth Syst. Sci. 2018, 18, 633–646. [Google Scholar] [CrossRef] [Green Version]
- Gariano, S.L.; Melillo, M.; Peruccacci, S.; Brunetti, M.T. How Much Does the Rainfall Temporal Resolution Affect Rainfall Thresholds for Landslide Triggering? Nat. Hazards 2020, 100, 655–670. [Google Scholar] [CrossRef] [Green Version]
- Xu, Q. Understanding the Landslide Monitoring and Early Warn-Ing: Consideration to Practical Issues. J. Eng. Geol. 2020, 28, 360–374. (In Chinese) [Google Scholar] [CrossRef]
- Jiang, W.; Chen, G.; Meng, X.; Jin, J.; Zhao, Y.; Lin, L.; Li, Y. Probabilistic Rainfall Threshold of Landslides in Data-Scarce Mountainous Areas: A Case Study of the Bailong River Basin, China. Catena 2022, 213, 106190. [Google Scholar] [CrossRef]
- Pan, H.-L.; Jiang, Y.-J.; Wang, J.; Ou, G.-Q. Rainfall Threshold Calculation for Debris Flow Early Warning in Areas with Scarcity of Data. Nat. Hazards Earth Syst. Sci. 2018, 18, 1395–1409. [Google Scholar] [CrossRef] [Green Version]
- Peres, D.J.; Cancelliere, A. Comparing Methods for Determining Landslide Early Warning Thresholds: Potential Use of Non-Triggering Rainfall for Locations with Scarce Landslide Data Availability. Landslides 2021, 18, 3135–3147. [Google Scholar] [CrossRef]
- Brunetti, M.T.; Peruccacci, S.; Rossi, M.; Luciani, S.; Valigi, D.; Guzzetti, F. Rainfall Thresholds for the Possible Occurrence of Landslides in Italy. Nat. Hazards Earth Syst. Sci. 2010, 47, 633–635. [Google Scholar] [CrossRef]
- Peruccacci, S.; Brunetti, M.T.; Luciani, S.; Vennari, C.; Guzzetti, F. Lithological and Seasonal Control on Rainfall Thresholds for the Possible Initiation of Landslides in Central Italy. Geomorphology 2012, 139, 79–90. [Google Scholar] [CrossRef]
- Berti, M.; Martina, M.L.V.; Franceschini, S.; Pignone, S.; Simoni, A.; Pizziolo, M. Probabilistic Rainfall Thresholds for Landslide Occurrence Using a Bayesian Approach. J. Geophys. Res. Earth Surf. 2012, 117, 1–20. [Google Scholar] [CrossRef] [Green Version]
- Staley, D.M.; Kean, J.W.; Cannon, S.H.; Schmidt, K.M.; Laber, J.L. Objective Definition of Rainfall Intensity-Duration Thresholds for the Initiation of Post-Fire Debris Flows in Southern California. Landslides 2013, 10, 547–562. [Google Scholar] [CrossRef]
- Peres, D.J.; Cancelliere, A. Derivation and Evaluation of Landslide-Triggering Thresholds by a Monte Carlo Approach. Hydrol. Earth Syst. Sci. 2014, 18, 4913–4931. [Google Scholar] [CrossRef] [Green Version]
- Postance, B.; Hillier, J.; Dijkstra, T.; Dixon, N. Comparing Threshold Definition Techniques for Rainfall-Induced Landslides: A National Assessment Using Radar Rainfall. Earth Surf. Process Landf. 2018, 43, 553–560. [Google Scholar] [CrossRef] [Green Version]
- Marino, P.; Peres, D.J.; Cancelliere, A.; Greco, R.; Bogaard, T.A. Soil Moisture Information Can Improve Shallow Landslide Forecasting Using the Hydrometeorological Threshold Approach. Landslides 2020, 17, 2041–2054. [Google Scholar] [CrossRef]
- Piciullo, L.; Tiranti, D.; Pecoraro, G.; Cepeda, J.M.; Calvello, M. Standards for the Performance Assessment of Territorial Landslide Early Warning Systems. Landslides 2020, 17, 2533–2546. [Google Scholar] [CrossRef]
- Zhang, K.; Wang, S.; Bao, H.; Zhao, X. Characteristics and Influencing Factors of Rainfall-Induced Landslide and Debris Flow Hazards in Shaanxi Province, China. Nat. Hazards Earth Syst. Sci. 2019, 19, 93–105. [Google Scholar] [CrossRef] [Green Version]
- Mattauer, M.; Matte, P.; Malavieille, J.; Tapponnier, P.; Maluski, H.; Qin, X.Z.; Lun, L.Y.; Qin, T.Y. Tectonics of the Qinling Belt: Build-up and Evolution of Eastern Asia. Nature 1985, 317, 496–500. [Google Scholar] [CrossRef]
- Xue, F.; Lerch, M.F.; Kröner, A.; Reischmann, T. Tectonic Evolution of the East Qinling Mountains, China, in the Palaeozoic: A Review and New Tectonic Model. Tectonophysics 1996, 253, 271–284. [Google Scholar] [CrossRef]
- Li, W.; Liu, C.; Hong, Y.; Zhang, X.; Wan, Z.; Saharia, M.; Sun, W.; Yao, D.; Chen, W.; Chen, S.; et al. A Public Cloud-Based China’s Landslide Inventory Database (CsLID): Development, Zone, and Spatiotemporal Analysis for Significant Historical Events, 1949–2011. J. Mt. Sci. 2016, 13, 1275–1285. [Google Scholar] [CrossRef]
- Qiu, H.; Cui, Y.; Hu, S.; Yang, D.; Pei, Y.; Yang, W. Temporal and Spatial Distributions of Landslides in the Qinba Mountains, Shaanxi Province, China. Geomat. Nat. Hazards Risk 2019, 10, 599–621. [Google Scholar] [CrossRef]
- Liu, J. Analysis of “2018.7” flooding in Lueyang station, Jialing River. Shaanxi Water Resour. 2019, 02, 74–76. (In Chinese) [Google Scholar] [CrossRef]
- Rescuers Rush to Help Rainstorm-Hit County. Available online: http://www.ecns.cn/hd/2018-07-16/detail-ifyvzyvz7264489.shtml (accessed on 16 July 2018).
- Melillo, M.; Brunetti, M.T.; Peruccacci, S.; Gariano, S.L.; Guzzetti, F. An Algorithm for the Objective Reconstruction of Rainfall Events Responsible for Landslides. Landslides 2015, 12, 311–320. [Google Scholar] [CrossRef]
- Melillo, M.; Brunetti, M.T.; Peruccacci, S.; Gariano, S.L.; Roccati, A.; Guzzetti, F. A Tool for the Automatic Calculation of Rainfall Thresholds for Landslide Occurrence. Environ. Model. Softw. 2018, 105, 230–243. [Google Scholar] [CrossRef]
- Thornthwaite, C.W. An Approach toward a Rational Classification of Climate. Geogr. Rev. 1948, 38, 55–94. [Google Scholar] [CrossRef]
- Fawcett, T. An Introduction to ROC Analysis. Pattern Recognit. Lett. 2006, 27, 861–874. [Google Scholar] [CrossRef]
- Vennari, C.; Gariano, S.L.; Antronico, L.; Brunetti, M.T.; Iovine, G.; Peruccacci, S.; Terranova, O.; Guzzetti, F. Rainfall Thresholds for Shallow Landslide Occurrence in Calabria, Southern Italy. Nat. Hazards Earth Syst. Sci. 2014, 14, 317–330. [Google Scholar] [CrossRef] [Green Version]
Figure 1.
(a) Location of Shaanxi province; (b) location of Lueyang (LY) and Xunyang (XY) counties; (c,d) distribution of weather station, rain gauges, and landslides in LY and XY counties, respectively (image sources: SRTM V3 data).
Figure 1.
(a) Location of Shaanxi province; (b) location of Lueyang (LY) and Xunyang (XY) counties; (c,d) distribution of weather station, rain gauges, and landslides in LY and XY counties, respectively (image sources: SRTM V3 data).

Figure 2.
(a,b) Comparison between monthly rainfall and number of landslides for LY and XY counties, respectively; (c,d) Date distribution of landslides for LY and XY counties. The total number of landslides occurred in July of 2018 in LY is 164: 1 on 10th, 75 on 11th, 88 on 14th.
Figure 2.
(a,b) Comparison between monthly rainfall and number of landslides for LY and XY counties, respectively; (c,d) Date distribution of landslides for LY and XY counties. The total number of landslides occurred in July of 2018 in LY is 164: 1 on 10th, 75 on 11th, 88 on 14th.

Figure 3.
Flowchart of the procedure adopted in this study.

Figure 4.
Example of the reconstruction of REs, NTEs, MRCs, and MPRCs. (a) Hourly rainfall measurements of Heihaba rain gauge from 6th to 16th July 2018; bars with different colors are the identified rainfall sub-events. (b) Selection of the rainfall event associated with landslides (RE 2), (c) reconstruction of MRCs and MPRC for the first landslide; red bars are the computed event rainfall of MRCs, and (d) reconstruction of MRCs and MPRC for the second landslide.

Figure 5.
Defined negative rainfall thresholds: (a) LY county; (b) XY county.

Figure 6.
Defined positive rainfall thresholds based on MRC: (a) LY county; (b) XY county.

Figure 7.
Defined positive rainfall thresholds based on MPRC: (a) LY county; (b) XY county.

Figure 8.
Validation set and best-performing rainfall thresholds: (a) LY county; (b) XY county.

Figure 9.
ROC curves for defined rainfall thresholds: (a) LY county; (b) XY county. Each point represents a threshold at a different non-exceedance/exceedance probability.
Figure 9.
ROC curves for defined rainfall thresholds: (a) LY county; (b) XY county. Each point represents a threshold at a different non-exceedance/exceedance probability.


Table 1.
Input parameters of CRTL-T adopted in this study.
| Parameter Name | Parameter Value | Unit | |
|---|---|---|---|
| Warm Periods (CW) | Cold Periods (CC) | ||
| Gs | 0.1 | 0.1 | mm |
| ER | 0.2 | 0.2 | mm |
| Rb | 15 | 15 | km |
| P1 | 3 | 6 | h |
| P2 | 6 | 12 | h |
| P3 | 1 | 1 | mm |
| P4 | 48 | 96 | h |
Table 2.
Contingency matrix defined for comparing the actual and predicted events based on a defined threshold E = f(D).
Table 2.
Contingency matrix defined for comparing the actual and predicted events based on a defined threshold E = f(D).
| Actual Events | |||
|---|---|---|---|
| Landslides | No Landslides | ||
| Predicted events | Landslides: E ≥ f(D) | TP | FP |
| No landslides: E < f(D) | FN | TN | |
Table 3.
Statistic of reconstructed rainfall events in the calibration set for Lueyang (LY) and Xunyang (XY) counties.
Table 3.
Statistic of reconstructed rainfall events in the calibration set for Lueyang (LY) and Xunyang (XY) counties.
| Events | Number | Duration (h) | Cumulated Rainfall (mm) | ||
|---|---|---|---|---|---|
| Min | Max | Min | Max | ||
| LY | |||||
| RE | 2467 | 1 | 1075 | 1.1 | 690 |
| RE associated with landslides | 29 | 2 | 383 | 14.5 | 690 |
| MRC total/not considering repetitions | 465/233 | 2 | 230 | 5.1 | 306.8 |
| MPRC total/not considering repetitions | 171/74 | 2 | 120 | 5.3 | 277.9 |
| Non-triggering RE | 2438 | 1 | 1075 | 1.1 | 381.9 |
| XY | |||||
| RE | 3229 | 1 | 669 | 1.1 | 298 |
| RE associated with landslides | 19 | 13 | 669 | 21 | 298 |
| MRC | 45 | 3 | 337 | 7.9 | 163.9 |
| MPRC | 21 | 3 | 187 | 13.3 | 163.9 |
| Non-triggering RE | 3210 | 1 | 526 | 1.1 | 280 |
Table 4.
Negative threshold functions and relative uncertainties of threshold parameters.
| Label | Threshold Equation | △α/α (%) | △γ/γ (%) |
|---|---|---|---|
| N5,LY | E = (10.44 ± 0.45) × D(0.57 ± 0.01) | 4% | 2% |
| N10,LY | E = (7.43 ± 0.31) × D(0.57 ± 0.01) | 4% | 2% |
| N15,LY | E = (5.91 ± 0.24) × D(0.57 ± 0.01) | 4% | 2% |
| N20,LY | E = (4.92 ± 0.20) × D(0.57 ± 0.01) | 4% | 2% |
| N50,LY | E = (2.24 ± 0.09) × D(0.57 ± 0.01) | 4% | 2% |
| N5,XY | E = (10.78 ± 0.40) × D(0.57 ± 0.01) | 4% | 2% |
| N10,XY | E = (7.91 ± 0.29) × D(0.57 ± 0.01) | 4% | 2% |
| N15,XY | E = (6.42 ± 0.22) × D(0.57 ± 0.01) | 3% | 2% |
| N20,XY | E = (5.43 ± 0.19) × D(0.57 ± 0.01) | 3% | 2% |
| N50,XY | E = (2.65 ± 0.08) × D(0.57 ± 0.01) | 3% | 2% |
Table 5.
Positive threshold functions and relative uncertainties of threshold parameters.
| Label | Threshold Equation | △α/α (%) | △γ/γ (%) |
|---|---|---|---|
| P20,LY,MRC | E = (14.59 ± 1.93) × D(0.38 ± 0.03) | 13% | 8% |
| P15,LY,MRC | E = (13.61 ± 1.84) × D(0.38 ± 0.03) | 14% | 8% |
| P10,LY,MRC | E = (12.48 ± 1.74) × D(0.38 ± 0.03) | 14% | 8% |
| P5,LY,MRC | E = (10.97 ± 1.59) × D(0.38 ± 0.03) | 14% | 8% |
| P50,LY,MRC | E = (19.68 ± 2.35) × D(0.38 ± 0.03) | 12% | 8% |
| P20,XY,MRC | E = (10.98 ± 5.60) × D(0.34 ± 0.10) | 51% | 28% |
| P15,XY,MRC | E = (10.12 ± 5.19) × D(0.34 ± 0.10) | 51% | 28% |
| P10,XY,MRC | E = (8.98 ± 4.53) × D(0.34 ± 0.10) | 50% | 28% |
| P5,XY,MRC | E = (7.61 ± 3.81) × D(0.34 ± 0.10) | 50% | 28% |
| P50,XY,MRC | E = (16.13 ± 8.41) × D(0.34 ± 0.10) | 52% | 28% |
| P20,LY,MPRC | E = (11.80 ± 2.14) × D(0.47 ± 0.05) | 18% | 12% |
| P15,LY,MPRC | E = (10.73 ± 1.99) × D(0.47 ± 0.05) | 19% | 12% |
| P10,LY,MPRC | E = (9.51 ± 1.82) × D(0.47 ± 0.05) | 19% | 12% |
| P5,LY,MPRC | E = (7.96 ± 1.58) × D(0.47 ± 0.05) | 20% | 12% |
| P50,LY,MPRC | E = (17.84 ± 2.92) × D(0.47 ± 0.05) | 16% | 12% |
| P20,XY,MPRC | E = (24.43 ± 19.85) × D(0.18 ± 0.17) | 81% | 96% |
| P15,XY,MPRC | E = (22.04 ± 17.58) × D(0.18 ± 0.17) | 80% | 96% |
| P10,XY,MPRC | E = (19.36 ± 14.91) × D(0.18 ± 0.17) | 77% | 96% |
| P5,XY,MPRC | E = (15.99 ± 11.92) × D(0.18 ± 0.17) | 75% | 96% |
| P50,XY,MPRC | E = (38.10 ± 33.51) × D(0.18 ± 0.17) | 88% | 96% |
Table 6.
Number of elements of the contingency matrix calculated for the rainfall thresholds defined in LY.
Table 6.
Number of elements of the contingency matrix calculated for the rainfall thresholds defined in LY.
| Label | TP | FN | FP | TN |
|---|---|---|---|---|
| N5,LY | 54 | 20 | 16 | 543 |
| N10,LY | 65 | 9 | 37 | 522 |
| N15,LY | 70 | 4 | 60 | 499 |
| N20,LY | 71 | 3 | 92 | 467 |
| P20,LY,MRC | 62 | 12 | 41 | 518 |
| P15,LY,MRC | 65 | 9 | 44 | 515 |
| P10,LY,MRC | 67 | 7 | 54 | 505 |
| P5,LY,MRC | 68 | 6 | 64 | 495 |
| P20,LY,MPRC | 62 | 12 | 29 | 530 |
| P15,LY,MPRC | 63 | 11 | 34 | 525 |
| P10,LY,MPRC | 66 | 8 | 48 | 511 |
| P5,LY,MPRC | 70 | 4 | 61 | 498 |
Table 7.
Number of elements of the contingency matrix calculated for the rainfall thresholds defined in XY.
Table 7.
Number of elements of the contingency matrix calculated for the rainfall thresholds defined in XY.
| Label | TP | FN | FP | TN |
|---|---|---|---|---|
| N5,XY | 4 | 17 | 33 | 885 |
| N10,XY | 7 | 14 | 103 | 815 |
| N15,XY | 14 | 7 | 146 | 772 |
| N20,XY | 17 | 4 | 184 | 734 |
| P20,XY,MRC | 17 | 4 | 210 | 708 |
| P15,XY,MRC | 17 | 4 | 223 | 695 |
| P10,XY,MRC | 18 | 3 | 258 | 660 |
| P5,XY,MRC | 19 | 2 | 279 | 639 |
| P20,XY,MPRC | 15 | 6 | 171 | 747 |
| P15,XY,MPRC | 17 | 4 | 190 | 728 |
| P10,XY,MPRC | 17 | 4 | 214 | 704 |
| P5,XY,MPRC | 18 | 3 | 255 | 663 |
Table 8.
Skill scores for the defined rainfall thresholds in LY (the best values of the scores, for each type of threshold, are underlined).
Table 8.
Skill scores for the defined rainfall thresholds in LY (the best values of the scores, for each type of threshold, are underlined).
| Label | EI | TPR | FPR | PPV | δ |
|---|---|---|---|---|---|
| N5,LY | 0.94 | 0.73 | 0.03 | 0.77 | 0.271 |
| N10,LY | 0.93 | 0.88 | 0.07 | 0.64 | 0.134 |
| N15,LY | 0.90 | 0.95 | 0.11 | 0.54 | 0.121 |
| N20,LY | 0.85 | 0.96 | 0.16 | 0.44 | 0.165 |
| P20,LY,MRC | 0.92 | 0.84 | 0.07 | 0.60 | 0.175 |
| P15,LY,MRC | 0.92 | 0.88 | 0.08 | 0.60 | 0.411 |
| P10,LY,MRC | 0.90 | 0.91 | 0.10 | 0.55 | 0.135 |
| P5,LY,MRC | 0.89 | 0.92 | 0.11 | 0.52 | 0.136 |
| P20,LY,MPRC | 0.94 | 0.84 | 0.05 | 0.68 | 0.168 |
| P15,LY,MPRC | 0.93 | 0.85 | 0.06 | 0.65 | 0.162 |
| P10,LY,MPRC | 0.91 | 0.89 | 0.09 | 0.58 | 0.142 |
| P5,LY,MPRC | 0.90 | 0.95 | 0.11 | 0.53 | 0.121 |
Table 9.
Skill scores for the defined rainfall thresholds in XY (the best values of the scores, for each type of threshold, are underlined).
Table 9.
Skill scores for the defined rainfall thresholds in XY (the best values of the scores, for each type of threshold, are underlined).
| Label | EI | TPR | FPR | PPV | δ |
|---|---|---|---|---|---|
| N5,XY | 0.95 | 0.19 | 0.04 | 0.11 | 0.811 |
| N10,XY | 0.88 | 0.33 | 0.11 | 0.06 | 0.679 |
| N15,XY | 0.84 | 0.71 | 0.16 | 0.09 | 0.331 |
| N20,XY | 0.80 | 0.81 | 0.20 | 0.08 | 0.276 |
| P20,XY,MRC | 0.77 | 0.81 | 0.23 | 0.07 | 0.298 |
| P15,XY,MRC | 0.76 | 0.81 | 0.24 | 0.07 | 0.306 |
| P10,XY,MRC | 0.72 | 0.86 | 0.28 | 0.07 | 0.313 |
| P5,XY,MRC | 0.70 | 0.90 | 0.30 | 0.06 | 0.316 |
| P20,XY,MPRC | 0.81 | 0.71 | 0.19 | 0.08 | 0.347 |
| P15,XY,MPRC | 0.79 | 0.81 | 0.21 | 0.08 | 0.283 |
| P10,XY,MPRC | 0.77 | 0.81 | 0.23 | 0.07 | 0.298 |
| P5,XY,MPRC | 0.73 | 0.86 | 0.28 | 0.07 | 0.313 |
Disclaimer/Publisher’s Note: The statements, opinions and data contained in all publications are solely those of the individual author(s) and contributor(s) and not of MDPI and/or the editor(s). MDPI and/or the editor(s) disclaim responsibility for any injury to people or property resulting from any ideas, methods, instructions or products referred to in the content. |
© 2023 by the authors. Licensee MDPI, Basel, Switzerland. This article is an open access article distributed under the terms and conditions of the Creative Commons Attribution (CC BY) license (https://creativecommons.org/licenses/by/4.0/).
Share and Cite
MDPI and ACS Style
Zhang, S.; Pecoraro, G.; Jiang, Q.; Calvello, M. Definition of Rainfall Thresholds for Landslides Using Unbalanced Datasets: Two Case Studies in Shaanxi Province, China. Water 2023, 15, 1058. https://doi.org/10.3390/w15061058
AMA Style
Zhang S, Pecoraro G, Jiang Q, Calvello M. Definition of Rainfall Thresholds for Landslides Using Unbalanced Datasets: Two Case Studies in Shaanxi Province, China. Water. 2023; 15(6):1058. https://doi.org/10.3390/w15061058
Chicago/Turabian StyleZhang, Sen, Gaetano Pecoraro, Qigang Jiang, and Michele Calvello. 2023. "Definition of Rainfall Thresholds for Landslides Using Unbalanced Datasets: Two Case Studies in Shaanxi Province, China" Water 15, no. 6: 1058. https://doi.org/10.3390/w15061058
Note that from the first issue of 2016, this journal uses article numbers instead of page numbers. See further details here.