Article

The Impacts of Land Use and Seasonal Effects on Phytoplankton Taxa and Physical-Chemical Variables in the Tigris River within the City of Mosul

by
Majd Muwafaq Yaqoob
1,2,†,
Imre Somlyai
1,3,†,
Csaba Berta
1,3,*,
István Bácsi
1,
Aws N. Al-Tayawi
4,
Kossay K. Al-Ahmady
5,
Ramadhan Hamza Mohammed
6,
Omar Alalami
7 and
István Grigorszky
1,3
1
Department of Hydrobiology, University of Debrecen, Egyetem tér 1, H-4032 Debrecen, Hungary
2
Pál Juhász-Nagy Doctoral School of Biology and Environmental Sciences, University of Debrecen, Egyetem tér 1, H-4032 Debrecen, Hungary
3
Department of Hydrobiology, National Laboratory for Water Science and Water Security, University of Debrecen, H-4032 Debrecen, Hungary
4
College of Environmental Sciences and Technology, University of Mosul, Mosul I-00964, Iraq
5
Department of Environmental Engineering, University of Mosul, Mosul I-00964, Iraq
6
Institutional Research Center (IRC), University of Duhok, Kurdistan Region, P.O. Box 78, Duhok I-1006, Iraq
7
Department of Chemical Engineering, University of Debrecen, Egyetem tér 1, H-4032 Debrecen, Hungary
*
Author to whom correspondence should be addressed.
These authors contributed equally to this work.
Water 2023, 15(6), 1062; https://doi.org/10.3390/w15061062
Submission received: 31 January 2023 / Revised: 6 March 2023 / Accepted: 7 March 2023 / Published: 10 March 2023

Abstract

:
We investigated the effect of land use based on the dominant phytoplankton and physical-chemical variables in the different areas of the Tigris River, within the city of Mosul. Agricultural and urban activities have a significant impact on the water quality of the river. Regardless of physical and chemical variables, phytoplankton act as a bio-indicator of water quality due to their fast and sensitive response to changes in the environment. Our research was conducted in the Tigris River within the city of Mosul by examining the phytoplankton species and the physical-chemical variables at 16 sites during each vegetation period. Point and non-point source pollutants have affected the Tigris River within the city of Mosul, getting into the river from upstream through agricultural activities and by urban activities in the middle section of the city, respectively from both banks. Based on our results, we observed the highest phytoplankton abundance during the October sampling periods, while the lowest occurred during the July sampling period, which was associated with maximum water temperature and absence of rain. According to our study, land use (e.g., agricultural, and urban activities) greatly affected the dominant phytoplankton species and physical-chemical variables of the Tigris River. Oscillatoria sp. dominated all seasons in the agricultural region, while at the same time, we observed an increase in the number of phytoplankton species caused by the nutrient availability upstream on the river. The effects of climate have very significant and characteristic effects in this area, which basically determine the community of organisms and the water quality; the effects resulting from anthropogenic activity significantly modify this. Based on our investigation, in the part of the Tigris River connected to Mosul, we found a clear connection between the pollution caused and the effects of different land uses, through the examination of the algal community and physical-chemical variables in different periods of the year.

1. Introduction

Rivers are essential to human existence and a natural ecology and refuge for many biological species, including eukaryotic and prokaryotic plankton, which are among the most diverse [1,2]. Human activity worldwide, such as the release of water contaminants due to rising urbanization and population, may intensify the contamination of aquatic environments [3,4,5,6]. The water quality of the river could be highly affected by the discharge of domestic wastes, sewage, and agricultural and industrial influents, which can contain substances varying from normal nutrients to highly toxic substances [7,8]. Anthropogenic activities e.g., deforestation, change in land use, expansion of agriculture, development of industry, urbanization, and increasing wastewater production can significantly affect the environment where people live and work [9,10,11,12,13,14].
Agricultural and urban areas are typically regarded as the major sources of contaminants (e.g., nutrients and organic pollution) in freshwater ecosystems [15,16,17]. Because of environmental and land use changes, these actions affect terrestrial and aquatic ecosystems, negatively affecting water quality [18,19].
With the dramatic expansion of urban land use and the global population over the last few decades, urbanization has become one of the most extreme forms of land-use alteration triggered by humans [20]. Ecosystems in urban regions are distinct from those in natural environments due to differences in air chemistry, geochemistry, temperature, hydrology, and plant covering [21]. Deterioration in water quality is often attributed to human activities and global environmental changes [22].
Land use changes can not only impact water quality but also serve as a driver of aquatic diversity [23,24,25]. Phytoplankton which form the most important component of aquatic ecosystems as primary producers, are very sensitive to the changing environmental conditions and respond accordingly. They play an important role in studying the impact of human activities and climate change on aquatic ecosystems [6,26].
Few studies have shown that Iraq′s water bodies are suffering from deterioration of the water quality [27,28]. This change in water quality has resulted from the discharge of untreated municipal wastewater, the increase in urbanization, and the intensification of agricultural activities [6,29,30]. Therefore, the river in the city of Mosul is vulnerable to a wide range of diffuse and point pollution. However, little is known about the phytoplankton communities in the city of Mosul and how they are adapted to the altered water quality.
In our study, we explored (i) the relationship between land use and pollution in the Tigris River using physical and chemical variables (Figure 1). Additionally, we examined (ii) how these factors affect phytoplankton composition and whether (ii) these organisms can serve as indicators of pollution resulting from land use.

2. Materials and Methods

2.1. Study Area

The current investigation was made in the Tigris River within the city of Mosul in Iraq (Figure 2a), located between latitude 36.34° N and longitude 43.13° N. Two sources of pollution are affecting the water quality of the Tigris River, point sources and non-point sources. The non-point source pollution is a result of agriculture activities, precipitation, and urban runoff while the point source pollution is wastewater discharge.
This area has a semi-arid climate, with an average humidity of 36% and an UV-index of 6. It is dry for 284 days a year. The highest average temperature occurs in July, reaching 42 °C, while the lowest temperature occurs in January, at 13 °C. From December to March, the area experiences rain on 7–10 days per month, with sunny days alternating with rainy periods. Nighttime temperatures can drop a few degrees below freezing (0 °C), and occasionally, it can even snow. During the summer months, the area is very hot, with temperatures reaching 43 °C in July and August and peaking at 48 °C. The air humidity is generally low during this time.
The Mosul Dam, located 50 km from the studied area, serves to generate hydroelectricity and provide water for downstream irrigation. Typically, balanced flow conditions occur downstream of the dam. The average water depth in the studied section is approximately 3 m, although depths of around 1 m or 5 m were observed in some sampling sites. The studied area was divided into four main zones (Figure 2b). Each area included four sampling points based on land use. Zone A, the upstream river, consisted of (1, 2, 3 and 4) sampling points which were affected by agricultural activities. Zone B was in the middle of the city, consisting of the sampling points from 5, 6, 7 and 8; this area is highly affected by agricultural activities and forestry. Zone C consisted of four points (9, 10, 11 and 12), mainly affected by urban activities (this zone is in the middle of the city). Lastly, Zone D, containing four sampling points (13, 14, 15 and 16), was downstream and affected by agriculture activities and livestock farming.

2.2. Land Use Map

A cloudless LC08 image obtained on 27 June 2021 was used to classify the land use over the study area in the city of Mosul (Figure 2c). A supervised classification was used to classify the image into four main classes (river area, urban area, agriculture area, and forest area).

2.3. Sample Collection

During the study period, 16 water samples per season were collected from the Tigris River. Our study covered about 13 km of the river, where the first station was selected at the point where the river entered the city of Mosul (upstream river, Figure 2) and station number 16 was selected as the last station after leaving the city (downstream river, Figure 2). A total of 64 water samples were collected during the four sampling periods (16 samples each) to represent the seasonal variances (1st of April, 13th of July, 7th of October, and 29th December) in 2021. The samples were taken from a boat. Sampling was carried out in the middle of the river from the current, 20 cm from the water surface.
During our study, phytoplankton and physical-chemical variables were investigated. Samples for the chemical analysis and phytoplankton samples were collected with a weighted plastic bottle at each sampling point. At the time of sampling, 500 cm3 water samples were taken for algal analysis.
At each sampling location in the field, water temperature (°C) and dissolved oxygen (mg/L) were directly measured using a digital portable ADWA AD630 dissolved oxygen meter (Adwa Instruments, Szeged, Hungary). pH was measured using a digital portable ADWA AD132 pH meter, total dissolved solids (TDS) were measured using a digital portable ADWA AD31 TDS meter, and turbidity (NTU) was measured using a Hach DR2010 device (hach, Loveland, CO, USA).
During the laboratorial work, we measured (NO3-N µg/mL, NO2-N µg/mL, PO4-P µg/mL, NH4-N µg/mL, Cl mg/L, CODsMn mg/L, chlorophyll-a mg/L, TSS mg/L, HCO3 mg/L, and BOD5 mg/L) according to the analytical standards of the Hungarian water quality monitoring service (Hungarian National Standards, MSZ 12749:1993).
The phytoplankton samples were immediately fixed on the field with Lugol’s iodine for subsequent phytoplankton counting with the Utermöhl inverted microscope technique [31]. Sedimentation chambers were used for microscopic analyses during counting. Their volumes were 5 cm3, 10 cm3, and 15 cm3 depending on the amount of algae in the water sample. The microscopic investigation was done with an Olympus-IX73 (Olympus, Tokyo, Japan) inverted and an Olympus-BX53 microscope using phase-contrast and Nomarski-contrast technics. The investigation was done at 400 and 1000 magnification.

2.4. Data Analysis

The data of phytoplankton was counted as individuals/litre (ind. L−1). A multivariate approach was used for statistical analysis to illustrate abiotic and biotic change patterns between phytoplankton distribution and environmental variables. Linear discriminant analysis (LDA) was applied by using the R add-on package “MASS” to reveal the pattern of phytoplankton variability in relation to physical-chemical characteristics. LDA belongs to a statistical technique that so-called ‘‘supervised pattern recognition methods’’, which maximizes the variance between the groups [32,33]. For LDA analysis, the phytoplankton taxa were only used at more than 2% of relative abundance. Canonical correspondence analysis (CCA) was performed using physical-chemical variables and phytoplankton taxa (relative abundance > 0.5%), using the R package “vegan”. Both phytoplankton and environmental data were transformed (log+1) before being generated as LDA and CCA outputs.
The ANOVA test was used to compare phytoplankton in different seasons and was conducted using PAST ver. 2.17c [34]. To investigate the community structure, hierarchical clustering was performed using Ward′s method and Manhattan distance in SPSS package [35]. The data were linearized using a log+1 transformation for the cluster analysis.

3. Results

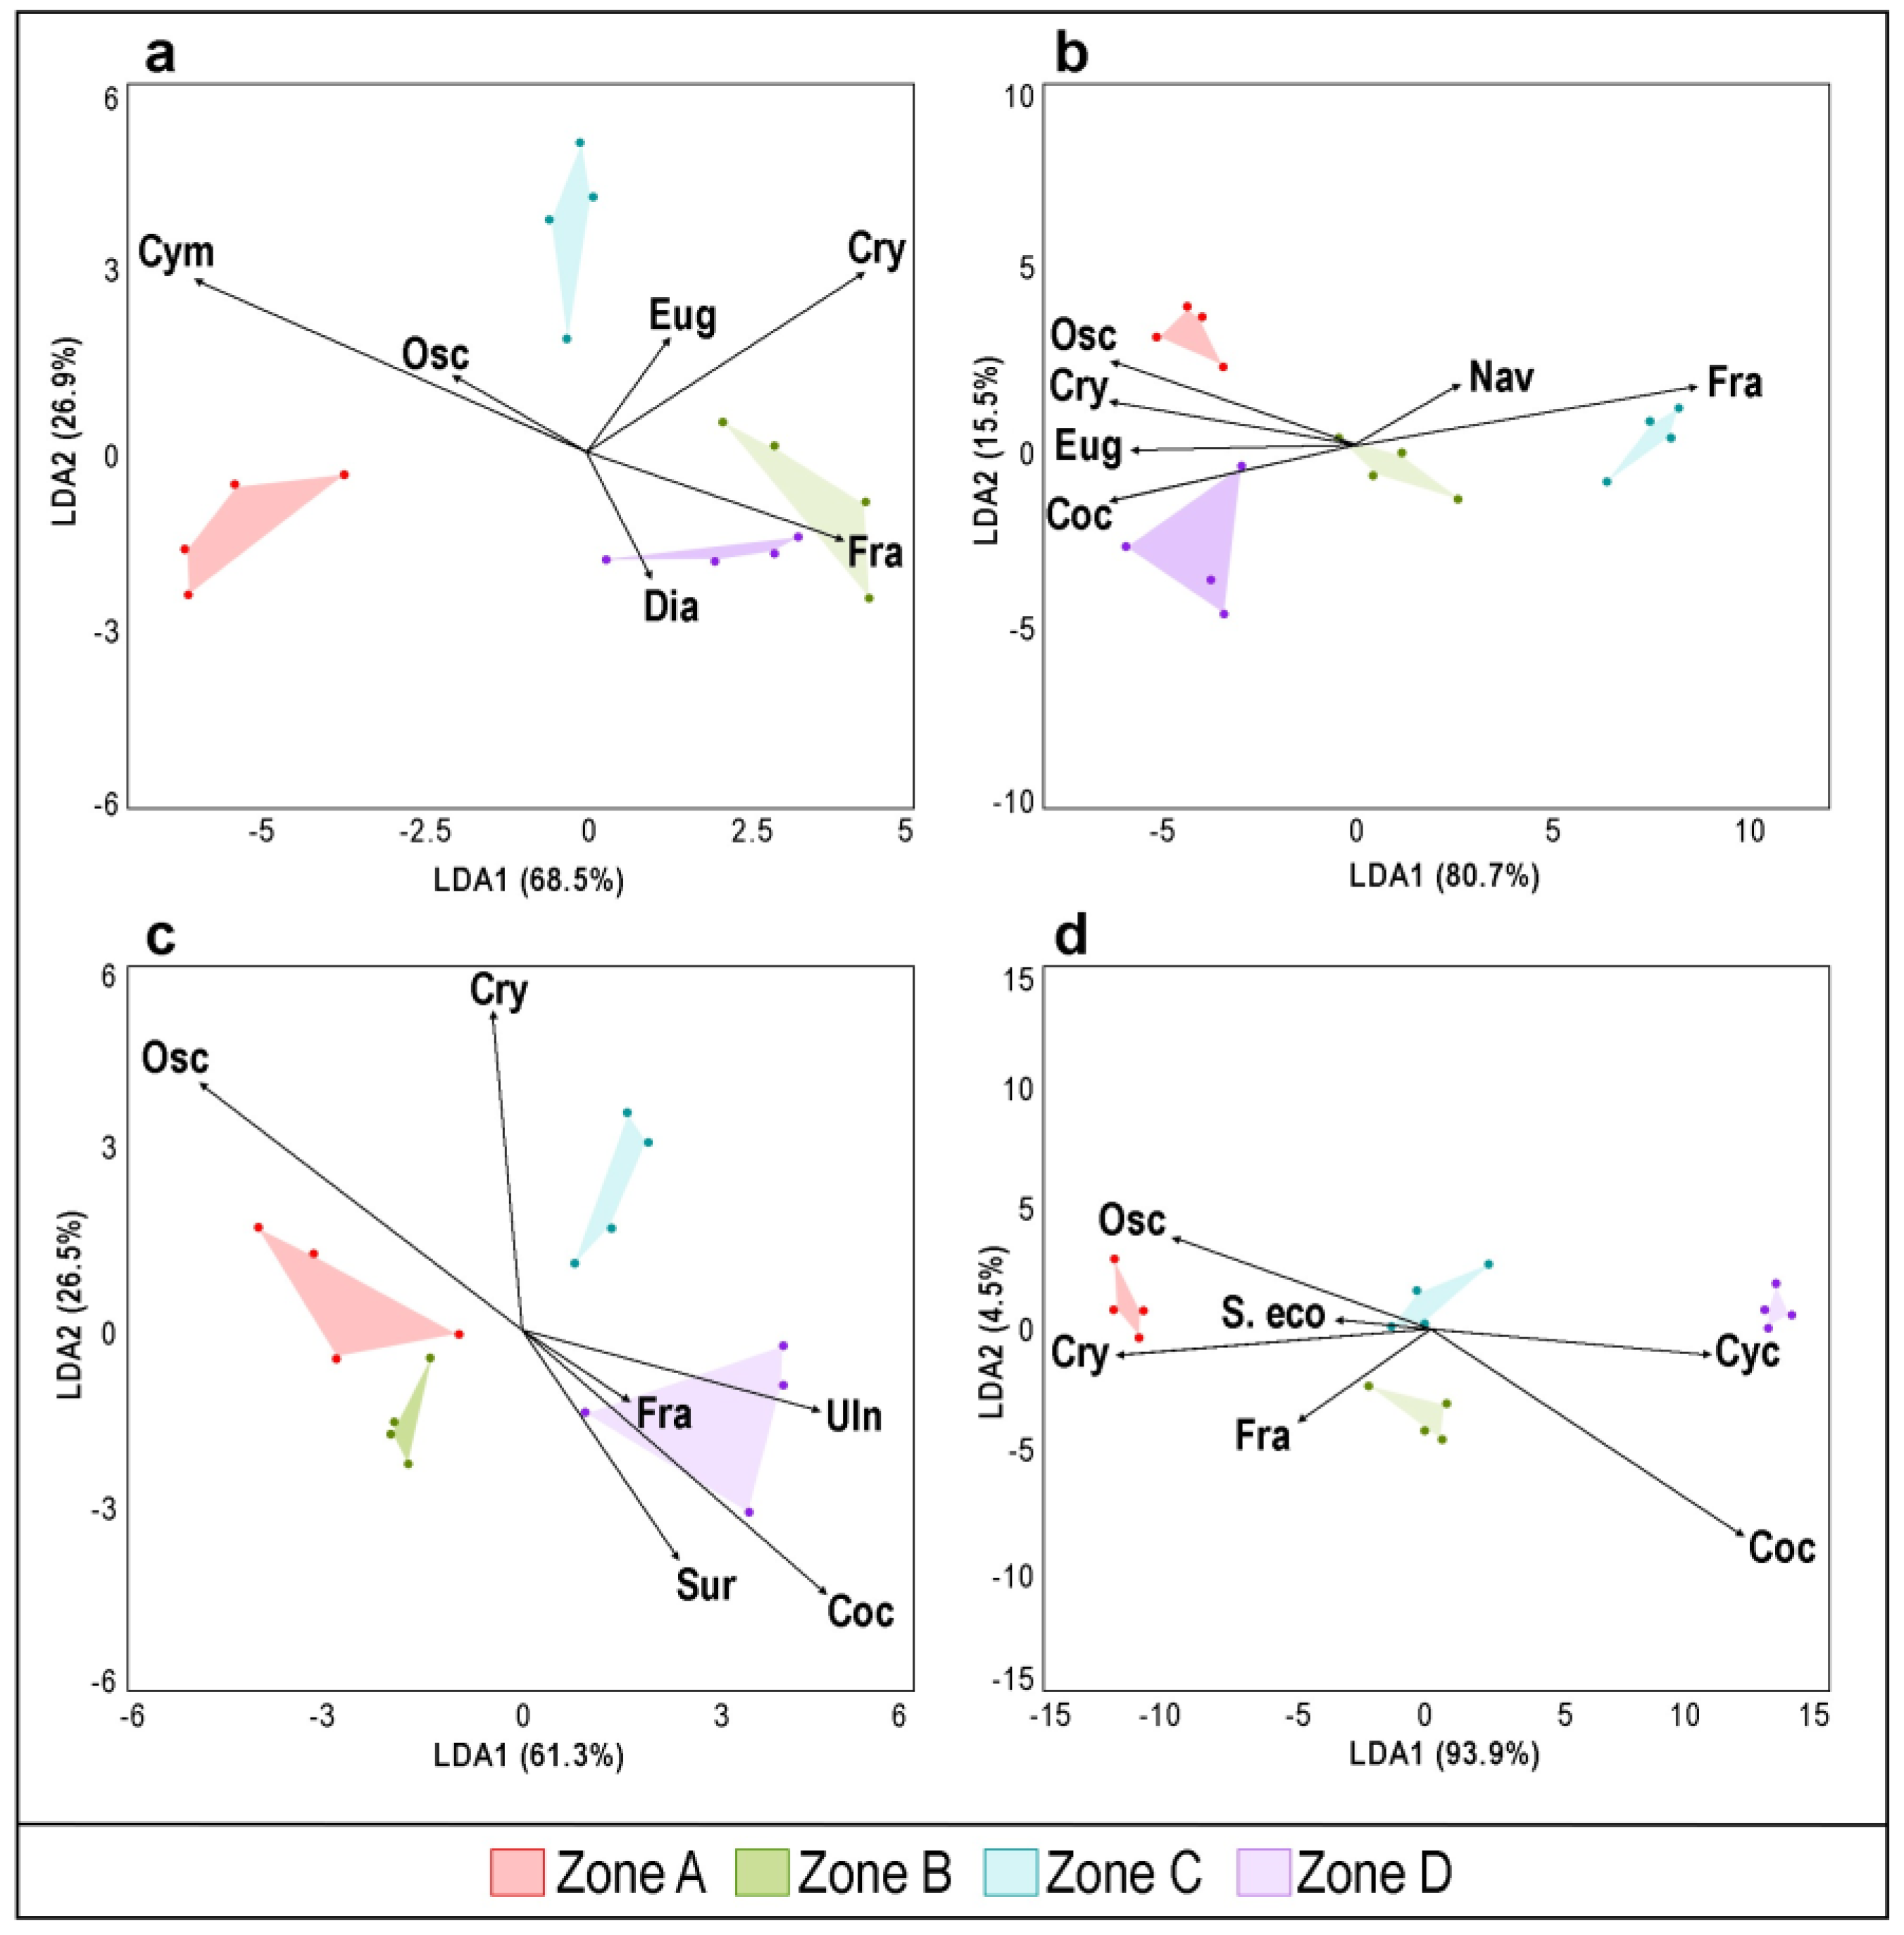
3.1. Seasonal Effects on the Phytoplankton Communities and Environmental Variables

Spring was a rainy season with a high-water discharge rate (Figure 3A). During April, the air and water temperatures were (25 °C, and 15.6 °C) respectively. The air and water temperatures in July (the summer season) reached their maxima (50 °C, 29.6 °C), and the summer season characterized by a low water discharge and no rain (Figure 3). In the autumn season (October), the air and water temperature were 35 °C and 17 °C respectively, with low water discharge rate and no rain (Figure 3A). While in December (the winter season), the air and water temperature dropped to the lowest (12 °C, 11 °C); winter was a rainy season with low water discharge (Figure 2a).
Figure (Figure 3B) shows that the October sampling period has the highest peak of phytoplankton total abundance, while April has the second highest peak during the study period. The lowest abundance of phytoplankton was in July. The total abundance of phytoplankton was moderate in December.
Fourteen variables were measured to investigate the different zones of the Tigris River near Mosul. These variables included pH, dissolved oxygen, BOD5, CODsMn, various forms of nitrogen (NH4-N, NO2-N, NO3-N), PO4-P, chloride, HCO3-, total dissolved solids, total suspended solids, turbidity, and chlorophyll-a. The purpose of measuring these variables was to study changes in the algal community and the effects of different types of water uses. Table 1 displays the minimum, maximum, and median values of the physical and chemical variables measured in the examined section of the Tigris River during the four investigated periods.
The Canonical correspondence analysis (CCA) (Figure 4) shows that spring and summer sampling periods strongly differed from autumn and winter sampling periods based on phytoplankton taxa and environmental variables. The first axis of CCA explained (57.7%) of the total variance, and the second axis explained (20.1%) of the variance.

3.2. Phytoplankton Species

According to the phytoplankton taxa abundance in April (Figure 5a), zone A differed from the other three zones. The first axis of April LDA explained (68.5%) of the total variance, and the second axis explained (26.9%) of the variance. Zone A has a high abundance of Cymbella parva, Oscillatoria sp. Zone B was characterized by a high abundance of the Fragilaria tenera and Cryptomonas ovata species. While zone C has a high abundance of Euglena sp. species. Lastly, zone D has a higher abundance of Diatoma vulgaris species.
In the summer season, the LDA (Figure 5b) showed that zone C and B differed from the other two zones based on the phytoplankton phylum. The first axis of July LDA explained (80.7%) of the total variance, and the second axis explained (15.5%) of the variance.
Zone A and D are characterized by a high abundance of Oscillatoria sp., Cryptomonas ovata, Euglenaformis proxima, and Cocconeis pediculus species. On the other hand, zone C and B are characterized by Fragilaria sp.
During the Autumn sampling, the LDA graph (Figure 5c) indicated that according to the abundance of phytoplankton, zones A and B differed from the other two zones. The C and D zones also differ from each other. The first axis of October LDA explained (61.3%) of the total variance, and the second axis explained (26.5%) of the variance. Zone A and B are characterized by the high abundance of Oscillatoria sp. While zone C is characterized by a high abundance of Cryptomonas ovata. Moreover, zone D has a higher abundance of Cocconeis pediculus, Surirella tenera, Fragilaria tenera, and Ulnaria ulna species.
According to the LDA graph in the winter season during December (Figure 5d),—based on the abundance of phytoplankton taxa—three different groups were separated. Every zone differed from the other in the winter season. The first axis of the LDA explained (93.9%) of the total variance, and the second axis explained (4.5%) of the variance. Zone A characterized by the highest abundance of Cryptomonas ovata, Oscillatoria sp. Zone B is characterized by Fragilaria tenera species. While zone C is characterized by a high abundance of S. ecornis. Zone D has the highest abundance of Cyclotella sp. and Cocconeis pediculus species.
Data on phytoplankton abundance in the different sampling periods are included in Supplementary Materials (Table S1).

3.3. Physical-Chemical Variables

According to the physical-chemical variables at spring (Figure 6a), zone A differed strongly from the other three zones. The first axis of April LDA explained (96.7%) of the total variance, and the second axis explained (2.17%) of the variance. During April, zone A was characterized by a high concentration of PO43−-P, NO3-N. The zones B, C, and D have a high concentration of NH4-N, NO2-N, TSS, and high turbidity.
During the summer season in July, the graph of LDA (Figure 6b) showed that zone A and B are similar, but zone C and D differed from each other and from zones A and B based on the physical-chemical variables. The first axis of July LDA explained (64.74%) of the total variance, and the second axis explained (24.2%) of the variance. Zone C is characterized by a high concentration of CODsMn and TSS. Zone D has the maximum concentration of chlorophyll-a, PO4-P, and NO2-N. Zone A and B have a high concentration of NH4-N.
During the season of Autumn in October, the LDA graph (Figure 6c)—according to the physical-chemical variables—indicates that zones A and B differed from the C and D zones. The C and D zones also differed from each other. The first axis of July LDA explained (74.31%) of the total variance, and the second axis explained (23.51%) of the variance. At zones A and B, the concentration of NH4-N and the concentration of NO3-N was the highest. Zone C is characterized by the maximum concentration of TSS, and CODsMn. Furthermore, zone D has a high concentration of NO2-N.
According to the LDA graph, in the winter season during December (Figure 6d) all zones differed from each other. The first axis of April LDA explained (72.1%) of the total variance, and the second axis explained (20.26%) of the variance. Zone A is characterised by a high concentration of DO, and high turbidity. Zone B has the highest concentration of PO4-P, TDS. Zone C is characterized by a high concentration of TDS, and zone D has a high concentration of NO2-N.

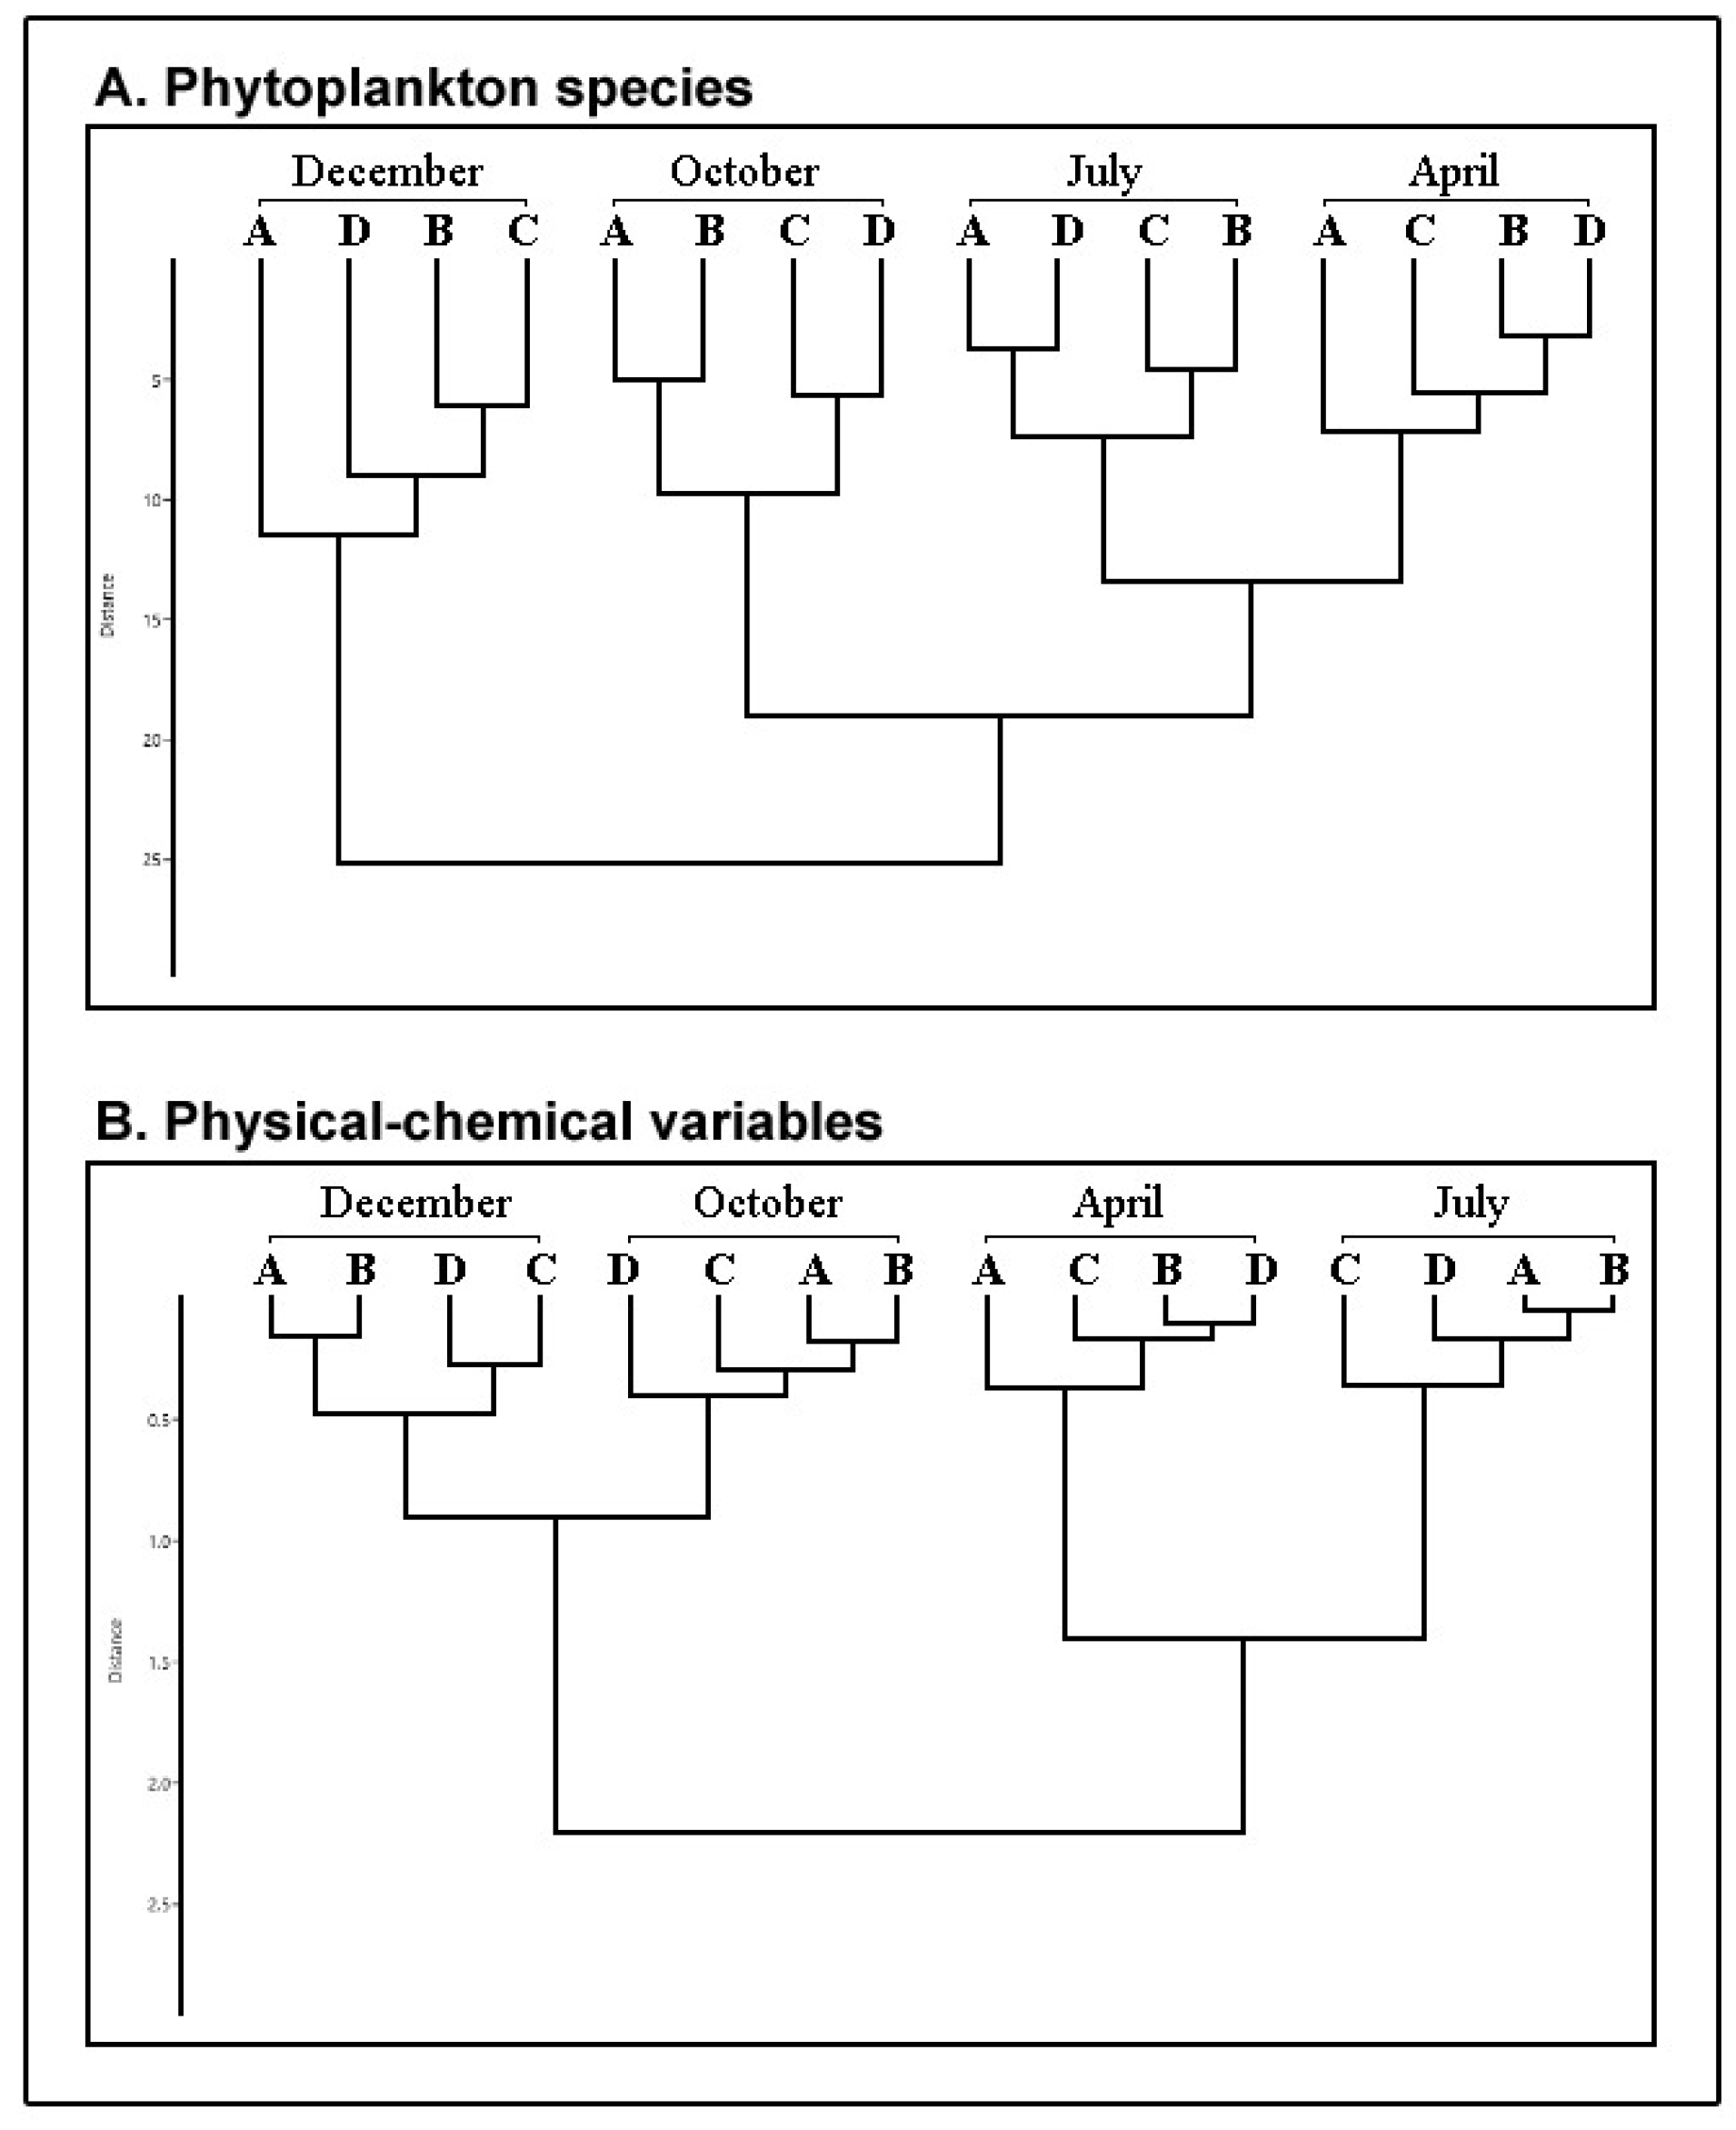
3.4. Hiararchical Cluster Analysis

Both the physical-chemical variables and algal plankton exhibited clear seasonal patterns (Figure 7A,B). For the algal plankton surveys, April and July were grouped together, while October and December were distinct from each other and from the April and July group (Figure 7A). An overview of the study areas within each period revealed: (i) in April, study areas B and D formed one group, while A and C were separate from each other and from the group created by B and D; (ii) in July, two groups were formed, with study areas A and D in one group and study areas B and C in the other; (iii) in October, two groups were also formed, with study areas A and B in one group and study areas C and D in the other; and (iv) in December, study areas B and C formed one group, while A and D were separate from each other and from the group created by B and D. This paragraph describes the grouping of study areas based on their physical-chemical variables and algal plankton data. The results show that the seasons (April and July as one group, and October and December as another group) had a marked separation for both variables. In April, study areas B and D formed one group while A and C were separate. In July, study areas A and D formed one group while B and C formed another. In October, study areas A and B formed one group while C and D were separate, with study area C more similar to the group created by A and B. In December, two groups were formed, one consisting of study areas A and B, and the other consisting of study areas C and D. These findings suggest that there are distinct differences in physical-chemical variables and the algal plankton community in the Tigris River near Mosul during different seasons and in different study areas.

4. Discussion

Urbanization can result in changes in the community structure of living organisms in various running and standing water bodies [36,37]. Different pollution sources including point and non-point sources such as agriculture and wastewater resulting from domestic uses could significantly affect the water′s environmental conditions by introducing a load of nutrients and pollutants into the water [38,39]. Phytoplankton is an important component of river ecosystems and is easily affected by environmental alterations [40]. Because phytoplankton are sensitive to long-term changes in ecosystems, such as those caused by climate change and the way land is used, they are often used as bioindicators [41,42]. Former studies concluded that it is essential to study seasonal variations of nutrients—whether the P or N forms are related to climatic conditions and river flow—for their effect on the phytoplankton abundance and composition [43,44,45,46,47].
According to the CCA graph and based on the phytoplankton community and environmental variables (Figure 4), we observed an overlap in the autumn and winter sampling periods which indicates a relative similarity according to the water quality. There was no overlapping between the summer and spring suggesting strong differences between these sampling periods. However, during spring, the weather was characterized by rains and a relatively low water temperature of 15.6 °C which was reflected in the phytoplankton community, recording the second-highest peak of phytoplankton abundance within the study period (Figure 3B). Microalgae may be better adapted to low temperatures than to higher temperatures [48,49]. Our results indicated the lowest phytoplankton abundance in summer while the maximum was in autumn. The low-flow and high-water temperature (29 °C) contributed to the decline in the phytoplankton abundance and was associated with a very low amount of dissolved oxygen (>2 mg/L) in all sampling points in July. One of the main factors leading to the degradation of DO and resulting in hypoxia are the plant nutrients and organic loadings from different sources. These loadings can adversely affect the aquatic life system due to consuming a massive amount of dissolved oxygen [50,51,52,53]. Although, Chlorophyll-a concentration was at the minimum during July. Populations of phytoplankton are a significant component of the DO budget in rivers and are essential for maintaining DO levels [54]. In autumn, the temperature of water decreased to 17 °C with low water discharge which provides an appropriate condition for increasing the phytoplankton abundance to the maximum. This was consistent with the observation of Al-Shahri [55] as the phytoplankton species were at their maximum abundance during the spring and autumn seasons. The rains started appearing during the winter season, which caused the drop in the water temperature (11 °C), which has an obvious effect on the river water quality due to the nutrient wash off from agricultural areas.
There is a direct relationship between the land use surrounding freshwater ecosystems and the quality of the water in such systems. Several studies have shown that there is a strong connection between water quality and land use [56,57,58]. During our study the LDA (Figure 5 and Figure 6) and the hierarchical cluster analysis (Figure 7) showed completely identical clustering for both physical-chemical variables and algae for all seasons. The agricultural area has a significant effect on the water quality in zone A during all seasons. This impact was distinctly visible in the LDA graph of physical-chemical variables (Figure 6) and the LDA of phytoplankton taxa (Figure 5) and cluster analysis (Figure 7A,B) by demonstrating a significant separation of the agricultural area from other zones in zone A along the Tigris River inside the city of Mosul. During spring, the sampling period is characterized by a high concentration of orthophosphate, nitrate, and CODsMn in Zone A. The water discharge rate was high in spring having a direct effect on the nutrient loads from the agricultural areas upstream. One of the most important indicators of nutrient loading is the discharge rate [59,60]. Diffuse sources of nutrients that originated from runoff of surrounding agricultural areas and discharge rates can affect water quality in urban streams [61,62]. The high concentration of CODsMn in the agriculture area could also be related to the organic content which may result from the detritus of phytoplankton and the release of dissolved organic matter from phytoplankton [63]. Typically, concentrations of various forms of nitrogen and orthophosphate ions were high in agricultural zones throughout the year (zone A and B). Orthophosphate can be used quickly in the area where autotrophic organisms are living, so its concentration can change quickly, but according to the minimum principle of Liebig, it can be the essential factor for eutrophication [64,65]. The highest concentration of orthophosphate and various forms of nitrogen in the agriculture area indicates the use of fertilizers along the area in which the river is crossing before reaching zone A.
The most characteristic species for the agriculture area were Oscillatoria sp., Cryptomonas ovata, and Cymbella parva (Figure 5). Our finding was consistent with many researchers who stated that the species of Oscillatoria sp. very often appears in water that is used for irrigation purposes for agricultural areas [66,67,68,69]. The genus Oscillatoria is typical at a low discharge rate [70]. Substantial cyanobacteria-related water quality issues may arise in surface water bodies [71,72]. There is conflicting evidence on whether cyanobacteria can out-compete other phytoplankton taxa in turbid systems [73,74]; some research suggests they can [75,76], while other research suggests their numbers decline in the presence of large concentrations of non-algal turbidity [73,77]. In our study, Oscillatoria sp. species were shown to have a negative relationship with total dissolved solids TSS (r = -0.73, p-value ≤0.05), turbidity (r = -0.62, p-value ≤ 0.05), and total dissolved solids TDS (r = -0.65, p-value ≤0.05) in July.
The second characteristic species in the agriculture area at zone A was C. ovata which appeared during winter. Cryptomonas favors growing in a nutrient-rich environment. The higher concentration of NH4-N and NO3-N might promote Cryptomonas growth [78,79]. Another characteristic taxon of this zone is the genus C. parva, which was identified during spring in the agricultural area. The species of C. parva. was identified in rivers that cross through agricultural areas [79,80].
In zone B, land use is characterized mainly by agriculture and forestry. Zone B had a higher concentration of CODsMn and PO4-P in winter, which could be washed off by rains from the agricultural areas [81]. In the rest of the year, the different forms of nitrogen are very typical in this area. Oscillatoria sp. Was a common taxon in zone B during summer. This may be connected to the availability of nutrients in this zone, which may derive from zone A. The appropriate temperature during summer also played an important role in increasing the number of Oscillatoria sp. In this zone. Another characteristic species in zone B was Fragilaria sp. (Figure 5). It is the well-known taxa considered, Fragilaria tenera. Characterized as an indicator of high-nutrient water bodies [82].
The urban area Impacted the water quality in zone C of the Tigris River inside the city, thus it varied greatly in other zones. Urbanization has the potential to produce significant hydrological alterations, which in turn affect the structure and function of aquatic communities [83]. It is also possible that increasing human activity along rivers would alter the nutrient types, proportions, and physical-chemical factors, which will have a negative impact on water quality [84]. This was obvious in the LDA graph of physical-chemical variables (Figure 6), the LDA of phytoplankton taxa (Figure 5), and hierarchical cluster analysis (Figure 7). Degraded water quality is more strongly associated with urban areas at small scales than at large scales [85,86].
Our research showed that Oscillatoria sp. was least common in zone C of the urban environment, perhaps as a direct effect of pollution discharge in that region. Previous studies have stated that toxic effect such as releasing pharmaceutical products, endocrine-disrupting chemicals, and disinfectants could have a negative effect on phytoplankton growth by affecting physiological and biochemical processes by inhibiting the enzymatic system [87,88,89]. Other studies suggested that submerged vegetations can effectively remove and absorb phosphorus and nitrogen in the water and inhibit the phytoplankton growth through the allelochemicals release [90,91]. The most characteristic species in the urban area were Euglenaformis proxima, Fragilaria tenera, Navicula sp., Cryptomonas ovata (Figure 5). The species of Euglena sp. have a higher abundance in spring in zone C. High abundance of Euglena sp. could be due to the rainfall, increasing nutrient loading and organic matter content [92]. Several studies have reported that Euglenophyceae species have significant importance due to their indicating organic pollution in water bodies [93,94]. F. tenera and Navicula sp. were characteristic species in the urban area in summer. F. tenera is a common species in urban areas and in a nutrient-rich environment [95,96]. Cyclotella sp. was another diatom species that was characteristic in the urban area. Cyclotella sp. is a typical species of urban zones [97], which was found in the urban area at zone C during winter. Furthermore, Scenedesmus economic also appeared within the urban area during winter. The species of Scenedesmus sp. have been reported in urban rivers that are polluted with raw sewage [98,99].
Zone D is located downstream of the Tigris River, and the land use is characterized by agricultural activities, as well as animal feces from animal husbandry. Area D during April has a high concentration of ammonium. A high concentration of ammonium in the surface water is commonly attributed to anthropogenic sources such as raw sewage and fertilizer from agricultural activities [48]. Zone D is characterized by a maximum concentration of NO2-N during autumn, which could be the result of agricultural activities from the right bank of the river and animal feces. Moreover, a high concentration of nitrite in zone D indicated the presence of anaerobic bacteria, which promoted the formation of nitrite through the denitrification process [49]. The most characteristic species in zone D were E. proxima, Oscillatoria sp., and Cryptomonas ovata. According to LDA in spring and summer (Figure 5), Euglenaformis proxima dominated in zone D, which could result mainly from agriculture areas and nutrients that reached zone C. Increasing a load of nutrients and organic matter could provide appropriate environmental conditions for Euglenophyceae, where their structure depends on a variety of abiotic and biotic environmental factors [92,100].

5. Conclusions

Running water types and their catchments together comprise functional ecosystems. Studies that relate land use and rivers have generally focused on a single geographical or ecological region and mainly investigated the relationships between catchment land use and water chemistry, although primary producer microorganisms such as algae have not been addressed on this scale. Our research revealed the existence of substantial spatial variance in water quality and phytoplankton and their connection to the land use throughout the studied area of the Tigris River inside Mosul. Our results indicated a great separation between the four investigated zones (A, B, C, and D) based on changes in the phytoplankton communities and physical-chemical variables. These changes may be traced back to the different land uses: (i) released nutrients from the agricultural area into zone A; (ii) in addition to nutrients from agricultural areas, a high level of chemical oxygen demand and high suspended solids values were also typical in zone B; (iii) as well as the diffuse point pollution from urban areas, which caused a high level of CODsMn and high TDS in zone C; and (iv) the effect of the urban area also includes the presence of reduced forms of nitrogen (the high concentration of nitrate-nitrogen is particularly characteristic), as well as high values of TSS, TDS, and orthophosphate-phosphate in zone D.
Based on our investigation, in the part of the Tigris River connected to Mosul, we found a clear connection between the pollution caused and the effects of different land uses through the examination of the algal community and physical-chemical variables in different periods of the year. Our study indicates that land use types can have a significant impact on the phytoplankton composition of large rivers, such as the Tigris. As such, it is important to consider phytoplankton composition in the development of river management plans.

Supplementary Materials

The following supporting information can be downloaded at: https://www.mdpi.com/article/10.3390/w15061062/s1, Table S1. Abundance of phytoplankton species at the different seasons. (a) April; (b) july; (c) October; (d) December.

Author Contributions

Conceptualization, M.M.Y. and I.S.; methodology, I.G.; software, M.M.Y. and I.S.; validation, R.H.M., O.A., and I.B.; formal analysis, C.B.; investigation, M.M.Y., A.N.A.-T., and K.K.A.-A.; resources, I.G.; data curation, M.M.Y.; writing—original draft preparation, M.M.Y.; writing—review and editing, M.M.Y., I.S.; visualization, M.M.Y. and I.S.; supervision, I.G.; project administration, M.M.Y.; funding acquisition, I.G. All authors have read and agreed to the published version of the manuscript.

Funding

Project no. TKP2021-NKTA-32 has been implemented with the support provided by the Ministry of Innovation and Technology of Hungary from the National Research, Development and Innovation Fund, financed under the TKP2021-NKTA funding scheme. The research presented in the article was carried out within the framework of the Széchenyi Plan Plus program with the support of the RRF 2.3.1 21 2022 00008 project.

Data Availability Statement

Not applicable.

Acknowledgments

We can thank the University of Mosul in Iraq and green water solution GWS because they helped us by providing some equipment and official approval papers for collecting the samples.

Conflicts of Interest

The authors declare no conflict of interest. The funders had no role in the design of the study; in the collection, analyses, or interpretation of data; in the writing of the manuscript; or in the decision to publish the results.

References

  1. Aufdenkampe, A.K.; Mayorga, E.; Raymond, P.A.; Melack, J.M.; Doney, S.C.; Alin, S.R.; Aalto, R.E.; Yoo, K. Riverine coupling of biogeochemical cycles between land, oceans, and atmosphere. Front. Ecol. Environ. 2011, 9, 53–60. [Google Scholar] [CrossRef] [PubMed] [Green Version]
  2. Abonyi, A.; Leitão, M.; Lançon, A.M.; Padisák, J. Phytoplankton functional groups as indicators of human impacts along the River Loire (France). Hydrobiologia 2012, 698, 233–249. [Google Scholar] [CrossRef]
  3. Wen, Y.; Schoups, G.; van de Giesen, N. Organic pollution of rivers: Combined threats of urbanization, livestock farming and global climate change. Sci. Rep. 2017, 7, 43289. [Google Scholar] [CrossRef] [PubMed] [Green Version]
  4. Shehab, Z.N.; Jamil, N.R.; Aris, A.Z.; Shafie, N.S. Spatial variation impact of landscape patterns and land use on water quality across an urbanized watershed in Bentong, Malaysia. Ecol. Indic. 2021, 122, 107254. [Google Scholar] [CrossRef]
  5. Fan, X.; Zhang, L.; Yuan, L.; Guo, B.; Zhang, Q.; Huang, H. Urbanization and water quality dynamics and their spatial correlation in coastal margins of mainland China. Ecol. Indic. 2022, 138, 108812. [Google Scholar] [CrossRef]
  6. Hajong, P.; Ramanujam, P. Effect of anthropogenic activities on algal community in Ganol River, West Garo Hills, Meghalaya. Bull. Environ. Pharmacol. Life Sci. 2017, 6, 109–120. [Google Scholar]
  7. Kilic, E.; Yucel, N. Determination of Spatial and Temporal Changes in Water Quality at Asi River Using Multivariate Statistical Techniques. Turk. J. Fish. Aquat. Sci. 2019, 19, 727–737. [Google Scholar] [CrossRef]
  8. Lehner, B.; Liermann, C.R.; Revenga, C.; Vörösmarty, C.; Fekete, B.; Crouzet, P.; Döll, P.; Endejan, M.; Frenken, K.; Magome, J.; et al. High-resolution mapping of the world’s reservoirs and dams for sustainable river-flow management. Front. Ecol. Environ. 2011, 9, 494–502. [Google Scholar] [CrossRef] [Green Version]
  9. Phungela, T.T.; Maphanga, T.; Chidi, B.S.; Madonsela, B.S.; Shale, K. The impact of wastewater treatment effluent on Crocodile River quality in Ehlanzeni District, Mpumalanga Province, South Africa. S. Afr. J. Sci. 2022, 118. [Google Scholar] [CrossRef]
  10. Cheng, C.; Zhang, F.; Shi, J.; Kung, H.-T. What is the relationship between land use and surface water quality? A review and prospects from remote sensing perspective. Environ. Sci. Pollut. Res. 2022, 29, 56887–56907. [Google Scholar] [CrossRef]
  11. Poff, N.L.; Bledsoe, B.P.; Cuhaciyan, C.O. Hydrologic variation with land use across the contiguous United States: Geomorphic and ecological consequences for stream ecosystems. Geomorphology 2006, 79, 264–285. [Google Scholar] [CrossRef]
  12. Rodrigues, V.; Estrany, J.; Ranzini, M.; de Cicco, V.; Martín-Benito, J.M.T.; Hedo, J.; Lucas-Borja, M.E. Effects of land use and seasonality on stream water quality in a small tropical catchment: The headwater of Córrego Água Limpa, São Paulo (Brazil). Sci. Total Environ. 2018, 622–623, 1553–1561. [Google Scholar] [CrossRef] [Green Version]
  13. Williams, M.R.; King, K.W.; Macrae, M.L.; Ford, W.; Van Esbroeck, C.; Brunke, R.I.; English, M.C.; Schiff, S.L. Uncertainty in nutrient loads from tile-drained landscapes: Effect of sampling frequency, calculation algorithm, and compositing strategy. J. Hydrol. 2015, 530, 306–316. [Google Scholar] [CrossRef]
  14. Zieliński, M.; Dopieralska, J.; Belka, Z.; Walczak, A.; Siepak, M.; Jakubowicz, M. Sr isotope tracing of multiple water sources in a complex river system, Noteć River, central Poland. Sci. Total Environ. 2016, 548–549, 307–316. [Google Scholar] [CrossRef] [PubMed]
  15. Vrebos, D.; Beauchard, O.; Meire, P. The impact of land use and spatial mediated processes on the water quality in a river system. Sci. Total Environ. 2017, 601–602, 365–373. [Google Scholar] [CrossRef] [PubMed]
  16. Giri, S.; Qiu, Z. Understanding the relationship of land uses and water quality in Twenty First Century: A review. J. Environ. Manag. 2016, 173, 41–48. [Google Scholar] [CrossRef] [PubMed] [Green Version]
  17. Yadav, S.; Babel, M.S.; Shrestha, S.; Deb, P. Land use impact on the water quality of large tropical river: Mun River Basin, Thailand. Environ. Monit. Assess. 2019, 191, 614. [Google Scholar] [CrossRef]
  18. Xu, Z.; Xu, J.; Yin, H.; Jin, W.; Li, H.; He, Z. Urban river pollution control in developing countries. Nat. Sustain. 2019, 2, 158–160. [Google Scholar] [CrossRef]
  19. Yang, Y.; Chen, H.; Al, M.A.; Ndayishimiye, J.C.; Yang, J.R.; Isabwe, A.; Luo, A.; Yang, J. Urbanization reduces resource use efficiency of phytoplankton community by altering the environment and decreasing biodiversity. J. Environ. Sci. 2022, 112, 140–151. [Google Scholar] [CrossRef]
  20. Hanashiro, F.T.T.; Mukherjee, S.; Souffreau, C.; Engelen, J.; Brans, K.I.; Busschaert, P.; De Meester, L. Freshwater Bacterioplankton Metacommunity Structure Along Urbanization Gradients in Belgium. Front. Microbiol. 2019, 10, 743. [Google Scholar] [CrossRef] [Green Version]
  21. Tran, T.H.Y.; Tran, T.T.; Nguyen, T.M.Y.; Ngo, X.Q.; Nguyen, X.D.; Pham, T.L. Seasonal changes in phytoplankton assemblages and environmental variables in highly turbid tropical estuaries of the Mekong River, Vietnam. Environ. Monit. Assess. 2022, 194, 776. [Google Scholar] [CrossRef] [PubMed]
  22. Reid, W.V.; Mooney, H.A.; Cropper, A.; Capistrano, D.; Carpenter, S.R.; Chopra, K.; Dasgupta, P.; Dietz, T.; Duraiappah, A.K.; Hassan, R.; et al. Ecosystems and Human Well-Being-Synthesis: A Report of the Millennium Ecosystem Assessment; Island Press: Washington, DC, USA, 2005. [Google Scholar]
  23. Katsiapi, M.; Mazaris, A.D.; Charalampous, E.; Moustaka-Gouni, M. Watershed land use types as drivers of freshwater phytoplankton structure. In Phytoplankton Responses to Human Impacts at Different Scales; Springer: Dordrecht, The Netherlands, 2012; pp. 121–131. [Google Scholar] [CrossRef]
  24. Russo, D.A.; Couto, N.; Beckerman, A.P.; Pandhal, J. A Metaproteomic Analysis of the Response of a Freshwater Microbial Community under Nutrient Enrichment. Front. Microbiol. 2016, 7, 1172. [Google Scholar] [CrossRef] [Green Version]
  25. Camara, M.; Jamil, N.R.; Abdullah, A.F.b. Impact of land uses on water quality in Malaysia: A review. Ecol. Process. 2019, 8, 10. [Google Scholar] [CrossRef]
  26. Luo, X.; Pan, K.; Wang, L.; Li, M.; Li, T.; Pang, B.; Kang, J.; Fu, J.; Lan, W. Anthropogenic Inputs Affect Phytoplankton Communities in a Subtropical Estuary. Water 2022, 14, 636. [Google Scholar] [CrossRef]
  27. Issa, I.; Al-Ansari, N.; Sherwani, G.; Knutsson, S. Trends and future challenges of water resources in the Tigris-Euphrates Rivers basin in Iraq. Hydrol. Earth Syst. Sci. Discuss. 2013, 10, 14617–14644. [Google Scholar] [CrossRef] [Green Version]
  28. Chabuk, A.; Al-Madhlom, Q.; Al-Maliki, A.; Al-Ansari, N.; Hussain, H.M.; Laue, J. Water quality assessment along Tigris River (Iraq) using water quality index (WQI) and GIS software. Arab. J. Geosci. 2020, 13, 654. [Google Scholar] [CrossRef]
  29. Farhan, A.F.; Al-Ahmady, K.K.; Al-Masry, N.A.-A. Assessment of Tigris River Water Quality in Mosul for Drinking and Domestic Use by Applying CCME Water Quality Index. IOP Conf. Ser. Mater. Sci. Eng. 2020, 737, 012204. [Google Scholar] [CrossRef]
  30. al Obaidy, A.H.; Al-Khateeb, M. The Challenges of Water Sustainability in Iraq. Eng. Tech. J. 2013, 31, 828–840. [Google Scholar]
  31. Utermöhl, H. Neue Wege in der quantitativen Erfassung des Planktons (mit besonderer Berucksichtigung des Ultraplanktons). Verh. Int. Ver. Theor. Angew. Limnol. 1931, 5, 567–596. [Google Scholar] [CrossRef]
  32. Hu, Y.H. (Ed.) Neural Networks for Signal Processing IX: Proceedings of the 1999 IEEE Signal Processing Society Workshop (Cat. No.98TH8468); IEEE: Piscataway, NJ, USA, 1999; p. 0_1. [Google Scholar] [CrossRef]
  33. Tharwat, A.; Gaber, T.; Ibrahim, A.; Hassanien, A.E. Linear discriminant analysis: A detailed tutorial. AI Commun. 2017, 30, 169–190. [Google Scholar] [CrossRef] [Green Version]
  34. Hammer, Ø.; Harper, D.A.T.; Ryan, P.D. PAST: Paleontological statistics software package for education and data analysis. Palaeontol. Electron. 2001, 4, 1–9. [Google Scholar]
  35. IBM Corp. IBM SPSS Statistics for Windows, Version 28.0; IBM Corp: Armonk, NY, USA, 2021. [Google Scholar]
  36. Paul, M.J.; Meyer, J.L. Streams in the Urban Landscape. Annu. Rev. Ecol. Syst. 2001, 32, 333–365. [Google Scholar] [CrossRef]
  37. Grimm, N.B.; Faeth, S.H.; Golubiewski, N.E.; Redman, C.L.; Wu, J.; Bai, X.; Briggs, J.M. Global Change and the Ecology of Cities. Science 2008, 319, 756–760. [Google Scholar] [CrossRef] [Green Version]
  38. Kaye, J.; Groffman, P.; Rimm, N.; Baker, L.; Pouyat, R. A distinct urban biogeochemistry? Trends Ecol. Evol. 2006, 21, 192–199. [Google Scholar] [CrossRef]
  39. Peng, F.; Guo, Y.; Isabwe, A.; Chen, H.; Wang, Y.; Zhang, Y.; Zhu, Z.; Yang, J. Urbanization drives riverine bacterial antibiotic resistome more than taxonomic community at watershed scale. Environ. Int. 2020, 137, 105524. [Google Scholar] [CrossRef] [PubMed]
  40. Yang, J.R.; Yu, X.; Chen, H.; Kuo, Y.-M.; Yang, J. Structural and functional variations of phytoplankton communities in the face of multiple disturbances. J. Environ. Sci. 2021, 100, 287–297. [Google Scholar] [CrossRef]
  41. Gökçe, D. Algae as an Indicator of Water Quality; IntechOpen: London, UK, 2016. [Google Scholar] [CrossRef] [Green Version]
  42. Khalil, S.; Mahnashi, M.H.; Hussain, M.; Zafar, N.; Khan, F.S.; Afzal, U.; Shah, G.M.; Niazi, U.M.; Awais, M.; Irfan, M. Exploration and determination of algal role as Bioindicator to evaluate water quality—Probing fresh water algae. Saudi J. Biol. Sci. 2021, 28, 5728–5737. [Google Scholar] [CrossRef]
  43. Casartelli, M.R.; Ferragut, C. Influence of seasonality and rooted aquatic macrophyte on periphytic algal community on artificial substratum in a shallow tropical reservoir. Int. Rev. Hydrobiol. 2015, 100, 158–168. [Google Scholar] [CrossRef]
  44. Stevenson, R.J.; Bennett, B.J.; Jordan, D.N.; French, R.D. Phosphorus regulates stream injury by filamentous green algae, DO, and pH with thresholds in responses. Hydrobiologia 2012, 695, 25–42. [Google Scholar] [CrossRef]
  45. Yadav, A.; Kumar, D.; Singh, R.S.; Pandey, L.K.; Rai, J. Seasonal variations in response of periphytic algal community to nutrient enrichment in the river Ganga (Varanasi, India). Ann. De Limnol.—Int. J. Limnol. 2018, 54, 32. [Google Scholar] [CrossRef] [Green Version]
  46. Seguro, I.; García, C.M.; Papaspyrou, S.; Gálvez, J.A.; García-Robledo, E.; Navarro, G.; Soria-Píriz, S.; Aguilar, V.; Lizano, O.G.; Morales-Ramírez, A.; et al. Seasonal changes of the microplankton community along a tropical estuary. Reg. Stud. Mar. Sci. 2015, 2, 189–202. [Google Scholar] [CrossRef]
  47. Cózar, A.; Echevarría, F. Size structure of the planktonic community in microcosms with different levels of turbulence. Sci. Mar. 2005, 69, 187–197. [Google Scholar] [CrossRef]
  48. Du, Y.; Ma, T.; Deng, Y.; Shen, S.; Lu, Z. Sources and fate of high levels of ammonium in surface water and shallow groundwater of the Jianghan Plain, Central China. Env. Sci. Process. Impacts 2017, 19, 161–172. [Google Scholar] [CrossRef]
  49. Ruiz, G.; Jeison, D.; Rubilar, O.; Ciudad, G.; Chamy, R. Nitrification–denitrification via nitrite accumulation for nitrogen removal from wastewaters. Bioresour. Technol. 2006, 97, 330–335. [Google Scholar] [CrossRef] [PubMed]
  50. Basant, N.; Gupta, S.; Malik, A.; Singh, K.P. Linear and nonlinear modeling for simultaneous prediction of dissolved oxygen and biochemical oxygen demand of the surface water—A case study. Chemom. Intell. Lab. Syst. 2010, 104, 172–180. [Google Scholar] [CrossRef]
  51. Xu, Z.; Xu, Y.J. Rapid field estimation of biochemical oxygen demand in a subtropical eutrophic urban lake with chlorophyll a fluorescence. Environ. Monit. Assess. 2015, 187, 4171. [Google Scholar] [CrossRef]
  52. Mallin, M.A.; Johnson, V.L.; Ensign, S.H.; MacPherson, T.A. Factors contributing to hypoxia in rivers, lakes, and streams. Limnol. Oceanogr. 2006, 51, 690–701. [Google Scholar] [CrossRef] [Green Version]
  53. Whitehead, P.G.; Wilby, R.L.; Battarbee, R.W.; Kernan, M.; Wade, A.J. A review of the potential impacts of climate change on surface water quality. Hydrol. Sci. J. 2009, 54, 101–123. [Google Scholar] [CrossRef] [Green Version]
  54. Carpenter, K.D.; Rounds, S.A.; Survey, U.S.G. Plankton Communities and Summertime Declines in Algal Abundance Associated with Low Dissolved Oxygen in the Tualatin River, Oregon; US Department of the Interior; US Geological Survey: Reston, VA, USA, 2013. [CrossRef]
  55. Al-Shahri, Y.; Maulood, B.; Toma, J. A study on a sulfur spring (Ain Al Kibrit) ecosystem along Tigris River Mosul, Iraq. J. Adv. Lab. Res. Biol. 2016, 7, 6. [Google Scholar]
  56. Dzinomwa, T.; Ndagurwa, H. Effect of land use on water quality and phytoplankton community in the tropical Khami River in semi-arid southwest Zimbabwe. Afr. J. Aquat. Sci. 2017, 42, 83–89. [Google Scholar] [CrossRef]
  57. Marmen, S.; Blank, L.; Al-Ashhab, A.; Malik, A.; Ganzert, L.; Lalzar, M.; Grossart, H.P.; Sher, D. The Role of Land Use Types and Water Chemical Properties in Structuring the Microbiomes of a Connected Lake System. Front. Microbiol. 2020, 11, 89. [Google Scholar] [CrossRef] [PubMed] [Green Version]
  58. Jordan, T.E.; Weller, D.E.; Pelc, C.E. Effects of Local Watershed Land Use on Water Quality in Mid-Atlantic Coastal Bays and Subestuaries of the Chesapeake Bay. Estuaries Coasts 2018, 41, 38–53. [Google Scholar] [CrossRef] [Green Version]
  59. le Tien, H.; Okubo, K.; Ho Thi, P.; Saito, M. Estimation of long-term external nutrient loading from watersheds to Lake Biwa by a combined rainfall-runoff model and loading-discharge curve approach. Hydrol. Res. Lett. 2020, 14, 143–149. [Google Scholar] [CrossRef]
  60. Amano, A.; Kazama, S. Relationship between Discharge and Nutrient Concentration in Inundation Areas in Cambodia. J. Water Environ. Technol. 2012, 10, 165–175. [Google Scholar] [CrossRef] [Green Version]
  61. Karlsen, C.S.; Flindt, M.R.; Sønderup, M.J.; Madsen, M.H.; Egemose, S. Impact of Land Use and Runoff on Stream Quality. Sustainability 2019, 11, 5479. [Google Scholar] [CrossRef] [Green Version]
  62. Arreghini, S. Influence of rainfall on the discharge, nutrient concentrations and loads of a stream of the “Pampa Ondulada” (Buenos Aires, Argentina). Limnetica 2005, 24, 225–236. [Google Scholar] [CrossRef]
  63. Zhang, Y.L.; Yang, L.Y.; Qin, B.Q.; Gao, G.; Luo, L.C.; Zhu, G.W.; Liu, M.L. Spatial distribution of COD and the correlations with other parameters in the northern region of Lake Taihu. Huan Jing Ke Xue Huanjing Kexue 2008, 29, 1457–1462. [Google Scholar]
  64. Smith, V.H. Eutrophication. In Encyclopedia of Inland Waters; Elsevier: Amsterdam, The Netherlands, 2009; pp. 61–73. [Google Scholar] [CrossRef]
  65. Somlyai, I.; Berta, C.; Nagy, S.A.; Dévai, G.; Ács, É.; Szabó, L.J.; Nagy, J.; Grigorszky, I. Heterogeneity and Anthropogenic Impacts on a Small Lowland Stream. Water 2019, 11, 2002. [Google Scholar] [CrossRef] [Green Version]
  66. Ren, X.; Sun, J.; Zhang, Q.; Zuo, Y.; Liu, J.; Liu, J.; Li, L.; Song, L. The Emergent Integrated Constructed Wetland-Reservoir (CW-R) Is Being Challenged by 2-Methylisoborneol Episode—ACase Study in Yanlonghu, C.W.-R. Water 2022, 14, 2670. [Google Scholar] [CrossRef]
  67. Mohamed, Z.A. Allelopathic activity of Spirogyra sp.: Stimulating bloom formation and toxin production by Oscillatoria agardhii in some irrigation canals, Egypt. J. Plankton. Res. 2002, 24, 137–141. [Google Scholar] [CrossRef] [Green Version]
  68. Yaqoob, M.M.; Berta, C.; Szabó, L.J.; Dévai, G.; Szabó, S.; Nagy, S.A.; Bácsi, I.; Simon, A.; Nagy, J.; Somlyai, I.; et al. Changes in Algal Plankton Composition and Physico-Chemical Variables in a Shallow Oxbow Lake. Water 2021, 13, 2339. [Google Scholar] [CrossRef]
  69. Fatima, A.; Abbas, G.; Kasprzak, R. Assessment of Hydrobiological and Soil Characteristics of Non-Fertilized, Earthen Fish Ponds in Sindh (Pakistan), Supplied with Seawater from Tidal Creeks. Water 2022, 14, 2115. [Google Scholar] [CrossRef]
  70. Espinosa, C.; Abril, M.; Guasch, H.; Pou, N.; Proia, L.; Ricart, M.; Ordeix, M.; Llenas, L. Water Flow and Light Availability Influence on Intracellular Geosmin Production in River Biofilms. Front. Microbiol. 2020, 10, 3002. [Google Scholar] [CrossRef] [Green Version]
  71. Wang, S.H.; Dzialowski, A.R.; Meyer, J.O.; Denoyelles, F.; Lim, N.C.; Spotts, W.W.; Huggins, D.G. Relationships between cyanobacterial production the physical chemical properties of a Midwestern Reservoir, U.S.A. Hydrobiologia 2005, 541, 29–43. [Google Scholar] [CrossRef]
  72. Smith, V.H.; Sieber-Denlinger, J.; deNoyelles Jr, F.; Campbell, S.; Pan, S.; Randtke, S.J.; Blain, G.T.; Strasser, V.A. Managing Taste and Odor Problems in a Eutrophic Drinking Water Reservoir. Lake Reserv. Manag. 2002, 18, 319–323. [Google Scholar] [CrossRef] [Green Version]
  73. Smith, V.H. Effects of Nutrients and Non-algal Turbidity on Blue-green Algal Biomass in Four North Carolina Reservoirs. Lake Reserv. Manag. 1990, 6, 125–131. [Google Scholar] [CrossRef]
  74. Dzialowski, A.R.; Smith, V.H.; Wang, S.-H.; Martin, M.C.; deNoyelles, F., Jr. Effects of non-algal turbidity on cyanobacterial biomass in seven turbid Kansas reservoirs. Lake Reserv. Manag. 2011, 27, 6–14. [Google Scholar] [CrossRef] [Green Version]
  75. Burkholder, J.M.; Larsen, L.M.; Glasgow, H.B.; Mason, K.M.; Gama, P.; Parsons, J.E. Influence of Sediment and Phosphorus Loading on Phytoplankton Communities in an Urban Piedmont Reservoir. Lake Reserv. Manag. 1998, 14, 110–121. [Google Scholar] [CrossRef]
  76. Scheffer, M.; Rinaldi, S.; Gragnani, A.; Mur, L.R.; van Nes, E.H. On the Dominance of Filamentous Cyanobacteria in Shallow, Turbid Lakes. Ecology 1997, 78, 272. [Google Scholar] [CrossRef]
  77. Cuker, B.E.; Gama, P.T.; Burkholder, J.M. Type of suspended clay influences lake productivity and phytoplankton community response to phosphorus loading. Limnol. Oceanogr. 1990, 35, 830–839. [Google Scholar] [CrossRef]
  78. Capo, E.; Debroas, D.; Arnaud, F.; Perga, M.-E.; Chardon, C.; Domaizon, I. Tracking a century of changes in microbial eukaryotic diversity in lakes driven by nutrient enrichment and climate warming. Environ. Microbiol. 2017, 19, 2873–2892. [Google Scholar] [CrossRef] [PubMed] [Green Version]
  79. Liu, Y.; Ren, Z.; Qu, X.; Zhang, M.; Yu, Y.; Peng, W. Seasonal Water Level Fluctuation and Concomitant Change of Nutrients Shift Microeukaryotic Communities in a Shallow Lake. Water 2020, 12, 2317. [Google Scholar] [CrossRef]
  80. Sinco, A.L.; Tampus, A.D. Diatoms in the rivers of Calamba Misamis Occidental, Philippines. IOP Conf. Ser. Earth Environ. Sci. 2020, 528, 012008. [Google Scholar] [CrossRef]
  81. Siksnane, I.; Lagzdins, A. Relationships between land use and nitrogen and phosphorus concentrations in Berze river basin. Eng. Rural. Development. Proc. Int. Sci. Conf. 2021. [Google Scholar] [CrossRef]
  82. Desianti, N.; Potapova, M.; Enache, M.; Belton, T.J.; Velinsky, D.J.; Thomas, R.; Mead, J. Sediment Diatoms as Environmental Indicators in New Jersey Coastal Lagoons. J. Coast. Res. 2017, 78, 127–140. [Google Scholar] [CrossRef]
  83. Isabwe, A.; Yang, J.R.; Wang, Y.; Liu, L.; Chen, H.; Yang, J. Community assembly processes underlying phytoplankton and bacterioplankton across a hydrologic change in a human-impacted river. Sci. Total Environ. 2018, 630, 658–667. [Google Scholar] [CrossRef]
  84. Yang, J.R.; Lv, H.; Isabwe, A.; Liu, L.; Yu, X.; Chen, H.; Yang, J. Disturbance-induced phytoplankton regime shifts and recovery of cyanobacteria dominance in two subtropical reservoirs. Water Res. 2017, 120, 52–63. [Google Scholar] [CrossRef]
  85. Shi, P.; Zhang, Y.; Li, Z.; Li, P.; Xu, G. Influence of land use and land cover patterns on seasonal water quality at multi-spatial scales. Catena 2017, 151, 182–190. [Google Scholar] [CrossRef]
  86. Mosa, O.; Al-Saffawi, A.; Sabry, M. Assessment of Surface Water Quality for Irrigation using WQI model; A Case Study of Khosar and Tigris Rivers. Int. J. Enhanc. Res. Sci. Technol. Eng. 2018, 7, 63–69. [Google Scholar]
  87. Liu, Y.; Ji, M.; Wang, R.; Zhai, H.; Yu, S.; Liu, B.; Zhao, Y. Spatial distribution and comprehensive evaluation of emerging organic pollutants in effluents from wastewater treatment plants in northern cities of China. Desalination Water Treat. 2019, 156, 20–31. [Google Scholar] [CrossRef] [Green Version]
  88. Zhang, Y.; Wang, B.; Cagnetta, G.; Duan, L.; Yang, J.; Deng, S.; Huang, J.; Wang, Y.; Yu, G. Typical pharmaceuticals in major WWTPs in Beijing, China: Occurrence, load pattern and calculation reliability. Water Res. 2018, 140, 291–300. [Google Scholar] [CrossRef]
  89. Wang, W.; Bai, J.; Xi, M.; Zhao, Q.; Zhang, G.; Wen, X.; Xiao, R. Occurrence, sources, and risk assessment of OCPs in surface sediments from urban, rural, and reclamation-affected rivers of the Pearl River Delta, China. Environ. Sci. Pollut. Res. 2017, 24, 2535–2548. [Google Scholar] [CrossRef] [PubMed]
  90. Mohamed, Z.A. Macrophytes-cyanobacteria allelopathic interactions and their implications for water resources management—A review. Limnologica 2017, 63, 122–132. [Google Scholar] [CrossRef]
  91. Sun, D.; Lin, X.; Lu, Z.; Huang, J.; Li, G.; Xu, J. Process evaluation of urban river replenished with reclaimed water from a wastewater treatment plant based on the risk of algal bloom and comprehensive acute toxicity. J. Water Reuse Desalination 2022, 12, 1–10. [Google Scholar] [CrossRef]
  92. Conceição, L.P.; de Jesus Affe, H.M.; da Silva, D.M.L.; de Castro Nunes, J.M. Spatio-temporal variation of the phytoplankton community in a tropical estuarine gradient, under the influence of river damming. Reg. Stud. Mar. Sci. 2021, 43, 101642. [Google Scholar] [CrossRef]
  93. Laskar, H.; Gupta, S. Phytoplankton diversity and dynamics of Chatla floodplain lake, Barak Valley, Assam, North East India—A seasonal study. J. Environ. Biol. 2009, 30, 1007–1012. [Google Scholar]
  94. Al-Thahaibawi, B.M.H.; Al-Mayaly, I.K.A.; Al-Hiyaly, S.A.K. Phytoplankton community within Al-Auda marsh in maysan province southern Iraq. IOP Conf. Ser. Earth Environ. Sci. 2021, 722, 012026. [Google Scholar] [CrossRef]
  95. Jüttner, I.; Chimonides, P.J.; Ormerod, S.J. Developing a diatom monitoring network in an urban river-basin: Initial assessment and site selection. Hydrobiologia 2012, 695, 137–151. [Google Scholar] [CrossRef]
  96. Klimaszyk, P.; Kuczyńska-Kippen, N.; Szeląg-Wasielewska, E.; Marszelewski, W.; Borowiak, D.; Niedzielski, P.; Nowiński, K.; Kurmanbayev, R.; Baikenzheyeva, A.; Rzymski, P. Spatial heterogeneity of chemistry of the Small Aral Sea and the Syr Darya River and its impact on plankton communities. Chemosphere 2022, 307, 135788. [Google Scholar] [CrossRef]
  97. Cira, E.K.; Paerl, H.W.; Wetz, M.S. Effects of Nitrogen Availability and Form on Phytoplankton Growth in a Eutrophied Estuary (Neuse River Estuary, NC, USA). PLoS ONE 2016, 11, e0160663. [Google Scholar] [CrossRef] [Green Version]
  98. Venkatesan, S.; Narayanan, M.; Prabakaran, M.; Anusha, P.; Srinivasan, R.; Kandasamy, S.; Natarajan, D.; Paulraj, B. In-Situ and Ex-Situ Phycoremediation Competence of Innate Scenedesmus Sp. On Polluted River Water. Res. Sq. 2020. [Google Scholar] [CrossRef]
  99. Xia, L.; Zhu, Y.; Zhao, Z. Understanding the Ecological Response of Planktic and Benthic Epipelic Algae to Environmental Factors in an Urban Rivers System. Water 2020, 12, 1311. [Google Scholar] [CrossRef]
  100. Haque, M.d.A.; Jewel, M.d.A.S.; Atique, U.; Paul, A.K.; Naher, N.; Iqbal, S. Seasonal and spatial variation of flagellate communities in a tropical river. Limnologica 2020, 85, 125824. [Google Scholar] [CrossRef]
Figure 1. Conceptual framework represents the expected relationship between variables and effects. Abbreviations: DO: Dissolved Oxygen; NO2-N: Nitrite; NO3-N: Nitrate; PO4-P: Orthophosphate; NH4-N: ammonium; TDS: Total dissolved solids; CODsMn: Chemical oxidation demand; TSS: Total suspended solids; Cl: Chloride; BOD5: Biological oxygen demand.
Water 15 01062 g001
Figure 2. (a) Map showing the study area in Iraq; (b) Map showing the sampling points in red dots. The red area is Zone A; green area is Zone B; blue area is Zone C, and purple area is Zone D. (c) Map showing the land use in the Tigris River in the city of Mosul.
Water 15 01062 g002
Figure 3. (A) Temperature, precipitation, and water discharge rate through the city of Mosul during 2021. The symbols “▲” designates the sampling dates; (B) total abundance of algal taxa in the sampling dates.
Water 15 01062 g003
Figure 4. Canonical correspondence analysis (CCA) graph showing the differences between the seasons. The April sampling period represented the spring season, July represented the summer season, October represented the autumn season, and December represented the winter season.
Water 15 01062 g004
Figure 5. Graphs representing linear discriminant analysis (LDA) based on the phytoplankton taxa. (a): April; Graphs (b): July; Graphs (c): October; Graphs (d): December. Whereas Coc: Cocconeis pediculus; Uln: Ulnaria ulna; Dia: Diatoma vulgaris.; Cry: Cryptomonas ovata; Osc: Oscilatoria sp.; Cym: Cymbla parva; Fra: Fragilaria tenera; Desmodesmus opoliensis; Cyc: Cyclotella sp.; S. eco: Scenedesmus ecornis, Spi: Spirogyra sp., Sur: Surirella tenera, and Eug: Euglenaformis proxima A zone: upstream river affected by agricultural activities, B zone: forest and agricultural area, C zone: urban area, D zone: downstream river affected by agricultural and livestock farming.
Water 15 01062 g005
Figure 6. Linear discriminant analysis (LDA) based on the physical-chemical variables during the investigated four seasons. Graph (a): April; Graph (b): July; Graph (c): October; Graph (d): December. Where Turb: Turbidity; DO: Dissolved Oxygen; Chl-a: Chlorophyll-a; NO2-N: Nitrite; NO3-N: Nitrate; PO4-P: Orthophosphate; NH4-N: ammonium; TDS: Total dissolved solids; CODsMn: Chemical oxidation demand; TSS: Total suspended solids; Cl: Chloride. A zone: upstream river affected by agricultural activities, B zone: forest and agricultural area, C zone: urban area, D zone: downstream river affected by agricultural and livestock farming.
Water 15 01062 g006
Figure 7. Hierarchical cluster analysis was performed on the algal composition (A) and physical-chemical variables (B) during the four investigated seasons. Zone A represents the upstream river area affected by agricultural activities, zone B represents the forest and agricultural area, zone C represents the urban area, and zone D represents the downstream river area affected by agricultural and livestock farming.
Water 15 01062 g007
Table 1. The maximum, minimum, and median values of the physical and chemical variables measured during the investigated periods.
VariablesSpringSummerAutumnWinter
Min-Max
Median
Min-Max
Median
Min-Max
Median
Min-Max
Median
BOD5 (mg L−1)0.06–1.85
0.3
0.7–2.2
1.6
0.5–2.5
1.9
1.5–2.7
2
Chlorophyll-a (mg L−1)0.21–0.65
0.4
0.1–0.5
0.1
0.5–1.5
0.8
0.2–0.8
0.4
Chloride (mg L−1)28–40
33
30.5–41.9
38
38.1–40
38
14.5–29.1
22
CODsMn (mg L−1)1.9–7.8
2.7
2.6–4.4
3.6 ± 0.4
2.4–6.1
3.1
2.8–4.7
3.5
DO (mg L−1)3.4–5.9
4.2
0–2
0.0
4.2–12
5.6
4.5–9.8
6.9
H-CO3- (mg L−1)172–246
222
170.8–195.2
171
195.2–244
220
110.9–244
155
NH4-N (mg L−1)0–0.056
0.009
0–0.055
0.012
0.017–0.059
0.026
0.002–0.011
0.005
NO2-N (mg L−1)0.004–0.018
0.006
0–0.0022
0.0
0–0.0065
0.002
0–0.0042
0.002
NO3-N (mg L−1)0.5–1.4
0.69
0.55–0.69
0.65
0.68–1.29
0.94
0.17–0.42
0.27
pH8.1–8.1
8.1
7.8–8
7.8
7.8–8.2
8
8.3–8.4
8.4
PO4-P (mg L−1)0.001–0.06
0.0014
0.004–0.026
0.009
0–0.003
0.0
0.001–0.007
0.0043
TDS (mg L−1)334–357
346
280–330
295
295–338
325
340–369
350
TSS (mg L−1)3–25
5.5
12.5–29
16.5
11.4–43
17.5
8.3–45
20.4
Turbidity (NTU)5–32
16.5
1–23
5
8–31
15
4–25
11
Disclaimer/Publisher’s Note: The statements, opinions and data contained in all publications are solely those of the individual author(s) and contributor(s) and not of MDPI and/or the editor(s). MDPI and/or the editor(s) disclaim responsibility for any injury to people or property resulting from any ideas, methods, instructions or products referred to in the content.

