Article

Hydraulic Conductivity Tests in the Triaxial Stress State: Is Peat an Aquitard or an Aquifer?

by
Łukasz Kaczmarek
1,*,
Maria Grodzka-Łukaszewska
1,
Grzegorz Sinicyn
1,
Mateusz Grygoruk
2,
Małgorzata Jastrzębska
3 and
Jan Szatyłowicz
2
1
Faculty of Building Services, Hydro and Environmental Engineering, Warsaw University of Technology, Nowowiejska 20 St., 00-653 Warsaw, Poland
2
Institute of Environmental Engineering, Warsaw University of Life Sciences, Nowoursynowska 166 St., 02-787 Warsaw, Poland
3
Faculty of Civil Engineering, Silesian University of Technology, Akademicka 5 St., 44-100 Gliwice, Poland
*
Author to whom correspondence should be addressed.
Water 2023, 15(6), 1064; https://doi.org/10.3390/w15061064
Submission received: 22 January 2023 / Revised: 2 March 2023 / Accepted: 7 March 2023 / Published: 10 March 2023
(This article belongs to the Section Hydrology)

Abstract

:
The characteristics of peat’s are crucial for understanding natural processes and their suitable shaping through the management of water relations. This study focused on the results of one of the first hydraulic conductivity (k) laboratory tests of exemplary peat samples from the Biebrza Valley (a peatland of very high environmental importance) in relation to the stress state and hydraulic gradient. Further, the research was devoted to a specific test procedure of peat permeability as a key feature for landform development in wetlands. Detailed tests of dark brown/black samples were selected as the reference for the research investigations. Four long-term test series of water permeability were performed in a modified triaxial compression apparatus. In all selected hydraulic gradient variants (i = 5,10,25,40,55,85), the k values decreased from 6 × 10⁻⁸ m/s to 1.6 × 10⁻¹⁰ m/s with a stepwise increase in the effective confining pressures tested (10, 15, 30, 45, and 90 kPa). These results were related to the inherent soil features—a relatively high peat decomposition and external driver—confining pressure (radial stress) magnitude. Compared to the other Polish peat tests, the determined k values were at the lower end of their hydraulic conductivity range. The analysed organic soil is not a typical aquifer. Despite very high porosities (~88%) and a high organic matter content (81.1–89.4%) which is favourable for water accumulation, the characterized peat showed relatively low hydraulic conductivity values. Thus, this specific soil may differentiate the groundwater flow as it complicates strong contact with surface water.

1. Introduction

Peat—an organic soil containing more than 30% organic matter [1,2,3,4,5]—remains a key element of the environment in the vicinity of rivers, lakes, and land depressions exposed to rainwater accumulation or groundwater discharge [6,7,8,9,10]. Therefore, its characteristics are critical for properly understanding natural processes and their suitable shaping through the management of water relations [11]. According to [12], hydraulic conductivity is a crucial factor for landform changes in wetlands. Furthermore, the shares of the area of country that are covered by peatlands can be relatively high (e.g., Poland—4%; Norway—9%; and Canada—18%; [4,13]), making the knowledge of permeability (and mechanical) parameters also essential for infrastructure development [14] that impacts the carbon balance and the global warming effect [12,14]. As a soft soil, peat presents a severe challenge to construction; therefore, peat areas usually are either avoided in construction purposes, or require a number of specific technical actions to make the construction possible. When this is not possible, soil replacement is most often used. This approach results in rare analyses of the geotechnical parameters of the peat. Nevertheless, hydraulic conductivity is a vital element in geotechnical investigations that are responsible for the subsoil’s consolidation rate. Furthermore, the permeability parameters and physical parameters (e.g., bulk density and porosity) studied comprise elementary information used in calculations such as subsoil settlements or the stability of an excavation bottom due to water pressure.
Peat has specific fibrous structure with a very high porosity and a variable amount of undecomposed/decomposed organic matter [7,8,9,14]—Figure 1. Due to its changing complex and local structure, peat parameterization requires careful study. In particular, the range of hydraulic conductivity values for peat can include values of impermeability as conductive groundwater layers. According to the guidelines for the Hydrogeological Map of Poland (on a scale of 1:50,000 [15]) and the principles of determining the Main Groundwater Reservoir (in Poland [16]), insulating layers are classified as poorly permeable formations (k = 10−9–10−6 m/s) with a thickness of over 15 m or practically impermeable beds (k < 10−9 m/s) with a thickness of more than 5 m. The specified thickness values are related to the time needed for water percolation. In contrast, a water-bearing bed is, in a broader sense, a zone (not only a layer) of permeable formations saturated with that demonstrate a conductivity sufficient for the formation of groundwater flow and the possibility of water intake through wells.
The hydraulic conductivity of peat is usually seen as high (e.g., 10−4 m/s) [17,18]. Nevertheless, peat studies in Poland typically show a range of hydraulic conductivity from 1 × 10⁻¹² m/s to 1 × 10⁻⁷ m/s [4,19,20], with a bulk density from 0.09 g/cm3 to 0.212 g/cm3 and a natural water content from 140% to 770% [21]. Studies on peat from different parts of the world provided widely varying characteristics of hydraulic conductivity, from the most often at 1 × 10⁻⁸ m/s to even 1 × 10⁻⁴ [18,19,22,23,24]. The highest values of k (from 1 × 10⁻⁶ m/s to 1 × 10⁻⁴ m/s) are typical for low-decomposed peat [23,25]. The hydraulic conductivity of medium-decomposed peat usually ranges from 1 × 10⁻⁷ m/s to 1 × 10⁻⁶ m/s [12,23]. Strongly decomposed peat has k values ranging from 1 × 10⁻¹² m/s to 1 × 10⁻⁶ m/s [4,12,14,19,20,23]. The most highly decomposed peats are characterized by an amorphous structure; less-decomposed peats have a pseudo-fibrous structure; and the least-decomposed have a fibrous structure. The differentiation of the k values is related to: (i) the degree of peat decomposition (with a high decrease in k as the degree of compression increases [13]) and the peat structure (which also relates to the locally dominant type of peat), (ii) the amount of additionally present mineral soil (sands, silt, and clay), and (iii) the state of effective stress affecting the type of soil analysis [13,14,20]. Additionally, there is a very strong influence of the test method used on the obtained values of the hydraulic conductivity (e.g., we observed that field tests usually provide a higher value than laboratory tests).
Hydraulic conductivity changes the shape of the groundwater’s hydrodynamic field and the abundance of aquifers. Thus, hydraulic conductivity or current water conditions form the environmental conditions for wetland vegetation. In areas of marginal fens and in the context of discharging minerotrophic groundwater, the peat hydraulic parameters (as the topsoil) determine the solubility of rainwater. Soil permeability characteristics are the driving factor of the whole trophic conditions of the habitat and are responsible for peatland ombrotrophication patterns [26]. The possible variability of the hydraulic conductivity of the peat, which changes over time in response to natural and human-induced stressors [27,28], should therefore be accounted for in studies addressing the future development of peatlands. Moreover, most research studies using modelling tools for a groundwater flow assessment in peatlands do not even discuss the permeability characteristics and use averaged values of k. Meanwhile, due to the variation in hydraulic conductivity values, it may be necessary to divide one peat division into different subunits characterized by other hydrogeological parameters [29]. These are essential aspects that affect the natural environment’s hydrogenic conditions and the water relations in areas covered by economic activity (e.g., agriculture). For this reason, an analysis of selected exemplary peat types was undertaken to determine their potential changes in water permeability, in addition to a quantitative evaluation of the extent of these changes.
This study focuses on the results of one of the first hydraulic conductivity laboratory tests of exemplary peat samples from the Biebrza Valley (a peatland of very high environmental importance) in relation to the stress state and hydraulic gradient. The peat is most identified as a layer of intensive horizontal groundwater flow, but it can also function as an insulating layer under certain conditions. Further, this research was oriented at a specific test procedure of peat permeability as a driver for the landform development of wetlands.

2. Materials and Methods
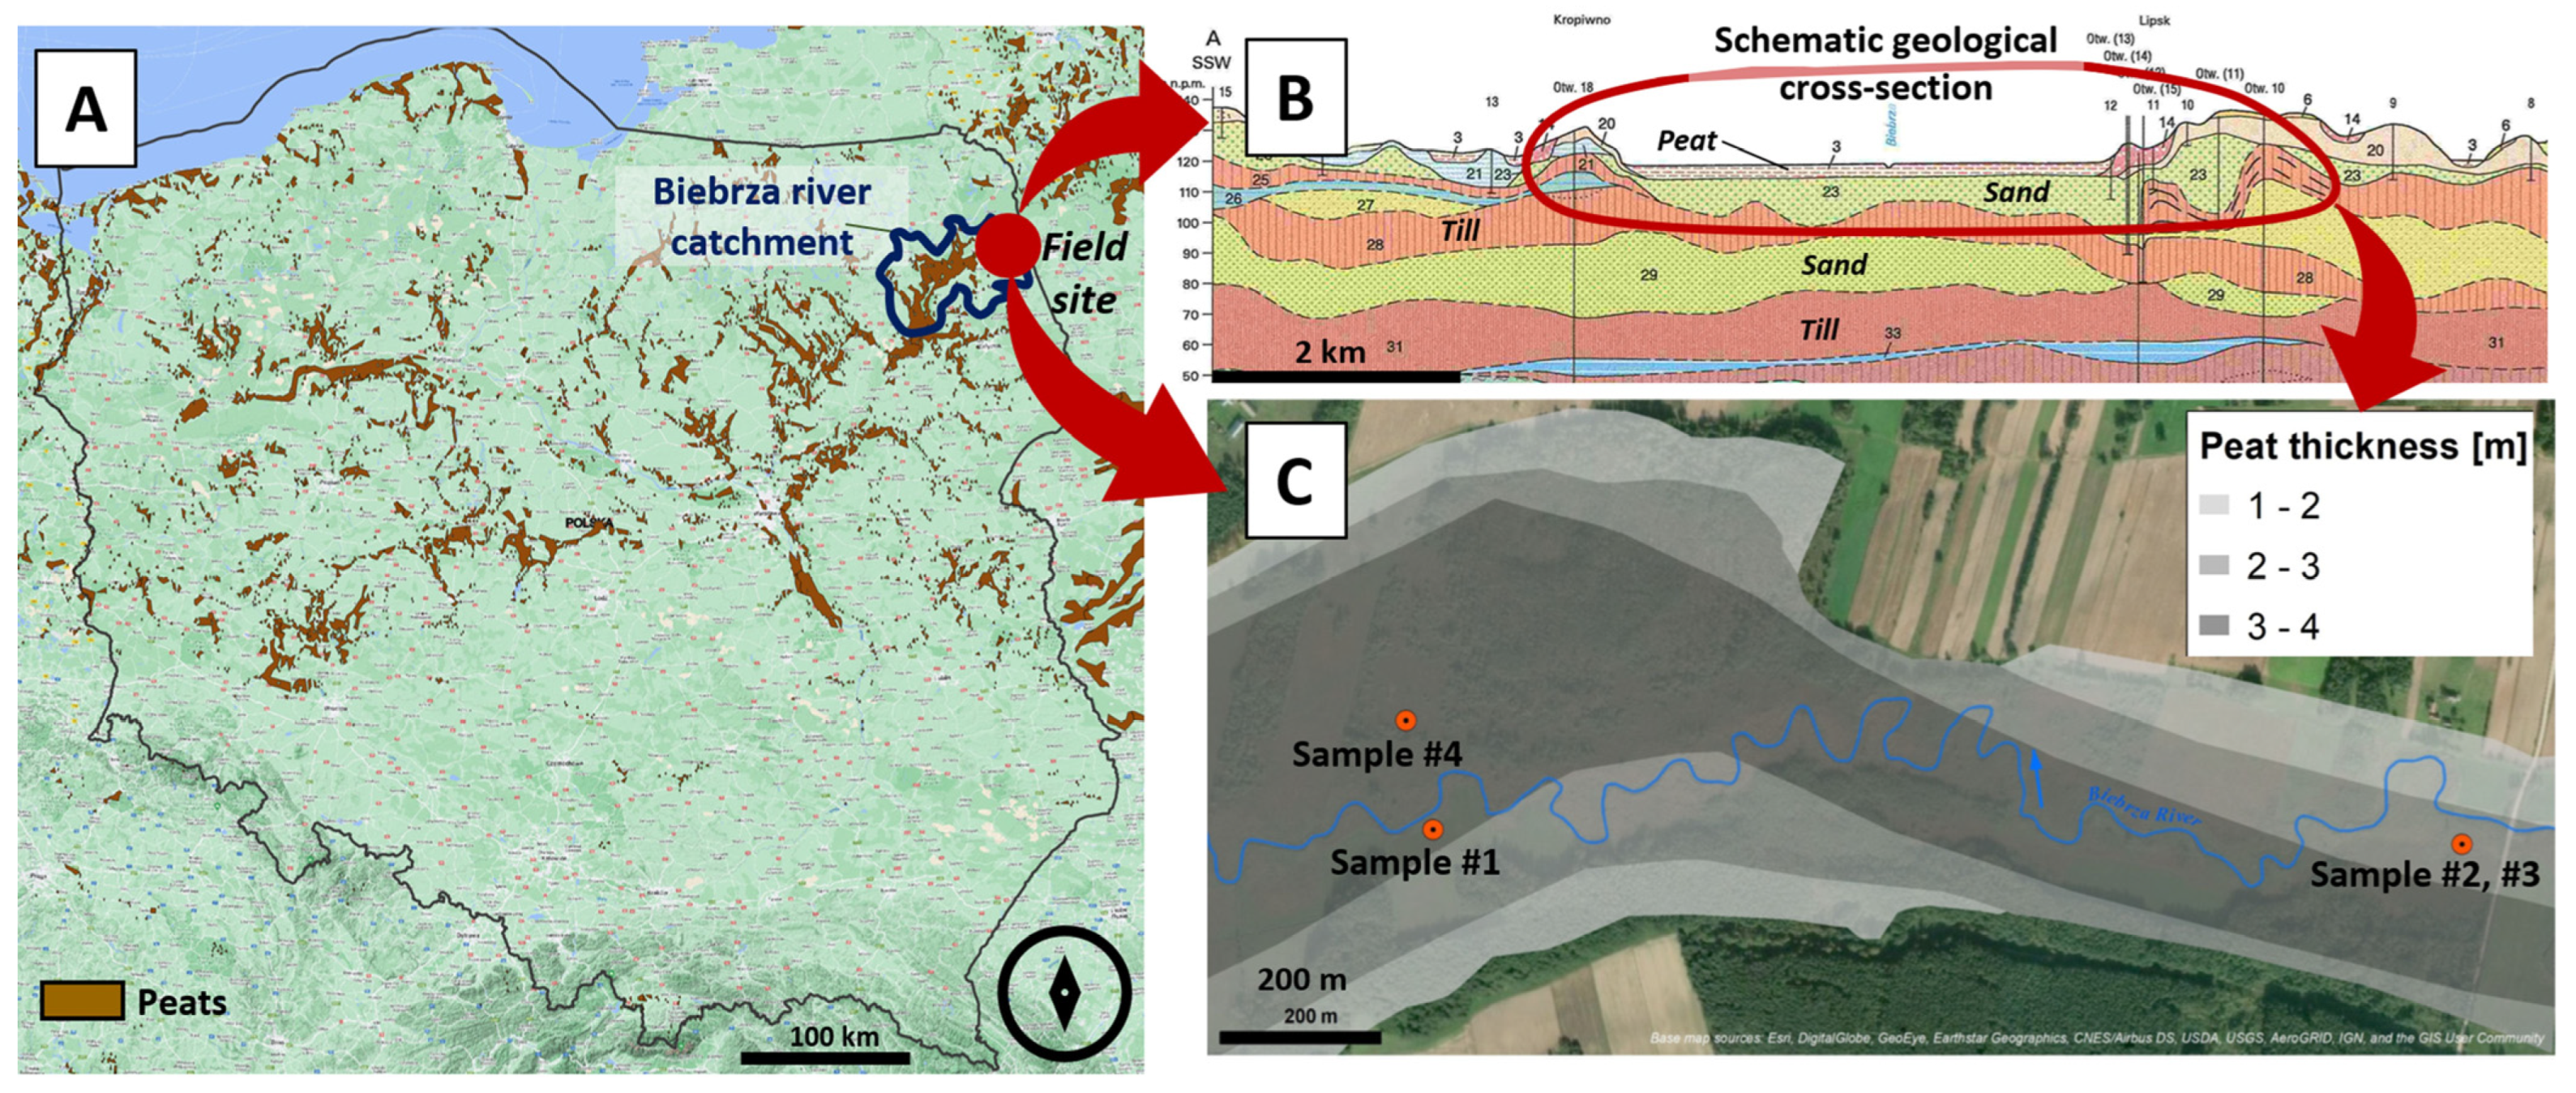
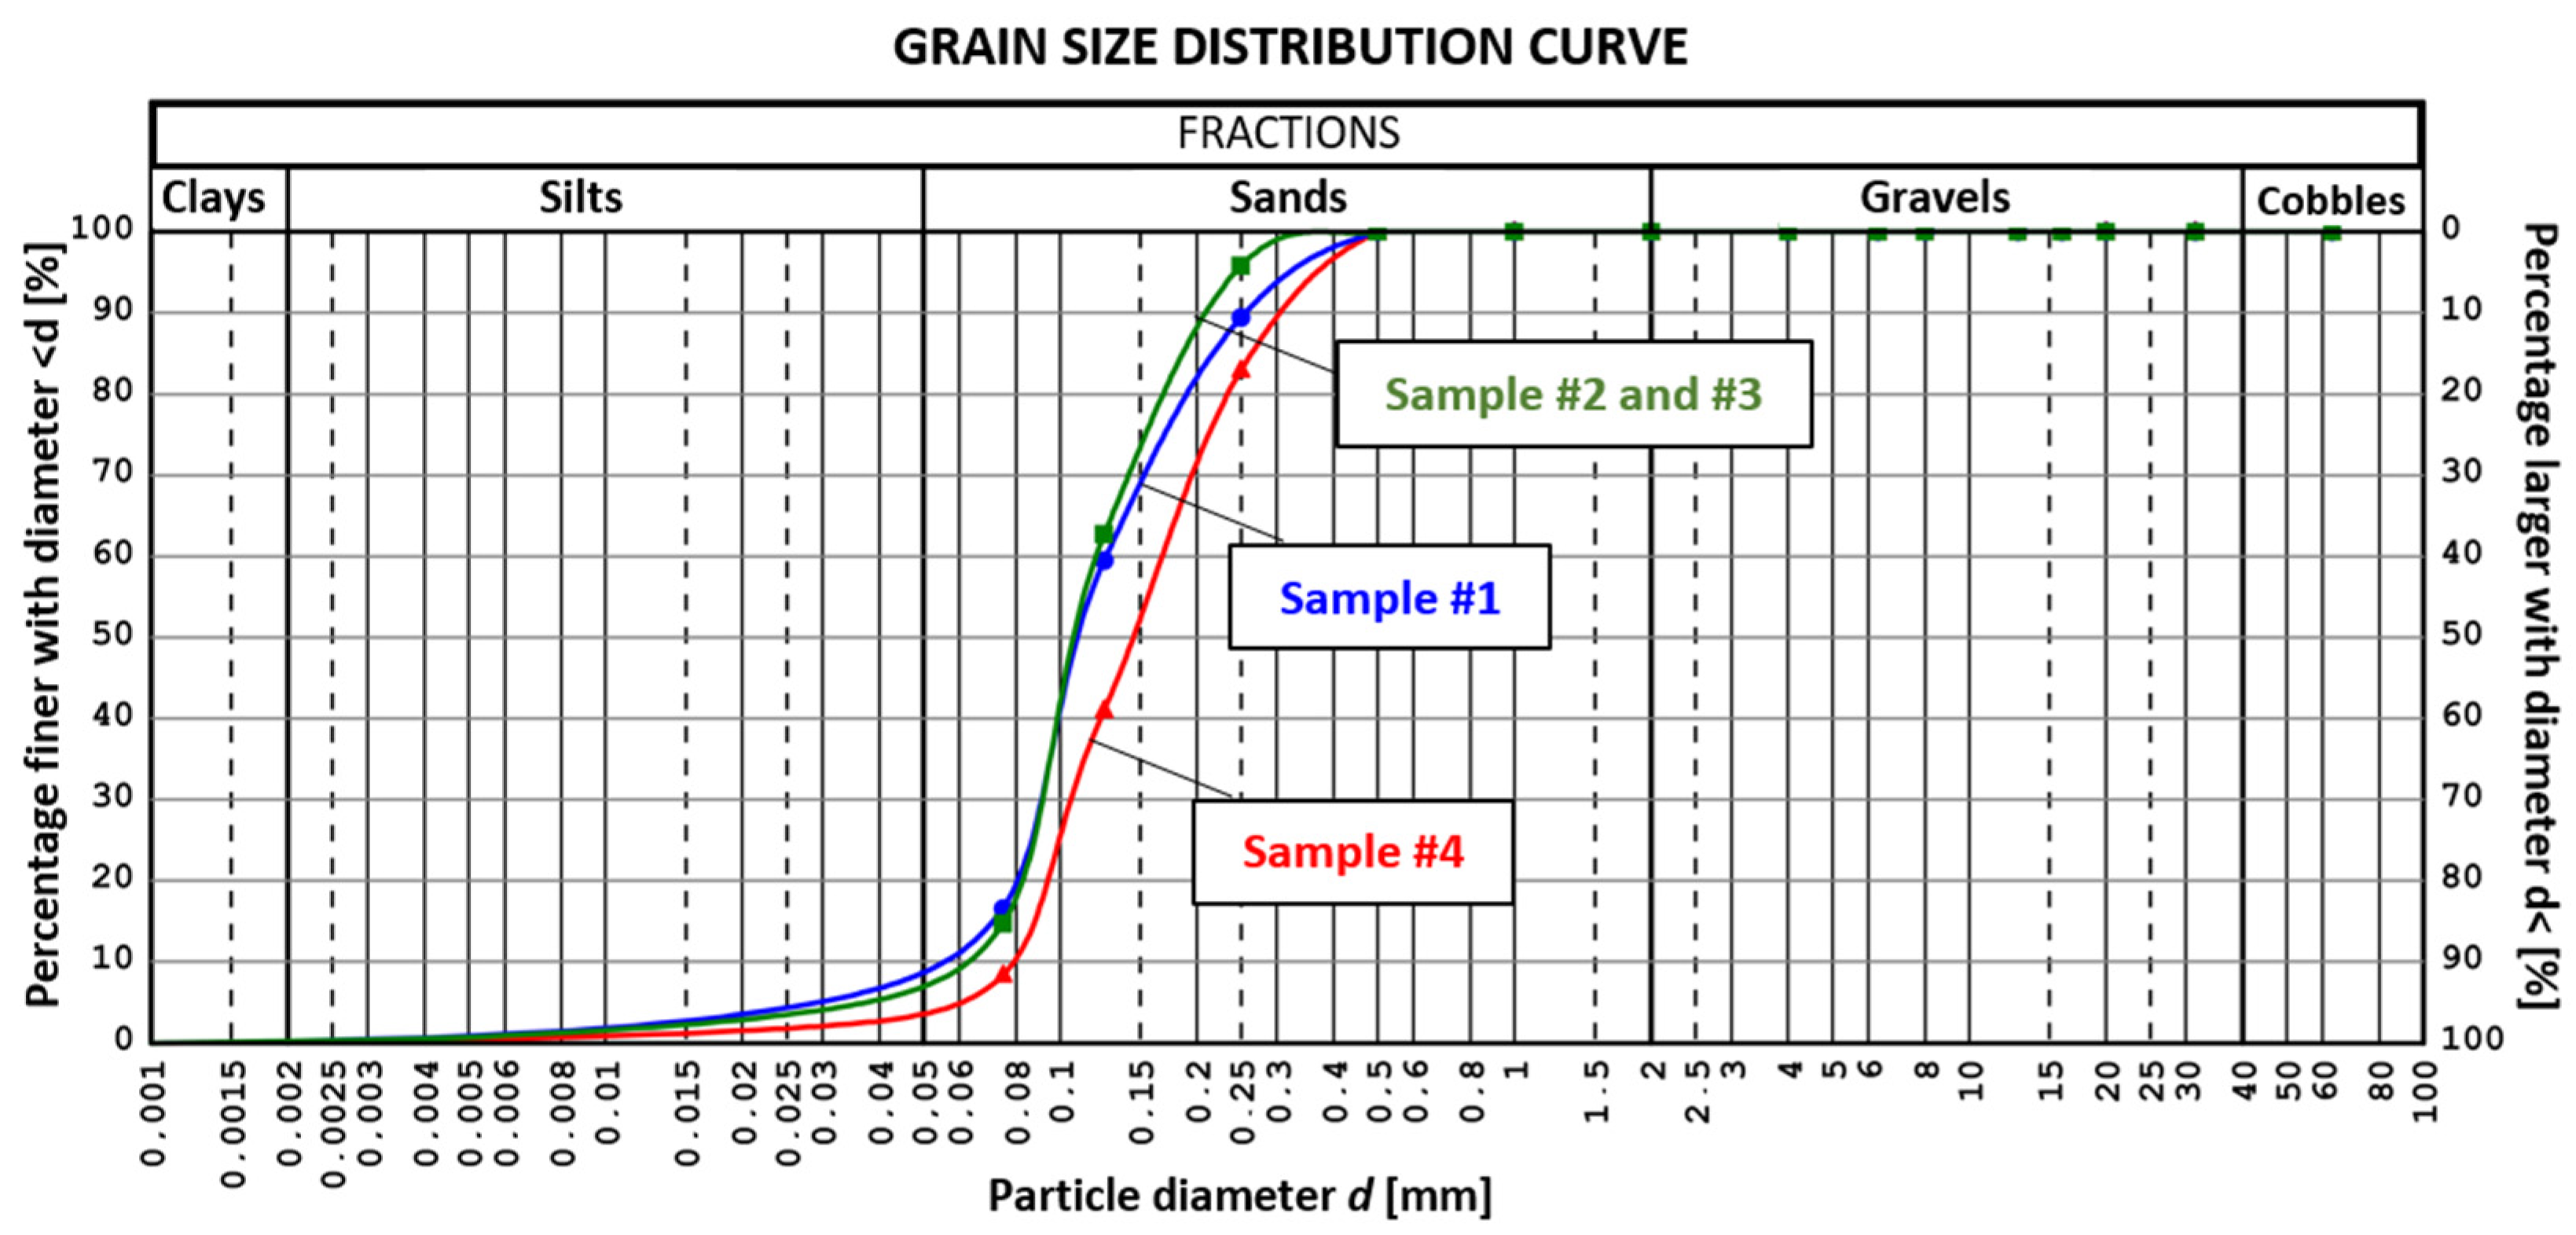
2.1. Study Area

Analysed peat samples were collected in the Biebrza Valley, which is one of the largest coherent peatland extents in Europe. In particular, our study site was located in the Upper Basin of the Biebrza Valley (NE Poland; Table 1; Figure 2). The Biebrza River catchment is in the subcontinental/subboreal climate zone and has a yearly average temperature of 6.8 °C. The average annual precipitation ranges from 550 to 700 mm yr−1, and the evapotranspiration is between 460 and 480 mm yr−1 [9,30,31].
The floodplain overlies an extensive peat deposit of 2–5 m [32,33]. In turn, this deposit partially overlies a 1–4 m gyttja layer [33]. Below the peat, there are sandy formations of a groundwater aquifer. These two formations (with a common piezometric head) and the surface water are in strong hydraulic contact. The geological structure of the sampling area is described in detail in [30]. Generally, the Biebrza river in the valley intensively drains the surrounding upland and the outwash plain. The peat formations near Biebrza are fed by the subsurface flow from the surrounding heights (from the north and south direction) and the flow from the mineral aquifer. An important role in the particular environment is played by the interaction between the peat groundwater and the water of the Biebrza River [10]. It was proven that the peat-forming process began after the last glaciation, and peat deposits that were formed by melting glacial ice fill the valley [34,35]. The analysed peat layer, which is currently characterized by a few meters of thickness, is still “growing” and simultaneously increasing its potential for groundwater (or carbon dioxide) accumulation.
Four samples (from three places) were collected from the surface of the minerotrophic fen mire. The samples were collected from a depth of approximately 0.5 m (below the groundwater table and grass/root zone) as three ~0.5 m long peat cores. Two samples from two cores and two samples, #2 and #3, from one core (for a rough estimation of the variability of the results) were prepared. The selected peat was quite decomposed, dark brown/black, and had fibrous and amorphic components. It had an estimated decomposition degree of approximately 60% (Figure 3). The location of the sampling site refers to the places of previously performed slug tests (field tests of k) [10]. An investigation of the electrical conductivity of the peat groundwater (in recognition boreholes after sampling) near the river (EC ≈ 475 μS/cm; pH ≈ 7.2) indicated similar properties to the waters of the Biebrza River in the recognized area section (EC ≈ 420 μS/cm; pH ≈ 7.7). The electrical conductivity of the water in the recognition holes at the depth of mineral deposits and closer to the uplands was approximately 605 μS/cm (pH ≈ 6.8).

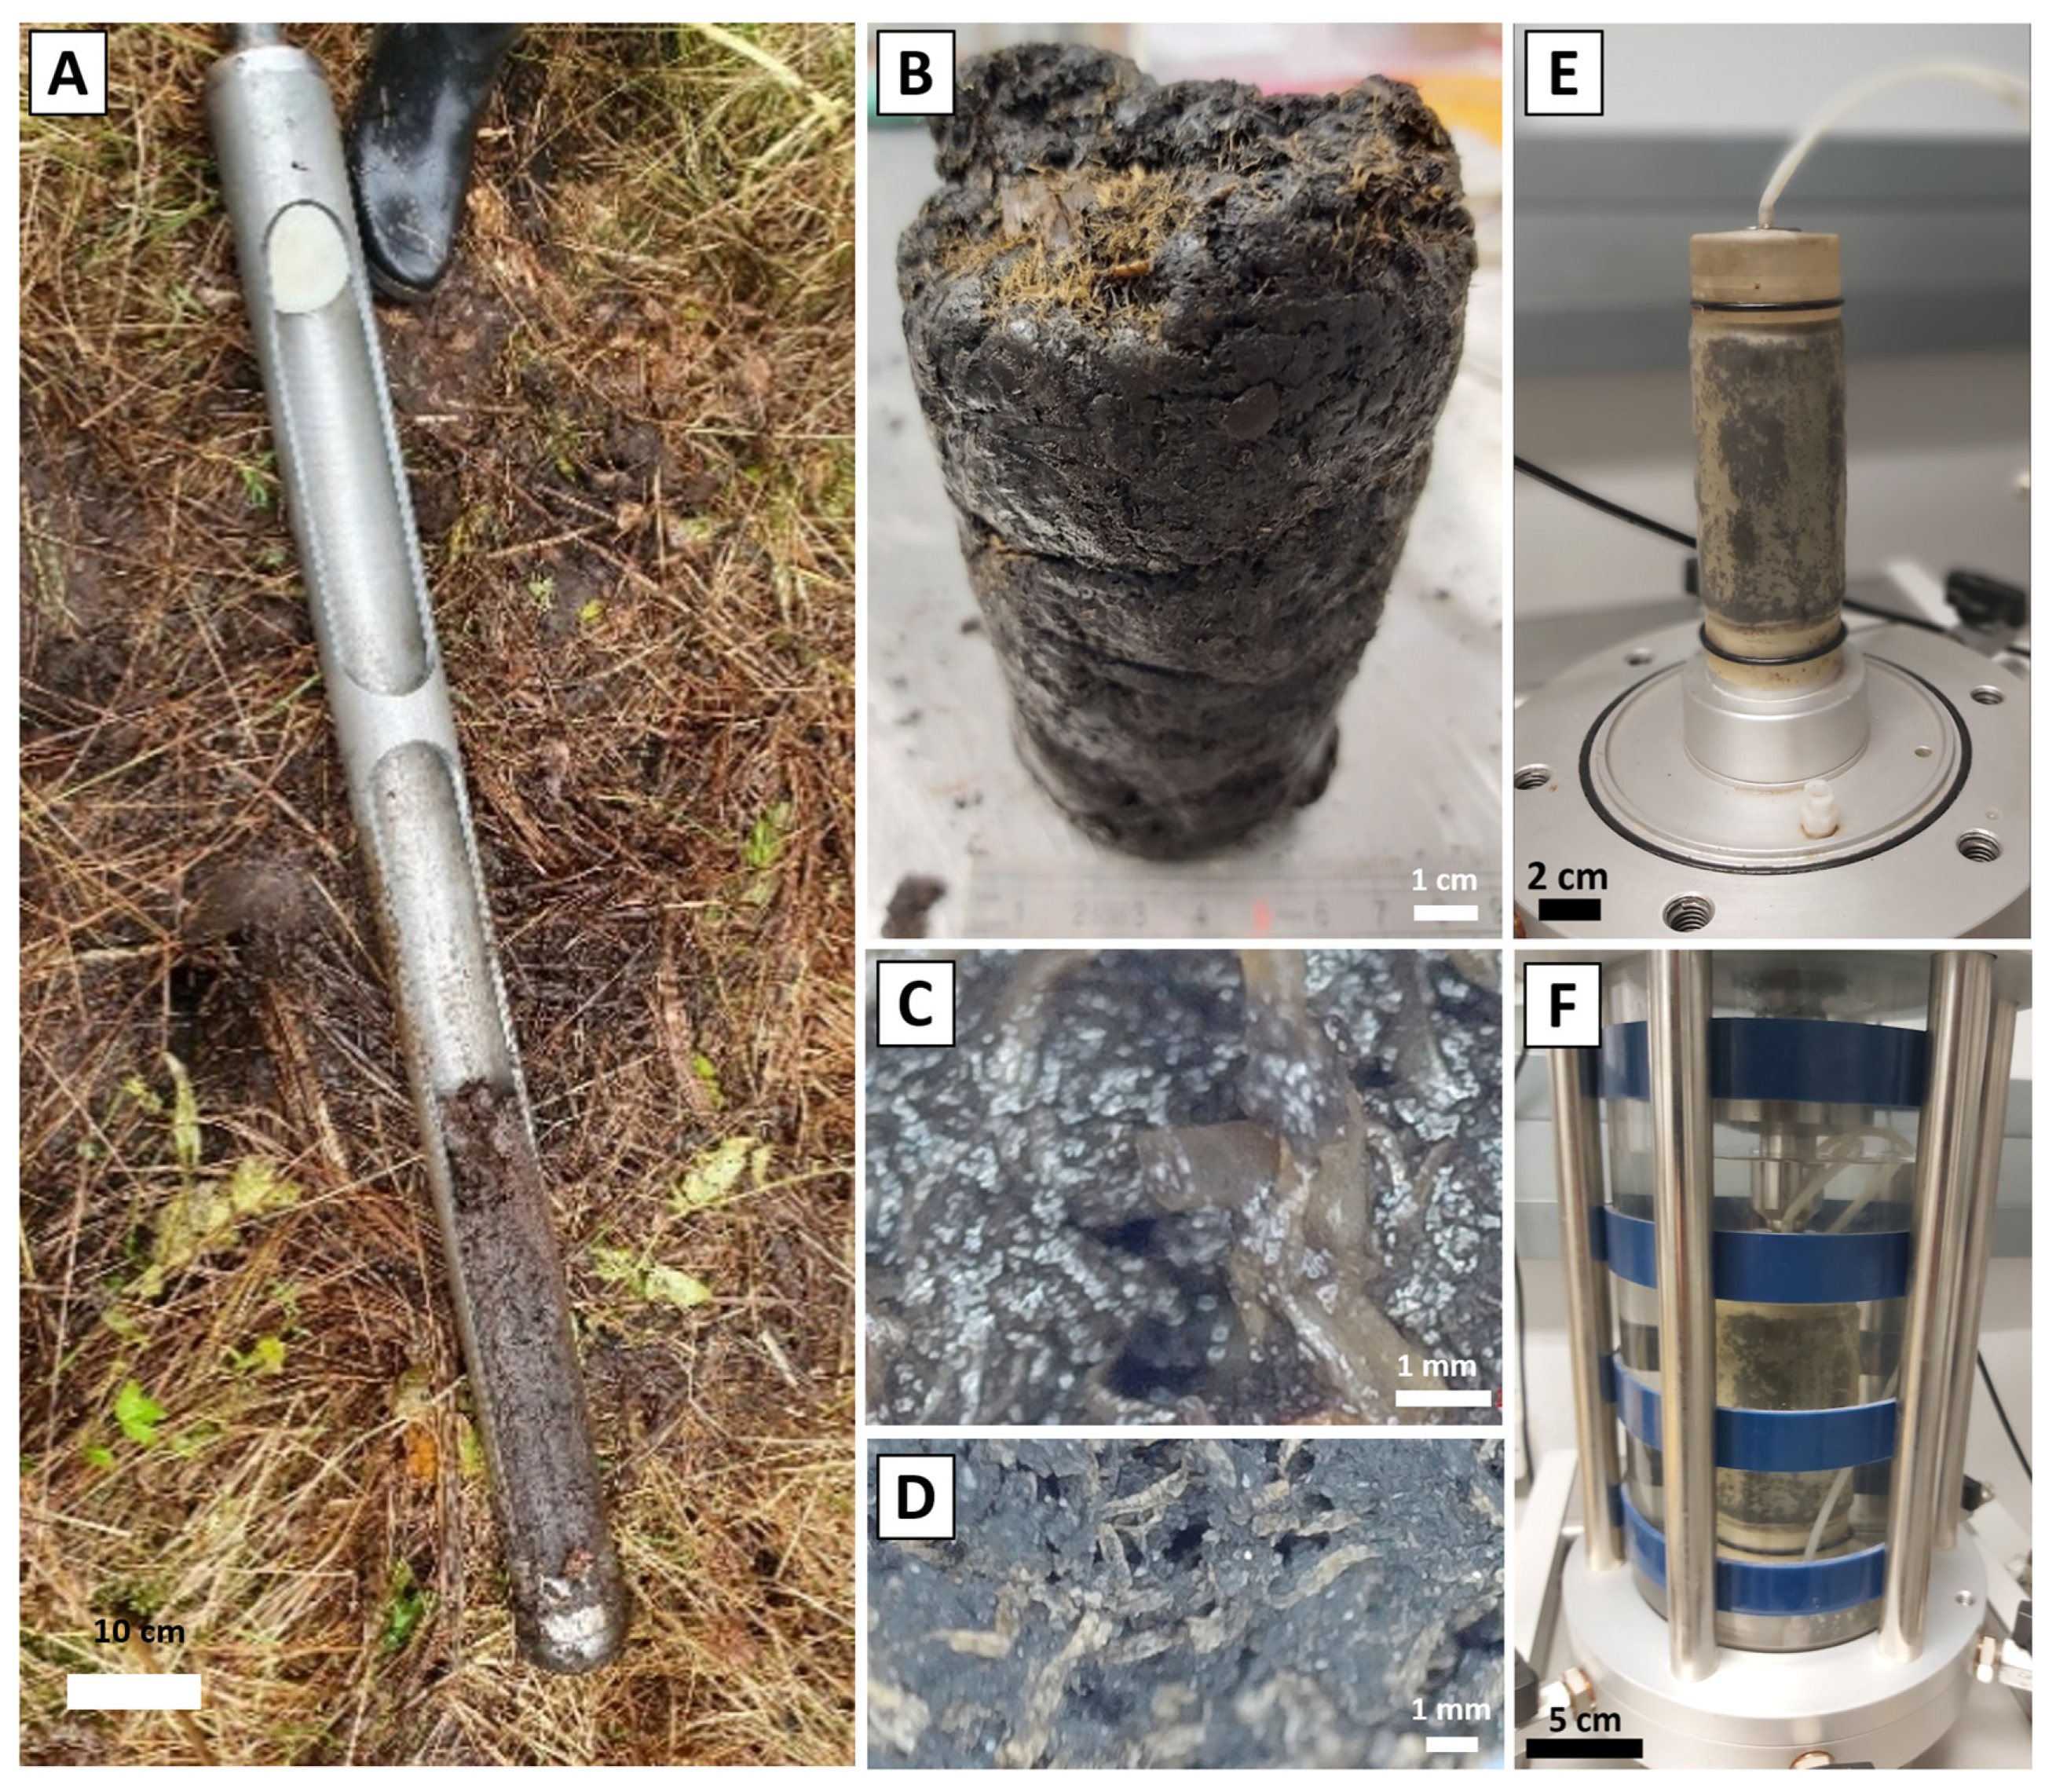
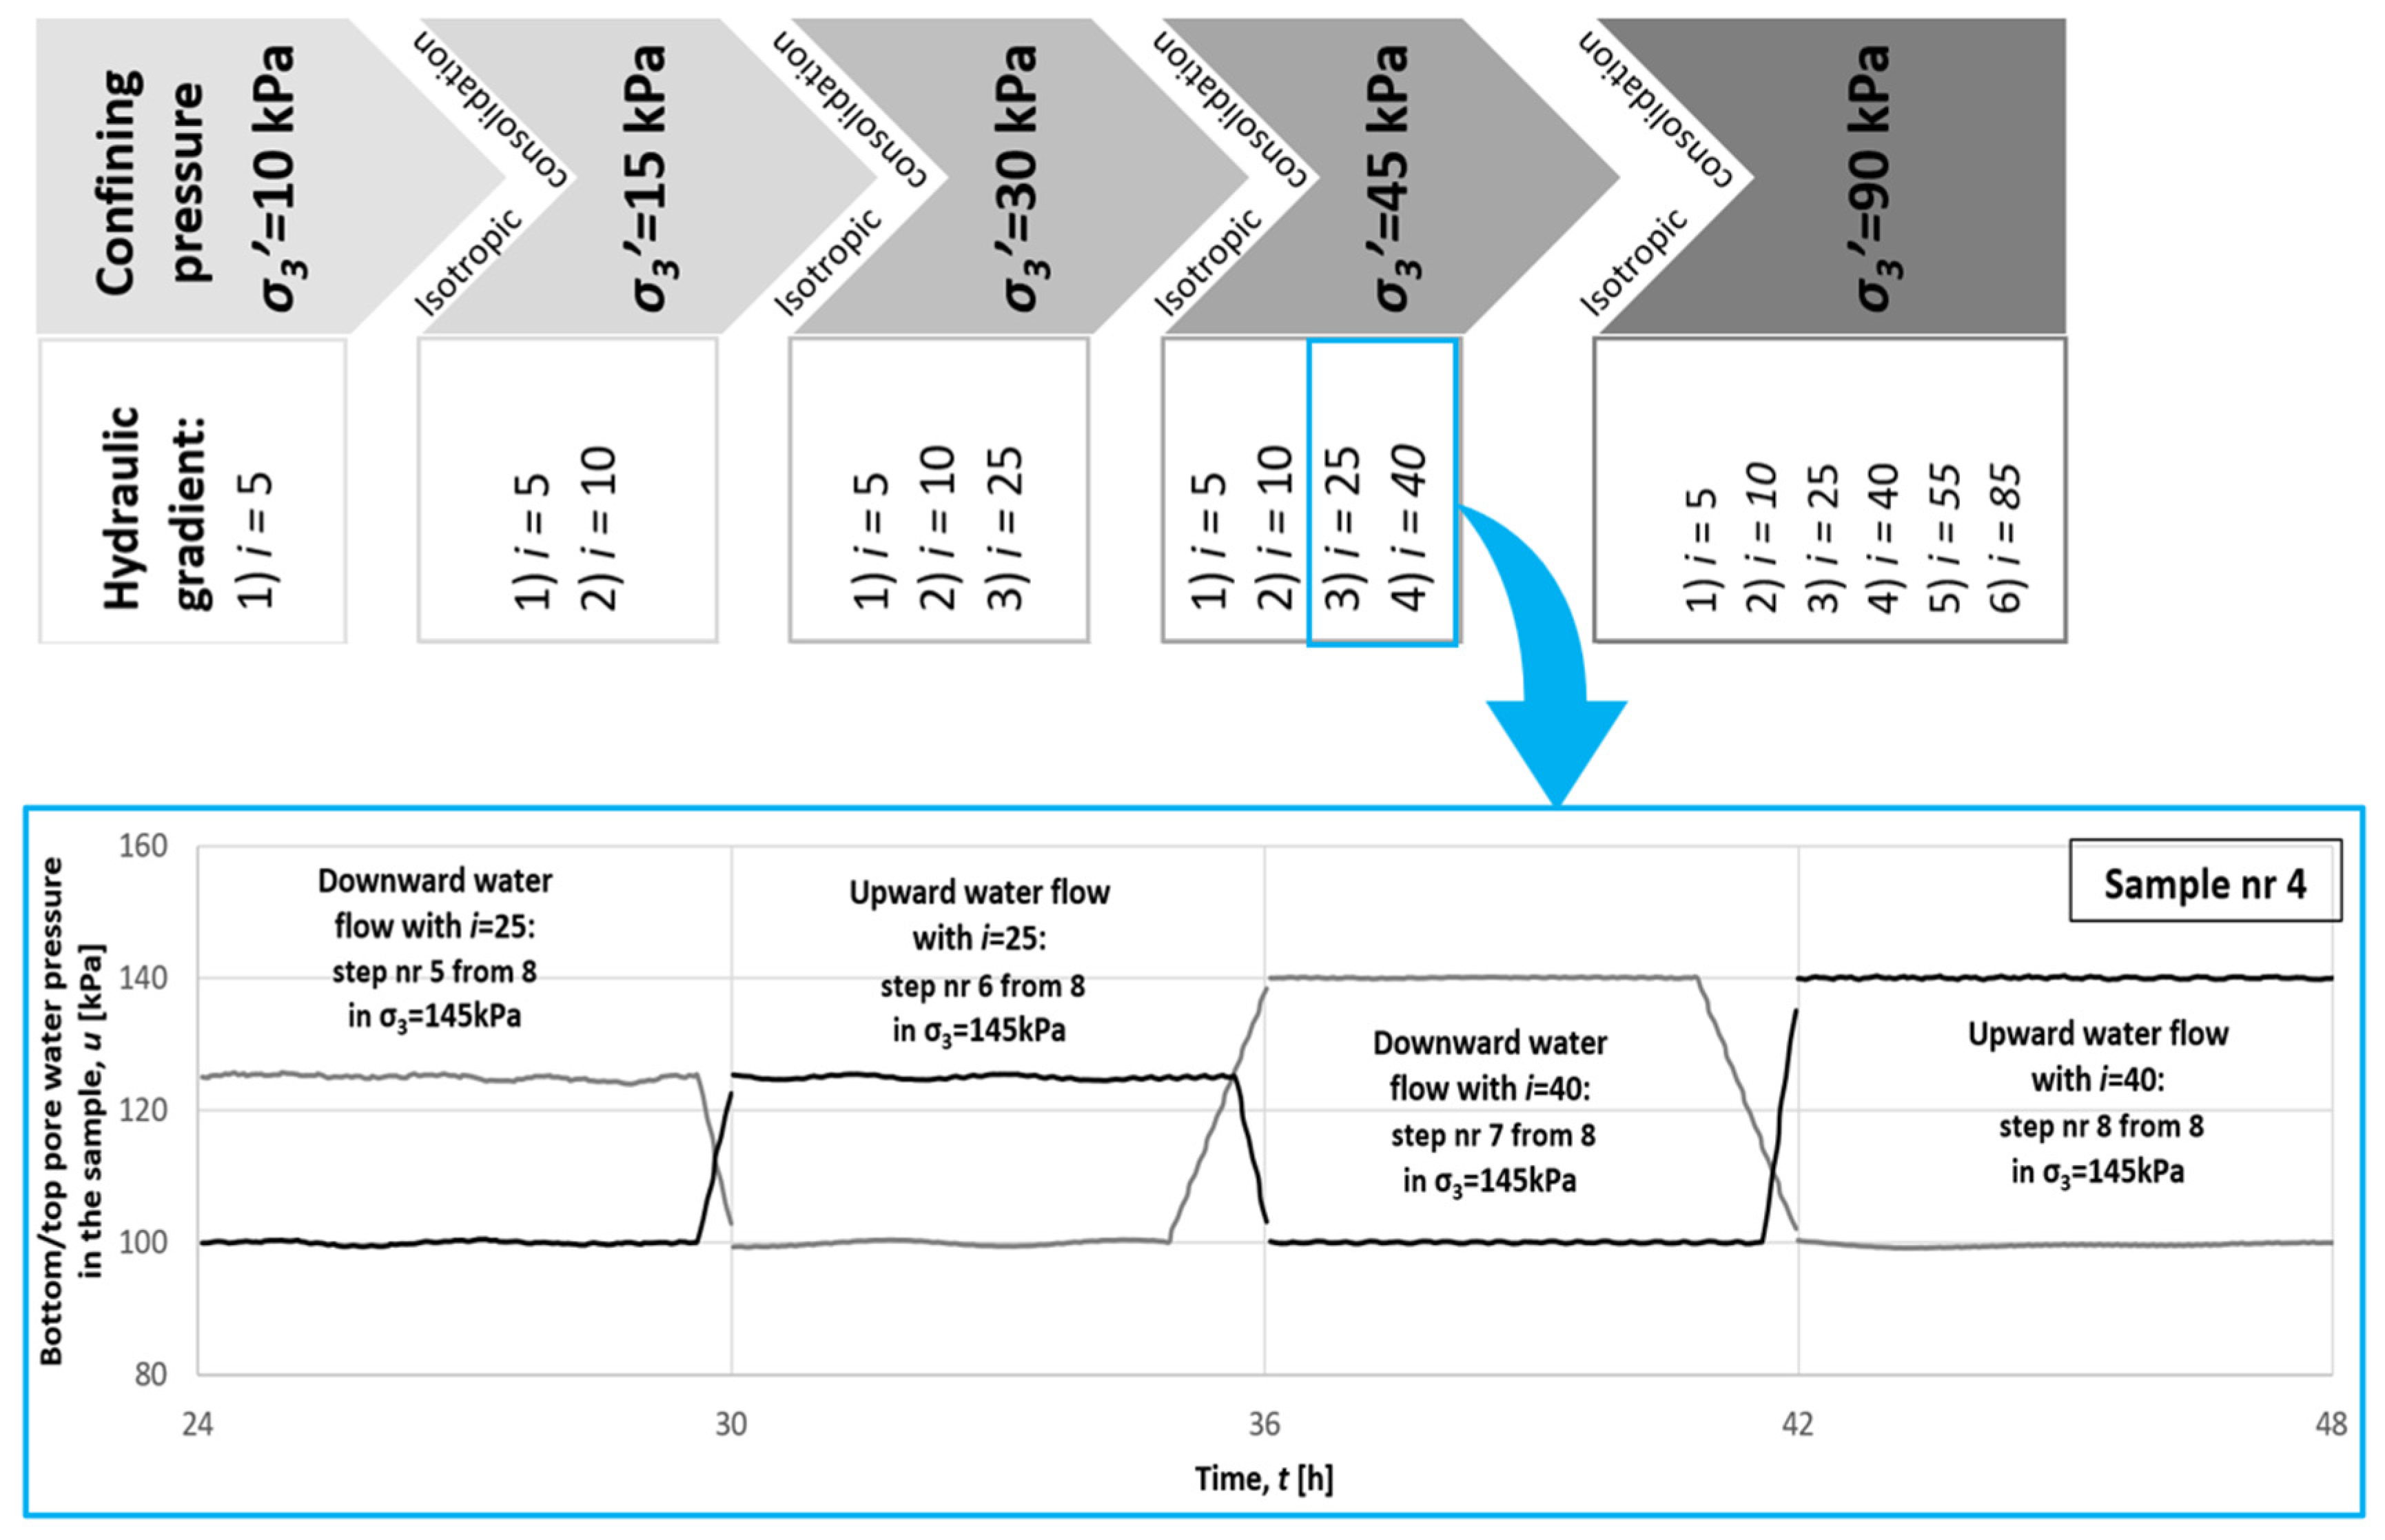
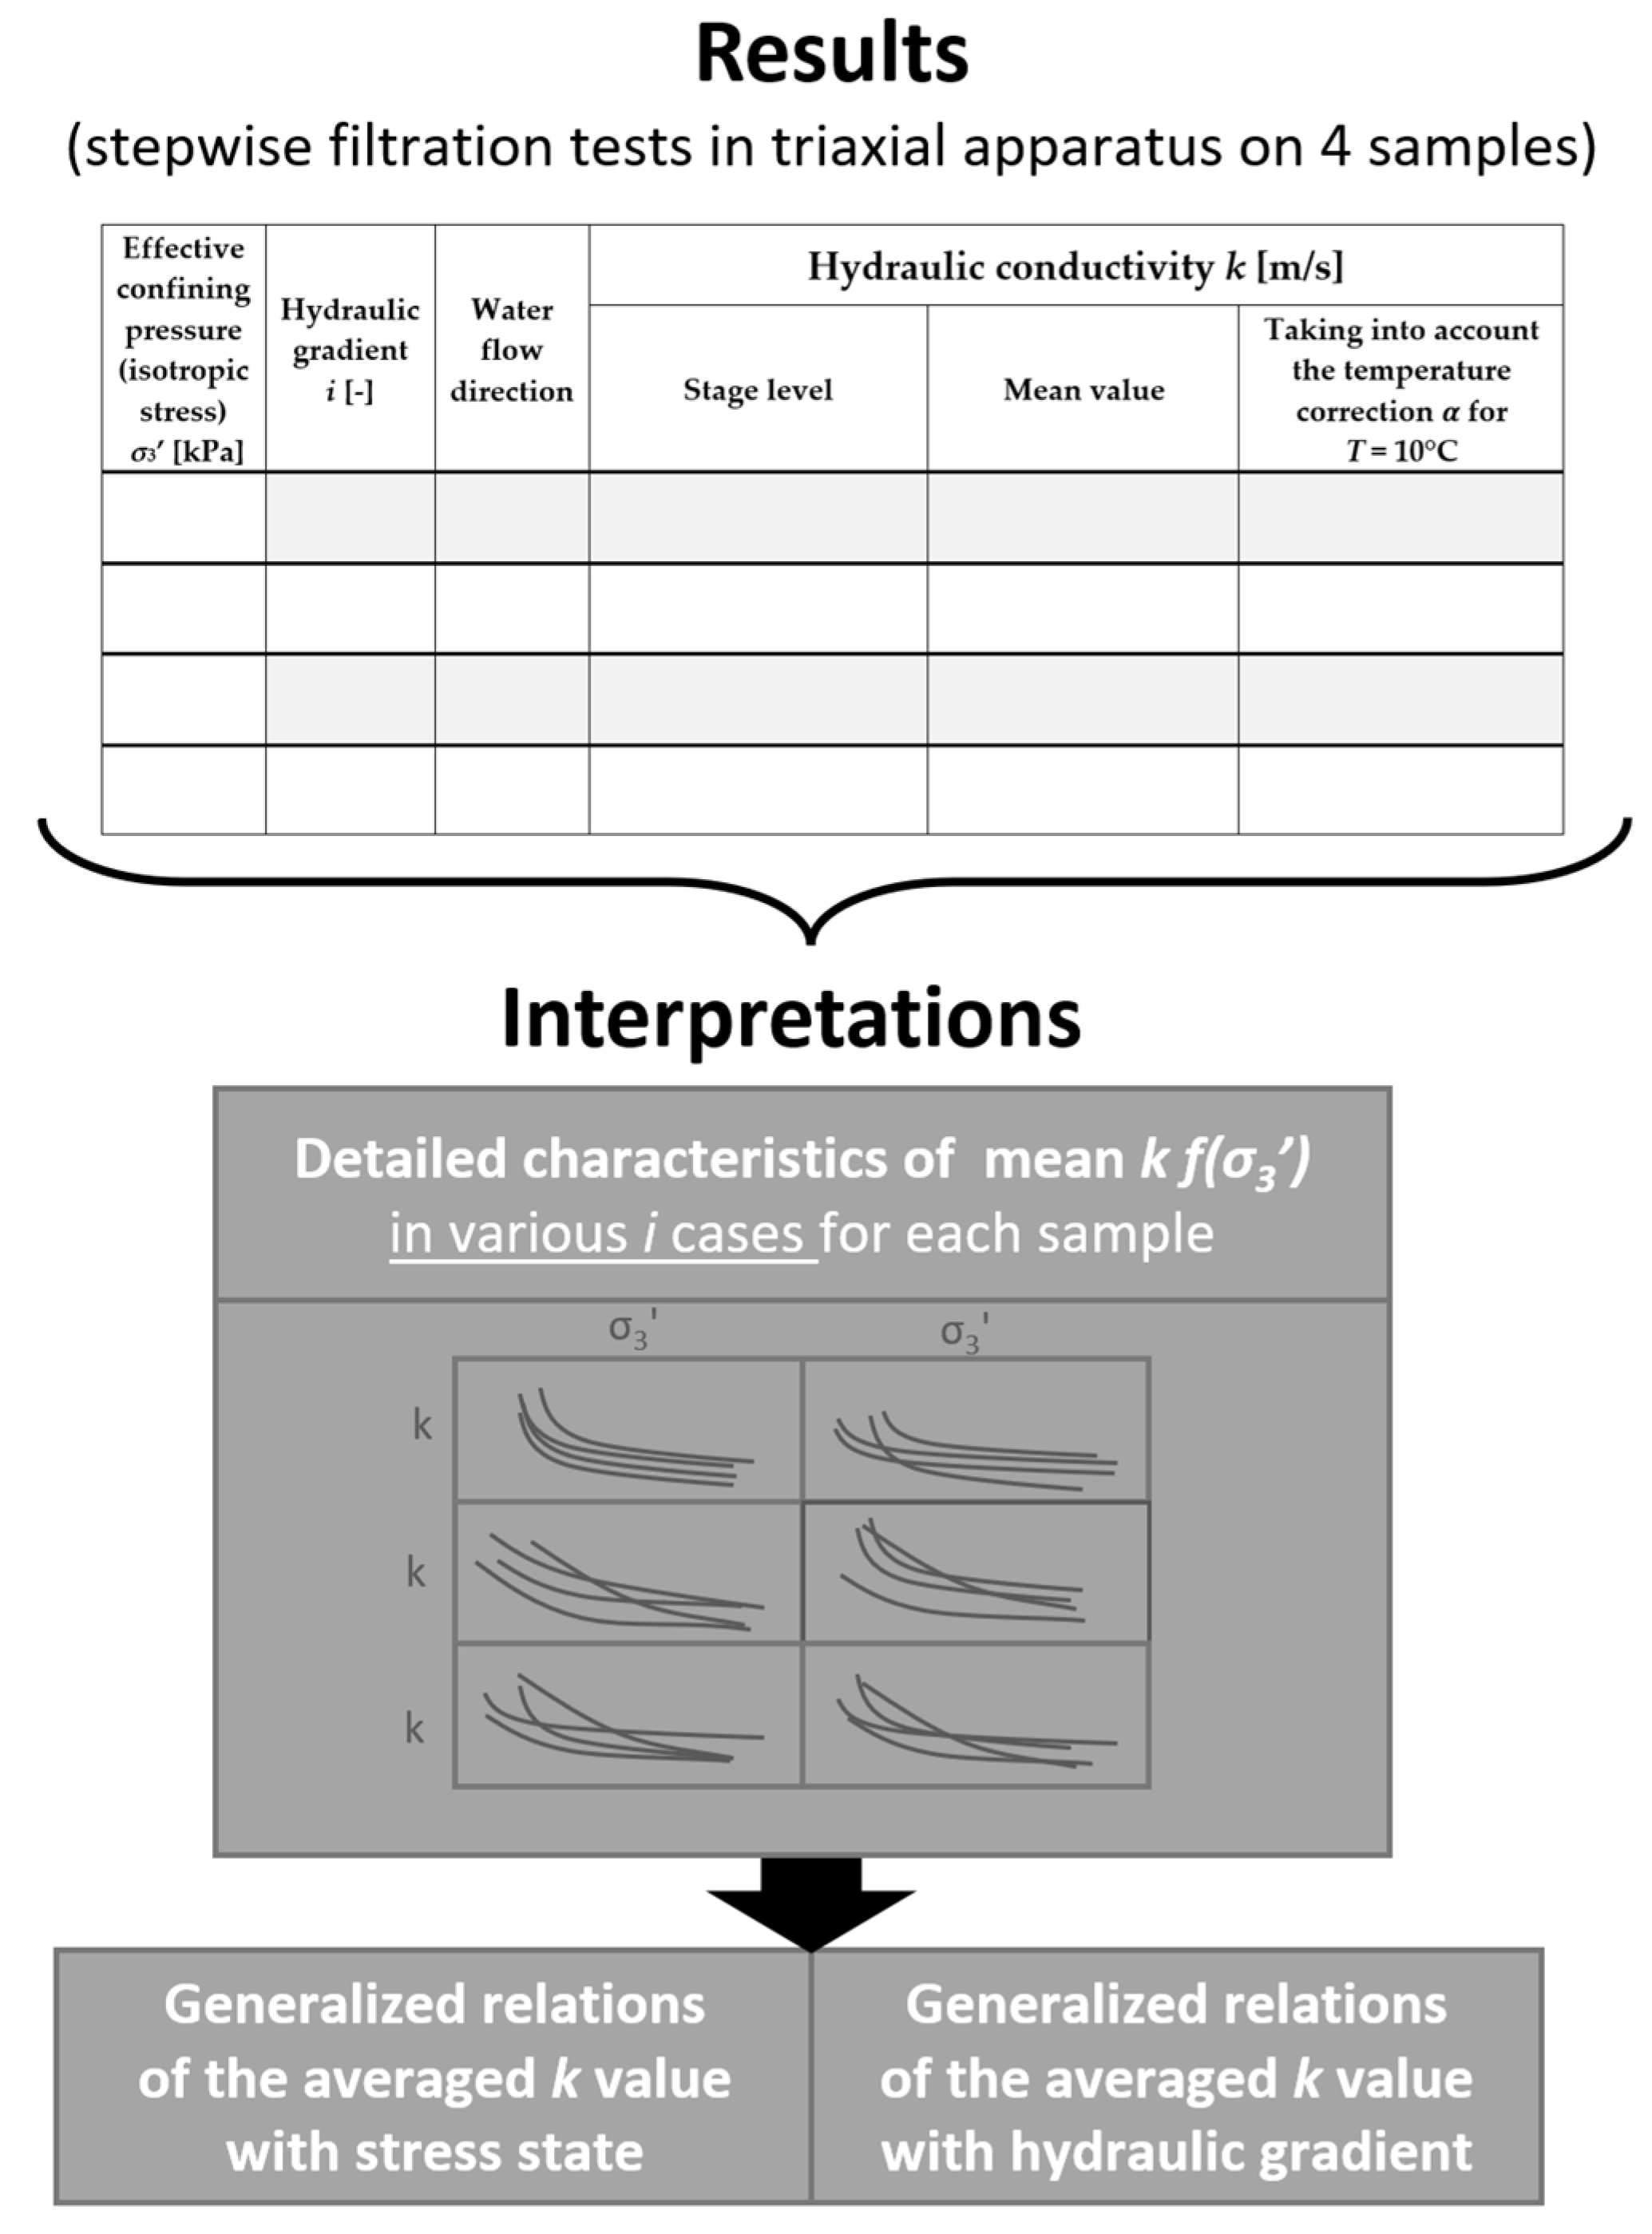
2.2. Test Procedures

The first stage of the workflow was the collection of samples. The laboratory physical property tests were then performed. The cylindrical samples were then cut from the sampler cores. The four properly sized samples were used in further stepwise, multi-stage permeability tests in the triaxial apparatus.
A dedicated mobile hand-sampling set was used in the field. It consisted of an open window sampler (1 m long) with an 80 mm spring break, 36 mm rods, and an upper knob for slow and careful manual insertion. In the bottom end part of the sampler, there was a so-called cutting knife that cut the peat samples and prevented the possibility of the sample slipping out when the sampler was pulled out. Thanks to the use of these specific samplers, it was possible to collect the research material without large disturbances to the soil structure and its water content (he state and structure of these specific soft soils are extremely sensitive to any interaction, including the material collection).
After the research material was transported in the samplers to the laboratory, the peat was directly subjected to a macroscopic analysis of its structure and basic physical tests of its natural water content (the ratio between water weight and dry soil weight; conventional oven drying at 105 °C for approximately 24 h—a criterion of a “constant” mass measure) and bulk density (determined using the buoyancy method in liquid paraffin) for each peat core. Based on these tests, the dry unit density was calculated, and the unit density of the soil solids was determined. Thanks to these data, the porosity finally could be calculated. Following the water content tests, the samples were used in ash content tests (using a kiln). The mineral residues were used in a sieve analysis to evaluate the fractions.
The four peat cores were trimmed to the proper dimension and shape for the triaxial tests: cylindrical samples (ϕ = 50 mm; h = 100 mm). Then, the samples were inserted into a rubber membrane (for protection against blurring) and placed in the triaxial cell. Next, the pore space was fully saturated with water using the back-pressure technique [36], which the B-test verified. Then, through consolidation (the isotropic mode according to methodology description: [37]), of the test samples, referring to the natural conditions of deposition (a low geostatic stress state on the sampling depth, which was evaluated based on bulk density) as well as the exemplary different burial depths in relation to their optional higher thickness (then 4 m) or other additional loadings (natural/anthropogenic—example in [38]), were brought to the initial state (for further test stages). After consolidation, the core testing followed: multi-stage permeability tests (a triaxial permeability test with two back-pressure systems for a constant-head approach), consisting of the flow of water through the sample (forced by hydraulic pumps that constituted part of the electromechanical controllers) with a given appropriate direction of water flow, hydraulic gradient, and confining pressure (which corresponded to consolidation stress states). As previously mentioned, a confining pressure equivalent to the natural and potential consolidation pressure was applied. The vertical permeability tests were carried out using a computer-controlled triaxial compression system manufactured by Wille Geotechnik. The test procedure was based on current technical standards [39,40] and the specialized literature [37,41].
Permeability tests were performed using a constant hydraulic gradient and the water flow from the top to the bottom of a sample (6 h) and then from the bottom to the top (6 h). The range of the studied hydraulic gradient included example values related to the need to exceed the initial gradient and hypothetical values up to high values to analyse the testing results under different physical boundary conditions. Throughout the test, the soil sample was affected by the radial stress σ3’, the confining pressure of water in the triaxial cell. A hydraulic gradient i was applied by keeping the water pressure increased, first in one part of the sample while keeping the value constant in the other part of the sample and then vice versa (the k result was the average value of the measurement) in the aforementioned downward and upward flow directions. After recording a steady flow of water, the flow tests were repeated (multi-stage tests) with sequential differentiation (Figure 4):
(a)
The direction of flow (from the top to the bottom and, in the next stage, with the same gradient and radial stress but from the bottom to the top);
(b)
A constant hydraulic gradient (stepwise increases i = 5; 10; 25; 40; 55; 80);
(c)
A constant confining pressure corresponding to different triaxial stress states on the different depths (σ3′ = 10 kPa; 15 kPa; 30 kPa; 45 kPa; 90 kPa).
Not all four experiments covered the aforementioned stages of permeability testing (the full procedure—Samples 1 and 4). This detailed opening research provided the experience to design subsequent, more numerous investigations. The test procedure for one sample lasted roughly one month (a saturation stage of approximately two days and a consolidation stage of approximately one week, which was important for stable physical boundary conditions) to complete all stages, including key stages—the stepwise confining pressure (i.e., radial stress) increase with the stepwise hydraulic gradient increase. Figure 5 presents the triaxial setup used.
The determination of the hydraulic conductivity value k in the triaxial compression apparatus consisted of measuring the water flow, i.e., the amount of water passing through the sample in a specific time unit (Q), flowing from one water-pressure controller to another through the soil sample (a triaxial permeability test with two back-pressure systems) and was based on the formula:
k = Q A i
where Q—water flow (m3/s); A—cross section through a cylindrical specimen, (A ≈ 0.002 m2); and i—hydraulic gradient (-):
i = Δh/l
where l—flow line path (m) (in this study, the analysed sample heights were l = 0.1 m) and Δh—hydraulic height difference (m).
Assuming that 1 m of water exerts 10 kPa of water pressure (u), Formula (2) takes the form:
i = Δu/(l·γw)
where γw—specific gravity of water; γw = 10 kN/m3; and l is as in formula (2); hence, i = Δu (-).
Based on the recommendations of [40], the obtained result of the hydraulic conductivity at the registered water temperature (T ≈ 20 °C) was converted into the reference value at 10 °C:
K10 = α·k
where α is a correction factor calculated using the Poiseuille formula: for T ≈ 20 °C, α = 0.771.

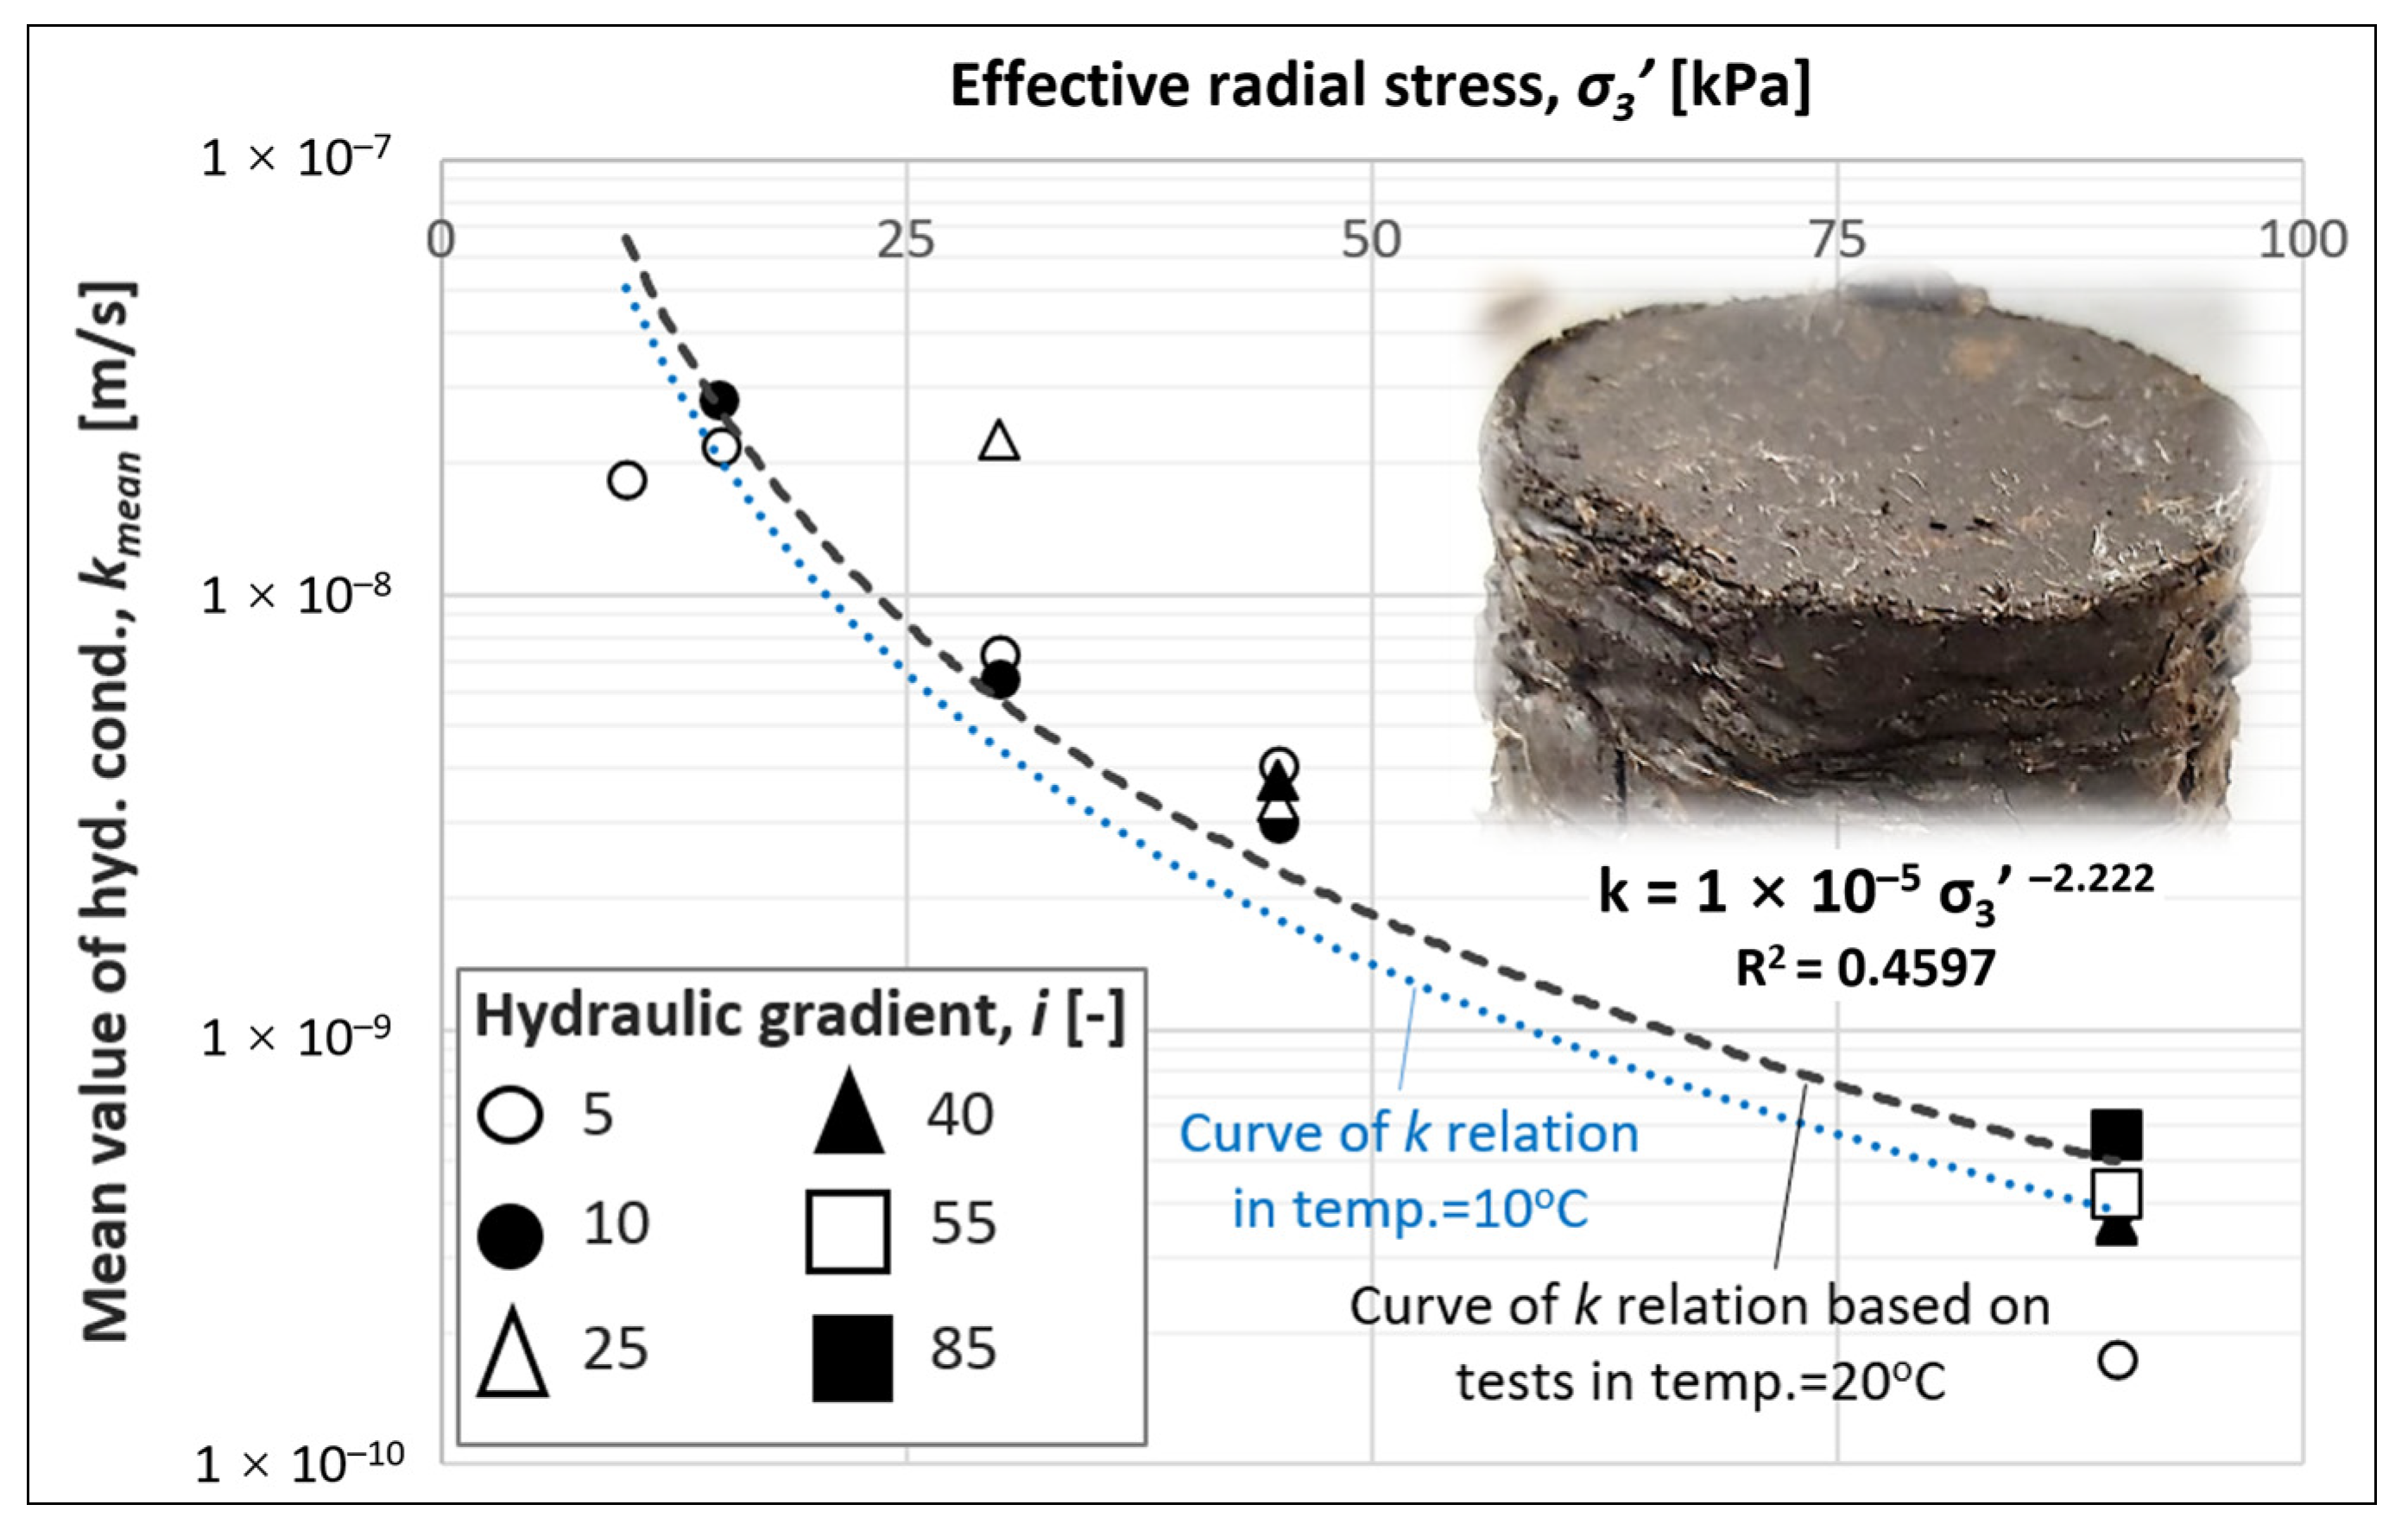
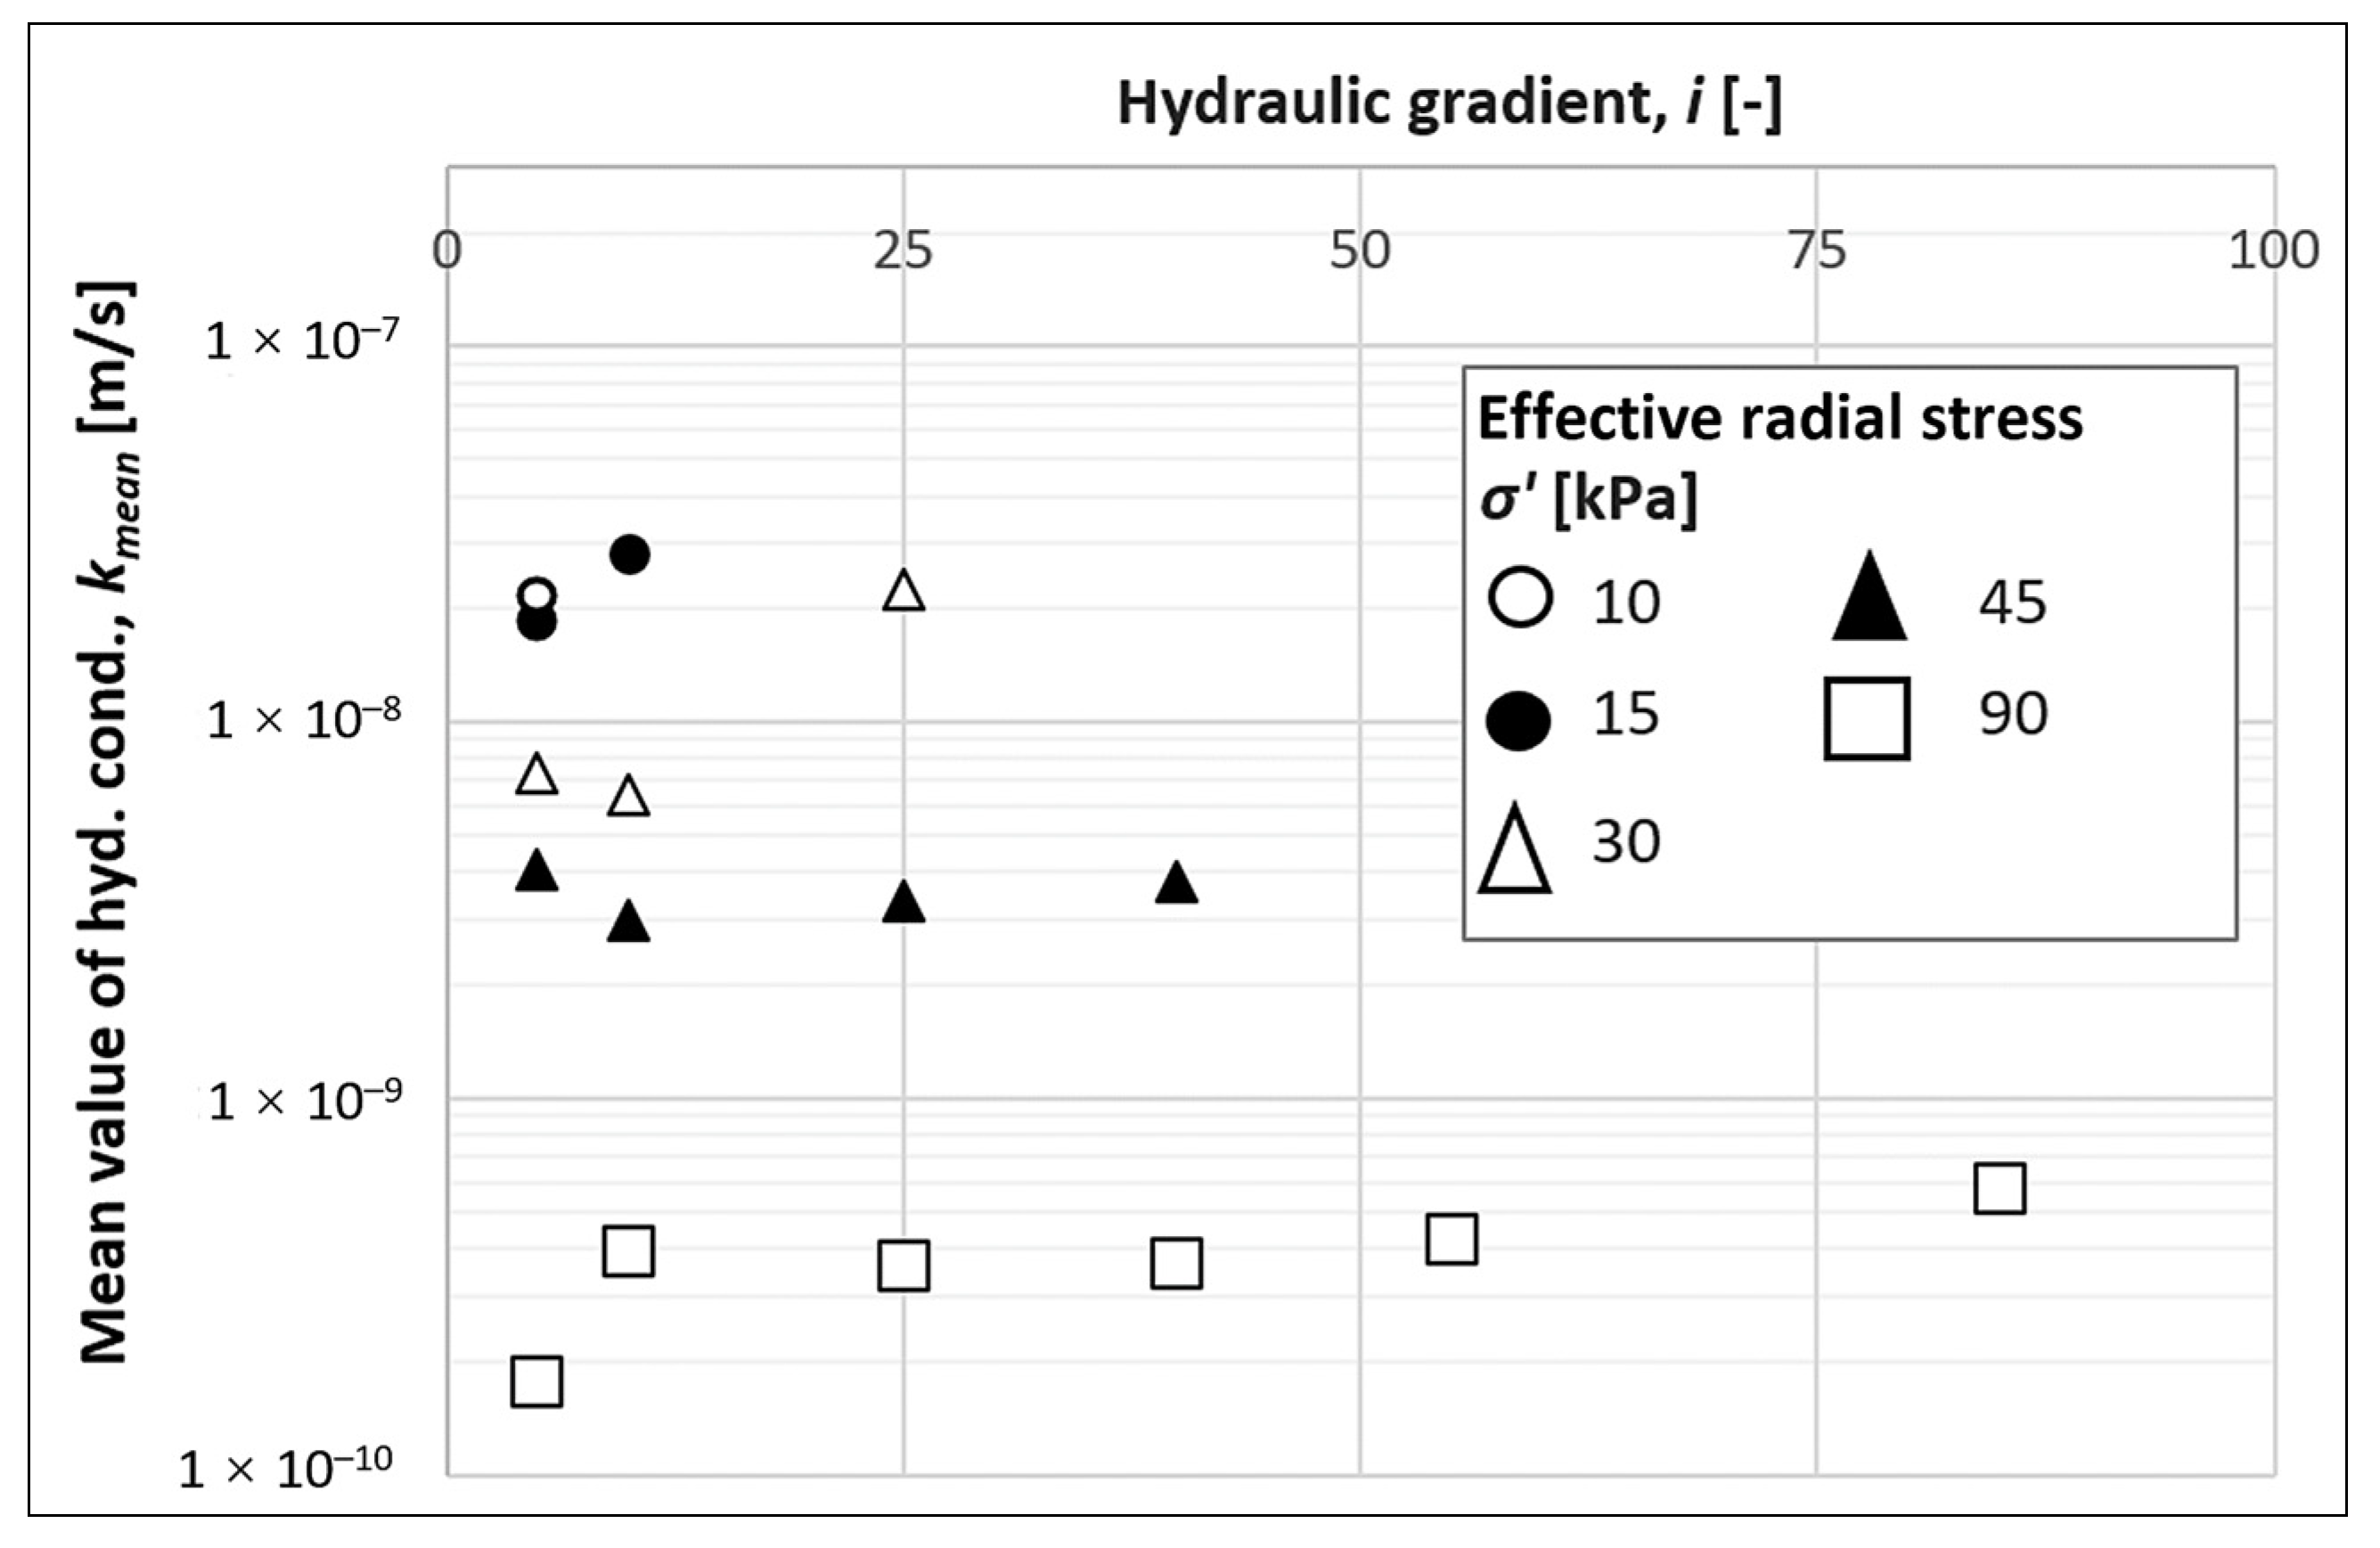
3. Results and Discussion

The vegetation, geomorphology, and water level are factors that cause the formation of the soft soil with a dominant content of plant parts (in this case, approx. 0.5 cm long) and a minority mineral part—namely, peat. One of the specific features of this soil is its progressive transformation (humification). The structure of the peat and a very low compaction determine the huge porosity, as does the immense water content (several hundred percent). Such physical characteristics of the peat are responsible for their low bulk densities which, at a high groundwater level, result in low values of the effective geostatic stress. As a result, the described soils are characterized by a high loading sensitivity expressed by changes in the permeability and mechanical properties. For example, even with a small additional external load resulting from, for example, intense precipitation and settlements of the soil may be observed [42]. Hence, in peat water permeability studies, it is important to include the variable stress state. The elaborated test procedures provided results that aid in the understanding the role of the peat in an ecosystem and in considering the potential permeability changes.
The first group of results were related to the physical properties, such as the water content from 452% to 535% (mean value: 499%, standard deviation: 33%). Such values are in the middle of the water content range of peat located in Poland (compared with [4,19,20]). The ash content of Samples #1 and #4 was 10.6% and 12.9%, respectively, while Samples #2 and #3 (from the same core) had an ash content of approximately 18.9%. Thus, the studied material had ~86% organic matter content (81.1% to 89.4%). Sieve analyses were carried out using the material left over from the ash study; the results are illustrated in Figure 6. The very similar content of the fractions (dominant: fine sand with the addition of silt; poorly graded) can be seen where differences are caused by natural variations. The lack of a clay fraction is due to the dehydration processes (during the the burning of the samples), according to [43]. The estimated content of the clay fraction is several percent (based on macroscopic observations and a comparative analysis with [44,45,46,47]). The described fractional characteristics are not the worst but are also not optimal for groundwater flow. Next, the results of the bulk density tests were 1.018–1.042 g/cm3 (mean value: 1.028 g/cm3, standard deviation: 0.010 g/cm3), which is in the lower archival range of the Polish peats tests (compared to [4,19,20]). Based on these parameters, the dry unit densities were evaluated to be 0.164–0.187 g/cm3, and the unit densities of the soil solid were valuated to be 1.48–1.55 g/cm3. Finally, the derived porosity values were ~88%.
The processing scheme of the permeability test (in triaxial apparatus) outcomes is assembled in Figure 7. In this procedure, the mean values of the vertical hydraulic conductivity k from the downward and upward flow were used (in most cases, the k values of the downward flow were higher).
The characteristic wetland vegetation genesis of the analysed organic soil led to a complex structure [48], making the resultant k values variable (Table 2). Nevertheless, it is possible to identity some trends even in the order of magnitude. Regarding the generalized regional permeability characteristics of peat soils from this particular region, determined trends should be verified and updated using a higher number of test results and samples from different places and depths. In the context of this paper’s research question, the several hydraulic conductivity tests provided a reasonable reference point and a first insight with the use of advanced triaxial apparatus.
Figure 8 presents the recalculated data results using the mean k values for each hydraulic gradient stage. In this case, the hydraulic conductivity correlation formula was derived as a function of the effective radial stress (i.e., confining pressure). The intensity of this stress can be affected by many factors, such as water table changes, massive rainfall, and hydrotechnical or agriculture loading (e.g., construction or heavy transport [47]). Therefore, we analysed various scenarios: in all hydraulic gradient variants, the k value in the tested effective radial stress range (10–90 kPa) decreased from 3 × 10⁻⁸ m/s to 1.6 × 10⁻¹⁰ m/s. If we take into account the temperature coefficient (for 10 °C), the lowest value would be 1.2 × 10⁻¹⁰ m/s. Thus, we can hypothesize that there is a difference in the hydraulic conductivity of 2.5 orders of magnitude between the exemplary warmer surface peat zone (and at lower stress states) and the colder, deeper zones (under higher stress states).
The study proved that the k values decreased with an increasing magnitude of stress in power mode (Figure 8 and Figure 9). For higher hydraulic gradient values (i = 10, 25), the correlation factors are quite good. There is also a visible association between the higher hydraulic gradients and the higher k formula coefficients, as well as the higher power values. Nevertheless, we should remember that the correlation coefficient here is for the trend line value of k (it relates to mean values). In the case of the lowest analysed hydraulic gradient (i = 5), the correlation factor is low. This result shows that under the conditions of low hydraulic gradient values and triaxial stress state conditions, the complex structure of the organic soil can play a primary role as a k-value driving factor and so differentiates the permeability properties. There was insufficient data to justify any correlation formula for the tests with the highest hydraulic gradient (Figure 8D–F). However, Figure 8D shows a decrease in the hydraulic conductivity at high effective confining pressures of a similar value. This indicates that the structure of the peat samples reached a similar compression.
To answer the question about confining pressure or hydraulic gradient having a higher influence on hydraulic conductivity, generalized relations (a compilation of these three parameters) are presented in Figure 9. This figure is based on the mean results from the stage Figure 7. In analysing this graph, in addition to the trends formulated earlier, a rather high variability of k expressed by a low correlation coefficient (regarding individual tests) may be indicated. Such hydraulic conductivity characteristics may be an argument for distinguishing different layers/zones with different hydraulic conductivities. This will result in different groundwater flows: a higher flow in the near-surface peat zones in contact with surface water (Biebrza River) and a lower vertical flow.
Before each confining pressure increase, there were long-term consolidation stages. The results of these five consolidation stages (with a final σ3′ = 90 kPa) provide a compacted peat structure (photo of Sample #1—Figure 9) with implications for the reduction of k values.
Figure 10 presents the changes in the mean k value (from all four samples) in reference to the increasing hydraulic gradient for various options of effective isotropic stress during particular permeability stage tests. The theoretical expectation was to observe no strong influence of the hydraulic gradient on the k values—just a slight increase that indicates the issue of exceeding the initial gradient. Nevertheless, the influence of the isotropic stress intensity on the k value was once again visible. Thus, the stress state is the main driving factor affecting the k values, followed by the hydraulic gradient in the context of the initial gradient. Deeper-located peat layers are usually characterized by a higher compaction and a higher degree of decomposition. Therefore, these structural factors should also be taken into account when considering the factors that shape the low permeability of peat.
Long-term, multi-stage permeability tests with a relatively high triaxial stress state showed a clearly impact on the peat structure (Figure 9). With this impact, the organic soil becomes more compacted, and the free spaces, microporosity, and loose plant fibres are modified into a more homogeneous system of water flow paths. Thus, due to the “sensitivity” of their structure, peats can differentiate into separate hydrogeological units (or subunits) vertically and horizontally. Such deep peat soils may constitute a more impervious material than the subsurface one.
Compared to tests of peat soils in Poland [4,19,20], the results described above are on the lower end of the range of hydraulic conductivity values. Similarly, compared to worldwide published results (e.g., [22,23,24]), they are below the values determined by various direct and indirect lab and field methods. Such a trend was also noted with reference to slug tests in eight observational wells located in the study area [10]. Based on the field test, the k minimum value of peat from the Upper Basin of the Biebrza Valley was 4 × 10⁻⁶ m/s (maximum value 9.2 × 10⁻⁵ m/s). We believe the reason for such a high difference may be the presence of high-permeability interlayers (loose peat or more sand) during the field tests. In the broader context, when trying to clarify the variable infiltration characteristics, it is also supportive to consider the biological aspects, such as plant species, their decomposition (in specific aeration and hydration zones), and their types. In the aforementioned study [10], based on slug test, and in eight (other) observational wells, the hydraulic conductivity of the mineral layer underlying the analysed peat (which also continues in the nearby hills, having outcrops there as well) was determined (from 0.33 × 10⁻⁴ m/s to 9.81 × 10⁻⁴ m/s; average value 2.11 × 10⁻⁴ m/s). This higher value plays a positive role in the case of feeding by the water of the Biebrza River (gaining river type) as well as the peat in the river valley.
Despite the analysed peat having very high water-accumulation capacity and a lack of typical aquitard features (marginal water yielding), it has no such unambiguous aquifer features. Undoubtedly, the complexity and susceptibility to a change in organic structure are favourable for water retention (or carbon dioxide and methane accumulation caused by organic matter), but they also complicate free water flow. Such circumstances are the reasons for which peats stabilize the water resources of the environment, which is important for the range of ecosystems.
The results of this study contribute to the discussion surrounding the amount of atmospheric water inflow vis lateral tributaries and/or from lower confined aquifers in the context of groundwater and surface water interaction. Eventually, we can propose a possible change in groundwater flow conception in the vicinity of the river Biebrza. The dominant water flow into the river would be a shallow subsurface flow and a longer deep flow through the mineral aquifers that underlying the peat (Figure 11).

4. Conclusions

Despite the tremendous natural and engineering importance of a peat across landscapes, the properties of peat soils are not regionally recognized in detail. This study provides some of the first laboratory results of exemplary peat samples from the Upper Basin of the Biebrza Valley (SE Poland), which remains one of the Europe’s most valuable peatlands. Further, the research was oriented at a specific test procedure of peat permeability as a driver for the landform development of wetlands.
The study material had relatively high decomposition rate (around 60%), a mean organic matter content of approximately 86%, a dark brown/black colour, a mean bulk density of 1.028 g/cm3, a mean water content of 499%, and a mean ash content of 14% (in the mineral-addition-dominant fraction of fine sand). The samples were collected below the groundwater table from a depth of ~0.5 m. Groundwater in the sampling site had average electrical conductivity EC ≈ 475 μS/cm and a pH ≈ 7.2 indicating feasible hydrological conditions for sustaining fen-type of peatlands.
Stepwise permeability tests in a triaxial compression apparatus were performed in a full water saturation state and with isotropic consolidation stages. A few dozen long-term permeability tests provided low hydraulic conductivity values that corresponded to a relatively high degree of decomposition. Nevertheless, the stress intensity (effective confining pressure) is the key factor responsible for the hydraulic conductivity (k) value. Due to buoyancy, low loading, and compressibility, this type of soft organic soil (especially in near-surface zones) may have k values that are two orders of magnitude higher than drained or compacted peat (also with higher bearing capacities).
The k values of the selected peat materials from the sampling site (in the tested stepwise increasing mode of effective confining pressure variants: σ3′ = 10, 15, 30, 45, 90 kPa with a hydraulic gradient i = 5, 10, 25, 40, 55, 85) decreased from 3 × 0−8 m/s to 1.6 × 10⁻¹⁰ m/s. Considering the temperature coefficient (for 10 °C), the lowest value was 1.2 × 10⁻¹⁰ m/s. Compared to other Polish peat tests, the determined k values are at the lower end of the range of hydraulic conductivity values. Moreover, the hydraulic conductivity of the analysed samples determined in the laboratory was lower than the field test results (slug tests in the study site), where k values were found to be from 4 × 10⁻⁶ m/s to 9.2 × 10⁻⁵ m/s. A possible reason for the difference may lie in the high-permeability interlayers (loose and not decomposed peat or more sand).
The research material did not present features of typical mineral aquifer materials. Although very high porosities and organic matter content are favourable for water accumulation and carbon sequestration, the characterized peat showed relatively low hydraulic conductivity values. Thus, in the case of the formation of the analysed organic soil, they differentiate groundwater flow, as it complicates intense contact with surface water.
The outcomes of this study should be followed by a regional generalizing study that uses more samples from different places and depths.

Author Contributions

Conceptualization, Ł.K., G.S. and M.G.-Ł.; methodology, Ł.K.; software, G.S., M.G.-Ł. and Ł.K.; validation, M.G., M.J. and Ł.K.; formal analysis, M.G.-Ł. and Ł.K.; investigation, Ł.K. and J.S.; resources, Ł.K. and G.S.; data curation, Ł.K. and G.S.; writing—original draft preparation, Ł.K., G.S. and M.G.-Ł.; writing—review and editing, Ł.K. and M.G. and M.J.; visualization, Ł.K. and G.S.; project administration, Ł.K., G.S. and M.G.-Ł.; funding acquisition, M.G.-Ł., Ł.K. and G.S. All authors have read and agreed to the published version of the manuscript.

Funding

The research results presented in the article were carried out thanks to funding from the FORCE GRIEG grant No. 2019/34/H/ST10/00711 funded by the National Science Centre (Poland) and Dean’s Grant No. 504/04612, obtained at the Faculty of Building Services, Hydro and Environmental Engineering of the Warsaw University of Technology.

Acknowledgments

We thank Grzegorz Kurzawski for help in laboratory examination of peat samples.

Conflicts of Interest

The authors declare no conflict of interest.

References

  1. Karlsson, R.; Hansbo, S. Soil Classification and Identification; Swedish Council for Building Research: Stockholm, Sweden, 1984; 50p. [Google Scholar]
  2. Polish Standard PN-86/B-02480; The Building Soils—The Definitions, Symbols, the Division and Description of Soils. Polish Committee for Standardization: Warsaw, Poland, 1986; 13p.
  3. Haynes, R.H. The Canadian System of Soil Classification; NRC CNRC: Ottawa, Canada, 1998; 188p.
  4. Kaczyński, R.R. Engineering-Geological Conditions in Poland; PIG-PIB: Warsaw, Poland, 2017; 396p. [Google Scholar]
  5. Joosten, H.; Clarke, D. Wise Use of Mires and Peatlands; International Mire Conservation Group and International Peat Society: Totness, UK, 2002; 304p. [Google Scholar]
  6. Jefferson, I.; Murray, E.J.; Faragher, E.; Fleming, P.R. Proceedings of the Symposium Held at the Nottingham Trent University School of Property and Construction on 8 November 2001; Thomas Telford: London, UK, 2001; 211p. [Google Scholar]
  7. Kellner, R. Wetlands—Different Types, Their Properties and Functions; Uppsala University: Uppsala, Sweden, 2003; 69p. [Google Scholar]
  8. Labadz, J.; Allott, T.; Evans, M.; Butchr, D.; Billett, M.; Stainer, S.; Yallop, A.; Jones, P.; Innerdale, M.; Harmon, N.; et al. Peatland Hydrology; Scientific Review Commissioned by the IUCN UK Peatland Programme’s Commission of Inquiry on Peatlands: Edinburgh, UK, 2010; 52p. [Google Scholar]
  9. Anibas, C.; Verbeiren, B.; Buis, K.; Chormański, J.; De Doncker, L.; Okruszko, T.; Meire, P.; Batelaan, O. A hierarchical approach on groundwater-surface water interaction in wetlands along the upper Biebrza River, Poland. Hydrol. Earth Syst. Sci. 2012, 16, 2329–2346. [Google Scholar] [CrossRef] [Green Version]
  10. Grodzka-Łukaszewska, M.; Sinicyn, G.; Grygoruk, M.; Mirosław-Świątek, D.; Kardel, I.; Okruszko, T. The role of the river in the functioning of marginal fen: A case study from the Biebrza Wetlands. PeerJ 2022, 10, e13418. [Google Scholar] [CrossRef] [PubMed]
  11. Stachowicz, M.; Manton, M.; Abramchuk, M.; Banaszuk, P.; Jarašius, L.; Kamocki, A.; Povilaitis, A.; Samerkhanova, A.; Schäfer, A.; Sendžikaitė, J.; et al. To store or to drain—To lose or to gain? Rewetting drained peatlands as a measure for increasing water storage in the transboundary Neman River Basin. Sci. Total Environ. 2022, 829, 154560. [Google Scholar] [CrossRef]
  12. Morris, P.J.; Davies, M.L.; Baird, A.J.; Balliston, N.; Bourgault, M.-A.; Clymo, R.S.; Fewster, R.E.; Furukawa, A.K.; Holden, J.; Kessel, E.; et al. Saturated Hydraulic Conductivity in Northern Peats Inferred From Other Measurements. Water Resour. Res. 2022, 58, e2022WR033181. [Google Scholar] [CrossRef]
  13. Mesri, G.; Ajlouni, M. Engineering properties of fibrous peats. J. Geotech. Geoenvironmental Eng. 2007, 133, 850–866. [Google Scholar] [CrossRef]
  14. Long, M.; Paniagua, P.; Grimstad, G.; Traffor, A.; Degago, S.; L’Heureux, J.-S. Engineering properties of Norwegian peat for calculation of settlements. Eng. Geol. 2022, 308, 106799. [Google Scholar] [CrossRef]
  15. Herbich, P.; Ćwiertniewska, Z.; Fert, M.; Mordzonek, G.; Węglarz, D. Mapa Hydrogeologiczna Polski w Skali 1:50 000 Udostępnianie, Weryfikacja, Aktualizacja i Rozwój. Instrukcja (Hydrogeological Map of Poland on a Scale of 1:50,000 Sharing, Verification, Updating and Development. Instruction); PGI-NRI: Warsaw, Poland, 2004; 125p.
  16. Herbich, P.; Kapuściński, J.; Nowicki, K.; Prażak, J.; Skrzypczyk, L. Metodyka Wyznaczania Obszarów Ochronnych Głównych Zbiorników Wód Podziemnych dla Potrzeb Planowania i Gospodarowania Wodami w Obszarach Dorzeczy (Methodology for Establishing Protected Areas of Major Groundwater Reservoirs for Planning and Water Management in River Basin Districts); Polish Ministry of Environment: Warsaw, Poland, 2009; 59p.
  17. Baird, A.J.; Low, R.; Young, D.; Swindles, G.T.; Lopez, O.R.; Page, S.E. High permeability explains the vulnerability of the carbon store in drained tropical peatlands. Geophys. Res. Lett. 2017, 44, 1333–1339. [Google Scholar] [CrossRef] [Green Version]
  18. Suhip, M.A.A.B.H.; GÖdeke, S.H.; Cobb, A.R.; Sukri, R.S. Seismic refraction study, single well test and physical core analysis of anthropogenic degraded Peat at the Badas Peat Dome, Brunei Darussalam. Eng. Geol. 2020, 273, 105689. [Google Scholar] [CrossRef]
  19. Rydelek, P. Peatlands of Lubartów Upland as the potential natural geological barriers. Biul. PIG 2011, 446, 407–416. [Google Scholar]
  20. Chmielewska, I. Coefficient of permeability of peat. Bud. Inżynieria Sr. 2018, 9, 15–21. [Google Scholar]
  21. Myślińska, E. Laboratory Testing of Land and Soil, 3rd ed.; Wyd. UW: Warsaw, Poland, 2016; 280p. [Google Scholar]
  22. Wong, L.S.; Hashim, R.; Ali, F.H. A Review on Hydraulic Conductivity and Compressibility of Peat. J. Appl. Sci. 2009, 9, 3207–3218. [Google Scholar] [CrossRef]
  23. Wdowska, M.K.; Lipiński, M.J.; Jaroń, Ł. Selection of a method for determination of permeability characteristics of cohesive soils. Acta Sci. Pol. Archit. 2017, 16, 47–57. [Google Scholar]
  24. Liu, H.; Lennartz, B. Hydraulic properties of peat soils along a bulk denstiy gradeint—A meta study. Hydrol. Process. 2018, 33, 101–114. [Google Scholar] [CrossRef] [Green Version]
  25. Mięsiak-Wójcik, K.; Turczyński, M.; Sposób, J. Diverse Sediment Permeability and Implications for Groundwater Exchange in Closed Lake-Wetland Catchments (West Polesie, East Poland). Wetlands 2018, 38, 779–792. [Google Scholar] [CrossRef] [Green Version]
  26. Van Loon, A.H.; Schot, P.P.; Griffioen, J.; Bierkens, M.F.P.; Batelaan, O.; Wassen, M.J. Throughflow as a determining factor for habitat contiguity in a near-natural fen. J. Hydrol. 2009, 379, 30–40. [Google Scholar] [CrossRef]
  27. Menberu, M.W.; Marttila, H.; Ronkanen, A.-K.; Torabi Haghighi, A.; Kløve, B. Hydraulic and physical properties of managed and intact peatlands: Application of the van Genuchten-Mualem models to peat soils. Water Resour. Res. 2021, 57, e2020WR028624. [Google Scholar] [CrossRef]
  28. Wang, M.; Liu, H.; Lennartz, B. Small-scale spatial variability of hydro-physical properties of natural and degraded peat soils. Geoderma 2021, 399, 115123. [Google Scholar] [CrossRef]
  29. Gnatowski, T.; Szatyłowicz, J.; Brandyk, T.; Kechavarzi, C. Hydraulic properties of fen peat soils in Poland. Geoderma 2010, 154, 188–195. [Google Scholar] [CrossRef]
  30. Wierzbicki, G.; Grygoruk, M.; Grodzka-Łukaszewska, M.; Bartold, P.; Okruszko, T. Mire Development and Disappearance due to River Capture as Hydrogeological and Geomorphological Consequences of LGM Ice-Marginal Valley Evolution at the Vistula-Neman Watershed. Geosciences 2020, 10, 363. [Google Scholar] [CrossRef]
  31. Kossowska-Cezak, U. Climate of the Biebrza ice-margin Valley. Pol. Ecol. Stud. 1984, 10, 253–270. [Google Scholar]
  32. Krzywicki, T. Detailed Geological Map of Poland—Sheet Lipsk; PIG-PIB: Warsaw, Poland, 2003. [Google Scholar]
  33. Żurek, S. The Origin of the Biebrza Valley Wetlands; IGiPZ PAN: Warsaw, Poland, 1975; 107p. [Google Scholar]
  34. Pałczyński, A. Jaćwieskie Marshes. Biebrza River Valley; Annuals (Nauk Roln. Ser. D-Monografie 145); PWN: Warsaw, Poland, 1975; 252p. [Google Scholar]
  35. Oświt, J.; Pacowski, R.; Żurek, S. Characteristics of more important peat species in Poland. In Proceedings of the V International Peat Congress—Peatlands and Their Utilization in Poland, Poznań, Poland, 20–26 September 1976. [Google Scholar]
  36. Black, D.K.; Lee, K.L. Saturating laboratory samples by back pressure. J. Soils Mech. Found. Div. 1973, 99, 75–93. [Google Scholar] [CrossRef]
  37. Head, K.H.; Epps, R. Manual of Soil Laboratory Testing, Volume 3: Effective Stress Tests, 3rd ed.; Whittles Publishing: Dunbeath, UK, 2014; 414p. [Google Scholar]
  38. Romero-Ruiz, A.; Linde, N.; Keller, T.; Or, D. A review of geophysical methods for soil structure characterization. Rev. Geophys. 2018, 56, 672–697. [Google Scholar] [CrossRef] [Green Version]
  39. International Standard ISO 17892-9:2018; Geotechnical Investigation and Testing—Laboratory Testing of Soil—Part 9: Consolidated Triaxial Compression Tests on Water Saturated Soils. International Organization for Standardization: Geneva, Switzerland, 2018; 25p.
  40. International Standard ISO 17892-11:2019; Geotechnical Investigation and Testing—Laboratory Testing of Soil—Part 11: Permeability Tests. International Organization for Standardization: Geneva, Switzerland, 2019; 20p.
  41. Lade, P.V. Triaxial Testing of Soils; Wiley Blackwell: Chichester, UK, 2016; 500p. [Google Scholar]
  42. Malloy, S.; Price, J.S. Consolidation of gyttja in a rewetted fen peatland: Potential implications for restoration. Mires Peat 2017, 19, 1–15. [Google Scholar]
  43. Gilbert, P.A. Computer Controlled Microwave Oven System for Rapid Water Content Determination. Technical Report GL-88-21; Department of the Army Waterways Experiment Station: Vicksburg, MS, USA, 1988. [Google Scholar]
  44. Ilnicki, P. Peatlands and Peat; AR: Poznań, Poland, 2002; 606p. (In Polish) [Google Scholar]
  45. Montzka, C.; Herbst, M.; Weihermüller, L.; Verhoef, A.; Vereecken, H. A global data set of soil hydraulic properties and sub-grid variability of soil water retention and hydraulic conductivity curves. Earth Syst. Sci. Data 2017, 9, 529–543. [Google Scholar] [CrossRef] [Green Version]
  46. Zhang, Y.; Schaap, M.G. Estimation of saturated hydraulic conductivity with pedotransfer functions: A review. J. Hydrol. 2019, 575, 1011–1030. [Google Scholar] [CrossRef]
  47. Van Putte, N.; Temmerman, S.; Verreydt, G.; Seuntjens, P.; Maris, T.; Heyndrickx, M.; Boone, M.; Joris, I.; Meire, P. Groundwater dynamics in a restored tidal marsh are limited by historical soil compaction. Estuar. Coast. Shelf Sci. 2020, 244, 106101. [Google Scholar] [CrossRef]
  48. Rezanezhad, F.; Price, J.S.; Quinton, W.L.; Lennartz, B.; Milojevic, T.; Van Cappellen, P. Structure of peat soils and implications for water storage, flow and solute transport: A review update for geochemists. Chem. Geol. 2016, 429, 75–84. [Google Scholar] [CrossRef]
Figure 1. Example photos of peat samples of various structure from different locations in the Biebrza valley area.
Water 15 01064 g001
Figure 2. (A) Localization map, (B) a cross-section of the peat-forming region modified from [32] where the analysed samples were collected, and (C) the sampling site.
Water 15 01064 g002
Figure 3. Peat study material (Samples #2 and #3): (A) sampler core, (B) soil after it was pulled out of the sampler, (C) peat with natural water content, (D) dried peat (after water content test), (E) trimmed sample in the rubber membrane, and (F) sample inside a triaxial cell. Photos: Ł. Kaczmarek, M. Grodzka-Łukaszewska.
Water 15 01064 g003
Figure 4. The applied triaxial tests scheme for determining the hydraulic conductivity values.
Water 15 01064 g004
Figure 5. Triaxial compression apparatus for permeability tests.
Water 15 01064 g005
Figure 6. Grain size distribution curves of mineral residues from burning peat samples.
Water 15 01064 g006
Figure 7. Workflow of results processing and interpretations stages.
Water 15 01064 g007
Figure 8. Detail characteristics of k value of peat from the Upper Biebrza Valley in the function of effective radial stress in various hydraulic gradient cases derived from triaxial tests: (A) i = 5, (B) i = 10, (C) i = 25, (D) i = 40, (E) i = 55, (F) i = 85.
Water 15 01064 g008
Figure 9. Generalized relationships between the average k value of peat from the analysed Biebrza region as a function of the effective radial stress and hydraulic gradient values derived from triaxial tests. In the background is an exemplary photo of Sample 1 after triaxial permeability tests.
Water 15 01064 g009
Figure 10. Relationship between average k values of peat from the Upper Biebrza Valley as a function of hydraulic gradient value for various values of effective radial stress (derived from triaxial tests).
Water 15 01064 g010
Figure 11. A schematic conception of groundwater flow into the Biebrza river (modified from [10]).
Water 15 01064 g011
Table 1. Sample point locations in the WGS84 system.
Sample No.LatitudeLongitude
153°42′14.7″23°26′43.5″
253°42′11.5″23°27′53.2″
3
453°42′19.2″23°26′42.1″
Table 2. Results of stepwise permeability tests in triaxial apparatus.
Effective Confining Pressure σ3′ [kPa]Hydraulic Gradient i [–]Water Flow
Direction
Hydraulic Conductivity k [m/s]
Stage LevelMean ValueTemperature Correction α for T = 10 °C
1053.5 × 10−8; 1.2 × 10−82.7× 10−8; 1.0 × 10−82.1 × 10−8; 7.9 × 10⁻⁹
1.8 × 10⁻⁸; 8.1·× 10−9
1551.8 × 10−8; 3.4 × 10⁻⁸;
7.7 × 10⁻⁸; 6.3 × 10⁻⁹
1.4 × 10⁻⁸; 2.6 × 10⁻⁸;
4.2 × 10⁻⁸; 5.4 × 10⁻⁹
1.1 × 10⁻⁸; 2.0 × 10⁻⁸;
3.2 × 10⁻⁸; 4.2 × 10⁻⁹
9.9 × 10⁻⁹; 1.8 × 10⁻⁸;
7.7 × 10⁻⁹; 4.5 × 10⁻⁹
101.9 × 10⁻⁸; 3.6 × 10⁻⁸;
9.2 × 10⁻⁸; 6.3 × 10⁻⁹
1.7 × 10⁻⁸; 3.1 × 10⁻⁸;
5.8 × 10⁻⁸; 6.0 × 10⁻⁹
1.3 × 10⁻⁸; 2.4 × 10⁻⁸;
4.4 × 10⁻⁸; 4.6 × 10⁻⁹
1.4 × 10⁻⁸; 2.6 × 10⁻⁸;
2.3·× 10−8; 5.7 × 10⁻⁹
3054.8 × 10−9; 3.0 × 10⁻⁸; 1.9 × 10−94.0 × 10−9; 1.6 × 10⁻⁸; 2.0 × 10−93.1 × 10−9; 1.3 × 10⁻⁸; 2.2 × 10⁻⁹
3.2 × 10⁻⁹; 2.8 × 10⁻⁹; 2.1 × 10⁻⁹
104.1 × 10⁻⁹; 2.2 × 10⁻⁸; 1.8 × 10−93.6 × 10−9; 1.4 × 10⁻⁸; 1.6 × 10−92.8 × 10−9; 1.1 × 10⁻⁸; 1.2 × 10⁻⁹
3.1 × 10⁻⁹; 6.4 × 10⁻⁹; 1.4 × 10⁻⁹
255.2 × 10⁻⁹; 1.1 × 10⁻⁷; 2.5 × 10−95.4 × 10−9; 6.0 × 10⁻⁸; 2.3 × 10−94.2 × 10−9; 4.6 × 10⁻⁸; 1.8 × 10⁻⁹
5.6 × 10⁻⁹; 1.6 × 10⁻⁸; 2.1 × 10⁻⁹
4552.3 × 10−9; 1.1 × 10⁻⁸; 1.7 × 10−92.0 × 10−9; 8.2 × 10⁻⁹; 1.9 × 10−91.5 × 10−9; 6.3 × 10⁻⁹; 1.5 × 10⁻⁹
1.6 × 10⁻⁹; 5.1 × 10⁻⁹; 2.2 × 10⁻⁹
102.2 × 10⁻⁹; 9.3 × 10⁻⁹; 1.1 × 10−91.8 × 10−9; 6.0 × 10⁻⁹; 1.1 × 10−91.4 × 10−9; 4.6 × 10⁻⁹;
8.1 × 10⁻¹⁰
1.5 × 10⁻⁹; 2.6 × 10⁻⁹; 1.0 × 10⁻⁹
251.9 × 10⁻⁹; 8.8 × 10⁻⁹; 9.9 × 10−102.0 × 10⁻⁹; 7.1 × 10⁻⁹; 8.7 × 10−101.5 × 10⁻⁹; 5.5 × 10⁻⁹;
6.7 × 10⁻¹⁰
2.1 × 10⁻⁹; 5.5 × 10⁻⁹; 7.4 × 10⁻¹⁰
402.8 × 10⁻⁹; 1.0 × 10⁻⁸; 1.1 × 10−92.9 × 10−9; 7.4 × 10⁻⁹; 9.2 × 10−102.2 × 10⁻⁹; 5.7 × 10⁻⁹;
7.1 × 10⁻¹⁰
2.9 × 10⁻⁹; 4.3 × 10⁻⁹; 7.9 × 10⁻¹⁰
9052.1 × 10−10; 2.1 × 10−101.9 × 10 −10; 1.6 × 10−101.4 × 10⁻¹⁰;
1.2 × 10⁻¹⁰
1.7 × 10 −10; 1.0 × 10⁻¹⁰
105.2 × 10⁻¹⁰; 3.1 × 10−103.5 × 10⁻¹⁰; 4.3 × 10−102.7 × 10⁻¹⁰;
3.3 × 10⁻¹⁰
1.7 × 10⁻¹⁰; 5.5 × 10⁻¹⁰
254.5 × 10⁻¹⁰; 2.3 × 10−104.3 × 10⁻¹⁰; 2.8 × 10−103.3 × 10⁻¹⁰; 2.2 × 10⁻¹⁰
4.1 × 10⁻¹⁰; 3.4 × 10⁻¹⁰
405.6 × 10⁻¹⁰; 3.6 × 10−103.1 × 10⁻¹⁰; 4.2 × 10−102.4 × 10⁻¹⁰; 3.2 × 10⁻¹⁰
7.2 × 10⁻¹¹; 4.8 × 10⁻¹⁰
555.8 × 10⁻¹⁰; 3.2 × 10−104.8 × 10⁻¹⁰; 3.6 × 10−103.7 × 10⁻¹⁰; 2.8 × 10⁻¹⁰
5.6 × 10⁻¹⁰; 4.1 × 10⁻¹⁰
857.5 × 10⁻¹⁰; 5.1 × 10−107.2 × 10⁻¹⁰; 4.2 × 10−105.6 × 10⁻¹⁰; 3.2 × 10⁻¹⁰
6.9 × 10⁻¹⁰; 3.3 × 10⁻¹⁰
Sample number: 1; 2; 3; 4.
Disclaimer/Publisher’s Note: The statements, opinions and data contained in all publications are solely those of the individual author(s) and contributor(s) and not of MDPI and/or the editor(s). MDPI and/or the editor(s) disclaim responsibility for any injury to people or property resulting from any ideas, methods, instructions or products referred to in the content.

