1. Introduction
In recent years, the fuel cell has been one of the most efficient sources of energy production. A fuel cell is an electrochemical device that produces electricity and heat from the reaction between hydrogen and oxygen. A fuel cell is relatively quiet and silent, and for this reason, it is a suitable method for electricity production [
1]. In addition, fuel cells are used as new technology to produce power in gas turbines, and increases efficiency up to 60%, while in normal gas turbines, due to high losses in the combustion chamber, the efficiency is around 30% to 35%. Among the types of fuel cells, the solid oxide type is the best option for use in a gas turbine due to its high efficiency, low pollution, variety of fuel consumed, and, most importantly, the high temperature of the exhaust gas. For this reason, in recent years, this technology has received significant attention [
2,
3]. Although the research in the field of solid oxide fuel cells began in the late 1950s, the results of a simple solid oxide fuel cell model were published in the mid-1980s; therefore, the first articles in the field of solid oxide fuel cell hybrid systems were published in the early 1990s. The concept of using a gas turbine along with a fuel cell has been known for years, and much research has been conducted on it using the first law of thermodynamics. In 2000, Maserado Volubi conducted a conceptual study on the performance of hybrid Siskel [
4]. The mathematical model presented by them simulated the performance of the battery in a uniform and stable state. Costamagna et al. tested the design and performance of a system consisting of a gas metro turbine with heat recovery and a high-temperature solid oxide fuel cell [
5]. In addition, many other works have been conducted in this field by different researchers, such as Chan et al. [
6,
7]. Yang et al. [
8] considered two systems with internal and external fuel improvement and investigated the effect of limitations placed on the fuel cell stack temperature difference on their performance. Park et al. [
9] investigated the design and performance characteristics of a hybrid system, considering a specific gas turbine. In most of the aforementioned research, the performance of the combined system of the fuel cell and the gas turbine was investigated according to the first law of thermodynamics. Additionally, various other works have been carried out considering the relationship between the second law of thermodynamics and the system as well as each of its components, and examines their rate of irreversibility. Knowledge of the contribution of each component to the rate of irreversibility of the entire system can be a source of improvement and correction of the components and processes of the system. In two separate studies, Heli and colleagues [
10,
11] investigated the destruction of exergy and production entropy in a hybrid system. In this research, the fuel cell model was fully modeled with thermodynamic relations. The fuel used in the fuel cell was hydrogen. First, the electrochemical relationships of the fuel cell were modeled with the help of thermodynamic relationships, and then they were coupled with the gas turbine system. This modeling is written in the form of code in MATLAB software.
2. Materials and Methods
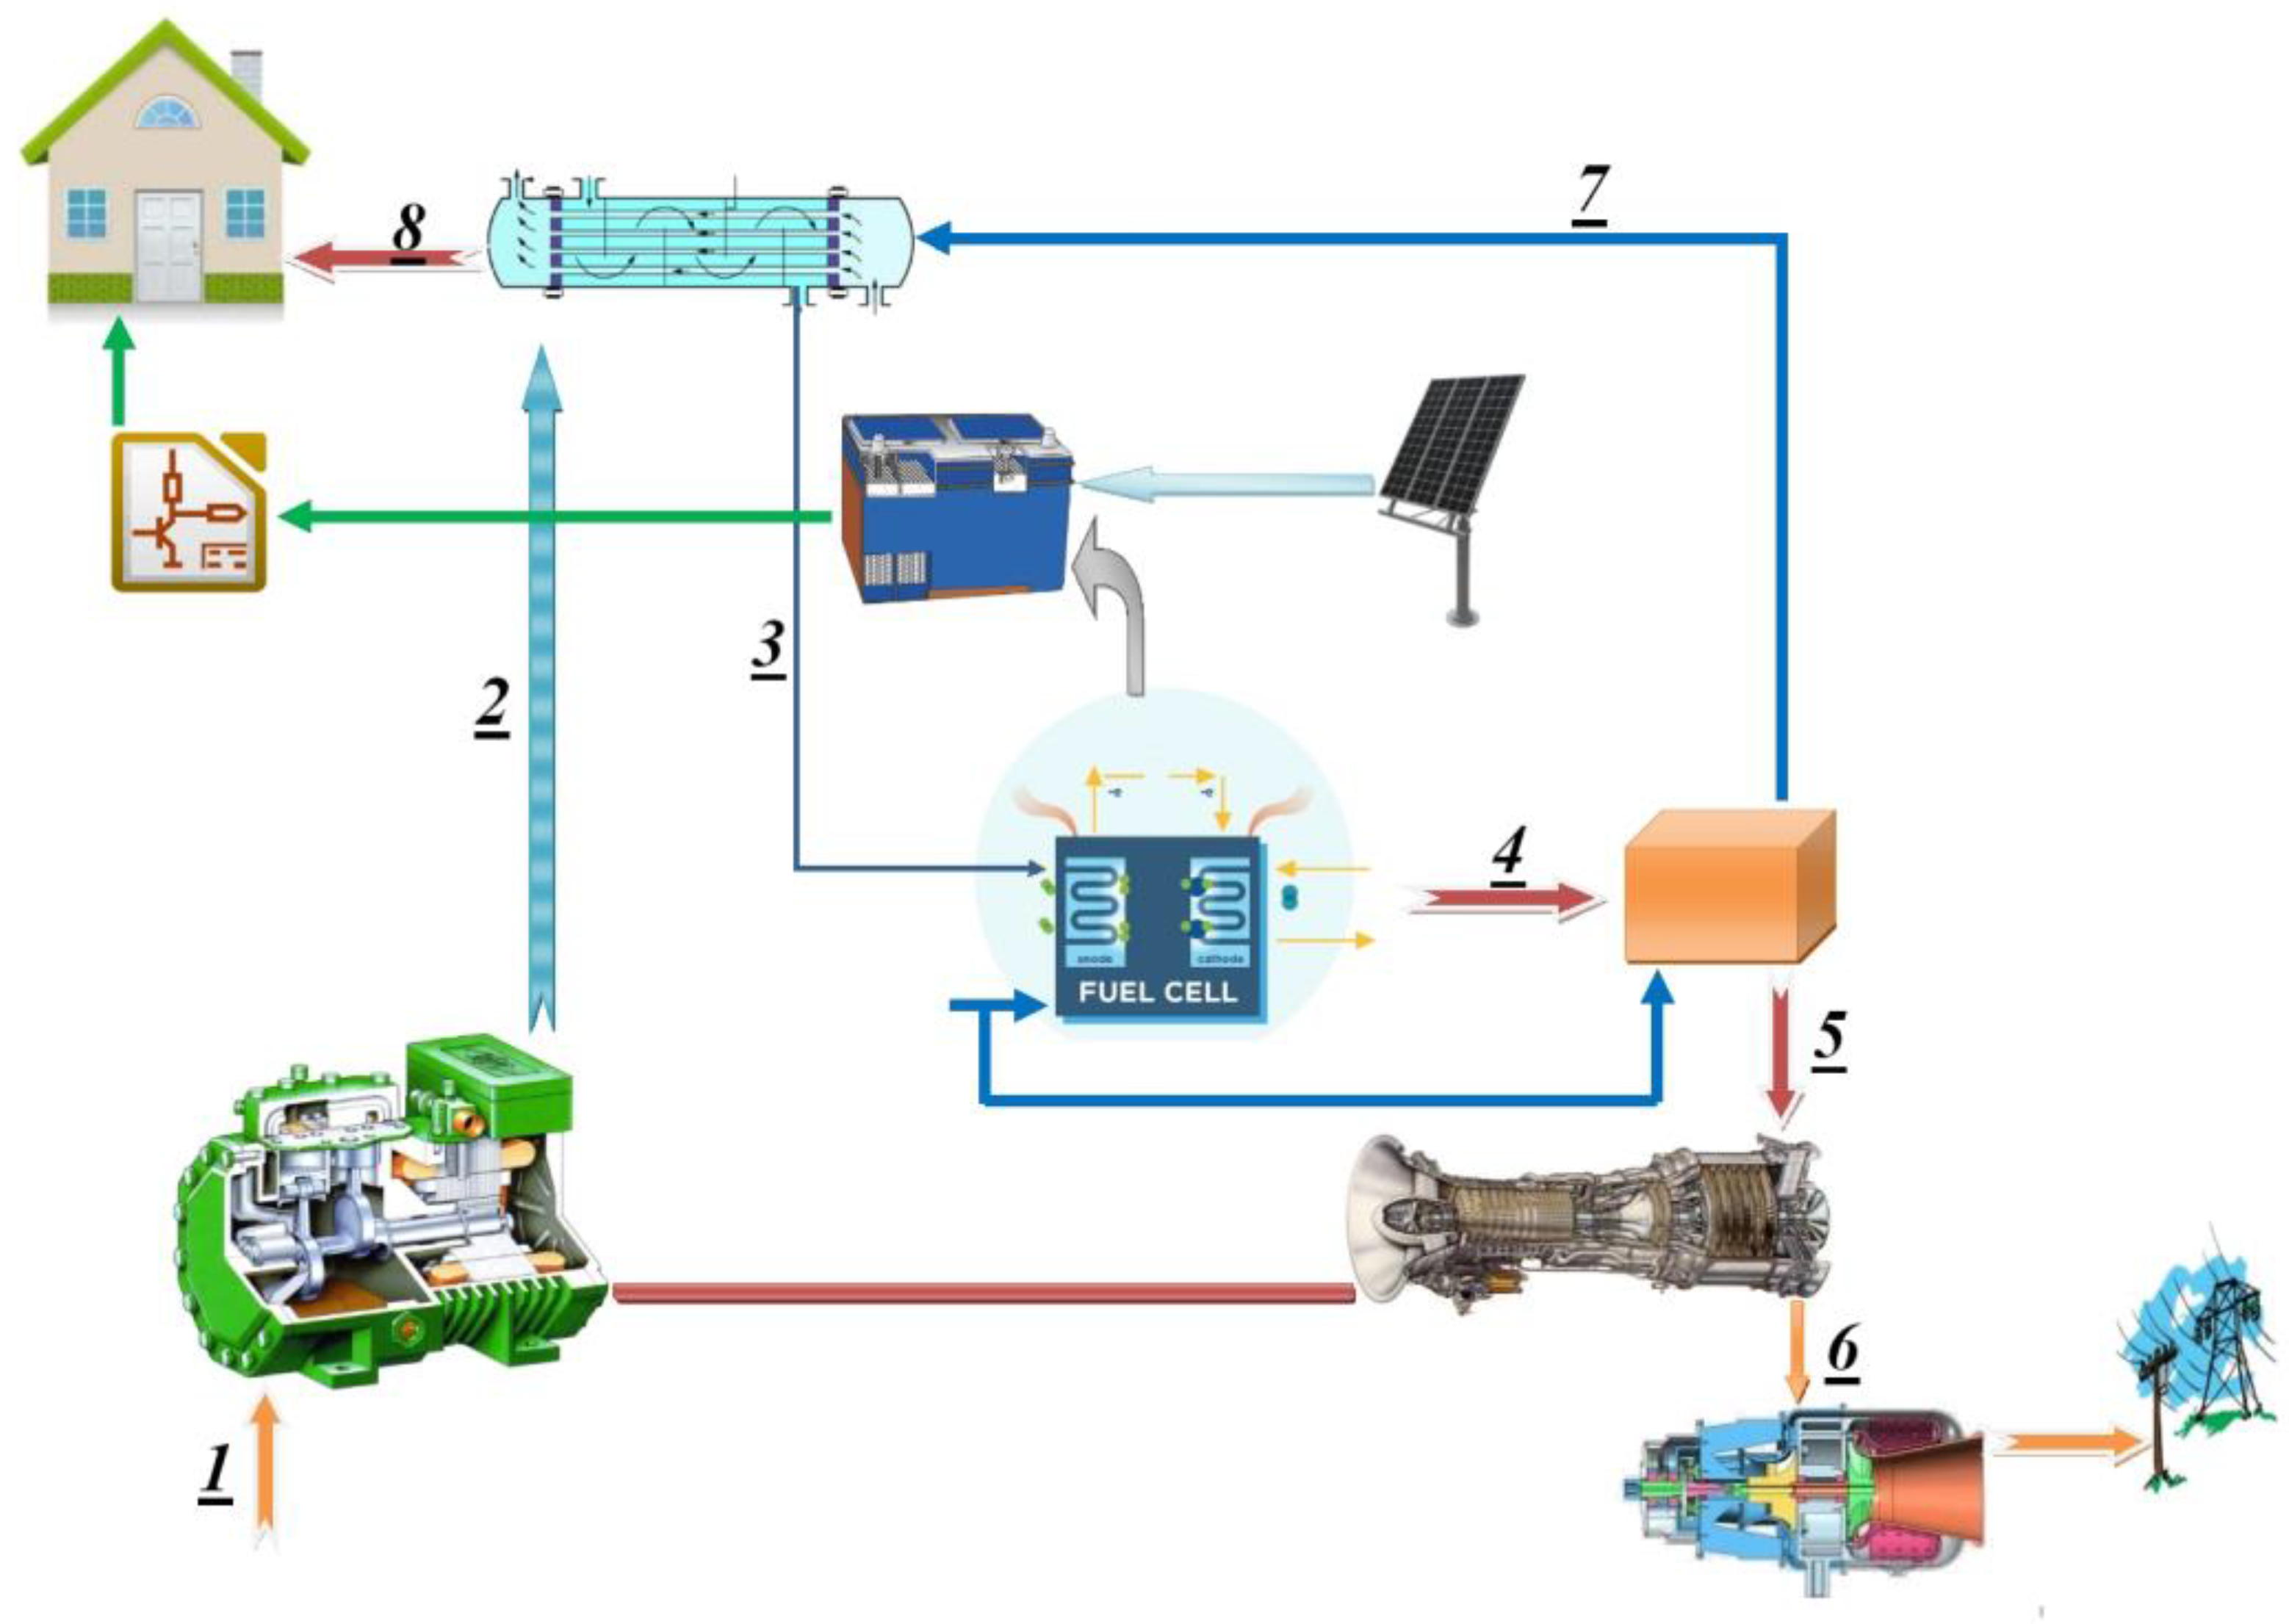
The studied system consists of 6 components: a compressor, a heat exchanger (regenerator), a fuel cell, a combustion chamber, a turbine, and a power turbine. In this system, air enters the compressor at point 1 and leaves in a compressed state at point 2. The compressed air enters the heat exchanger, and the temperature of the compressed air rises to point 3 by transferring heat from the hot flow of the turbine output. The heated air in the heat exchanger, and after exiting, enters the fuel cell and then its cathode. The fuel also enters the fuel cell. After performing the electrochemical reaction inside the fuel cell and generating power, the output goes to the combustion chamber and reacts with the other fuel that entered the combustion chamber; thus, high-temperature products are produced. The output of the combustion chamber enters the turbine at point 5; after turning the compressor, it enters the power turbine at point 6 and produces power. Then, it enters the regenerator at point 7, and after heating the incoming air for the battery, fuel enters the environment at point 8. The combined system is shown in
Figure 1. The boundary of the studied system includes the generation of electricity from the fuel cell and the power turbine, combustion reaction using a combustion chamber, feeding hydrogen fuel to the fuel cell, and storing energy using batteries.
2.1. Modeling of Gas Turbine Combined System with Solid Oxide Fuel Cell and Photovoltaic Cell
In this part, the equations governing the components of the gas turbine cycle combined with a solid oxide fuel cell are given for thermodynamic modeling. For thermodynamic modeling, the following hypotheses are considered: (1). All components of the gas turbine are assumed to be adiabatic; (2) the fluid flow is stable in all components; (3) changes in potential and kinetic energies are assumed to be zero; (4) the behavior of all gases is ideal; (5) effects related to turbine cooling are ignored.
2.2. Compressor Modeling
The air entering the compressor is ambient. The molar composition of air is considered to be 0.21 mol of oxygen and 0.79 mol of nitrogen. In combined systems, the air compressed by the compressor, after being heated by the heat exchanger, enters the cathode of the fuel cell. The compressor can be considered as a control volume, so its first law relationship will be as follows:
The power consumption of the compressor is provided through the supply turbine as follows:
The isentropic efficiency of the compressor is also defined as follows:
To analyze the second law of the system, with the input and output conditions, the production entropy rate during the condensation process is calculated as follows:
2.3. Heat Exchanger Modeling
Heat exchangers are widely used in industrial processes and have very diverse designs. The common point of all of them is that the performance of each one depends on the level of heat transfer, fluid properties, and flow shape. The heat exchanger efficiency can be written as follows [
12]:
The first law of thermodynamics for the heat exchanger is written as follows:
From Equation (6), the temperature of the hot gases exiting the cycle can be obtained. According to the conservation of mass, the entropy production rate in the heat exchanger is as follows:
2.4. Solid Oxide Fuel Cell Modeling
The solid oxide fuel cell model studied in this article is based on the developed tube solid oxide fuel cell model in [
13]. Electrochemical reactions in the anode and cathode occur based on the following relationships [
14,
15]
The famous Nernst equation is used to calculate the voltage of the fuel pebble, and is written as follows [
2]:
The maximum theoretical voltage is called open circuit voltage, and when there is no current in the circuit, the battery voltage will be equal to it. As can be seen, the maximum voltage of the battery increases with the increase in the concentration of the reactants.
2.5. Operating Voltage of Solid Oxide Fuel Cell
When the fuel cell works under the operating conditions of generating an external current, a voltage drop occurs in the battery, which causes the battery output voltage to always be lower than the maximum voltage value. The drops, which are usually referred to as polarization, are:
Therefore, the voltage measured in a practical fuel cell is usually lower than the reversible voltage. The operating voltage of the fuel cell is determined as follows:
In the above relationship, the voltage drop usually depends on the partial pressure of gases, temperature, and current density in a real fuel cell. In the following, the calculation of the voltage drop in the fuel cell is discussed.
2.5.1. Activation Polarization
Activation polarization depends on the speed of the electrochemical reaction on the electrode surface. In electrochemical reactions, such as chemical reactions, the reactants must pass the activation energy barrier. The loss resulting from activation polarization is significant at low current density and increases slightly with increasing current density. The activation polarization is expressed by the semi-empirical Butler–Volmer equation, as follows [
2]:
where
i is the electric current density and its unit is A/m
2. From Equation (11), it is not possible to directly obtain
Vact, but for a fuel cell with a hydrogen electrode, the value of α is assumed to equal to 0.5. The
Vact can be obtained from Equation (14) [
16,
17]:
On the other hand, the exchange current density is calculated from the semi-empirical relationship for anode and cathode [
16]:
Pnef atmospheric pressure is considered. The required constants are obtained from
Table 1.
2.5.2. Ohmic Polarization
This voltage drop is a result of the resistance of the electrodes and connecting surfaces against the flow of electrons and the resistance of the electrolytes against the flow of ions. Since this voltage drop is directly proportional to the current density of the battery, it is called ohmic polarization. As the current density of the battery increases, this voltage drop also gradually increases. Ohmic losses are highly dependent on temperature, especially in the case of the electrolytes, which is where most of the cell losses occur in this section. Therefore, the ohmic polarization for the anode, cathode, electrolyte, and internal connector are as follows [
18]:
A and B are fixed, and their values are 0.604 and 0.13, respectively. In addition, the specific resistance and thickness of each component of the fuel cell are solid oxide. The thickness value of each component is given in
Table 2. The diameter of the tubular solid oxide fuel cell is 22 mm. The connected width is 11 mm, and it is internal. Specific resistance is a function of temperature, and is obtained from the following empirical relationship [
17]:
The constants a and b related to Equation (21) are shown in
Table 2.
2.5.3. Concentration Polarization
If the reactants do not reach the electrode in a sufficient quantity, there will be a drop in the potential in the electrode and a concentration gradient will be witnessed. The reactive species in the fuel cell must be transported from the fuel and air channels through the porous medium of the electrode to the reaction site. In this case, the dominant transfer mechanism is permeation; in addition, the electrochemical reaction products that are created in the anode increase the concentration resistance after reducing the fuel concentration in this area. Many factors are effective in the formation of the concentration gradient, including slow penetration of gaseous reactants in the catalyst cavities, dissolution of reactants in the electrolyte, and slow exit of the reaction product from the electrolyte. In practice, the slow transfer of reactants to the active sites of the reaction slows down the process. Under normal battery performance conditions, the values related to this voltage drop are very low. In this case, the loss is more effective at high current density, because it is difficult to deliver enough fuel to the reaction sites. This polarization is expressed by a quantity called limiting current density, as follows:
The limiting current density is a current in which the fuel consumption rate is equal to the value at the time when the maximum fuel feeding rate is established, and this occurs when the concentration on the surface reaches zero, that is, all the reactants are consumed. Here, according to the reported work by Calise et al., the value of the limiting current density was considered equal to 9000 A/m
2 [
19].
The molar flow rate of hydrogen in an electrochemical reaction is directly proportional to the current density. By knowing the current density and using Faraday’s law, the molar rate of hydrogen can be obtained from the following equation.
N is the number of fuel cells. The amount of gases in the input and output of the fuel cell is balanced as follows:
Now, after calculating the above voltage drop, the working voltage of the battery is obtained using Equation (12). The direct power produced by the solid oxide fuel cell can be obtained from the following equation:
The first law of thermodynamics for a fuel cell can be written as follows:
which is the production power of the solid oxide fuel cell and the wasted heat from the system. The amount of wasted heat in each mass of the fuel cell can be obtained through the amount of voltage drop created in the fuel cell.
The entropy rate produced by the fuel cell can be obtained by Equation (33):
2.6. Combustion Chamber
The output products from the fuel cell, along with some of the fuel that did not react in the fuel cell, enter the combustion chamber along with the excess fuel. They react and produce high-temperature exhaust gases. When modeling the flow in the combustion chamber, it is assumed that the combustion process is a constant pressure process. It is also assumed that no energy loss occurs in the combustion chamber. The first law of thermodynamics for the combustion chamber can be written as follows [
20]:
Additionally, the rate of entropy produced in the combustion chamber is as follows:
2.7. Turbine
The turbine is responsible for supplying the work of the compressor and must be compatible with the compressor in terms of design. To model the turbine, it is necessary to consider it as a control volume.
The relation of the first law for the turbine is as follows:
The isentropic efficiency of the turbine is defined as follows:
The production entropy rate in the turbine is as follows:
2.8. Power Turbine
The power turbine has the task of generating power. For the power turbine, the first law of thermodynamics can be written as follows:
The rate of entropy produced in the power turbine is as follows:
2.9. Equilibrium Equations of the Combined System
The conservation of energy for the combined cycle can be written in the following form [
20]:
which is the heat produced in the combustion chamber and the wasted heat. The thermal efficiency of the combined cycle of a gas turbine with a fuel cell is defined as the ratio of the net power output to the input energy rate; therefore, the total thermal efficiency is defined as follows:
where
is the net power produced by the cycle, which is defined as follows:
To (40)
, and
is calculated as follows:
The production entropy of the whole system is equal to the sum of the production entropy of each component; therefore [
20]:
2.10. Photovoltaic Cell
The photovoltaic cell output power is calculable according to the operating temperature [
21]:
where P
pv refers to the power output under standard test conditions (STC) (kW), Y_PV stands for the rated capacity of the photovoltaic array, f
PV refers to PV derating factor (%), G
T denotes the solar irradiation striking the PV panel (kW/m
2), G
(T.STC) is the incident radiation under STC (1 kW/m
2), α
P represents the power temperature coefficient (%/°C), T
C is the PV cell temperature (°C), and T
(C.STC) denotes the temperature of the PV cell under STC (25 °C).
The following expression is used to obtain the PV cell temperature [
22]:
where T
a is the ambient temperature (°C), T
(c.NOCT) indicates the cell’s nominal operating temperature (°C), T
(a.NOCT) presents the ambient temperature at which NOCT is expressed (20 °C), G_T is the solar radiation striking the PV array (kW/m
2), G
(T.NOCT) is the solar radiation at which the NOCT is expressed (0.8 kW/m
2), τ denotes the cover’s solar transmittance over the PV array (%), α denotes the PV array solar absorptance (%), and η
mp is the PV array efficiency at its maximum power point (%) [
23]:
The main design parameters of the combined system performance conditions are shown in
Table 3.
3. Results
Table 4 shows the input and output of the steps of the block diagram related to
Figure 1 at the design point. According to the developed analysis, the net power obtained from the proposed energy system is equal to 2470 kW. The shares of SOFC and the gas turbine in the net power generation of the energy system are 72.9% and 27.1%, respectively. Additionally, almost 175 kJ/kg of electrical power is consumed through the compressor.
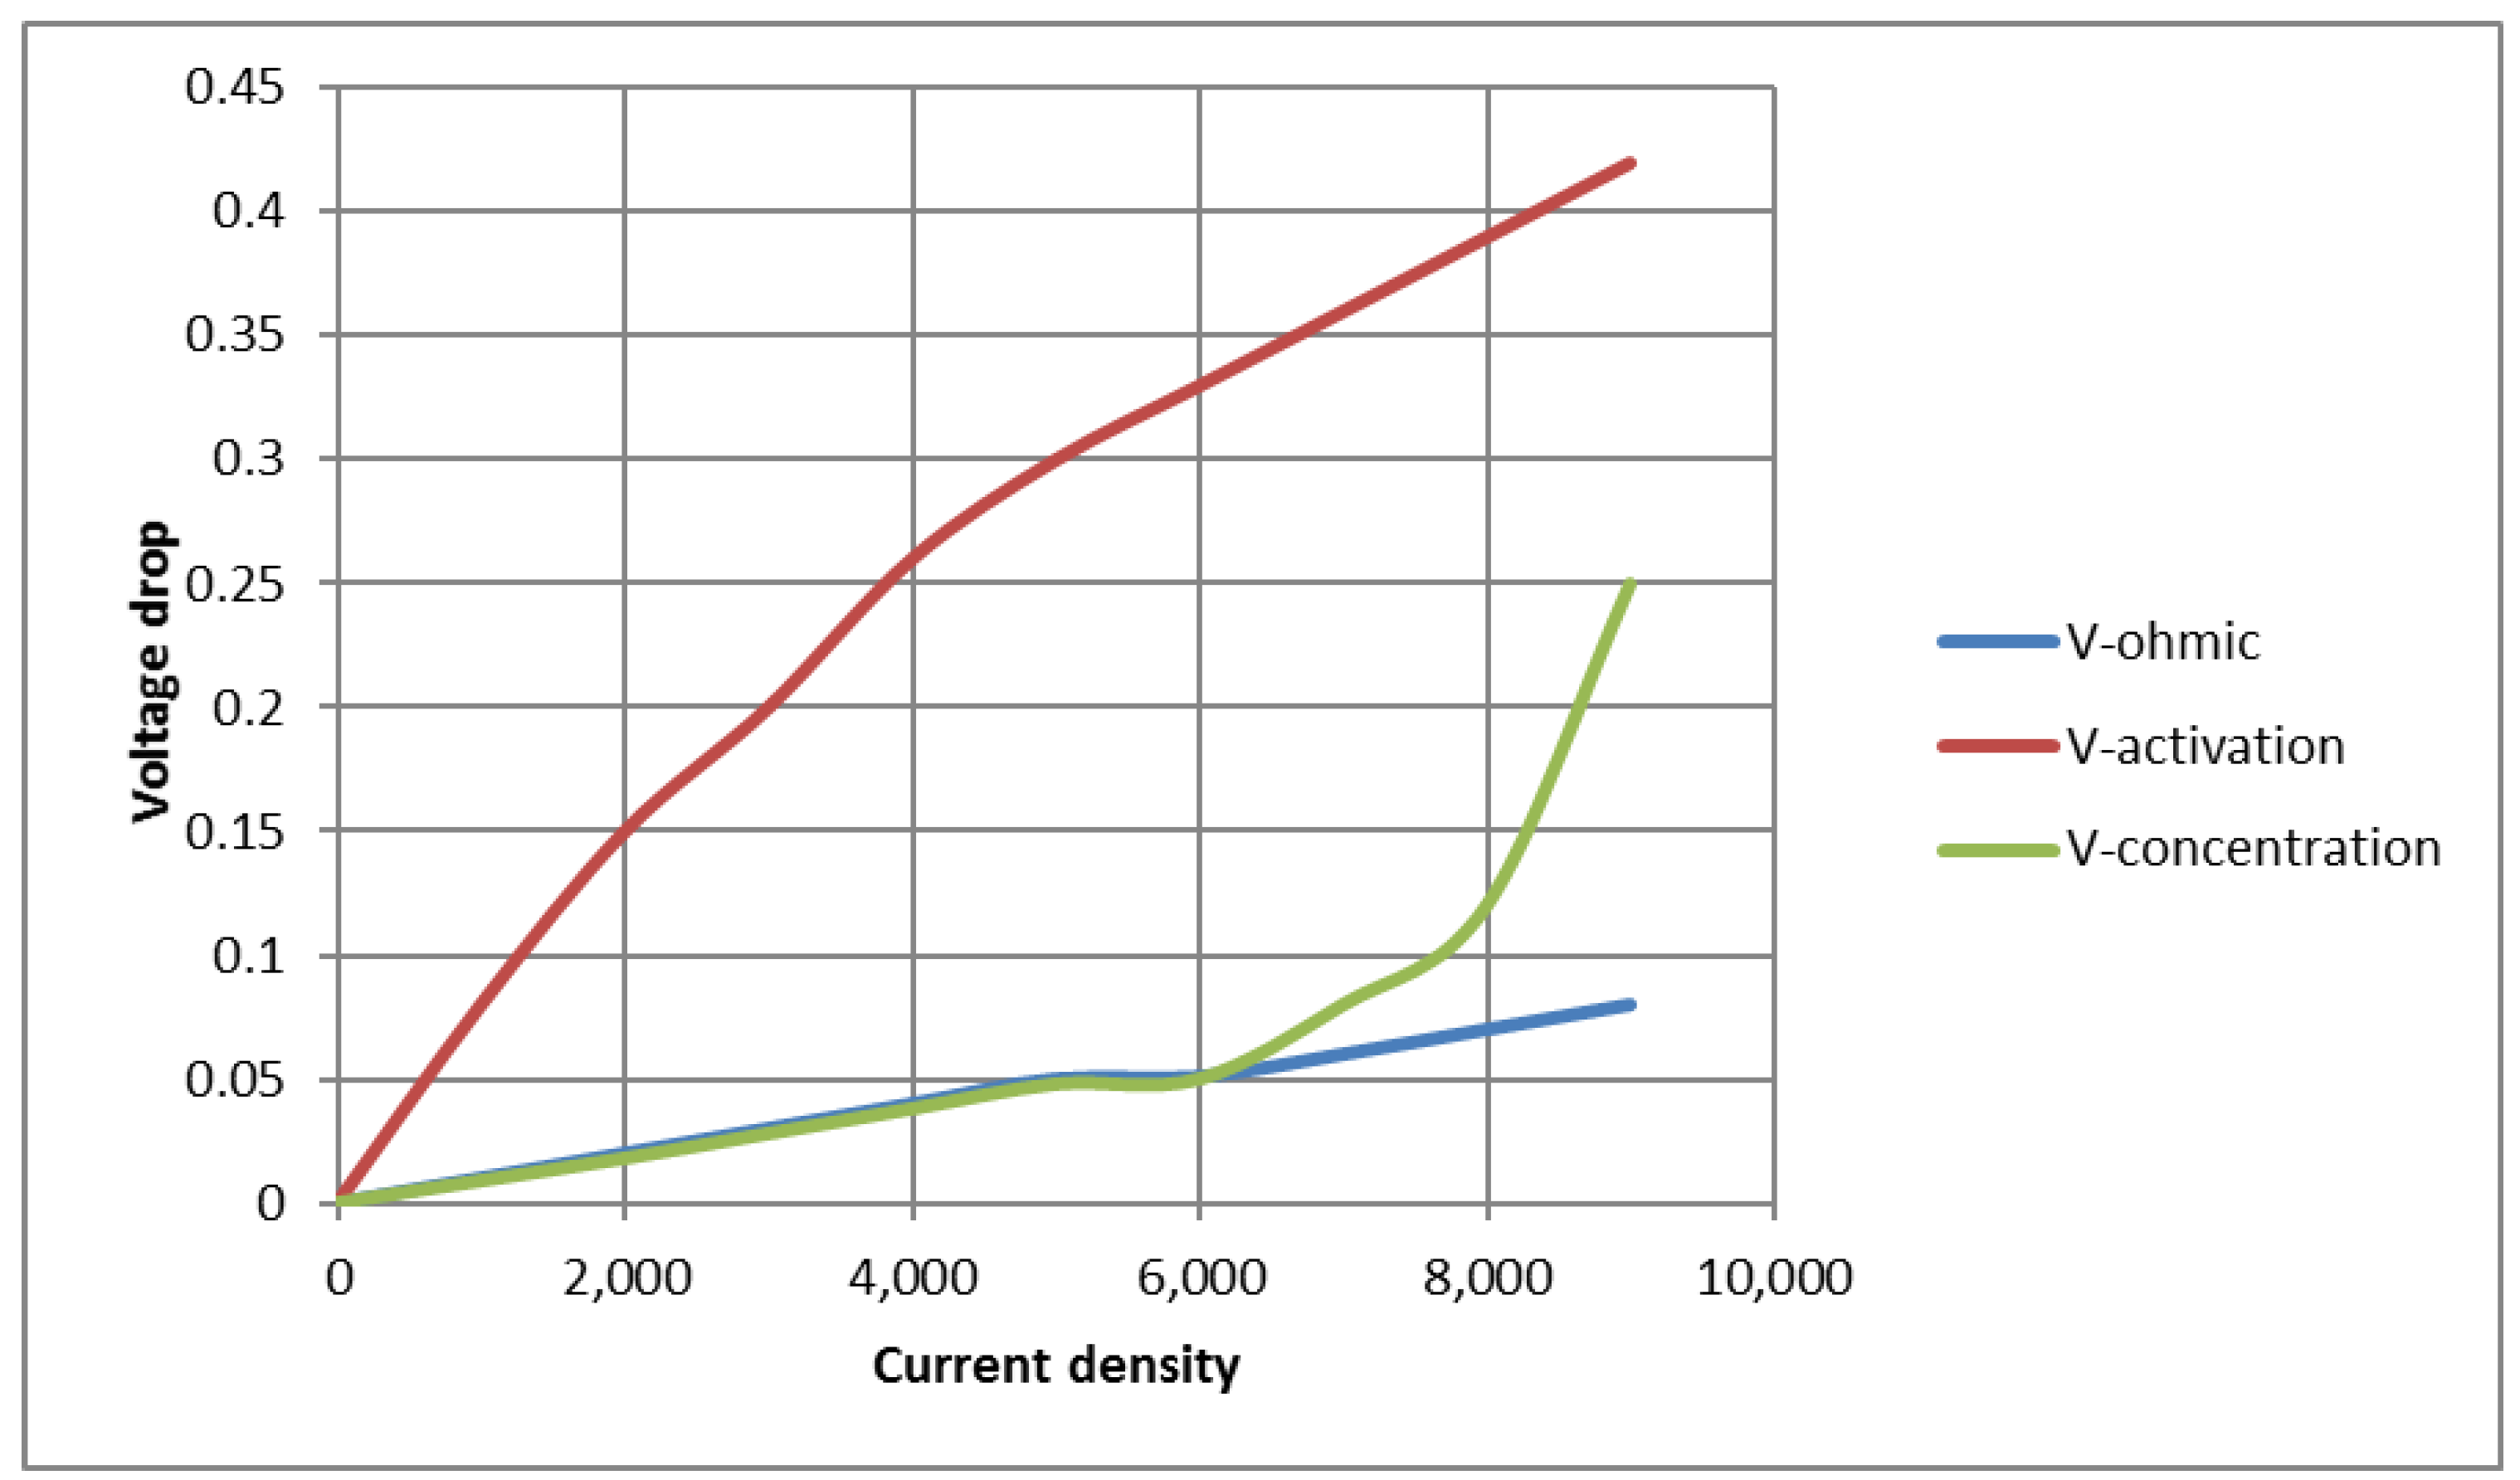
Figure 2 is a comparison between ohmic polarization, activation, and concentration in a solid oxide fuel cell. As can be seen from
Figure 2, at low current densities, the voltage drop is mainly related to activation. As the current and ohmic resistance increase, the voltage drop increases because hydrogen cannot react sufficiently in the electrode. The logarithmic form of the concentration voltage drop causes the graph to bend at a higher current density. The diagram in
Figure 2 shows the importance of each voltage drop and the effect it has on the total voltage.
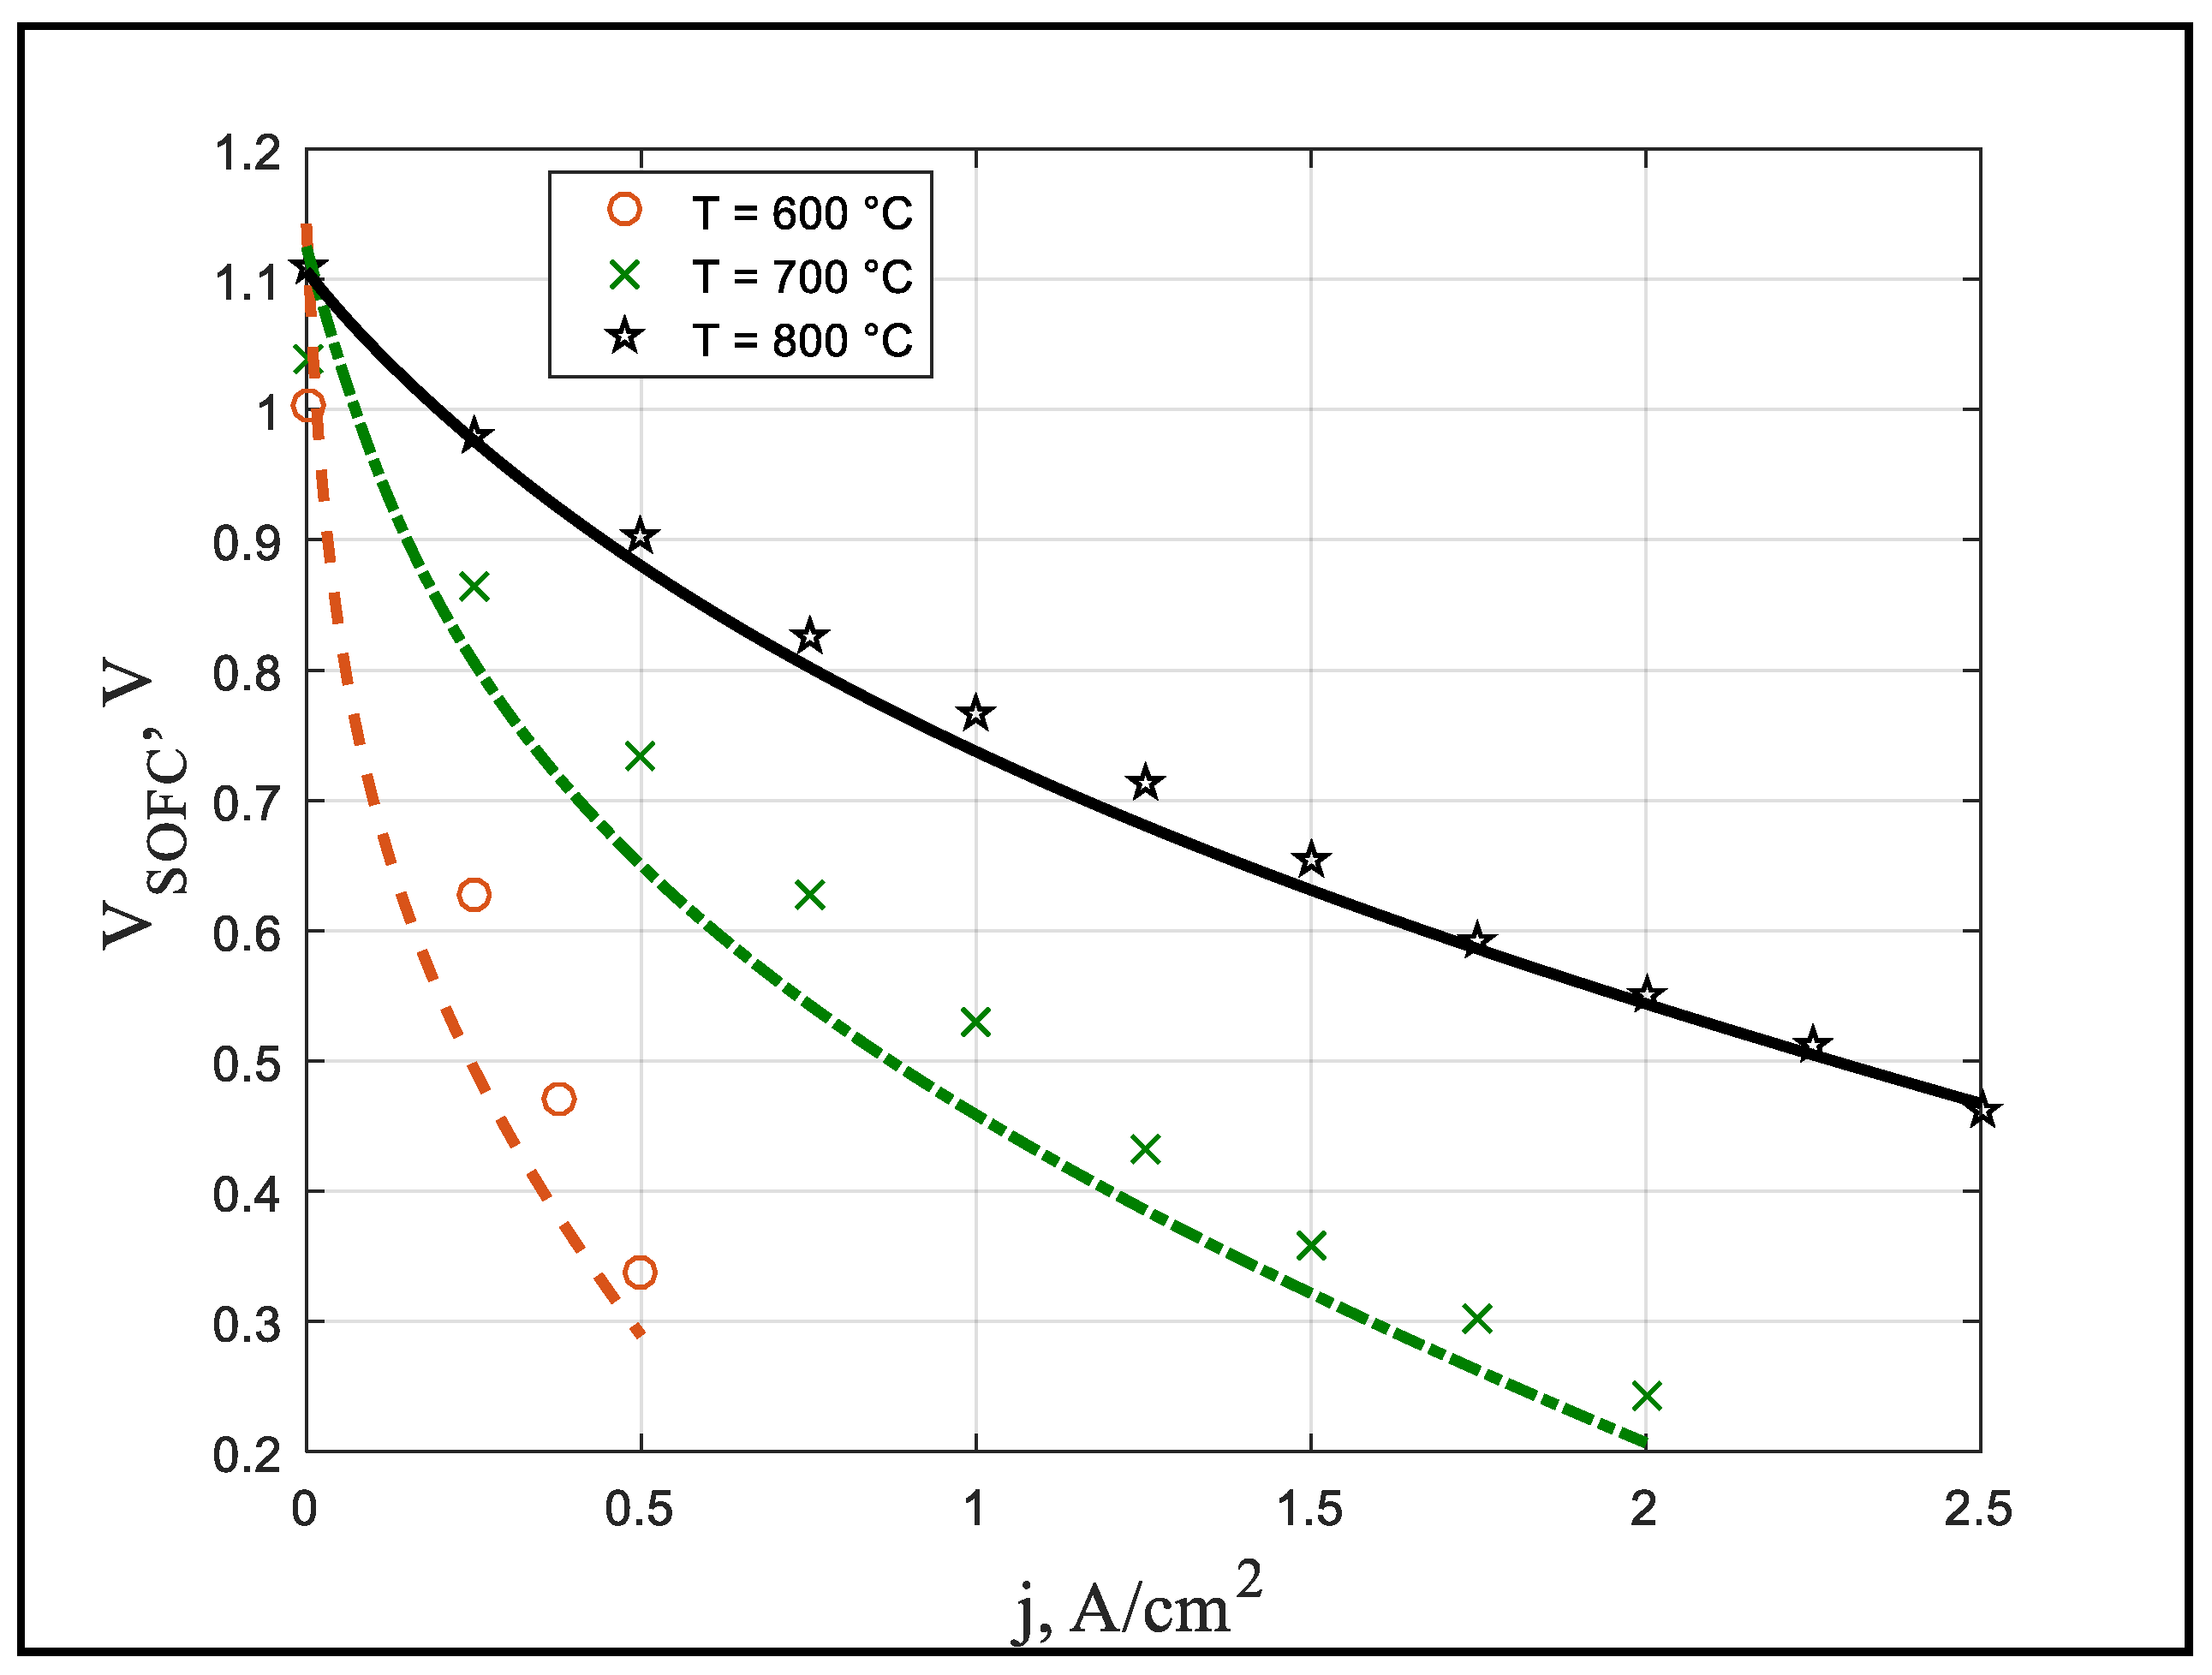
Figure 3 shows the effect of current density on cell voltage in the fuel cell. To validate the results, numerical results were compared with experimental results [
13]. According to
Figure 3, increasing the temperature of the tubular solid oxide fuel cell causes its voltage to increase. There is a similar trend in the experimental data which confirms the correctness of the results. However, this slight difference is caused by various factors. In practice, the electrochemical process involves a complex mechanism. The modeling of each drop requires consideration of the molecular behaviors of the reacting components. In the model considered in this research, similarly to the previous models, the temperature distribution, the pressure of the chemical components on the battery, the temperature and pressure difference between the inlet and outlet of the anode and cathode, and the presence of nitrogen and other gases in the air with oxygen have been omitted.
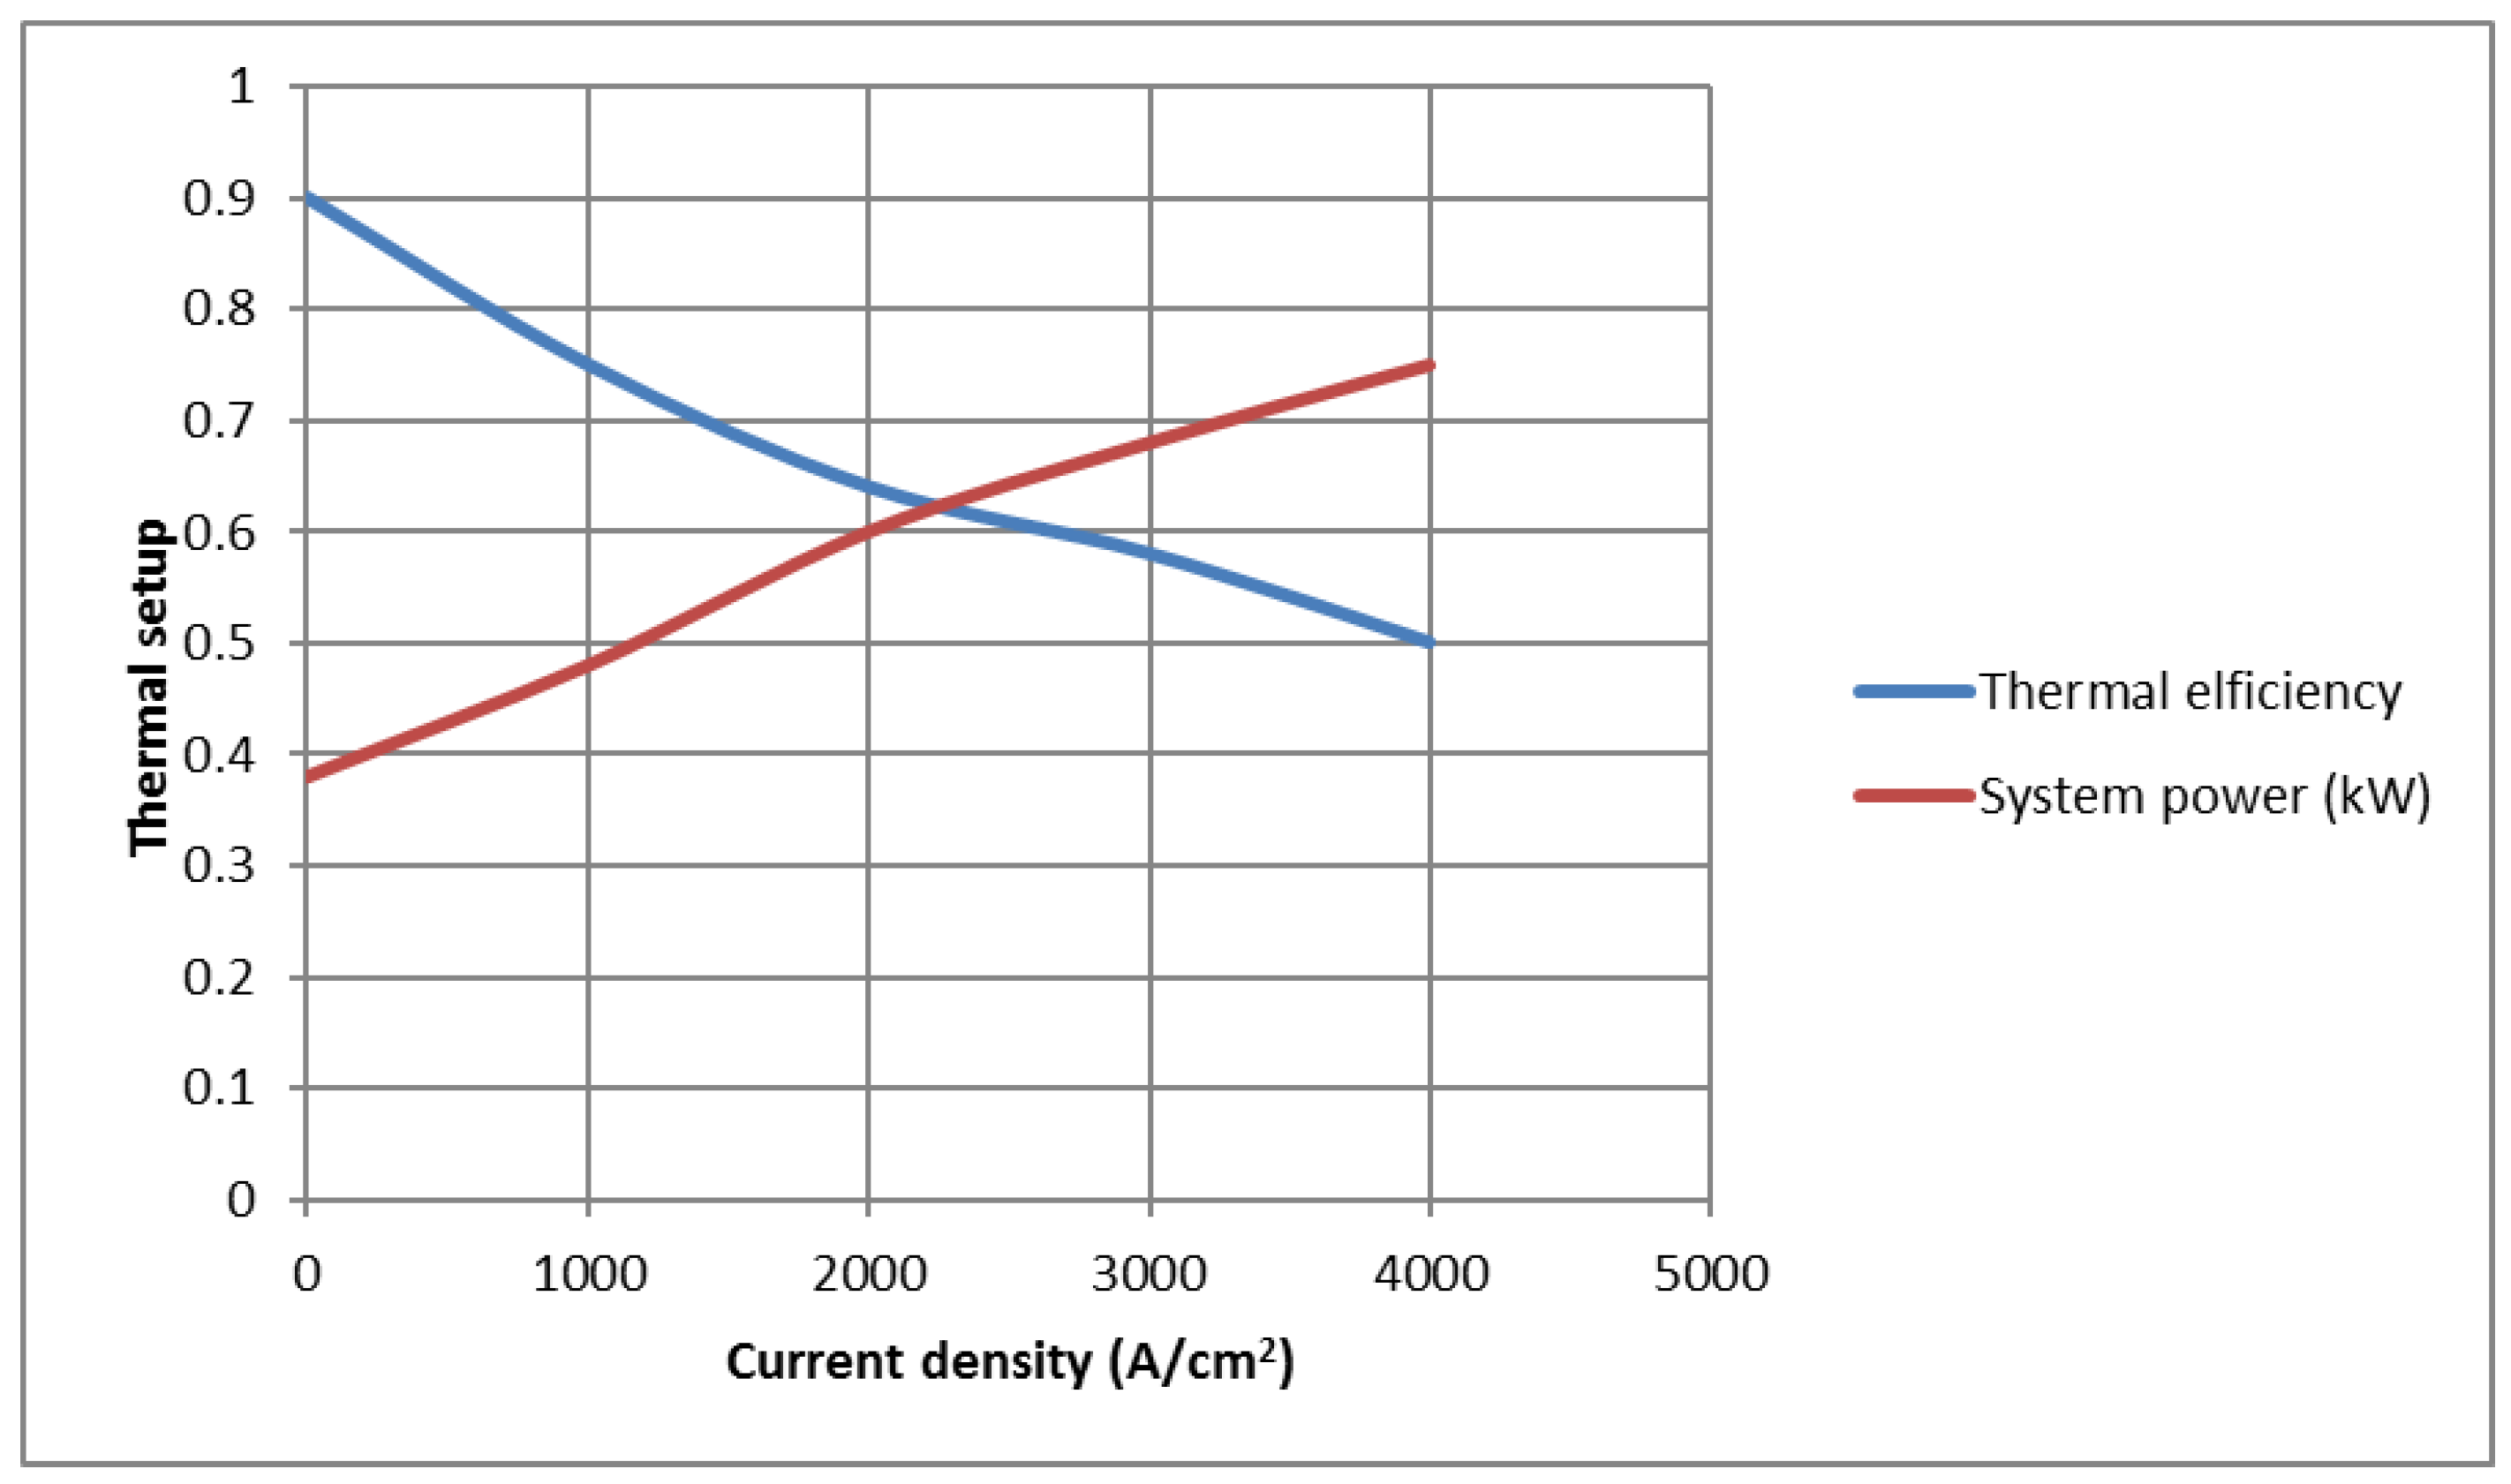
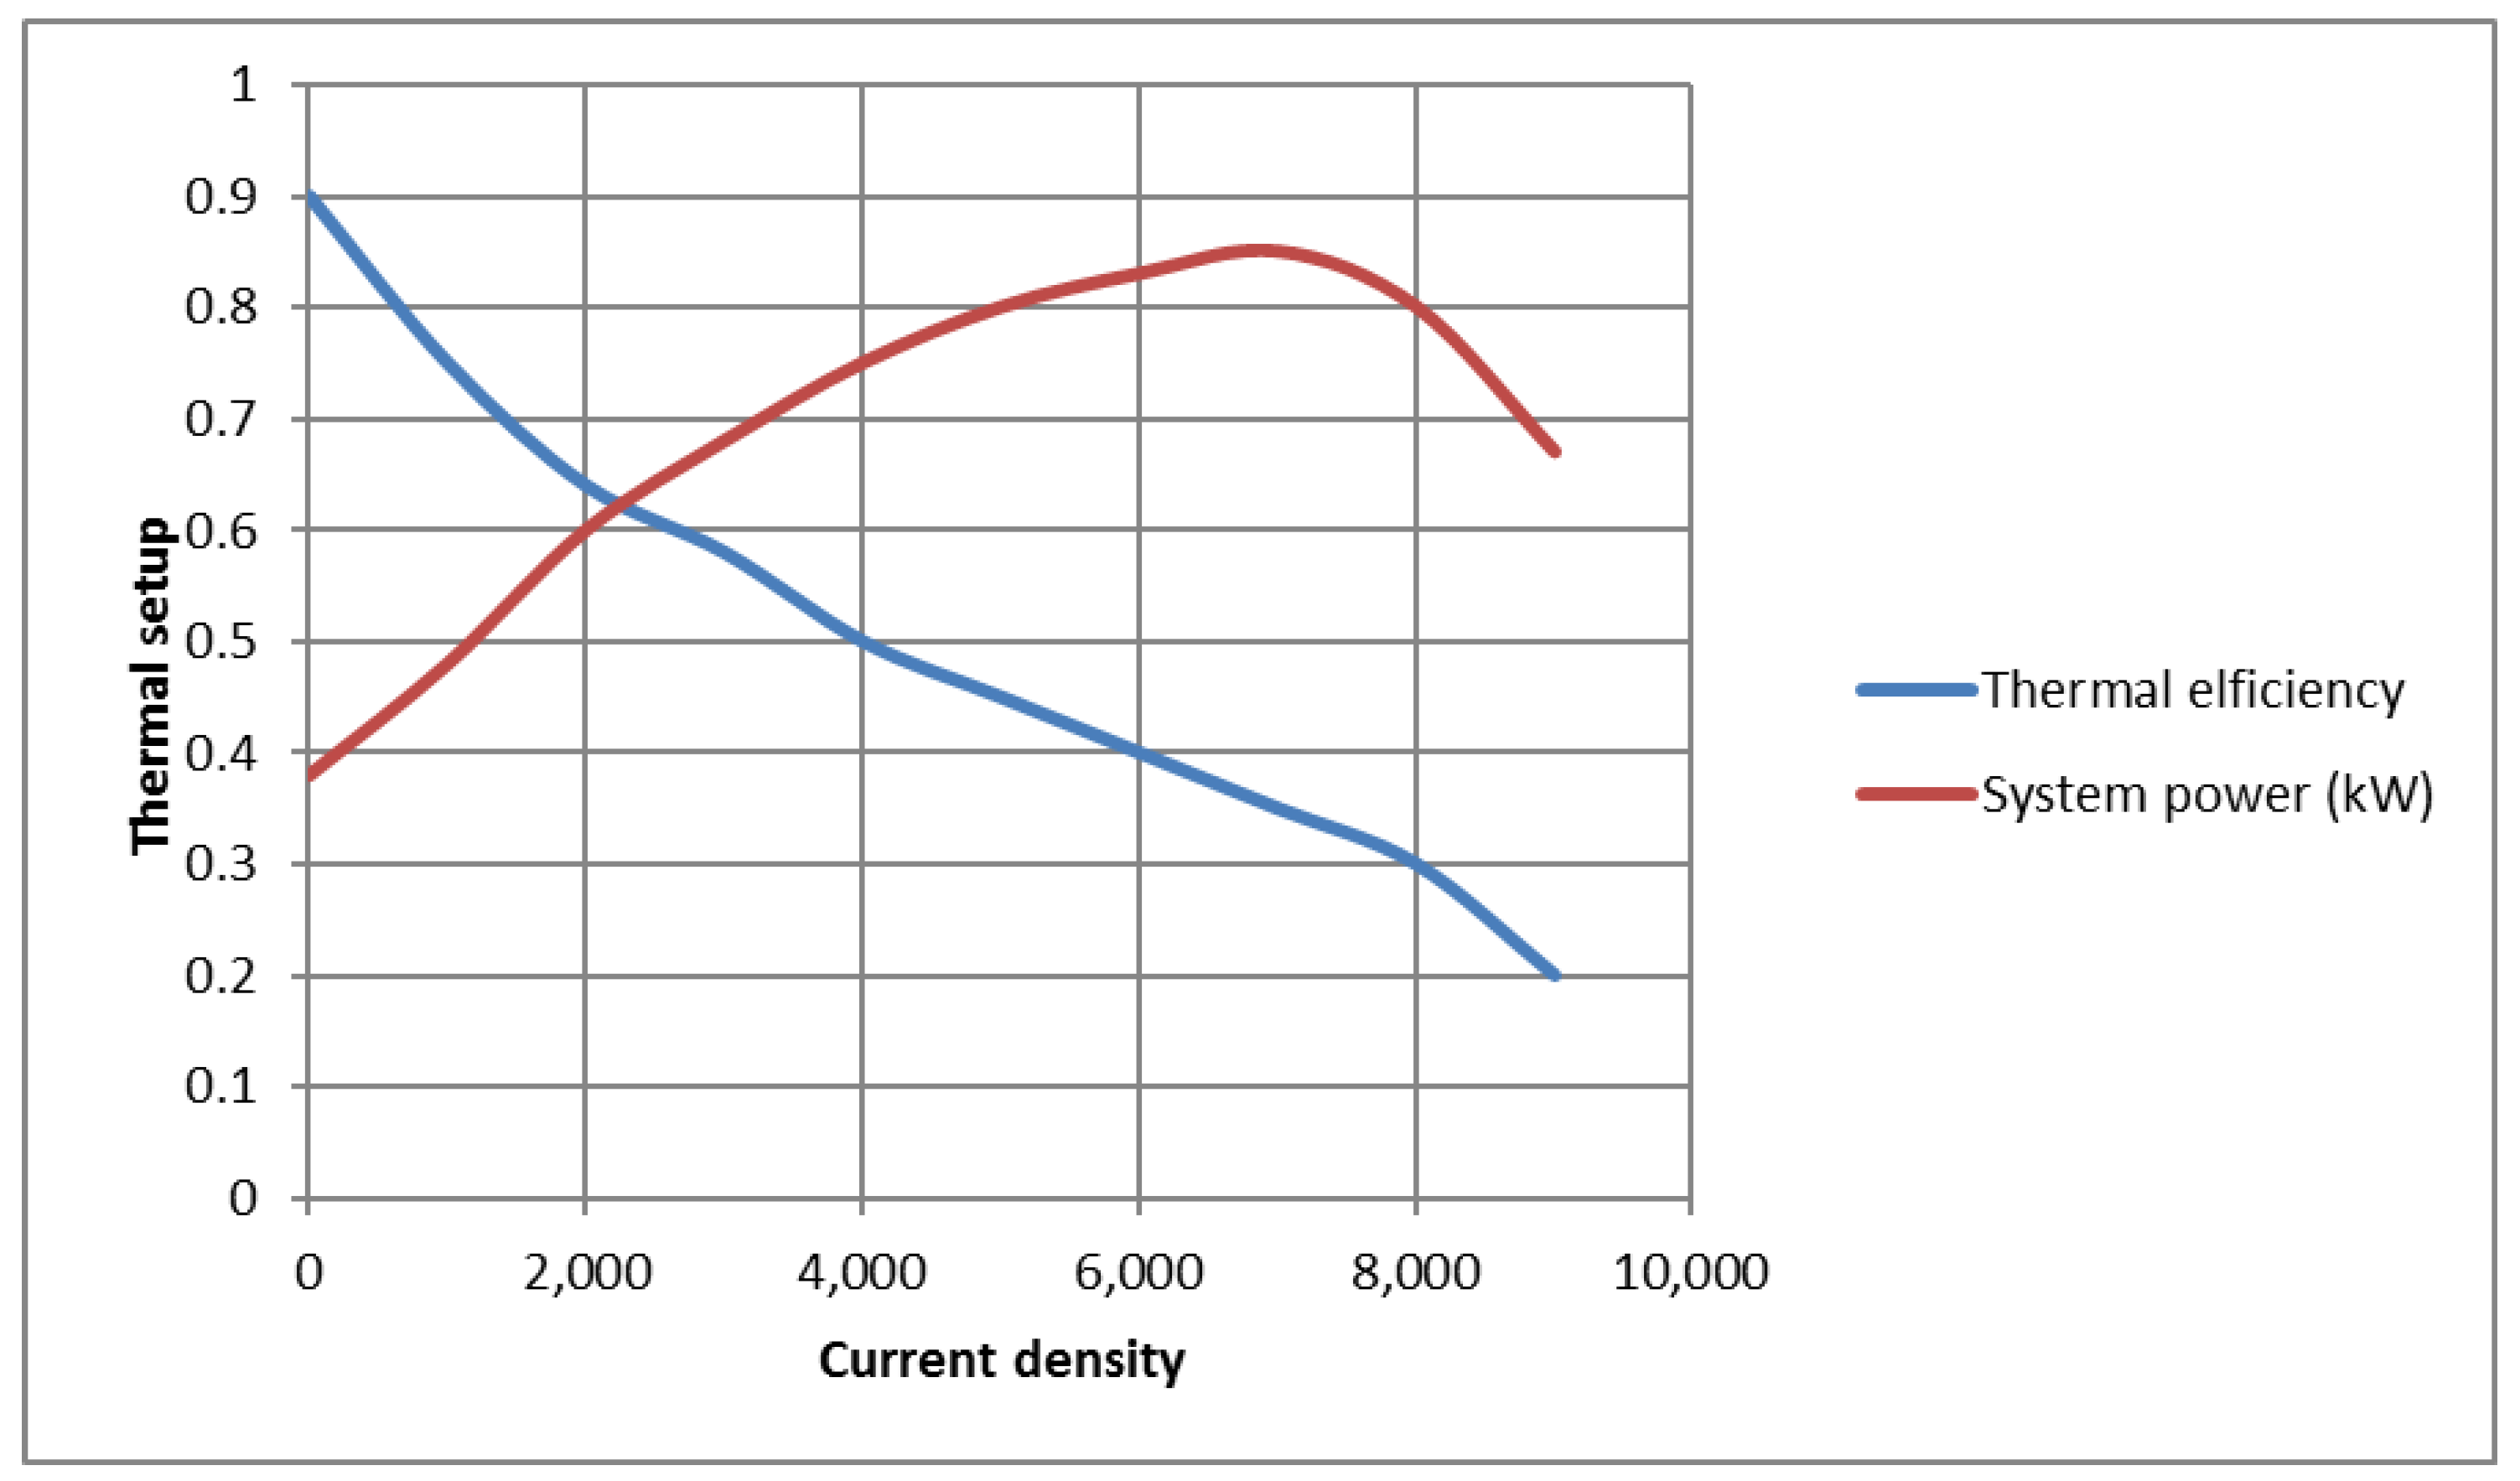
Current density is the speed of electron transfer per unit of the active area of the battery.
Figure 4 shows the effect of current intensity on the system’s production power and efficiency. When the fuel consumption factor, the air consumption factor, and the operating temperature of the fuel cell are constant, with the increase in current density, the power of the battery increases and reaches its maximum value. The continued increase in current intensity eventually approaches the current density limit. Due to the significant increase in losses, decrease in voltage occurs, and, as a result, the power of the battery, which has a major contribution to the overall power of the combined gas turbine system equipped with a fuel cell, is decreased. Finally, the overall power of the system decreases. Furthermore, at the point where the current density reaches the limit current density, due to the increase in the voltage drop caused by the concentration and the sharp decrease in the operating voltage of the battery, the power of the fuel cell becomes zero.
As the temperature of the SOFC increases the rate of concentration voltage loss (due to the increase in irreversibility), the rates of activation and ohmic losses decrease. In addition, with the increase in the working temperature of the SOFC, the ionic conductivity and the rate of chemical reactions of the fuel cell also increase. For these reasons, as the working temperature of the fuel cell increases, the output voltage of the cell enhances. Moreover, at high temperatures, the resistance due to the transmission of electrolyte ions is reduced, thereby improving cell performance. This principle has been reported in much of the authoritative literature.
Additionally, the increase in current density causes a decrease in the efficiency of the combined system. This is because, with the increase in the intensity of the current, the rate of input fuel to the battery increases, and due to the increase in the calorific value of the input fuel, the efficiency of the system decreases.
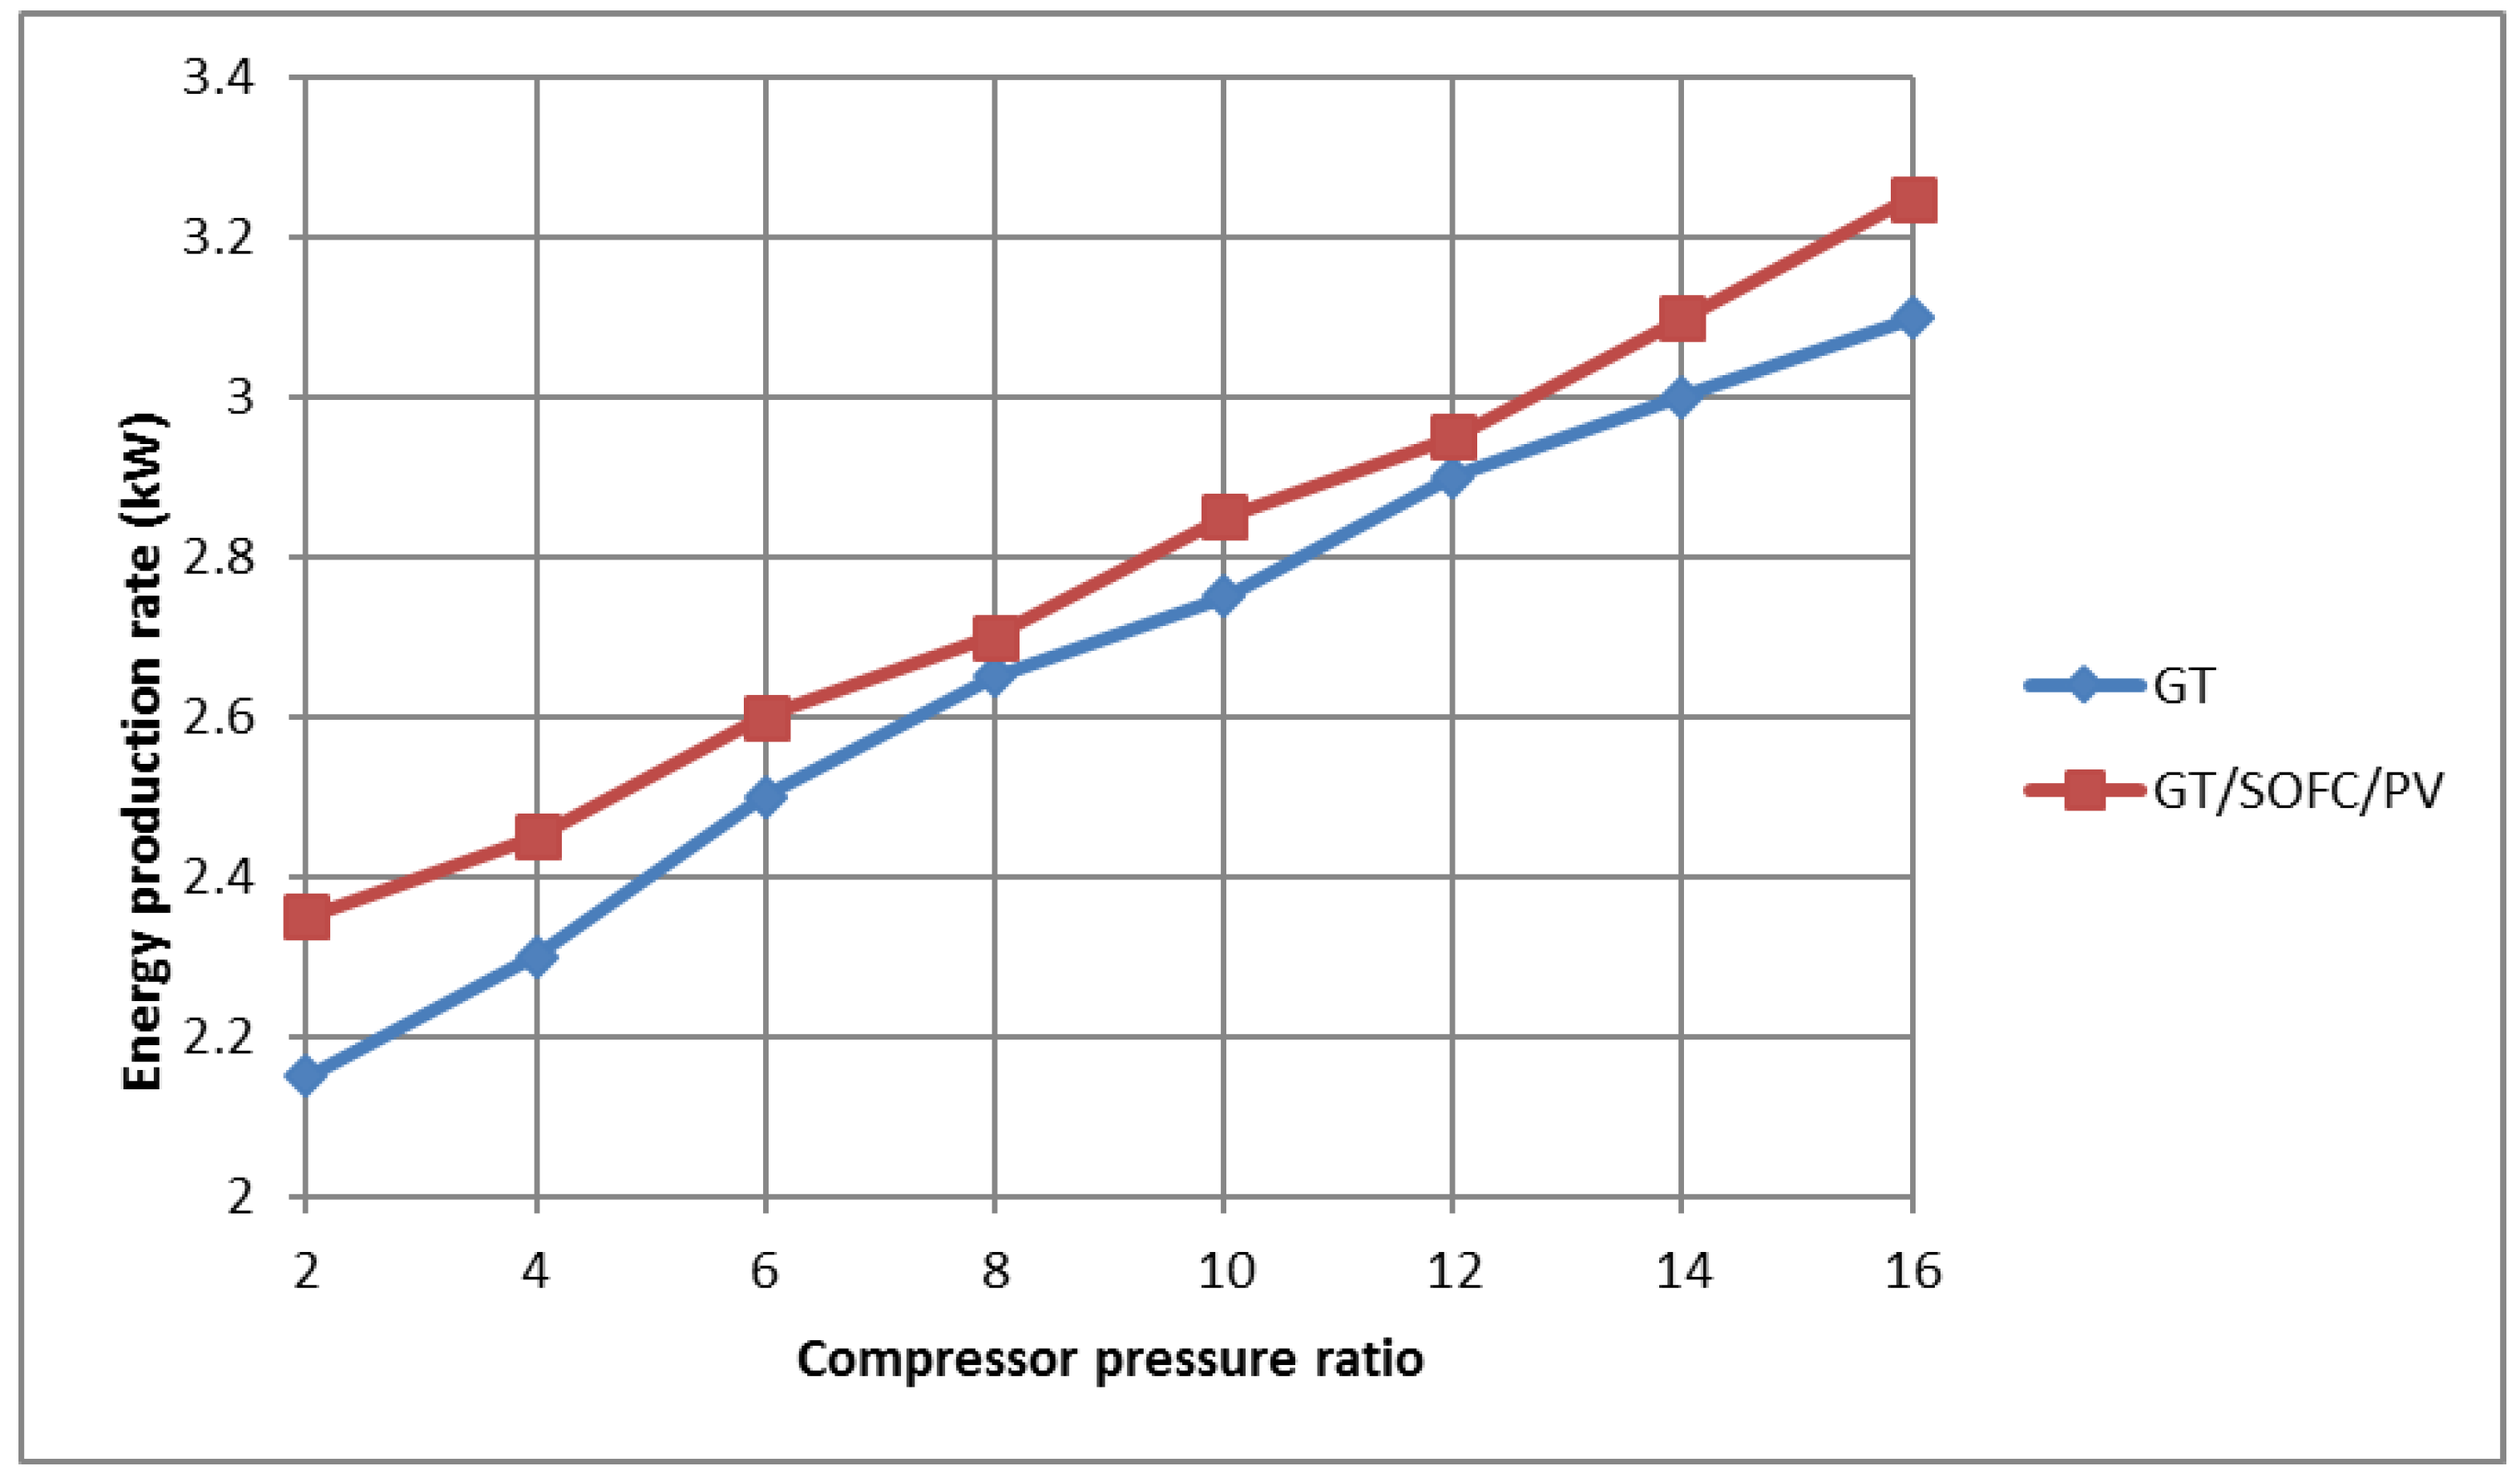
Figure 5 shows the extraordinary performance of the hybrid system compared to the normal system. One of the reasons why a high-temperature fuel cell is used is that it preheats the working fluid before entering the combustion chamber, and produces more energy. Both factors cause an increase in energy compared to the normal state. Based on the predicted values of
Figure 5, the combined cycle shows a 23% better performance than the normal gas turbine in terms of system efficiency. In addition, to ensure the correctness of the results, the results are compared with [
23].
Figure 5 shows that the pressure ratio has less effect on the combined cycle than the gas turbine system. The reason for the difference in the results of [
23] is due to the use of hydrogen fuel, which has a higher calorific value (LHV) than methane, and as a result, the efficiency of the system is slightly reduced. According to Equation (40), as the value of LHV
fuel increases, the efficiency of the system will decrease.
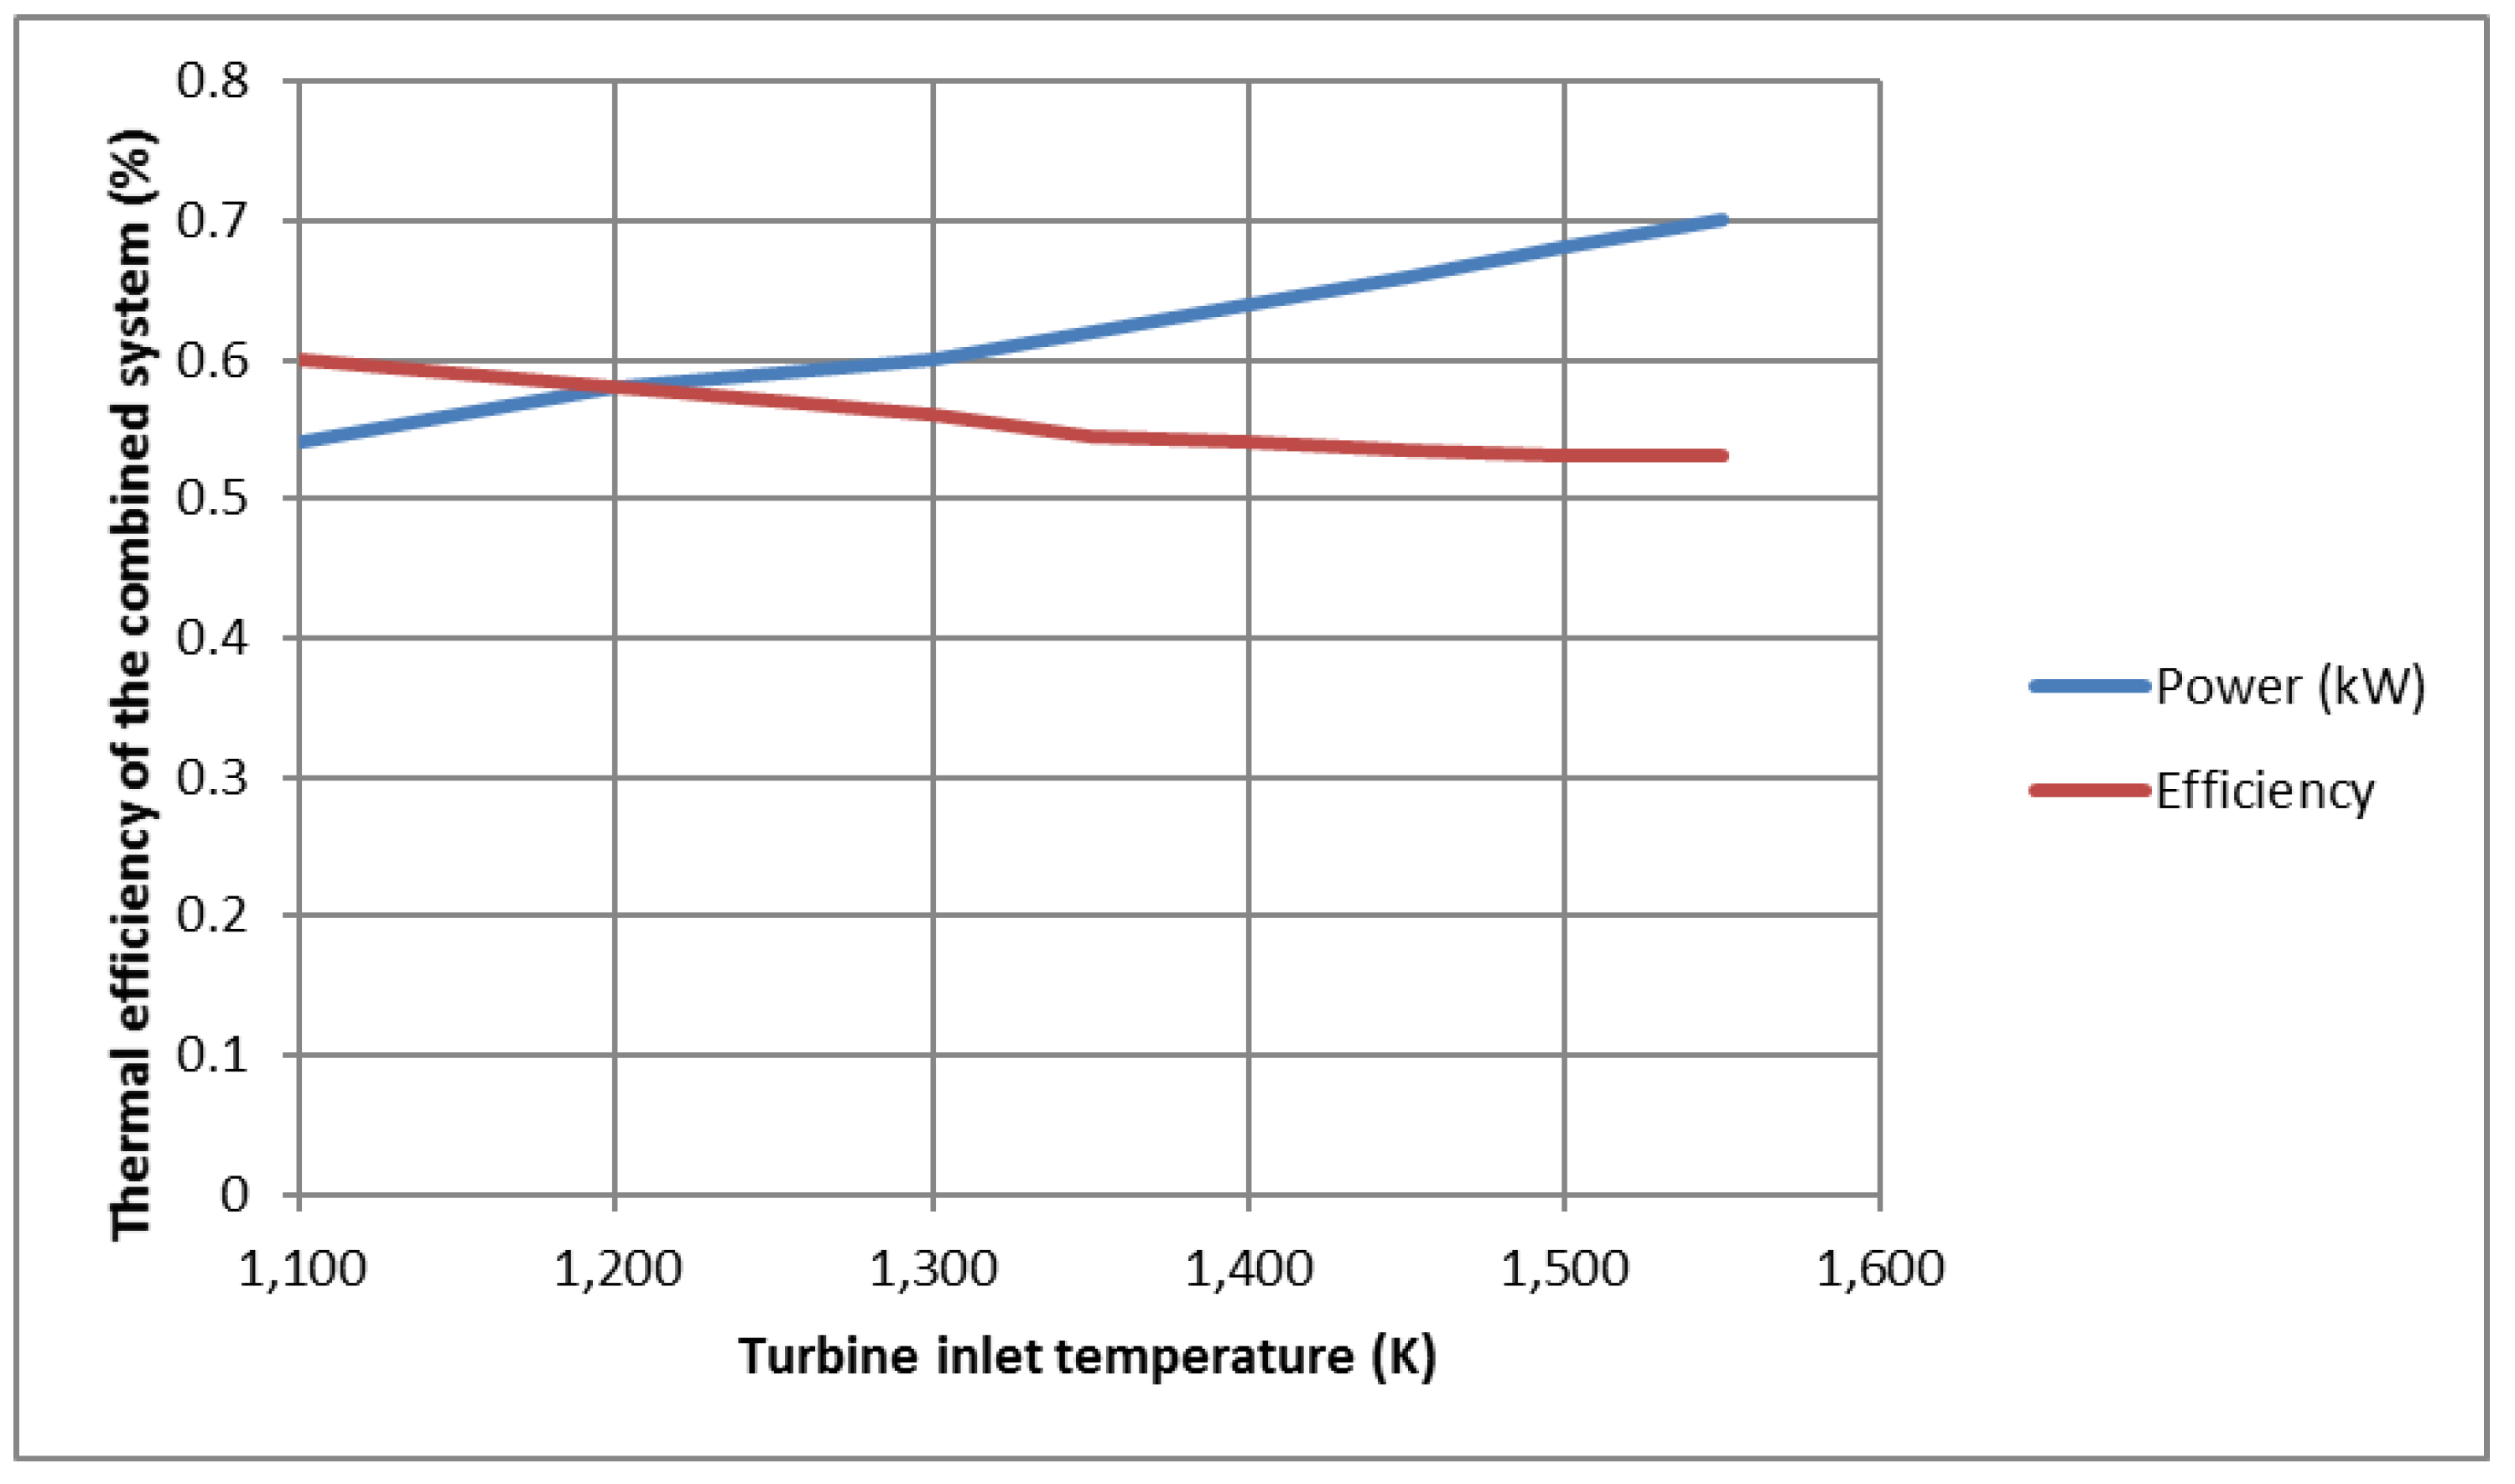
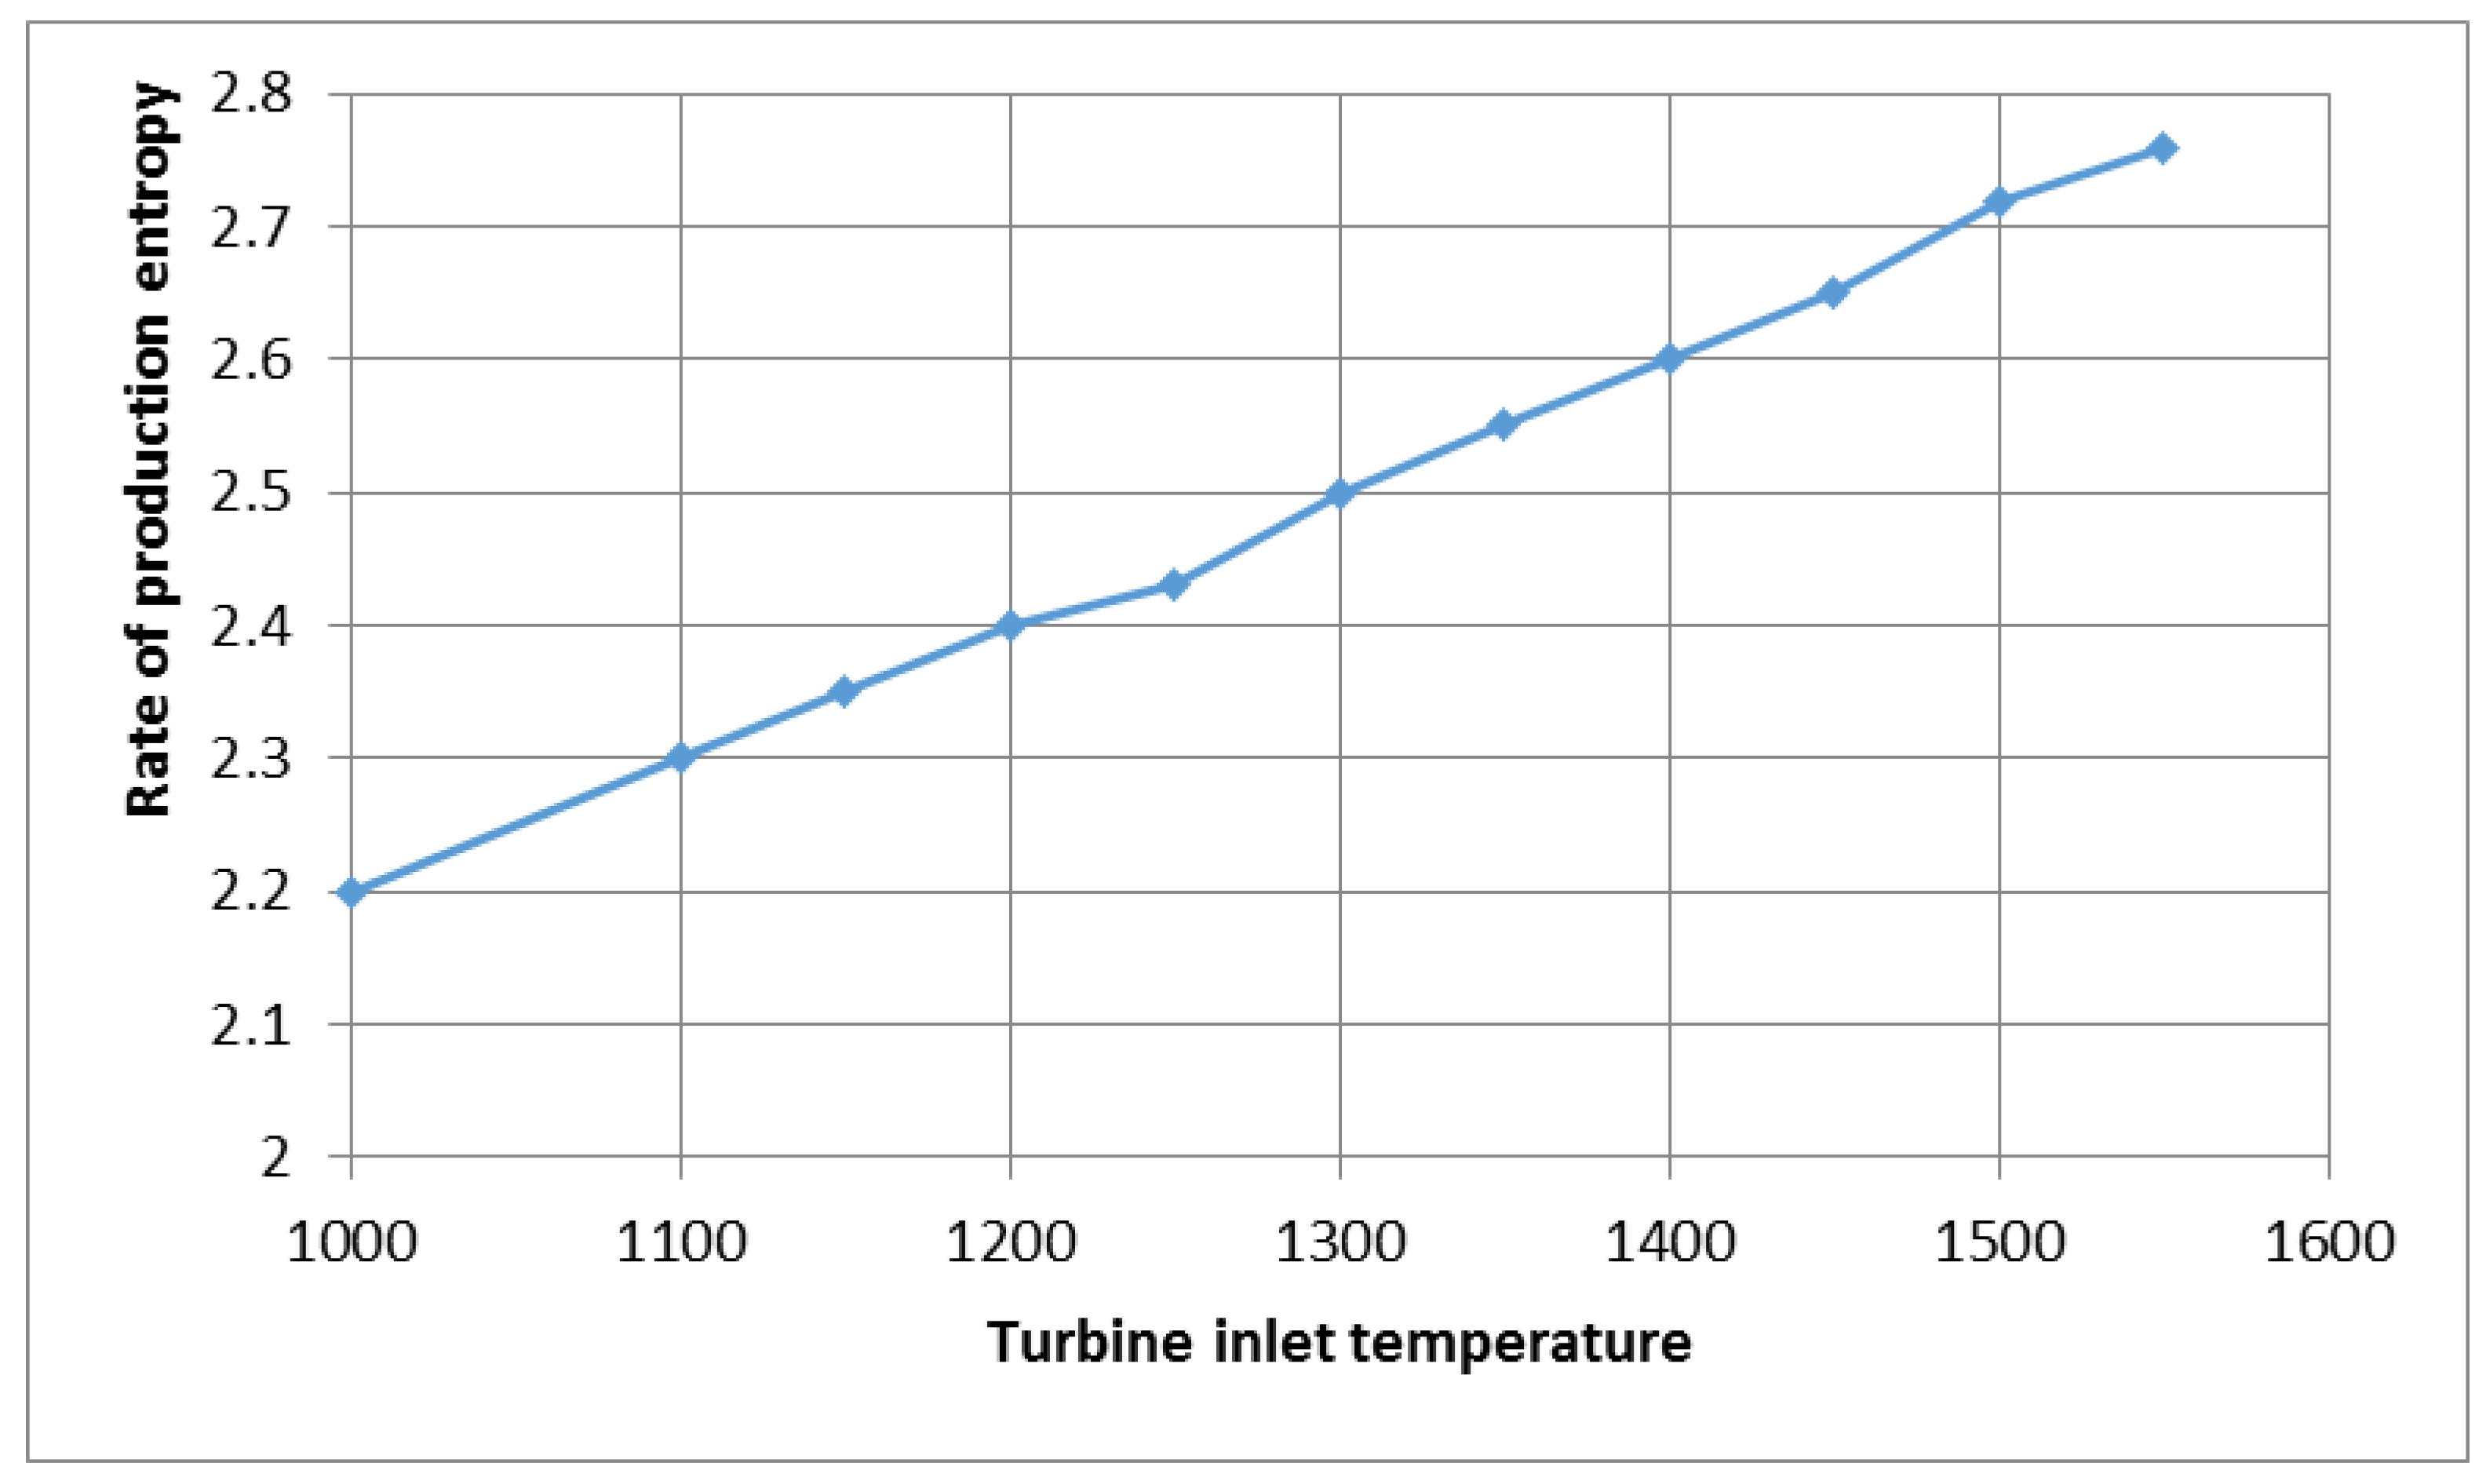
The effect of turbine temperature on thermodynamic efficiency and output power is shown in
Figure 6. When the turbine inlet temperature increases, the thermal efficiency decreases. This is an interesting result which shows that the higher temperature of the working fluid after the fuel cell is not effective in the combustion chamber, and this is the main reason for using the combustion chamber to burn the unreacted fuel flow in the fuel cell. The specific power output from the cycle, as well as the control of part of this system, is one of the reasons for using the combustion chamber.
Figure 6 shows that increasing the temperature of the input to the turbine increases the output power.
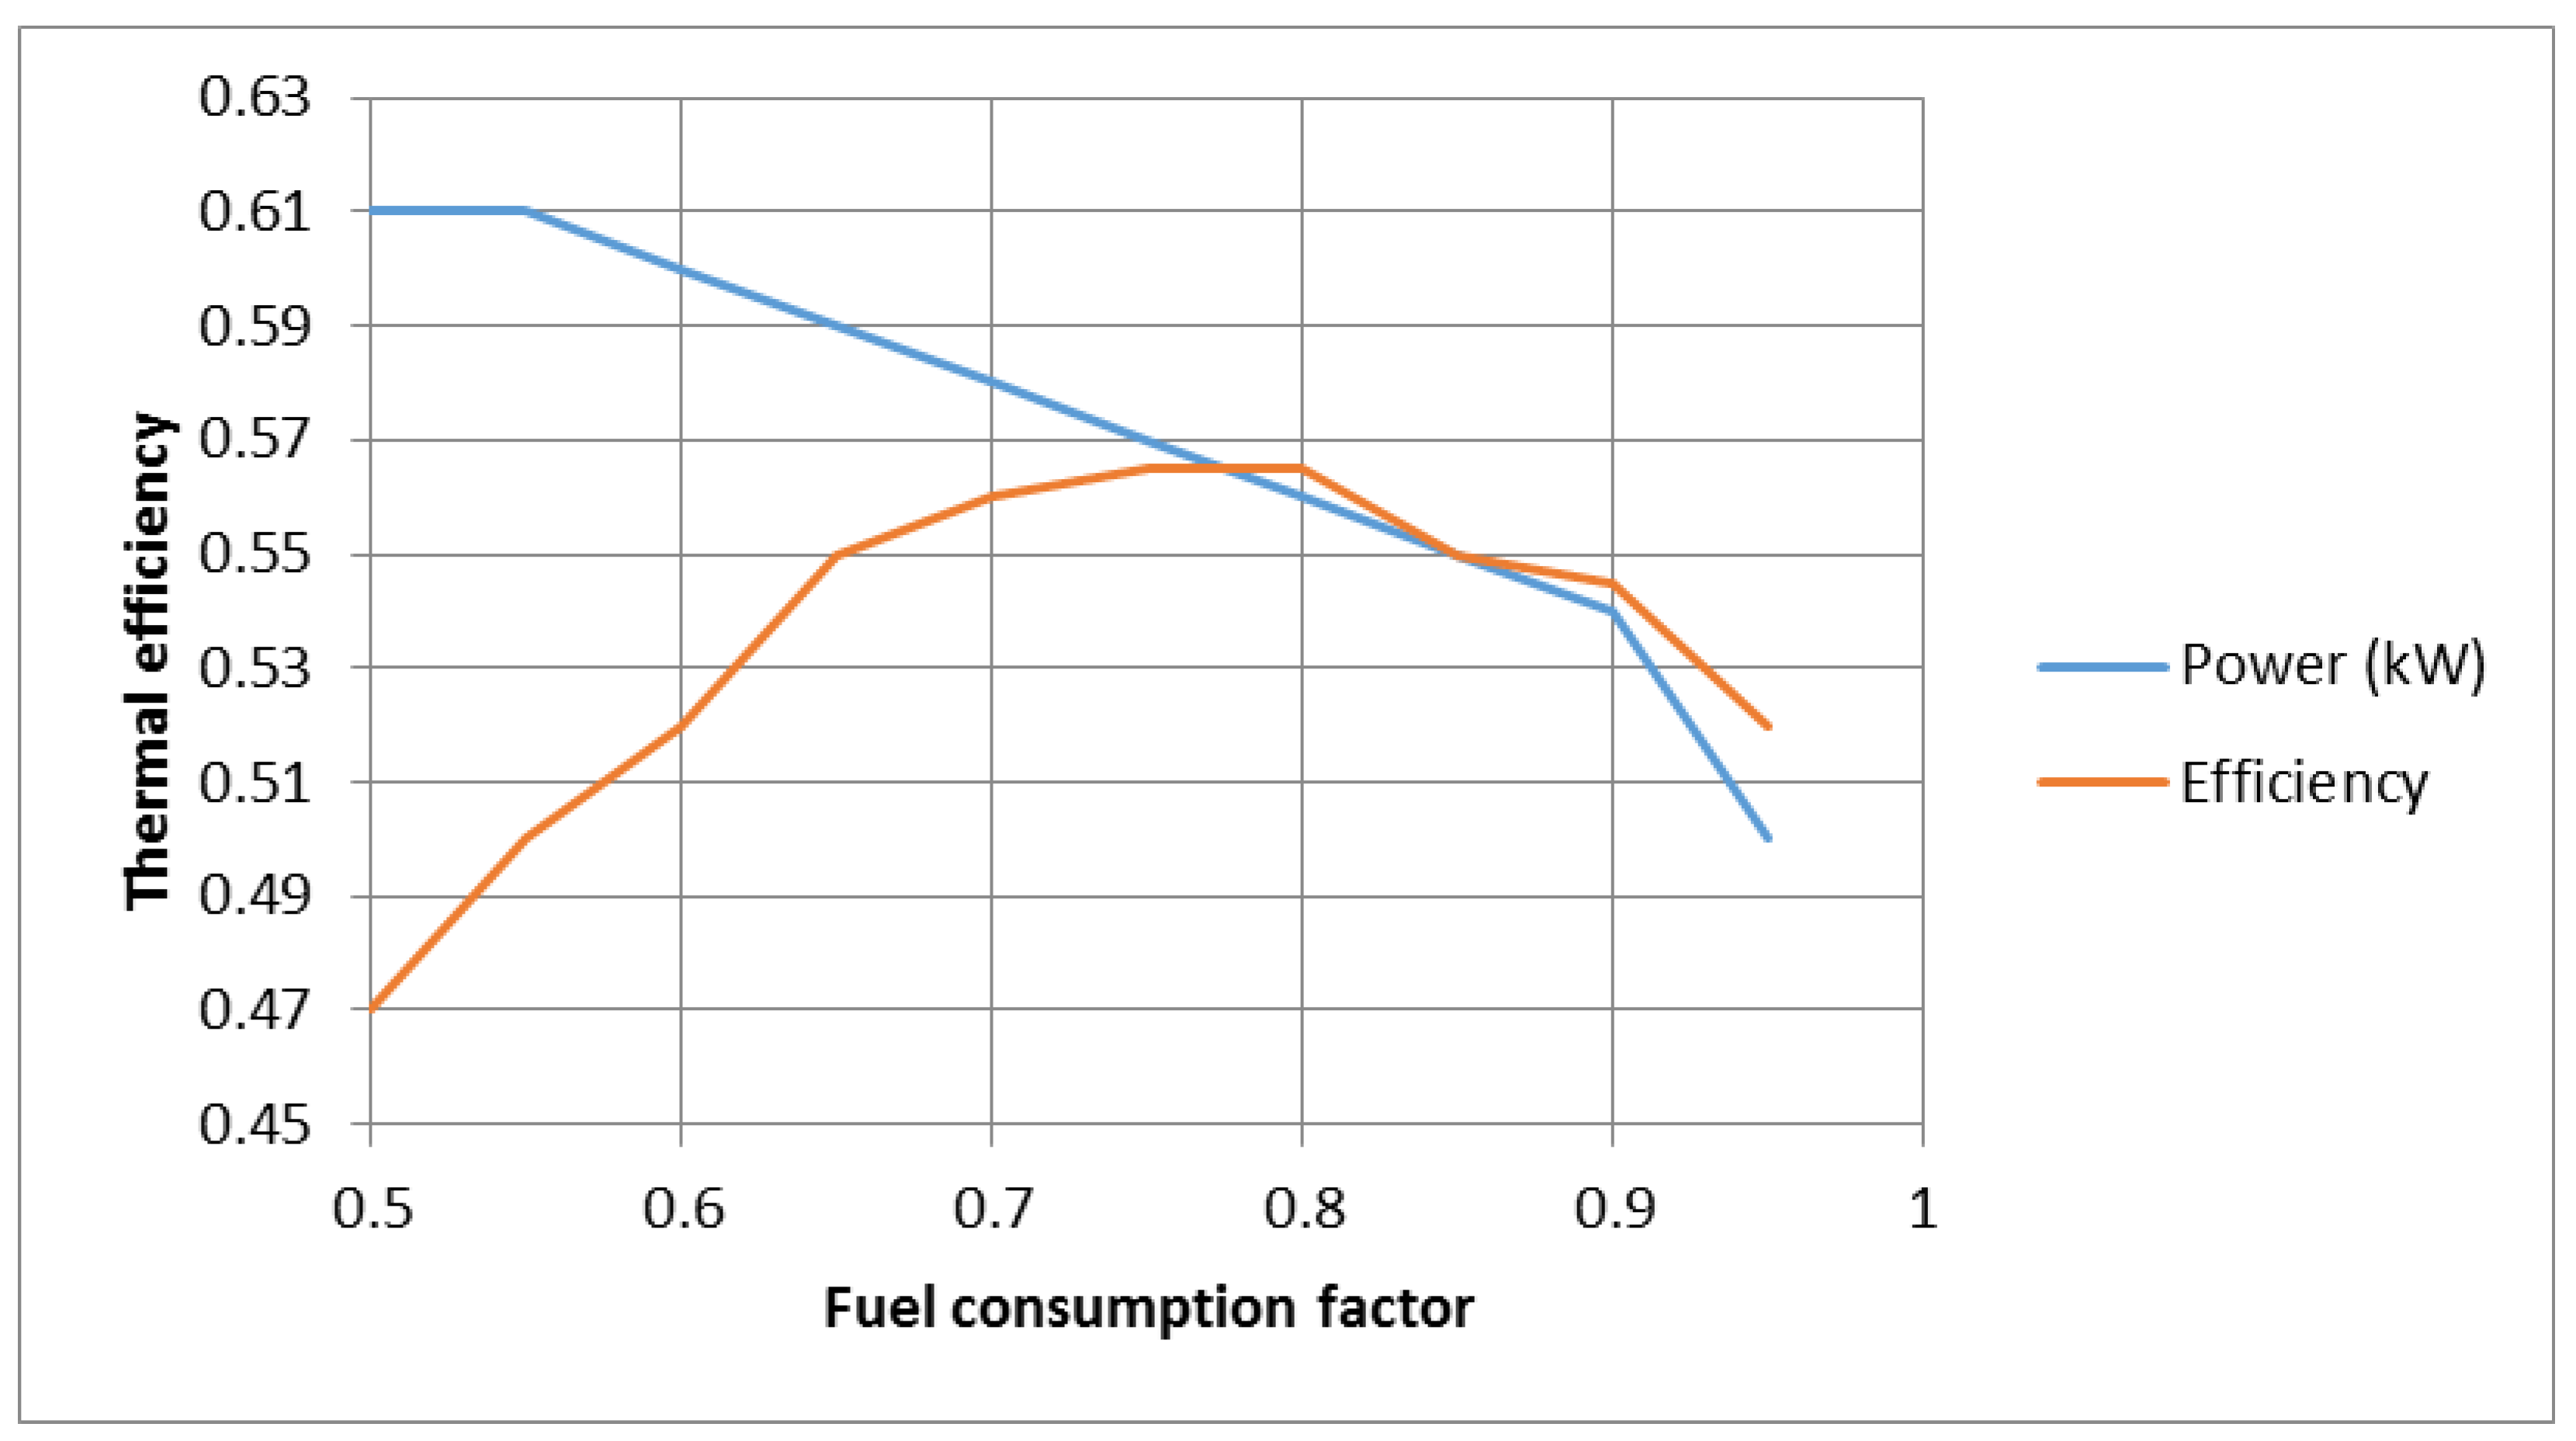
In
Figure 7, the effect of the fuel consumption factor on the production power of the entire system and its efficiency can be seen. As is known, the production power of the system decreases with an increase in the effect of the fuel consumption factor due to the increasing drop in the activation voltage of the fuel cell. A decrease in voltage also causes a decrease in power. In addition, an increase in the effect of the fuel consumption factor due to a decrease in fuel consumption first increases the efficiency, but with a further increase in the effect of the fuel consumption factor, because the voltage drops increases greatly, as a result, the battery voltage decreases significantly, and the power reduction becomes too much. Finally, this process results in a reduction in efficiency.
In
Figure 8, the effect of pressure on the entropy rate of the combined system is compared with the normal system. The combined system has more entropy than the normal system due to more fuel entering it. Of course, one should be careful, because in the normal system, fuel vapor enters the combustion chamber and the exergy efficiency decreases. Compared to the amount of burn that enters the normal system, there is a higher level of irreversibility than the combined system.
Figure 9 shows the effect of the temperature entering the turbine on the production entropy of the combined gas turbine system equipped with a fuel cell at a pressure ratio of 4. With the rapid increase in the temperature above the turbine inlet, more injected fuel is needed, and as a result, the combustion heat transfer rate in the combustion chamber need to be increased. Therefore, there is a need to increase the fuel flow rate to the combustion chamber. Increasing the heat transfer rate itself increases the entropy production and, thus, the irreversibility of the system. An increase in the inlet temperature of the turbine indicates an increase in fuel consumption, which will harm the irreversibility of the system.
To compare, the overall performance of the current modeled system was compared with previous reports by Tese et al. [
24]. This comparison is shown in
Table 5, and it is possible to observe the similarities, which constitute a self-confirmation of the formulations. The difference in predicting the specific power output from the fuel cell is due to the number of determined cells. The reason for the difference in efficiency may be due to the method of calculating the enthalpy of the materials and fuel used in the battery. The use of hydrogen fuel reduces efficiency due to its calorific value, which is higher than that of methane. However, an advantage of using hydrogen fuel is the weight of the system.
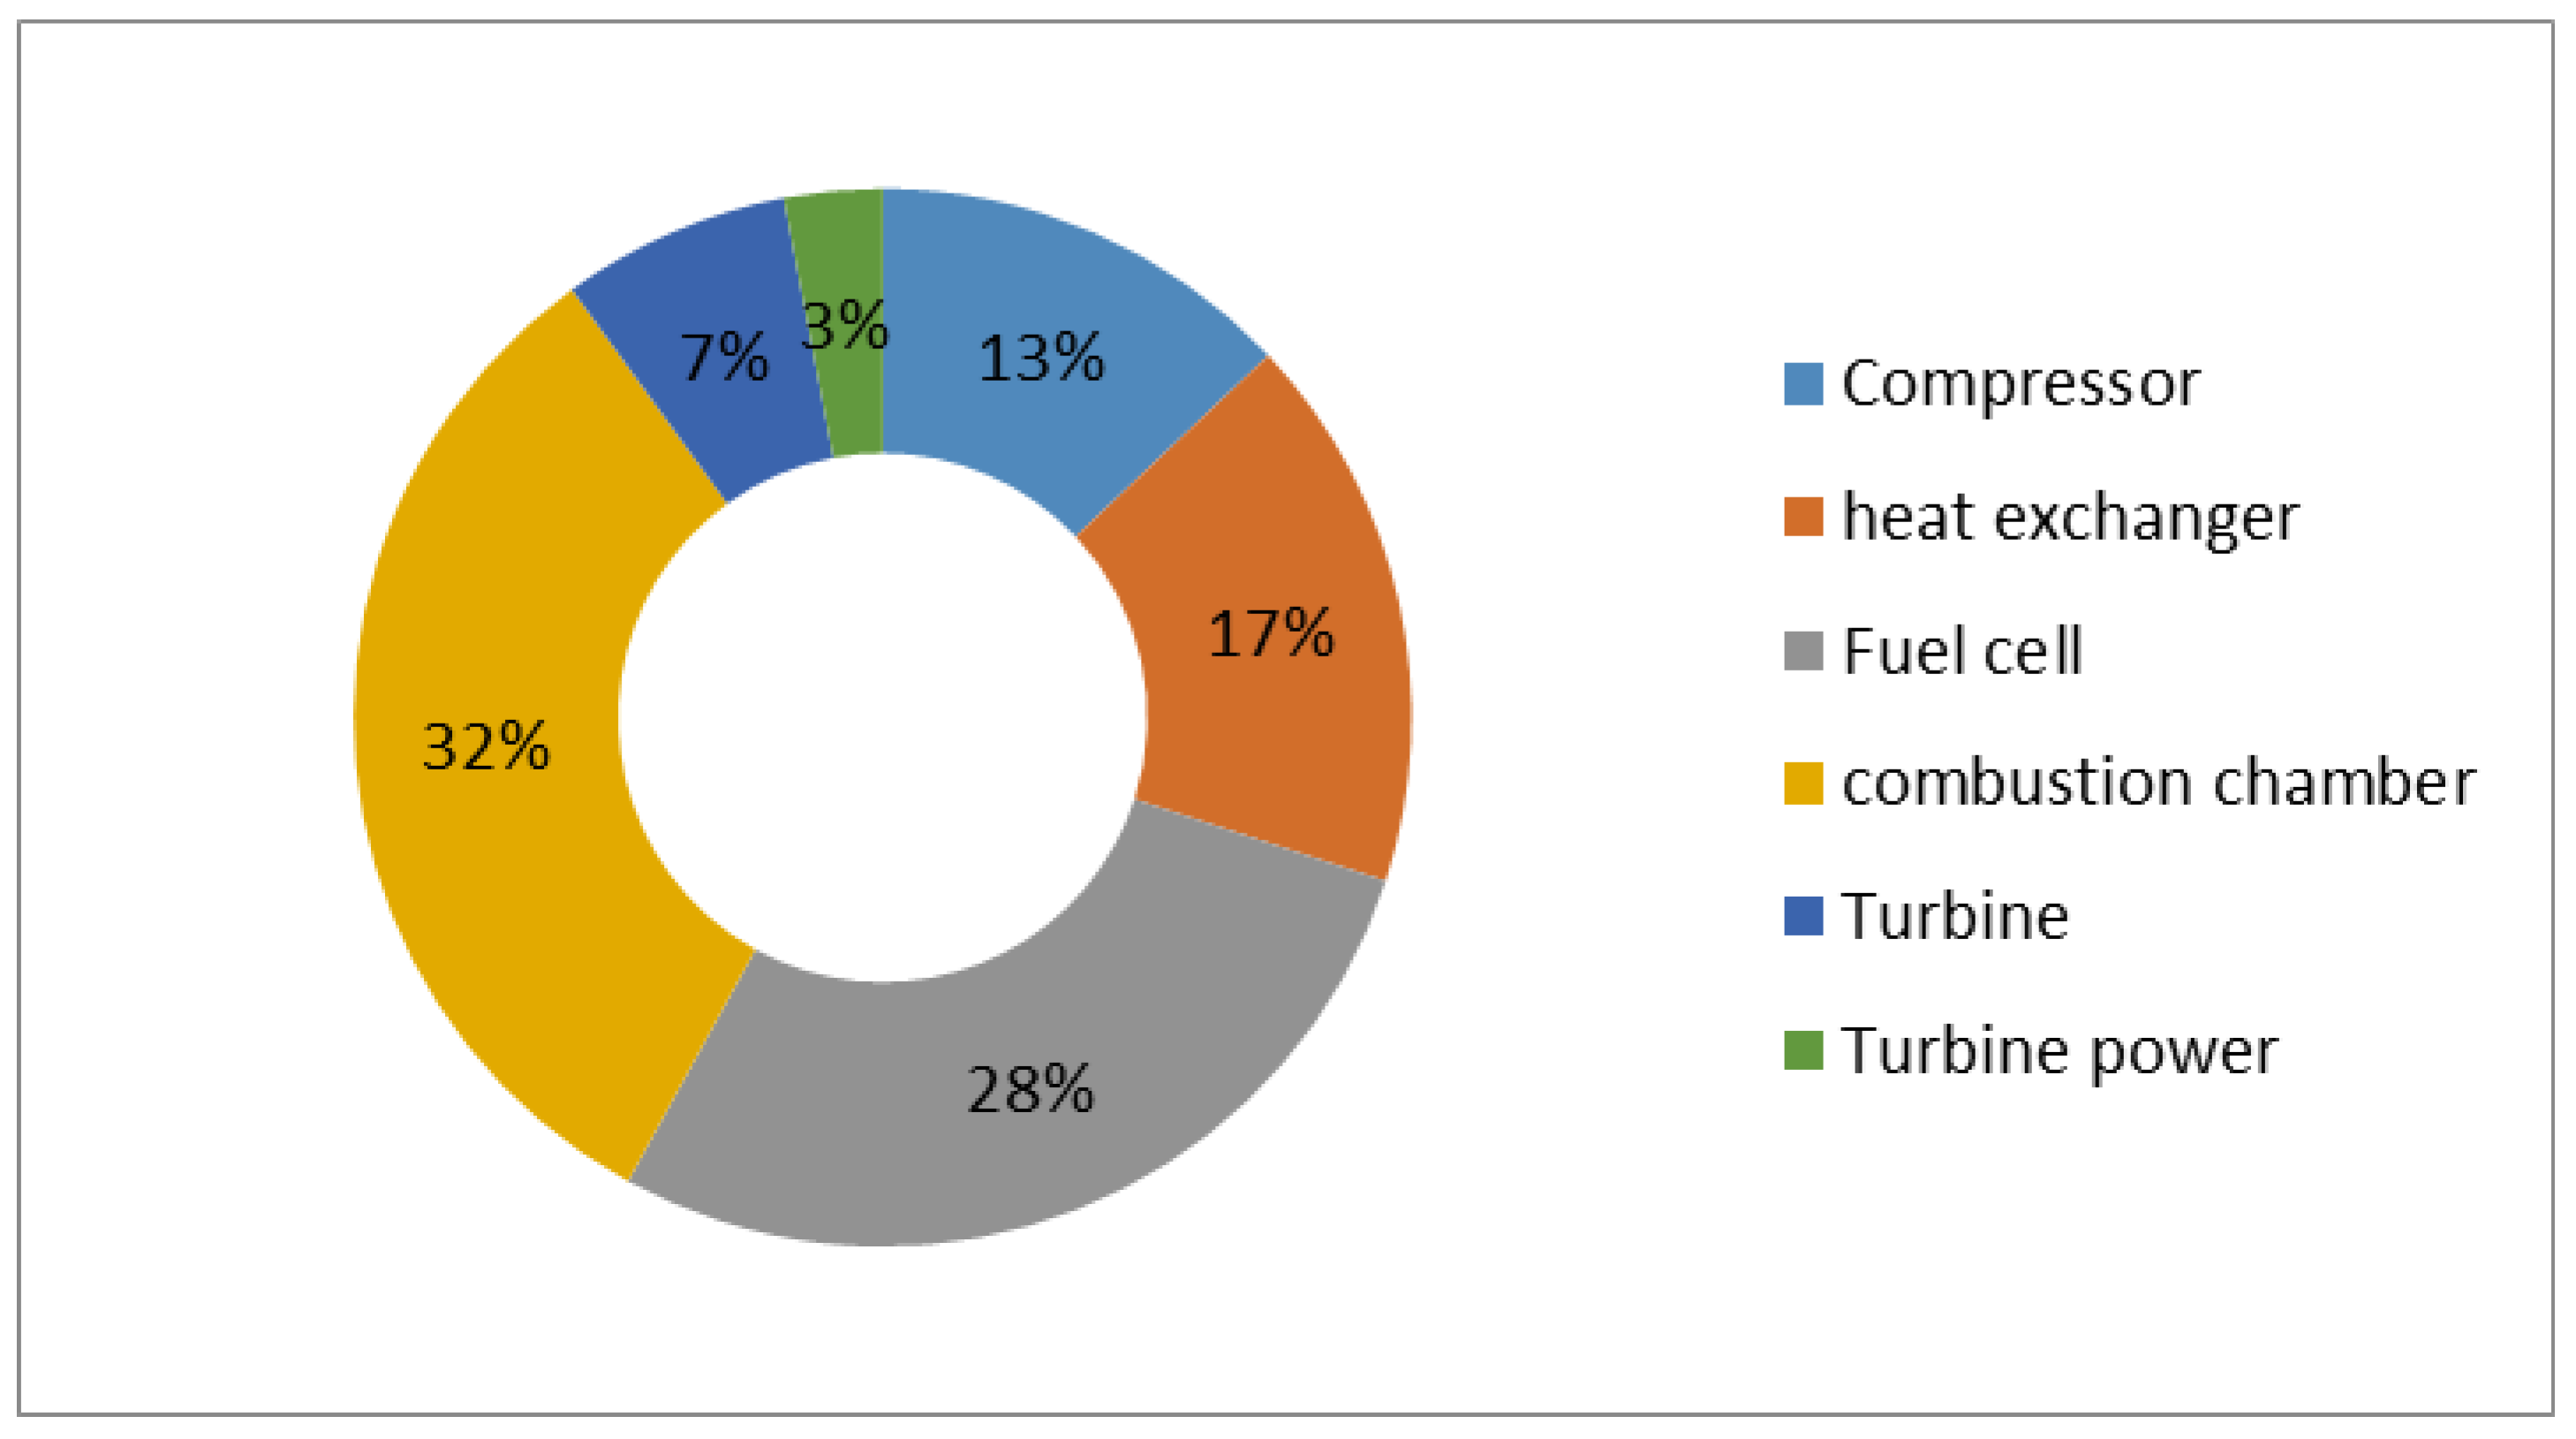
In
Figure 10, the distribution of entropy produced in different components of the combined cycle, as a percentage, occurs at a pressure ratio of 4, and the temperature when entering the turbine is 1250 K. The greatest irreversibility occurs in the combustion chamber and then in the fuel cell, where the greatest amount of fuel reacts. Of course, it should be noted that with the increase in the compressor pressure ratio, the output temperature of the compressor decreases as a result of the increase in the amount of fuel injected into the chamber. As a result, the rate of destruction in the fuel cell increases in terms of the ratio of high pressures.

 ,
, 


