
Water Vapor Budget Features and Its Precipitation Effects over the Key Area of Sichuan-Tibet Railway in Summer

1
Institute of Plateau Meteorology, China Meteorology Administration, Chengdu 610072, China
2
Heavy Rain and Drought-Flood Disasters in Plateau and Basin Key Laboratory of Sichuan Province, Chengdu 610072, China
3
Plateau Atmosphere and Environment Key Laboratory of Sichuan Province, Chengdu 610072, China
*
Author to whom correspondence should be addressed.
Water 2023, 15(6), 1071; https://doi.org/10.3390/w15061071
Submission received: 17 January 2023
/
Revised: 7 March 2023
/
Accepted: 8 March 2023
/
Published: 10 March 2023
(This article belongs to the Section Water and Climate Change)
Abstract
:In this study, we investigate the variation of characteristics of summer precipitation with different magnitudes and the water vapor budget in different key areas of the Sichuan-Tibet Railway by using the daily precipitation data from meteorological stations and the monthly mean ERA-Interim reanalysis data from 1979 to 2018. The results show that the summer heavy precipitation anomaly in the Brahmaputra valley and mountain (BVM) area is generated by the multi-scale interactions between the unique topography and different water vapor transports at low latitudes. When an intense anticyclonic circulation occurs over the western Pacific and the South China Sea, there is also an anomalous anticyclonic circulation extending from the northern Indian Peninsula to the Bay of Bengal. This circulation pattern is conductive to the increase of the water vapor inflow from the southern boundary and the net water vapor budget in the BVM area. The strong southwesterly wind and water vapor convergence over this area thus leading to heavy precipitation in the summer. The summer heavy precipitation amount, frequency and intensity in the western parts of the steep terrain (ST) area on the east slope of the plateau are positively correlated with the water vapor inflow from its western boundary. However, the correlations of the water vapor budget to the summer heavy precipitation amount and frequency are opposite in the eastern parts of the ST area. The unique terrain and circulation patterns lead to the localization and diversity of heavy precipitation in the ST area.
1. Introduction
Traversing the Tibetan Plateau (TP), the Brahmaputra Valley, the Hengduan Mountains, the Sichuan Basin, and and Chengdu Plain, the Sichuan-Tibet Railway crosses the first and second terrain ladders of China and passes through five geomorphic units and several rivers. The altitude differences of the terrain are huge along the railway, and the geological conditions are extremely complex. Specifically, the Kangding-Changdu section of the railway goes across the “Three Parallel Rivers” in the Hengduan Mountains, and spans the mountain and valley area of western Sichuan and the alpine ravine area of southeastern Tibet [1,2]. With the complex distribution of multi-scale terrain and the variable weather, the area along Sichuan-Tibet Railway is frequently hit by disasters, especially mountain-flood geological disasters. Mountain-flood geological disasters are among the most serious latent dangers faced by railway construction, operation, and maintenance. They are mainly caused by precipitation, especially heavy precipitation. Heavy precipitation can affect high-speed railways mainly in two aspects. First, the floods of medium and small rivers caused by heavy precipitation may directly destroy the infrastructure (such as subgrade, power facilities and bridges), as well as the inundation of rails and culverts. Second, the secondary disasters including landslides, mudslides, and collapses may bury rails, resulting in the operation interruption and overturning of trains. The most serious railway accidents in China were all caused by heavy precipitation and secondary geological disasters. Jiang et al. [3] pointed out that the disasters caused by heavy precipitation often occur on the eastern boundary of the TP in summer. Based on the statistics in recent 50 years, Xu et al. [4] found that the railway accidents in China caused by landslides and collapses mainly occur from May to August, among which 60% resulted from the geological disasters generated by heavy precipitation.
The TP and its surrounding areas have complex topography and are very sensitive to climate change. In this region, the intensity, temporal scale and characteristics of the climate change are different, the responses of regional precipitation to warming climate are also different, and the regional difference of precipitation variability is obvious [5,6,7,8,9]. The precipitation amount and precipitation days in the TP decrease from the southeast to the northwest [10,11,12,13]. There is remarkable spatial difference in the inter-annual variation of precipitation in the TP. Liu and Yin [10] found that the inter-annual variation of precipitation in the southeastern TP is much greater that in the central part. The inter-annual variability of summer precipitation in the northern TP is opposite to that in the southern TP [14,15,16,17,18,19,20]. However, there are divergences in the research on the inter-annual variability of summer precipitation. Wu et al. [21] proposed that the precipitation amount displays an overall increasing trend in the TP from 1971 to 2000, but the spatial difference is obvious. Yao et al. [22] showed that from 1979 to 2010, the precipitation decreases in the southeastern TP but increases in the northwestern TP. Gao et al. [23] found that under the background of an overall increasing trend of humidity in the TP, the wet southeastern TP tends to become dry, while the dry southwestern TP shows a wetting trend. Xu et al. [24] pointed out that the precipitation increases in the central and eastern TP, but decreases in the western TP from 1961 to 2001. Duan et al. [16] proposed that the annual precipitation amount increases in the southern TP, while decreases in the northeastern TP from 1960 to 2004. Yang et al. [25] and Li et al. [26] showed that the summer precipitation rises in the central TP, but decreases in the peripheral areas of the TP from 1984 to 2006. The summer precipitation on the TP is closely related to the variation of the mid-latitude westerly circulation, the South Asian monsoon, the East Asian monsoon, the South Asian high, the western Pacific subtropical high, the North Atlantic oscillation, and the sea surface temperature anomaly in the Indian Ocean [11,27,28,29,30,31,32].
The water vapor flux and its divergence, as well as the water vapor budget, are not only important processes affecting regional water cycling, but also the most important and direct impact factors of precipitation [33,34,35,36]. The water vapor source of the precipitation on the TP is mainly from the outside, including the water vapor transported by the South Asian monsoon, the East Asian monsoon, and the westerlies. In recent years, the research on the water vapor budget and its effect has made great progress. It is found that there is a water vapor sink in the southeastern TP in summer. The water vapor is mainly transported from the southern and western boundaries of this region, and the water vapor mainly comes from the Arabian Sea, the Bay of Bengal, the South China Sea, and the mid-latitude westerly transportation [11,20,37,38,39]. The long-term variation characteristics of water vapor on the TP have been studied based on the ERA-Interim data [39,40], the NCEP/NCAR reanalysis data [41,42], surface observation data, sounding data, and satellite data [43,44,45]. Most studies have indicated that the vertically integrated atmospheric precipitable water vapor on the TP shows an overall increasing trend. However, the results vary with different data, study periods, and areas. The water vapor transport in the southeastern TP is mainly controlled by the Asian monsoon [46]. The overall humidification of TP is primarily due to the northward movement of the jet and the enhancement of the South Asian summer monsoon. The strengthening of the monsoon circulation is conducive to the water vapor intrusion to TP from its southern boundary, which increases the water vapor content and precipitation on the TP [23,47,48]. The water vapor variations in the areas controlled by the westerly belt and monsoon contribute to the precipitation over the TP. The precipitation increase over the TP from 1979 to 2013 is mainly due to the enhancement of water vapor transport from the southwest and local water vapor supply [49]. With the interdecadal variation of water vapor over the TP in summer, the precipitation over the plateau also shows corresponding interdecadal variation characteristics [39]. The anomalous water vapor budget at the southern edge of TP directly affects the abnormal distribution of precipitation over the TP and surrounding monsoon areas, and the occurrence and development of extreme drought and flood events [50]. The water vapor transported through the Brahmaputra Valley plays a critical role in the precipitation in the southeastern TP [51].
Previous studies mainly focused on the spatio-temporal variation characteristics of water vapor and precipitation over the TP. However, there are few studies on the water vapor transport variations and their effect on precipitation at the southeast verge of TP under the joint influence of plateau terrain and the Indian thermal low. Moreover, the investigation on the typical variation characteristics of regional precipitation and water cycle process in the key area along the Sichuan-Tibet Railway has been seldom carried out. The altitude difference in the key area of the Sichuan-Tibet Railway on the southeastern TP exceeds 4000 m. Steep terrains and intense plate activities can be found in these areas, resulting in frequent mountain hazards and a fragile ecological environment. The regional precipitation in the key area of the Sichuan-Tibet Railway is an important component of the plateau precipitation. However, what are the spatio-temporal distribution characteristics of the precipitation in this area? What is the relationship between the regional precipitation and the water vapor budget inside and outside this area? These questions are worth deep and careful studying.
Therefore, the key area of the Sichuan-Tibet Railway is selected as the study area, and it is also the most difficult section for the construction at present. In this study, the spatio-temporal characteristics of precipitation with different magnitudes and the variation characteristics of summer water vapor transport and budget in this area are analyzed. Moreover, the occurrence and development mechanisms of heavy precipitation affected by the multi-scale complex terrain are studied. Finally, the effects of plateau terrain, river valley and mountains, and steep terrain of the TP eastern slope on the heavy precipitation in the key area of Sichuan-Tibet Railway are analyzed. We hope this study could deepen the understanding on the weather and climate of TP and help improve the forecast performance on the summer precipitation in the key area of Sichuan-Tibet Railway. Moreover, the conclusions can be applied to the construction of major projects and the disaster prevention and mitigation, providing the meteorological scientific and technological support for the safe and high-quality construction of the Sichuan-Tibet Railway.
2. Materials and Methods
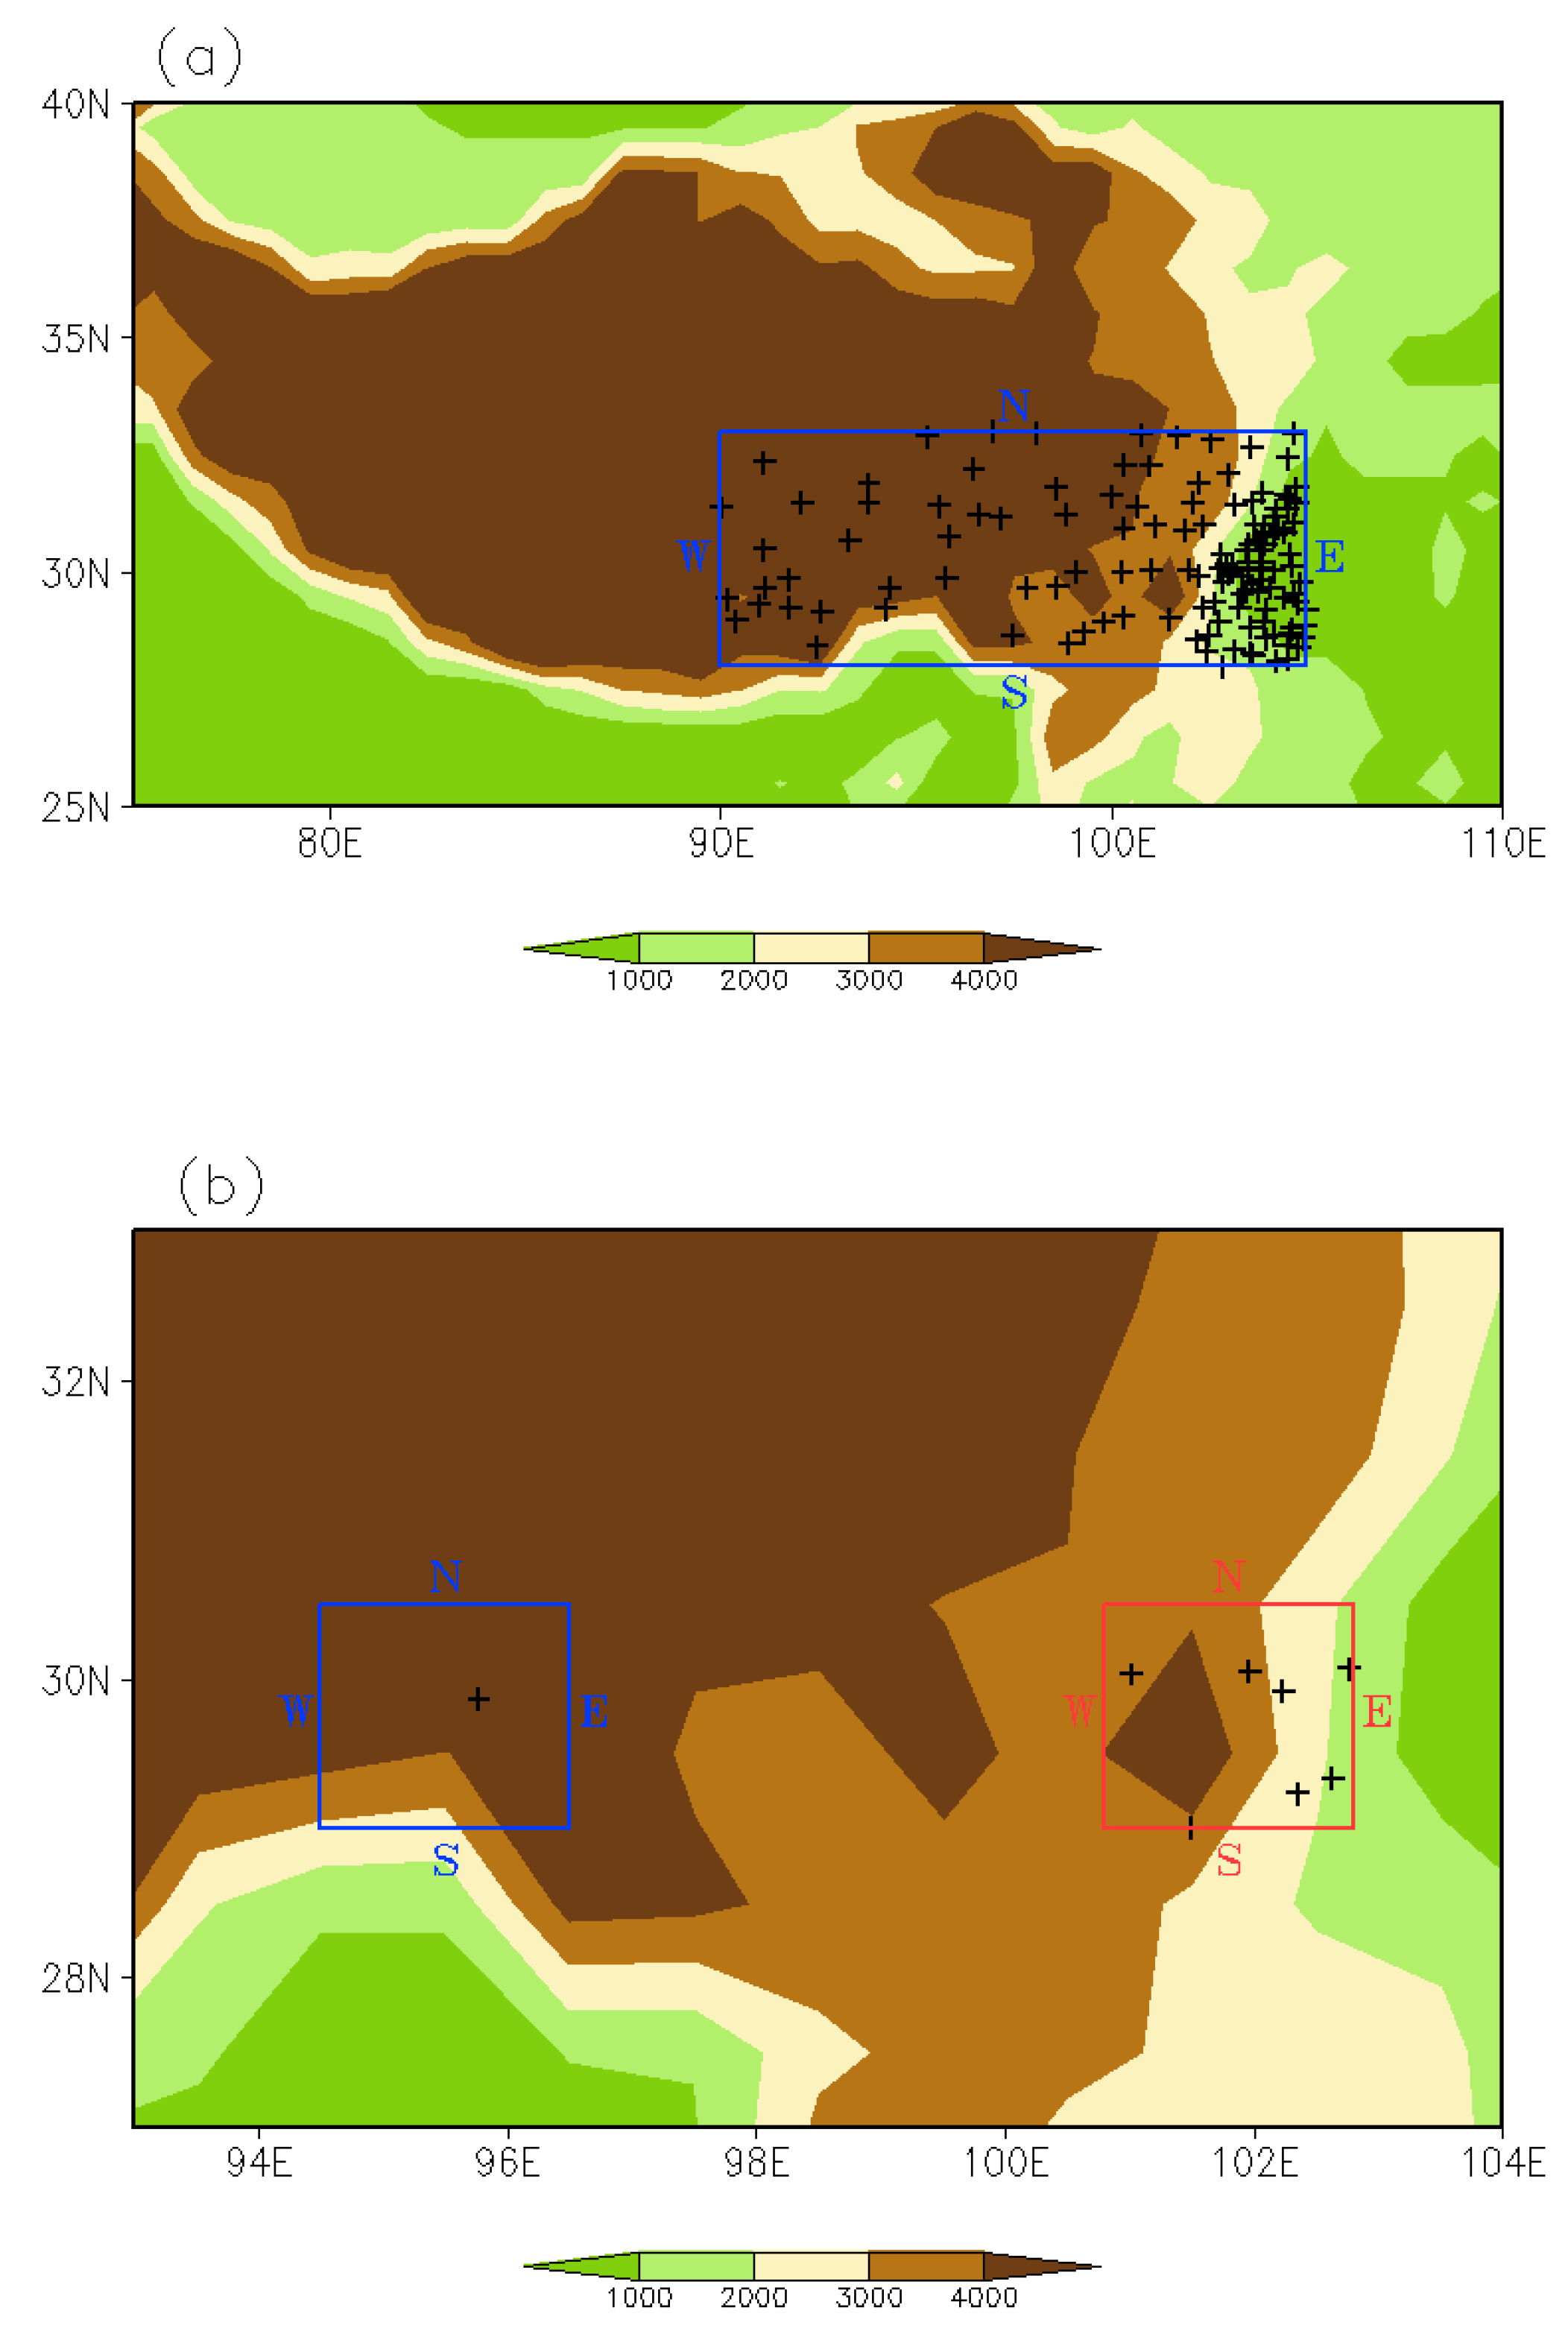
To explore the variability of the water vapor budget, we use the monthly mean ERA-Interim reanalysis dataset [52] with a horizontal resolution 1.5° × 1.5° grid over the period 1979–2018, including the geo-potential height, horizontal meridional wind, horizontal zonal wind, specific humidity from 1000 hPa to 300 hPa, and the corresponding surface pressure. To explore the spatio-temporal characteristics of precipitation with different magnitudes, we use the latest version (V3) of surface climatological daily rain gauge data from the China National Meteorological Information Center. We selected 130 stations in the key area of Sichuan-Tibet Railway (the distribution of stations is shown in Figure 1a). Only the sites with complete daily data during 1979–2018 and a number of missing days less than 10 per year are selected.
The study area is the key area of the Sichuan-Tibet Railway (STR area) (28–33° N, 90–105° E, Figure 1a). The sub-area 1 is the key area of the Brahmaputra valley and mountain (BVM area) on the southern slope of TP (29.0–30.5° N, 94.5–96.5° E). The sub-area 2 is the key area of the steep terrain on the eastern slope of the plateau (ST area) (29.0–30.5° N, 100.8–102.8° E) (Figure 1b). In addition, there are four boundaries for each key area, and the S, W, N, and E represent the southern, western, northern, and eastern boundaries, respectively. The positive values of water vapor budget indicate water vapor inflow on the boundary of the region, while negative values indicate outflow. The net water vapor budget in the STR area (the BVM area and ST area) is the sum of the net water vapor transport through the southern, western, northern and eastern boundaries, while the positive (negative) values of net water vapor budget indicate that the whole region acts as a water vapor sink (source).
It should be noted that the STR area contains the complex terrain of the TP main body and its surrounding slopes. The sub-area 1 (BVM area) reflects the south–north steep terrain on the southern slope of TP. The sub-area 2 (ST area) exhibits the west–east steep terrain on the eastern slope of TP. Moreover, the terrains and circulation patterns in these typical areas have remarkable and unique influence on the TP climate.
The vertically integrated water vapor fluxes (units: kg m−1 s−1) are defined as:
The water vapor transport calculated by the boundary integral is calculated as:
where q is the specific humidity (units: kg kg−1), u, ν are the zonal wind and meridional wind, respectively (units: m s−1), g is the acceleration of gravity (units: m s−2), λ and φ are the longitude and latitude, respectively, a is the radius of the earth, and Ps is the surface pressure. The pressure of top layer Pt is set as 300 hPa (units: Pa), because there is negligible water vapor above 300 hPa.
The regional total water vapor budget (units: kg s−1) is calculated as follows:
where is the total water vapor inflow and is the total water vapor outflow.
According to the meteorological standards of grade classification of rainfall intensity released by the China Meteorological Administration, the 24 h accumulated precipitation R has the following levels: light to moderate rain (0.1 mm ≤ R < 25 mm), heavy rain (25 mm ≤ R < 50 mm, and rainstorm (R ≥ 50 mm). Because the STR area is located on the TP and the days with R above 50.0 mm are few, the heavy precipitation refers to the events with R above 25.0 mm in this study. The precipitation amount is the accumulated precipitation, the precipitation frequency is the number of precipitation occurrences, and the precipitation intensity is the ratio of the precipitation amount to the precipitation frequency. Analysis methods include correlation analysis, composite analysis, regression analysis, linear trend estimation method, and Student’s t test.
3. Results
3.1. Spatio-Temporal Variations of Summer Precipitation with Different Magnitudes in the STR Area
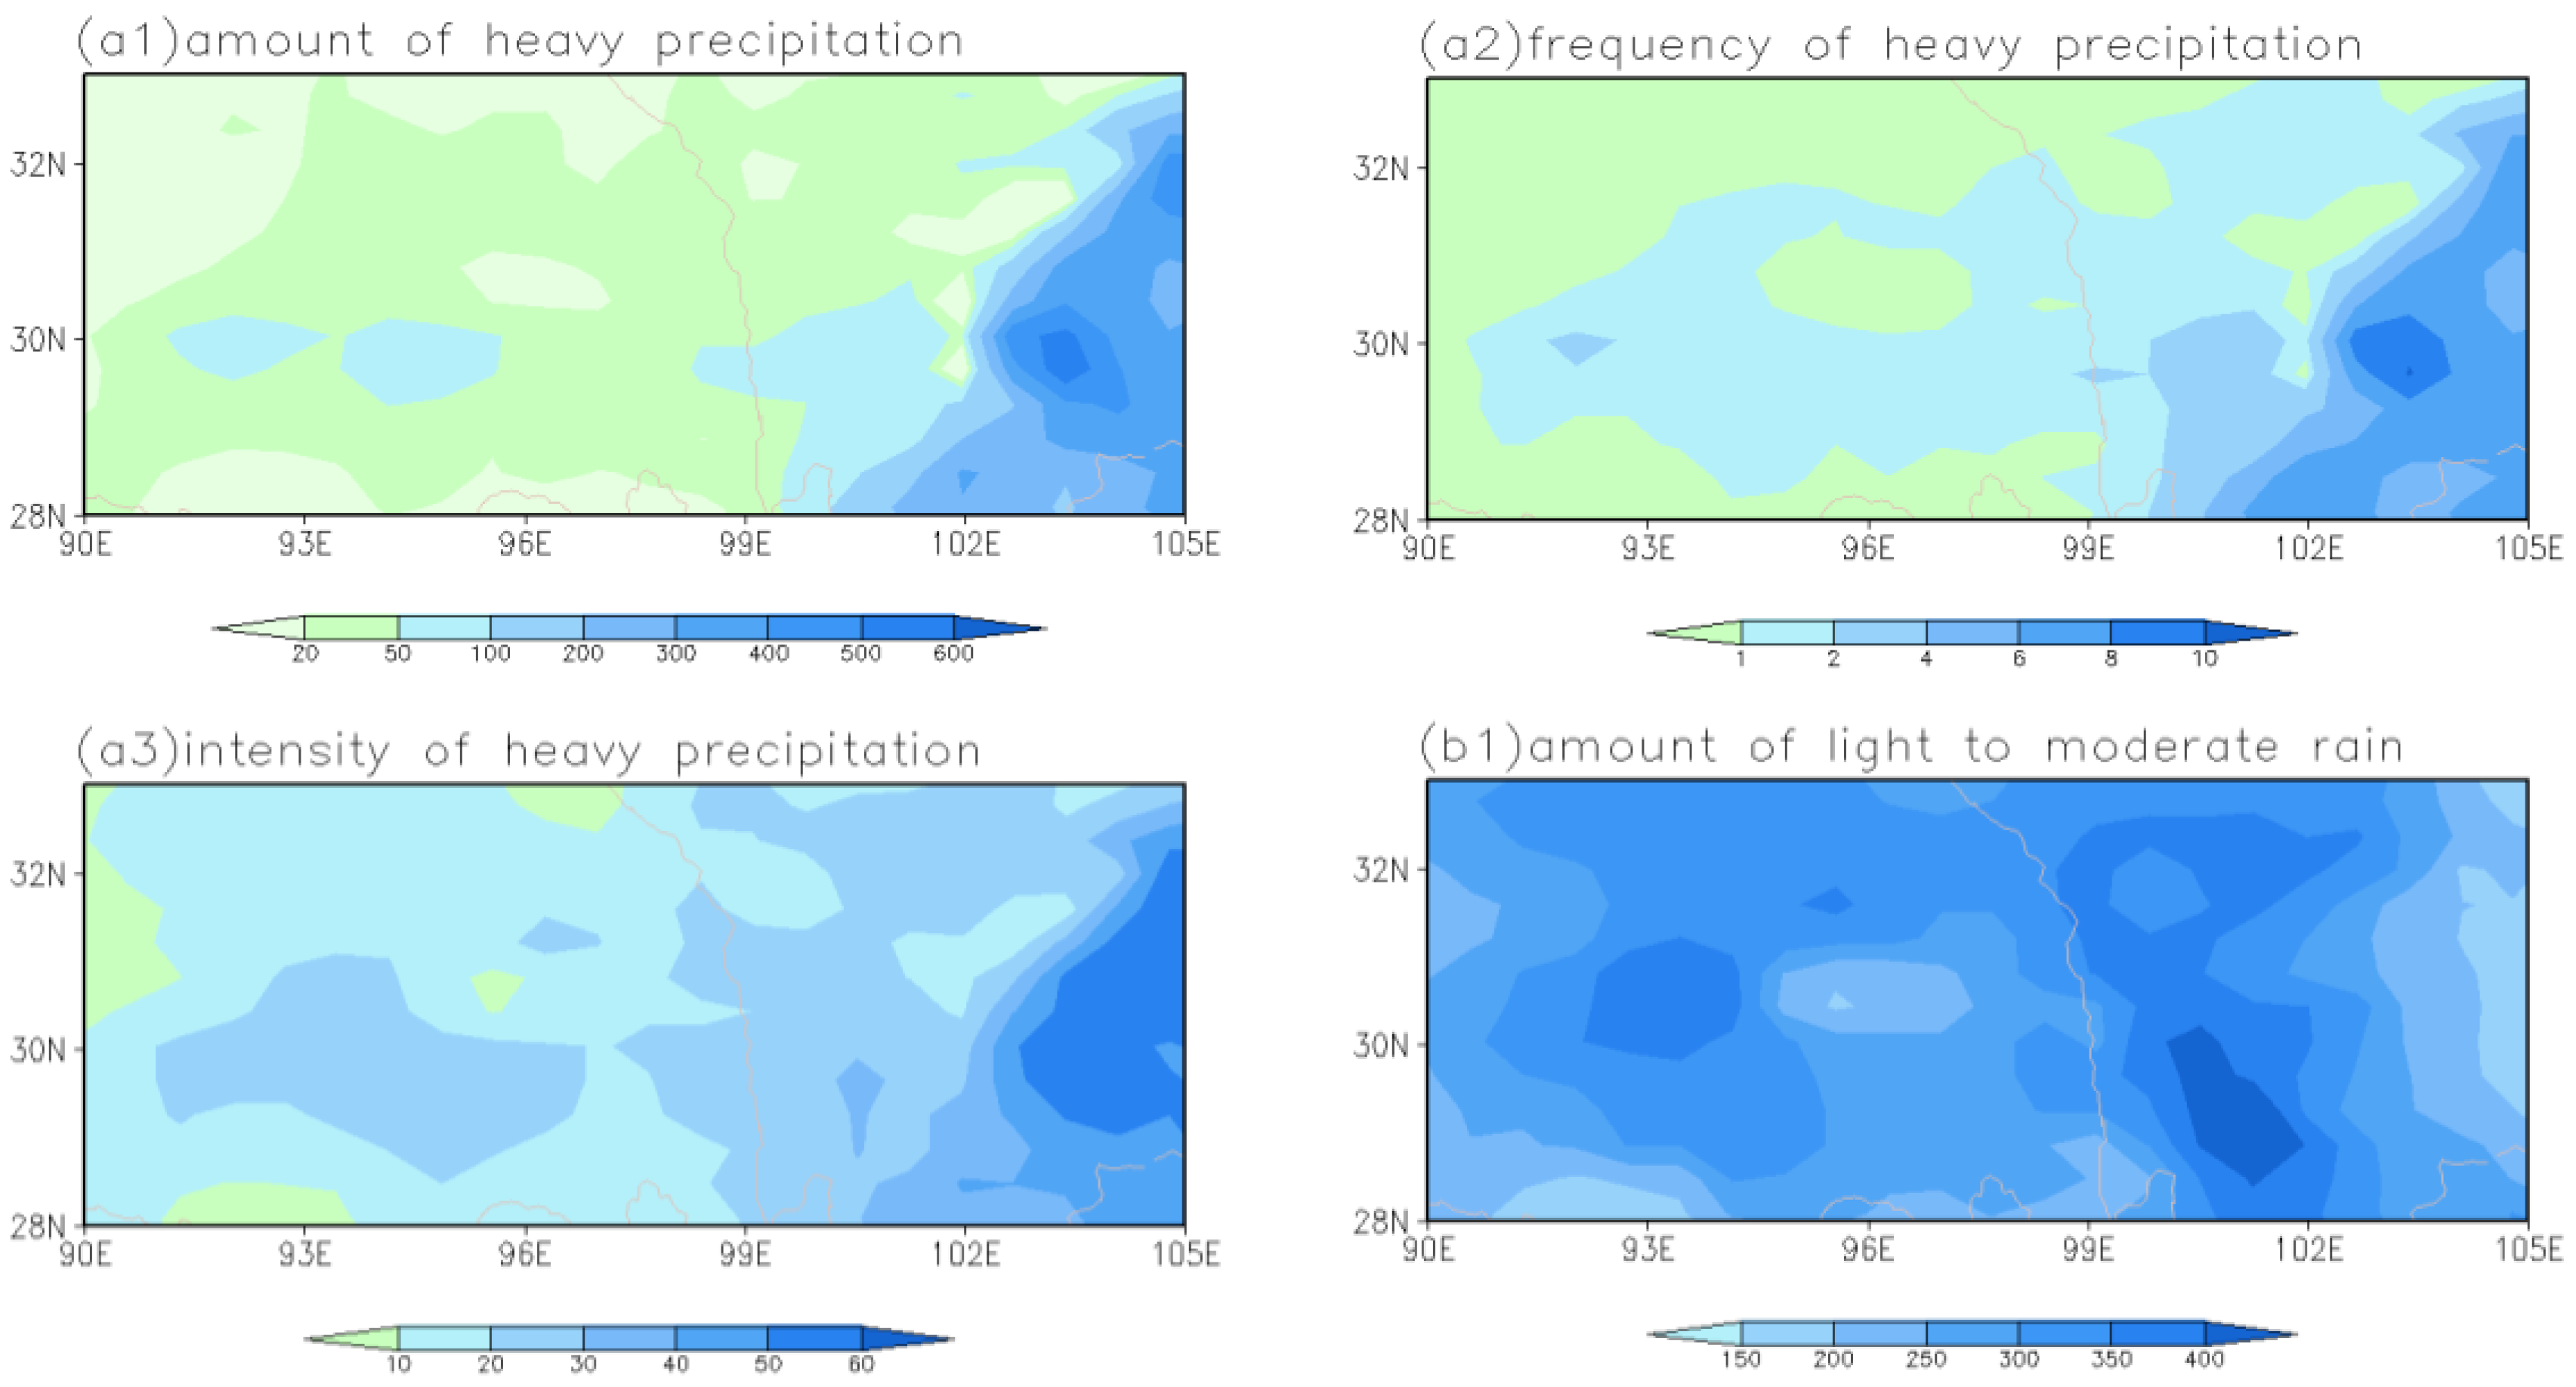
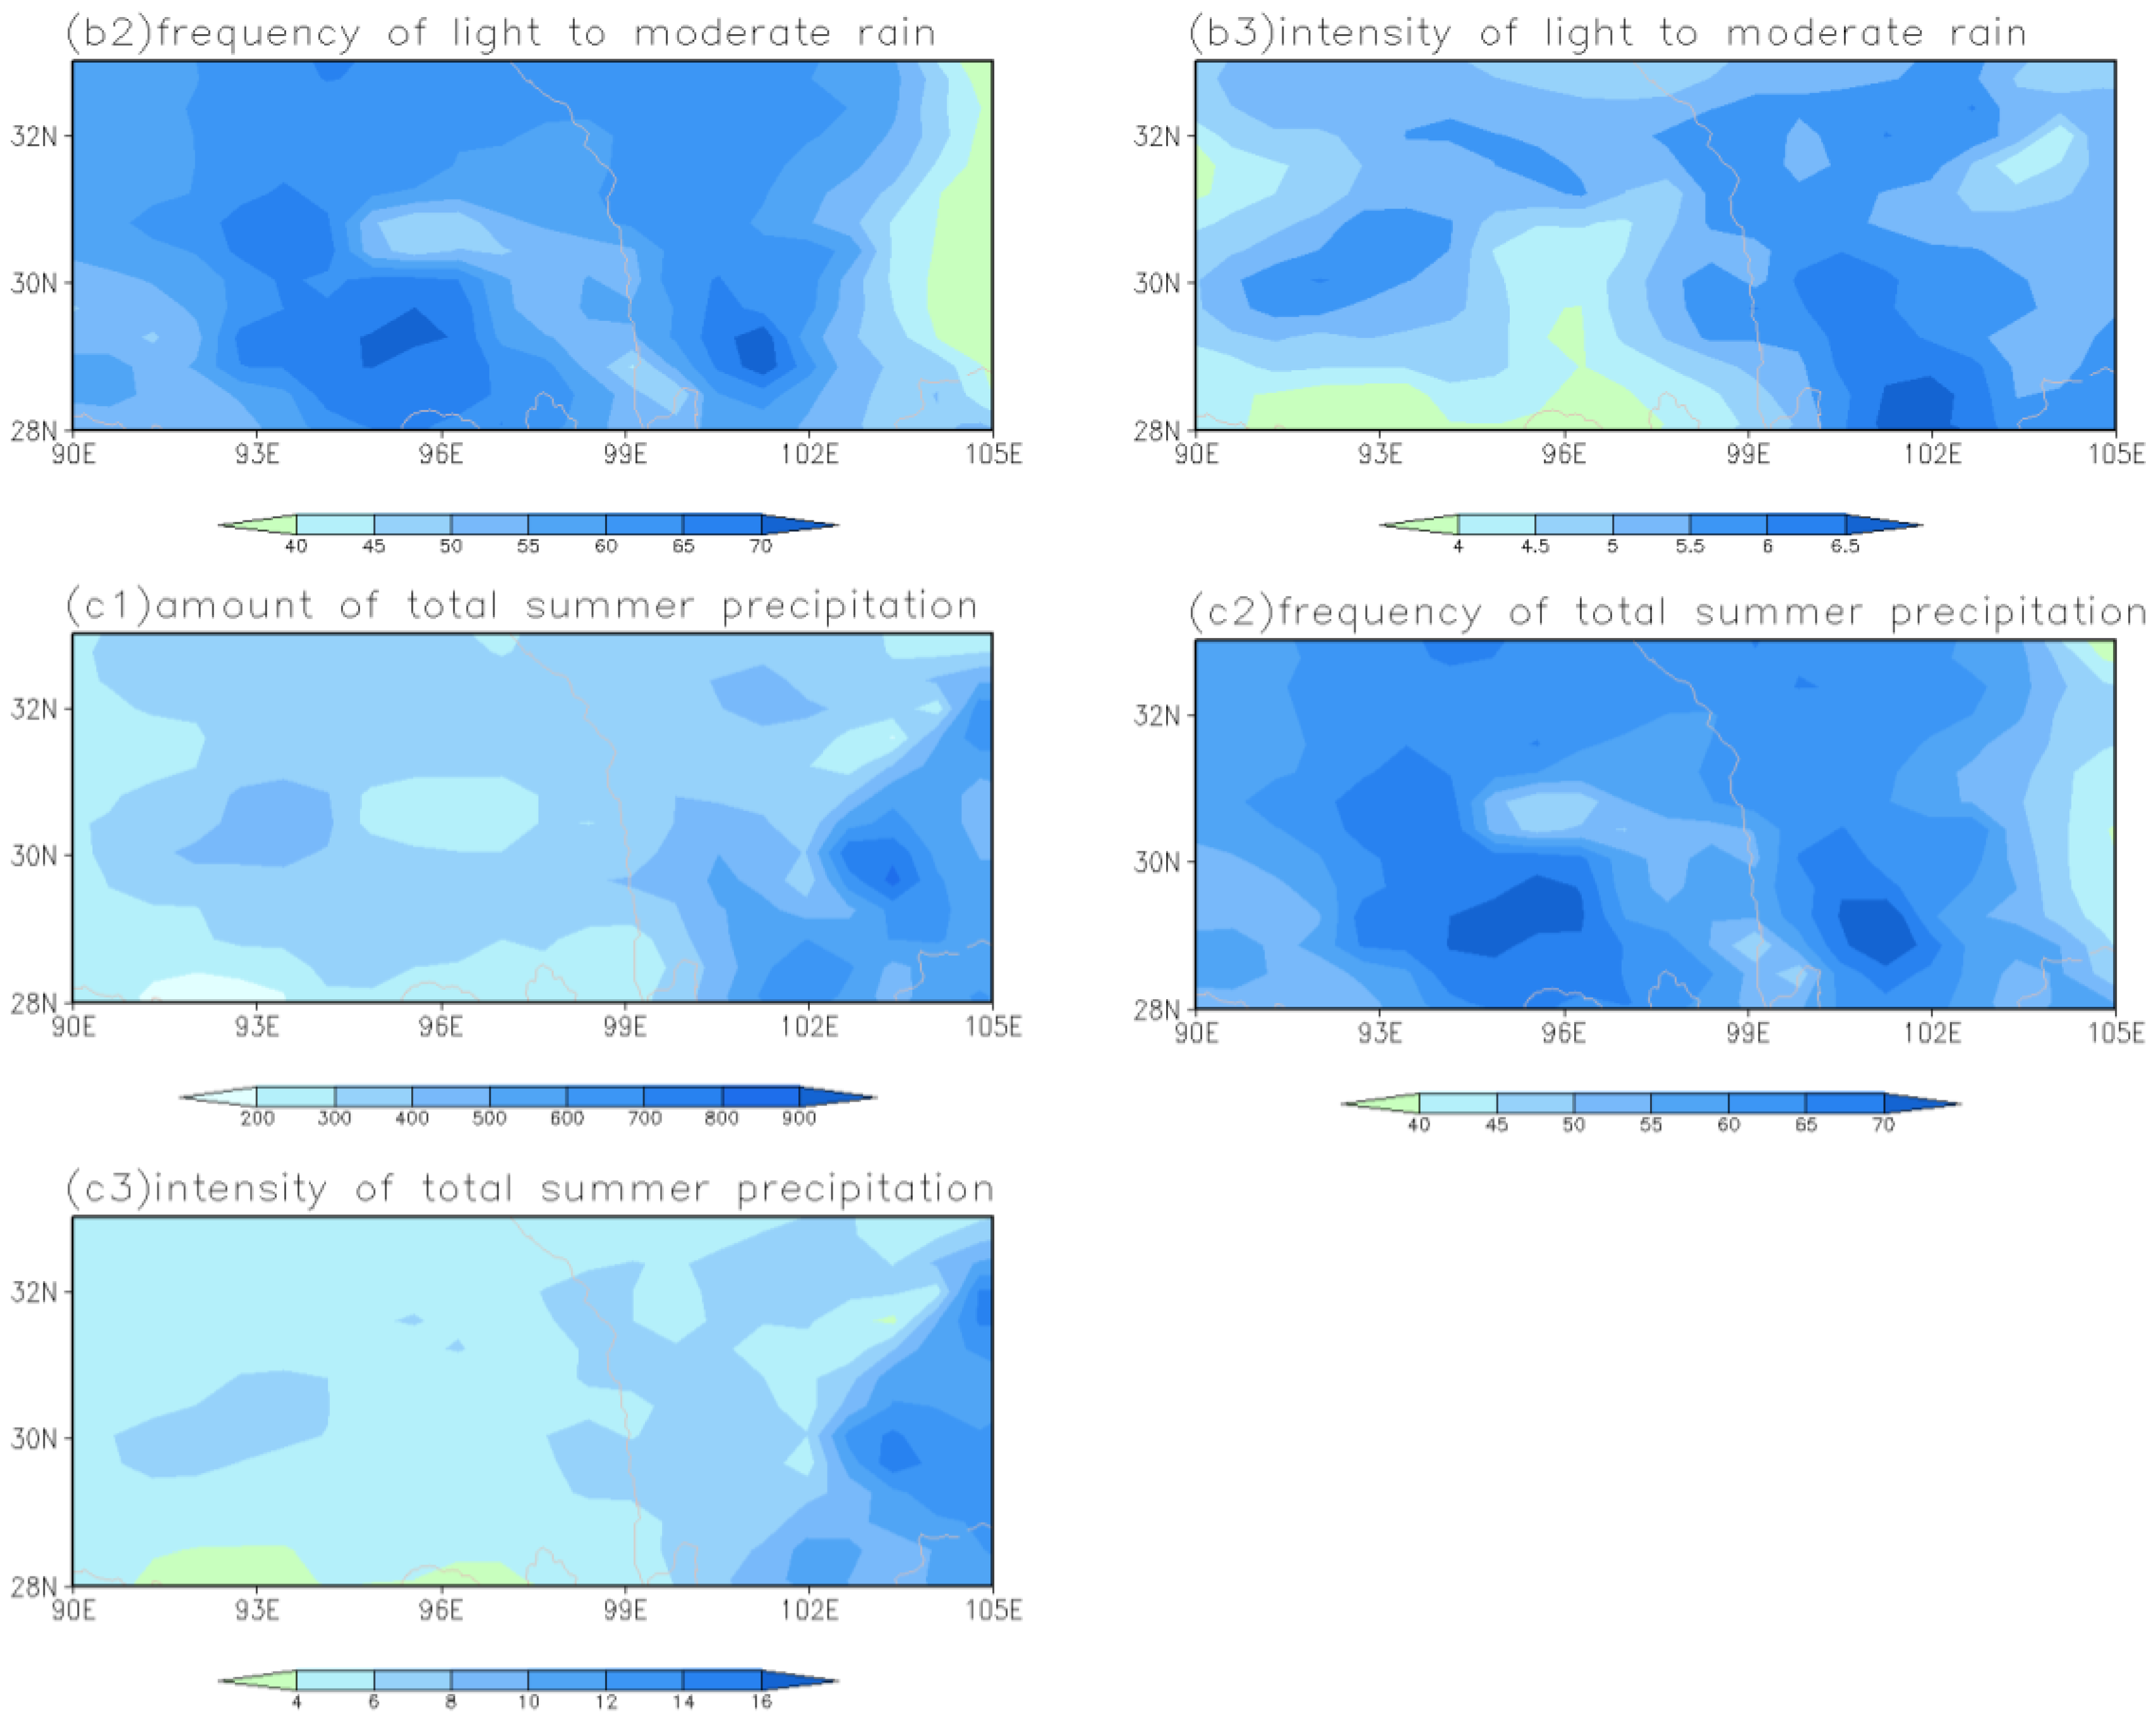
Figure 2 shows that the spatial distribution differences of summer precipitation with different magnitudes are remarkable in the STR area. Due to the terrain that is high in the west and low in the east, the difference of summer heavy precipitation mainly distributes in the west–east direction. The precipitation amount, frequency, and intensity of heavy precipitation increase gradually from west to east, with low values on the TP and high values in the Sichuan-Chongqing basin. The large gradient of heavy precipitation between the TP and the Sichuan-Chongqing basin is closely related to the abrupt elevation of terrain in the Western Sichuan Plateau. The maximum values of precipitation amount, frequency, and intensity of heavy precipitation are located in the western Sichuan-Chongqing basin which is in the eastern part of the west–east steep terrain on the eastern slope of TP. The largest values of precipitation amount, frequency, and intensity of heavy precipitation distribute in Ya’an along the slope between the plateau and the basin. Ya’an is the precipitation center of the China inland and is the well-known ‘Ya’an sky-leakage’ [8], where the precipitation amount, frequency, and intensity of summer heavy precipitation are 711.0 mm, 11.7 times, and 61.5 mm, respectively. The minimum areas of precipitation amount, frequency, and intensity of heavy precipitation are located in the southern Qinghai Province on the TP. The lowest values are observed in Yushu with the heavy precipitation amount of 6.2 mm, the frequency of 0.2 times, and the intensity of 5.5 mm (Table 1 and Figure 2(a1–a3)). The area with the largest precipitation amount and frequency of heavy precipitation in the Tibet is from Lhasa to Nyingchi on the northwest of BVM area. This is closely related to the south–north steep terrain of the Brahmaputra Grand Canyon on the east of the Himalayas. In addition, in the western Sichuan-Chongqing basin and the area from Lhasa to Nyingchi where the heavy precipitation is large, and in the slope area of the Western Sichuan Plateau, the secondary disasters such as landslides and mudslides often occur.
The precipitation amount and intensity of light to moderate rain are larger in the area from Lhasa to Nyingchi in Xizang, the Western Sichuan Plateau and southwestern Sichuan. The values are smaller in southern Shannan and the junction area of Gansu and Sichuan. The maximum values of precipitation amount and intensity, respectively, appear in Jiulong and Yuexi, while the minimum values are, respectively, in Wenxian and Longzi. The precipitation frequency is large in the river valley and mountain areas of the steep terrain on the southern slope of TP and the Western Sichuan Plateau, and is small in the northern Sichuan-Chongqing basin. The maximum value of precipitation frequency appears in Jiulong, while the minimum value is in Zizhong (Table 1 and Figure 2(b1–b3)).
The precipitation amount and intensity of total summer precipitation are large in the Sichuan-Chongqing basin and are small in southern Shannan. The maximum values of the precipitation amount and intensity, respectively, appear in E’meishan and Ya’an in the Sichuan basin. The minimum values of the precipitation amount and intensity are in Longzi in southern Shannan. The frequency of total summer precipitation is high in the Western Sichuan Plateau and the river valley and mountain areas of the steep terrain on the southern slope of TP, and is low in the junction area of Gansu and Sichuan. The maximum value is in Jiulong, and the minimum value is in Wenxian (Table 1 and Figure 2(c1–c3)).
The temporal trends of the heavy precipitation amount show a “+−+−” pattern from west to east in the STR area. It is indicated that the heavy precipitation amount has increased from Lhasa to Nyingchi and from the east edge of Tibet to the Western Sichuan Plateau. The heavy precipitation amount has decreased in the western Sichuan basin and from the east of Nyingchi to Zayü in the BVM area. The decreasing trend of heavy precipitation is especially significant in the BVM area on the east of Nyingchi, and the increasing trend is quite significant from Changdu to Mangkang in the east edge of Tibet (significant at the 95% confidence level). The area from Kangding of Sichuan to Changdu of Tibet is a high-hazard area of geological disasters [26], and meanwhile the heavy precipitation amount has increased significantly in this area, which increases the risk of geological disasters (Figure 3a).
The light to moderate rain amount shows a significant increasing trend in the junction area of Sichuan, Yunnan, and Tibet (significant at the 95% confidence level), and a significant decreasing trend in the river valley and mountain areas of the steep terrain on the southern slope of TP, southeastern Qinghai, and northern Sichuan-Chongqing basin (significant at the 95% confidence level) (Figure 3b). The total summer precipitation amount shows a significantly increasing trend near Lhasa and in the junction are of Sichuan, Yunnan, and Tibet (significant at the 95% confidence level), and significant decreasing trend in the southeastern Qinghai (significant at the 95% confidence level) (Figure 3c).
3.2. The Regional Variation Characteristics of Water Vapor Budget in the STR Area
Table 2 shows that water vapor flows into the STR area from the southern and western boundaries for the whole year and each season, while it flows out from the eastern boundary. The inflow from the western boundary is much smaller than from the southern boundary. The water vapor flows out of the STR area from the northern boundary for the whole year, summer and autumn, and flows into the area from the northern boundary in spring and winter. The outflow in autumn is especially larger than that in summer, and the inflow in spring is larger than that in winter. The total water vapor inflow is the largest in summer, followed by spring, autumn, and winter. The total water vapor outflow is the largest in autumn, followed by spring, winter, and summer. The net water vapor budget is positive for the whole year and each season, being the largest in summer, followed by spring, autumn, and winter. It is indicated that summer is the season with the most active water vapor transport. Therefore, the STR area is an obvious water vapor sink for the whole year and each season.
3.2.1. The Climate Change of Water Vapor Budget in the STR Area
Figure 4 shows that from 1979 to 2018, the water vapor inflow from the southern and western boundaries of the STR area have gradually decreased, while the water vapor outflow through the northern boundary has increased significantly and that from the eastern boundary has decreased significantly (significant at the 95% confidence level), leading to the decreasing trend of the net water vapor budget in summer (amplitude of 1.28 × 10⁶ kg s−1 (10 a)−1). As the decrease of water vapor inflow from the southern and western boundaries and the decrease of water vapor outflow through the eastern boundary are close to each other, the reduction of the net water vapor budget in the STR area is mainly caused by the increased water vapor outflow through the northern boundary.
Figure 5 shows that the most remarkable characteristic for summer water vapor transportation is the intensive southwesterly water vapor transport belt, which is formed by the strong easterly flow from the southern hemisphere when it crosses the equator at 40–60° E. This water vapor transport belt reflects the interaction of weather systems in the southern and northern hemispheres. The water vapor is continuously transported by the southwesterly airflow to China. Affected by the East Asian monsoon, South Asian monsoon and plateau monsoon, the water vapor transport in the STR area is complicated. The water vapor in the whole study area is mainly transported by the southerly flow of the monsoon circulation from the Bay of Bengal and the southwesterly flow from the northern Arabian sea. The water vapor is also transported by the westerly flow at middle latitudes, but not so much as that by the southerly flow. Therefore, the water vapor inflow from the southern boundary is significantly larger than that from the western boundary in summer, and the southern boundary is the main boundary for water vapor inflow to the STR area. The eastern boundary is the main boundary for water vapor outflow from the STR area.
3.2.2. The Climate Change of Water Vapor Budget in the BVM and ST Areas
Water vapor transport is closely related to the water vapor channel. The north–south inclined terrain in the lower reaches of the Brahmaputra Grand Canyon in the southeastern TP forms a topographic channel of the huge flabellate slope. In summer, the southerly warm-wet airflow from the Indian Ocean and the Bay of Bengal travels from the estuary of the Bay of Bengal to the Brahmaputra Grand Canyon along the Brahmaputra Rivers, forming the famous Brahmaputra water vapor channel. The variations of water vapor transport and precipitation in this area may influence the precipitation and climate of the TP and even the whole East Asia [51,53,54]. Thus, the water vapor budget in the BVM area has important significance on weather and climate. The west–east inclined terrain in the transition zone between the TP and the Sichuan-Chongqing Basin forms a topographic barrier with a large altitude difference. Within 100 km from east to west, the elevation difference is above 3000 m. Therefore, the water vapor budget in the ST area reflects the multi-scale interaction of earth-atmosphere processes.
Table 3 shows that the water vapor inflows of the BVM and ST areas are all from the southern and western boundaries for the whole year and summer, and the outflows are from the northern and eastern boundaries. The inflow from the southern boundary of the BVM area is larger than that from the western boundary, which is opposite to that of the ST area. The outflow from the eastern boundary is larger than that from the northern boundary in both areas. The net water vapor budgets are both positive, indicating that the two areas are water vapor sinks. In addition, the water vapor inflow (outflow) from the southern (northern) boundary of the BVM area is much larger than that of ST area, and the water vapor inflow from the western boundary of the BVM area is less than that in the ST area. It is illustrated that the south–north water vapor transport in the BVM area is more obvious, while the east–west water vapor transport in the ST area is more obvious. Moreover, the total inflow, total outflow, and net water vapor budget in the BVM area are all larger than those in the ST area. This may be related to the influence of monsoons and topography. The BVM area is directly affected by the South Asian monsoon. The south–north terrain near the turning point of the Brahmaputra Grand Canyon is conducive to the south–north water vapor transport by monsoon. Differently, the ST area is located in the inland area, and is less directly affected by the Asian monsoon. The prominent altitude difference of the west–east terrain in the ST area is more favorable for the water vapor transport from the west to the east. Meanwhile, the relatively closed terrain of ST area is not conducive to its interaction with the peripheral circulation. However, the BVM area is in the water vapor transport channel of the Asian monsoon. Therefore, the water vapor budget in the BVM area changes more significantly and actively than that in the ST area.
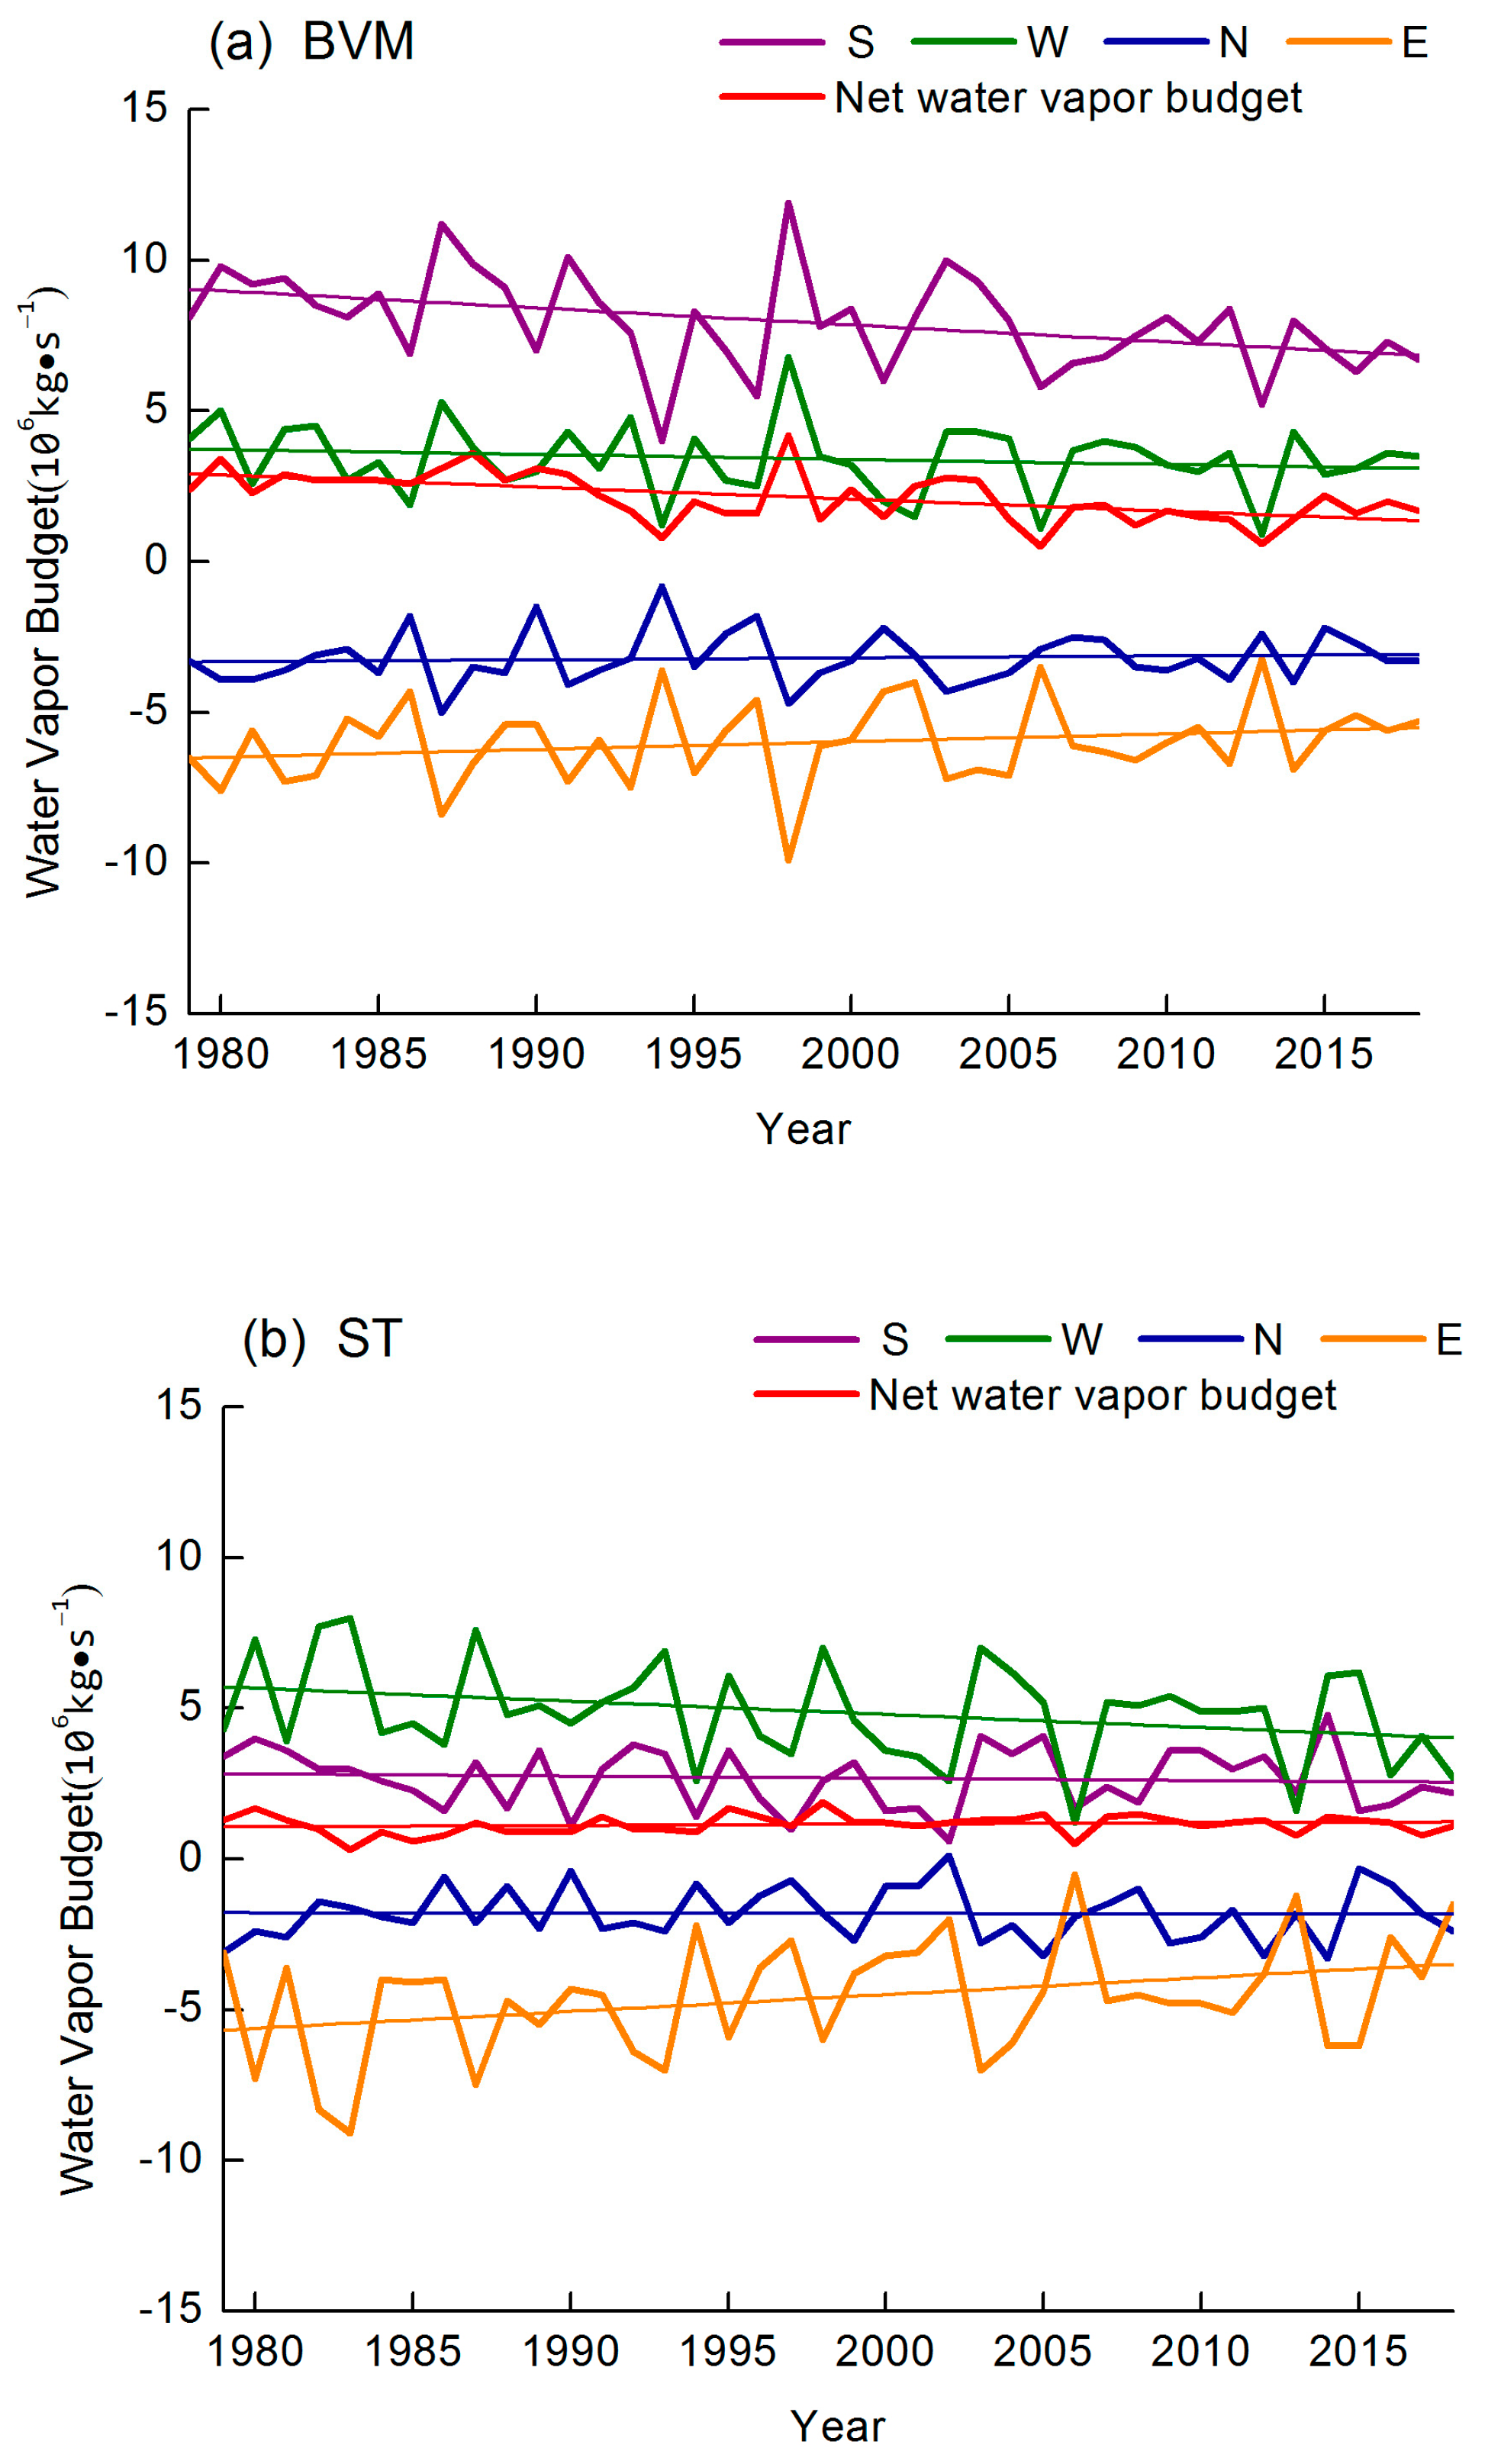
Figure 6 shows that from 1979 to 2018, the water vapor inflow from the southern boundary of BVM area shows a remarkable decreasing trend. The water vapor outflow from the northern and eastern boundaries and inflow from the western boundary both exhibit a decreasing trend. The net water vapor budget displays a significant decreasing trend of 0.40 × 10⁶ kg s−1 (10 a)−1 (significant at the 99.9% confidence level) (Figure 6a). However, the water vapor inflow from the southern and western boundaries of the ST area shows a decreasing trend. The water vapor outflow from the northern boundary has a slight increasing trend, and that from the eastern boundary shows a significant decreasing trend. Thus, the net water vapor budget exhibits a slight increasing trend (Figure 6b). In the summers from 1979 to 2018, the significant reduction of the net water vapor budget in the BVM area is mainly due to the obvious decrease of water vapor inflow from the southern boundary which is the main boundary of water vapor inflow. In the ST area, the water vapor inflow from the western boundary has significantly decreased, and the water vapor outflow from the eastern boundary has also decreased. As a result, the net water vapor budget has increased slightly. The abnormal evolution of the influence area and intensity of the South Asian monsoon and the effect of north–south terrain in the BVM area near the turning point of the Brahmaputra Grand Canyon on the water vapor transport jointly lead to the significant inter-annual variation of water vapor inflow from the southern boundary of the BVM area.
3.3. The Effects of the Water Vapor Budget on Summer Heavy Precipitation
3.3.1. The Effects of the Water Vapor Budget on Summer Heavy Precipitation in the STR Area
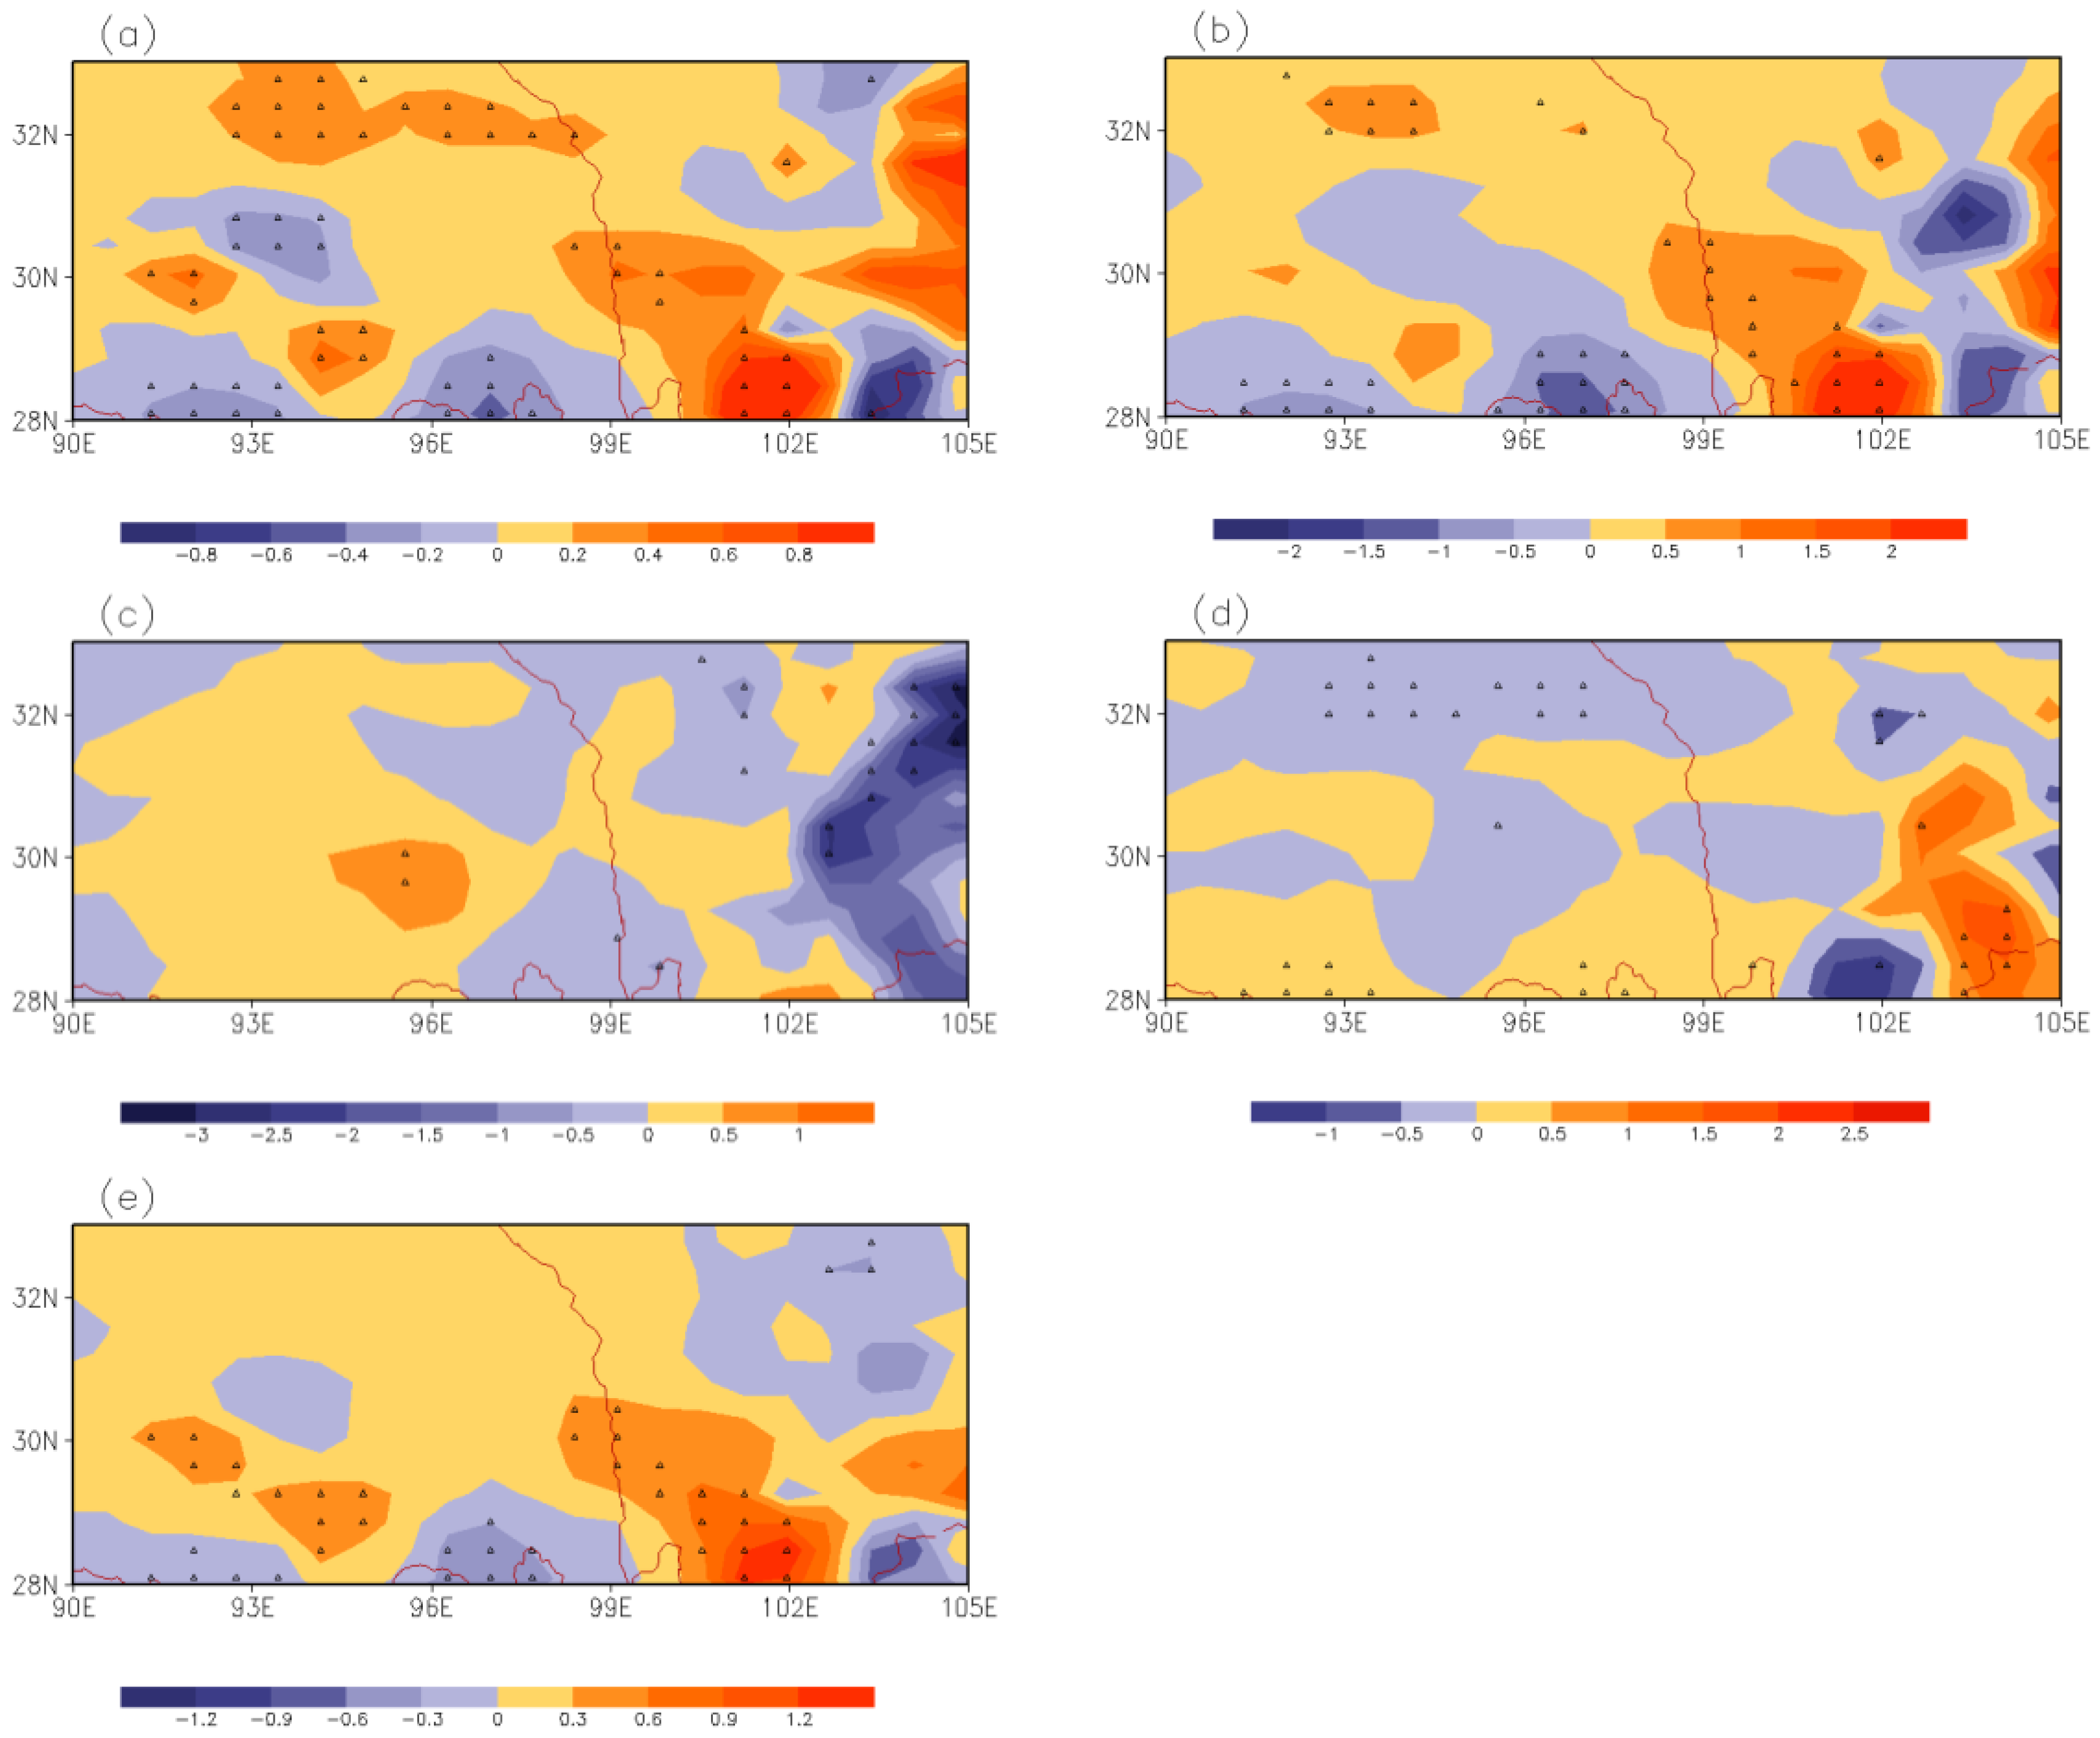
Figure 7 shows that there are great spatial differences in the relationship between summer water vapor budget and heavy precipitation amount in the STR area. The water vapor inflow from the southern boundary is positively correlated with the summer heavy precipitation amount in most parts of this area. The positive correlations in the area from southern Qinghai to the northeastern Tibet, the eastern Lhasa, the southwestern Nyingchi, and the southern parts of the Western Sichuan Plateau are especially significant. The negative correlations in Lhari of southeastern Nagqu on the TP, southern Shannan, the southeast edge of Tibet, and the southern Sichuan-Chongqing Basin are significant (Figure 7a). The western boundary water vapor inflow is positively correlated with the summer heavy precipitation amount in southern Qinghai and the southern parts of the Western Sichuan Plateau. Moreover, it is negatively correlated with the summer heavy precipitation amount in southern Shannan and the southeast edge of Tibet (significant at the 95% confidence level) (Figure 7b).
The water vapor budget contribution from the northern outflow is negatively correlated with the heavy precipitation amount in most of the study areas, especially in the northern part of the Western Sichuan Plateau and the northern Sichuan-Chongqing Basin (Figure 7c). The water vapor budget contribution from the eastern outflow is in significant and negative correlation with the heavy precipitation amount in the area from southern Qinghai to northeastern Tibet and the northern Western Sichuan Plateau, while in significant and positive correlation with the heavy precipitation amount in the southern Shannan and the area from the southern Sichuan-Chongqing Basin to northeastern Yunnan (Figure 7d).
The net water vapor budget in the STR area is positively and significantly correlated with the heavy precipitation amount in eastern Lhasa, southwestern Nyingchi and the southern Western Sichuan Plateau, while it is significantly and negatively correlated with the heavy precipitation amount in southern Shannan, the southeast edge of Tibet and the northern Sichuan-Chongqing Basin (Figure 7e).
3.3.2. The Effects of the Water Vapor Budget on Summer Heavy Precipitation in the BVM Area
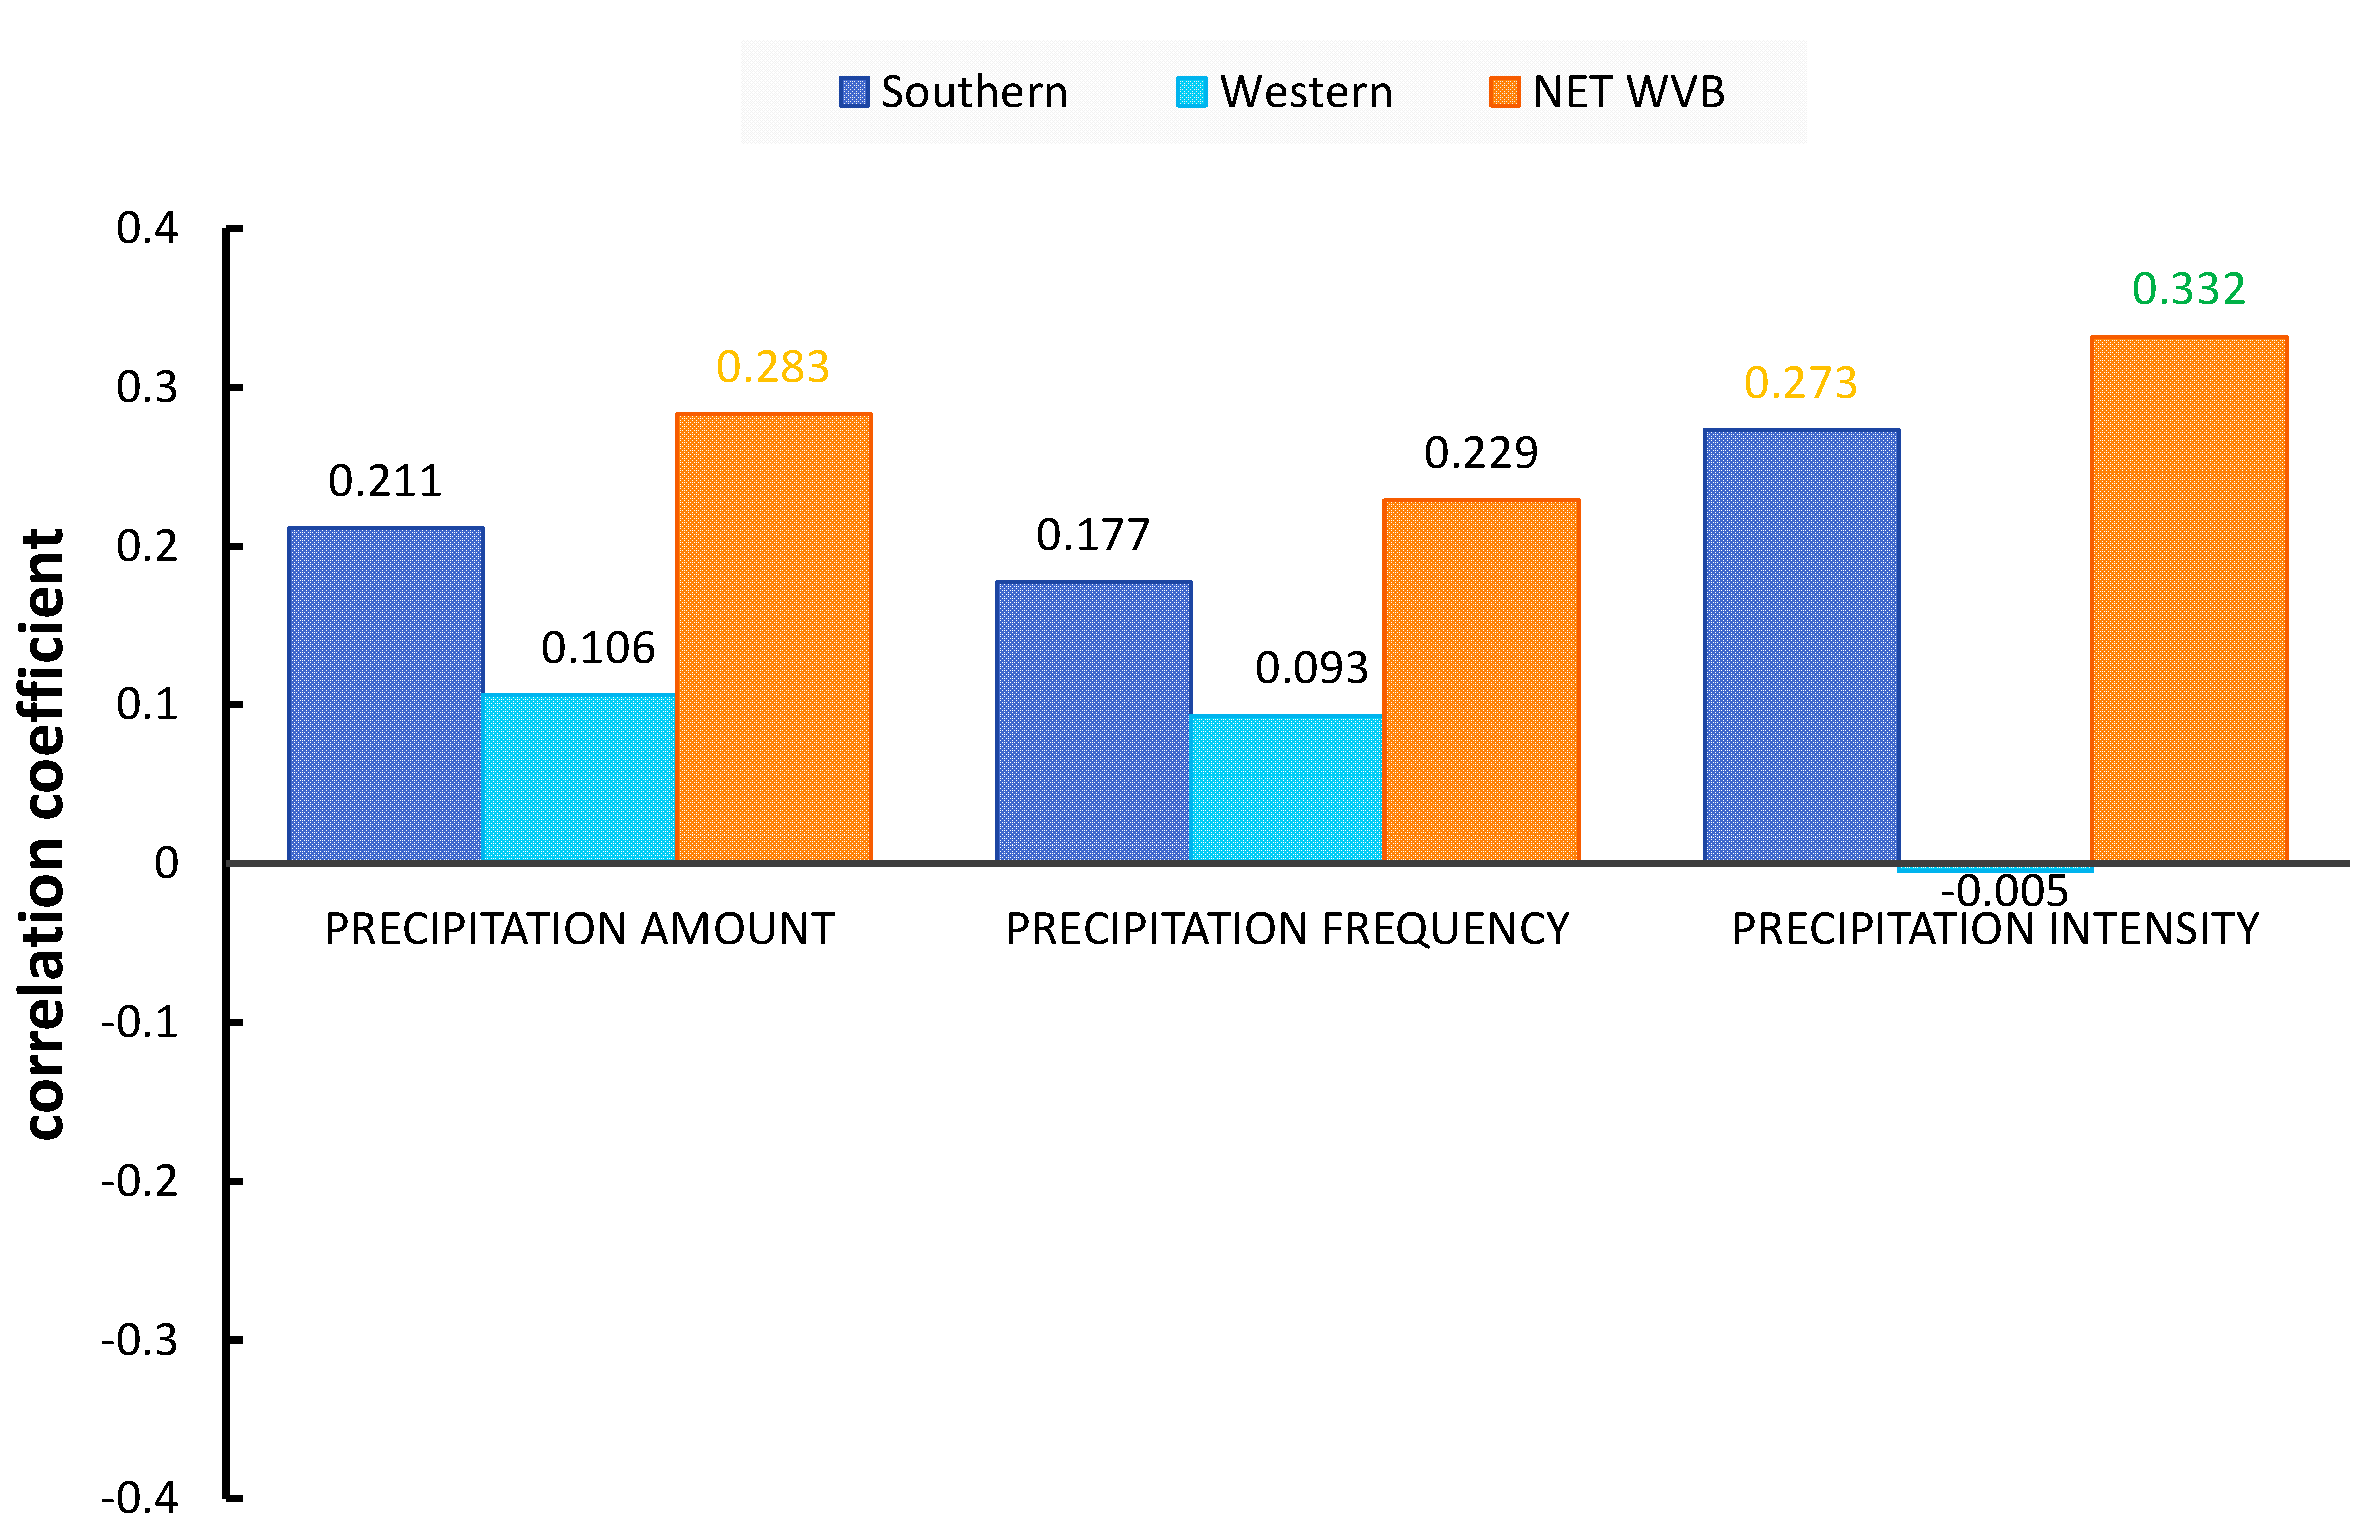
Figure 8 shows that the summer heavy precipitation amount in the BVM area is positively correlated with the net water vapor budget in this area (significant at the 90% confidence level). The relationship between the heavy precipitation frequency and the water vapor budget is unobvious. The heavy precipitation intensity is positively correlated with the southern boundary inflow and the net water vapor budget (significant at the 90% and 95% confidence level, respectively). It is indicated that the summer water vapor budget in the BVM area has the largest influence on the local heavy precipitation intensity, followed by the heavy precipitation amount and then the heavy precipitation frequency. When the southern boundary water vapor inflow and the net water vapor budget in the BVM area increase, the regional precipitation amount and intensity also increase. The summer water vapor inflow from the southern boundary contributes greatly to the heavy precipitation in the BVM area.
The water vapor transport flux and its divergence are the most important and direct factors affecting precipitation. To analyze water vapor budget characteristics in the typical anomalous years of summer heavy precipitation, five anomalous years with more heavy precipitation amount (1980, 1991, 1995, 1997, and 2015), and five anomalous years with less heavy precipitation amount (1989, 2009, 2013, 2016, and 2018) from 1979 to 2018 in the BVM area are selected for the composite analysis. The spatial differences of water vapor transport and water vapor budget in these anomalous years in the BVM area are discussed below.
Figure 9 shows the difference of the composites of integrated water vapor flux and its divergence. Seen from Figure 9, there is an anticyclonic circulation over the western Pacific and the South China Sea. The anomalous easterly flow on the south of the anticyclone transports water vapor westward from the western Pacific and the South China Sea. A part of the warm-wet airflow turns to southerly near the Indochina Peninsula and transports water vapor to the east of the STR area. The other part transports water vapor westwards and converges with the warm-wet airflow from the Bay of Bengal. Due to the anomalous anticyclone over the northern Indian Peninsula to the Bay of Bengal, the transport direction of a part of water vapor changes, and the water vapor is transported along the southern plateau to the STR area continuously. In addition, the water vapor from the Arabian Sea is also transported to the STR area by the southwesterly flow, and the water vapor converges to form a convergence center. In particular, there is a large water vapor convergence in the BVM area, which is conducive to the increase of the heavy precipitation amount in this area. The results for heavy precipitation intensity are similar (figure omitted). When there is more and stronger summer heavy precipitation in the BVM area, anomalous southwesterly wind and water vapor convergence occur over the BVM area and eastern-southern China. Moreover, the regional water vapor transport and convergence are intense, connecting with the low-latitude water vapor convergence area over the Bay of Bengal. The water vapor from the Bay of Bengal converges with the water vapor from the South China Sea, forming a jet over the BVM area, which is an important factor of the heavy precipitation in this region. This indicates that the summer water vapor inflow from the southern boundary contributes greatly to the heavy precipitation in the BVM area.
3.3.3. The Effects of the Water Vapor Budget on Summer Heavy Precipitation in the ST Area
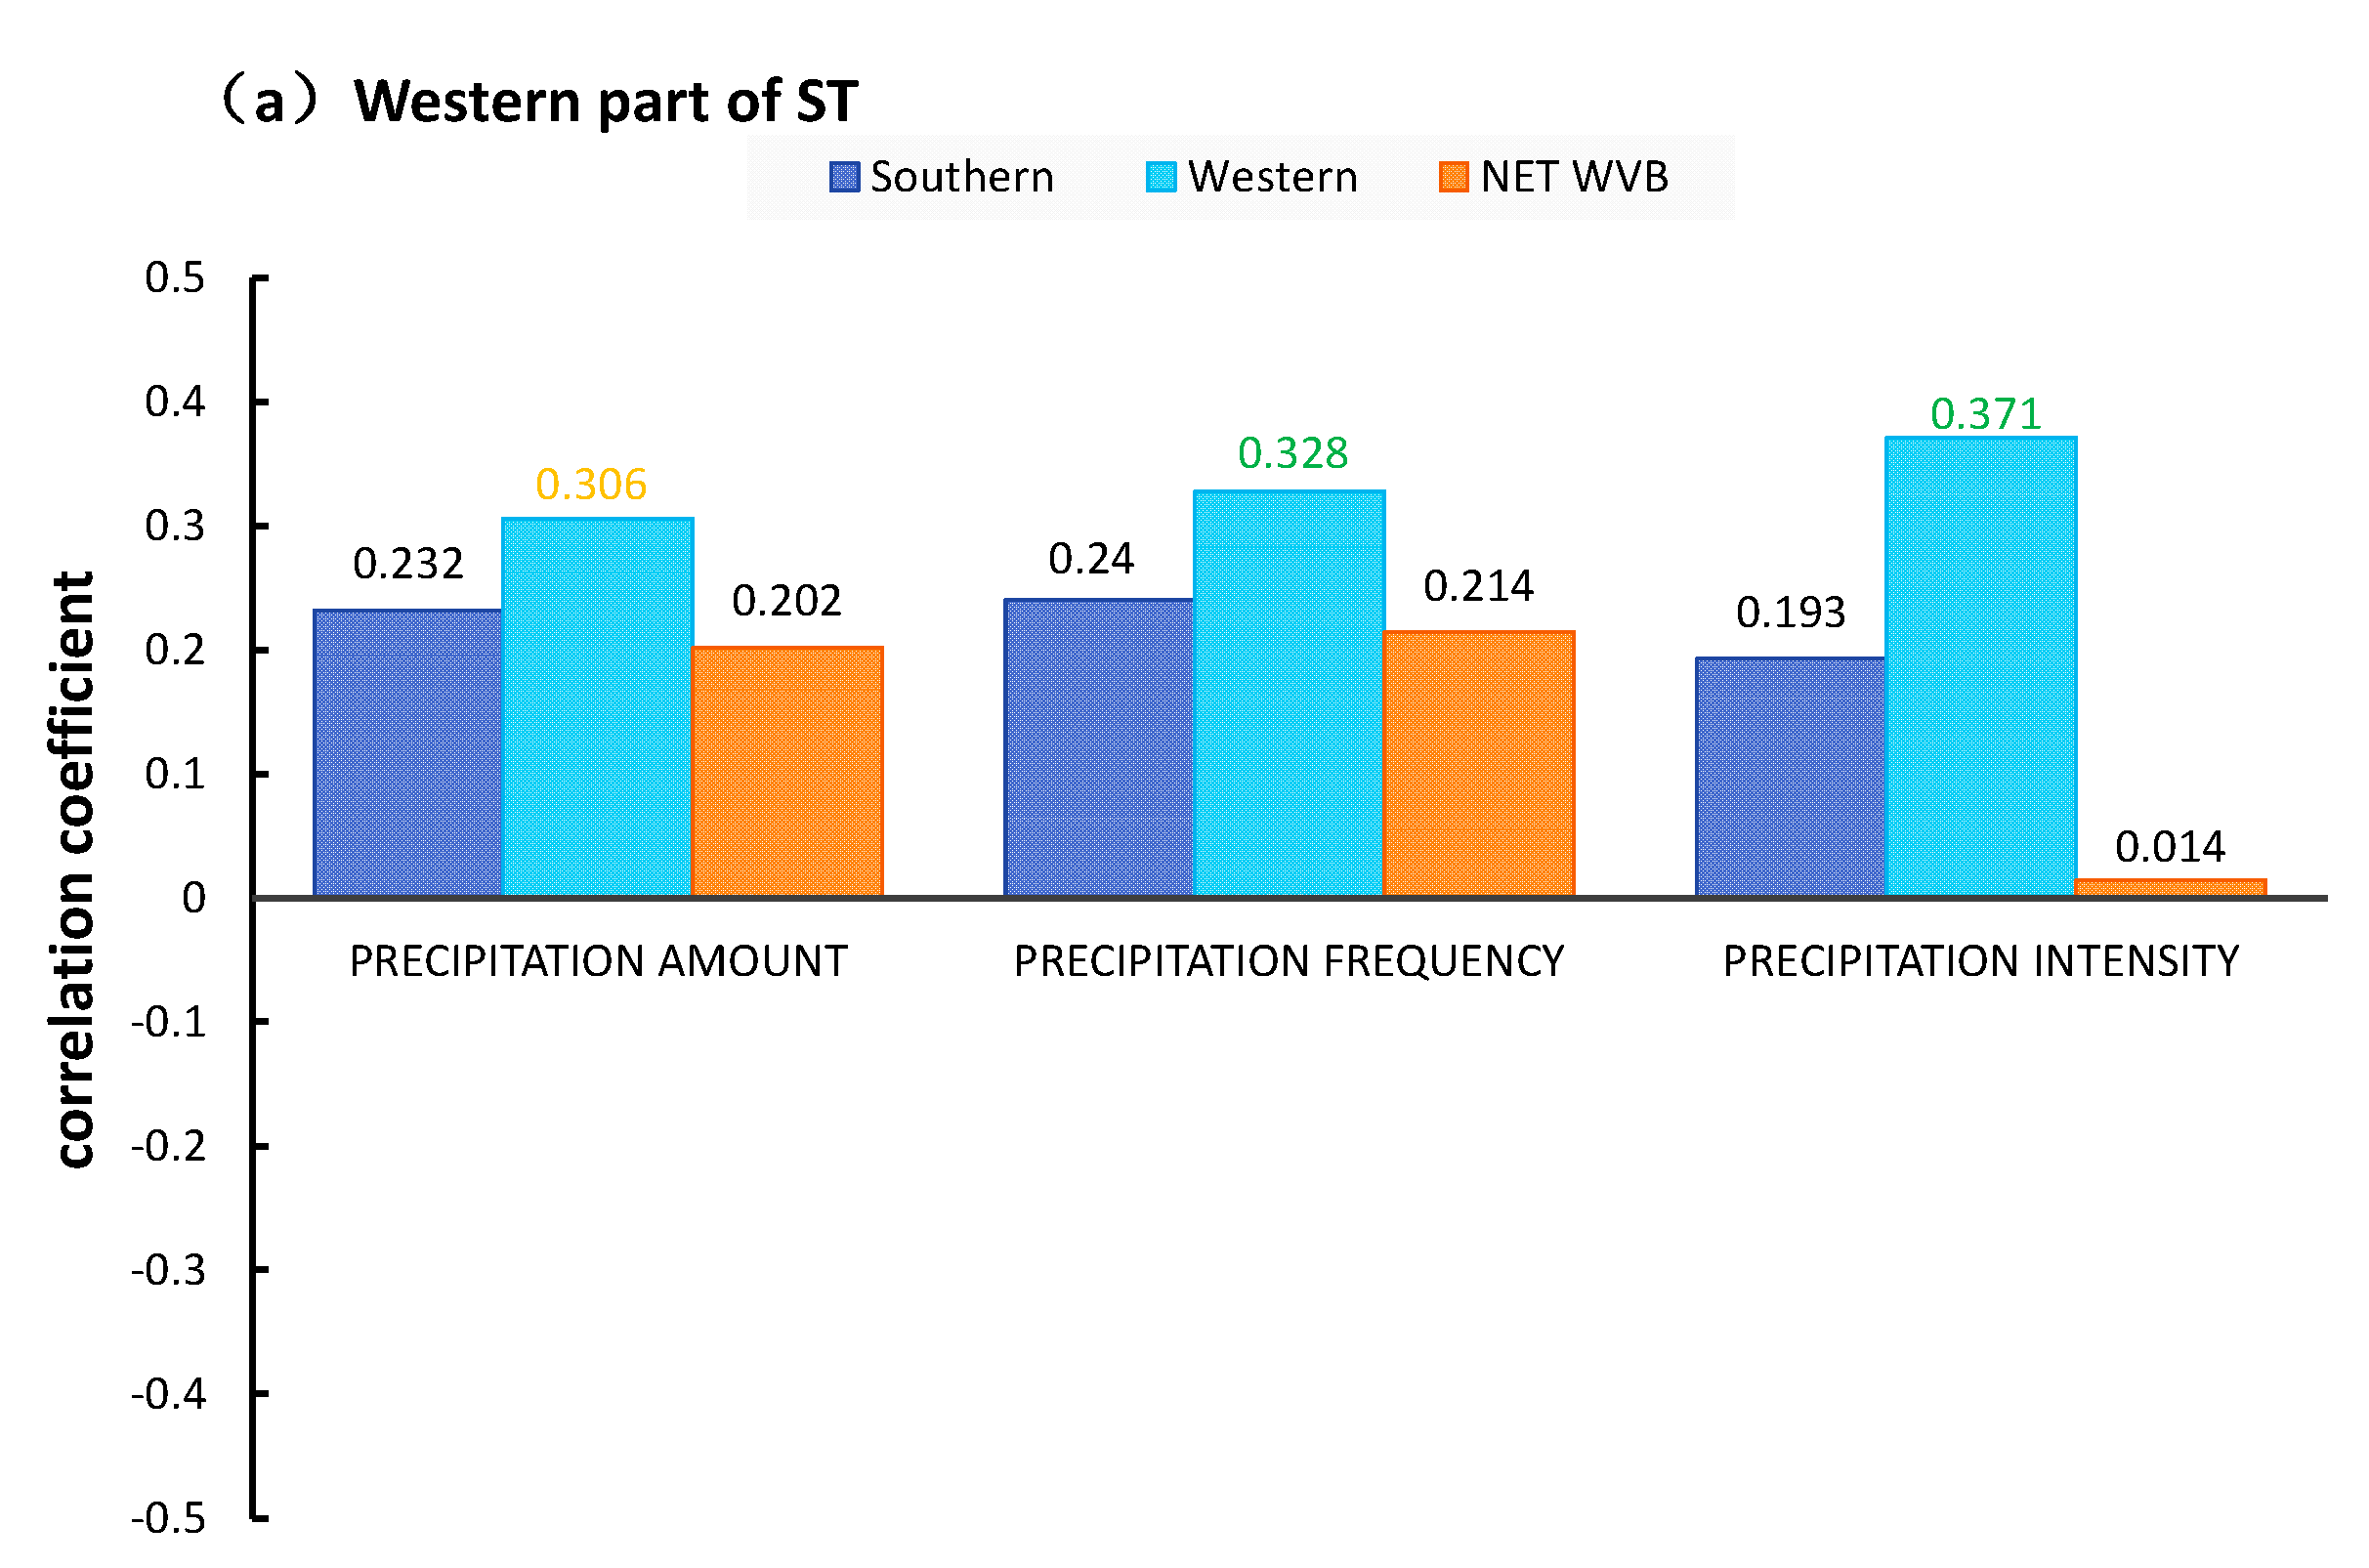
According to the topographic altitude, the ST area is divided into the western/eastern parts with 102° E longitude as the boundary. The eastern part of the ST area is here named as the basin area of the eastern TP (BA). Then, the correlations of the heavy precipitation amount, frequency, and intensity of the water vapor budget in the two areas are calculated. Figure 10a shows that the heavy precipitation amount, frequency, and intensity in summer in the western part of the ST area are positively correlated to the western boundary water vapor inflow of the ST area (significant at the 90%, 95% and 95% confidence level, respectively). It is indicated that the water vapor inflow from the western boundary of the ST area has significant effects on the summer heavy precipitation amount, frequency, and intensity in the western part of the ST area. When the water vapor inflow from the western boundary increases, there is larger precipitation amount, higher frequency and stronger intensity of summer heavy precipitation in the western part of the ST area. The correlation between the heavy precipitation intensity and water vapor budget is the most significant.
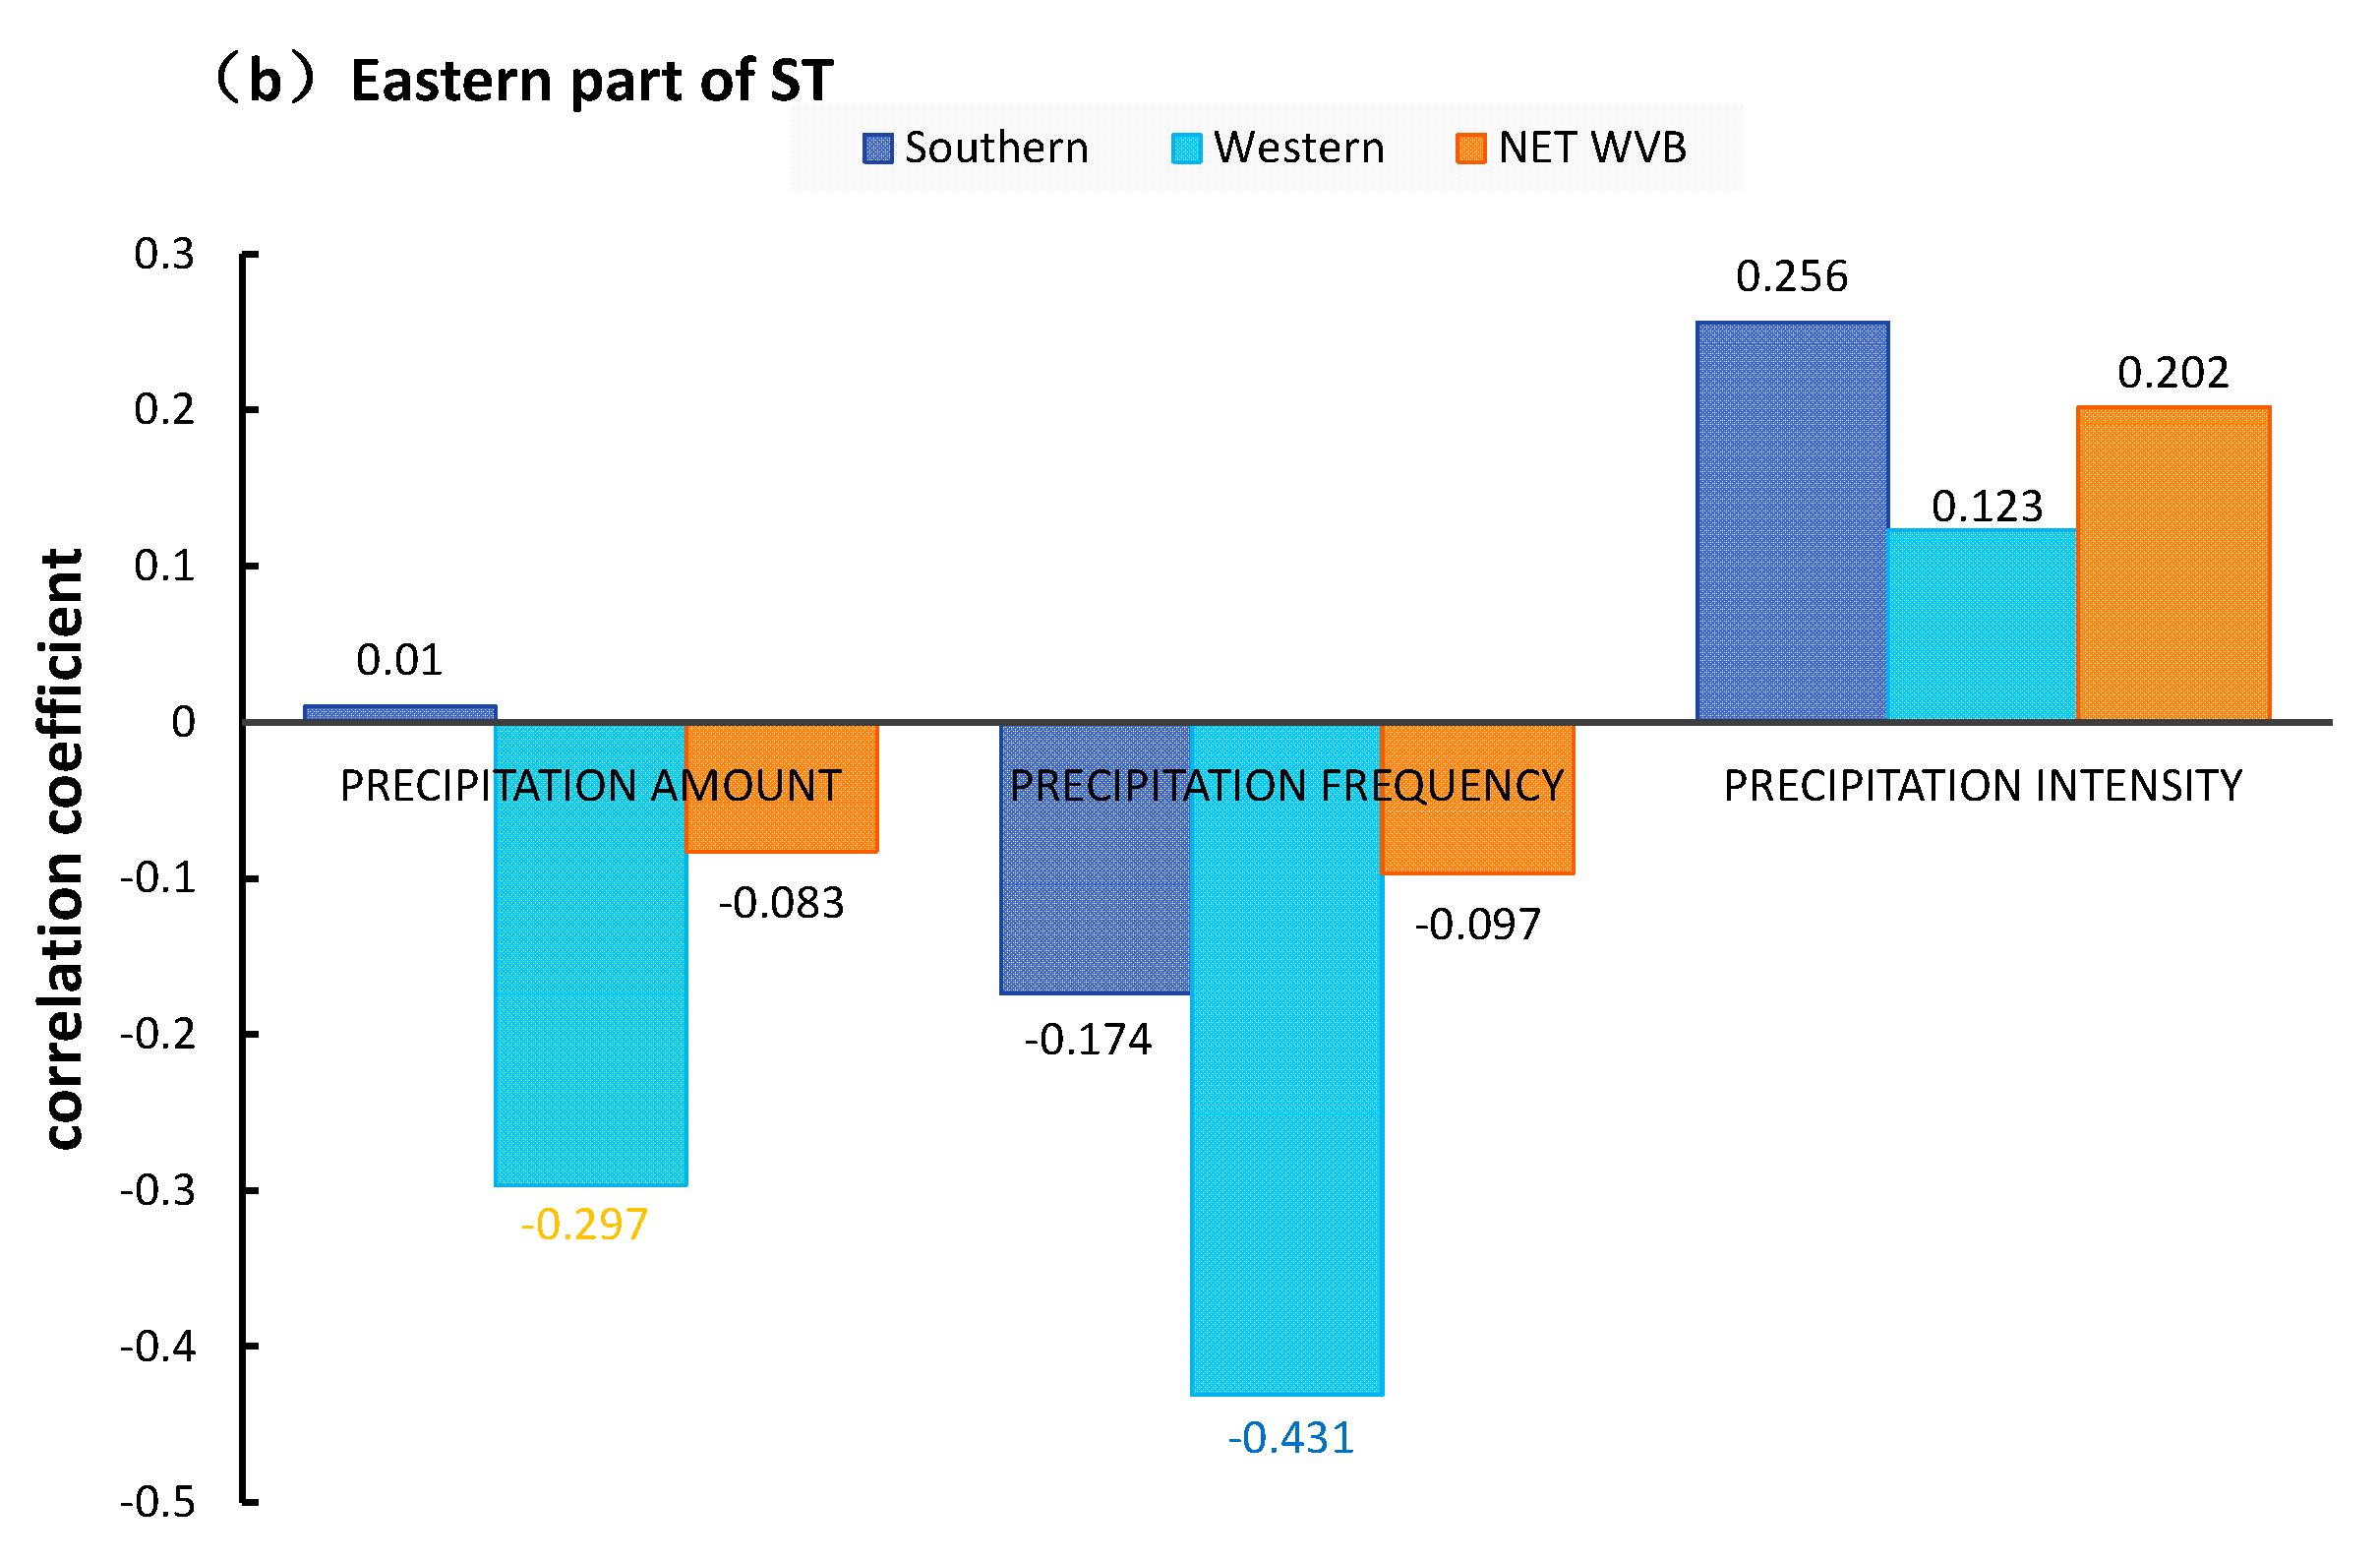
However, the summer heavy precipitation amount and frequency in the BA are negatively correlated with the water vapor inflow from the western boundary of the ST area (significant at the 90% and 99% confidence level, respectively). The relationship between the heavy precipitation intensity and the water vapor budget is not significant (Figure 10b). It shows that the water vapor inflow from the western boundary of the ST area has significant impact on the summer heavy precipitation amount and intensity in the BA. When the water vapor inflow from the western boundary of ST area decreases, it is favorable for a larger precipitation amount and higher frequency of summer heavy precipitation in the BA. The correlation between the heavy precipitation frequency and water vapor budget is especially significant. In comparison, the water vapor budget from the western boundary has obvious influence on the summer heavy precipitation in the two sub-areas, but the effects of water vapor budget are opposite in different areas with different terrains. It is revealed that the ST area has great influence on the water vapor budget and heavy precipitation. In particular, when the South Asian monsoon and plateau monsoon move eastward, the warm-wet airflow is blocked by the unique mountain terrain on the eastern TP. It leads to the uplifting of water vapor and low-level convergence and upper-level divergence in this area, which further generates the anomalous heavy precipitation. Moreover, the BA is located in the leeward slope of the TP, which is related to the southwesterly water vapor transport of monsoon. The precipitation intensity in this area is always related to the uplifting of the easterly flow (the East Asian monsoon) into the BA when it is blocked by the eastern plateau. Therefore, the heavy precipitation in the ST area is affected by the joint effect of different monsoons and terrains.
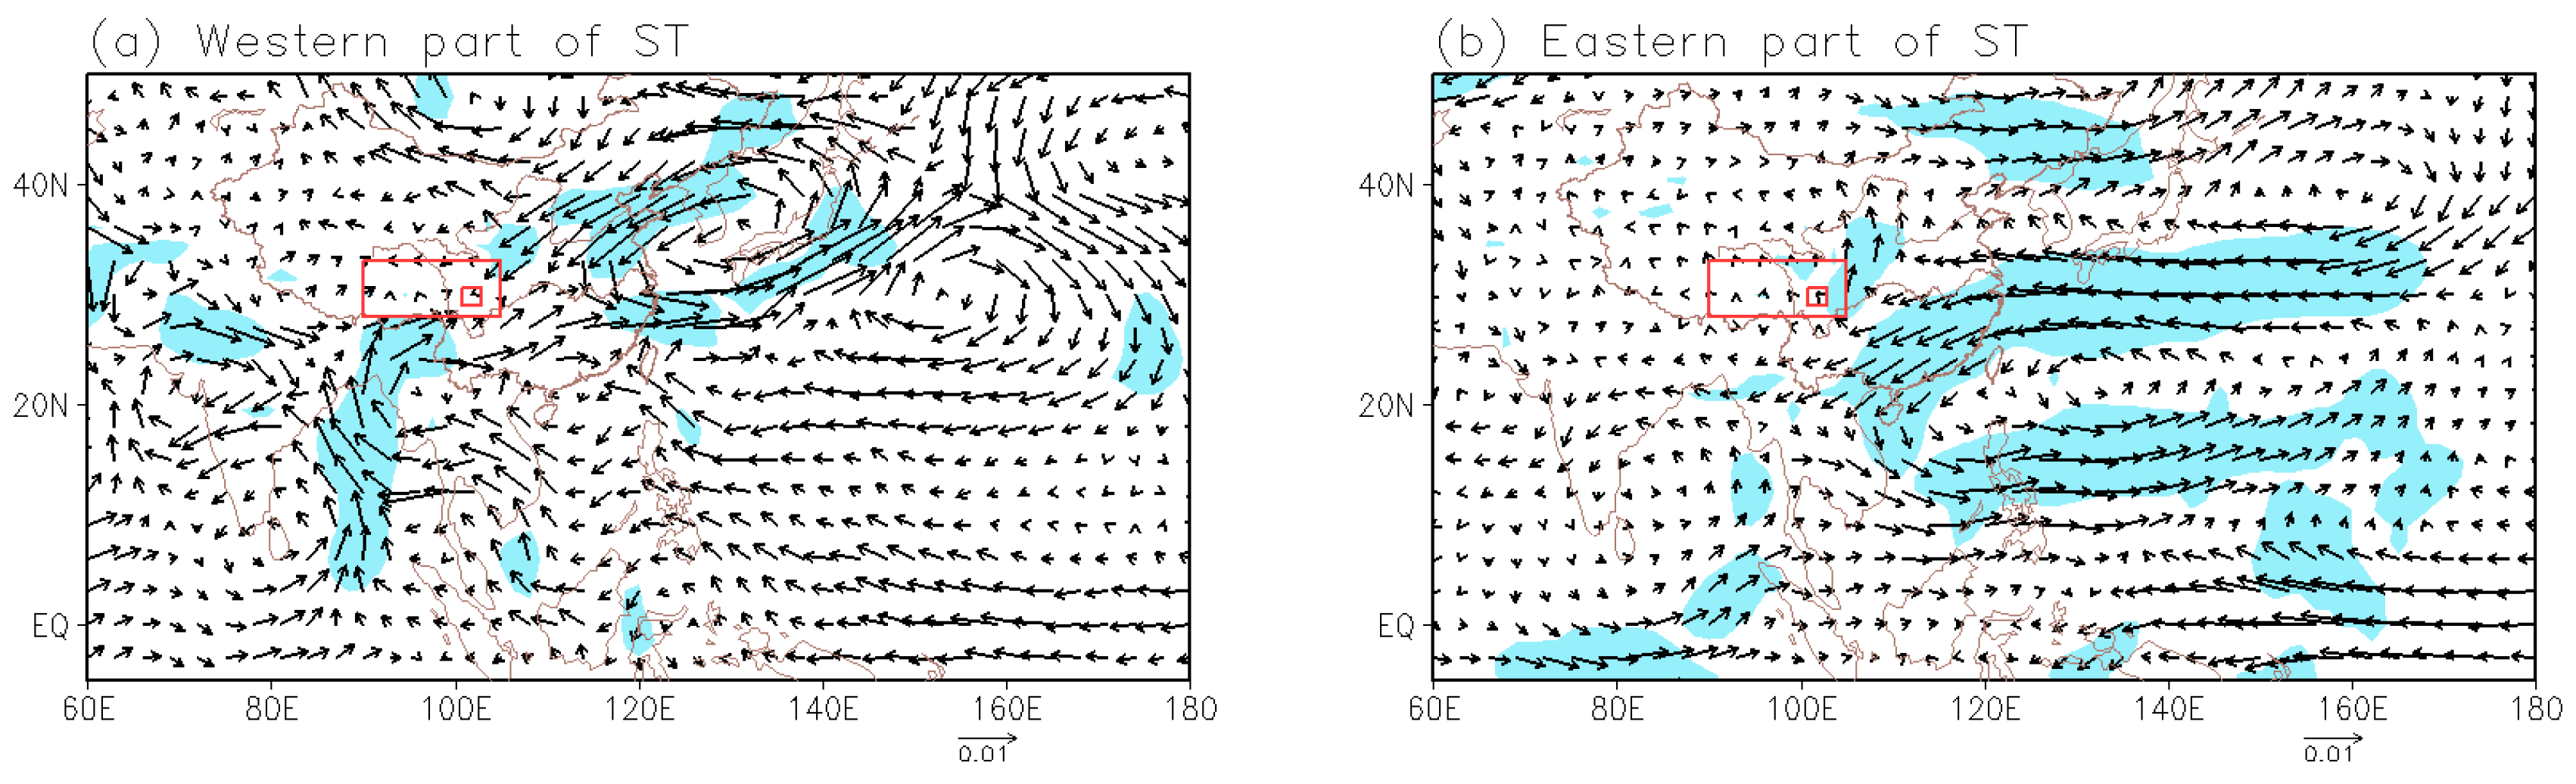
Figure 11 shows the summer heavy precipitation amount regressed against the 700 hPa wind in the ST area from 1979 to 2018. In the western part of the ST area, positive anomalies of summer heavy precipitation are closely related to the southwesterly flow water vapor transportation from the Bay of Bengal and the westerly flow water vapor transportation at mid-latitudes. There is an anomalous cyclonic circulation in the south of the Indian Peninsula, and an anomalous anti-cyclonic circulation in the north of the Indochina Peninsula. The southwesterly wind anomaly to the north of this anomalous anti-cyclone leads to more water-vapor inflow from the western boundary of the ST area (Figure 11a). Increased summer heavy precipitation in the BA is closely related to the East Asia summer monsoon. There is an anti-cyclone anomaly and cyclone-anomaly over North China to the Japan Sea and the Northwest Pacific, respectively, presenting the East Asia-Pacific teleconnection pattern. Correspondingly, there is easterly wind anomaly in the east of the TP, which counts against the water-vapor inflow from the western boundary and the outflow from the eastern boundary of the ST area (Figure 11b).
4. Conclusions
In this study, based on the daily precipitation data from 130 meteorological stations from 1979 to 2018 and the monthly mean ERA-Interim data, the spatio-temporal variation characteristics of summer precipitation with different magnitudes in the STR area are analyzed, and the relationship between the heavy precipitation and water vapor budget is revealed by various statistical and diagnostic methods. The main conclusions are as follows.
As the terrain is high in the west and low in the east, the difference of summer heavy precipitation mainly distributes in the west–east direction. The precipitation amount, frequency, and intensity of heavy precipitation increase gradually from west to east. The maximum values are located in the western Sichuan-Chongqing basin, and the minimum values are located in southern Qinghai of the TP. The amount, frequency, and intensity of heavy precipitation are also large in the area from Lhasa to Nyingchi. The heavy precipitation amount, frequency, and intensity have significant decreasing trends in the BVM area, while they have significant increasing trends from Changdu to Mangkang, which increases the risk of geologic hazards.
In the STR area, the net water vapor budget is positive for the whole year and each season, being the smallest in winter and the largest in summer. The water vapor flows out through the eastern and northern boundaries and flows in through the southern and western boundaries in the whole year and summer, with the southern (eastern) boundary being the main boundary via which the water vapor flows in (out). In the summers of recent 40 years, the water vapor inflow from the southern and western boundaries of the STR area has gradually decreased; the water vapor outflow from the northern boundary has increased; the water vapor outflow from the eastern boundary has obviously decreased. On the whole, the regional net water vapor budget in summer shows a slight decreasing trend.
In the BVM and ST areas, the water vapor flows in from the southern and western boundaries for the whole year and summer, and flows out from the northern and eastern boundaries. In the BVM area, the inflow from the southern boundary is larger than that from the western boundary while it is opposite in the ST area. The net water vapor budgets are both positive for the whole year and summer, indicating that the two areas are water vapor sinks. The south–north water vapor transport in the BVM area is more significant, while the east–west transport in the ST area is more obvious. In addition, the net water vapor budget in the BVM area is much larger than that in the ST area, and the water vapor budget variations are more obvious and active in the BVM area. In the summers of recent 40 years, the significantly decreasing trend of net water vapor budget in the BVM area is due to the remarkable reduction of water vapor inflow from the southern boundary. The water vapor inflow from the western boundary and the outflow from the eastern boundary of the ST area decrease significantly, and the net water vapor budget increases slightly.
In the BVM area, the summer heavy precipitation is directly related to monsoon circulations and water vapor transport. The water vapor inflow from the southern boundary has great contribution to the regional heavy precipitation. When the water vapor inflow from the southern boundary and the net water vapor budget increase, the regional precipitation amount and intensity of heavy precipitation also increase. The summer heavy precipitation anomaly in the BVM area is generated by the multi-scale interaction of unique topography and water vapor transport by different low-latitude circulations. When an intense anticyclonic circulation occurs over the western Pacific and the South China Sea, there is also an anomalous anticyclonic circulation extending from the northern Indian Peninsula to the Bay of Bengal. This circulation pattern is conducive to the water vapor transport from the South China Sea, western Pacific and the Bay of Bengal to the STR area. The effect of the unique terrain of the BVM area leads to the anomalous variations of regional water vapor budget and convergence (divergence) distribution. The remarkable southwesterly wind and water vapor convergence over the BVM area leads to more summer heavy precipitation.
The water vapor inflow from the western boundary of the ST area has significant effects on the summer heavy precipitation amount, frequency, and intensity in the western part of the ST area. It also greatly affects the summer heavy precipitation amount and frequency in the BA. The water vapor budget from the western boundary has the opposite influence on these two areas. When the water vapor inflow from the western boundary increases, it is favorable for larger summer heavy precipitation amount, higher frequency, and stronger intensity in the western part of the ST area. However, it is unfavorable for larger summer heavy precipitation amount and higher frequency in the BA. The joint effect of different terrains and circulation patterns leads to the localization and diversity of heavy precipitation in the ST area.
Author Contributions
Y.L. and D.Q. contributed to the idea and research of the study; Y.L. and D.Q. designed this manuscript; C.Z. and D.C. performed the statistical analysis; X.L. analyzed data; D.Q. drafted the manuscript; Y.L. and D.Q. performed manuscript review and editing. All authors have read and agreed to the published version of the manuscript.
Funding
This research was jointly supported by the National Natural Science Foundation of China (No.42030611), Project PAEKL-2023-K06 supported by Open Research Fund Program of Plateau Atmosphere and Environment Key Laboratory of Sichuan Province, the Second Tibetan Plateau Scientific Expedition and Research (STEP) program (No. 2019QZKK0105; 2019QZKK0103), Natural Science Foundation of Sichuan (No.2022NSFSC0230), and the Strategic Priority Research Program of Chinese Academy of Sciences (No. XDA23090103).
Data Availability Statement
The monthly average ERA-Interim reanalysis data for this study can be found in the ECMWF, (https://apps.ecmwf.int/datasets/) URL (accessed on 16 August 2021). The daily precipitation datasets are derived from the latest version [version 3 (V3)] of surface climatological data compiled by the China National Meteorological Information Center (http://data.cma.cn/ (accessed on 16 August 2021)).
Acknowledgments
We acknowledge the National Natural Science Foundation of China for supporting this study. We also thank China Meteorological Administration Information Center and ECMWF for providing their multiple databases.
Conflicts of Interest
The authors declare no conflict of interest.
References
- Guo, C.B.; Du, Y.B.; Zhang, Y.S.; Zhang, G.Z.; Yao, X.; Wang, K.; Liu, J. Geohazard effects of the Xianshuihe fault and characteristics of typical landslides in western Sichuan. Geol. Bull. China 2015, 34, 121–134. (In Chinese) [Google Scholar]
- Zhang, W.X.; Zhang, L.X.; Zhou, T.J. Interannual variability and the underlying mechanism of summer precipitation over the Yarlung Zangbo River basin. Chin. J. Atmos. Sci. 2016, 40, 965–980. (In Chinese) [Google Scholar]
- Jiang, X.W.; Li, Y.Q.; Yang, S.; Shu, J.C.; He, G.B. Interannual variation of mid-summer heavy rainfall in the eastern edge of the Tibetan Plateau. Clim. Dyn. 2015, 45, 3091–3102. [Google Scholar] [CrossRef]
- Xu, Y.Q.; He, J.C. Analysis on the landslide and rockfall disasters of China railways. J. Inst. Disaster Prev. 2014, 16, 40–46. (In Chinese) [Google Scholar]
- Liu, X.; Chen, B. Climatic warming in the Tibetan Plateau during recent decades. Int. J. Climatol. 2000, 20, 1729–1742. [Google Scholar] [CrossRef]
- Wu, S.H.; Yin, Y.H.; Zheng, D.; Yang, Q.Y. Climatic trends over the Tibetan Plateau during 1971-2000. J. Geogr. Sci. 2007, 17, 141–151. (In Chinese) [Google Scholar] [CrossRef]
- Kang, S.; Xu, Y.; You, Q.; Flügel, W.-A.; Pepin, N.; Yao, T. Review of climate and cryospheric change in the Tibetan Plateau. Environ. Res. Lett. 2010, 5, 015101. [Google Scholar] [CrossRef]
- Li, Y.Q.; Li, D.J.; Yang, S.; Liu, C.; Zhong, A.H.; Li, Y. Characteristics of the precipitation over the eastern edge of the Tibetan Plateau. Meteorol. Atmos. Phys. 2010, 106, 49–56. [Google Scholar] [CrossRef]
- Jian, J.; Yang, Z.G.; Zhuo, G. Temporal-spatial distributions of severe precipitation event during flood period in Tibet in last 30 years. Plateau Meteorol. 2012, 31, 380–386. (In Chinese) [Google Scholar]
- Liu, X.; Yin, Z.Y. Spatial and Temporal Variation of Summer Precipitation over the Eastern Tibetan Plateau and the North Atlantic Oscillation. J. Clim. 2001, 14, 2896–2909. [Google Scholar] [CrossRef]
- Feng, L.; Zhou, T.J. Water vapor transport for summer precipitation over the Tibetan Plateau: Multidata set analysis. J. Geophys. Res. Atmos. 2012, 117, 85–99. [Google Scholar] [CrossRef] [Green Version]
- Lin, H.B.; You, Q.L.; Jiao, Y.; Min, J.Z. Spatial and temporal characteristics of the precipitation over the Tibetan Plateau from 1961 to 2010 based on high resolution grid-observation dataset. J. Nat. Resour. 2015, 30, 271–281. (In Chinese) [Google Scholar]
- Han, Y.Z.; Ma, W.Q.; Wang, B.Y.; Ma, Y.M.; Tian, R.X. Climatic characteristics of rainfall change over the Qinghai-Tibetan Plateau from 1980 to 2013. Plateau Meteorol. 2017, 36, 1477–1486. (In Chinese) [Google Scholar]
- Zhu, X.D.; Li, L.; Qin, N.S.; Zhou, L.S.; Wang, Q.C. Studies on climatic variation and anomaly types of the annual precipitation over Qinghai-Xizang Plateau. Sci. Meteorol. Sin. 2003, 23, 452–459. (In Chinese) [Google Scholar]
- Wei, Z.G.; Huang, R.H.; Dong, W.J. Interannual and interdecadal variations of air temperature and precipitation over the Tibetan Plateau. Chin. J Atmos. Sci. 2003, 27, 157–170. (In Chinese) [Google Scholar]
- Duan, K.Q.; Yao, T.D.; Wang, N.L.; Tian, L.D.; Xu, B.Q. The difference in precipitation variability between the north and south Tibetan Plateaus. J. Glaciol. Geocryol. 2008, 30, 276–282. (In Chinese) [Google Scholar]
- Wang, C.H.; Zhou, S.W.; Yang, W.; Hai-Rong, B.; Feng, D.; Zhang, Y. Spatial patterns and moisture configurations of rainfall anomalies in flood season over the Tibetan Plateau. Trans. Atmos. Sci. 2015, 38, 566–572. (In Chinese) [Google Scholar]
- Liu, H.C.; Duan, K.Q. Effects of North Atlantic Oscillation on summer precipitation over the Tibetan Plateau. J. Glaciol. Geocryol. 2012, 34, 311–318. (In Chinese) [Google Scholar]
- Liu, H.C.; Duan, K.Q.; Li, M.; Shi, P.H.; Yang, J.H.; Zhang, X.; Sun, J.Y. Impact of the North Atlantic Oscillation on the Dipole Oscillation of summer precipitation over the central and eastern Tibetan Plateau. Int. J. Climatol. 2015, 35, 4539–4546. [Google Scholar] [CrossRef]
- Zhou, S.; Wu, P.; Wang, C.; Han, J. Spatial distribution of atmospheric water vapor and its relationship with precipitation in summer over the Tibetan Plateau. J. Geogr. Sci. 2012, 22, 795–809. [Google Scholar] [CrossRef]
- Wu, S.H.; Yin, Y.H.; Zheng, D.; Yang, Q.Y. Climate Changes in the Tibetan Plateau during the Last Three Decades. Acta Geogr. Sin. 2005, 60, 3–11. (In Chinese) [Google Scholar]
- Yao, T.; Thompson, L.; Yang, W.; Yu, W.; Gao, Y.; Guo, X.; Yang, X.; Duan, K.; Zhao, H.; Xu, B.; et al. Different glacier status with atmospheric circulations in Tibetan Plateau and surroundings. Nat. Clim. Chang. 2012, 2, 663–667. [Google Scholar] [CrossRef]
- Gao, Y.H.; Cuo, L.; Zhang, Y.X. Changes in moisture flux over the Tibetan Plateau during 1979-2011 and possible mechanisms. J. Clim. 2014, 27, 1876–1893. [Google Scholar] [CrossRef]
- Xu, Z.X.; Gong, T.L.; Liu, C.M. Detection of decadal trends in precipitation across the Tibetan Plateau. IAHS-AISH Publ. 2007, 311, 271–276. [Google Scholar]
- Yang, K.; Ye, B.; Zhou, D.; Wu, B.; Foken, T.; Qin, J.; Zhou, Z. Response of hydrological cycle to recent climate changes in the Tibetan Plateau. Clim. Chang. 2011, 109, 517–534. [Google Scholar] [CrossRef]
- Li, X.; Wang, L.; Guo, X.; Chen, D. Does summer precipitation trend over and around the Tibetan Plateau depend on elevation? Int. J. Climatol. 2017, 37, 1278–1284. [Google Scholar] [CrossRef]
- Zhou, T.J.; Yu, R.C. Atmospheric water vapor transport associated with typical anomalous summer rainfall patterns in China. J. Geophys. Res. Atmos. 2005, 110, D08104. [Google Scholar] [CrossRef] [Green Version]
- Liu, Q.; Qin, N.; Dongliang, L.I.; Feng, S.; Zhang, J.; Zhao, M. Relationship between Dipole Oscillation of Sea Temperature in Indian Ocean and Precipitation and Temperature in Flood Season over Qinghai-Xizang Plateau. Plateau Meteorol. 2005, 24, 350–356. (In Chinese) [Google Scholar]
- Gong, Y.F. On the relationship between the eastern Tibet plateau and subtropical high shift in summer. Acta Meteorol. Sin. 2006, 1, 90–99. (In Chinese) [Google Scholar]
- Liu, W.; Wang, L.; Chen, D.; Tu, K.; Ruan, C.; Hu, Z. Large-scale circulation classification and its links to observed precipitation in the eastern and central Tibetan Plateau. Clim. Dyn. 2015, 46, 3481–3497. [Google Scholar] [CrossRef]
- Lin, H.; You, Q.; Zhang, Y.; Jiao, Y.; Fraedrich, K. Impact of large-scale circulation on the water vapor balance of the Tibetan Plateau in summer. Int. J. Climatol. 2016, 36, 4213–4221. [Google Scholar] [CrossRef] [Green Version]
- Wei, W.; Zhang, R.; Wen, M.; Yang, S. Relationship between the Asian westerly jet stream and summer rainfall over central Asia and North China: Roles of the Indian monsoon and the South Asian high. J. Clim. 2016, 30, 537–552. [Google Scholar] [CrossRef]
- Trenberth, K.E. Atmospheric moisture residence times and cycling: Implications for rainfall rates and climate change. Clim. Chang. 1998, 39, 649–667. [Google Scholar] [CrossRef]
- Huang, R.H.; Chen, J.L. Characteristics of the Summertime Water Vapor Transports over the Eastern Part of China and Those over the Western Part of China and Their Difference. Chin. J. Atmos. Sci. 2010, 34, 1035–1045. (In Chinese) [Google Scholar]
- Xu, J.; Gao, Y.; Peng, F.; Wang, X. Change Characteristics of Precipitation and its Cause During 1979-2016 over the Qinghai-Tibetan Plateau. Plateau Meteorol. 2020, 39, 234–244. (In Chinese) [Google Scholar]
- Qi, D.M.; Li, Y.Q.; Zhou, C.Y. Variation Characteristics of Summer Water vapor budget and Its Relationship with the Precipitation over the Sichuan Basin. Water 2021, 13, 2533. [Google Scholar] [CrossRef]
- Shi, X.Y.; Shi, X.H. Climatological characteristics of summer moisture budget over the southeast part of Tibetan Plateau with their impacts. J. Appl. Meteorol. Sci. 2008, 19, 41–46. (In Chinese) [Google Scholar]
- Wang, Z.; Duan, A.; Yang, S.; Ullah, K. Atmospheric moisture budget and its regulation on the variability of summer precipitation over the Tibetan Plateau. J. Geophys. Res. D. Atmos. JGR. 2017, 122, 614–630. [Google Scholar] [CrossRef]
- Zhou, C.Y.; Zhao, P.; Chen, J.M. The interdecadal change of summer water vapor over the Tibetan Plateau and associated mechanisms. J. Clim. 2019, 32, 4103–4119. [Google Scholar] [CrossRef]
- He, X.H.; Song, M.H.; Zhou, Z.X. Temporal and spatial characteristics of water vapor and cloud water over the Qinghai-Xizang Plateau in summer. Plateau Meteorol. 2020, 39, 1339–1347. (In Chinese) [Google Scholar]
- Wang, P.X.; Wang, B.J.; Huang, Y.X.; Guo, P.W.; Li, D.L. Distribution and Changing Character of Water Vapor over Qinghai Plateau in Summer in Recent 43 Years. Plateau Meteorol. 2006, 25, 60–65. (In Chinese) [Google Scholar]
- Xie, C.Y.; Li, M.J.; Zhang, X.Q. Characteristics of summer atmospheric water resources and its causes over the Tibetan Plateau in recent 30 years. J. Nat. Resour. 2014, 29, 979–989. (In Chinese) [Google Scholar]
- Han, J.C.; Zhou, S.W.; Wu, P.; Wang, C.H.; Yang, S.Y.; Yang, M. Spatial distribution of water vapor content over the Qinghai-Tibet plateau in summer. Arid. Zone Res. 2012, 29, 457–463. (In Chinese) [Google Scholar]
- Zhao, T.B.; Wang, J.H.; Dai, A.G. Evaluation of atmospheric precipitable water from reanalysis products using homogenized radiosonde observations over China. J. Geophys. Res. Atmos. 2015, 120, 10703–10727. [Google Scholar] [CrossRef]
- Lu, N.; Trenberth, K.E.; Qin, J.; Yang, K.; Yao, L. Detecting long-term trends in precipitable water over the tibetan plateau by synthesis of station and modis observations. J. Clim. 2015, 28, 1707–1722. [Google Scholar] [CrossRef] [Green Version]
- Zhang, C.; Tang, Q.; Chen, D.; Van der Ent, R.J.; Liu, X.; Li, W.; Haile, G.G. Moisture source changes contributed to different precipitation changes over the northern and southern Tibetan Plateau. J. Hydrometeorol. 2019, 20, 217–229. [Google Scholar] [CrossRef]
- Guo, Y.P.; Wang, C.H. Trends in precipitation recycling over the Qinghai-Xizang Plateau in last decades. J. Hydrol. 2014, 517, 826–837. [Google Scholar] [CrossRef]
- Hu, M.L.; You, Q.L. Characteristics of meridional circulation cell on the south side of Qinghai-Tibetan Plateau and its effects on precipitation over the region. Plateau Meteorol. 2019, 38, 14–28. (In Chinese) [Google Scholar]
- Zhang, C.; Tang, Q.H.; Chen, D.L. Recent changes in the moisture source of precipitation over the Tibetan Plateau. J. Clim. 2017, 30, 1807–1819. [Google Scholar] [CrossRef]
- Xie, C.Y.; Li, M.J.; Zhang, X.Q.; Guan, X.F. Moisture Transport Features in Summer and Its Rainfall Effects over Key Region in Southern Margin of Qinghai-Xizang Plateau. Plateau Meteorol. 2015, 34, 327–337. (In Chinese) [Google Scholar]
- Gao, D.Y. Expeditionary studies on the Moisture Passage of the Yarlung Zangbo River. Chin. J. Nat. 2008, 5, 301–303. (In Chinese) [Google Scholar]
- Dee, D.P.; Uppala, S.M.; Simmons, A.J.; Berrisford, P.; Poli, P.; Kobayashi, S.; Andrae, U.; Balmaseda, M.A.; Balsamo, G.; Bauer, D.P.; et al. The ERA-Interim reanalysis: Configuration and performance of the data assimilation system. Q. J. R. Meteorol. Soc. 2011, 137, 553–597. [Google Scholar] [CrossRef]
- Zhang, W.J.; Gao, D.Y. The scientific expedition in the great canyon, Yalungtsangpo. J. Mt. Sci. 1999, 17, 99–103. (In Chinese) [Google Scholar]
- Zhang, G.Z.; Jiang, L.W.; Song, Z.; Wu, G. Research on the mountain disaster and geological alignment fundamental of Sichuan-Tibet railway running through N-S mountain area. J. Railw. Eng. Soc. 2016, 33, 21–24. (In Chinese) [Google Scholar]
Figure 1.
The distribution of topography, the regional boundaries of water vapor transport and 130 meteorological stations in the key area of the Sichuan-Tibet Railway. (Shading shows the topography, units: m, where different colors indicate different terrain heights; “+” represents the location of meteorological stations. (a). the key area of the Sichuan-Tibet Railway (28–33° N, 90–105° E), (b). the key area of the Brahmaputra valley and mountain (29.0–30.5° N, 94.5–96.5° E) and the key area of the steep terrain on the eastern slope of the plateau (29.0–30.5° N, 100.8–102.8° E).

Figure 2.
The climatological distributions of summer precipitation with different magnitudes in the key area of the Sichuan-Tibet Railway from 1979 to 2018 ((a): heavy precipitation; (b): light to moderate rain; (c): total summer precipitation; 1: precipitation amount, unit: mm; 2: precipitation frequency, unit: times; 3: precipitation intensity, unit: mm).


Figure 3.
The trends of summer precipitation amount for different magnitudes in the key area of the Sichuan-Tibet Railway from 1979 to 2018 ((a): heavy precipitation; (b): light to moderate rain; (c): total summer precipitation. unit: mm (10 a)−1). Red stippling indicates the trends are statistically significant at the 95% confidence level.

Figure 4.
Inter-annual variation of summer average water vapor inflow and outflow and net water vapor budget at each boundary in the key area of the Sichuan-Tibet Railway from 1979 to 2018 (unit: 106 kg s−1; S, W, N, and E indicate the southern, western, northern, and eastern boundaries, respectively. The thin lines indicate linear trends).

Figure 5.
Distributions of summer average vertically integrated water vapor fluxes from 1979 to 2018 (units: kg m−1 s−1; the shading denotes the areas with the water vapor flux ≥30).
Figure 5.
Distributions of summer average vertically integrated water vapor fluxes from 1979 to 2018 (units: kg m−1 s−1; the shading denotes the areas with the water vapor flux ≥30).

Figure 6.
Inter-annual variation of summer average water vapor inflow and outflow and net water vapor budget at each boundary in the BVM and ST areas from 1979 to 2018 ((a): the BVM area, (b): the ST area; unit: 106 kg s−1; S, W, N, and E indicate the southern, western, northern, and eastern boundaries, respectively. The thin lines indicate linear trends).

Figure 7.
Summer heavy precipitation amount (unit: mm) regressed against the water vapor budget through the (a) southern, (b) western, (c) northern and (d) eastern boundaries, and (e) the net water vapor budget (unit: 106 kg s−1) in the key area of the Sichuan-Tibet Railway from 1979 to 2018. Stippling indicates statistical significance at a 95% confidence level.

Figure 8.
Correlation coefficients of the summer heavy precipitation amount, frequency, and intensity with the water vapor budget in the BVM area from 1979 to 2018. Green and orange numbers indicate correlation coefficients are significant at the 95% and 90% confidence levels, respectively.
Figure 8.
Correlation coefficients of the summer heavy precipitation amount, frequency, and intensity with the water vapor budget in the BVM area from 1979 to 2018. Green and orange numbers indicate correlation coefficients are significant at the 95% and 90% confidence levels, respectively.

Figure 9.
The difference of the composites of integrated water vapor flux (vectors, units: kg m−1 s−1) and its divergence (colored areas, units: 10−5 kg m−2 s−1) between the more heavy precipitation years and less heavy precipitation years in the BVM area.
Figure 9.
The difference of the composites of integrated water vapor flux (vectors, units: kg m−1 s−1) and its divergence (colored areas, units: 10−5 kg m−2 s−1) between the more heavy precipitation years and less heavy precipitation years in the BVM area.

Figure 10.
Correlation coefficients of the summer heavy precipitation amount, frequency, and intensity to the water vapor budget in the ST area from 1979 to 2018 ((a): the western part of the ST area, (b): the eastern part of the ST area). The numbers colored in blue, green, and orange indicate the correlation coefficients are significant at the 99%, 95%, and 90% confidence levels, respectively.


Figure 11.
Summer heavy precipitation amount (unit: mm) regressed against the 700 hPa wind (unit: m s−1) in the ST area from 1979 to 2018 ((a): the western part of the ST area, (b): the eastern part of the ST area). Stippling indicates the statistical significance at 95% confidence level.
Figure 11.
Summer heavy precipitation amount (unit: mm) regressed against the 700 hPa wind (unit: m s−1) in the ST area from 1979 to 2018 ((a): the western part of the ST area, (b): the eastern part of the ST area). Stippling indicates the statistical significance at 95% confidence level.


Table 1.
The climatological maximum and minimum values of summer precipitation amount, frequency and intensity for different precipitation magnitudes in the key area of the Sichuan-Tibet Railway from 1979 to 2018.
Table 1.
The climatological maximum and minimum values of summer precipitation amount, frequency and intensity for different precipitation magnitudes in the key area of the Sichuan-Tibet Railway from 1979 to 2018.
| Precipitation Maximum | Precipitation Minimum | |||
|---|---|---|---|---|
| heavy precipitation | Ya’an 29.98° N, 103.00° E | amount: 711.0 mm frequency: 11.7 times intensity: 61.5 mm | Yushu 33.00° N, 97.02° E | amount: 6.2 mm frequency: 0.2 times intensity: 5.5 mm |
| light to moderate rain | Jiulong 29.00° N, 101.50° E | amount: 442.0 mm frequency: 70.2 times | Wenxian 32.95° N, 104.67° E | amount: 178.2 mm |
| Yuexi 28.65° N, 102.52° E | intensity: 6.6 mm | Zizhong 29.77° N, 104.85° E | frequency: 34.8 times | |
| Longzi 28.42° N, 92.47° E | intensity: 3.6 mm | |||
| total summer precipitation | E’meishan 29.52° N, 103.33° E | amount: 991.0 mm | Longzi 28.42° N, 92.47° E | amount: 207.8 mm |
| Jiulong 29.00° N, 101.50° E | frequency: 73.4 times | Wenxian 32.95° N, 104.67° E | frequency: 38.7 times | |
| Ya’an 29.98° N, 103.00° E | intensity: 17.0 mm | Longzi 28.42° N, 92.47° E | intensity: 3.8 mm | |
Table 2.
Annual and seasonal average water vapor budget through the four boundaries and the regional net water vapor budget in the key area of the Sichuan-Tibet Railway from 1979 to 2018 (unit: 106 kg s−1).
Table 2.
Annual and seasonal average water vapor budget through the four boundaries and the regional net water vapor budget in the key area of the Sichuan-Tibet Railway from 1979 to 2018 (unit: 106 kg s−1).
| Water Vapor Budget | |||||||
|---|---|---|---|---|---|---|---|
| Season | Southern Boundary | Western Boundary | Northern Boundary | Eastern Boundary | Total Inflow | Total Outflow | Net Water Vapor Budget |
| spring | 49.4 | 25.09 | 1.78 | −41.41 | 76.27 | −41.41 | 34.86 |
| summer | 72.9 | 14.41 | −2.83 | −17.85 | 87.31 | −20.68 | 66.63 |
| autumn | 47.05 | 17.41 | −4.85 | −37.43 | 64.46 | −42.28 | 22.18 |
| winter | 18.83 | 14.52 | 0.94 | −31.94 | 34.29 | −31.94 | 2.35 |
| annual | 47.04 | 17.86 | −1.24 | −32.16 | 64.9 | −33.40 | 31.5 |
Table 3.
Annual and summer average water vapor budget through the four boundaries and the regional net water vapor budget in the BVM and ST areas from 1979 to 2018 (unit: 106 kg s−1).
Table 3.
Annual and summer average water vapor budget through the four boundaries and the regional net water vapor budget in the BVM and ST areas from 1979 to 2018 (unit: 106 kg s−1).
| Water Vapor Budget | ||||||||
|---|---|---|---|---|---|---|---|---|
| Region | Season | Southern Boundary | Western Boundary | Northern Boundary | Eastern Boundary | Total Inflow | Total Outflow | Net Water Vapor Budget |
| BVM area | summer | 7.95 | 3.41 | −3.21 | −6.02 | 11.36 | −9.23 | 2.13 |
| annual | 4.74 | 3.87 | −2.01 | −5.12 | 8.61 | −7.13 | 1.48 | |
| ST area | summer | 2.69 | 4.87 | −1.81 | −4.58 | 7.56 | −6.39 | 1.17 |
| annual | 2.39 | 5.80 | −1.32 | −6.73 | 8.19 | −8.05 | 0.14 | |
Disclaimer/Publisher’s Note: The statements, opinions and data contained in all publications are solely those of the individual author(s) and contributor(s) and not of MDPI and/or the editor(s). MDPI and/or the editor(s) disclaim responsibility for any injury to people or property resulting from any ideas, methods, instructions or products referred to in the content. |
© 2023 by the authors. Licensee MDPI, Basel, Switzerland. This article is an open access article distributed under the terms and conditions of the Creative Commons Attribution (CC BY) license (https://creativecommons.org/licenses/by/4.0/).
Share and Cite
MDPI and ACS Style
Qi, D.; Li, Y.; Zhou, C.; Chen, D.; Lai, X. Water Vapor Budget Features and Its Precipitation Effects over the Key Area of Sichuan-Tibet Railway in Summer. Water 2023, 15, 1071. https://doi.org/10.3390/w15061071
AMA Style
Qi D, Li Y, Zhou C, Chen D, Lai X. Water Vapor Budget Features and Its Precipitation Effects over the Key Area of Sichuan-Tibet Railway in Summer. Water. 2023; 15(6):1071. https://doi.org/10.3390/w15061071
Chicago/Turabian StyleQi, Dongmei, Yueqing Li, Changyan Zhou, Dan Chen, and Xin Lai. 2023. "Water Vapor Budget Features and Its Precipitation Effects over the Key Area of Sichuan-Tibet Railway in Summer" Water 15, no. 6: 1071. https://doi.org/10.3390/w15061071
Note that from the first issue of 2016, this journal uses article numbers instead of page numbers. See further details here.