
Genotoxicity Signatures near Brine Outflows from Desalination Plants in the Levant
by

Amalia Rosner
1,*,†,
Yaara Grossmark
1,2,†,
Yaron Gertner
1,
Claudette Rabinowitz
1,
Eitan Reem
1 and
Baruch Rinkevich
1 1
Israel Oceanographic and Limnological Research, National Institute of Oceanography, Tel Shikmona, P.O. Box 9753, Haifa 3109701, Israel
2
Marine Biology Department, Natural Sciences Faculty, Haifa University, 199 Aba Khoushy Ave., Haifa 3498838, Israel
*
Author to whom correspondence should be addressed.
†
These authors contributed equally to this work.
Water 2023, 15(6), 1079; https://doi.org/10.3390/w15061079
Submission received: 13 February 2023
/
Revised: 5 March 2023
/
Accepted: 7 March 2023
/
Published: 11 March 2023
(This article belongs to the Section Biodiversity and Functionality of Aquatic Ecosystems)
Abstract
:(1) Background: Desalination is a developing industry that keeps expanding, nowadays counting >15,000 infrastructures worldwide. A byproduct of the desalination process is concentrated brine, further containing operational chemicals, including antiscalants and coagulants. Yet, the potential genotoxic impacts of the inclusive brine are inadequately studied. (2) Methods: In vitro and in vivo assays were used to test the impacts of a representative antiscalant and a coagulant. The model cnidarian Nematostella vectensis was employed to assess the impacts of the tested pollutants on animal longevity. Additionally, the genotoxicity of seawater sampled near four desalination plants was tested using the comet assay. (3) Results: In vitro analyses of the antiscalant and coagulant revealed neither genotoxic nor cytotoxic effects at environmentally relevant concentrations, but they were destructive to whole organisms (N. vectensis) at various developmental stages. Part of the seawater samples from sites near desalination plants were genotoxic, revealing ephemeral and mosaic genotoxicity. Since desalination plants are situated in highly anthropogenic-impacted areas, it is impossible at this stage to evaluate the possible contribution of the brine to overall marine genotoxicity. (4) Conclusions: Exact desalination-associated chemicals and the brine itself should be evaluated directly for potential genotoxicity.
1. Introduction
While sailors have used seawater desalination for centuries to produce potable water [1], it is only in the last five decades that desalination went through industrialization [2]. This reflects the globally distributed temperate, semi-arid, and arid regions experiencing increased freshwater dwindling and shortages, levying economic and socio-developmental constraints on human populations. On a global scale, there are more than 15,000 functional desalination plants [3] that provide potable water to >300 million people from 150 countries [4]. About half of the total desalination industry is situated in the Persian and Oman gulfs and in the Red Sea [5]. Like other countries in the middle east, Israel went from the mid-’90 s through prolonged drought years [6], leading to an acute water crisis [7]. Consequently, the Israeli government initiated a long-term and large-scale desalination program with the construction of five desalination plants along the Israeli Mediterranean shores. The targeted production capacity is planned to reach 1.2 billion cubic meters (CM) of water per year by 2030 after the construction of at least three additional desalination plants, supplementary to the current existing plants (Hadera, Palmachim, Sorek, Ashdod, and Ashkelon), far exceeding the 2021 supply of more than 640 million CM of potable water, covering more than 75% of households’ potable water consumption in Israel [8]. This potable water supply is based on seawater desalination through reverse osmosis (SWRO) technology, the most common seawater desalination technology [1,9,10], accounting for 80% of desalination plants worldwide [11].
Despite the importance of seawater desalination to human livelihood, human health, and environmental benefits, the literature has raised increasing alarms about the potential undesirable impacts of desalination on the biological environment, such as the impingement and entrainment of planktonic organisms from the large seawater volumes pumped during the desalination processes. In the SWRO process, seawater is forced at pressure through a semi-permeable membrane that filters out salts, minerals, and any other particulate and dissolved substances present in the seawater, including pollutants [7]. Although recently improved manufactured membranes present greater fouling resistance [12], the main concern of an SWRO plant is dealing with the need for high-quality feed water, as poor feed water may lead to short reverse osmosis membrane lifetimes, short periods of operation, and high maintenance costs [12,13,14]. In order to obtain high-quality feed water, materials within the intake water must be removed or reduced to acceptable levels, and thus feed water is pretreated with various materials aiming at coagulation, pH adjustment, scale inhibition, and media filtration [5,14]. Coagulation materials, including aluminum sulfate (alum), ferric salts, lime, and polyelectrolyte, target the removal of particles by combining smaller particles into larger aggregates via the neutralization of the electrical charges of particles by commonly used coagulants [13]. Scale inhibitors (antiscalants), including sodium hexametaphosphate, organophosphates, and polyacrylates, are used to control the scaling of soluble salt from the feed water onto the membranes [13,15]. Residues of these materials that are moved to the discharge brine have various potential toxic impacts on the environment [16,17]. In addition, the brines, which are usually released to the environment [5], may contain concentrated toxic materials present in the intake water, heavy metals originating from the corrosion of infrastructure, and chemical additives used in the pretreatment or their conversions [5,17,18].
About 60% of the water that is pumped by the desalination plants is returned to the sea in the form of brine [3]. According to the Israeli “Marine coastal pollution report” (as of now, the latest published report online dates to 2017 [19]), the discharges from desalination plants constitute 91.8% of total discharges (914 million MC) to the Israeli Mediterranean shores. The total desalination activity is not only continuously operating but also expanding, increasing the likelihood of the accumulation of pollutants around the desalination plants. Besides the regular discharge of brine water by the desalination plants, there are also various accidents that augment chemicals reaching the marine environment [20]. Thus, the discharged brine may carry harmful impacts, impairing coastal water quality and further affecting marine life [5,17,21].
In spite of the above concerns regarding the potential environmental impacts involved with the expanding desalination industry, studies focusing on brine water impacts are relatively limited, concentrating on limited abiotic (e.g., salinity, temperature) [22,23] and biotic (e.g., effects on species density, species variation) [5,24] parameters. One such important parameter is the potential genotoxic impacts (inflicted damage to DNA integrity) of the brine, which, in the long term, may lead to tumors, hereditary defects, and teratogenic effects [25,26]. While yet undisclosed, discharged brine from desalination plants may have a genotoxic impact on the marine environment, by the buildup in the condensate of pre-existing pollutants in the intake waters, chemicals which are added to the brine during the process such as antiscalants and coagulants, and leached heavy metals following pipeline corrosion. Some studies evaluated potential genotoxicity in desalination plants through chlorination, a disinfection process applied in pre-treatment stages to reduce membrane biofouling [27,28], while very few studies sampled brine discharge areas for genotoxicity [29].
The comet assay (SCGE, Single-Cell Gel Electrophoresis) is a sensitive technique commonly used to evaluate genotoxicity (DNA damage) instigated by various agents (e.g., chemicals, radiation) in individual cells. The assay involves multiple consecutive steps, including the preparation of cell suspensions, embedding the cells in low-melting agarose on microscope slides, exposure to the tested agent, lysis of the cells, electrophoresis, staining of the DNA, and scoring the results. It is a time-consuming and precise process. The analysis outcome is images of cells’ nuclei that acquire a “comet” shape, with a head (intact DNA) and a tail (damaged DNA). The extent of DNA damage is proportional to the genotoxicity of the tested agent and can be precisely scored. To avoid subjectivity, the results are automatically quantified for a fixed number of cells (normally 200 or 300 cells) using specialized software that compares the length and intensity of the tail to that of the head. The comet assay is a highly sensitive, cost-effective, and flexible methodology that can be applied to a variety of cell types from different organisms and tissues and used to evaluate a wide range of agents. However, it provides information on DNA damage only, without identifying the cause. The assay might show variability due to differences in sample preparation, electrophoresis conditions, cell type, and so on. Additionally, some types of tissue that cannot be easily separated into individual cells cannot be efficiently processed due to damage caused during the dissociation process [30]. The comet assay has been successfully implemented in the field of aquatic environmental assessment for testing various materials, such as pesticides, hydrocarbons, nanoparticles, environmental endocrine disruptors, and heavy metals, using both in vivo and in vitro models [31,32,33,34].
In Israel, the quantities of coagulants and antiscalants discharged into the sea are limited by permits issued by the environmental ministry to each desalination plant, such as the permit issued to the Ashkelon desalination plant in 2018 [35]. The explicit names of the coagulants and antiscalants used by the desalination plants in Israel, as well as the actual quantities discharged into the sea, are not publicly available. Additionally, we did not receive authorization from the desalination companies to sample raw brine at the source. Therefore, this research evaluates genotoxic levels in seawater samples from sites close to desalination plants’ outfalls along the Mediterranean coast of Israel without the possibility of comparing the results to the genotoxicity of the brine. Furthermore, the genotoxicity of only a representative coagulant and a representative antiscalant were tested under laboratory-controlled conditions, and not all the coagulants and antiscalants used by desalination plants were tested.
2. Materials and Methods
2.1. Cell Cultures
We used fish hepatoma cell line RTH-149, originating from an Aflatoxin-induced hepatoma in an adult rainbow trout (Oncorhynchus mykiss) [36], regularly cultured in the laboratory [37,38] in Leibovitz L-15 medium (L-15) supplemented with 10% fetal calf serum (FCS), 2 mM L-glutamine, 1 mM Hepes buffer, and 1% penicillin–streptomycin–amphotericin B (PSA). A few days before each experiment, confluent cultures were dislodged using Trypsin-EDTA, and the cells were distributed as required for the test.
2.2. Artificial Sea Water (ASW) Control
A solution mimicking the concentrations of salts in the sea was used as a control: 1x ASW is composed of 1.87 M NaCl, 0.044 M KCl, 0.039 M CaCl2.2H2O, 0.18 M MgSO4.7 H2O, and 0.12 M MgCl2.6 H2O [39]. When the seawater samples differed in salinity/pH from the basic ASW controls, additional controls of modified ASW with matching salinity/pH to the seawater samples were used.
2.3. Chemicals
Progal PK350 (cat no 10028-22-5, Amgal Chemicals Manufacturing-1989, Ltd., Be’er Tuvia, Israel) is a coagulant with the chemical formula Fe2(SO4)3. Aquarex 1214 (GES-environmental solutions) is an antiscalant approved by the “Israeli Standards Institute” for drinking-water treatment.
2.4. LD-50 Assay
Specimens of the starlet sea anemone Nematostella vectensis were cultivated in 100 mm diameter tissue culture dishes in non-circulating sea water and diluted with double distilled water (DDW) 1:2 at room temperature with a weekly water change and twice-weekly feeding with Artemia nauplii. The sea anemones were then exposed to different dosages of the test chemicals for 30 days. The range of tested concentrations was determined through preliminary experiments that established maximal concentrations (which caused complete mortality of all exposed animals within one to six days), while minimal concentrations were within the range of quantities approved by authorities for discharge in desalination plant permits. Six concentrations of Progal 350 PK (0, 3.7, 37, 50, 75, and 100 ppm) were tested using 180 N. vectensis specimens divided into 36 plates, with 5 animals per plate. Additionally, six concentrations of Aquarex 1214 (0, 20, 40, 60, 80, and 100 ppm) were tested using 360 N. vectensis specimens divided into 36 plates, with 10 animals per plate. Each dosage had six replicates. The animals were monitored every two to three days, the survival percentage was determined, and dead animals were removed.
2.5. Neutral Red Test
The test was performed as described by Repetto et al., 2008 [40]. The method is based on the ability of living cells to accumulate Neutral Red dye in their lysosomes. A stock solution of Neutral Red (Sigma, cat. no. N4638) at a concentration of 4mg/mL was prepared by diluting Neutral Red in PBS. Neutral Red stain solution was prepared by diluting the stock to a concentration of 40 μg/mL with a culture medium. The Neutral Red destain solution is composed of 50% ethanol (96%), 49% distilled water, and 1% glacial acetic acid (Sigma).
Each test was performed on 1 × 10⁵ RTH-149 cells resuspended in 200 µL of medium/well and seeded in 96-well plates. Each experiment was performed in triplicate. The tested chemical was added to the wells for one hour. After incubation, the chemical was removed, and the wells were washed with 150 µL PBS. Then, the cells were exposed to Neutral Red stain solution for two hours. The medium was removed and the cells were washed with PBS. After PBS removal, the dye was extracted from the cells by adding 150 µL/well of Neutral Red destain solution, while rapidly shaking the plate for 10 min until a homogeneous solution was formed. The dye levels were determined by reading each solution absorbance (540 nm) and comparing the results with a calibration curve established in parallel on known quantities of living cells.
Six concentrations of Progal 350 PK (0, 3.7, 37, 50, 75, and 100 ppm) were tested with nine replicates for each concentration, and five concentrations of Aquarex 1214 (0, 5, 50, 500, and 5000 ppm) were tested with six replicates for each concentration.
2.6. Testing Genotoxicity by Comet Assay
RTH-149 cells were inoculated onto sterile 6-well plates and incubated for 24h. The cells were exposed to the tested chemical, or a sample of seawater diluted 1:1 with the medium and incubated for 1h at 20 °C (dark conditions). Then, the medium was removed, and the cells were trypsinized. The dilution ratio was established following preliminary experiments, which tested the highest salinity for RTH cells’ endurance.
The comet assay followed the protocols used in the laboratory [41,42,43]. An amount of 10 µL of cell suspension was embedded in 90 µL of a 0.65% low-melting agarose (LMA) layer on a star-frost microscope slide pre-coated with 0.65% normal-melting agarose (NMA). After 5 min of solidification on ice, a third layer of 120 µL LMA was placed on top and left on ice for solidification for another 20 min. The slides were then immersed in a freshly prepared lysis solution (2.5 M NaCl, 100 mM EDTA, 10 mM Tris, 10% DMSO, 1% Triton X-100, pH = 10), left to soak overnight at 4 °C, and then were washed three times, 5 min each in DDW.
The electrophoresis box was leveled on ice and filled with 850 mL cold alkaline running buffer (1 mM EDTA, 300 mM NaOH, pH 13.0). After washing, the slides were placed in the electrophoresis box for 20 min for DNA unwinding. Electrophoresis was carried out at 300 mA, ~20 V, for 20 min, and followed by slide washing (3 times, 5 min each, in Tris solution), then dehydration in 70% ethanol for 5 min, 5 min in 100% ethanol, and air drying. Slides were kept in darkness until the analyses. Slides were stained with 50 µL of 20 µg/mL ethidium bromide solution, mounted with cover slides, sealed, and kept in darkness. The slides were read under a fluorescent microscope; 50 nuclei per slide were photographed and scored (% of DNA in the tail) using VisComet image analysis software [41,44,45]. The experiment was repeated three times for each tested sample per site. During the assay, a total of 300 cells were analyzed for the appearance of comets following each treatment.
Statistical analyses were conducted using SPSS 16 and SPSS 23 software. For the seawater samples, a Chi-square test was performed, comparing the number of nuclei with more than 25% tail DNA that developed in the sampling groups to the nuclei numbers in the control cells. This was done to avoid pseudo-replication, as each sub-site was sampled only once. The comet assay results for the chemical tests were analyzed using ANOVA or the non-parametric Kruskal–Wallis and Mann–Whitney post hoc tests, depending on the distribution and variance of the data. An α level of 0.05 was used to determine the significance and the B-Y method for α corrections [46]. Pearson or Spearman correlations were performed following the data’s distribution and variance.
Progal 350 PK genotoxicity was tested for seven concentrations (0, 3.7, 50, 75, 100, 500, and 1000 ppm), and Aquarex-1214 genotoxicity was tested for five concentrations (0, 5, 50, 500, and 5000 ppm). These concentrations reflect the range between concentrations approved for discharge into the sea and concentrations found in this study to cause severe poisoning and death.
2.7. Water Sampling
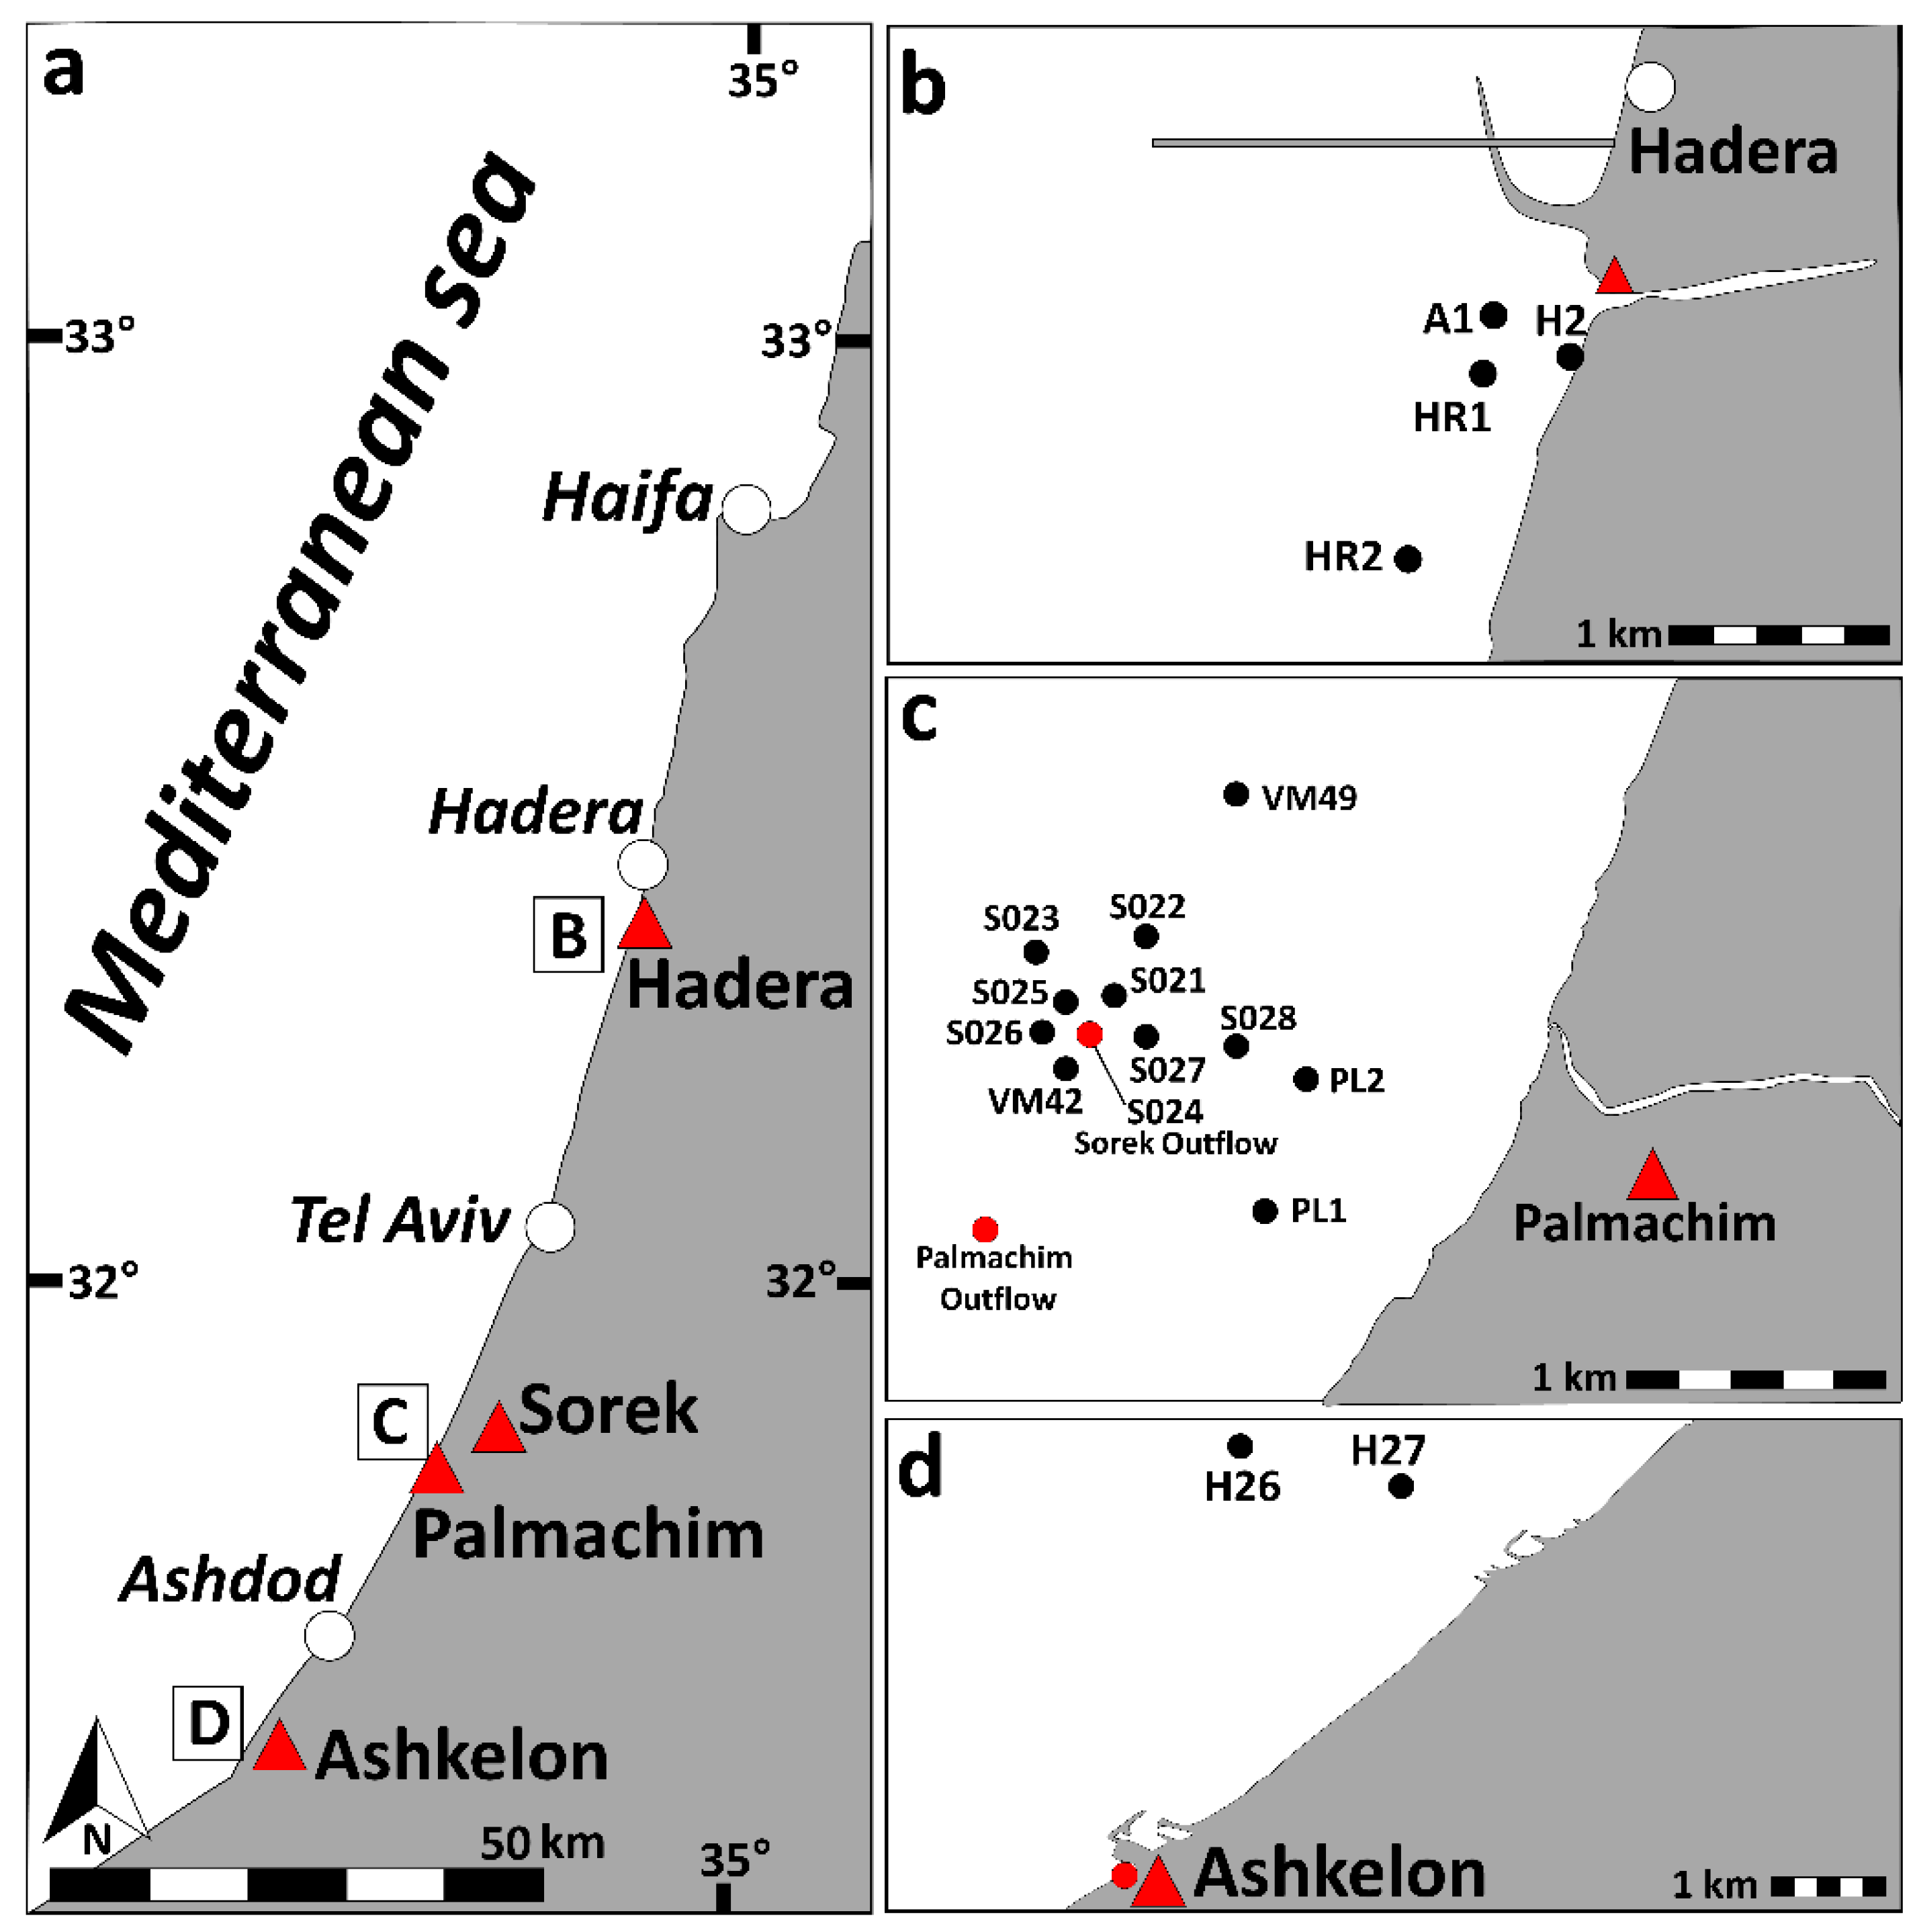
Water samples (50–100 mL) were obtained from sites near the discharged brines of four large desalination plants along the Mediterranean coast of Israel (Figure 1). In 2014, one sampling session was conducted near three of the desalination plants: Ashkelon (operated by VID Desalination Company Ltd, Herzliya, Israel), Sorek (operated by SDL Desalination consortium Ltd, Kadima, Israel), and Palmachim (operated by Via Maris Desalination Ltd, Herzliya, Israel). Multiple sampling sites per plant are indicated in Figure 1 and Table S1 in the Supplementary materials section.
The fourth desalination plant, at Hadera (operated by the H2ID consortium, Hadera, Israel), is located next to the harbor of Orot Rabin power infrastructure (Figure 1, GPS coordinates, sampling date, and salinity of each sample—Supplementary Table S2). It has a production capacity of 127 million MC/year, and before being returned to the sea, the brine water is diluted with the cooling waters from the Orot Rabin power plant [5]. Sites near the Hadera desalination plant were sampled monthly for a period of six months during the 2013/2014 season (not all sites were sampled every month; see Supplementary Table S2).
All samples were filtered using PES 0.22 μm vacuum-driven filters, measured for salinity and pH, and stored at 4 °C until used.
3. Results
3.1. Toxic Impact of a Coagulant and an Antiscalant
To evaluate the possible genotoxic impacts of chemicals used in the process of water desalination, a representative coagulant (Progal 350 PK) and antiscalant (Aquarex 1214) were tested. The impacts of each of these materials were studied using three ecotoxicological approaches: (1) LD50 levels for each of the two chemicals, established on N. vectensis (Figure 2a) individuals, an established aquatic invertebrate model species in regenerative biology and ecotoxicological studies [47]; (2) cellular cytotoxicity curves using various levels of each chemical employed on RTH-149 cells using the Neutral Red assay; (3) the potential genotoxicity of various chemicals levels employed on RTH-149 cells using the comet assay.
3.1.1. Setting LD50 for Progal 350 PK and Aquarex 1214
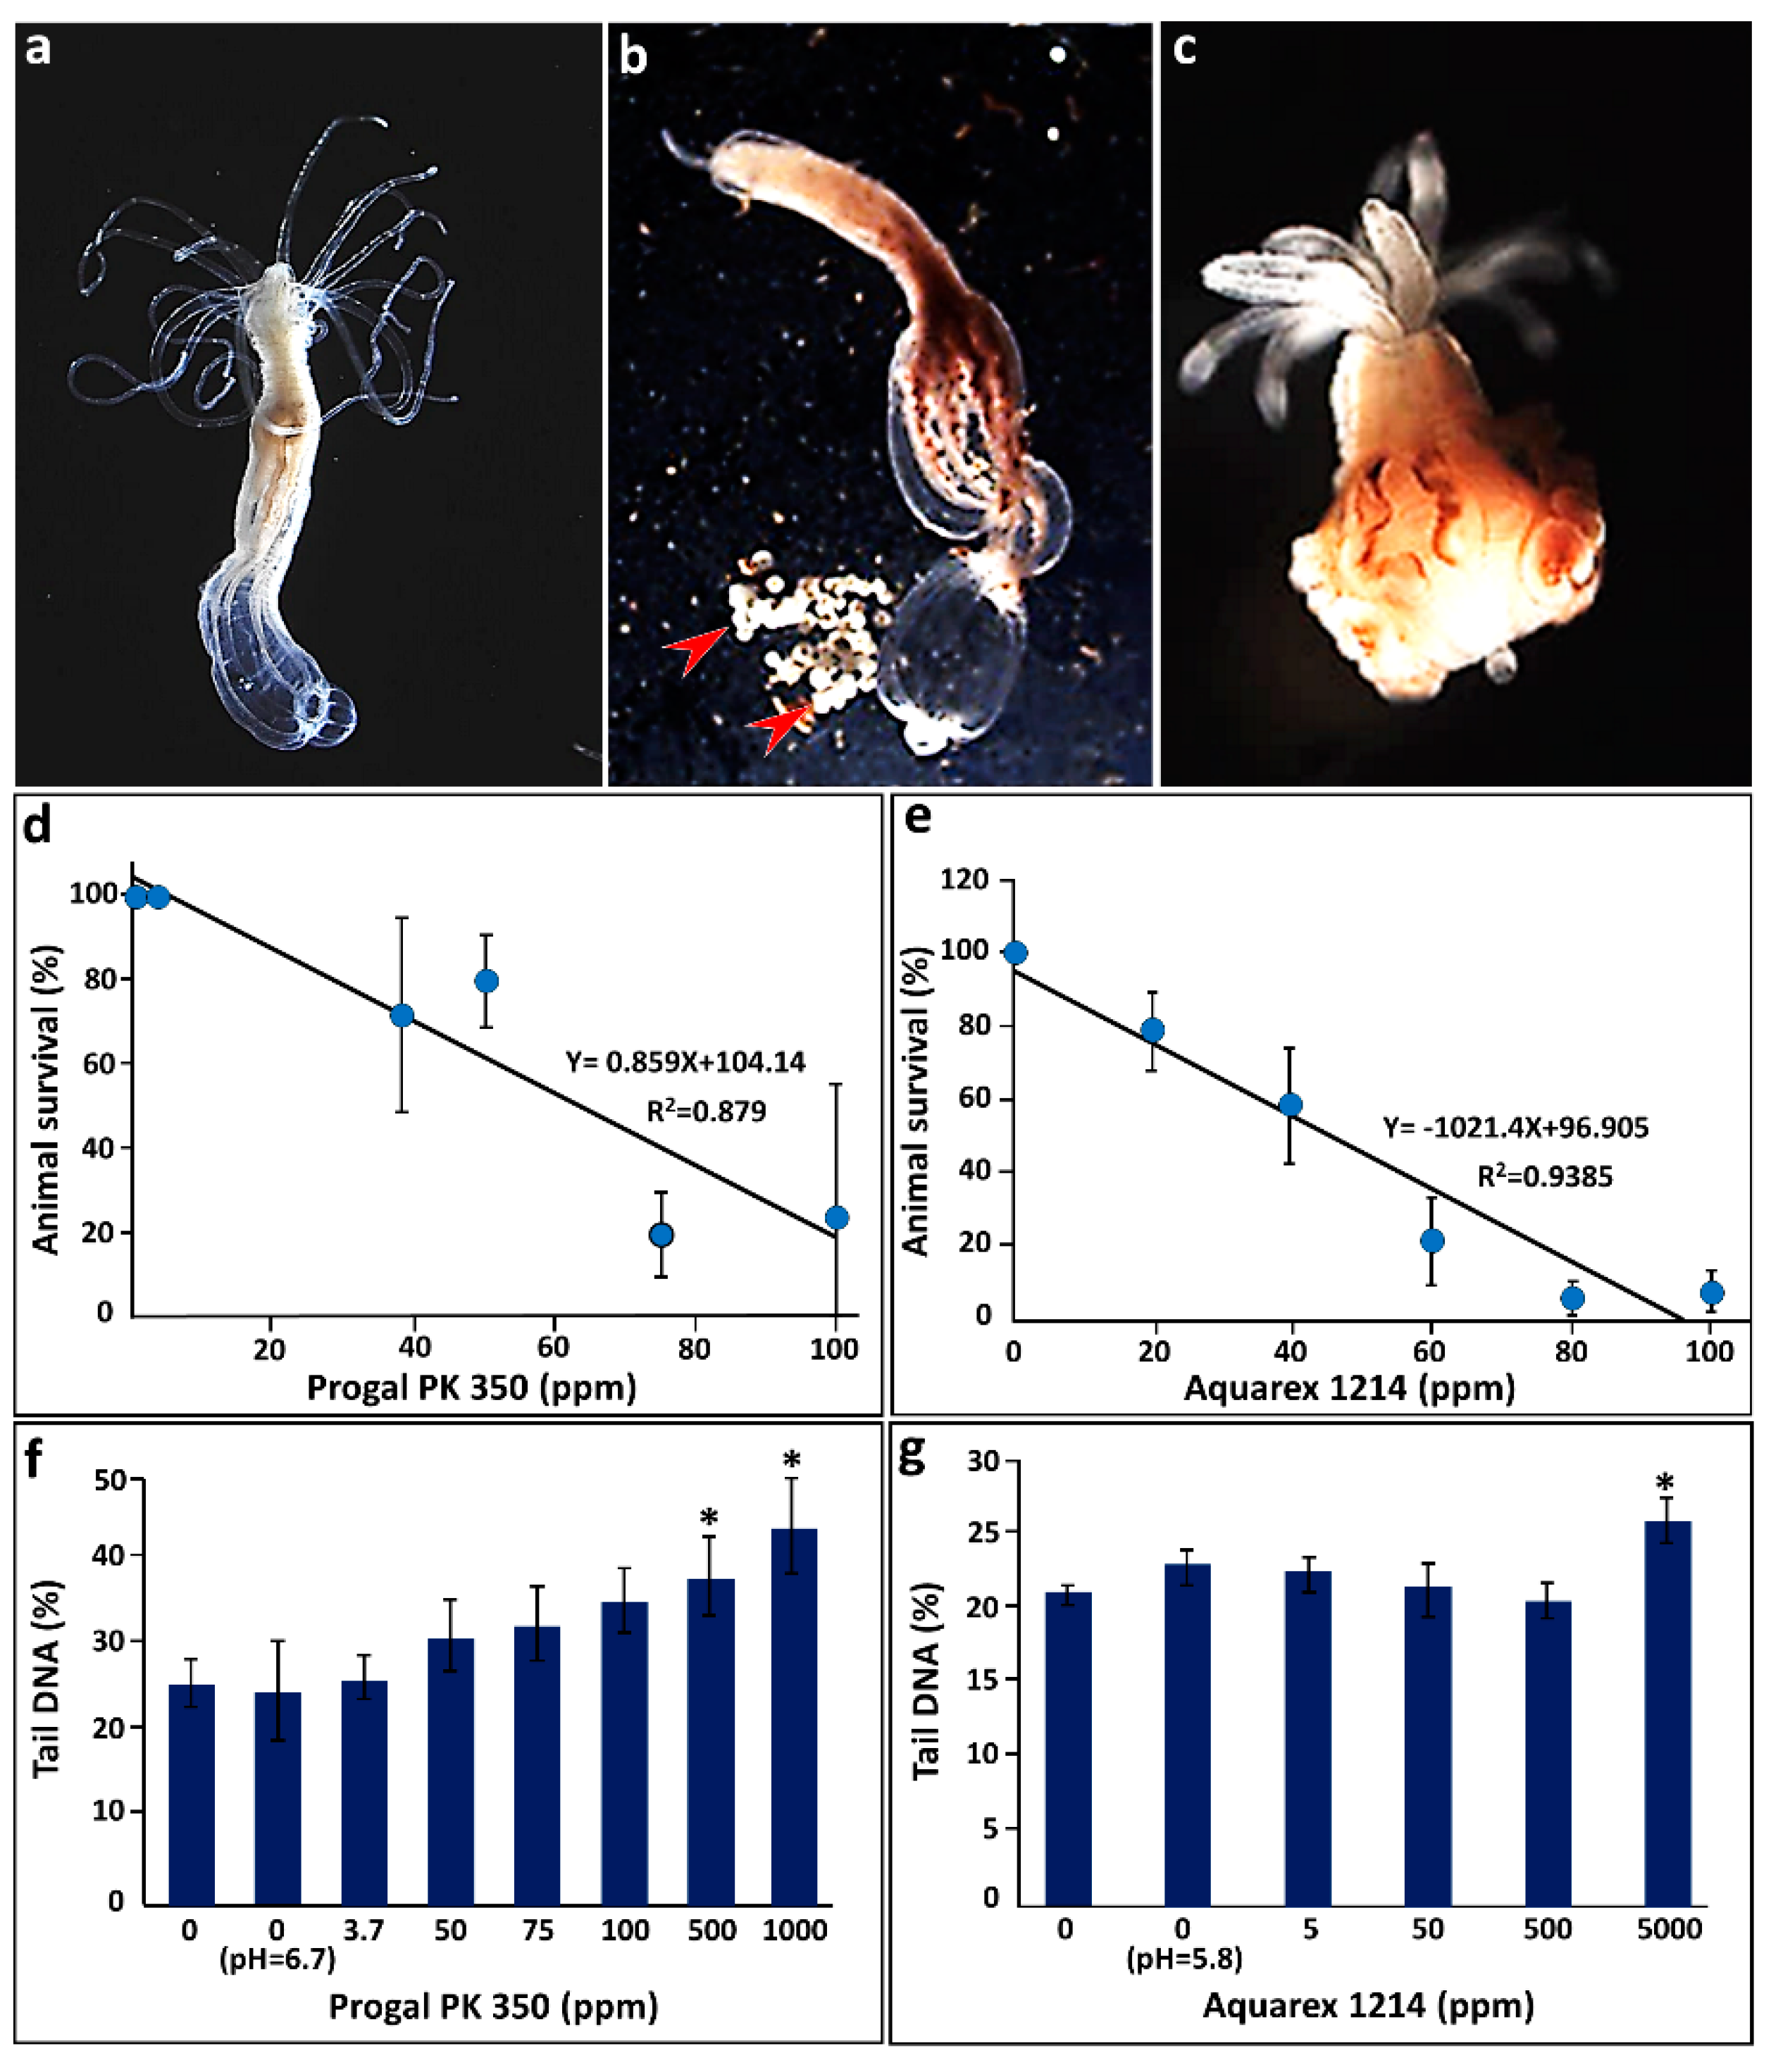
Five concentrations of Progal 350 PK and a control growing medium were tested (Figure 2b,d). Each concentration was tested on six different groups of animals (6 repetitions) that were monitored every 2–3 days up to a period of 30 days, during which dead animals were counted and removed. The mortality of animals was observed as of 24 h after exposure to concentrations of ≥50 ppm of Progal 350. At these concentrations, all surviving animals, while responsive to touch and food stimuli, were wrapped with a mixture of coagulant and tissue debris (data not shown). At low concentrations of 3.7–37 ppm, while no phenotypic changes were seen, laid egg bundles failed to develop into the planula larvae stage (Figure 2b). The Kruskal–Wallis test (data not shown) revealed significant impacts on animal survival at Progal 350 PK concentrations ≥75 ppm compared to control treatment, and the regression test (Figure 2d) revealed LD50 at 63 ppm.
Five concentrations of Aquarex 1214 and a control growing medium were tested (Figure 2c,e). Each concentration was tested on six different groups of animals (6 repetitions) that were monitored as previously described. Exposure to the high concentration of Aquarex 1214 (≥ 60 ppm) inflicted inverted morphology on the exposed animals (Figure 2c). The mortality of animals was observed as of 24 h after exposure to concentrations of ≥ 60 ppm of Aquarex 1214. At low concentrations (20 and 40 ppm), planulae developed from eggs released during exposure did not survive. The Kruskal–Wallis test (data not shown) revealed significant impacts on animal survival at concentrations ≥40 ppm relative to control treatment and the regression test (Figure 2e) revealed LD50 at 45.92 ppm.
3.1.2. Cell Viability following Exposure to Progal 350 PK and Aquarex 1214
The Neutral Red test was used to evaluate RTH-149 cell viability following exposure to Progal 350 PK by employing six concentrations in the range of 0–100 ppm of Progal 350 PK, with nine repetitions for each concentration. No significant impact on viability was found at the tested concentrations (data not shown). Aquarex 1214’s impacts on cell viability were tested within the range of 0–5000 ppm of the antiscalant, with six repetitions for each concentration. Significant cell mortality relative to control treatment was revealed only at the 5000 ppm of Aquarex 1214 (p = 0.004, Kruskal–Wallis test).
3.1.3. Genotoxicity Testing of Progal 350 PK and Aquarex 1214
RTH-149 cells were exposed to Progal 350 PK concentrations in the range of 0–1000 ppm (Figure 2f). As the pH of the medium at 500 and 1000 ppm was shifted from 7.2 to 6.7 and 6.1, respectively, we added medium-modified controls to match the low pH levels (since no significant difference in genotoxicity between the two controls was observed, only the results of the control at pH 6.7 are shown). The results (Figure 2f) further showed that there was no significant difference in genotoxicity between the pH controls and that only high concentrations of Progal 350 (≥500 ppm) significantly enhanced genotoxicity (p < 0.001, ANOVA test).
RTH-149 cells were also exposed to Aquarex-1214 concentrations in the range of 0–5000 ppm (Figure 2g). As the pH of the medium at 5000 ppm was shifted from 7.2 to 5.8, we added medium-modified control with pH = 5.8. The results (Figure 2g) further showed that there was no significant difference in genotoxicity between the pH controls and that only high concentrations of Aquarex-1214 (≥5000 ppm) significantly enhanced genotoxicity (p = 0.002, ANOVA test).
3.2. Sea Water Genotoxicity
Water samples were collected during 2013/2014 near the discharge outlets of four desalination plants along the Israeli Mediterranean shores: Ashkelon, Hadera, Palmachim, and Sorek (Figure 1; GPS coordinates, sampling date, and salinity of each sample—Supplementary Tables S1 and S2).
3.2.1. Ashkelon Desalination Plant
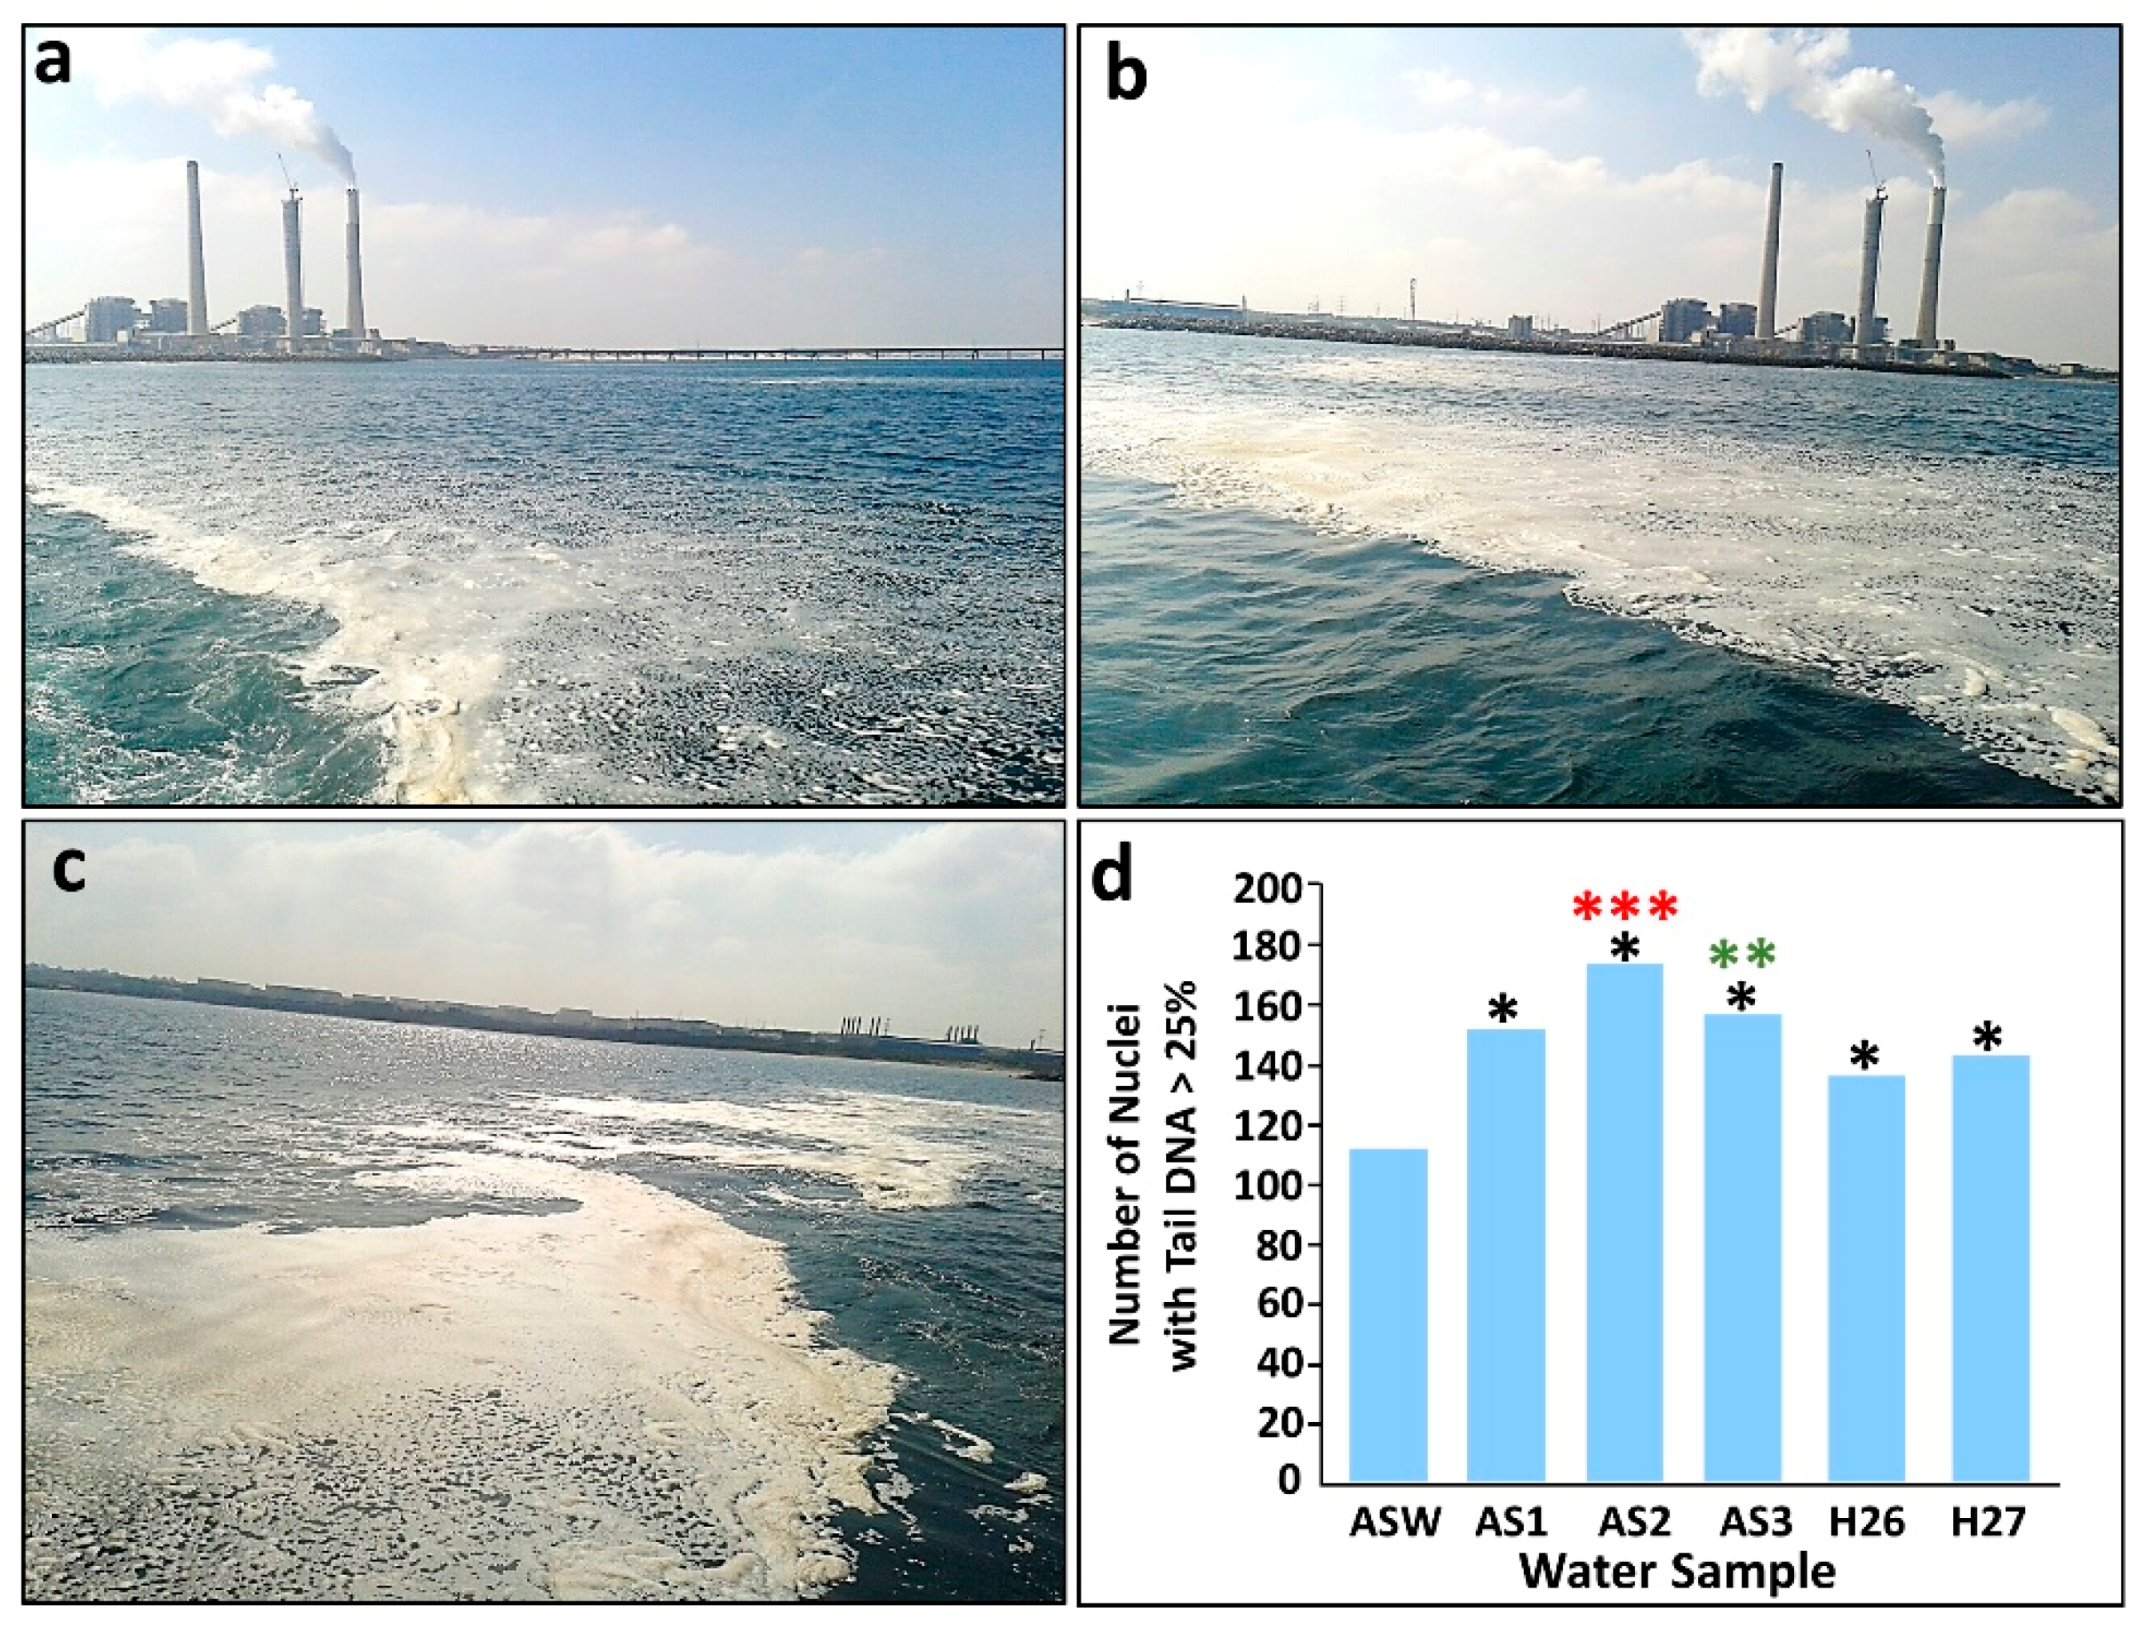
On the sampling day, a large spill of unknown origin was seen on the sea surface near the outflow (Figure 3a–c). Three samples were taken from that region (AS1, AS2, AS3) and two samples (H26, H27) were taken 7.8 and 7.4 km, respectively, away from the Ashkelon desalination plant outflow. All sites revealed significantly higher genotoxicity (p < 0.001,) compared with ASW, including H26 and H27 (Figure 3d). A comparison of the seawater samples from sites within the spill, to the two distant sites (H26 and H27), revealed significantly higher genotoxicity in AS2 as compared to H26 and H27 (p < 0.001), and AS3 as compared to H26 (p < 0.013; Figure 3d).
3.2.2. Palmachim and Sorek Desalination Plants
The Palmachim and Sorek outflows are relatively close to each other, located 0.9 km apart (Figure 1; Table S1). The Palmachim discharge site is at a depth of 17.6 m, while the Sorek discharge site is at 18.1 m (Y.G., personal communication). The two seawater samples taken close to the Palmachim plant infrastructure (PL1 and PL2) had different salinity levels (54 and 41 g/L, respectively), so an additional ASW control with matching salinity (ASW-P1) was used in this experiment. The nine Sorek samples taken near the outflows had similar salinity levels (45 g/L), so in this experiment, we used one appropriate salinity-modified ASW control (salinity 45 g/L).
Genotoxicity tests (Figure 4) revealed significant differences (p < 0.027; B-Y correction for multiple testing) between all Palmachim desalination plant field samples when compared to ASW. ASW and ASW-PL1 were also significantly different from each other, consistent with the known finding that salinity can be genotoxic [48]. Chi-square statistical tests showed that PL1 had higher genotoxicity (p < 0.027) than the matched corresponding control (ASW-P1) and PL2, likely due to its closer proximity to the spillage.
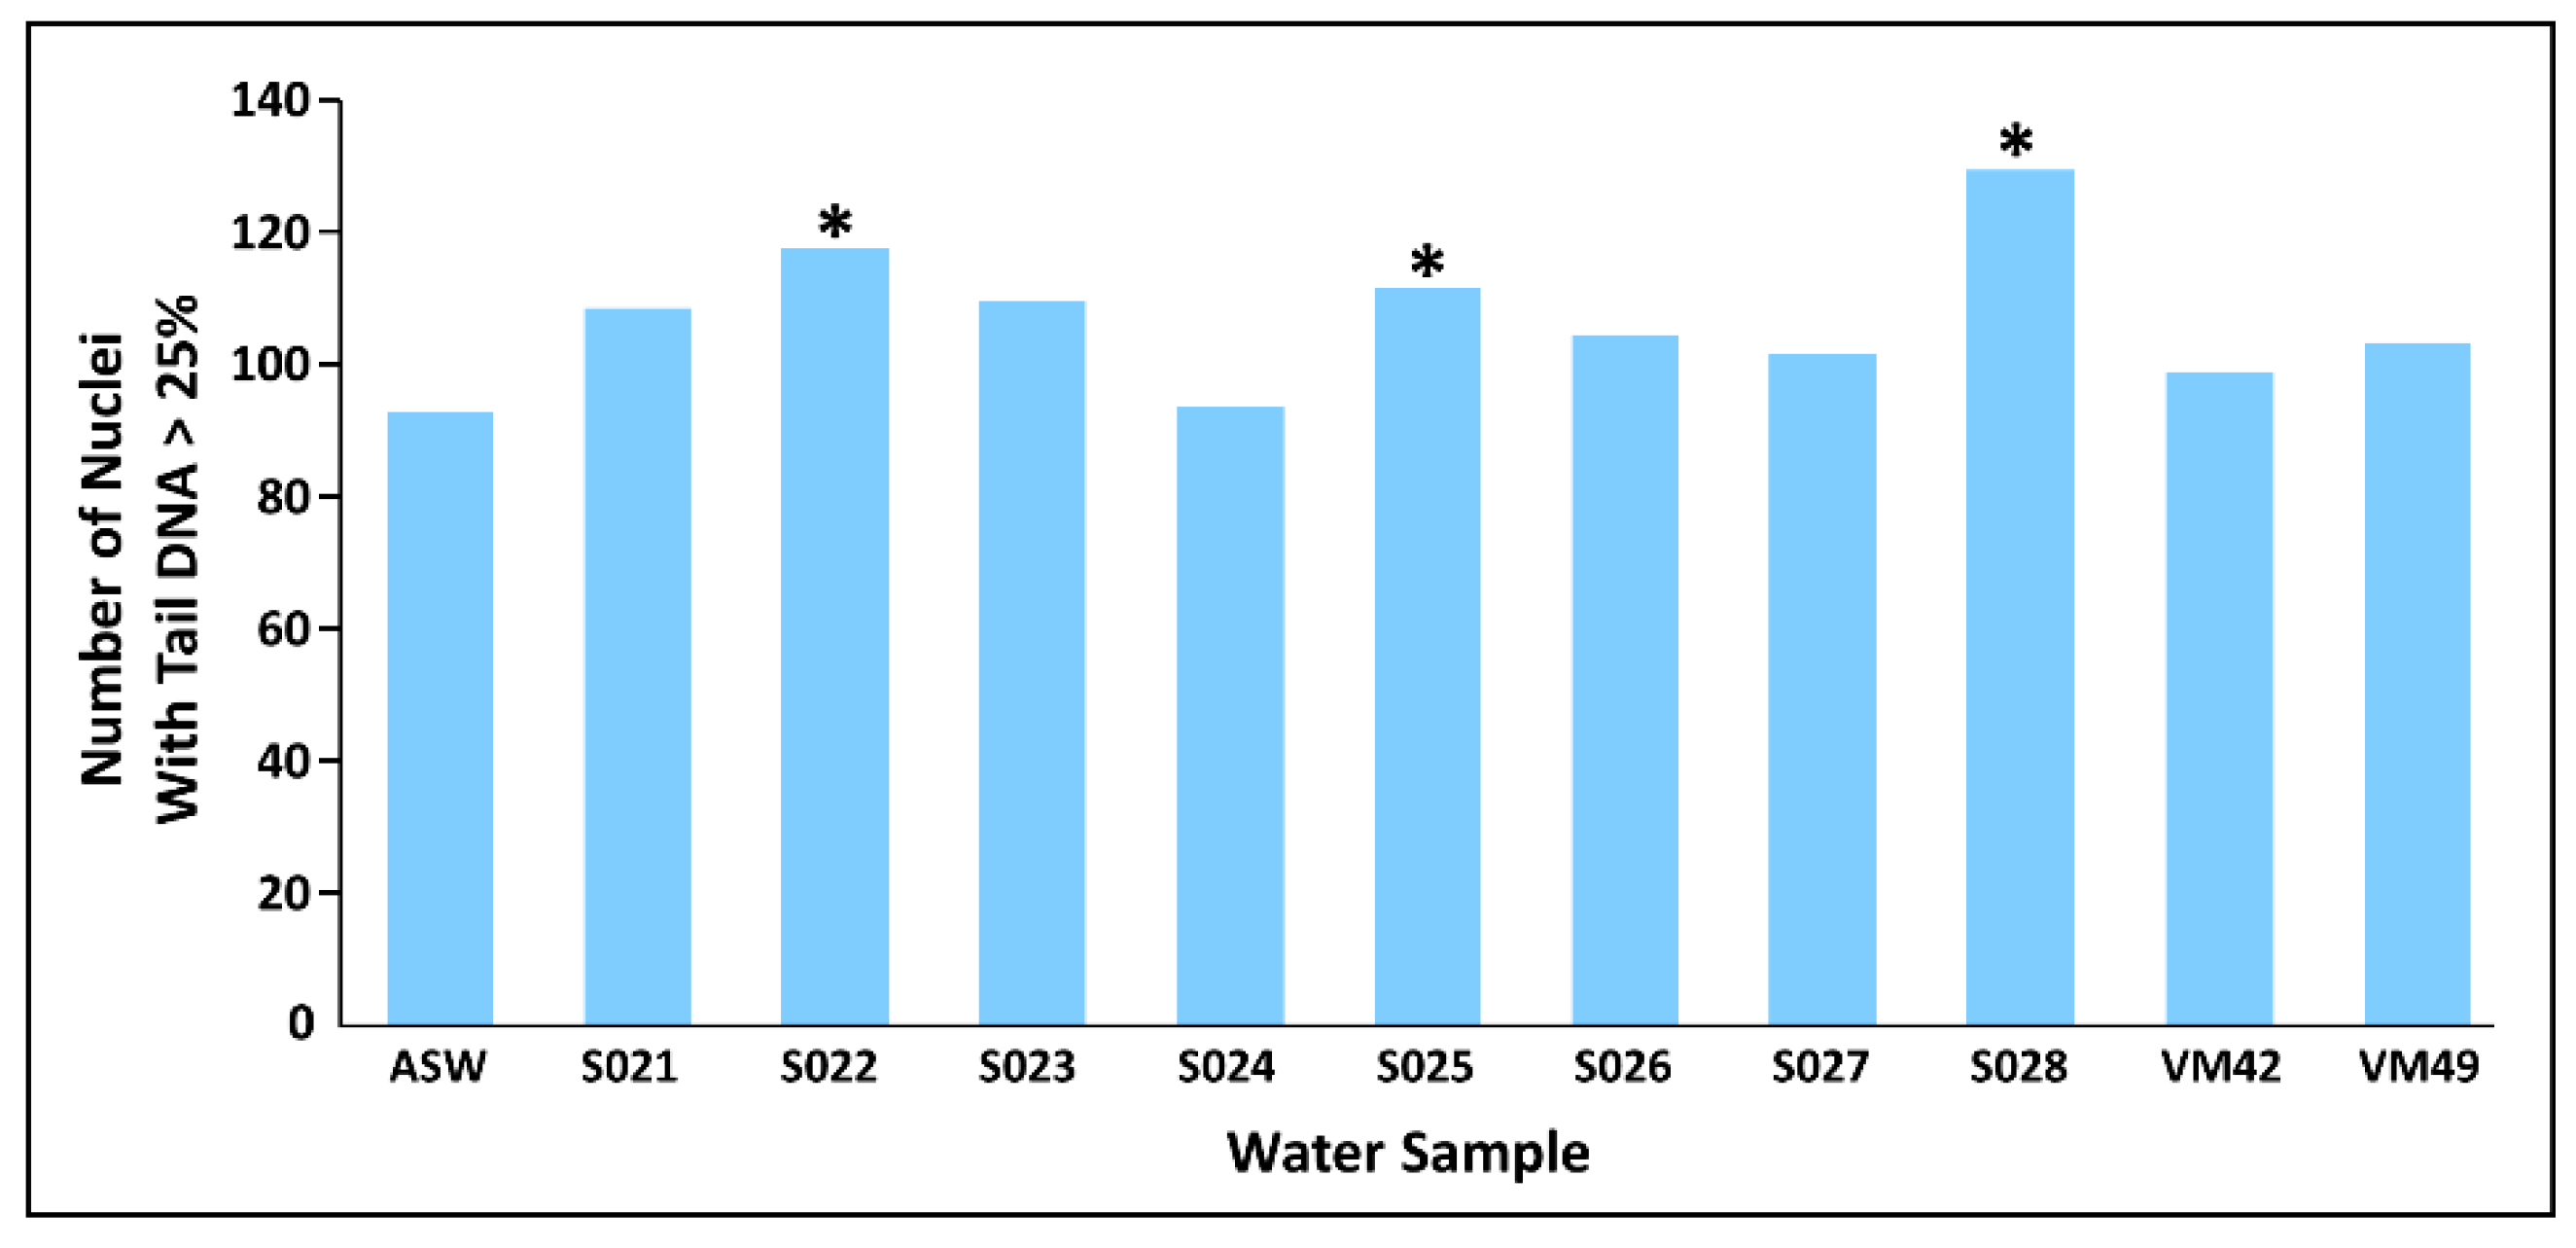
Several sites situated near Sorek and Palmachim outflows (Figure 1 and Figure 5) were similarly tested. Two sites located north of the outflows (SO22 and SO25) and one east of the outflows (SO28) showed significant differences compared to the control (p < 0.017, according to B-Y correction for multiple testing; Figure 5). The other sites including, the site at the Sorek outlet (SO24), had no significant increase in genotoxicity.
3.2.3. Hadera Desalination Plant
The brine from the Hadera desalination plant is mixed with the Orot Rabin power plant cooling seawater before discharge to the sea, thus no fluctuations in salt concentrations were detected at the outflow. Samplings were repeatedly taken from four sites (Figure 1, Table S2) for six monthly sessions during summer (July and August), autumn 2013 (November), and winter 2013/2014 (December–February). The distances between the outflow and the sampling sites ranged from 500 m (H2) to 1.4 km (HR2). The results (Figure 6) show significantly higher genotoxicity relative to ASW assigned to some water samples with no association to a specific site (i.e., significant toxicity was detected in site H2, 2/5 times; in site A1 and HR1, 3/6 times; in site HR2, 1/5 times). There was no correlation between the season and genotoxicity. A repeated measures ANOVA analysis employed on the average genotoxicity in the studied period (months July 2013–February 2014) did not reveal a site that was persistently genotoxic (Figure 6).
4. Discussion
Desalination is an expanding industry that is essential to the livelihood of an increasing number of countries. It is most likely the ultimate solution for water shortage and drought problems. However, concerns have been raised about the potential environmental impacts associated with desalination, including the discharge of brine. Brine contains concentrated seawater salts and may also hold substances associated with water treatment and equipment maintenance [5]. The impacts of brine discharge can be evaluated through different approaches, some of which this paper partially applies.
The discharged brine, including the supplementary chemicals added during the desalination process, may have adverse impacts on a wide range of biological organizations including impacts on community composition, the whole organism, and the cellular and sub-cellular levels. This study evaluated the impacts of a coagulant and an antiscalant on N. vectensis individuals, showing negative effects on reproduction even at low concentrations. For example, 3.7 ppm of the coagulant Progal 350 PK harmed larval development, and Aquarex 1214 (20 ppm) caused planulae death. Higher concentrations (≥75 ppm of Progal 350 PK; ≥40 ppm of Aquarex 1214) resulted in significant adult mortality. These results are aligned with previous reports on other cnidarians revealing harmful impacts of the increased salinity in the presence of environmentally relevant concentrations of antiscalants (0.2 mg/l SW, polyphosphonate-based), leading to the partial bleaching of corals Stylophora pistillata, Acropora tenuis, and Pocillopora verrucose [49]. Various antiscalants (0.025mL/l SW) had further significant impacts on the physiology and vitality of the coral Montipora capricornis, with polyphosphonate-based antiscalants being more harmful than polymer-based [50]. On the cellular level (cell vitality), our results revealed that Progal 350 PK was not cytotoxic at tested ranges (up to 100 ppm), while Aquarex 1214 was toxic at concentrations ≥ 5000 ppm. On the sub-cellular level (genotoxicity) the present study showed enhanced DNA breakage at high concentrations (≥500 ppm for Progal 350 PK; ≥5000 ppm for Aquarex 1214) not at environmentally relevant levels. It should be noted that these results and the follow-up conclusions are not general, as other coagulants, antiscalants, and other additives used in the desalination industry may carry different cellular/genotoxic impacts. Further, it is well known that there are substantial inter-species and sometimes intra-species differences in animals’ responses to environmental pollutants [51]. Therefore, it is necessary to test additional marine keystone species from different phyla for their sensitivity to brine-associated pollutants before drawing general conclusions or building models [52] to assess the impact of brine on marine populations. The exact cell type used for the comet assay is also an important factor, as there is variability in the repair rates in various tissues [53]. The RTH-149 cell line used in this research has been previously tested and successfully applied to detect genotoxicity in a variety of aquatic samples [41].
Since raw brine samples were unavailable to us, we tested genotoxicity in seawater samples taken from open-to-the-public sites that are close to the desalination outflows, an approach that may reveal total seawater genotoxicity that combines impacts imposed by the brine in combinations with other-source pollutants (e.g., power plant station effluents). Further, since no pollution-free reference site has yet been identified, we used an artificial seawater solution as a control. It should further be considered that the high salt concentrations in the brine may carry genotoxic impacts [48] on animals and microbial communities [54,55]. This methodological aspect was responded to in the present study by adding the salt-modified ASW controls when testing high-salinity-containing field samples. Yet, the genotoxic impacts generated by salinity alone should be further considered and examined in follow-up studies.
Marine cell lines tolerant to high salt concentrations were not available to us. Therefore, the environmental samples tested in this study had to be diluted (1:1) before being applied to the cell line (RTH-149) used in the comet assay protocol. Such dilution artificially reduces the pollutant concentration in the sample, which, in turn, reduces the sensitivity of the test. As a result, the outcomes obtained in the study should be considered as presenting lower-skewed thresholds of toxicity.
Our analyses of the environmental genotoxic levels near four of the five large desalination plants along the Israeli coast revealed: (1) High genotoxicity sites in large, unidentified spills traced near the Ashkelon and Palmachim desalination plants, in close proximity to outflows where the brine is spilled directly into the environment (Palmachim and Sorek). (2) Enhanced genotoxicity was detected in distant sites from the outflows, such as H26 and H27, located 7.8 and 7.4 km away from the Ashkelon brine discharge, respectively (Figure 3). This implies that the genotoxicity is affecting areas of the Israeli Mediterranean seawater independently from the desalination plants. (3) Genotoxicity near the Hadera desalination plant (six sampling sessions over eight months) presents ephemeral and mosaic patterns not associated with the brine outflow sites.
Overall, this first study testing seawater genotoxicity in association with the desalination brine did not reveal a clear causality, yet the unambiguous genotoxic results in some sites highlight the existence of environmental genotoxicity along the Israeli Mediterranean shores. These results thus call for additional studies to be employed. On the other side, the desalination industry should assess potential genotoxic impacts and adopt less hazardous chemicals among those available in the market.
Supplementary Materials
The following supporting information can be downloaded at: https://www.mdpi.com/article/10.3390/w15061079/s1. Table S1: Palmachim, Sorek, and Ashkelon desalination plants—sampling sites (coordinates, sampling dates, and salinity). Table S2: Hadera desalination plant and the sampling sites (coordinates, sampling dates, and salinity).
Author Contributions
Conceptualization, B.R. and A.R.; methodology, Y.G. (Yaara Grossmark), C.R., Y.G. (Yaron Gertner); statistics, E.R. and Y.G. (Yaara Grossmark); writing—original draft preparation, A.R.; writing—review and editing, A.R, Y.G. (Yaara Grossmark), B.R., E.R., Y.G. (Yaron Gertner); supervision, B.R.; funding acquisition, A.R. All authors have read and agreed to the published version of the manuscript.
Funding
This research was funded by the Israeli Ministry of Energy, contract no: 211-17-025.
Data Availability Statement
Not applicable.
Acknowledgments
We thank E. Mizrachi and A. R. Morov for providing seawater samples and G. Paz for figure preparation.
Conflicts of Interest
The authors declare no conflict of interest.
References
- Greenlee, L.F.; Lawler, D.F.; Freeman, B.D.; Marrot, B.; Moulin, P. Reverse osmosis desalination: Water sources, technology, and today’s challenges. Water Res. 2009, 43, 2317–2348. [Google Scholar] [CrossRef] [PubMed]
- Elimelech, M.; Phillip, W.A. The future of seawater desalination: Energy, technology, and the environment. Science 2011, 333, 712–717. [Google Scholar] [CrossRef]
- Jones, E.; Qadir, M.; van Vliet, M.T.H.; Smakhtin, V.; Kang, S.-M. The state of desalination and brine production: A global outlook. Sci. Total Environ. 2019, 657, 1343–1356. [Google Scholar] [CrossRef] [PubMed]
- Panagopoulos, A.; Haralambous, K.-J. Environmental impacts of desalination and brine treatment—Challenges and mitigation measures. Mar. Pollut. Bull. 2020, 161, 111773. [Google Scholar] [CrossRef]
- Kress, N. Marine Impacts of Seawater Desalination: Science, Management, and Policy, 1st ed.; Elsevier: Amsterdam, The Netherlands, 2019. [Google Scholar] [CrossRef]
- Dreizin, Y.; Tenne, A.; Hoffman, D. Integrating large scale seawater desalination plants within Israel’s water supply system. Desalination 2008, 220, 132–149. [Google Scholar] [CrossRef]
- Fritzmann, C.; Löwenberg, J.; Wintgens, T.; Melin, T. State-of-the-art of reverse osmosis desalination. Desalination 2007, 216, 1–76. [Google Scholar] [CrossRef]
- Israeli Ministry of Environmental Protection. Available online: https://www.gov.il/he/departments/policies/desalination_facilities_moep_policy (accessed on 28 February 2023).
- Qasim, M.; Badrelzaman, M.; Darwish, N.; Darwish, N.; Hilal, N. Reverse osmosis desalination: A state-of-the-art review. Desalination 2019, 459, 59–104. [Google Scholar] [CrossRef] [Green Version]
- Curto, D.; Franzitta, V.; Guercio, A. A Review of the Water Desalination Technologies. Appl. Sci. 2021, 11, 670. [Google Scholar] [CrossRef]
- Morillo, J.; Usero, J.; Rosado, D.; El Bakouri, H.; Riaza, A.; Bernaola, F.J. Comparative study of brine management technologies for desalination plants. Desalination 2014, 336, 32–49. [Google Scholar] [CrossRef]
- Henthorne, L.; Boysen, B. State-of-the-art of reverse osmosis desalination pretreatment. Desalination 2015, 356, 129–139. [Google Scholar] [CrossRef]
- Prihasto, N.; Liu, Q.-F.; Kim, S.-H. Pre-treatment strategies for seawater desalination by reverse osmosis system. Desalination 2009, 249, 308–316. [Google Scholar] [CrossRef]
- Valavala, R.; Sohn, J.; Han, J.; Her, N.; Yoon, Y. Pretreatment in Reverse Osmosis Seawater Desalination: A Short Review. Environ. Eng. Res. 2011, 16, 205–212. [Google Scholar] [CrossRef]
- Ghafour, E.E. Enhancing RO system performance utilizing antiscalants. Desalination 2002, 153, 149–153. [Google Scholar] [CrossRef]
- Ketsetzi, A.; Stathoulopoulou, A.; Demadis, K.D. Being “green” in chemical water treatment technologies: Issues, challenges and developments. Desalination 2008, 223, 487–493. [Google Scholar] [CrossRef]
- Lattemann, S.; Höpner, T. Environmental impact and impact assessment of seawater desalination. Desalination 2008, 220, 1–15. [Google Scholar] [CrossRef]
- Hoepner, T.; Lattemann, S. Chemical impacts from seawater desalination plants—A case study of the northern Red Sea. Desalination 2003, 152, 133–140. [Google Scholar] [CrossRef]
- Marine Coastal Pollution Report of the Israeli Ministry of Environmental Protection. Available online: https://www.gov.il/he/departments/publications/reports/pollutant_loads_sea_annual_reports (accessed on 28 February 2023).
- An Article Published by Tashtiot Magazine on 1st March 2015. Available online: https://www.tashtiot.co.il/2015/03/01/%D7%90%D7%99%D7%9B%D7%95%D7%AA-%D7%94%D7%A1%D7%91%D7%99%D7%91%D7%94-175/ (accessed on 28 February 2023).
- Missimer, T.M.; Maliva, R.G. Environmental issues in seawater reverse osmosis desalination: Intakes and outfalls. Desalination 2018, 434, 198–215. [Google Scholar] [CrossRef]
- Benaissa, M.; Rouane-Hacene, O.; Boutiba, Z.; Habib, D.; Guibbolini-Sabatier, M.E.; Risso-De Faverney, C. Ecotoxicological effects assessment of brine discharge from desalination reverse osmosis plant in Algeria (South Western Mediterranean). Reg. Stud. Mar. Sci. 2020, 39, 101407. [Google Scholar] [CrossRef]
- Capó, X.; Tejada, S.; Ferriol, P.; Pinya, S.; Mateu-Vicens, G.; Montero-González, I.; Box, A.; Sureda, A. Hypersaline water from desalinization plants causes oxidative damage in Posidonia oceanica meadows. Sci. Total Environ. 2020, 736, 139601. [Google Scholar] [CrossRef]
- de-la-Ossa-Carretero, J.A.; Del-Pilar-Ruso, Y.; Loya-Fernández, A.; Ferrero-Vicente, L.M.; Marco-Méndez, C.; Martinez-Garcia, E.; Sánchez-Lizaso, J.L. Response of amphipod assemblages to desalination brine discharge: Impact and recovery. Estuar. Coast. Shelf Sci. 2016, 172, 13–23. [Google Scholar] [CrossRef] [Green Version]
- Mitchelmore, C.L.; Chipman, J.K. DNA strand breakage in aquatic organisms and the potential value of the comet assay in environmental monitoring. Mutat Res. 1998, 399, 135–147. [Google Scholar] [CrossRef]
- Lee, R.; Kim, G.B.; Maruya, K.A.; Steinert, S.A.; Oshima, Y. DNA strand breaks (comet assay) and embryo development effects in grass shrimp (Palaemonetes pugio) embryos after exposure to genotoxicants. Mar. Environ. Res. 2000, 50, 553–557. [Google Scholar] [CrossRef]
- Kim, D.; Amy, G.L.; Karanfil, T. Disinfection by-product formation during seawater desalination: A review. Water Res. 2015, 81, 343–355. [Google Scholar] [CrossRef] [PubMed] [Green Version]
- Chowdhury, S. Disinfection by-products in desalinated and blend water: Formation and control strategy. J. Water Health 2019, 17, 1–24. [Google Scholar] [CrossRef]
- Benaissa, M.; Rouane-Hacene, O.; Boutiba, Z.; Guibbolini-Sabatier, M.E.; Risso-De Faverney, C. Ecotoxicological impact assessment of the brine discharges from a desalination plant in the marine waters of the Algerian west coast, using a multi-biomarker approach in a limpet, Patella rustica. Environ. Sci. Pollut. Res. 2017, 24, 24521–24532. [Google Scholar] [CrossRef] [PubMed]
- Cardoso, R.; Dusinska, M.; Collins, A.; Manjanatha, M.; Pfuhler, S.; Registre, M.; Elespuru, R. In vivo Mammalian Alkaline Comet Assay Method Adapted for Genotoxicity Assessment of Nanomaterials. Front. Toxicol. 2022, 4, 903896. [Google Scholar] [CrossRef] [PubMed]
- Bianchi, E.; Lessing, G.; Brina, K.R.; Angeli, L.; Andriguetti, N.B.; Peruzzo, J.R.; do Nascimento, C.A.; Spilki, F.R.; Ziulkoski, A.L.; da Silva, L.B. Monitoring the Genotoxic and Cytotoxic Potential and the Presence of Pesticides and Hydrocarbons in Water of the Sinos River Basin, Southern Brazil. Arch. Environ. Contam Toxicol. 2017, 72, 321–334. [Google Scholar] [CrossRef]
- Naguib, M.; Mekkawy, I.A.; Mahmoud, U.M.; Sayed, A.E.-D.H. Genotoxic evaluation of silver nanoparticles in catfish Clarias gariepinus erythrocytes; DNA strand breakage using comet assay. Sci. Afr. 2022, 16, e01260. [Google Scholar] [CrossRef]
- Martínez-Paz, P.; Morales, M.; Martínez-Guitarte, J.L.; Morcillo, G. Genotoxic effects of environmental endocrine disruptors on the aquatic insect Chironomus riparius evaluated using the comet assay. Mutat. Res./Genet. Toxicol. Environ. Mutagen. 2013, 758, 41–47. [Google Scholar] [CrossRef]
- Turan, F.; Karan, S.; Ergenler, A. Effect of heavy metals on toxicogenetic damage of European eels Anguilla anguilla. Environ. Sci. Pollut. Res. 2020, 27, 38047–38055. [Google Scholar] [CrossRef]
- VID—Desalination Company Ltd. A Permit for the Discharge of Brine. Available online: https://www.gov.il/Files/Sviva/PermitFlowingToSea/doclib3/2018/07-2018.pdf (accessed on 28 February 2023).
- Fryer, J.L.; McCain, B.B.; Leong, J.C. A Cell Line Derived from Rainbow Trout (Salmo gairdneri) Hepatoma. Fish Pathol. 1981, 15, 193–200. [Google Scholar] [CrossRef]
- Kamer, I.; Rinkevich, B. In vitro application of the comet assay for aquatic genotoxicity: Considering a primary culture versus a cell line. Toxicol. Vitr. 2002, 16, 177–184. [Google Scholar] [CrossRef]
- Kamer, I.; Douek, J.; Tom, M.; Rinkevich, B. Metallothionein induction in RTH-149 cell line as an indicator for heavy metal pollution in a brackish environment: Assessment by RT-competitive PCR. Environ. Toxicol. Chem. 2003, 45, 86–91. [Google Scholar] [CrossRef]
- Rabinowitz, C.; Rinkevich, B. Epithelial cell cultures from Botryllus schlosseri palleal buds: Accomplishments and challenges. Methods Cell Sci. 2003, 25, 137–148. [Google Scholar] [CrossRef] [PubMed]
- Repetto, G.; del Peso, A.; Zurita, J.L. Neutral red uptake assay for the estimation of cell viability/cytotoxicity. Nat. Protoc. 2008, 3, 1125–1131. [Google Scholar] [CrossRef]
- Avishai, N.; Rabinowitz, C.; Moiseeva, E.; Rinkevich, B. Genotoxicity of the Kishon River, Israel: The application of an in vitro cellular assay. Mutat. Res. 2002, 518, 21–37. [Google Scholar] [CrossRef] [PubMed]
- Avishai, N.; Rabinowitz, C.; Rinkevich, B. The use of the comet assay for studying environmental genotoxicity: Comparisons between visual and image analyses. Environ. Mol. Mutagen. 2003, 42, 155–165. [Google Scholar] [CrossRef]
- Avishai, N.; Rabinowitz, C.; Rinkevich, B. A two and half year genotoxicity profile for a partly restored polluted river. Environ. Sci. Technol. 2004, 38, 3482–3487. [Google Scholar] [CrossRef]
- Rinkevich, B.; Avishai, N.; Rabinowitz, C. UV incites diverse levels of DNA breaks in different cellular compartments of a branching coral species. J. Exp. Biol. 2005, 208, 843–848. [Google Scholar]
- Uziel, O.; Beery, E.; Dronichev, V.; Samocha, K.; Gryaznov, S.; Weiss, L.; Slavin, S.; Kushnir, M.; Nordenberg, Y.; Rabinowitz, C.; et al. Telomere shortening sensitizes cancer cells to selected cytotoxic agents: In vitro and in vivo studies and putative mechanisms. PLoS ONE 2010, 5, e9132. [Google Scholar] [CrossRef]
- Narum, S.R. Beyond Bonferroni: Less conservative analyses for conservation genetics. Conserv. Genet. 2006, 7, 783–787. [Google Scholar] [CrossRef]
- Klein, S.; Frazier, V.; Readdean, T.; Lucas, E.; Diaz-Jimenez, E.P.; Sogin, M.; Ruff, E.S.; Echeverri, K. Common Environmental Pollutants Negatively Affect Development and Regeneration in the Sea Anemone Nematostella vectensis Holobiont. Front. Ecol. Evol. 2021, 9, 786037. [Google Scholar] [CrossRef]
- Kültz, D.; Chakravarty, D. Hyperosmolality in the form of elevated NaCl but not urea causes DNA damage in murine kidney cells. Proc. Natl. Acad. Sci. USA 2001, 98, 1999–2004. [Google Scholar] [CrossRef] [PubMed] [Green Version]
- Lykkebo Petersen, K.; Paytan, A.; Rahav, E.; Levy, O.; Silverman, J.; Barzel, O.; Potts, D.; Bar-Zeev, E. Impact of brine and antiscalants on reef-building corals in the Gulf of Aqaba—Potential effects from desalination plants. Water Res. 2018, 144, 183–191. [Google Scholar] [CrossRef] [PubMed]
- Marques, J.A.; Gafni, A.; Adler, O.; Levy, O.; Edo Bar-Zeev, E. Antiscalants used in the desalination industry impact the physiology of the coral Montipora capricornis. Water Res. 2022, in press. [Google Scholar] [CrossRef]
- Vaal, M.; van der Wal, J.T.; Hoekstra, J.; Hermens, J. Variation in the sensitivity of aquatic species in relation to the classification of environmental pollutants. Chemosphere 1997, 35, 1311–1327. [Google Scholar] [CrossRef] [PubMed]
- Spurgeon, D.; Lahive, E.; Robinson, A.; Short, S.; Kille, P. Species Sensitivity to Toxic Substances: Evolution, Ecology and Applications. Front. Environ. Sci. 2020, 8, 588380. [Google Scholar] [CrossRef]
- Svanfeldt, K.; Lundqvist, L.; Rabinowitz, C.; Sköld, H.N.; Rinkevich, B. Repair of UV-induced DNA damage in shallow water colonial marine species. J. Exp. Mar. Biol. Ecol. 2014, 452, 40–46. [Google Scholar] [CrossRef]
- Dmitrieva, N.I.; Ferraris, D.J.; Norenburg, J.L.; Burg, M.B. The Saltiness of the Sea Breaks DNA in Marine Invertebrates: Possible Implications for Animal Evolution. Cell Cycle 2006, 5, 1320–1323. [Google Scholar] [CrossRef] [Green Version]
- Belkin, N.; Rahav, E.; Elifantz, H.; Kress, N.; Berman-Frank, I. Enhanced salinities, as a proxy of seawater desalination discharges, impact coastal microbial communities of the eastern Mediterranean Sea. Environ. Microbiol. 2015, 17, 4105–4120. [Google Scholar] [CrossRef]
Figure 1.
Sampling sites along the Mediterranean Israeli shores. (a) A schematic outline of the Israeli Mediterranean shore, indicating the locations of the Ashkelon, Hadera, Palmachim, and Sorek desalination plants. B, C, and D regions (in boxes) are zoomed-in panels (b–d), respectively. (b) Sampling sites near the Hadera desalination plant. (c) Sampling sites near the Sorek and Palmachim desalination plants. (d) Sampling sites near the Ashkelon desalination plant. ◯ = a major city; ▲ = desalination plant; ● = sampling site; ● = desalination plant outflow. Distance bars are inserted in each panel. At Hadera and Ashkelon, the outflows are near the seashore line.

Figure 2.
(a) N. vectensis normal morphology. (b) N. vectensis phenotype following exposure to 37 ppm of Progal 350 PK for 10 days. The arrowheads point to egg bundles. (c) N. vectensis phenotype following exposure to 20 ppm of Aquarex 1214 for 23 days. (d) N. vectensis LD50 set for Progal 350 PK exposure. (e) N. vectensis LD50 set for Aquarex 1214 exposure. (f) Genotoxicity inflicted by Progal 350 PK on RTH-149 cells. Significant differences: *—significant result relative to control medium (ANOVA; p < 0.001). (g) Genotoxicity inflicted by Aquarex 1214 on RTH-149 cells. Significant differences: *—significant result relative to control medium (ANOVA; p = 0.002). Error bars represent standard deviation.

Figure 3.
(a–c) Images of unknown-origin spill observed near the Ashkelon desalination plant on 17.8.2014. (d) Genotoxicity tested by comet assay at sites within the spill area and the remote H26 and H27 sites. A total of 300 nuclei were analyzed per site/treatment. Significant differences: *—significant result relative to ASW control; **—H26 vs. other field samples; ***—field samples vs. H26 and H27.

Figure 4.
Genotoxicity tested on samples taken near the Palmachim infrastructure. A total of 300 nuclei were analyzed per site/treatment. Significant differences: *—significant difference between field samples and modified control (ASW-PL1) relative to ASW control; **—significant difference between PL1 site vs. its salinity-matched control (ASW-PL1) and the other field sample.

Figure 5.
Genotoxicity tested on samples taken near the Sorek–Palmachim desalination plants’ outflows. A total of 300 nuclei were analyzed per site/treatment. Significant differences: *—significant result relative to modified-ASW control (p < 0.017; following B-Y correction for multiple testing).
Figure 5.
Genotoxicity tested on samples taken near the Sorek–Palmachim desalination plants’ outflows. A total of 300 nuclei were analyzed per site/treatment. Significant differences: *—significant result relative to modified-ASW control (p < 0.017; following B-Y correction for multiple testing).

Figure 6.
Genotoxicity tested on samples taken near the Hadera desalination plant outflow. The p-value is indicated for each set of experiments. (a–f) Genotoxicity levels for each indicated month. A Chi-square test was performed, comparing the number of nuclei with more than 25% tail DNA between the various sites and controls. In total, 300 nuclei were analyzed per site/treatment. Significant differences: *—significant result relative to ASW control; **—field sample vs. other field samples. (g) The average genotoxicity at the various sites along the tested period. The error bars represent the standard deviation. A repeated measures ANOVA analysis was used to test for significant differences between sites, but no significant differences were detected (p > 0.05).

Disclaimer/Publisher’s Note: The statements, opinions and data contained in all publications are solely those of the individual author(s) and contributor(s) and not of MDPI and/or the editor(s). MDPI and/or the editor(s) disclaim responsibility for any injury to people or property resulting from any ideas, methods, instructions or products referred to in the content. |
© 2023 by the authors. Licensee MDPI, Basel, Switzerland. This article is an open access article distributed under the terms and conditions of the Creative Commons Attribution (CC BY) license (https://creativecommons.org/licenses/by/4.0/).
Share and Cite
MDPI and ACS Style
Rosner, A.; Grossmark, Y.; Gertner, Y.; Rabinowitz, C.; Reem, E.; Rinkevich, B. Genotoxicity Signatures near Brine Outflows from Desalination Plants in the Levant. Water 2023, 15, 1079. https://doi.org/10.3390/w15061079
AMA Style
Rosner A, Grossmark Y, Gertner Y, Rabinowitz C, Reem E, Rinkevich B. Genotoxicity Signatures near Brine Outflows from Desalination Plants in the Levant. Water. 2023; 15(6):1079. https://doi.org/10.3390/w15061079
Chicago/Turabian StyleRosner, Amalia, Yaara Grossmark, Yaron Gertner, Claudette Rabinowitz, Eitan Reem, and Baruch Rinkevich. 2023. "Genotoxicity Signatures near Brine Outflows from Desalination Plants in the Levant" Water 15, no. 6: 1079. https://doi.org/10.3390/w15061079
Note that from the first issue of 2016, this journal uses article numbers instead of page numbers. See further details here.