
Assessing the Hydrochemistry, Groundwater Drinking Quality, and Possible Hazard to Human Health in Shizuishan Area, Northwest China
 , ,
, ,
Abstract
:1. Introduction
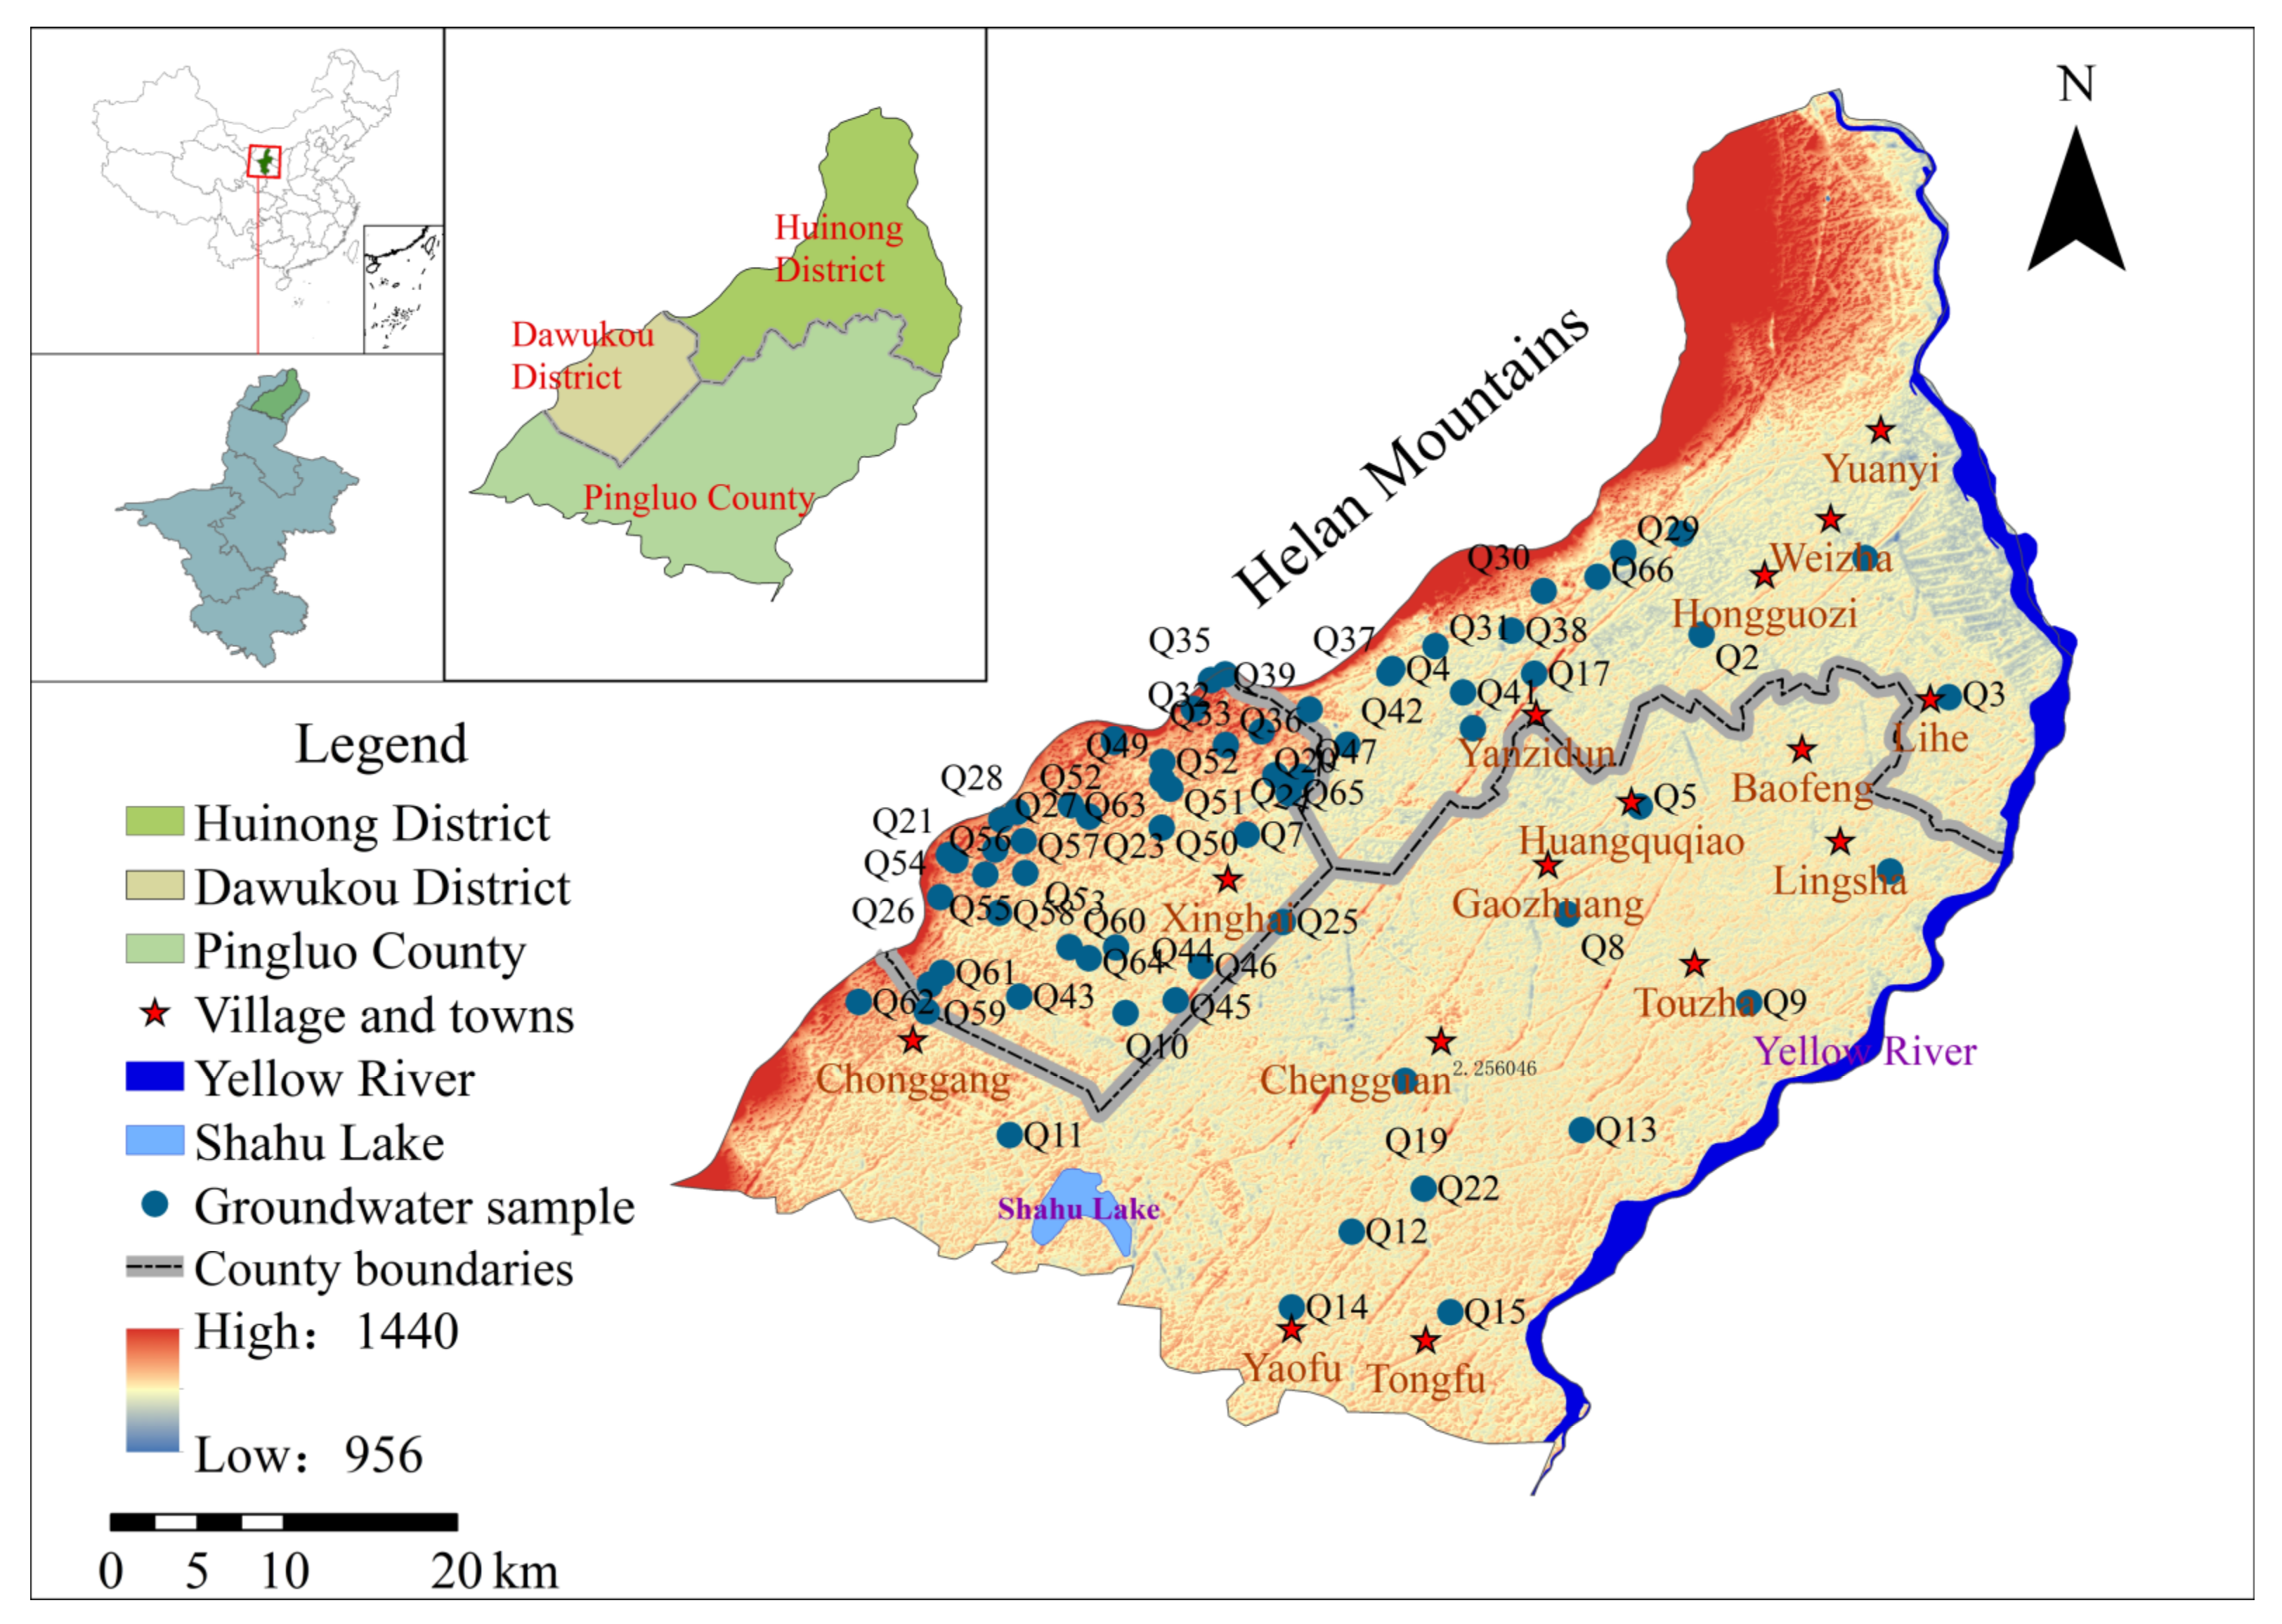
2. Study Area
3. Materials and Methods
3.1. Collection and Analyses of Samples
3.2. Groundwater Quality Assessment
3.3. Assessment of Hazards to Human Health
4. Results and Discussion
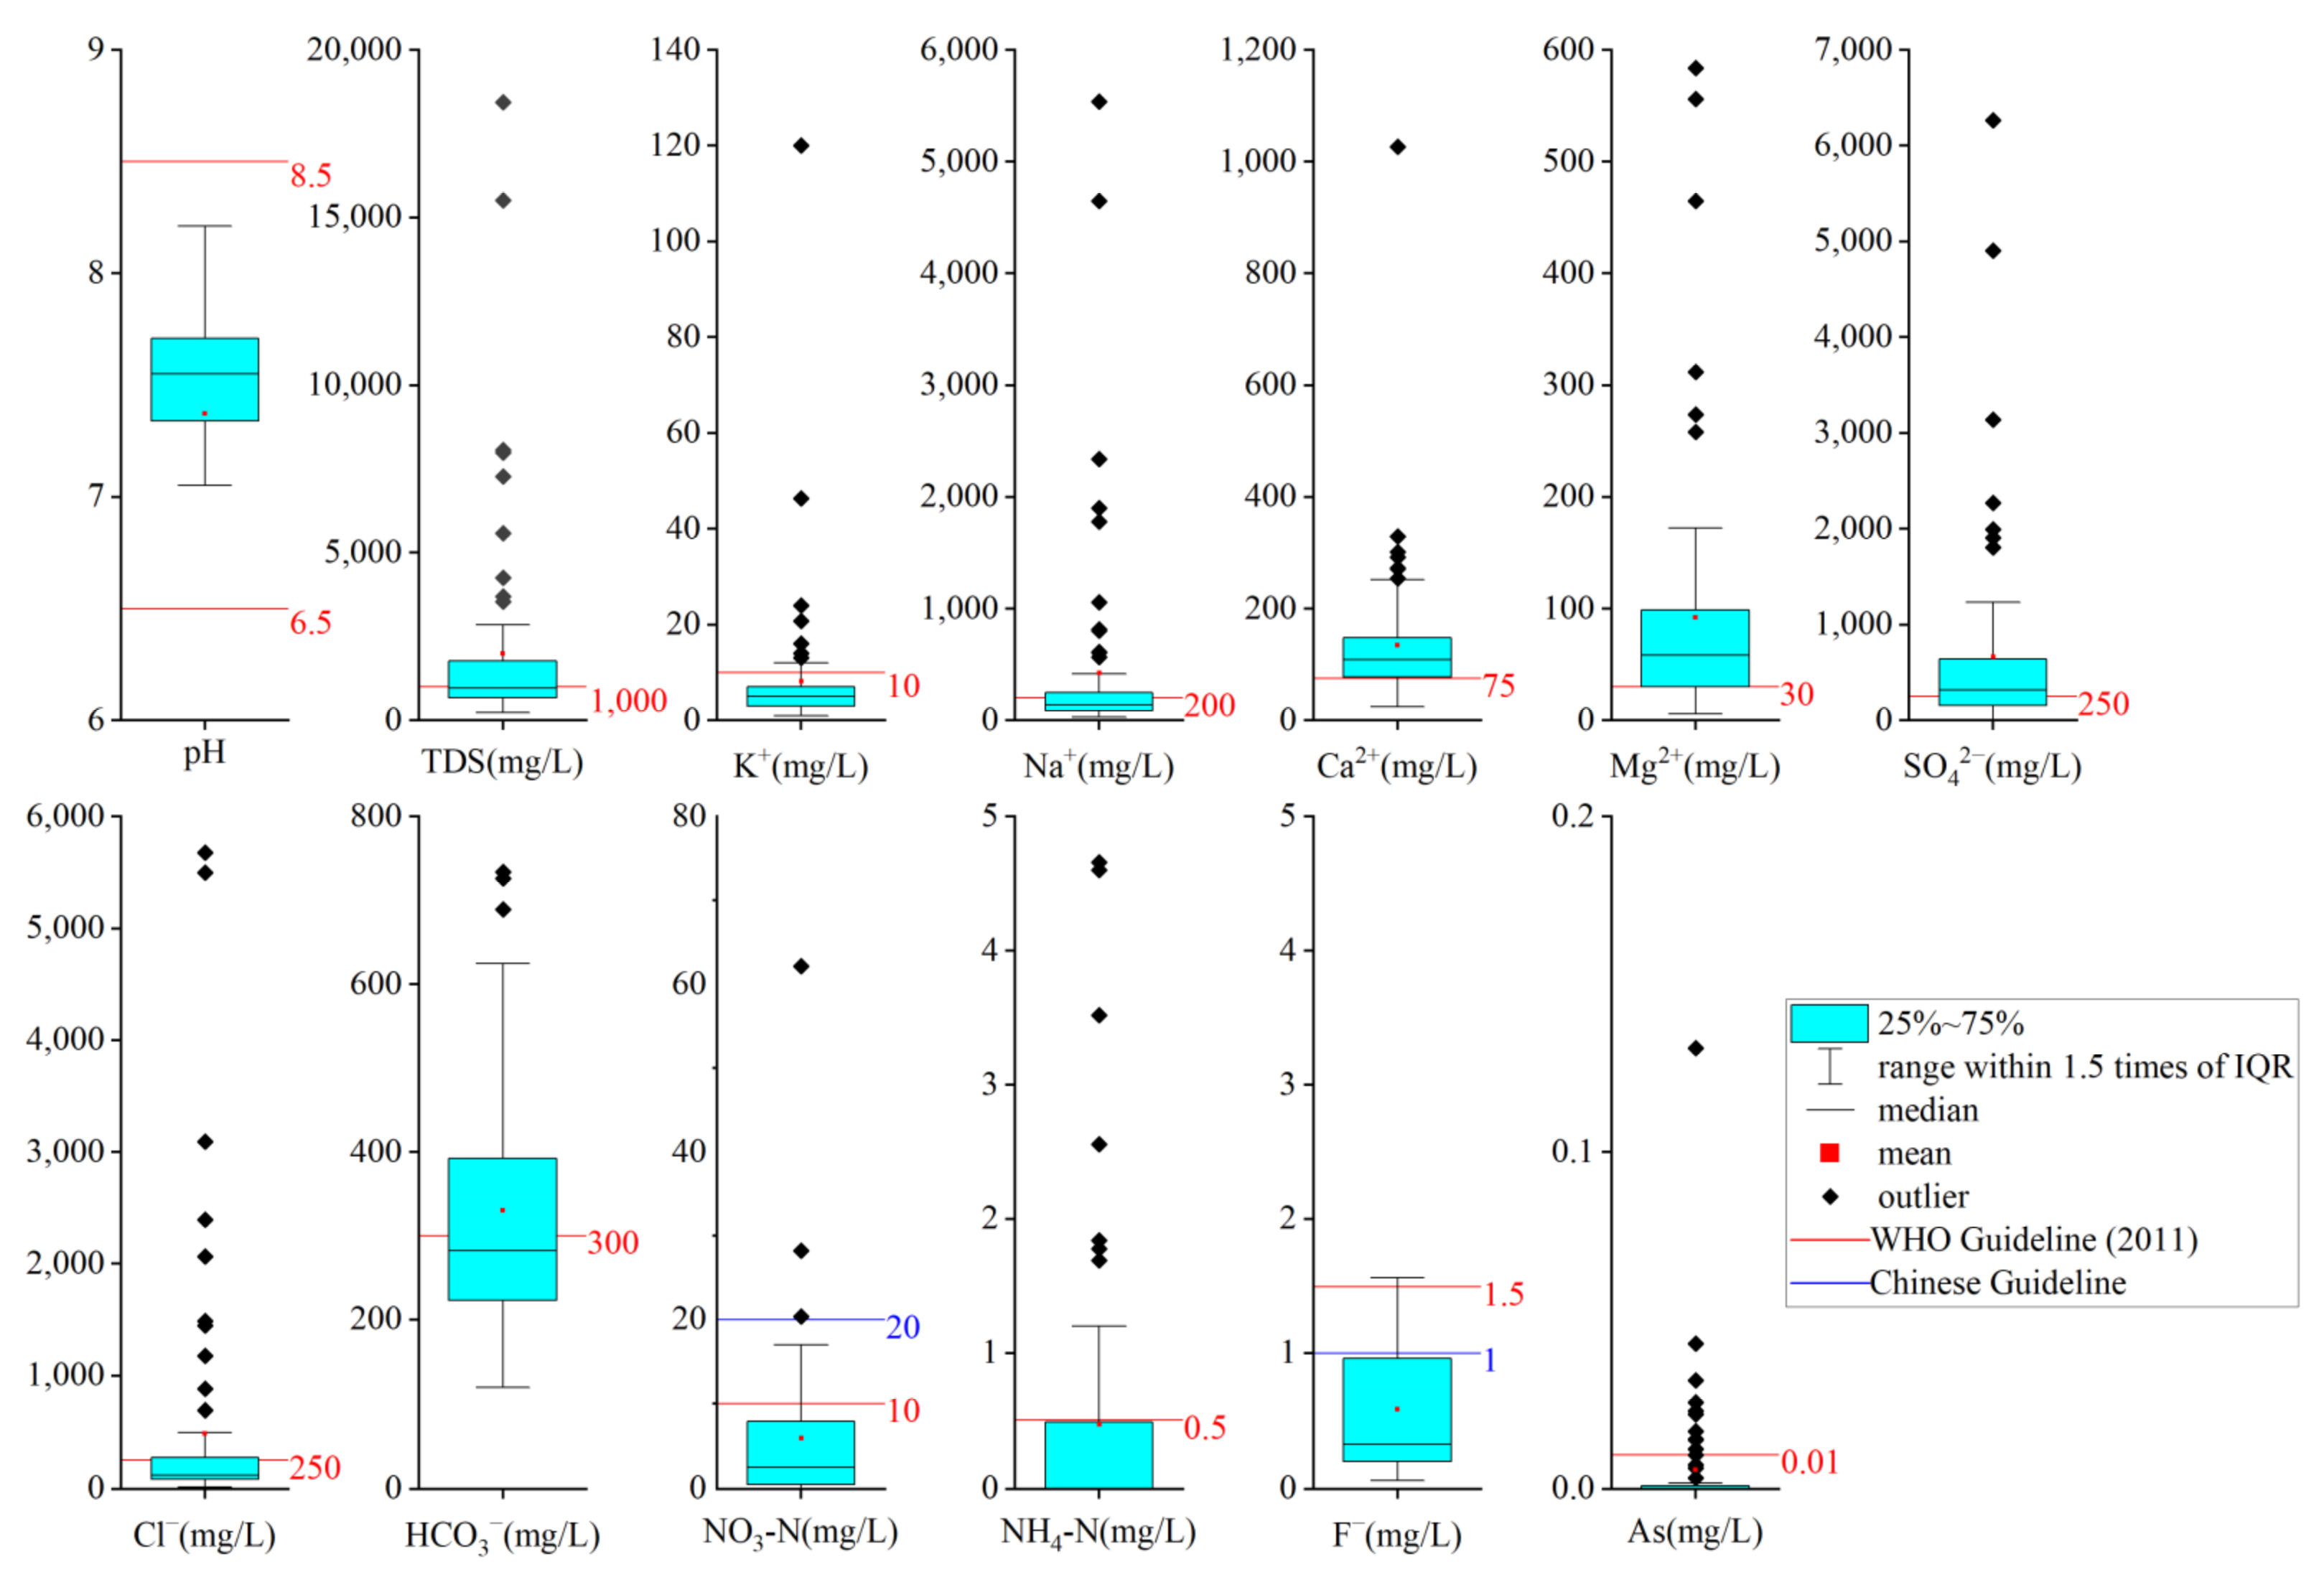
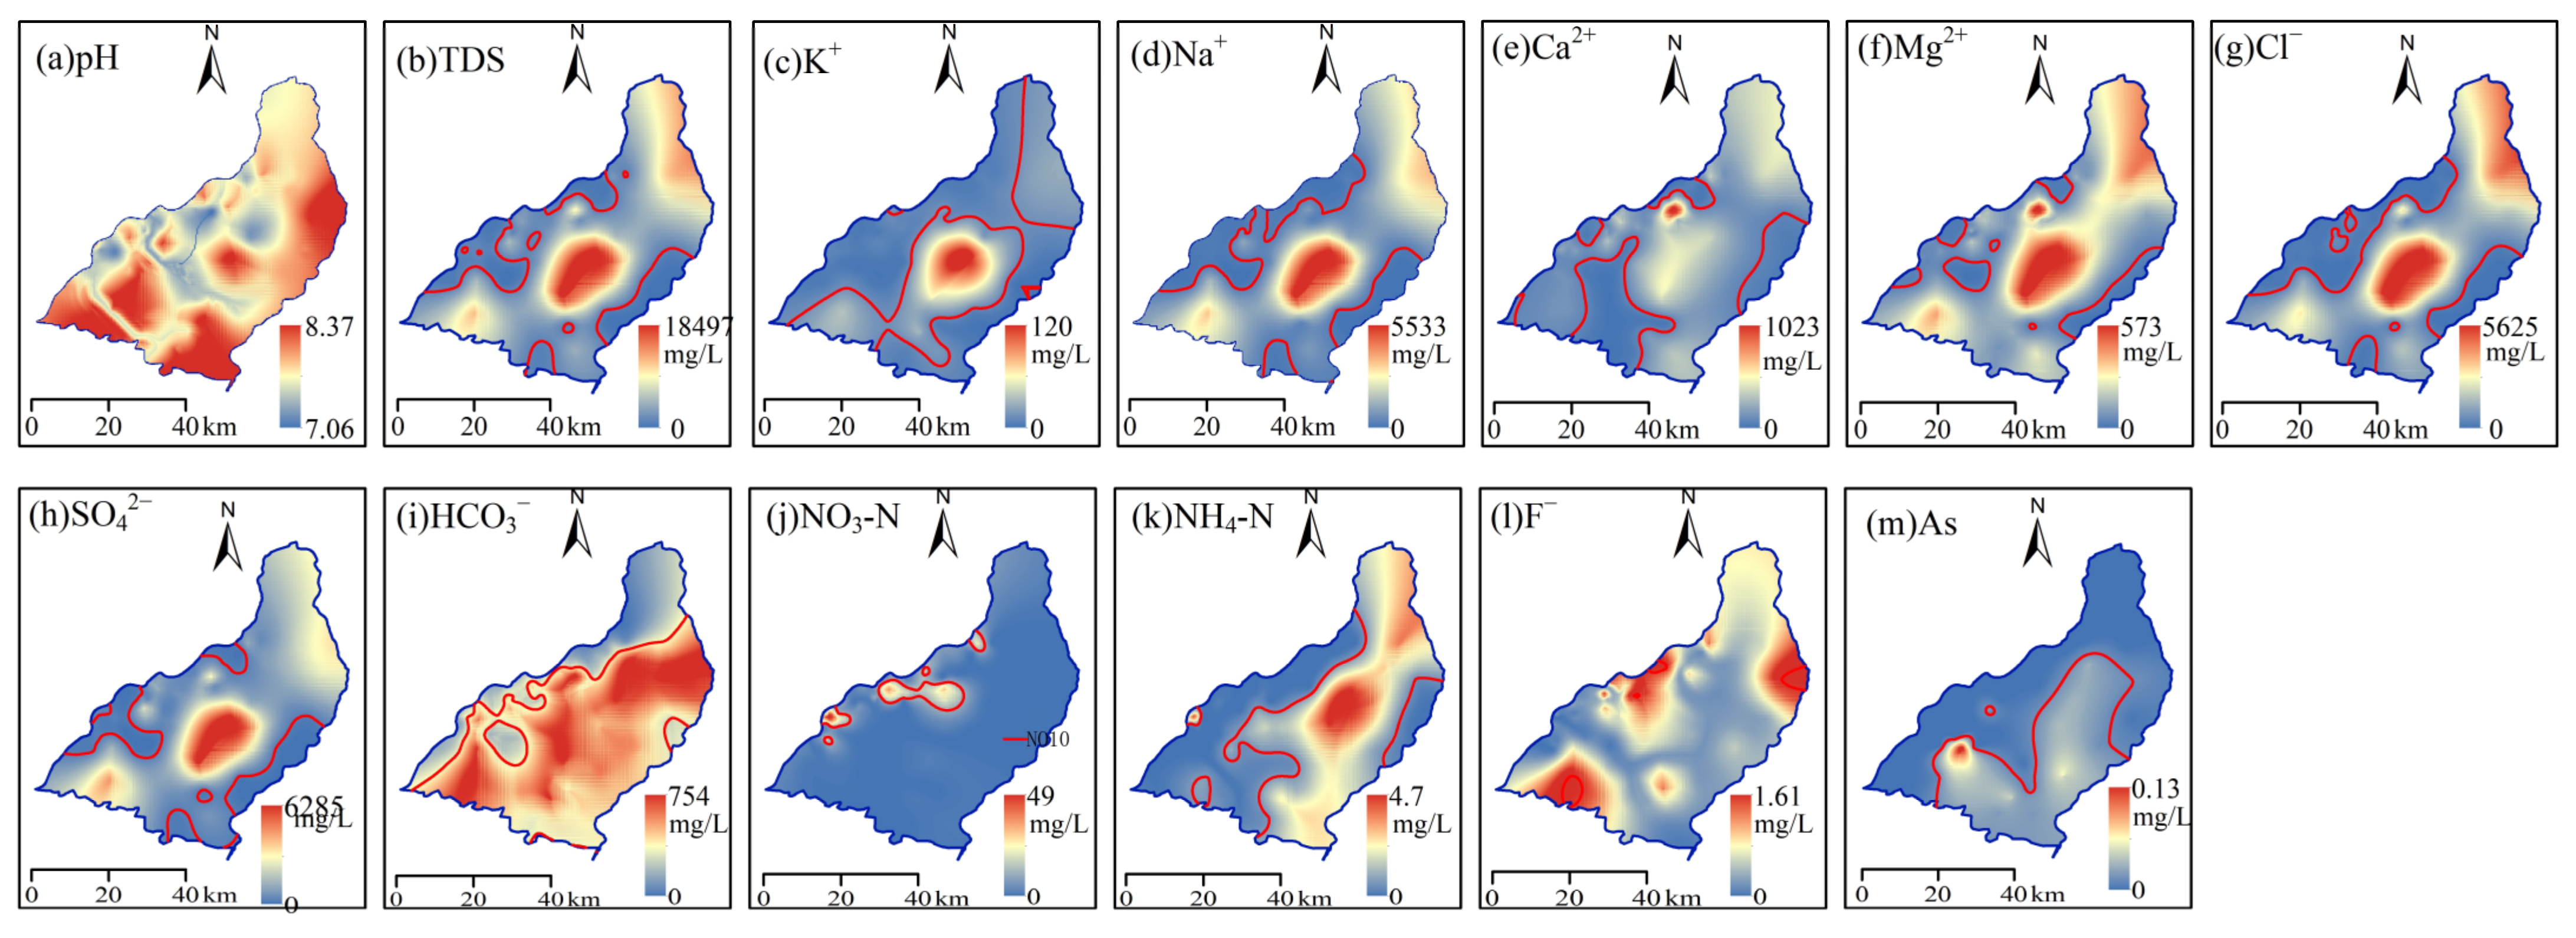
4.1. Groundwater Chemistry
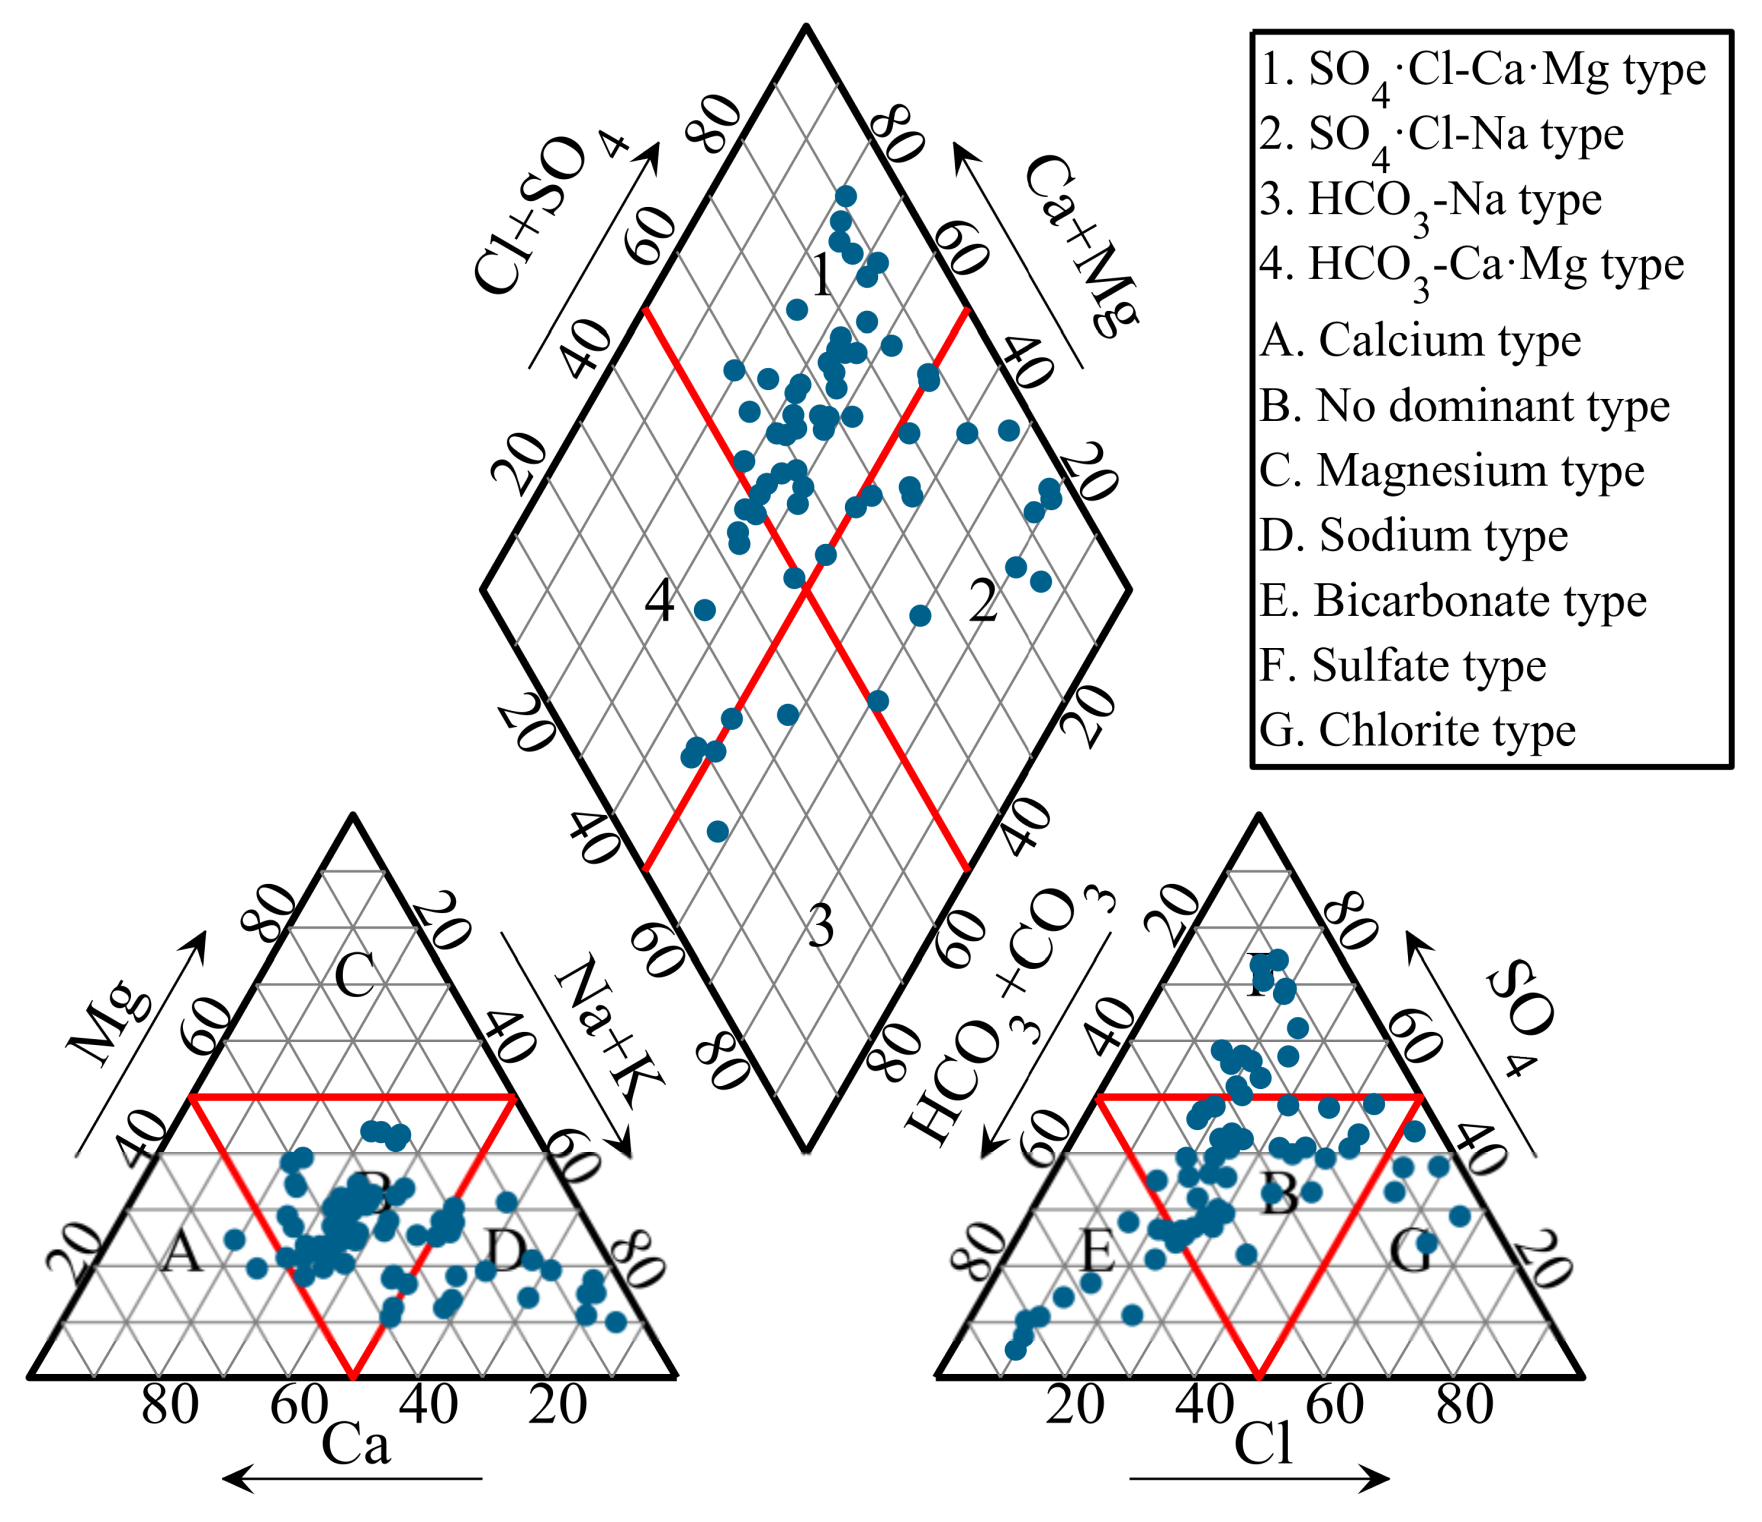
4.2. Hydrogeochemical Facies
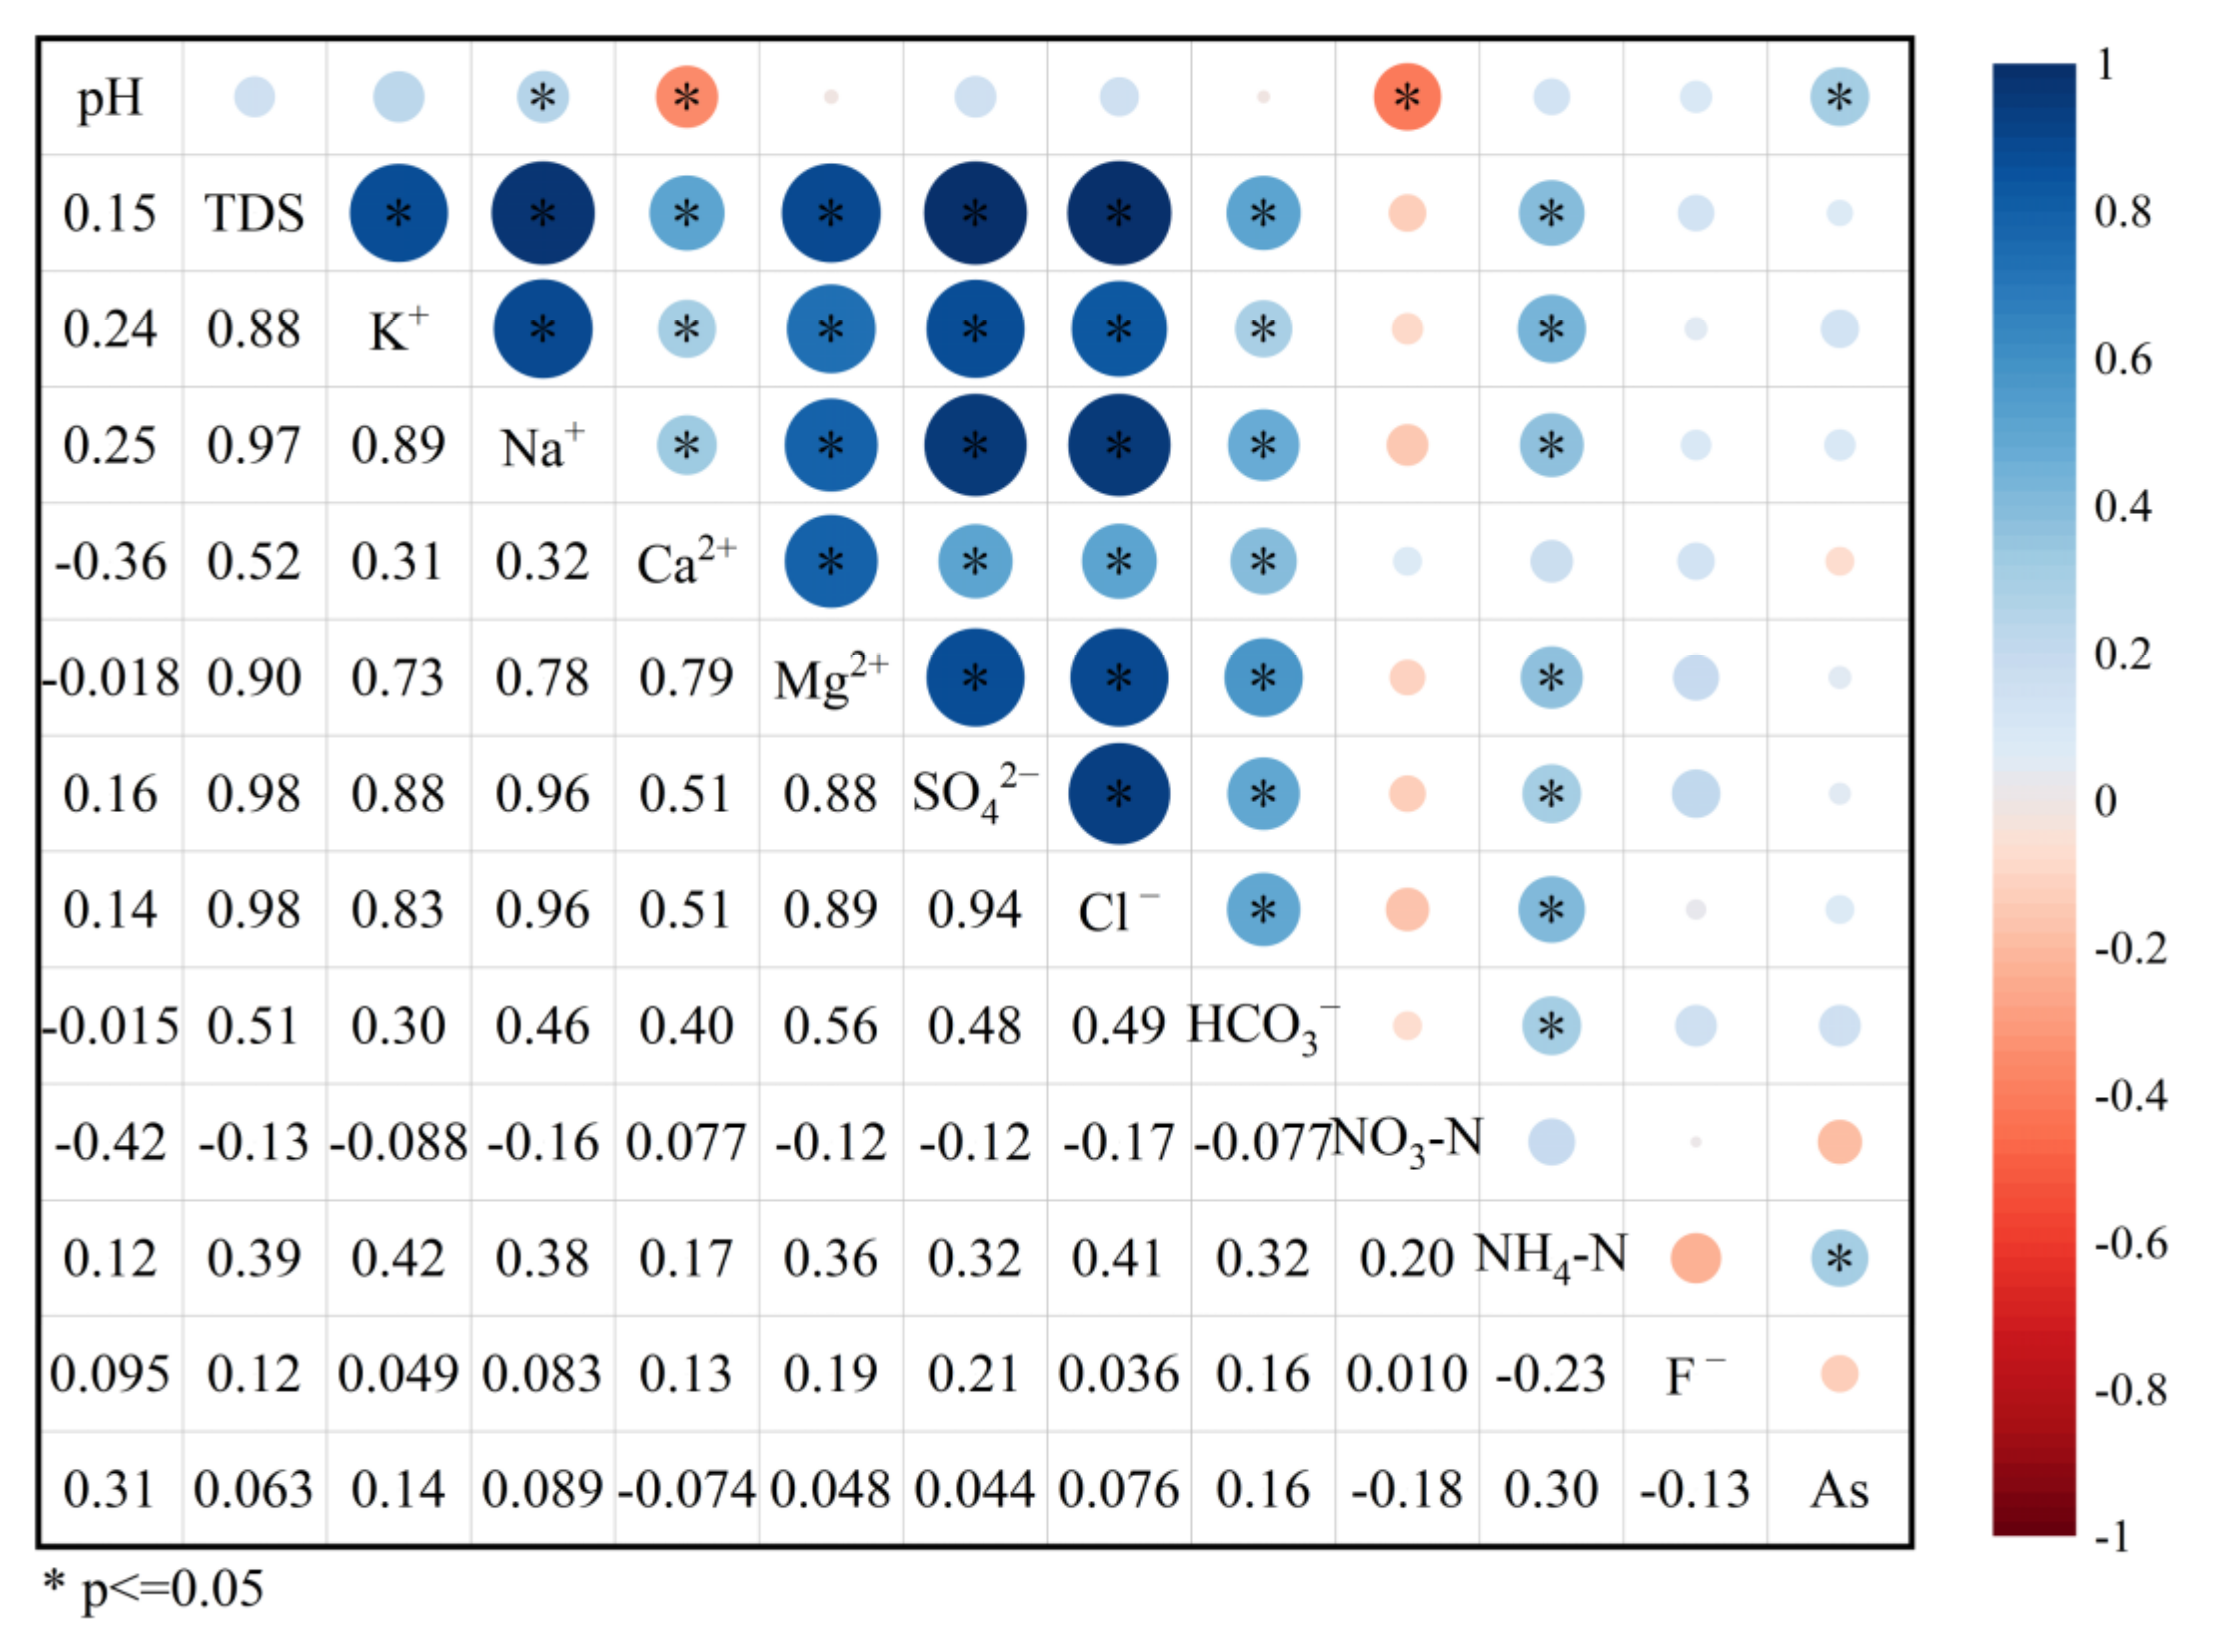
4.3. Processes Regulating Groundwater Hydrochemistry
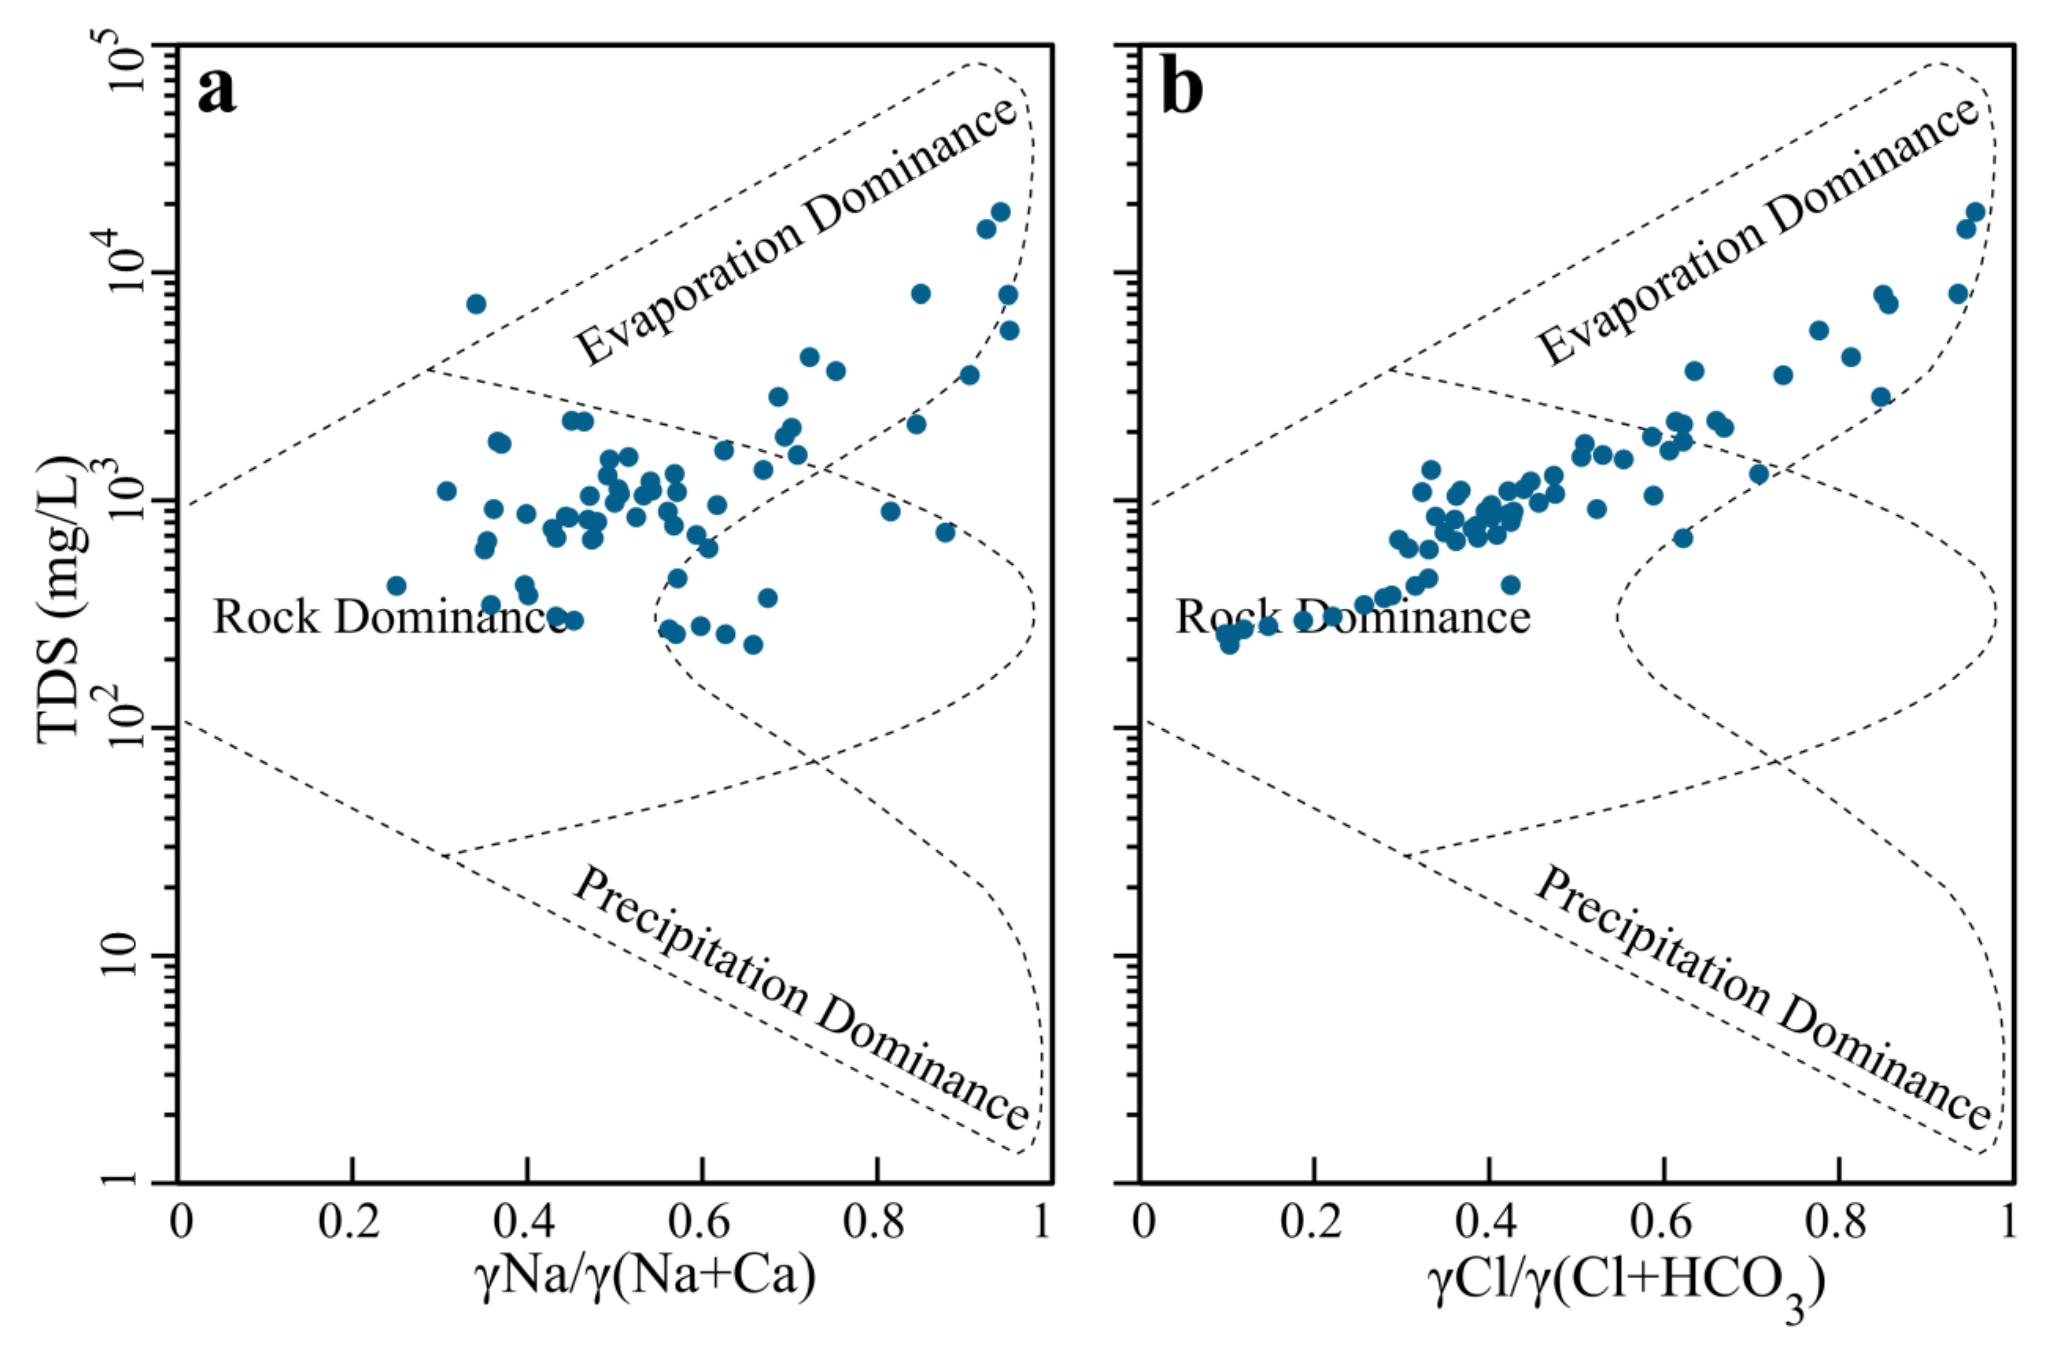
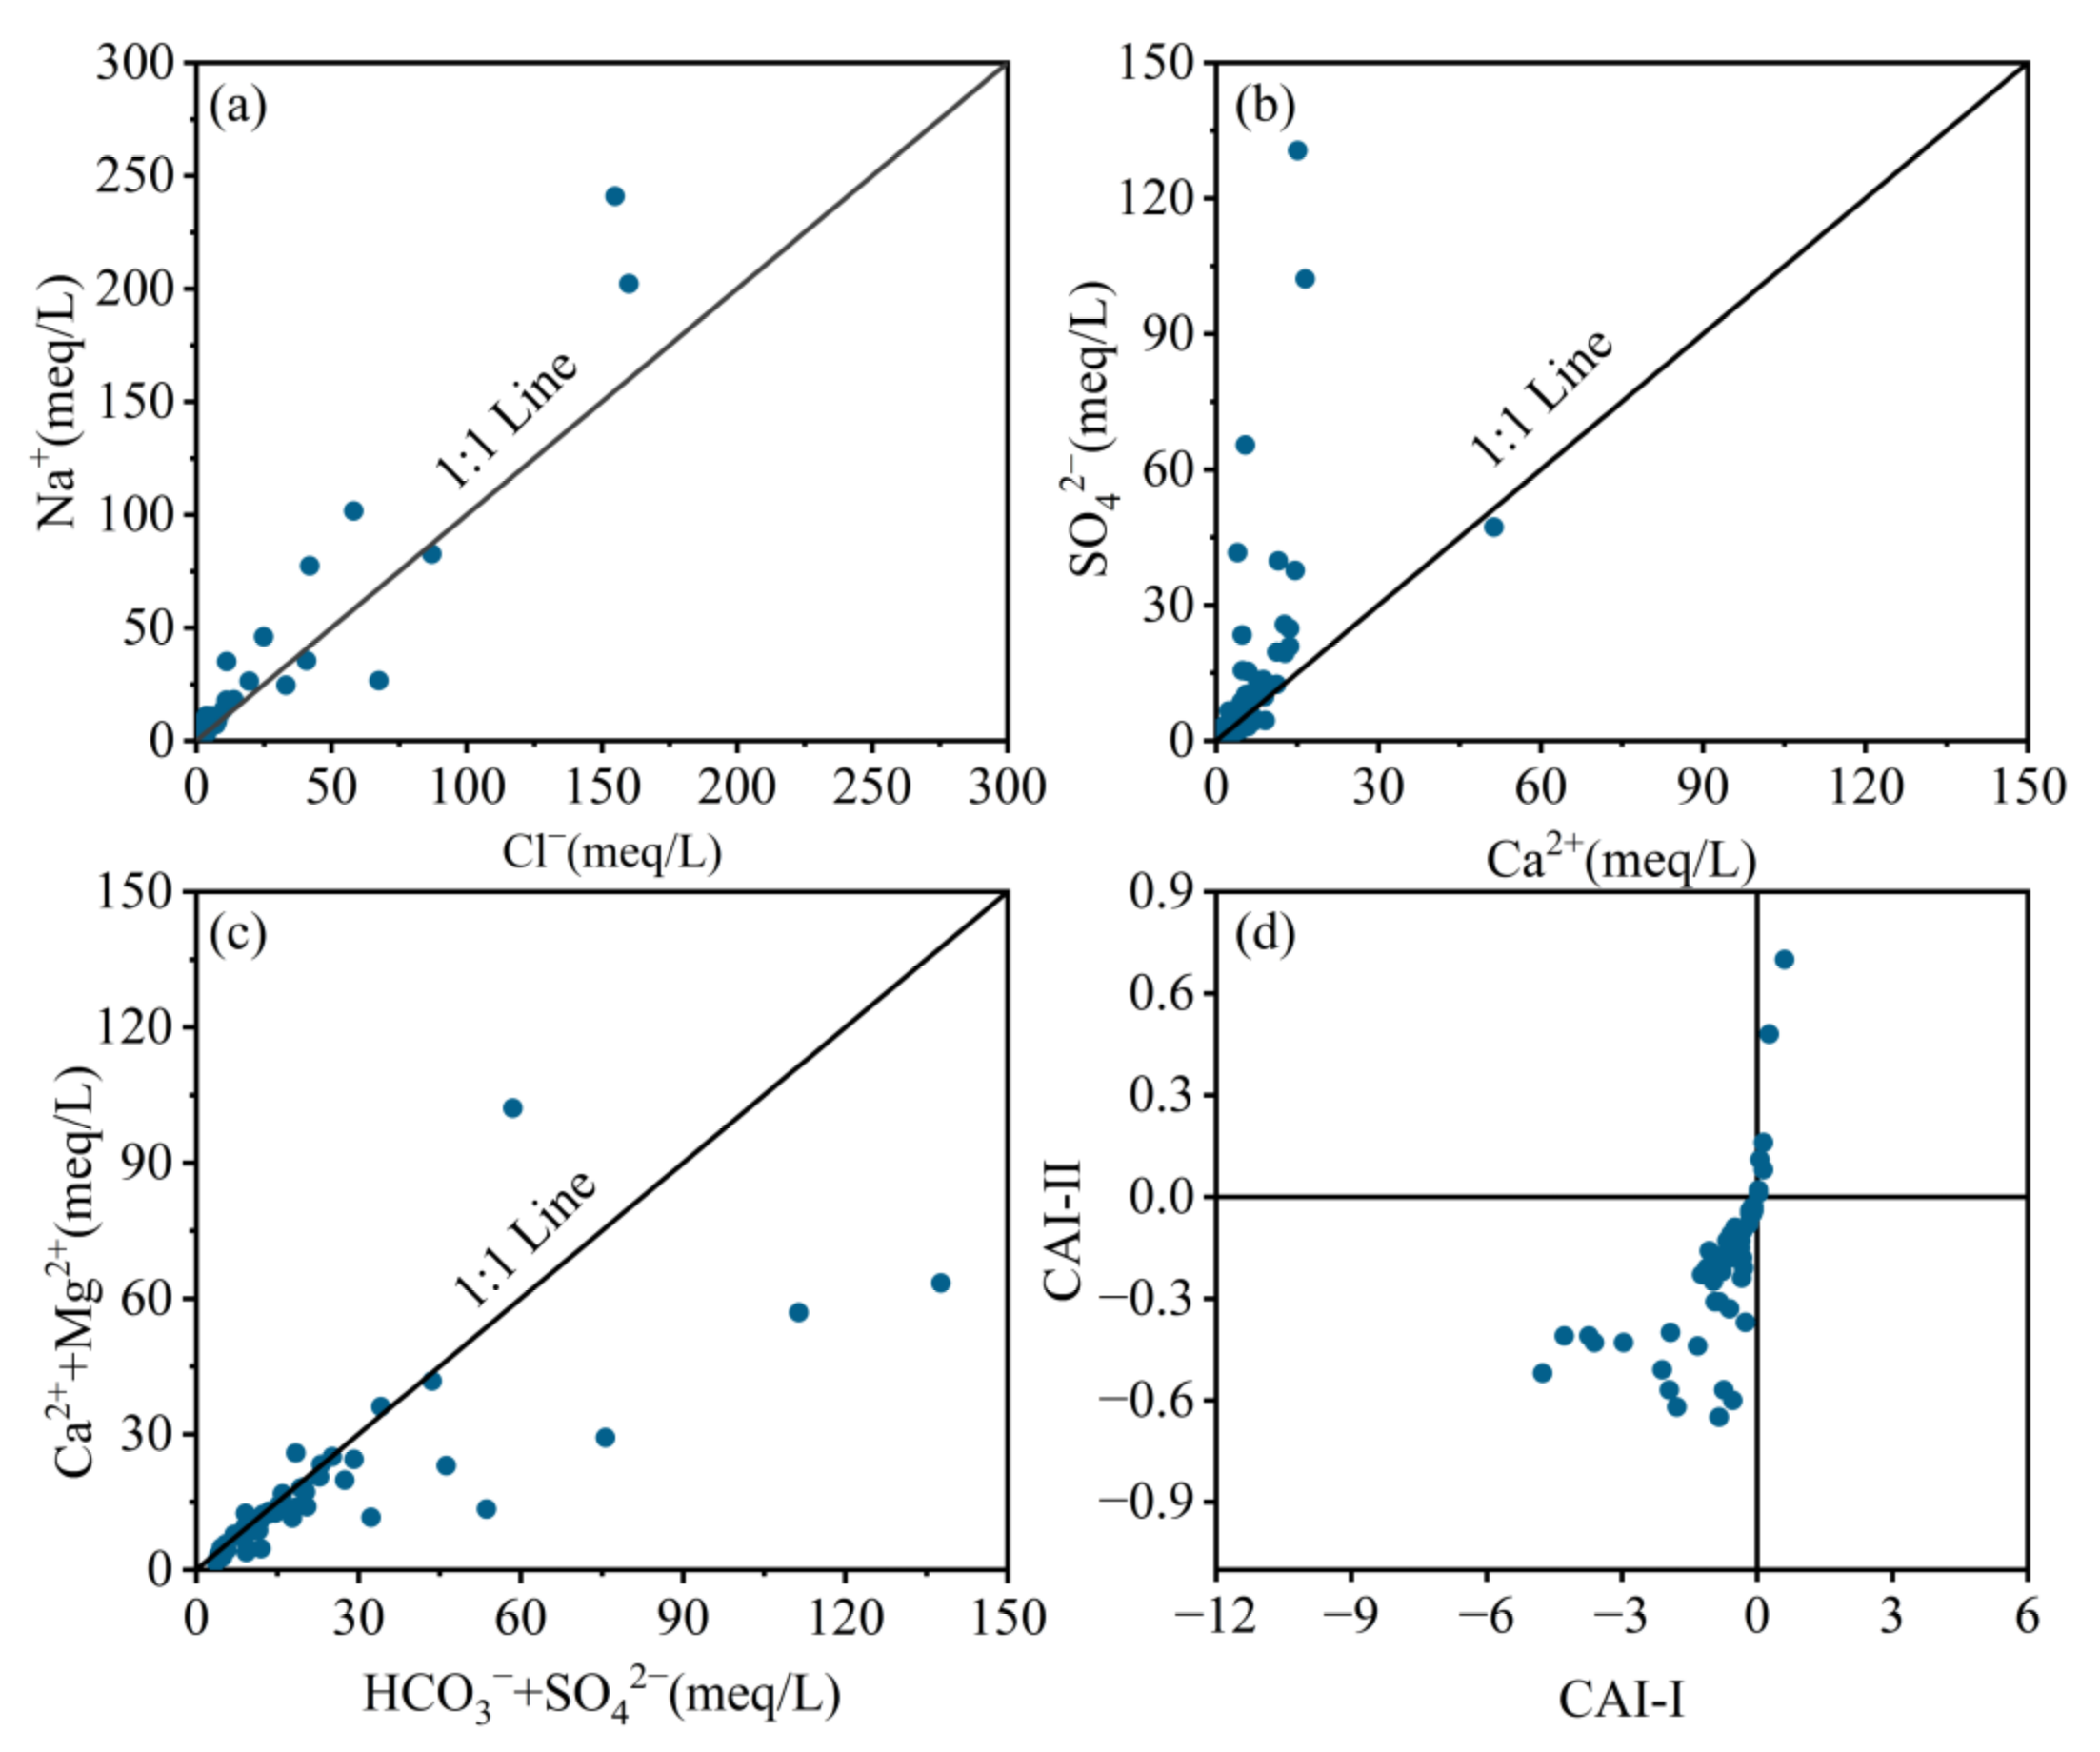
4.3.1. Water-Rock Interaction
4.3.2. Anthropogenic Activities
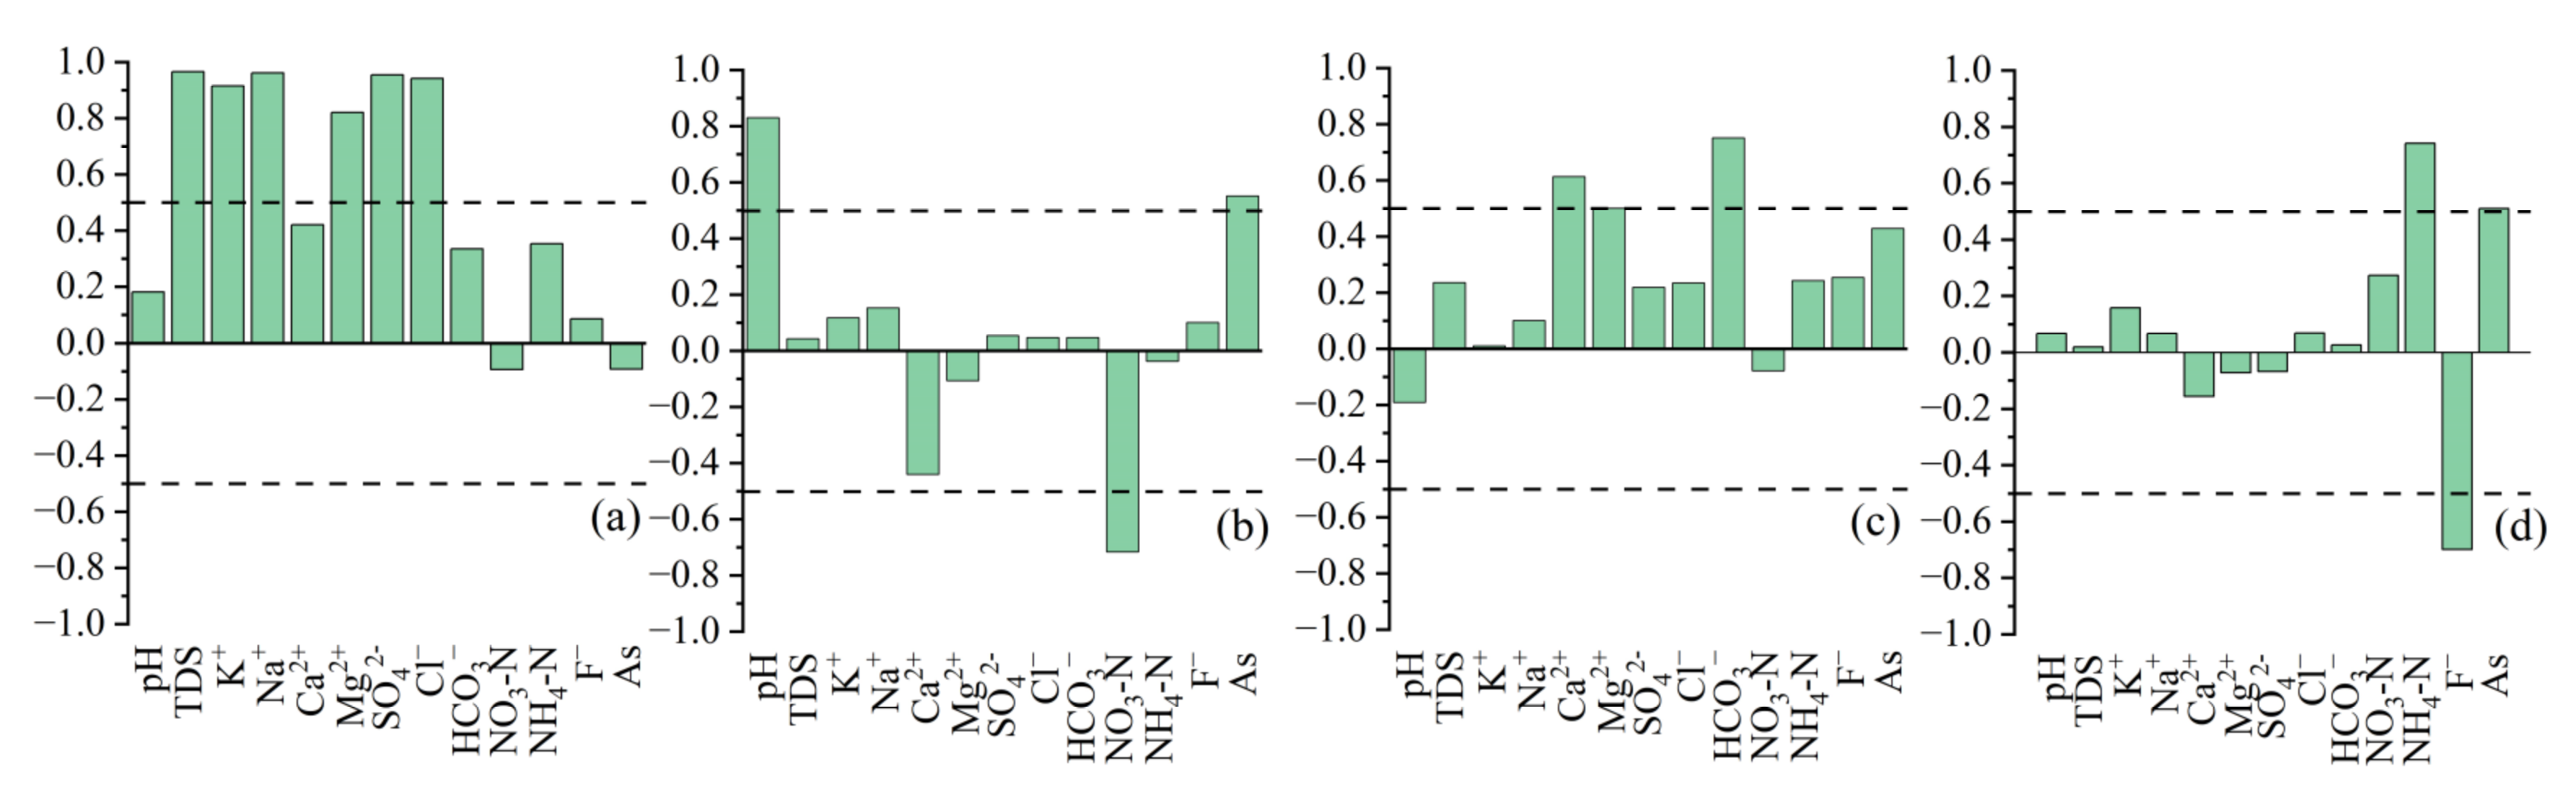
4.3.3. Geogenic Sources
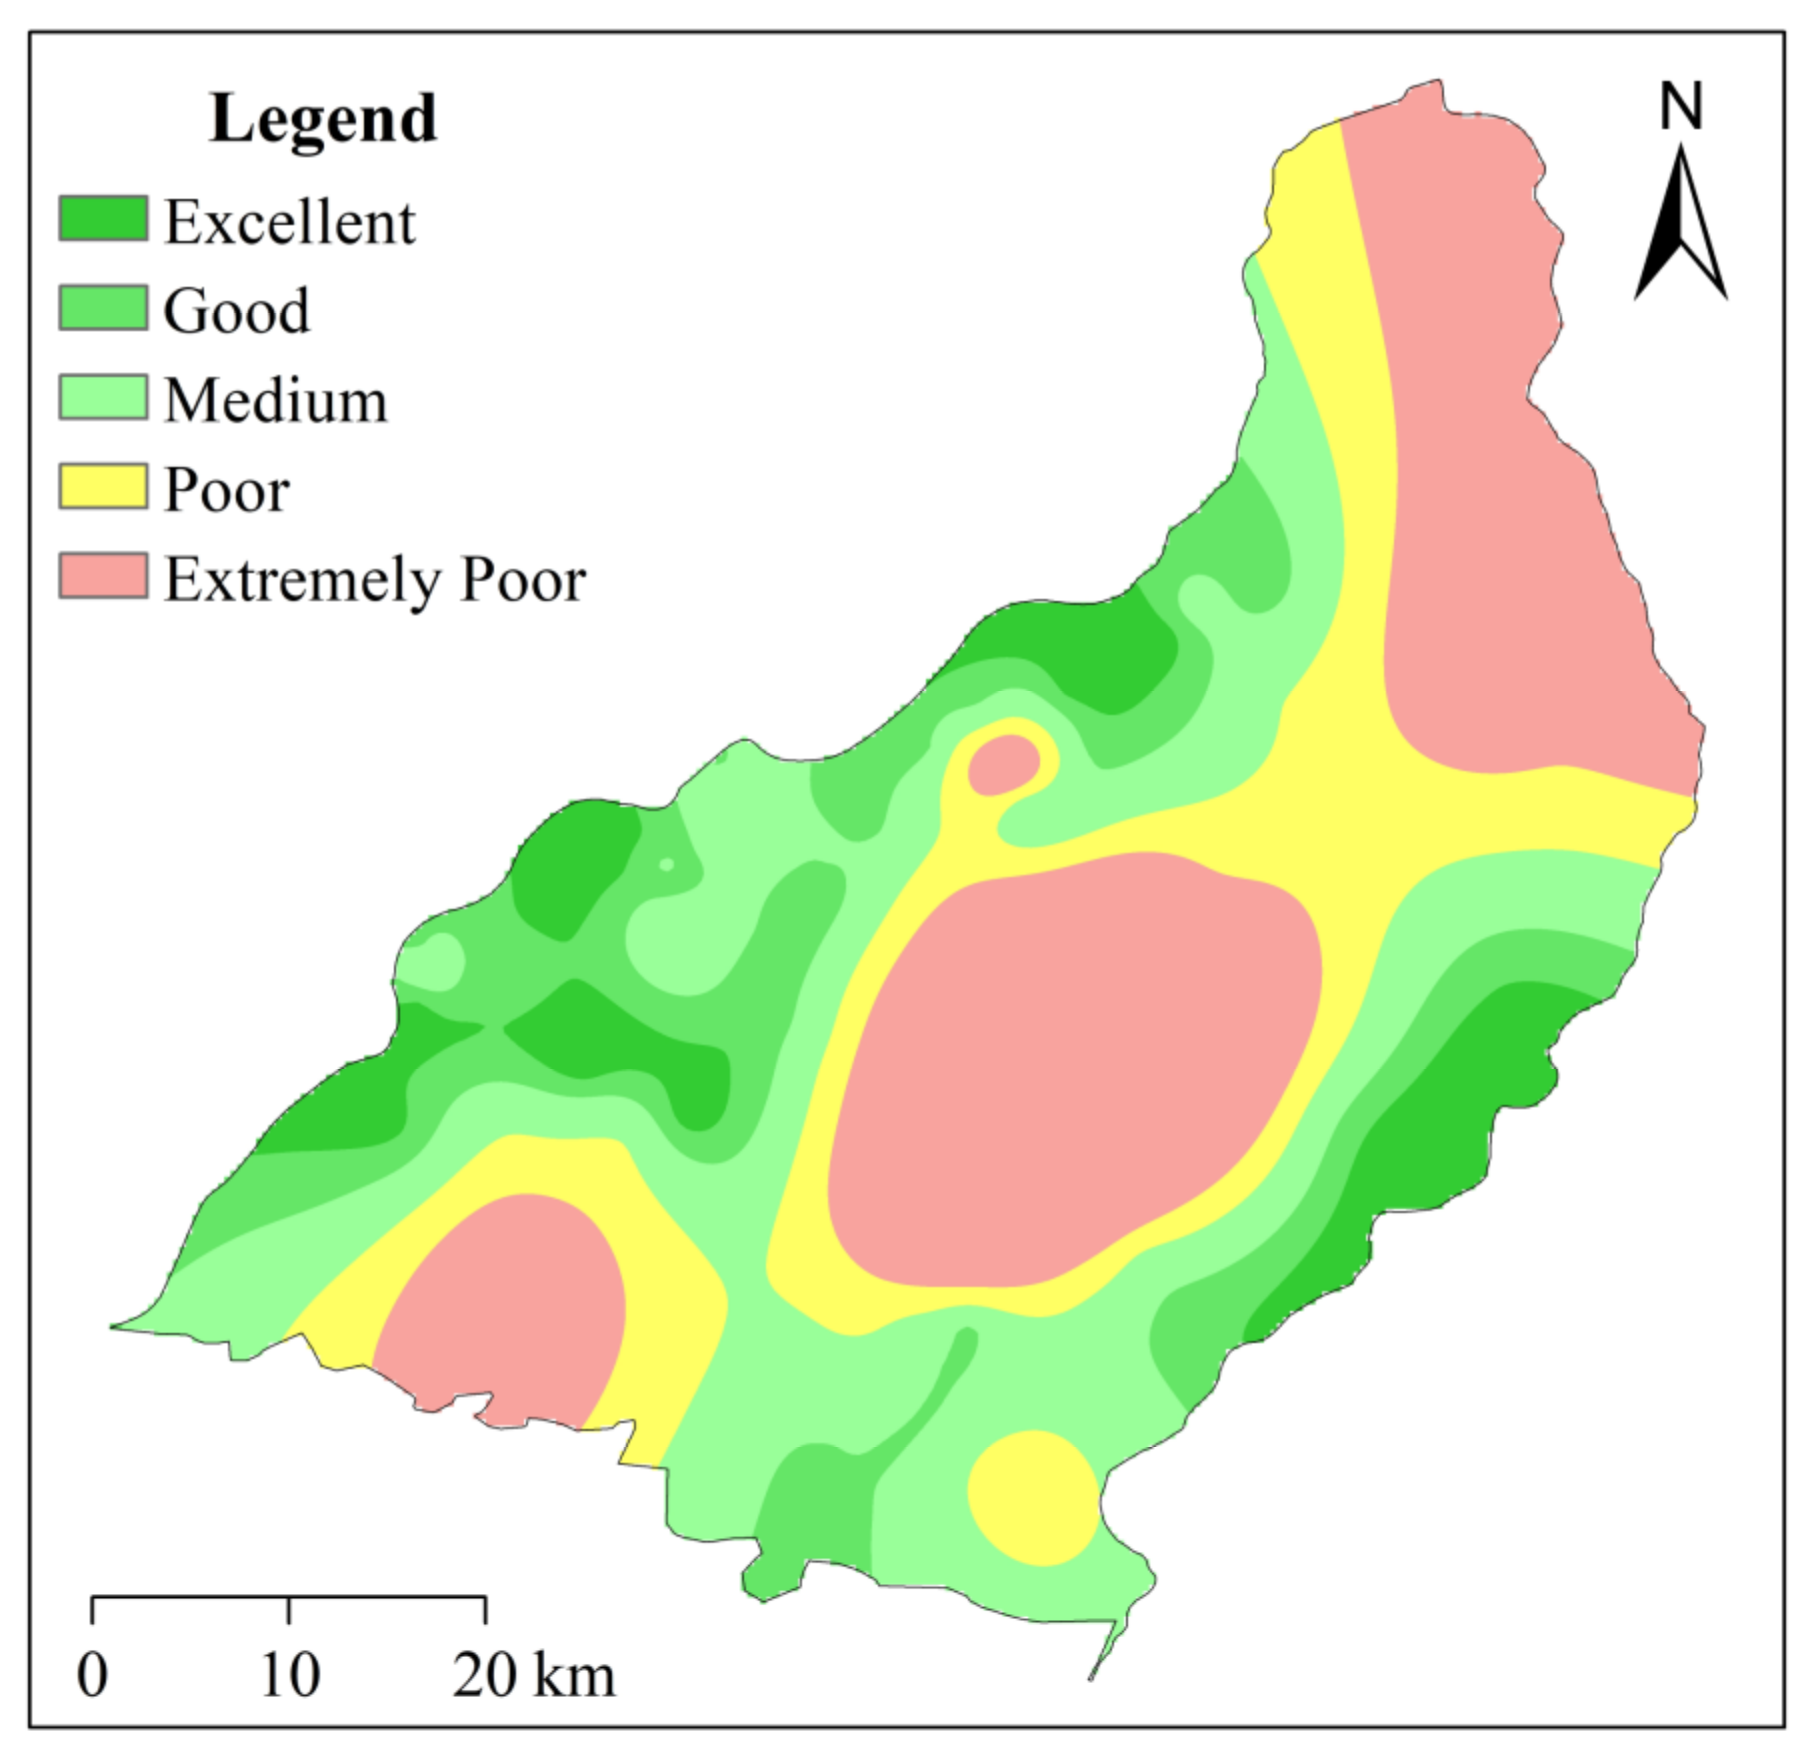
4.4. Groundwater Quality Assessment
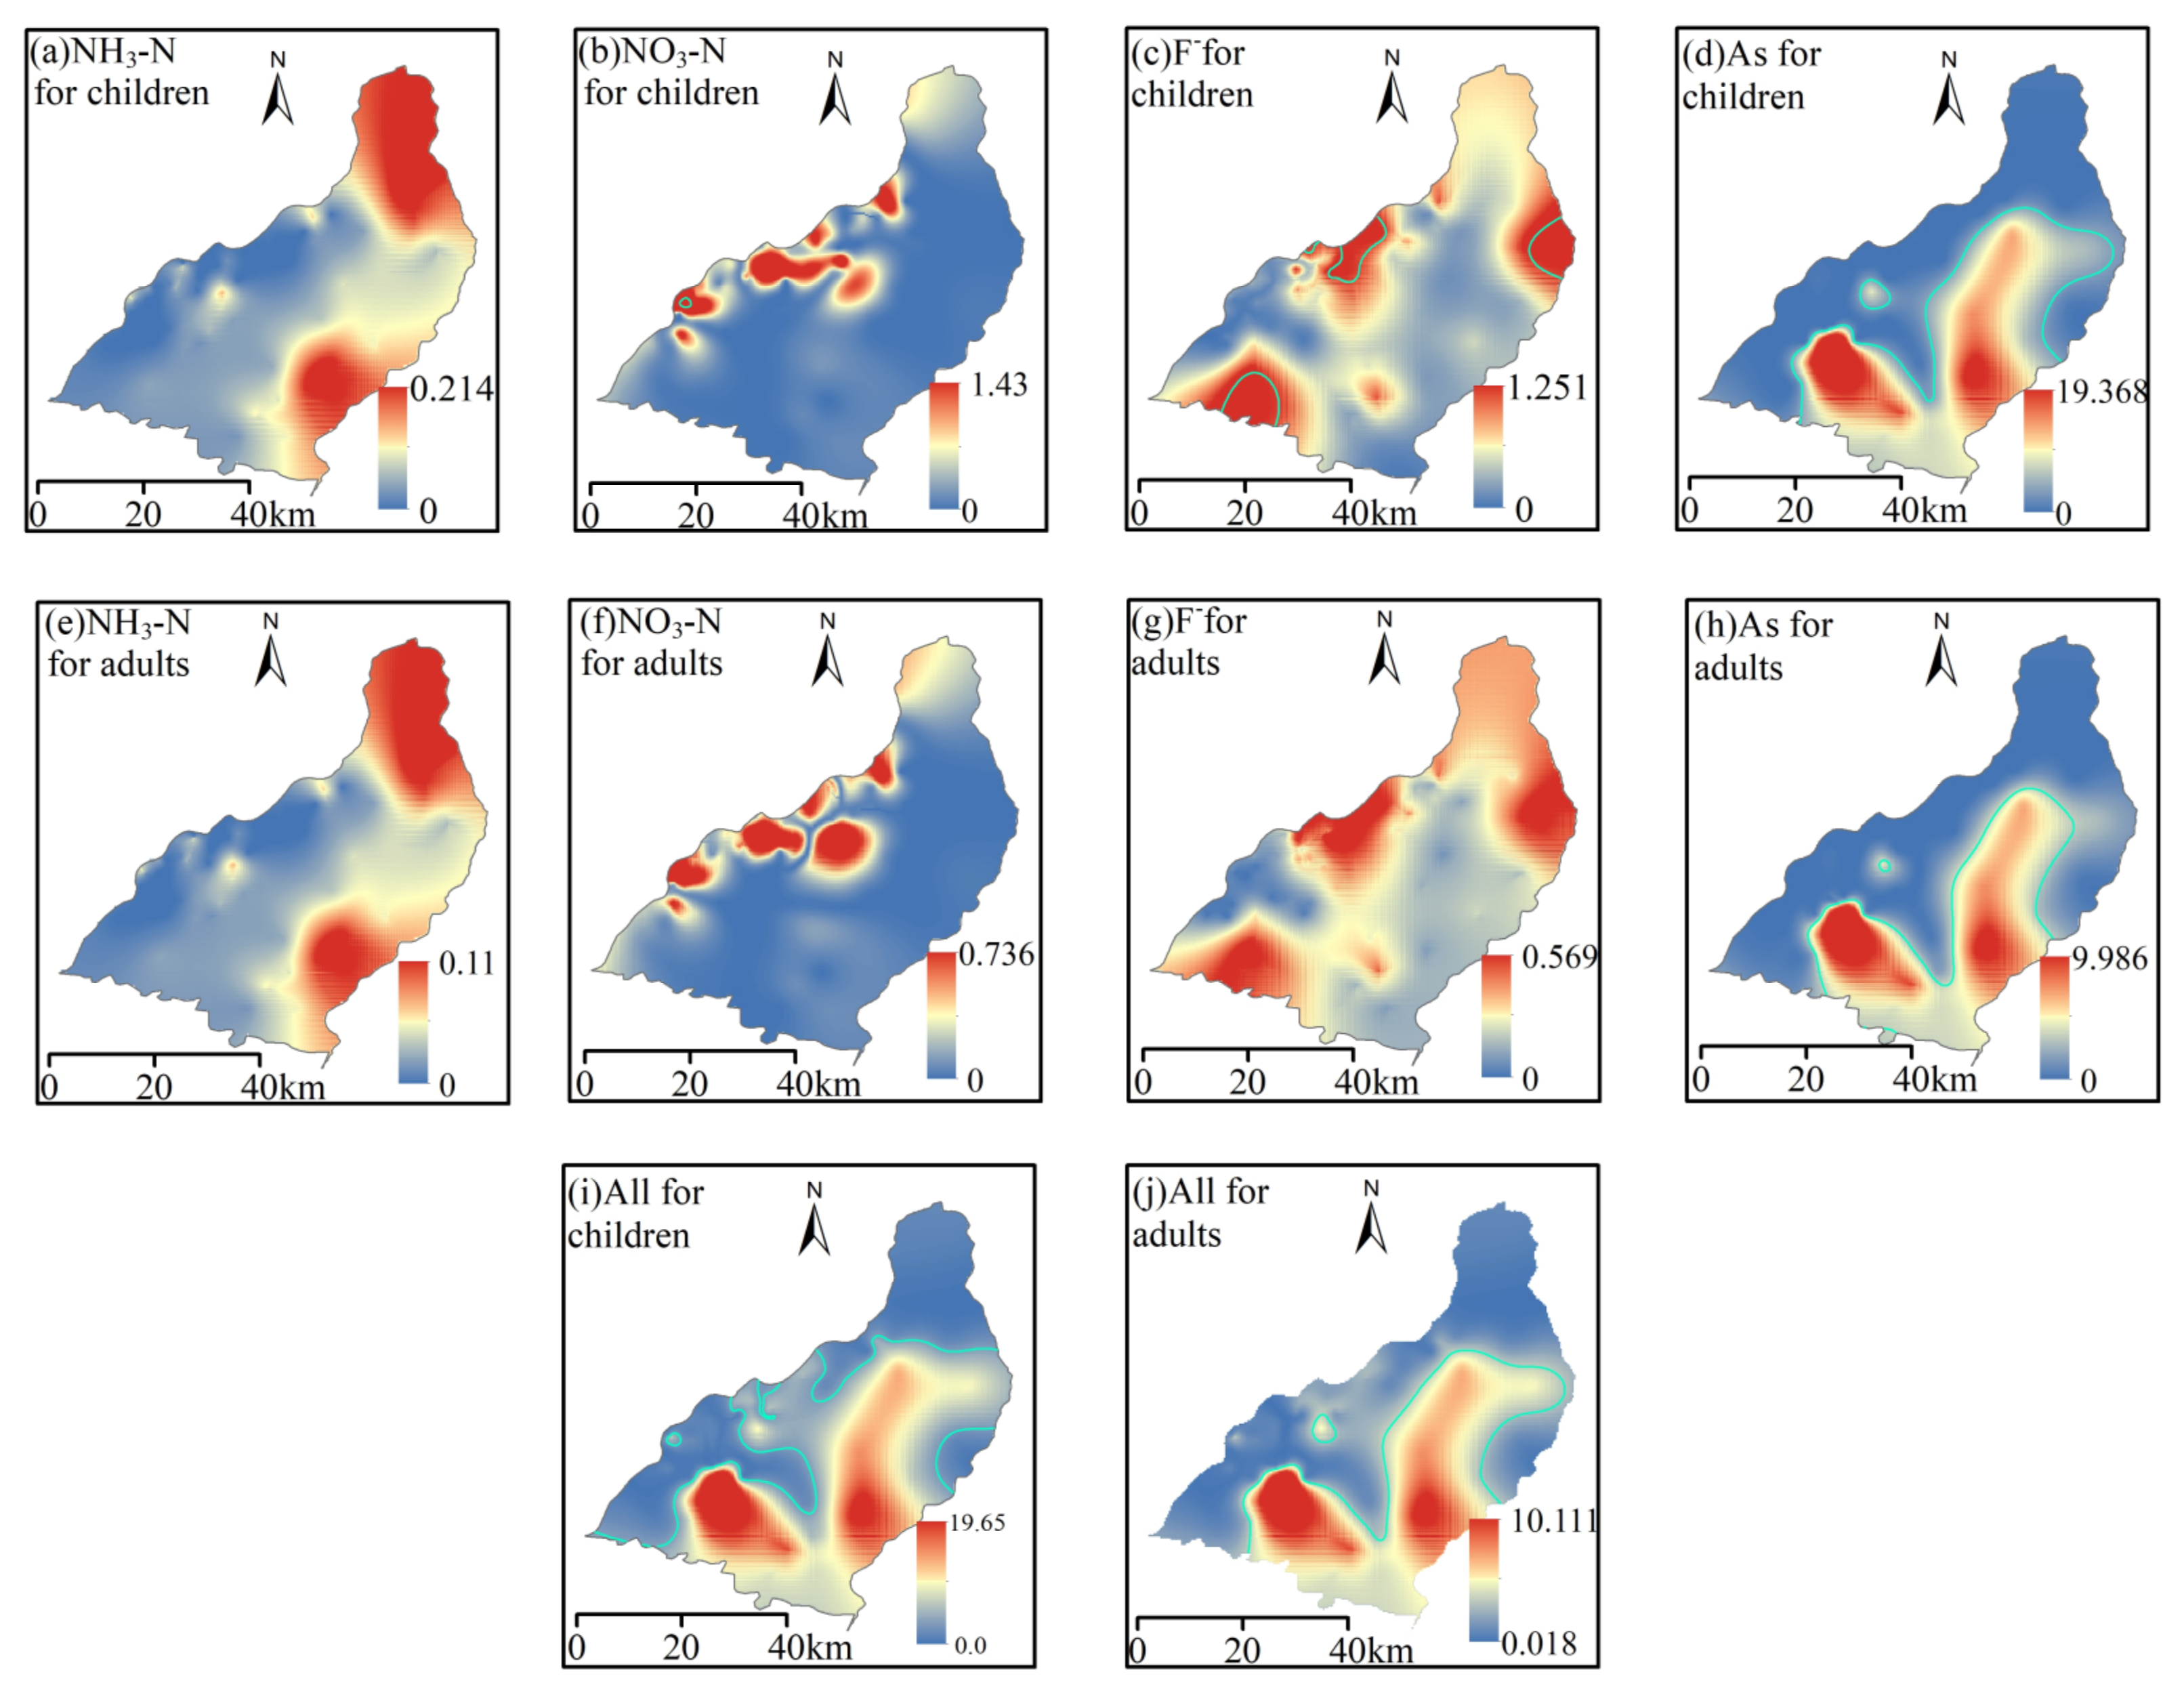
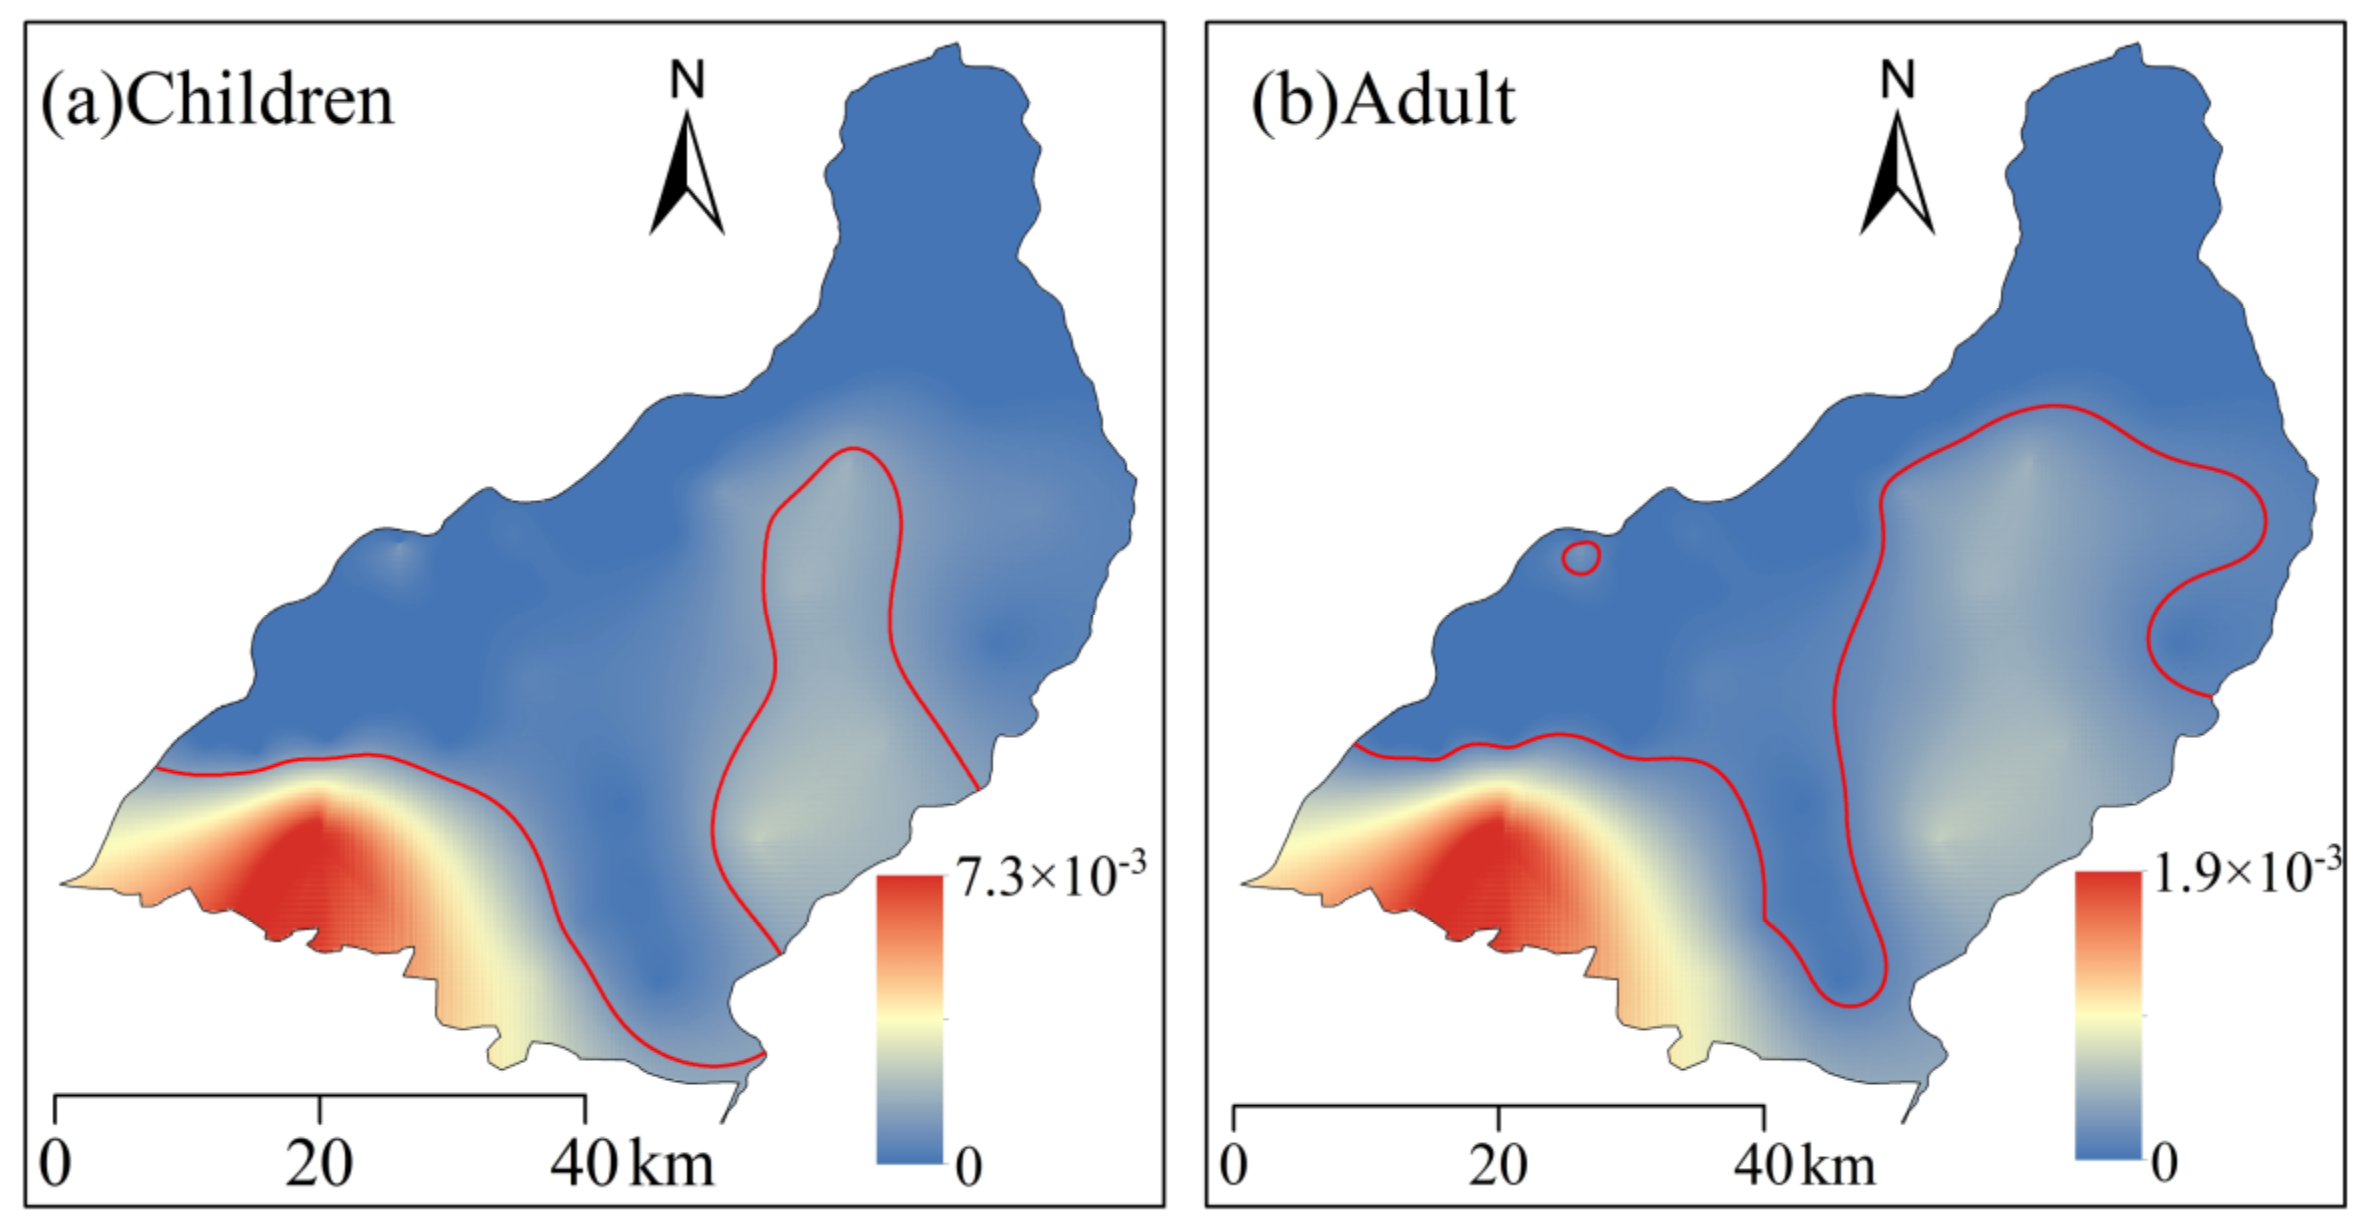
4.5. Assessment of the Hazard to Human Health
4.6. Recommendation for Groundwater Management
5. Conclusions
Author Contributions
Funding
Data Availability Statement
Acknowledgments
Conflicts of Interest
References
- Shrestha, S.; Kafle, R.; Pandey, V.P. Evaluation of index-overlay methods for groundwater vulnerability and risk assessment in Kathmandu Valley, Nepal. Sci. Total Environ. 2017, 575, 779–790. [Google Scholar] [CrossRef] [PubMed]
- Zhong, C.; Wang, H.; Yang, Q. Hydrochemical interpretation of groundwater in Yinchuan basin using self-organizing maps and hierarchical clustering. Chemosphere 2022, 309, 136787. [Google Scholar] [CrossRef] [PubMed]
- Han, S.; Zhang, F.; Zhang, H. Spatial and temporal patterns of groundwater arsenic in shallow and deep groundwater of Yinchuan Plain, China. J. Geochem. Explor. 2013, 135, 71–78. [Google Scholar] [CrossRef]
- Moyé, J.; Picard-Lesteven, T.; Zouhri, L.; El Amari, K.; Hibti, M.; Benkaddour, A. Groundwater assessment and environmental impact in the abandoned mine of Kettara (Morocco). Environ. Pollut. 2017, 231, 899–907. [Google Scholar] [CrossRef] [PubMed]
- Ahmed, N.; Bodrud-Doza, M.; Towfiqul Islam, A.R.M.; Hossain, S.; Moniruzzaman, M.; Deb, N.; Bhuiyan, M.A.Q. Appraising spatial variations of As, Fe, Mn and NO3 contaminations associated health risks of drinking water from Surma basin, Bangladesh. Chemosphere 2019, 218, 726–740. [Google Scholar] [CrossRef]
- Chen, R.; Teng, Y.; Chen, H.; Hu, B.; Yue, W. Groundwater pollution and risk assessment based on source apportionment in a typical cold agricultural region in Northeastern China. Sci. Total Environ. 2019, 696, 133972. [Google Scholar] [CrossRef]
- Abdalla, O.; Al-Abri, R.b.Y. Factors affecting groundwater chemistry in regional arid basins of variable lithology: Example of Wadi Umairy, Oman. Arab. J. Geosci. 2014, 7, 2861–2870. [Google Scholar] [CrossRef]
- Busico, G.; Cuoco, E.; Kazakis, N.; Colombani, N.; Mastrocicco, M.; Tedesco, D.; Voudouris, K. Multivariate statistical analysis to characterize/discriminate between anthropogenic and geogenic trace elements occurrence in the Campania Plain, Southern Italy. Environ. Pollut. 2018, 234, 260–269. [Google Scholar] [CrossRef]
- Reddy, A.G.S.; Kumar, K.N. Identification of the hydrogeochemical processes in groundwater using major ion chemistry: A case study of Penna–Chitravathi river basins in Southern India. Environ. Monit. Assess. 2010, 170, 365–382. [Google Scholar] [CrossRef]
- Xueli, L. Hydrogeochemistry; Atomic Energy Press: Beijing, China, 1988; p. 446. (In Chinese) [Google Scholar]
- Wali, S.U.; Alias, N.; Bin Harun, S. Hydrogeochemical evaluation and mechanisms controlling groundwater in different geologic environments, Western Sokoto Basin, Northwestern Nigeria. SN Appl. Sci. 2020, 2, 1808. [Google Scholar] [CrossRef]
- Okkonen, J.; Kløve, B. Assessment of temporal and spatial variation in chemical composition of groundwater in an unconfined esker aquifer in the cold temperate climate of Northern Finland. Cold Reg. Sci. Technol. 2012, 71, 118–128. [Google Scholar] [CrossRef]
- Li, Z.-J.; Song, L.-L.; Gui, J.; Li, Z.-X. Hydrochemical patterns indicating hydrological processes with the background of changing climatic and environmental conditions in China: A review. Environ. Sci. Pollut. Res. 2022, 29, 15364–15379. [Google Scholar] [CrossRef]
- Schot, P.P.; van der Wal, J. Human impact on regional groundwater composition through intervention in natural flow patterns and changes in land use. J. Hydrol. 1992, 134, 297–313. [Google Scholar] [CrossRef] [Green Version]
- Adams, S.; Titus, R.; Pietersen, K.; Tredoux, G.; Harris, C. Hydrochemical characteristics of aquifers near Sutherland in the Western Karoo, South Africa. J. Hydrol. 2001, 241, 91–103. [Google Scholar] [CrossRef] [Green Version]
- Zhang, B.; Song, X.; Zhang, Y.; Han, D.; Tang, C.; Yu, Y.; Ma, Y. Hydrochemical characteristics and water quality assessment of surface water and groundwater in Songnen plain, Northeast China. Water Res. 2012, 46, 2737–2748. [Google Scholar] [CrossRef] [PubMed]
- Güler, C.; Kurt, M.A.; Alpaslan, M.; Akbulut, C. Assessment of the impact of anthropogenic activities on the groundwater hydrology and chemistry in Tarsus coastal plain (Mersin, SE Turkey) using fuzzy clustering, multivariate statistics and GIS techniques. J. Hydrol. 2012, 414–415, 435–451. [Google Scholar] [CrossRef]
- Maheswari, M.; Murthy, A.N.G.; Shanker, A.K. Nitrogen Nutrition in Crops and Its Importance in Crop Quality. In The Indian Nitrogen Assessment; Abrol, Y.P., Adhya, T.K., Aneja, V.P., Raghuram, N., Pathak, H., Kulshrestha, U., Sharma, C., Singh, B., Eds.; Elsevier: Amsterdam, The Netherlands, 2017; pp. 175–186. [Google Scholar] [CrossRef]
- Bodirsky, B.L.; Popp, A.; Lotze-Campen, H.; Dietrich, J.P.; Rolinski, S.; Weindl, I.; Schmitz, C.; Müller, C.; Bonsch, M.; Humpenöder, F.; et al. Reactive nitrogen requirements to feed the world in 2050 and potential to mitigate nitrogen pollution. Nat. Commun. 2014, 5, 3858. [Google Scholar] [CrossRef] [Green Version]
- Zahoor; Ahmad, W.; Hira, K.; Ullah, B.; Khan, A.-u.; Shah, Z.; Khan, F.; Naz, R. Role of nitrogen fertilizer in crop productivity and environmental pollution. Int. J. Agric. For. 2014, 4, 201–206. [Google Scholar]
- Ahmed, M.; Rauf, M.; Mukhtar, Z.; Saeed, N.A. Excessive use of nitrogenous fertilizers: An unawareness causing serious threats to environment and human health. Environ. Sci. Pollut. Res. 2017, 24, 26983–26987. [Google Scholar] [CrossRef]
- Kumar, M.; Goswami, R.; Patel, A.K.; Srivastava, M.; Das, N. Scenario, perspectives and mechanism of arsenic and fluoride Co-occurrence in the groundwater: A review. Chemosphere 2020, 249, 126126. [Google Scholar] [CrossRef]
- Li, P.; He, X.; Guo, W. Spatial groundwater quality and potential health risks due to nitrate ingestion through drinking water: A case study in Yan’an City on the Loess Plateau of northwest China. Hum. Ecol. Risk Assess. Int. J. 2019, 25, 11–31. [Google Scholar] [CrossRef]
- He, X.; Li, P.; Wu, J.; Wei, M.; Ren, X.; Wang, D. Poor groundwater quality and high potential health risks in the Datong Basin, northern China: Research from published data. Environ. Geochem. Health 2021, 43, 791–812. [Google Scholar] [CrossRef] [PubMed]
- Cheng, P.S.; Weng, S.F.; Chiang, C.H.; Lai, F.J. Relationship between arsenic-containing drinking water and skin cancers in the arseniasis endemic areas in Taiwan. J. Dermatol. 2016, 43, 181–186. [Google Scholar] [CrossRef]
- Astolfi, E.; Maccagno, A.; García Fernández, J.C.; Vaccaro, R.; Stímola, R. Relation between arsenic in drinking water and skin cancer. Biol. Trace Elem. Res. 1981, 3, 133–143. [Google Scholar] [CrossRef] [PubMed]
- Yang, L.; Peterson, P.J.; Williams, W.P.; Wang, W.; Hou, S.; Tan, J. The Relationship Between Exposure to Arsenic Concentrations in Drinking Water and the Development of Skin Lesions in Farmers from Inner Mongolia, China. Environ. Geochem. Health 2002, 24, 293–303. [Google Scholar] [CrossRef]
- Şener, Ş.; Şener, E.; Davraz, A. Evaluation of water quality using water quality index (WQI) method and GIS in Aksu River (SW-Turkey). Sci. Total Environ. 2017, 584–585, 131–144. [Google Scholar] [CrossRef] [PubMed]
- Lumb, A.; Sharma, T.C.; Bibeault, J.-F. A Review of Genesis and Evolution of Water Quality Index (WQI) and Some Future Directions. Water Qual. Expo. Health 2011, 3, 11–24. [Google Scholar] [CrossRef]
- Vasanthavigar, M.; Srinivasamoorthy, K.; Vijayaragavan, K.; Rajiv Ganthi, R.; Chidambaram, S.; Anandhan, P.; Manivannan, R.; Vasudevan, S. Application of water quality index for groundwater quality assessment: Thirumanimuttar sub-basin, Tamilnadu, India. Environ. Monit. Assess. 2010, 171, 595–609. [Google Scholar] [CrossRef] [PubMed]
- Xiao, J.; Wang, L.; Deng, L.; Jin, Z. Characteristics, sources, water quality and health risk assessment of trace elements in river water and well water in the Chinese Loess Plateau. Sci. Total Environ. 2019, 650, 2004–2012. [Google Scholar] [CrossRef] [PubMed]
- Hasan, M.S.U.; Rai, A.K. Groundwater quality assessment in the Lower Ganga Basin using entropy information theory and GIS. J. Clean. Prod. 2020, 274, 123077. [Google Scholar] [CrossRef]
- Radfard, M.; Yunesian, M.; Nabizadeh, R.; Biglari, H.; Nazmara, S.; Hadi, M.; Yousefi, N.; Yousefi, M.; Abbasnia, A.; Mahvi, A.H. Drinking water quality and arsenic health risk assessment in Sistan and Baluchestan, Southeastern Province, Iran. Hum. Ecol. Risk Assess. 2019, 25, 949–965. [Google Scholar] [CrossRef]
- Adimalla, N.; Li, P. Occurrence, health risks, and geochemical mechanisms of fluoride and nitrate in groundwater of the rock-dominant semi-arid region, Telangana State, India. Hum. Ecol. Risk Assess. Int. J. 2018, 25, 81–103. [Google Scholar] [CrossRef]
- Rasool, A.; Farooqi, A.; Masood, S.; Hussain, K. Arsenic in groundwater and its health risk assessment in drinking water of Mailsi, Punjab, Pakistan. Hum. Ecol. Risk Assess. 2016, 22, 187–202. [Google Scholar] [CrossRef]
- Li, P.; Wu, J.; Qian, H. Hydrogeochemistry and Quality Assessment of Shallow Groundwater in the Southern Part of the Yellow River Alluvial Plain (Zhongwei Section), Northwest China. Earth Sci. Res. J. 2014, 18, 27–38. [Google Scholar] [CrossRef]
- Chen, J.; Gao, Y.; Qian, H.; Ren, W.; Qu, W. Hydrogeochemical evidence for fluoride behavior in groundwater and the associated risk to human health for a large irrigation plain in the Yellow River Basin. Sci. Total Environ. 2021, 800, 149428. [Google Scholar] [CrossRef] [PubMed]
- Ningxia Statistical Bureau. Ningxia Statistical Yearbook; China Statistics Press: Beijing, China, 2022. [Google Scholar]
- Wu, J.; Li, P.; Qian, H. Hydrochemical characterization of drinking groundwater with special reference to fluoride in an arid area of China and the control of aquifer leakage on its concentrations. Environ. Earth Sci. 2015, 73, 8575–8588. [Google Scholar] [CrossRef]
- Chen, J.; Qian, H.; Wu, H. Nitrogen contamination in groundwater in an agricultural region along the New Silk Road, northwest China: Distribution and factors controlling its fate. Environ. Sci. Pollut. Res. 2017, 24, 13154–13167. [Google Scholar] [CrossRef]
- Ministry of Water Resources of PRC. Technical Regulation of Water Quality Sampling (SL 187–96); Standards Press of China: Beijing, China, 1997. (In Chinese)
- State Environmental Protection Administration. The Technical Specification for Environmental Monitoring of Groundwater; China Environmental Science Press: Beijing, China, 2004. (In Chinese) [Google Scholar]
- Adimalla, N.; Qian, H. Groundwater quality evaluation using water quality index (WQI) for drinking purposes and human health risk (HHR) assessment in an agricultural region of Nanganur, south India. Ecotoxicol. Environ. Saf. 2019, 176, 153–161. [Google Scholar] [CrossRef]
- Verma, D.K.; Bhunia, G.S.; Shit, P.K.; Tiwari, A.K. Assessment of Groundwater Quality of the Central Gangetic Plain Area of India Using Geospatial and WQI Techniques. J. Geol. Soc. India 2018, 92, 743–752. [Google Scholar] [CrossRef]
- USEPA. Risk Assessment Guidance for Superfund; Human Health Evaluation Manual (Part A); Office of Emergency and Remedial Response: Washington, DC, USA, 1989; Volume 1.
- Feng, B.; Ma, Y.; Qi, Y.; Zhong, Y.; Sha, X. Health risk assessment of groundwater nitrogen pollution in Yinchuan plain. J. Contam. Hydrol. 2022, 249, 104031. [Google Scholar] [CrossRef]
- Qaiser, F.U.R.; Zhang, F.; Pant, R.R.; Zeng, C.; Khan, N.G.; Wang, G. Characterization and health risk assessment of arsenic in natural waters of the Indus River Basin, Pakistan. Sci. Total Environ. 2023, 857, 159408. [Google Scholar] [CrossRef] [PubMed]
- Li, P.; Li, X.; Meng, X.; Li, M.; Zhang, Y. Appraising Groundwater Quality and Health Risks from Contamination in a Semiarid Region of Northwest China. Expo. Health 2016, 8, 361–379. [Google Scholar] [CrossRef]
- Hunter, P.R.; Fewtrell, L. Acceptable Risk 10.1 Introduction; IWA Publishing: London, UK, 2001. [Google Scholar]
- Bureau of Quality and Technical Supervision of China. National Standard of the People’s Republic of China:Quality Standard for Groundwater. In GB/T 14848-2017; Bureau of Quality and Technical Supervision of China: Beijing, China, 2017. (In Chinese) [Google Scholar]
- World Health Organization (WHO). Guidelines for Drinking Water Quality; World Health Organization: Geneva, Switzerland, 2011. [Google Scholar]
- Su, Y.H.; Zhu, G.F.; Feng, Q.; Li, Z.Z.; Zhang, F.P. Environmental isotopic and hydrochemical study of groundwater in the Ejina Basin, northwest China. Environ. Geol. 2009, 58, 601–614. [Google Scholar] [CrossRef]
- Li, P.; Qian, H.; Wu, J.; Zhang, Y.; Zhang, H. Major Ion Chemistry of Shallow Groundwater in the Dongsheng Coalfield, Ordos Basin, China. Mine Water Environ. 2013, 32, 195–206. [Google Scholar] [CrossRef]
- Marghade, D.; Malpe, D.B.; Zade, A.B. Major ion chemistry of shallow groundwater of a fast growing city of central India. Environ. Monit. Assess. 2012, 184, 2405–2418. [Google Scholar] [CrossRef] [PubMed]
- Zhang, X.; Qian, H.; Wu, H.; Chen, J.; Qiao, L. Multivariate Analysis of Confined Groundwater Hydrochemistry of a Long-Exploited Sedimentary Basin in Northwest China. J. Chem. 2016, 2016, 3812125. [Google Scholar] [CrossRef] [Green Version]
- Rahman, A.; Mondal, N.C.; Tiwari, K.K. Anthropogenic nitrate in groundwater and its health risks in the view of background concentration in a semi arid area of Rajasthan, India. Sci. Rep. 2021, 11, 9279. [Google Scholar] [CrossRef]
- Galloway, J.N.; Leach, A.M.; Bleeker, A.; Erisman, J.W. A chronology of human understanding of the nitrogen cycle. Philos. Trans. R. Soc. Lond. Ser. B Biol. Sci. 2013, 368, 20130120. [Google Scholar] [CrossRef] [Green Version]
- Morrissy, J.G.; Currell, M.J.; Reichman, S.M.; Surapaneni, A.; Megharaj, M.; Crosbie, N.D.; Hirth, D.; Aquilina, S.; Rajendram, W.; Ball, A.S. Nitrogen contamination and bioremediation in groundwater and the environment: A review. Earth-Sci. Rev. 2021, 222, 103816. [Google Scholar] [CrossRef]
- Jha, S.K.; Singh, R.K.; Damodaran, T.; Mishra, V.K.; Sharma, D.K.; Rai, D. Fluoride in groundwater: Toxicological exposure and remedies. J. Toxicol. Environ. Health Part B Crit. Rev. 2013, 16, 52–66. [Google Scholar] [CrossRef]
- Vithanage, M.; Bhattacharya, P. Fluoride in the environment: Sources, distribution and defluoridation. Environ. Chem. Lett. 2015, 13, 131–147. [Google Scholar] [CrossRef]
- Kechiched, R.; Nezli, I.E.; Foufou, A.; Belksier, M.S.; Benhamida, S.A.; Djeghoubbi, R.; Slamene, N.; Ameur-zaimeche, O. Fluoride-bearing groundwater in the complex terminal aquifer (a case study in Hassi Messaoud area, southern Algeria): Hydrochemical characterization and spatial distribution assessed by indicator kriging. Sustain. Water Resour. Manag. 2020, 6, 54. [Google Scholar] [CrossRef]
- Wang, S.X.; Wang, Z.H.; Cheng, X.T.; Li, J.; Sang, Z.P.; Zhang, X.D.; Han, L.L.; Qiao, X.Y.; Wu, Z.M.; Wang, Z.Q. Arsenic and fluoride exposure in drinking water: Children’s IQ and growth in Shanyin county, Shanxi province, China. Environ. Health Perspect. 2007, 115, 643–647. [Google Scholar] [CrossRef] [PubMed] [Green Version]
- Villalba, E.; Tanjal, C.; Borzi, G.; Páez, G.; Carol, E. Geogenic arsenic contamination of wet-meadows associated with a geothermal system in an arid region and its relevance for drinking water. Sci. Total Environ. 2020, 720, 137571. [Google Scholar] [CrossRef] [PubMed]
- Rahman, A.; Persson, L.A.; Nermell, B.; El Arifeen, S.; Ekstrom, E.C.; Smith, A.H.; Vahter, M. Arsenic Exposure and Risk of Spontaneous Abortion, Stillbirth, and Infant Mortality. Epidemiology 2010, 21, 797–804. [Google Scholar] [CrossRef]
- Piper, A.M. A graphic procedure in the geochemical interpretation of water-analyses. Eos Trans. Am. Geophys. Union 1944, 25, 914–928. [Google Scholar] [CrossRef]
- Liu, F.X.; Qian, H.; Shi, Z.W.; Wang, H.K. Long-term monitoring of hydrochemical characteristics and nitrogen pollution in the groundwater of Yinchuan area, Yinchuan basin of northwest China. Environ. Earth Sci. 2019, 78, 885–897. [Google Scholar] [CrossRef]
- Wang, Y.X.; Pi, K.F.; Fendorf, S.; Deng, Y.M.; Xie, X.J. Sedimentogenesis and hydrobiogeochemistry of high arsenic Late Pleistocene-Holocene aquifer systems. Earth-Sci. Rev. 2019, 189, 79–98. [Google Scholar] [CrossRef]
- Huq, M.E.; Fahad, S.; Shao, Z.; Sarven, M.S.; Khan, I.A.; Alam, M.; Saeed, M.; Ullah, H.; Adnan, M.; Saud, S.; et al. Arsenic in a groundwater environment in Bangladesh: Occurrence and mobilization. J. Environ. Manag. 2020, 262, 110318. [Google Scholar] [CrossRef]
- Böhlke, J.K.; Smith, R.L.; Miller, D.N. Ammonium transport and reaction in contaminated groundwater: Application of isotope tracers and isotope fractionation studies. Water Resour. Res. 2006, 42. [Google Scholar] [CrossRef]
- Sun, Y.; Sun, J.; Nghiem, A.A.; Bostick, B.C.; Ellis, T.; Han, L.; Li, Z.; Liu, S.; Han, S.; Zhang, M.; et al. Reduction of iron (hydr)oxide-bound arsenate: Evidence from high depth resolution sampling of a reducing aquifer in Yinchuan Plain, China. J. Hazard. Mater. 2021, 406, 124615. [Google Scholar] [CrossRef] [PubMed]
- Gibbs, R.J. Mechanisms Controlling World Water Chemistry. Science 1970, 170, 1088–1090. [Google Scholar] [CrossRef] [PubMed]
- Maurya, S.; Saxena, A. Spatiotemporal assessment of groundwater quality in the Central Ganga Plain, India, using multivariate statistical tools. Environ. Monit. Assess. 2022, 194, 865. [Google Scholar] [CrossRef] [PubMed]
- Naseem, S.; Rafique, T.; Bashir, E.; Bhanger, M.I.; Laghari, A.; Usmani, T.H. Lithological influences on occurrence of high-fluoride groundwater in Nagar Parkar area, Thar Desert, Pakistan. Chemosphere 2010, 78, 1313–1321. [Google Scholar] [CrossRef] [PubMed]
- Li, P.; Wu, J.; Qian, H. Hydrochemical appraisal of groundwater quality for drinking and irrigation purposes and the major influencing factors: A case study in and around Hua County, China. Arab. J. Geosci. 2015, 9, 15. [Google Scholar] [CrossRef]
- Guo, X.; Wang, X.; Shi, X.; Yu, H.; Huirong, Z.; Fang, Z. Hydrochemical characteristics and sources of chemical constituents in groundwater in Hunchun River Basin, Northeast China. Arab. J. Geosci. 2022, 15, 694. [Google Scholar] [CrossRef]
- Chen, J.; Huang, Q.; Lin, Y.; Fang, Y.; Qian, H.; Liu, R.; Ma, H. Hydrogeochemical Characteristics and Quality Assessment of Groundwater in an Irrigated Region, Northwest China. Water 2019, 11, 96. [Google Scholar] [CrossRef] [Green Version]
- Chen, J.; Qian, H.; Gao, Y.; Wang, H.; Zhang, M. Insights into hydrological and hydrochemical processes in response to water replenishment for lakes in arid regions. J. Hydrol. 2020, 581, 124386. [Google Scholar] [CrossRef]
- Rahman, M.A.T.M.T.; Majumder, R.K.; Rahman, S.H.; Halim, M.A. Sources of deep groundwater salinity in the southwestern zone of Bangladesh. Environ. Earth Sci. 2011, 63, 363–373. [Google Scholar] [CrossRef]
- Schoeller, H. Qualitative Evaluation of Groundwa-Ter Resources; UNESCO: Paris, France, 1965; Volume 1965, pp. 54–83. [Google Scholar]
- Ehrlich, H.L.; Newman, D.K. Geomicrobiology, 5th ed.; CRC Press: Boca Raton, FL, USA, 2009. [Google Scholar]
- Chen, J.; Qian, H.; Wu, H.; Gao, Y.; Li, X. Assessment of arsenic and fluoride pollution in groundwater in Dawukou area, Northwest China, and the associated health risk for inhabitants. Environ. Earth Sci. 2017, 76, 314. [Google Scholar] [CrossRef]
- Feng, S.; Guo, H.; Sun, X.; Han, S. Limited roles of anthropogenic activities on arsenic mobilization in groundwater from the Yinchuan Basin, China. J. Hydrol. 2022, 610, 127910. [Google Scholar] [CrossRef]
- Adimalla, N.; Marsetty, S.K.; Xu, P.P. Assessing groundwater quality and health risks of fluoride pollution in the Shasler Vagu (SV) watershed of Nalgonda, India. Hum. Ecol. Risk Assess. 2020, 26, 1569–1588. [Google Scholar] [CrossRef]
- Kanagaraj, G.; Elango, L. Chromium and fluoride contamination in groundwater around leather tanning industries in southern India: Implications from stable isotopic ratio delta Cr-53/delta Cr-52, geochemical and geostatistical modelling. Chemosphere 2019, 220, 943–953. [Google Scholar] [CrossRef] [PubMed]
- Chung, J.Y.; Yu, S.D.; Hong, Y.S. Environmental source of arsenic exposure. J. Prev. Med. Public Health Yebang Uihakhoe Chi 2014, 47, 253–257. [Google Scholar] [CrossRef] [PubMed] [Green Version]
- Morales, K.H.; Ryan, L.; Kuo, T.L.; Wu, M.M.; Chen, C.J. Risk of internal cancers from arsenic in drinking water. Environ. Health Perspect. 2000, 108, 655–661. [Google Scholar] [CrossRef]
- He, X.; Li, P.; Ji, Y.; Wang, Y.; Su, Z.; Elumalai, V. Groundwater Arsenic and Fluoride and Associated Arsenicosis and Fluorosis in China: Occurrence, Distribution and Management. Expo. Health 2020, 12, 355–368. [Google Scholar] [CrossRef]
- Zhang, Y.; Wu, J.; Xu, B. Human health risk assessment of groundwater nitrogen pollution in Jinghui canal irrigation area of the loess region, northwest China. Environ. Earth Sci. 2018, 77, 273. [Google Scholar] [CrossRef]
- Bengtsson, G.r.; Annadotter, H. Nitrate Reduction in a Groundwater Microcosm Determined by 15N Gas Chromatography-Mass Spectrometry. Appl. Environ. Microbiol. 1989, 55, 2861–2870. [Google Scholar] [CrossRef] [Green Version]
- Edmunds, W.M.; Ahmed, K.M.; Whitehead, P.G. A review of arsenic and its impacts in groundwater of the Ganges-Brahmaputra-Meghna delta, Bangladesh. Environ. Science. Process. Impacts 2015, 17, 1032–1046. [Google Scholar] [CrossRef]
- Chakraborti, D.; Singh, S.K.; Rahman, M.M.; Dutta, R.N.; Mukherjee, S.C.; Pati, S.; Kar, P.B. Groundwater Arsenic Contamination in the Ganga River Basin: A Future Health Danger. Int. J. Environ. Res. Public Health 2018, 15, 180. [Google Scholar] [CrossRef] [Green Version]
- Zhou, Y.; Wei, A.; Li, J.; Yan, L.; Li, J. Groundwater Quality Evaluation and Health Risk Assessment in the Yinchuan Region, Northwest China. Expo. Health 2016, 8, 443–456. [Google Scholar] [CrossRef]


| Parameters | Unit | Item | Children | Adults |
|---|---|---|---|---|
| IR | L/d | Oral | 0.7 | 1.50 |
| BW | kg | Oral | 15 | 62.5 |
| EF | d/a | Oral | 365 | 365 |
| ED | a | Oral | 6 | 30 |
| AT | d | Carcinogenic | 74.68 × 365 | 74.68 × 365 |
| Non-carcinogenic | 6 × 365 | 30 × 365 |
| Parameters | Weight (Wi) | Relative Weight Wi |
|---|---|---|
| pH | 3 | 0.063 |
| TDS | 5 | 0.104 |
| K+ | 2 | 0.042 |
| Na+ | 2 | 0.042 |
| Ca2+ | 3 | 0.063 |
| Mg2+ | 3 | 0.063 |
| SO42− | 3 | 0.063 |
| Cl− | 4 | 0.083 |
| HCO3− | 3 | 0.063 |
| NO3–N | 5 | 0.104 |
| NH4–N | 5 | 0.104 |
| F− | 5 | 0.104 |
| As | 5 | 0.104 |
| Categories | Ranges | NO. of Sample | |
|---|---|---|---|
| WQI | Excellent | <50 | 15 |
| Good | 50–100 | 24 | |
| Medium | 100–200 | 18 | |
| Poor | 200–300 | 3 | |
| Extremely poor | >300 | 6 |
| HI | RAs | |||||
|---|---|---|---|---|---|---|
| NO. of Samples | Percentage of HQ > 1 | Contribution rate of HI | NO. of Samples | Percentage of RAs > 1 × 10⁻⁴ | ||
| Children | NH4-N | 0 | 0% | 1.61% | / | / |
| NO3-N | 1 | 1.52% | 11.42% | / | / | |
| F− | 13 | 19.70% | 29.91% | / | / | |
| As | 12 | 18.18% | 57.07% | 6 | 9.09% | |
| All | 29 | 43.94% | / | / | / | |
| Adults | NH4-N | 0 | 0% | 1.61% | / | / |
| NO3-N | 0 | 0% | 11.42% | / | / | |
| F− | 0 | 0% | 29.91% | / | / | |
| As | 9 | 13.64% | 57.07% | 12 | 18.18% | |
| All | 12 | 18.18% | / | / | / | |
Disclaimer/Publisher’s Note: The statements, opinions and data contained in all publications are solely those of the individual author(s) and contributor(s) and not of MDPI and/or the editor(s). MDPI and/or the editor(s) disclaim responsibility for any injury to people or property resulting from any ideas, methods, instructions or products referred to in the content. |
© 2023 by the authors. Licensee MDPI, Basel, Switzerland. This article is an open access article distributed under the terms and conditions of the Creative Commons Attribution (CC BY) license (https://creativecommons.org/licenses/by/4.0/).
Share and Cite
Xiao, S.; Fang, Y.; Chen, J.; Zou, Z.; Gao, Y.; Xu, P.; Jiao, X.; Ren, M. Assessing the Hydrochemistry, Groundwater Drinking Quality, and Possible Hazard to Human Health in Shizuishan Area, Northwest China. Water 2023, 15, 1082. https://doi.org/10.3390/w15061082
Xiao S, Fang Y, Chen J, Zou Z, Gao Y, Xu P, Jiao X, Ren M. Assessing the Hydrochemistry, Groundwater Drinking Quality, and Possible Hazard to Human Health in Shizuishan Area, Northwest China. Water. 2023; 15(6):1082. https://doi.org/10.3390/w15061082
Chicago/Turabian StyleXiao, Shan, Yuan Fang, Jie Chen, Zonghua Zou, Yanyan Gao, Panpan Xu, Xueke Jiao, and Miaoyue Ren. 2023. "Assessing the Hydrochemistry, Groundwater Drinking Quality, and Possible Hazard to Human Health in Shizuishan Area, Northwest China" Water 15, no. 6: 1082. https://doi.org/10.3390/w15061082