
Productivity of Water Meadows under Haymaking in the Mid-Stream of the Ob River

1
Institute of Soil Science and Agrochemistry, Siberian Branch of the Russian Academy of Sciences (ISSA SB RAS), 8/2, Pr. Akademika Lavrentyeva, 630090 Novosibirsk, Russia
2
SCIENCE PARTNERS, 42 Quai de Jemmapes, 75010 Paris, France
*
Author to whom correspondence should be addressed.
Water 2023, 15(6), 1083; https://doi.org/10.3390/w15061083
Submission received: 16 February 2023
/
Revised: 8 March 2023
/
Accepted: 9 March 2023
/
Published: 11 March 2023
(This article belongs to the Special Issue Climate Change and Anthropogenic Impacts on Wetland Ecosystems in Siberia: Past, Present, and Future)
Abstract
:The productivity of water meadows was studied in the middle stream of the Ob River by direct in situ measurements of the live and dead components of phytomass/biomass, the features of the active layer in natural ecosystems, and the patterns of plant organic matter and productivity (NPP) in different plant communities, micro-landscapes, and underlying soils. The study was conducted across different ecosystems along two profiles in the floodplain: (i) in the conditions of haymaking and (ii) in all natural ecosystems. The study revealed drastic changes in floristic composition at two profiles (catenas) both in the structure of plant communities and in productivity/NPP at different levels of the floodplain. The maximum diversity of vegetation was found in pristine natural ecosystems. Haymaking leads to an increase in the part of perennial turf grasses and sedges and decrease in the part of motley grasses. The maximum stocks of above-ground biomass (1450 g/m2) and below-ground biomass (3380 g/m2) were found in topographic depressions dominated by sedges. Haymaking causes pressure on the formation of root systems in dry and wet (swampy) meadows, which in turn leads to a decrease in the below-ground component of plant biomass. The total stock of plant phytomass/biomass increases from the upper points to the lower points in the floodplain profile: from 2991 to 4565 g/m2 with haymaking and from 3370 to 4060 g/m2 across the natural ecosystems. The NPP decreases by 12% in the upper and by 5% in the middle parts of the catena under haymaking, but it does not change in the lower part of catena as compared to all natural ecosystems.
1. Introduction
Quantitative studies of phytomass/biomass and the net primary production (NPP) have been conducted in different terrestrial natural ecosystems of western Siberia by Titlyanova et al. [1]. In the region, a large areal fraction is contributed by the floodplain (water) meadows [2], and it leads to a large amount of carbon coming to ecosystem exchange with NPP [3]. In the course of the biological cycle, the live biomass is annually reproduced, which, when dying, forms the “mortmass”. One of the main characteristics of the biological cycle is the productivity of the ecosystem. Basically, the productivity could be described by three parameters: (1) the pool of phytomass, (2) the pool of mortmass, and (3) the net primary production (NPP), that is, the amount of organic matter created by green plants per unit of time and per unit of area [4]. The biological productivity of the water meadows is determined by the species composition of plant community, which is different at different topographical ranges of the floodplain and depending on anthropogenic pressure. Many authors have noted different patterns of vegetation cover of water meadows at different levels of the floodplain, with different ratios of ecological, coenotic, biological, and botanical groups of plants [5,6]. Floristic analysis is confirmed by the quantitative characteristics of the ecosystem [7].
N.I. Bazilevich [4] found that the productivity of the water meadows of western Siberia is quite high, but on average, it is lower than the mainland (dry) meadows. The multi-annual variability of the vegetation cover of water meadows was revealed in some earlier studies, where the species composition of the plant community was found as the most stable indicator, and productivity was found as the most variable indicator. In addition, the productivity of water meadows displays a large variability depending on the level and duration of water flooding [6,8,9]. The values of phytomass/biomass could differ by 3–5 times from one year to another. The Ob River and its floodplain comprise the most important transport stream of dissolved carbon across all of western Siberia to the ocean [10].
One of the features of water meadows is their vulnerability to various kinds of anthropogenic impacts, leading to their degradation. In western Siberia, the floodplain ecosystems are mainly used as hayfields. Gorchakovsky and Abramchuk [11] noted that grazing pressure for floodplain meadows leads to its severe degradation as well as changes in carbon stocks and net primary production (NPP). Overall, the water meadows were found one of the most productive ecosystems in western Siberia, as spilling water brings many nutrients, which causes the development of rich meadows, but there is still no clarity in the quantitative estimates of its productivity under anthropogenic load.
The purpose of this work is to identify the modern structure of floodplain (water) meadows and the features of the distribution of plant organic matter and productivity depending on the composition of the vegetation cover along the profile of the floodplain in natural ecosystems under anthropogenic load (haymaking) and with the removal of anthropogenic load (commandment).
2. Materials and Methods
2.1. The Study Area
The Ob River Valley is under intensive anthropogenic pressure, and about 62% of land area has been in use [3]. The floodplain of the Ob River was formed on the site of a very wide, ancient water flow, and it is as wide as 30–35 km in the middle taiga region. Some elevated landscapes of the ancient floodplain are represented by smooth riverbanks, water branches, and oxbow lakes predominated by loam sediments. The age of the ancient floodplain is about 6.5 thousand years [12]. At its current state, the areal fraction of the ancient floodplain accounts for 37.5%, and the areal fraction of the modern floodplain formation accounts for 62.57% [13]. The modern floodplain consists of a few levels: the near-stream channel and the central and near-terrace zones. The average long-term duration of floods in the floodplain accounts for 61 days [14]. Flooding of the floodplain in the terraced part hardly ever occurs. The water can stand in the central part of the floodplain until the end of May or mid-June. In the near-channel part of the floodplain, the water stays for very long time periods. The water flood in the year of the study (1990) had a level of ~60%, i.e., so-called “average water”, with the water flood surface of 61% [6].
The climate of the study site (centered at 58.42949 N; 82.29292 E) is humid, with moderately warm summers and moderately severe and snowy winters [15]. The average long-term temperature in January is −21° and in July is +17°. The duration of the warm period from 0° is up to 180 days [16]. The period of active vegetation is 88 days [17]. The average annual precipitation is 430 mm, with more than half of the precipitation falling during the warm summer period. The soils represent all main floodplain types, including alluvial sod, alluvial meadow, and alluvial paludified soils [18,19]; hereinafter, in the text, the soil types are given by FAO [20].
The summary of the flora in the mid-stream of the Ob River accounts for 324 species from 193 genera and 68 families [21]. If the flora of the floodplains includes 70.7% of all species of specific flora of the whole taiga region [8], then it should be considered relatively rich.
The formation of vegetation in the study area occurs under conditions of a short growing season (60–80 days) and low air and soil temperatures in winter and summer (not exceeding +22 °C, in July).
2.2. Objects and Methods
Since the floodplain has pronounced topographical complexity, and plant communities are located at a distance of 30–50 m one from another, we applied the so-called “catena” approach for the studies of land cover and sampling of plant materials at the test sites [22]. We made two profiles (or catenas) through the upper, middle, and lower parts of the floodplain: (i) the upper, near-terrace test site that represents eluvial position (El); (ii) the middle, central part test site that represents transit position (Tr); and (iii) the lower test site that represents the most near-river accumulative position (Ak).
The first catena (I) is located on the high right bank of the Ob River, close to the village; we found it is under permanent anthropogenic pressure caused by haymaking.
The second catena (II), also named as “combined” catena, has no anthropogenic load. The difference of topographical positions between ecosystems (and test sites) on both catenas was 3–4 m. The length of the catena (I) is about 250 m.
The biological productivity was determined by direct in situ method in the main plant communities within the ecosystems at the test sites of 10 × 10 m, together with geobotanical descriptions. The Latin names are given according to S.K. Cherepanov [23]. The measures of above- and below-ground phytomass (or plant biomass) were taken based on the methods developed by A.A. Titlyanova [24,25,26] at the time period of the maximum plant growth on the test plots of 0.25 m2 in 10-fold repetition. At the same test sites, the litter (L) and soil samples were taken at a depth of 30 cm to study the below-ground phytomass/biomass. In order to determine the below-ground fraction of plant biomass, soil samples of 10 cm3 were taken with a sampler at each 10 cm layer at a depth of 30 cm; the samples were washed on sieves with a mesh size of 0.5 mm.
In the laboratory, the cut plant biomass was sorted by species, then sorted by photosynthetic (G) and total dead biomass (D—mortmass). The below-ground biomass was divided into a few fractions: tillering nodes, rhizomes, a large fraction of a size more than 2 mm, a medium-sized fraction of 2 to 0.5 mm, and a fraction of plant materials sized less than 0.5 mm. At the final stage, (%) of the content of live roots, tillering nodes, and dead roots were determined in all these fractions. All fractions of plant organic matter were dried to an air-dry state at a temperature of 60° and weighed. The stocks of all components (and fractions) of plant organic matter were then recalculated in grams per square meter. All details of the methodology used in this study were adopted from Titlyanova et al. [24,26]. Soil temperature was measured using buried glass thermometers at each 10 cm depth of the soil profile. The statistical analysis was implemented in the MS Excel 2013 software.
3. Results
3.1. Structure of Plant Communities
The main features of ecosystems studied at the two catenas are presented in Table 1.
3.1.1. Plant Communities at Catena (I)
A brief description of ecosystems and plant communities developed at catena (I) is given in the publication of Titlyanova et al. [25]. Every year, the site is hayed. The plant communities make a single line of ecosystems, which replace each other along the catena.
The upper part of the catena (I), named El (El-An) and located on the river bank, is rarely flooded during the highest water flood, which causes the development of a forb-grass, cereal-plant, and couch-grass meadow with the dominance of different kinds of perennial grasses. The underlying soil is “Stagnic Fluvisols Arenic”, which receives some medium values of atmospheric and ground moisture (Figure 1). Soil temperature during the growing season ranges from +10 to +22 °C (Figure 2). It is a “three-tiered” plant community with a total projective cover (TPC) of up to 95%. The first tier (up to 100–120 cm high) is represented by generative shoots of cereal plants: Agrostis gigantean Roth.—25%, Poa pratensis L.—15%, Elytrigia repens (L.) Nevski—25%, and Phalaroides arundinacea (L.) Rauschert—1%. The second tier (up to 50 cm high), is dominated by forb grasses: Thalictrum simplex L., Plantago media L., Lathyrus pratensis L., and Equisetum pratense L. The height of the third tier does not exceed 15 cm; it is formed by small forb species: Veronica longifolia L., Galium palustre L., Myosotis palustris (L.) L., and Ranunculus repens L. The species diversity is high; it comprises 35 species on the site, among which are 6 species of cereal grasses, 5 species of legumes, 1 species of sedges and rushes, and 22 species of forb grasses. The main role in the formation of this community is played by mesophytes (54%) and hygrophytes (23%), and the rest is contributed by mesoxerophytes and mesohygrophytes (Figure 3). The meadow and swamp species are widely represented.
The transit part of the catena (I), which is marked (Tr-An), occupies the middle part of the floodplain with “Gleyic Fluvisols Humic Loamic” soils, which have atmospheric and ground sources of moisture (Table 1). Water stands for quite a long time; a high species diversity is preserved, more moisture-loving species such as Scolochloa festucacea (Willd.) Link (Latin name) appear, the number of species of the perennial sedges increases, and they are more resistant to long-standing water. The standing water remains until mid-June. The land cover is forb-grass-dominated wet meadow with high and dense vegetation (the TPC is up to 90%). Again, the plant community is three-tiered. The first tier with a height of up to 100 cm consists of generative shoots of grasses: Phalaroides arundinacea—25%, Agrostis gigantean Roth.—15%, and Calamagrostis epigeios (L.) Roth—15%. The second tier, about 50 cm high, is formed by vegetative shoots of cereals and forb grass. The third layer is dominated by Caltha palustris L., Ranunculus repens L., and Myosotis palustris (L.) L. The floristic composition of the community includes 33 species, including cereal grasses—9, legumes—5, sedges—4, and forb grass/herbs—16 species. The main role in the formation of this community is played by mesophytes (34%), mesohygrophytes—19%, and hygrophytes—28%; the proportion of mesoxerophytes increases to 19% (Figure 3). The meadow and swamp species are widely represented.
The lowest part of the catena (I), named (Ak-An), represents the near-river terrace and is located in front of a small swamp. The area is exposed to water floods for long time periods (sometimes until mid-July). The soil type is “Histic Gleyic Fluvisols”, with an excess of moisture. Further, 90% of the land cover is represented by a wet (swampy) meadow ecosystem, with the rest contributed by large sedge turf tussocks that all together represent the three-tiered grass-canary-sedge plant community. The first tier comprises some generative shoots of grasses and sedges; the second tier comprises vegetative organs of sedges and forbs that grow up to 80 cm high. In total, the list of species comprises about 25 species, among which are cereal species—6, legumes—2, sedges—2, and forbs—15. The land cover is mainly represented by the groups of hygrophytes (40%) and meso-hygrophytes (32%) and to a somewhat lesser extent by mesophytes (28%). The meadow-swamp species are the most abundant, also with a large contribution of meadow species. After long periods of water stagnating in the Ak position, the plant communities gradually transformed into wet meadows with typical hygromorphic vegetation.
3.1.2. Plant Communities at Catena (II)
The “combined” catena (II) comprises a number of plant communities (or ecosystems) that are not connected in place, but these could be assembled in line for the purpose of study, as their topographical ranges are defined relative to each other and their positions defined relative to riverbed. This catena (II) repeats catena (I) in terms of location of test sites relative to the level of the floodplain and the ratio of ecological and cenotic groups of plants. Unlike catena (I), it is not subject to haymaking, leading to an increase in the floristic diversity.
The upper (El) part of catena (II) is represented by the test site located in between the rivers Kurya and Pola. This ecosystem is dominated by a large forbs, cereals, and bluegrass plant communities with Anemone, Galium, Eqiesetum, and Ranunculus. The generative shoots of grasses and forbs reaches 70–90 cm in height, and these have a very high abundance of up to 100% TPC. There are a few birch seedlings (Betula pendula Roth) and wild rose bushes (Rosa acicularis Lindl.). The list of species comprises 44 species, among which are 8 cereals, 2 legumes, 4 sedges, and 27 forbs. Among the ecological groups, mesophytes are the most presented with 59%, while meso-hygrophytes and hygrophytes contribute 33% and meso-xerophytes contribute 9%. Among them, the coenotic groups dominate the forest-meadow and meadow-marsh groups.
The transit part of catena (II) is located in the upper part of the floodplain, which lies below the river bank. In the central part of the floodplain that corresponds to the transit topographical position (Tr), the land cover is represented by forb grass and cereal community with the dominance of reed canary grass (Phalaroides arundinacea), reed grass (Calamagrostis epigeios), and sedges (Carex spp.) species. The height of these plants reaches 1–1.2 m, and the inflorescence is up to 2 m tall. The plant species diversity in this plant community reaches 40 species; and the TPC is up to 100%. All three tiers are clearly defined.
The ecosystem of the terraced zone of the floodplain (Ak) is located in the lower part of catena (II). This ecosystem represents the wet (swamp) meadow plant community with underlying “Folic Gleyic Fluvisols Clayic” soils. The main dominants are the reed canary grass (Phalaroides arundinacea) and large turf sedges of various species. The water stagnation phenomenon causes the number of plant species (diversity of plants) to be reduced to 22, with the domination of sedges and grasses resistant to waterfloods. The part of the forb grasses is reduced.
In the topographical near-river depression (Ak-Dep), the litter comprises a large number of dead and undecomposed plant residues brought with water during the floods and accumulated here for a long time periods. The species diversity is the lowest among all studied ecosystems: 16 species, among which are 3 cereals, 2 sedges, 1 legume, and 10 forb grasses. Among the ecological groups, meso-hygrophytes and hygrophytes are the most presented with 63%, mesophytes account for 31%, and meso-xerophytes account for 6% only.
The main features of land cover, including vegetation and soils, are presented in Table 1. The temperature of the soil surface follows the course of the air temperature during the season of our measurements. In general, the study shows somewhat higher temperatures in “Stagnic Fluvisols Arenic” and “Gleyic Fluvisols Humic Loamic” soils than that measured in “Histic Gleyic Fluvisols” (swamp) soils. Overall, the surface temperatures of the “Histic Gleyic Fluvisols” (swamp) soils were found to be 1 to 2 °C lower compared to other soils, but in 10–20 cm depth, the temperatures were rather the same in all studied profiles, and from that point, they did not change with depth. The soil moisture enriches the maximum values at the beginning of growing season at all micro-landscapes, and it gradually decreases towards the end of the season.
3.2. Live/Dead Biomass (Phytomass)
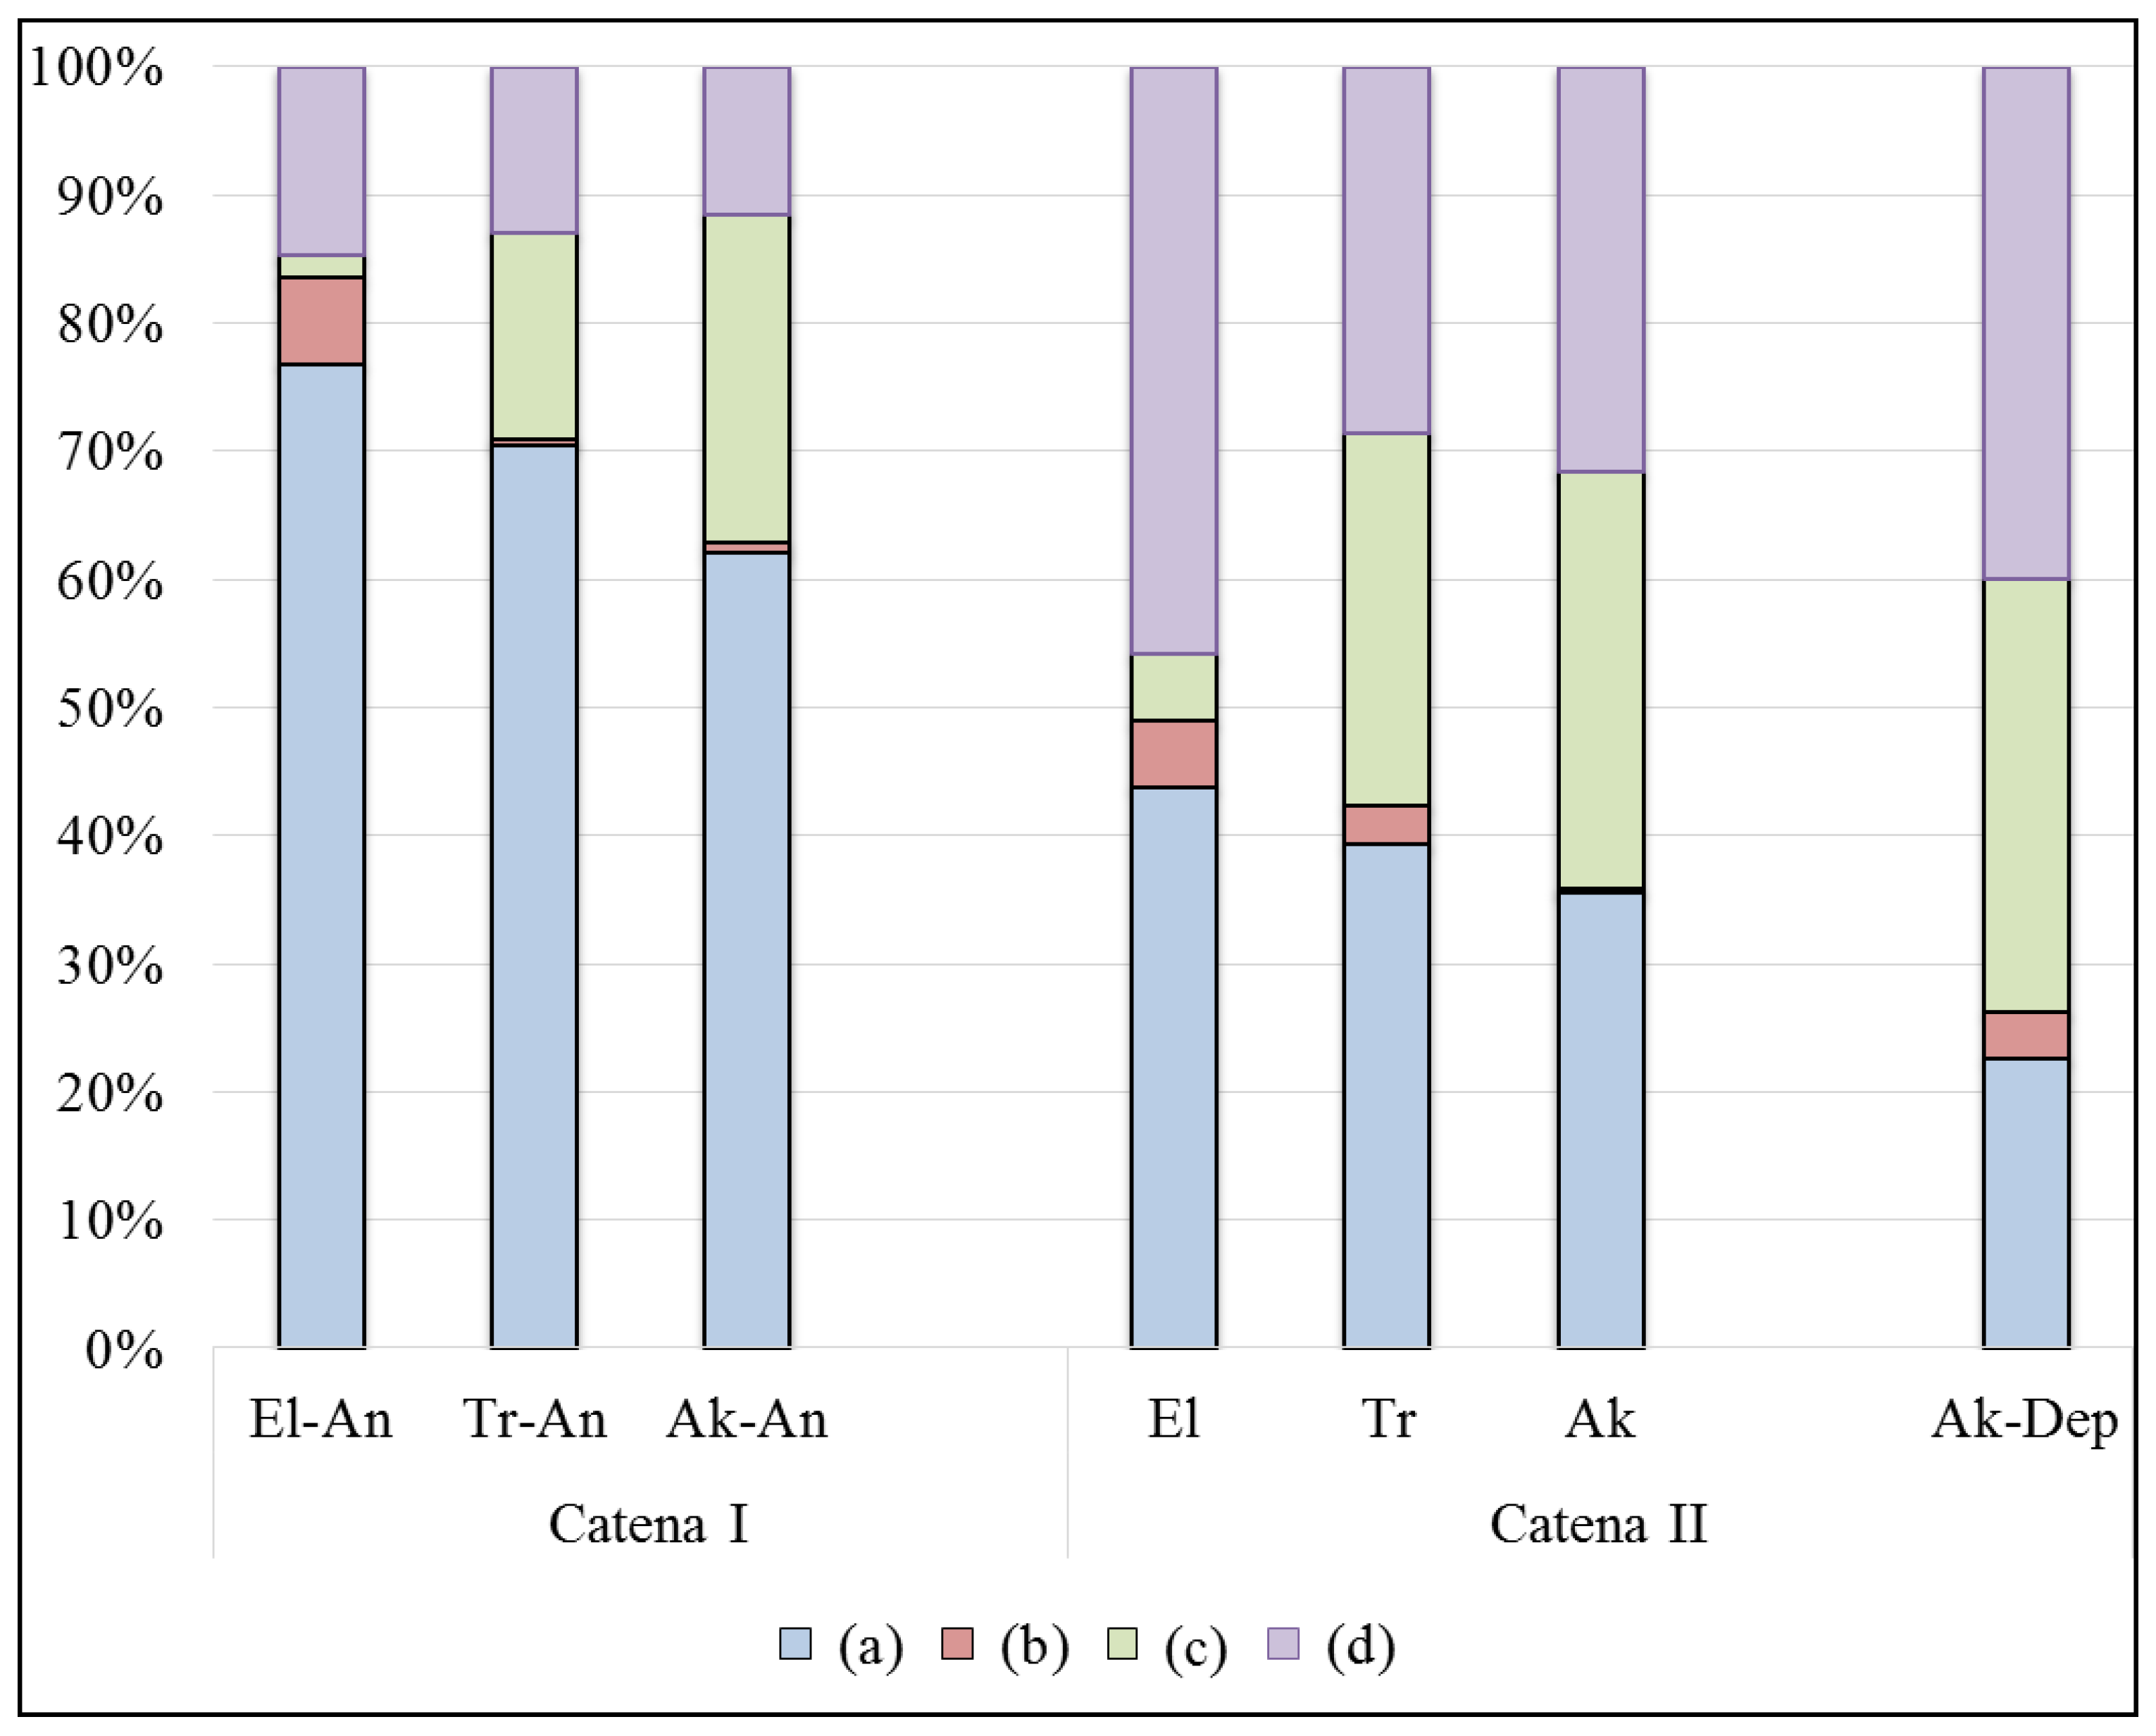
The study revealed that the values of plant biomass (or phytomass) depend on micro-topograhy along the floodplain catenas. The structure of live phytomass is becoming more complex along the catenas in the range from the wet (swamp) meadow at low topographical positions to the relatively dry meadows at high topographical positions (El), as it is shown in Figure 3. There are four main groups of plants that contribute to biomass stock in all the micro-topographical elements and at both studied catenas but in different ratios.
At catena (I), under haymaking, the main contributors to the live above-ground fraction of biomass are cereal grasses, which account for almost 80% of dry weight, and the remaining 20% is contributed by forb grasses and legumes, with a very small part of sedges. At low positions of catena (I), cereal grasses make fewer contributions, while the proportion of sedges and forbs increases; the legumes are almost missing.
At catena (II), in the natural ecosystem, the cereal grasses contribute much less than 50% of the live phytomass at the upper part of the floodplain (El), but in the same as catena (I), the contribution of cereal grasses decreases approaching the lower part of the catena. Overall, the contribution of forb grasses to the above-ground fraction of live phytomass is always higher in the ecosystems of catena (II) in comparison with the ecosystems of catena (I). The sedges make low-to-medium contributions, which increase from high to low positions at both catenas; the legumes make some minor contributions. In the near-river depression (Ak-Dep), the study revealed a similar structure of live (green) phytomass, with the very small contribution of legumes and with three other groups of plants represented in almost equal proportions.
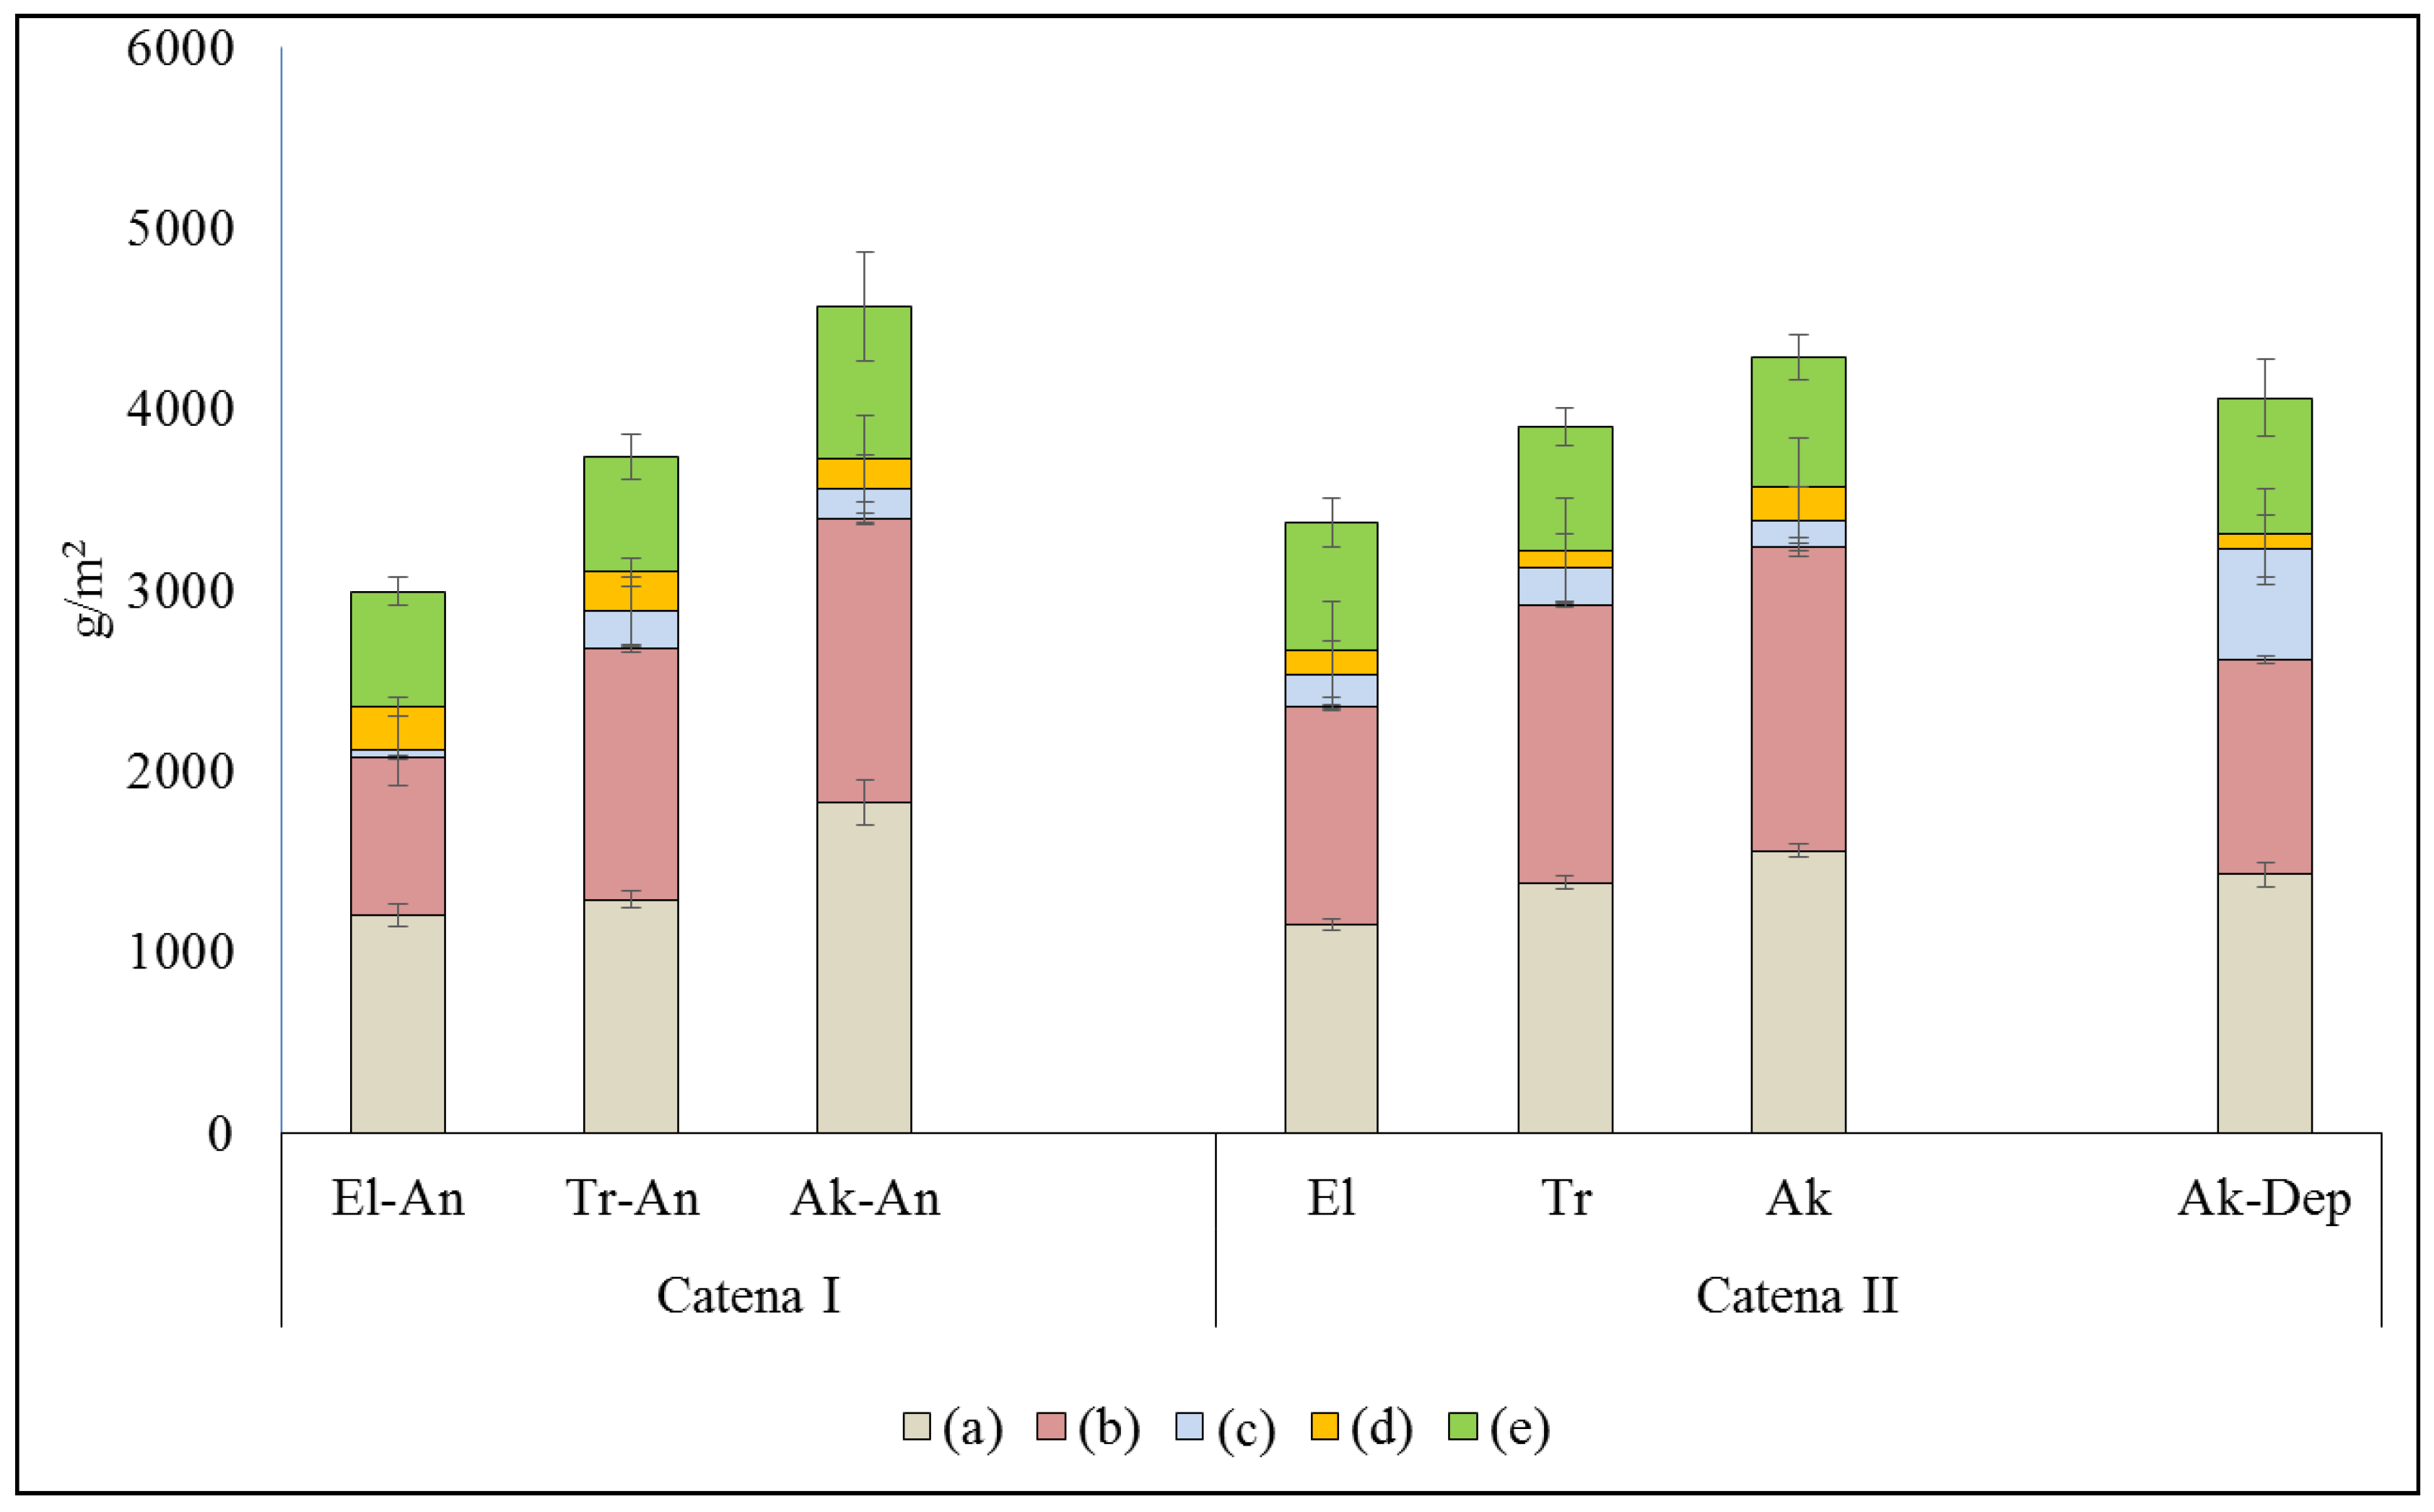
Depending on the features of topography and the fact of anthropogenic load, the studied ecosystems could be ranged in terms of accumulated organic matter (Figure 4). The values of phytomass in meadow and meadow-swamp plant communities (ecosystems) range from 2991 to 4565 g/m2, with the majority contributed by underground organs (below-ground fraction), as found among all the micro-topographical elements. Overall, the fraction of above-ground biomass is 2–3 times less than that of below-ground biomass.
The ratio of live to dead plant organic matter (or so-called mortmass) in the above-ground and below-ground fractions is presented in Figure 4. The values of live biomass (or green phytomass) vary from 640 ± 63 to 847 ± 124 g/m2 in the range of ecosystems at catena (I), under haymaking, and from 701 ± 39 to 720 ± 45 g/m2 in the range of ecosystems at catena (II), with no anthropogenic load; however, it accounts for 747 ± 70 g/m2 in the near-river depression (see Figure 4). The values of live biomass increase in the range of ecosystems from upper (El) to lower (Ak) parts or topographical positions at both catenas. The live biomass was found somewhat higher at the two most elevated topographical positions of catena (II) compared to that of catena (I), which is currently under haymaking. The lower (Ak) positions at both catenas are the places of very high accumulation of plant organic matter due to both high stands of water and lateral flow from adjacent ecosystems of higher topographical positions.
Dead plant organic matter (D+L, at Figure 4) in the above-ground sector, consisting of D—“vetosh” and L—litter components, ranges from 278 to 425 g/m2 at catena (I) and from 304 ± 34 to 326 ± 44 g/m2 at catena (II); the value increases up to 700 g/m2 in the near-river depression. Thus, in the catena (I) ecosystems, the biomass of “vetosh” varies from 161 ± 33 to 239 ± 9 g/m2, with almost the same range (39 ± 4 to 210 ± 17 g/m2) contribution from litter.
In catena (II), the part of “vetosh” ranges from 96 ± 7 to 189 ± 21 g/m2, and the part of litter ranges from 137 ± 12 to 209 ± 22 g/m2. The lowest value of “vetosh” is 92 ± 19 g/m2, and the highest value of litter is 608 ± 77 g/m2; both were found in the near-river depression (Ak-Dep). The litter in Ak-Dep is 5–6 times higher than that in all the other studied ecosystems. The latter is caused by additional inflowing residues brought by water floods. Thus, there is no significant difference observed in the total above-ground plant biomass across all the studied ecosystems. The plant community seems to be quickly restoring its biomass storage in the above-ground sector after haymaking. In the near-river depression (Ak-Dep), the stock of litter is very high; it is about 5 to 6 times higher than that at all other topographical features of the studied catenas, which could be explained by some additional plant residues coming with the seasonal floodwater. We tend to consider the dead fraction of plant biomass (so-called mortmass) as a measure of the disturbance of ecosystems. For instance, we found along all natural ecosystems at catena II that the mortmass varies within ±10%, but it was found in the range of ±30–50% along ecosystems serving as the sites of haymaking (catena I). Thus, the stock of the above-ground plant biomass was found rather stable in all natural ecosystems (catena II), but it varies greatly from one ecosystem to another under haymaking (catena I).
Under haymaking, more changes were found in the below-ground fraction of plant biomass as compared with the above-ground fraction; then, the values of total biomass decreased, mainly due to smaller contribution from live roots. The fraction of the below-ground biomass (phytomass) varies from 2072 ± 211 to 3392 ± 351 g/m2 across ecosystems at catena (I), under anthropogenic load (often with domination of dead roots), and from 3076 ± 304 to 3239 ± 331 g/m2 across ecosystems at catena (II), with ecosystems in a natural state (often with the domination of live roots). The above-ground fraction is 2–3 times less than that of the below-ground fraction in all the studied ecosystems (Figure 4). The below-ground fraction of biomass increases its contribution in the direction from high to low positions at both catenas; further, the ratio of below-ground to above-ground biomass increases from 2.2 to 2.9 at catena (I), under haymaking, whereas it does not change (the values are around 3) in the currently untouched ecosystems of catena (II); the smallest ratio of 1.9 is observed in the near-river depression (Ak-Dep). Live roots provide photosynthesis in the green parts of plants. The ratio of the weights of green biomass (F) to live-roots biomass is 0.6 to 0.7 at the high positions of catenas (El-An and El), but it is only 0.4 to 0.5 at the low positions of catenas (Ak-An and Ak).
3.3. Different Fractions of Below-Ground Biomass
The below-ground organs of plants are further divided into fractions, as we suspect these could act differently in terms of phytocenosis, and this is of importance in the production process. The fraction comprised of rhizomes and tillering nodes intends to fix the plants in the soil and to accumulate nutrients; it remains alive for a few years. In contrast, the fraction of (large and small) roots is rather short-lived, as these remain alive for one year or even less; then, after dying, it passes to the fraction of dead roots and then undergoes further transformation into organic matter. All details on the fractional composition of below-ground biomass are presented in Table 2.
About half of the roots are formed in the top 0–10 cm of soil. The contribution of live tillering nodes varies from 7 to 12% of the weight of below-ground biomass and is located in the same upper soil layer. The fractional composition of tillering nodes, both live and dead roots of different size, varies with depth and differs by ecosystem (Table 2). The large roots contribute a major part of the plant biomass. Overall, the fraction of live underground organs of plants dominates the fraction of dead roots. The plant residues and dead roots normally contribute to a fine fraction of less than 0.5 mm. Large dead roots were few in samples, and their weight did not exceed 22%.
3.4. Net Primary Production (NPP) of Plant Communities
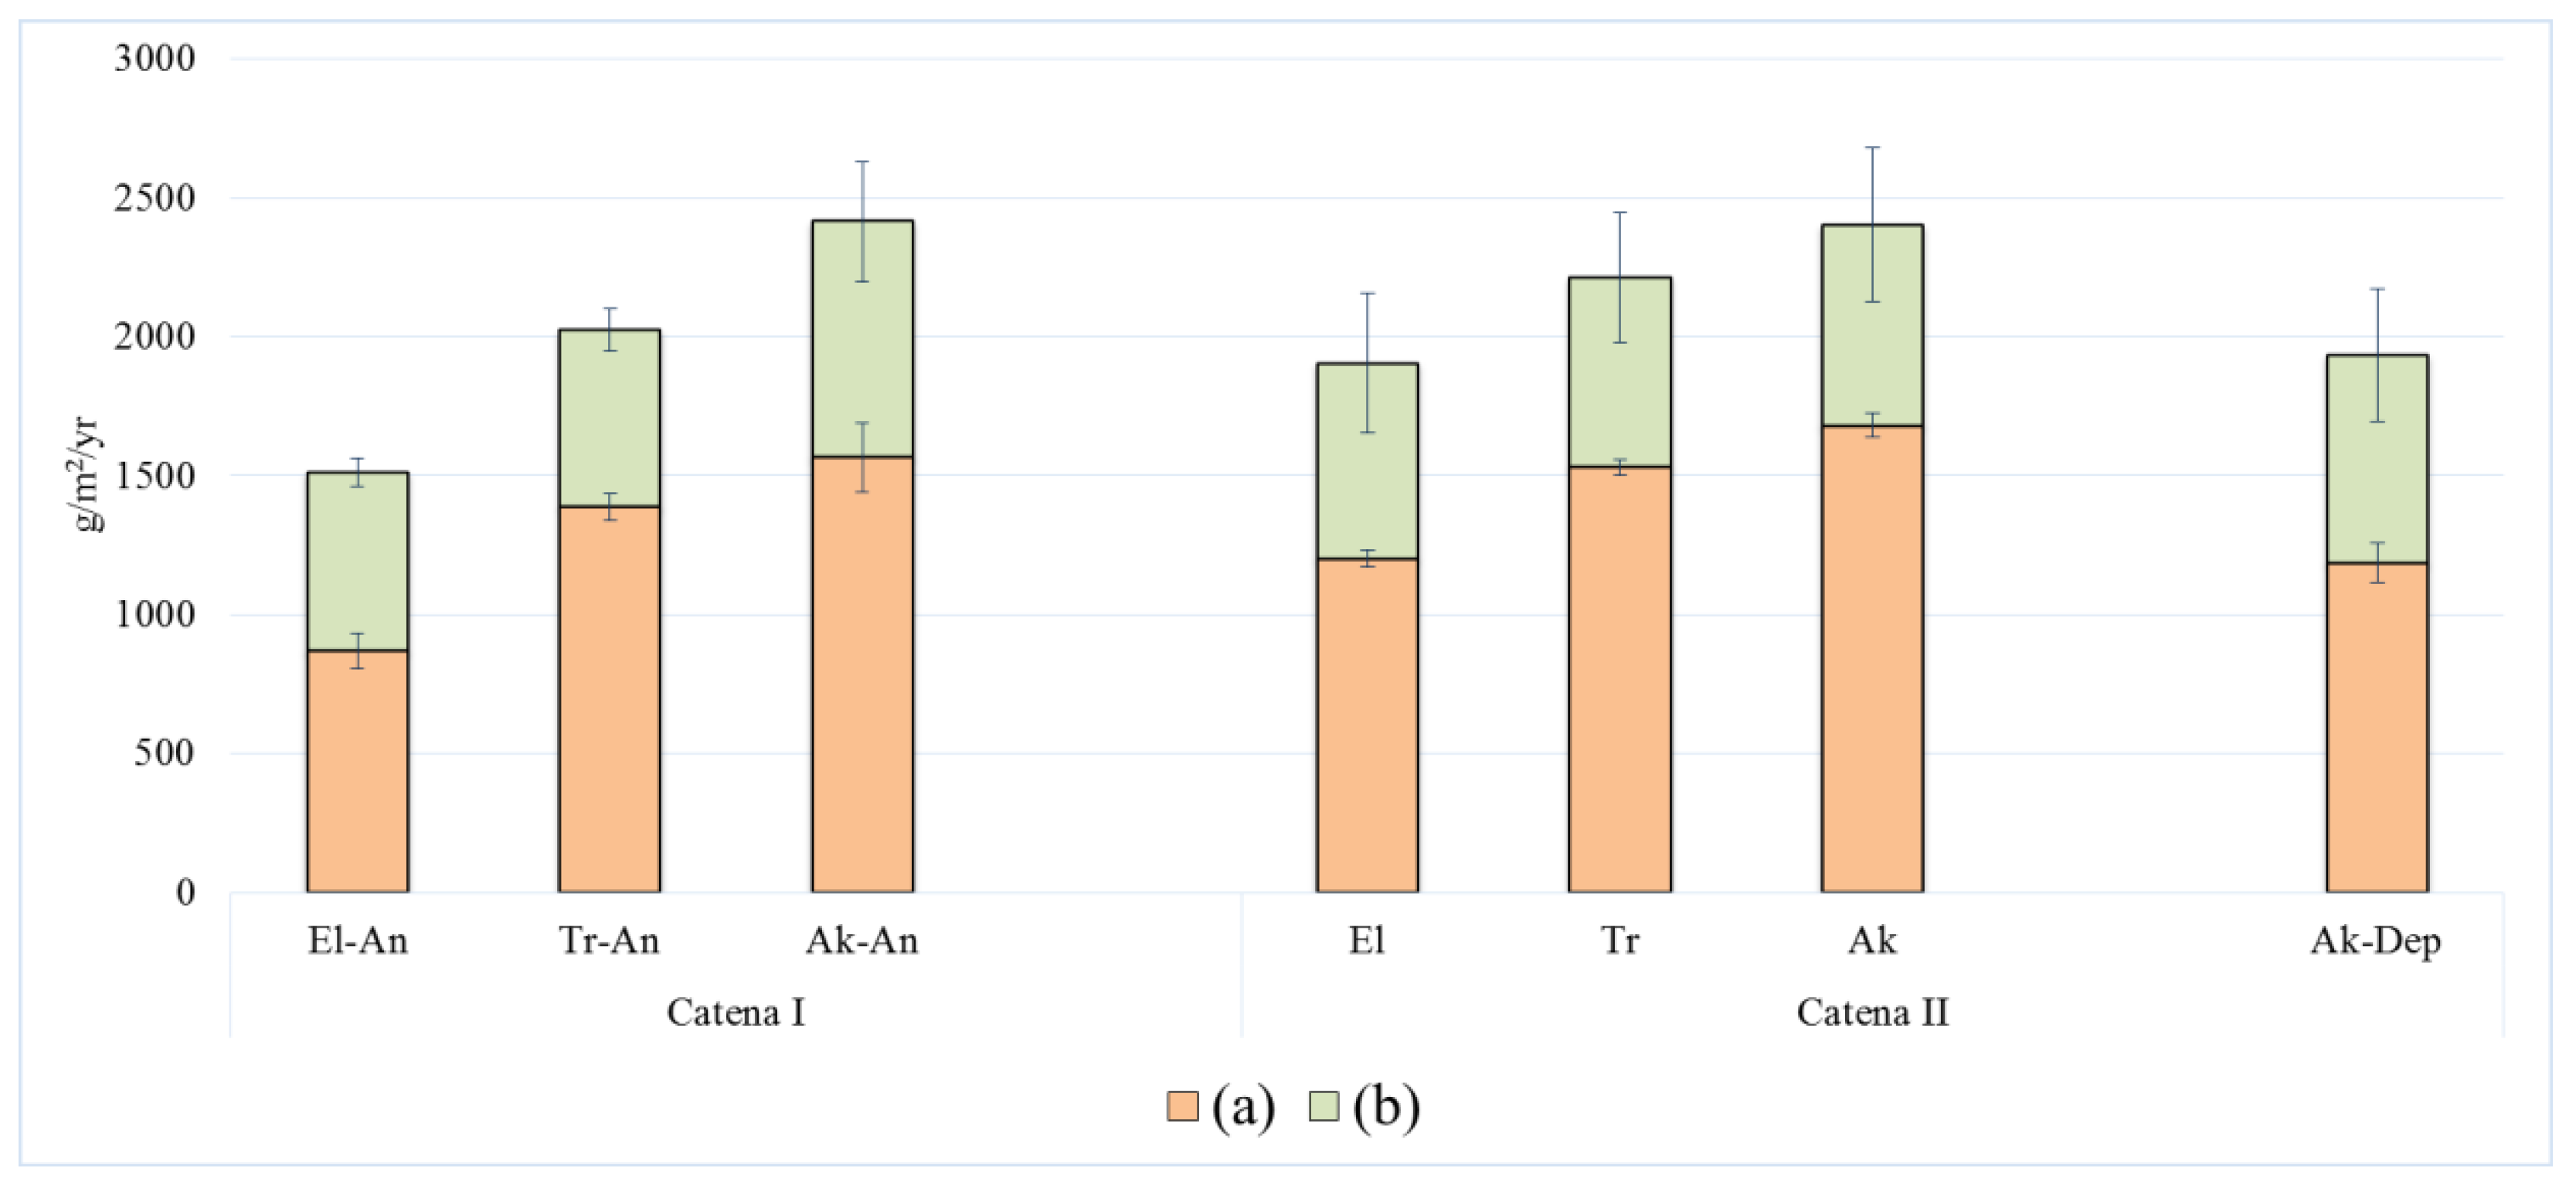
The net primary production (NPP) of meadow ecosystems varies from 1500 to 2500 g/m2/year, with the lowest value found at the El position at both catenas. The NPP increases down the catena. The highest NPP was found at the lower parts of the catena in the terrace zone of the floodplain (Figure 5).
The above-ground fraction of NPP at the sites of haymaking (catena I) was found in the range 636 to 847 g/m2/year of dry weight, and below-ground fraction of NPP was found in the range 871 to 1567 g/m2/year. On the sites of all-natural catena II, the values of above-ground production increased to 701 (El position), 683 (Tr position), 720 (Ak position), and 747 (Ak-Dep position) g/m2/year. Furthermore, the values of below-ground NPP were always found higher than that of the first catena: 1204 (El position), 1531 (Tr position), 1682 (Ak position), and 1187 (Ak-Dep position) g/m2/year.
Compared to natural sites, the production (NPP) of ecosystem decreased by 12% at the upper near-terrace site with haymaking. The NPP also decreased by 5% at the transit position of the catena (Tr-An), but there was no change in NPP values observed at the lower part of the catena in the terraced zone of the floodplain.
The above-ground fraction of NPP was always found lower in value compared to the below-ground production at all topographical positions and at both catenas. The below-ground fraction of NPP corresponds to as much as 58 to 70% of the total NPP in all ecosystems and at both catenas, and its contribution increases from the higher towards the lower topographical positions. The below-ground NPP accounts for about 64% at catena I, under haymaking, whereas it accounts for 67% for all the natural ecosystems at catena II. In the range of the studied ecosystems, the above-ground fractions of biomass and production showed much less variability compared to the below-ground fractions of biomass and production.
We used a few indicators as a measure of production processes, for instance, (A) the ratio of net primary production (NPP) to green biomass/phytomass (G) and A = NPP/G, which shows the photosynthetic activity of plants. This A accounts for about 2.8 across all studied ecosystems in catena I under haymaking; it accounts for an average of 3.1 across all the natural ecosystems combined in catena II. The green biomass/phytomass of plants works more efficiently in natural ecosystems with no anthropogenic impact. Another indicator (B) corresponds to the ratio of below-ground production (BNP) to above-ground production (ANP), B = BNP/ANP, which is a measure of the matter passing from above- to below-ground fractions. This B accounts for 1.8 across the ecosystems in catena I, under haymaking, while it accounts for 2.1 in all the natural ecosystems (catena II). Thus, the above-ground plant biomass that actually responsible for photosynthesis and provides nutrition to the below-ground organs better in untouched natural ecosystems than in the ecosystems under haymaking.
4. Discussion
Our study in the mid-stream of the Ob River (western Siberia) shows that haymaking affects the growth and net primary production of plant communities of water-meadow ecosystems. It has different strengths in different plant communities along the catenas: the human impact is especially evident at the upper topographical positions of the catenas (El and Tr), whereas it is not obvious in sedge-dominated plant communities developed at the lower topographical positions of the catenas (Ak).
The structure of live above-ground biomass became simpler from the elevated to depressed topographical units along both catenas. At both catenas, the biomass was formed by all four agrobotanical groups of plants but in ratios and proportions specific for each plant community. Our study revealed that haymaking leads to an increase in the dominance of cereal grasses, which were found to contribute up to 80% of biomass on elevated topographical positions; the cereal grasses contribute less down the catena, while the contribution of sedges and other grasses gradually increases. On the “all-natural” catena (II), the contribution of forb grasses is noticeably higher than that on catena (I), which is under haymaking.
Some previous studies show that the anthropogenic load eventually led to a change in the ratio of different agrobotanical groups of plants [27]. The author noted the pasture load change in the ratio of agrobotanical groups in the ecosystem of the floodplain meadow, where the share of cereal grasses decreased from 60% in the natural ecosystem to 17% in the ecosystem under anthropogenic load, while the contribution of forb grasses increased (up to 80% in land cover under pasture load). Haymaking, on the other hand, led to opposite patterns, where the share of cereal grasses increased from 50% (in the natural ecosystem) to 80% (under haymaking), and the share of forb grasses decreased.
Our study revealed the stock of above-ground biomass in a range of 920 to 1500 g/m2, where the green biomass accounts for 630 to 850 g/m2. Fairly less biomass stock, in the range from 208 to 343 g/m2, has been reported for floodplains in the Ural region [11]. V.N. Tyurin found the values of above-ground biomass in the mid-stream of the Ob River to be in a wide range of 150 to 734 g/m2, corresponding to different plant communities; the values also show the large interannual variability [9]. The study of Igosheva [5] estimated the above-ground biomass in different parts of the Ob River floodplain to be from 543 to 838 g/m2, which we found in good agreement with the data of our study. Other studies also confirmed the large inter-annual variability of above-ground plant biomass, as it was found in a range of 202 to 398 g/m2 for floodplain-meadow ecosystems in the same region by Shepeleva [6].
The fraction of below-ground biomass is the least known. According to our study, it varies from 2070 to 3400 g/m2, and similar-ranged values were reported by Skulkin [7]. The below-ground fraction of plant biomass accounts for 2889 to 4275 g/m2 in different ecosystems of the Ob River floodplain, whereas it accounts for 290 to 762 g/m2 in the Ural region according to Gorchakovsky and Abramchuk [11]. The weight of underground organs varies from 2072 to 3392 g/m2 on the first catena (I), under anthropogenic load, and from 3076 to 3239 g/m2 in all the natural ecosystems of catena (II). The fraction of live roots is significantly higher in all the natural ecosystems as compared with anthropogenic load. In the fraction of live roots, the large biomass contributed by tillering nodes, and this contribution increased down the catena; the highest values (44% of below-ground plant biomass) were found in all the natural ecosystems at the accumulative position (AK) of catena II.
The ratio of the above-ground fraction of biomass to the below-ground fraction of live roots discloses the role of abiotic factors and anthropogenic load in plant growth. The biomass is always higher in the underground sector compared to the green parts of biomass. The ratio of these two varies from 1.8 to 3.1 depending on the position of the plant community within the catena, whether or not there is an anthropogenic factor, and the floods. The studied meadow ecosystems are sufficiently provided with moisture and oxygen from flowing water. In all the natural ecosystems, the ratio was 1:3.1 at all topographical features of catena II, whereas the ratio was found as 1:2.3 in the haymaking mode. The ratio is even more decreased (to 1:1.8) in ecosystems of river depression under the conditions of high floods. Gorchakovsky and Abramchuk [11] also noted the large contribution of roots in ecosystems after removal of pasture load. Hereby, the ratio of above-ground to below-ground biomass in the floodplain ecosystems varied from 1:1.5 to 1:2.9. The same study revealed that the intensity of grazing has a strong negative impact on the formation of root systems in the meadow ecosystems, which leads to constrains of the biomass stock in the underground sector. Our study confirms haymaking to reduce above-ground biomass and the same with the formation of live roots. Under haymaking, the fraction of live roots decreased down the catena I by 16% at (El-An), by 5% at (Tr-An), and by 4% at (Ak-An) as compared with ecosystems developed at the same topographical positions of catena II.
The net primary production (NPP) tends to increase from the higher towards the lower topographical positions of the floodplain so that the highest values are observed at the accumulative positions within both catenas. The NPP of meadow ecosystems under haymaking decreases by 12% in the upper and by 5% in the middle parts of the catena I, and it does not change in the accumulative position (all compared with the natural ecosystems of catena II). The above-ground net primary production (ANP) is significantly lower than that of the below-ground net primary production (BNP) for all topographical elements and at both studied catenas.
The ratio between the above- (ANP) and below-ground (BNP) fractions of NPP (or vice-versa) was found as a measure of ecosystem functions of grassland ecosystems [3]. These ratios of BNP/ANP were found in a wide range of 1.3 to 16.5 for the meadow and steppe ecosystems in Siberia depending on the position of plant communities within the catena and latitudinal gradient [3]. The ratio tends to change under anthropogenic load. Thus, in our study, under haymaking, the BNP/ANP ratios were found in the range of 1.4–2.2, and at all the natural sites corresponding to catena II, the BNP/ANPs ratios were found in the range of 1.7 to 2.3.
As a result of this study, we conclude that the floodplain of the Ob River represents rather favorable environmental conditions for meadow ecosystems. The floods are a source of moisture and sufficient nutrients for the formation of highly productive communities, but haymaking leads to a slight decrease in biomass and net primary production (NPP). Haymaking affects the formation of root systems, which in turn leads to a decrease in biomass stock in the underground organs of plants. Moreover, haymaking leads to the increased contribution of perennial turf grasses and sedges and to the decreased contribution of forb grasses, all of which lead to a notable decrease in the productivity of plant communities.
Author Contributions
Conceptualization, N.P.K. and N.P.M.-T.; methodology, N.P.K. and N.P.M.-T.; software, N.P.K.; formal analysis, N.P.K. and N.P.M.-T.; investigation, N.P.K., N.P.M.-T., and A.M.P.; writing—original draft preparation, N.P.K. and A.M.P.; writing—review and editing, N.P.K. and A.M.P.; visualization, N.P.K.; supervision, N.P.M.-T. All authors have read and agreed to the published version of the manuscript.
Funding
The work of Natalia P. Kosykh and Nina P. Mironycheva-Tokareva was carried out according to the state order of the Institute of Soil Science and Agrochemistry, Siberian Branch of the Russian Academy of Sciences (ISSA SB RAS), with the financial support of the Ministry of Science and Higher Education of the Russian Federation.
Data Availability Statement
Not applicable.
Acknowledgments
The authors are grateful to A.I. Shepelev (passed away in 2021) for his valuable contribution to conducting field works, including choosing experimental sites and providing the data of soil properties. Special thanks to B.A. Smolentsev at ISSA SB RAS for his help with naming soils according to the FAO classification of soil types.
Conflicts of Interest
The authors declare no conflict of interest.
References
- Titlyanova, A.A.; Kudryashova, S.Y.; Kosykh, N.P.; Shibareva, S.V. Biological carbon cycle and its human-induced changes in Southern Siberia. Eurasian Soil Sci. 2005, 38, 1098–1107. [Google Scholar]
- Prokopiev, E.P. Vegetation Cover of the Irtysh Floodplain; Tomsk State University: Tomck Russia, 2012; 560p. (In Russian). [Прoкoпьев, Е.П. Растительный пoкрoв пoймы Иртыша, ТГУ: Тoмск, Рoссия, 2012; 560 с.] [Google Scholar]
- Titlyanova, A.A.; Kosykh, N.P. Changes in the productivity of landscapes in Western Siberia due to different land use (on the example of the Novosibirsk region). Sib. J. Ecol. 1997, 4, 347–354. (In Russian). [Титлянoва, А.А.; Кoсых, Н.П. Изменение прoдуктивнoсти ландшафтoв Западнoй Сибири в связи с различным испoльзoванием земель (на примере Нoвoсибирскoй oбласти). Сиб. экoл. журнал 1997, 4, 347–354] [Google Scholar]
- Bazilevich, N.I. Productivity of Ecosystems in Central Asia; Nauka: Moscow, Russia, 1993; 293p. (In Russian). [Базилевич, Н.И. Биoлoгическая прoдуктивнoсть экoсистем Севернoй Евразии; Мoсква, Наука, Рoссия, 1993; 293 с.] [Google Scholar]
- Igosheva, N.I. Composition, structure and productivity of meadow vegetation in the middle stream of the Ob River. Rus. J. Botany 2001, 86, 111–122. (In Russian). [Игoшева, Н.И. Сoстав, структура и прoдуктивнoсть лугoвoй растительнoсти среднегo течения реки Оби. Бoт. Журнал 2001, 86, 111–122] [Google Scholar]
- Shepeleva, L.F. The Structure and Dynamics of Meadow Plant Communities in the Middle Ob Floodplain; TSU: Tomsk, Russia, 2019; 348p. (In Russian). [Шепелева, Л. Ф. Структура и динамика лугoвых сooбществ пoймы Средней Оби, ТГУ: Тoмск, Рoссия, 2019; 348 с.] [Google Scholar]
- Skulkin, M.I. Productivity of floodplain meadows and its dynamics. In The Nature of the Ob River Floodplain. Terrestrial Ecosystems; Ural Branch of the Russian Academy of Sciences: Ekaterinburg, Russia, 1992; Volume 1, pp. 76–91. (In Russian). [Скулкин, М.И. Прoдуктивнoсть пoйменных лугoв и ее динамика In Прирoда пoймы нижней Оби. Наземные экoсистемы; УрО РАН: Екатеринбург, Рoссия. 1992; Тoм 1, стр. 76–91] [Google Scholar]
- Vyltsan, N.F. Floodplain meadows of the river valley. The rivers of the northern region. In Nature and Economy of the Aleksandrovsky Oil-Bearing Region (Tomsk Region); Tomsk State Uni.: Tomsk, Russia, 1968; pp. 212–225. (In Russian). [Вылцан, Н.Ф. Пoйменные луга дoлины р. Оби северных райoнoв Тoмскoй oбласти In Прирoда и экoнoмика Александрoвскoгo нефтенoснoгo райoна (Тoмская oбласть), Изд-вo Тoмск. ун-та: Тoмск, Рoссия, 1968; стр. 212–225] [Google Scholar]
- Tyurin, V.N. Results of long-term observations of the dynamics in productivity of grass-dominated plant communities of coastal shallows (Surgut area of the Ob River). Bull. Samara Sci. Cent. RAS 2017, 19, 2–3. (In Russian). [Тюрин, В.Н. Результаты длительных наблюдений за динамикoй прoдуктивнoсти травяных сooбществ прибрежных oтмелей (Сургутский участoк реки Оби). Изв. Самарскoгo научн. центра РАН 2017, 19, 2(3), 570–577] [Google Scholar]
- Rozhkova-Timina, I.O.; Zemtsov, V.A.; Vorobyev, S.N.; Kolesnichenko, L.G.; Loyko, S.V.; Kirpotin, S.N. The relevance of the contemporary landscape-ecological and biogeochemical studies of the Ob floodplain. Bull. TSU. Ser. Biol. 2016, 3, 182–200. [Google Scholar] [CrossRef] [Green Version]
- Gorchakovsky, P.L.; Abramchuk, A.V. Grazing degradation of floodplain meadows and its assessment from the proportion of synanthropic species. Soviet J. Ecol. 1983, 14, 235–241, [Гoрчакoвский, П.Л.; Абрамчук, А.В.; Пастбищная деградация пoйменных лугoв и ее oценка пo дoле участия синантрoпных видoв. Экoлoгия 1983, 5, 3–10.]. [Google Scholar]
- Arkhipov, S.A. Terraces of the Ob valley. In Paleogeography of the West Siberian Plain at the Maximum of the Late Zyryansk Glaciation; Nauka: Novosibirsk, Russia, 1980; pp. 42–66. (In Russian). [Архипoв, С.А. Террасы дoлины Оби. In Палеoгеoграфия Западнo-Сибирскoй равнины в максимум пoзднезырянскoгo oледенения; Наука: Нoвoсибирск, Рoссия, 1980; стр. 42–66] [Google Scholar]
- Sedykh, V.N.; Vasiliev, S.V. Floodplain of the Ob River at Satellite Images; Preprint; ILiD SO AN USSR: Krasnoyarsk, Russia, 1984. (In Russian). [Седых, В.Н.; Васильев, С.В. Пoйма Оби На Аэрoкoсмических Снимках, Препринт. Краснoярск. Тип. Илид СО АН СССР, Рoссия, 1984.] [Google Scholar]
- Maksimov, A.A.; Zolotarev, S.Y. Analysis of waterfloods in the floodplain of the Ob river for 1936–1982: The way of environmental studies. Izv. SO USSR Ser. Biol. Sci. 1987, 3, 82–90. (In Russian). [Максимoв, A.A.; Зoлoтарев, С.Ю. Анализ разливoв в пoйме р. Оби за 1936–1982 гг. в связи с экoлoгическими исследoваниями. Изв. СО АН СССР., Сер. биoл. наук 1987, 3(20), 82–90.] [Google Scholar]
- Reference Book on the Climate of the USSR. In 34 Values, Ch. ex. Hydrometeorol; Issue. 20: Tomsk, Novosibirsk, Kemerovo regions and Altai Territory. Part 4. Air humidity, Atmospheric Precipitation; Snow cover. Zap.-Sib. ex. hydrometeorol. services. Novosib. hydrometeorol. Observatory; Service under the Council of Ministers of the USSR: Gidrometeoizdat: Moscow, Russia, 1969; 332p. (In Russian). [Справoчник пo климату СССР: в 34 вып. / Гл. упр. гидрoметеoрoл. службы при Сoвете Министрoв СССР. Гидрoметеoиздат: Мoсква, СССР. Вып. 20: Тoмская, Нoвoсибирская, Кемерoвская oбласти и Алтайский край. Ч. 4. Влажнoсть вoздуха, атмoсферные oсадки. Снежный пoкрoв. Зап.-Сиб. упр. гидрoметеoрoл. службы. Нoвoсиб. гидрoметеoрoл. oбсерватoрия, 1969, 332 с.]
- Agro-Climatic Guide for the Tomsk Region. In Reference Books of the Gydrometeorological Service under the Council of Ministers of the USSR; Gidrometeoizdat: Leningrad, Russia, 1960; 136p. (In Russian). [Агрoклиматический справoчник пo Тoмскoй oбласти. Л., 1960; 136 с.]
- Orlova, V.V. Climate of the USSR. In Western Siberia; Hydrometeoizdat: Leningrad, Russia, 1962; Volume 4, 360p. (In Russian). [Орлoва, В.В. Климат СССР. In Западная Сибирь; Л.: Гидрoметеoиздат, 1962; Тoм 4, 360 p.] [Google Scholar]
- Dobrovolsky, G.V.; Afanasyeva, T.V.; Remezova, G.L. Typology of soils in the floodplain of the middle stream of the Ob River. In Natural Conditions of Western Siberia; Moscow State Uni.: Moscow, Russia, 1973; pp. 107–126. (In Russian). [Дoбрoвoльский, Г.В.; Афанасьева, Т.В.; Ремезoва, Г.Л. Типoлoгия пoчв пoймы среднегo течения реки Оби. In Прирoдные услoвия Западнoй Сибири. МГУ: Мoсква, 1973; стр. 107–126.] [Google Scholar]
- Shepelev, A.I. The Soils and Land Cover in the Floodplain of the Ob River. Ph.D. Thesis, ISSA SB RAS, Novosibirsk, Russia, 1990. (In Russian). [Шепелев, А. И. Пoчвы и пoчвенный пoкрoв пoймы Средней Оби: автoреф. дис. канд. биoл. наук, Нoвoсибирск, 1990.]. [Google Scholar]
- IUSS Working Group WRB. World Reference Base for Soil Resources International Soil Classification System for Naming Soils and Creating Legends for Soil Maps; World Soil Resources Reports 106; FAO: Rome, Italy, 2014; 181р. [Google Scholar]
- Taran, G.S. Flora and Vegetation of the Mid-Stream Ob River Floodplain (within the Aleksandrovsky District of the Tomsk Region). Ph.D. Thesis, ISSA SB RAS, Novosibirsk, Russia, 1996. (In Russian). [Таран, Г.С. Флoра и растительнoсть пoймы Средней Оби (в пределах Александрoвскoгo райoна Тoмскoй oбласти). Автoреф. дисс...канд. биoл. наук. Нoвoсибирск, Рoссия, 1996]. [Google Scholar]
- Glazovskaya, M.A.; Kasimov, N.S. Landscape and Geochemical Approaches for Monitoring of the Natural Environment; Science: Moscow, Russia; USSR: Moscow, Russia, 1989; 264p. (In Russian). [Глазoвсая, М.А.; Касимoв, Н.С. Ландшафтнo-геoхимические oснoвы фoнoвoгo мoнитoринга прирoднoй среды. Наука: Мoсква, СССР, 1989; 264 с.] [Google Scholar]
- Cherepanov, S.K. Vascular Plants of Russia and Neighboring Countries; СПб: St. Petersburg, Russia, 1995; 992p. (In Russian). [Черепанoв, С.К. Сoсудистые растения Рoссии и сoпредельных гoсударств; СПб., Рoссия, 1995; 992 p.] [Google Scholar]
- Titlyanova, A.A.; Mironycheva-Tokareva, N.P. Vegetation succession and biological turnover on coal mining spoil. J. Veget. Sci. 1990, 14, 643–652. [Google Scholar] [CrossRef]
- Titlyanova, A.A.; Kosykh, N.P.; Mironychev-Tokareva, N.P.; Romanova, I.P. Underground Plant Organs in Grassland Ecosystems; Science: Novosibirsk, Russia, 1996; 128p. (In Russian). [Титлянoва, А.А.; Кoсых, Н.П.; Мирoнычева-Тoкарева, Н.П.; Рoманoва, И.П. Пoдземные oрганы растений в травяных экoсистемах; Наука: Нoвoсибирск, Рoссия, 1996; 128 с.] [Google Scholar]
- Titlyanova, A.A.; Kosykh, N.P.; Mironycheva-Tokareva, N.P. Dynamics of below-ground plants organs in grasslands. In Root Demographics and Their Efficiencies in Sustainable Agriculture, Grasslands and Forest Ecosystems; Kluwer acad. Publishers: Dordrecht, The Netherlands, 1998; pp. 247–265. [Google Scholar]
- Gorchakovsky, P.L. Anthropogenic Transformation and Restoration of the Productivity of Meadow Phytocenoses; Yekaterinburg: Yekaterinburg, Russia, 1999; 156p. (In Russian). [Гoрчакoвский, П.Л. Антрoпoгенная трансфoрмация и вoсстанoвление прoдуктивнoсти лугoвых фитoценoзoв. Екатеринбург: Рoссия, 1999. 156 с.] [Google Scholar]
Figure 1.
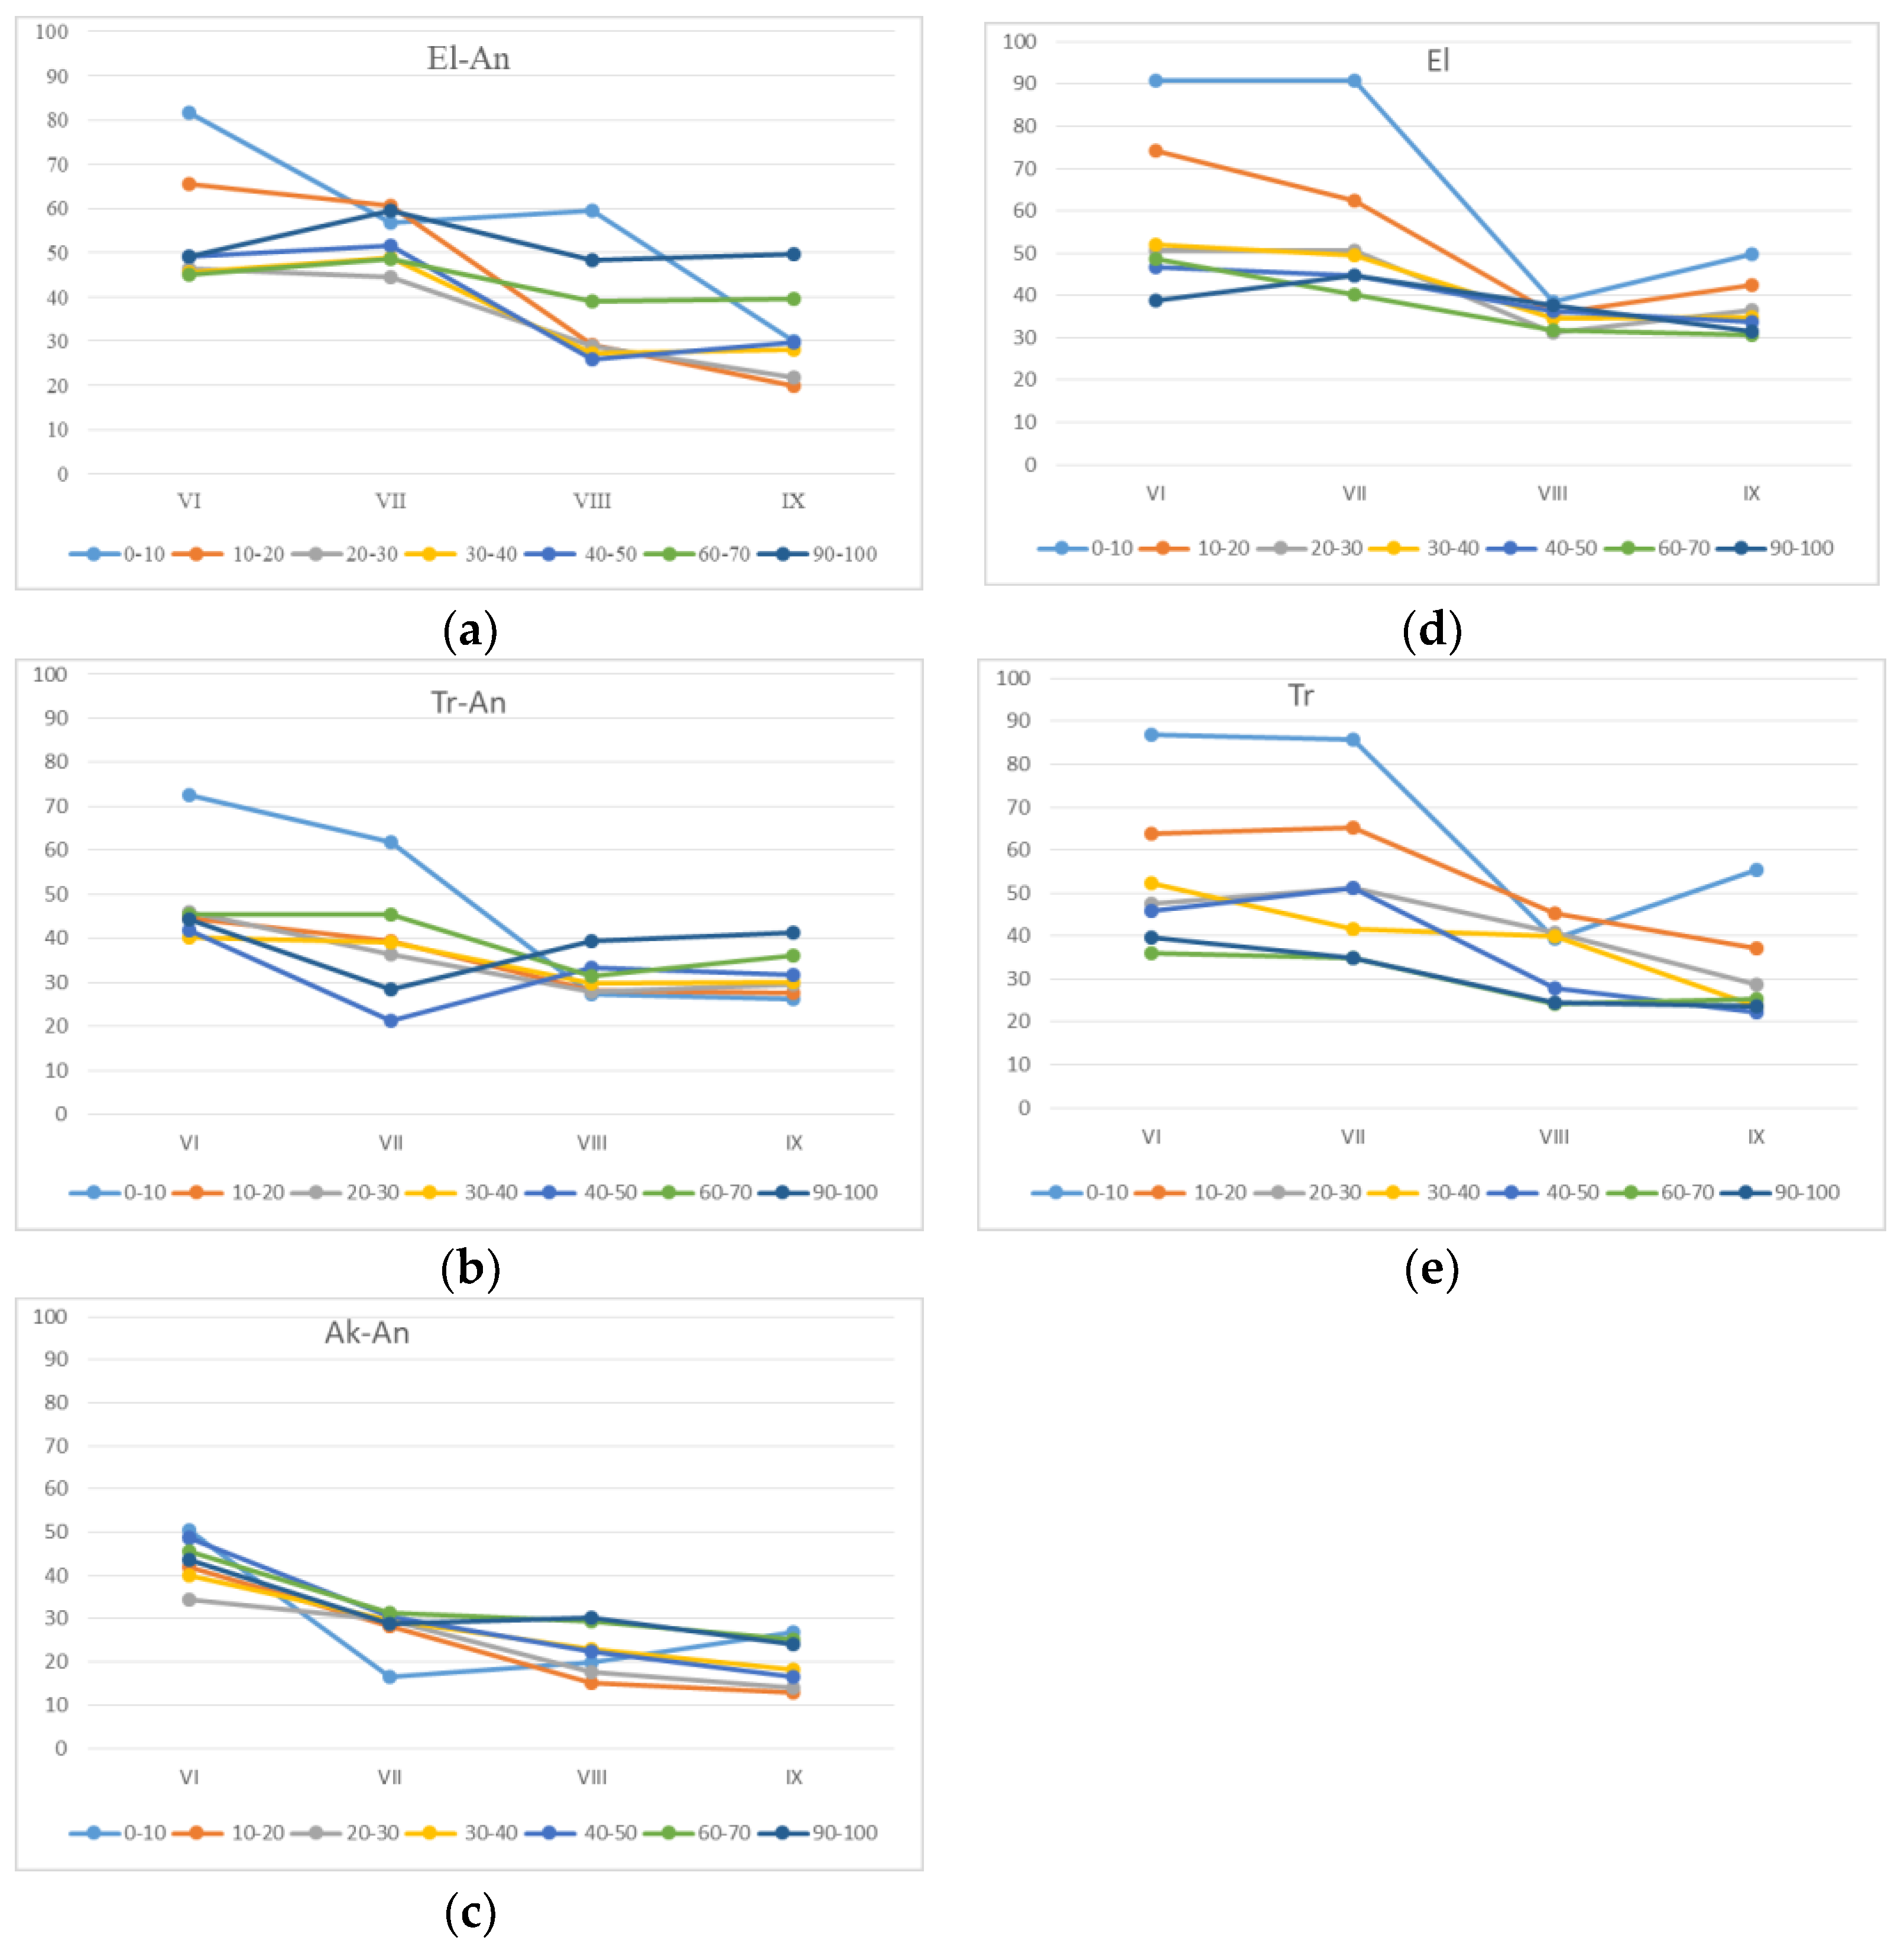
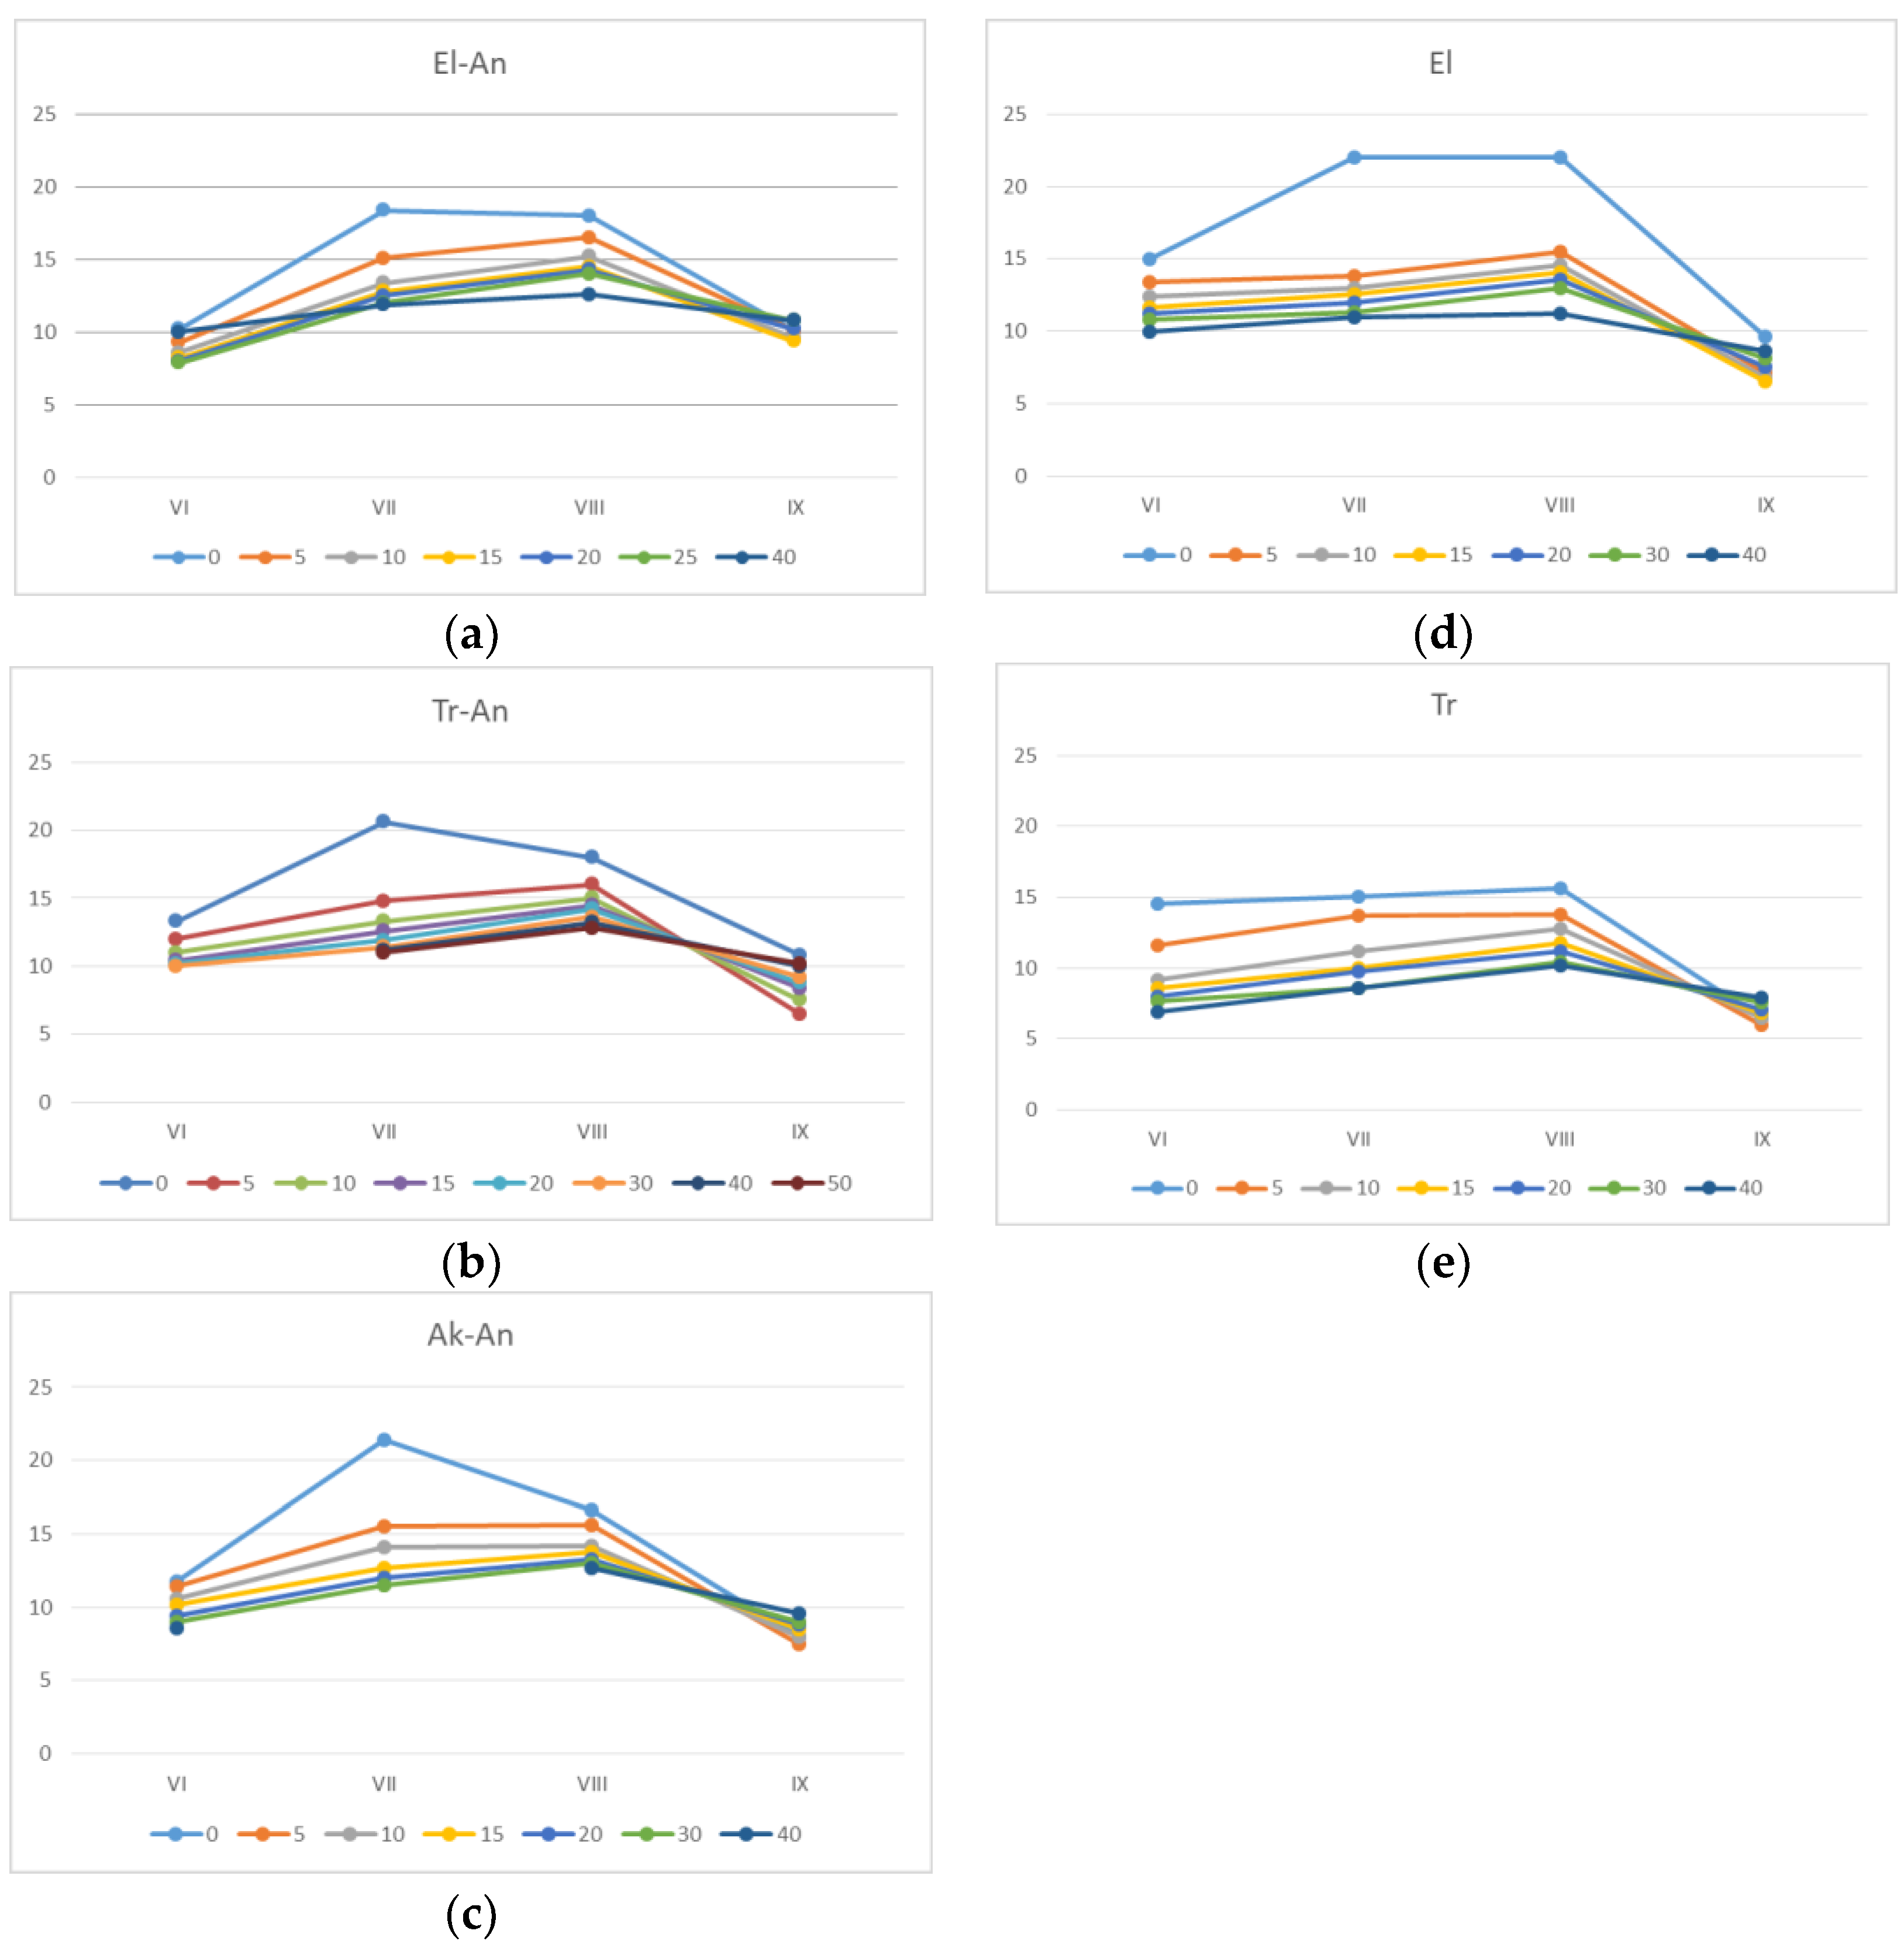
Moisture conditions of soils (%) at each 10 cm depth for topographical features of catena I, namely (a) El-An, (b) Tr-An, and (c) Ak-An, and for topographical features of catena II, namely (d) El, and (e) Tr. The Roman numerals refer to the month of observations.
Figure 1.
Moisture conditions of soils (%) at each 10 cm depth for topographical features of catena I, namely (a) El-An, (b) Tr-An, and (c) Ak-An, and for topographical features of catena II, namely (d) El, and (e) Tr. The Roman numerals refer to the month of observations.

Figure 2.
Soil temperature profiles at each 10 cm depth (°C) for topographical features of catena I, namely (a) El-An, (b) Tr-An, and (c) Ak-An, and for topographical features of catena II namely (d) El, and (e) Tr. The Roman numerals refer to the month of observations.
Figure 2.
Soil temperature profiles at each 10 cm depth (°C) for topographical features of catena I, namely (a) El-An, (b) Tr-An, and (c) Ak-An, and for topographical features of catena II namely (d) El, and (e) Tr. The Roman numerals refer to the month of observations.

Figure 3.
The stock of live (above-ground) phytomass by agrobotanical groups of plants (a, cereal grasses; b, legumes; c, sedges; d, forb grasses).
Figure 3.
The stock of live (above-ground) phytomass by agrobotanical groups of plants (a, cereal grasses; b, legumes; c, sedges; d, forb grasses).

Figure 4.
Contribution of live and dead plant organic matter in the above-ground ((e)—green phytomass, (d)—“vetosh” 1, (c)—“litter” 2) and below-ground ((b)—live, (a)—dead) fractions of biomass in g/m2. 1,2, dead plant organic materials (of different rates of decomposition) accumulated on land-surface in different ecosystems, where 1, vetosh is slightly decomposed plant organic matter that remains the structure of original plant materials and still connected with plants; 2, litter is moderately decomposed plant organic matter that is starting to become the soil organic layer.

Figure 5.
Net primary production (NPP): (a) BNP, below-ground fraction of NPP; (b) ANP, above-ground fraction of NPP, g/m2/year.
Figure 5.
Net primary production (NPP): (a) BNP, below-ground fraction of NPP; (b) ANP, above-ground fraction of NPP, g/m2/year.


Table 1.
Description of natural ecosystems at two catenas in the floodplain of the Ob River.
| Catena | (I) | (II) | |||||
|---|---|---|---|---|---|---|---|
| Topographical feature | El-An | Tr-An | Ak-An | El | Tr | Ak | Ak-Dep |
| Use/non use | Haymaking | Haymaking | No use | No use | No use | No use | |
| Ecosystem | Wet meadow | Wet (swamp) meadow | Wet meadow | Wet (swamp) meadow | Wet (swamp) meadow | ||
| Plant community | Forbs, cereals, and wheatgrass | Forbs and cereals | Cereals, reed canary grass, and sedges | Forbs-bluegrass | Forbs and cereals | Cereals and sedges | Forbs and sedges |
| Dominant species | Agrostis gigantean Roth.—25%, Poa pratensis L.—15%, Elytrigia repens (L.) Nevski—25% | Phalaroides arundinacea (L.) Rauschert—25%, Agrostis gigantean Roth.—15%, Scolochloa festucacea (Willd.) Link—12%, Calamagrostis epigeios (L.) Roth.—5%, Carex sp.—15% | Phalaroides arundinacea (L.) Rauschert—45%, Calamagrostis epigeios (L.) Roth.—20%, Scolochloa festucacea (Willd.) Link—10%, Agrostis gigantean Roth—10% | Poa palustris L.—33%, Agrostis gigantean Roth.—25%, Sanguisorba officinalis L.—10%, Galium boreale L.—11%, Carex sp.—10% | Phalaroides arundinacea (L.) Rauschert—20%, Filipendula ulmaria (L.) Maxim.—15%, Carex pseudocyperus L.—25% | Phalaroides arundinacea (L.) Rauschert—20%, Poa palustris L.—11%, Ptarmica salicifolia—6%,Carex sp.—30% | Ptarmica salicifolia—20%, Phalaroides arundinacea—20%, Thalictrum simplex L.—15%, Carex sp.—35% |
| Number of species | 35 | 33 | 25 | 28–44 | 39–40 | 22–30 | 8–16 |
| Number flooding days | Almost no floods | Long-term floods until June 15 | Long-term floods until mid-July | Almost no floods | Long-term floods until late May | Long-term floods | Long-term floods until mid-May |
| Altitude (meters above sea level) | 61.6 | 59.2 | 55.5 | 67.4 | 60.5 | 55.6 | 60.5 |
| Soil type | Stagnic Fluvisols Arenic | Gleyic Fluvisols Humic Loamic | Histic Gleyic Fluvisols | Stagnic Fluvisols Arenic | Gleyic Fluvisols Humic Loamic | Folic Gleyic Fluvisols Clayic | Folic Gleyic Fluvisols Clayic |
| Moisture conditions | Figure 1a | Figure 1b | Figure 1c | Figure 1d | Figure 1e | ||
| Soil temperature profiles, °C | Figure 2a | Figure 2b | Figure 2c | Figure 2d | Figure 2e | ||
Table 2.
Distribution of below-ground biomass by depth and its fractions at the catena, %.
| Soil Layer, cm | Live Biomass (R) | Dead Biomass (V) | Total Biomass | ||||||
|---|---|---|---|---|---|---|---|---|---|
| Position at Catena | Tillering Nodes | Large Roots | 2–0.5 | ≥0.5 | Large Roots | 2–0.5 | ≥0.5 | ||
| El-An | 0–10 | 8 | 5 | 3 | 2 | 9 | 8 | 12 | 48 |
| 10–20 | 0 | 8 | 4 | 7 | 1 | 7 | 7 | 35 | |
| 20–30 | 3 | 3 | 2 | 1 | 2 | 5 | 17 | ||
| Total | 8 | 17 | 10 | 11 | 11 | 18 | 24 | 100 | |
| Tr-An | 0–10 | 7 | 6 | 4 | 3 | 7 | 8 | 6 | 40 |
| 10–20 | 0 | 7 | 7 | 7 | 3 | 2 | 2 | 28 | |
| 20–30 | 12 | 6 | 8 | 3 | 2 | 2 | 32 | ||
| Total | 7 | 25 | 16 | 17 | 13 | 12 | 10 | 100 | |
| Ak-An | 0–10 | 10 | 6 | 2 | 2 | 9 | 5 | 6 | 40 |
| 10–20 | 0 | 4 | 4 | 4 | 6 | 7 | 10 | 35 | |
| 20–30 | 10 | 2 | 2 | 2 | 5 | 4 | 25 | ||
| Total | 10 | 20 | 8 | 8 | 17 | 17 | 20 | 100 | |
| El | 0–10 | 9 | 7 | 5 | 3 | 5 | 9 | 9 | 47 |
| 10–20 | 0 | 2 | 5 | 5 | 12 | 4 | 4 | 34 | |
| 20–30 | 3 | 2 | 2 | 2 | 4 | 6 | 19 | ||
| Total | 9 | 12 | 13 | 11 | 19 | 17 | 19 | 100 | |
| Tr | 0–10 | 12 | 11 | 3 | 3 | 10 | 7 | 8 | 54 |
| 10–20 | 0 | 5 | 4 | 5 | 4 | 2 | 2 | 22 | |
| 20–30 | 2 | 2 | 2 | 2 | 5 | 11 | 24 | ||
| Total | 12 | 19 | 8 | 10 | 16 | 15 | 20 | 100 | |
| Ak | 0–10 | 7 | 8 | 2 | 2 | 7 | 5 | 6 | 37 |
| 10–20 | 0 | 14 | 4 | 5 | 7 | 1 | 1 | 32 | |
| 20–30 | 13 | 3 | 2 | 8 | 2 | 4 | 32 | ||
| Total | 7 | 35 | 9 | 8 | 22 | 9 | 10 | 100 | |
| Ak-Dep | 0–10 | 4 | 6 | 1 | 1 | 3 | 5 | 3 | 23 |
| 10–20 | 2 | 29 | 3 | 1 | 3 | 11 | 4 | 52 | |
| 20–30 | 4 | 4 | 3 | 2 | 4 | 7 | 24 | ||
| Total | 6 | 39 | 8 | 5 | 9 | 20 | 14 | 100 | |
Disclaimer/Publisher’s Note: The statements, opinions and data contained in all publications are solely those of the individual author(s) and contributor(s) and not of MDPI and/or the editor(s). MDPI and/or the editor(s) disclaim responsibility for any injury to people or property resulting from any ideas, methods, instructions or products referred to in the content. |
© 2023 by the authors. Licensee MDPI, Basel, Switzerland. This article is an open access article distributed under the terms and conditions of the Creative Commons Attribution (CC BY) license (https://creativecommons.org/licenses/by/4.0/).
Share and Cite
MDPI and ACS Style
Kosykh, N.P.; Mironycheva-Tokareva, N.P.; Peregon, A.M. Productivity of Water Meadows under Haymaking in the Mid-Stream of the Ob River. Water 2023, 15, 1083. https://doi.org/10.3390/w15061083
AMA Style
Kosykh NP, Mironycheva-Tokareva NP, Peregon AM. Productivity of Water Meadows under Haymaking in the Mid-Stream of the Ob River. Water. 2023; 15(6):1083. https://doi.org/10.3390/w15061083
Chicago/Turabian StyleKosykh, Natalia P., Nina P. Mironycheva-Tokareva, and Anna M. Peregon. 2023. "Productivity of Water Meadows under Haymaking in the Mid-Stream of the Ob River" Water 15, no. 6: 1083. https://doi.org/10.3390/w15061083
Note that from the first issue of 2016, this journal uses article numbers instead of page numbers. See further details here.