
Spatial Conservation Assessment for Native Fishes in the Lahontan and Central Nevada Basins, USA
1
Trout Unlimited, 910 Main Street, Suite 342, Boise, ID 83702, USA
2
Nevada Division of Natural Heritage, 901 S. Stewart Street, Suite 5002, Carson City, NV 89701, USA
3
Nevada Department of Wildlife, 6980 Sierra Center Parkway, Reno, NV 89511, USA
*
Author to whom correspondence should be addressed.
Water 2023, 15(6), 1087; https://doi.org/10.3390/w15061087
Submission received: 9 February 2023
/
Revised: 4 March 2023
/
Accepted: 6 March 2023
/
Published: 12 March 2023
(This article belongs to the Special Issue Endangered Fish, Rivers at Risk: Spatial Aspects of Freshwater Biodiversity Conservation)
Abstract
:Freshwater biodiversity is declining faster than terrestrial and marine biodiversity. The protection and restoration of aquatic habitats are based, in part, on stemming this decline. We conducted a spatial conservation assessment of native fishes in the Lahontan and central Nevada basins using core-area zonation. The complementarity-based assessment yielded a landscape value (rank) of all subwatersheds (12-digit hydrologic unit code; ~12,000 ha) whereby high-ranking subwatersheds, as a set, maximized the representation of all native species, subspecies, and the within-species ecological diversity of salmonids, while accounting for aquatic connectivity and risk of aquatic habitat degradation. The high-ranking subwatersheds encapsulated small patches of habitat inhabited by endemic desert fishes, as in the Ash Meadows National Wildlife Refuge. They also highlighted clusters of high-value subwatersheds, such as in the Truckee River watershed that has extant populations of, and historical habitat for, Lahontan cutthroat trout in its headwaters, with species such as the mountain whitefish with migratory life histories, and endemic cui-ui, Chasmistes cujus, at Pyramid Lake—a terminal lake. Both the Truckee River headwaters and Pyramid Lake have been recipients of ongoing native fish conservation efforts. The landscape rankings will be used by the Desert Fish Habitat Partnership to inform regional conservation investments, and the rankings are available for broader use by resource agencies working on native fish conservation at landscape scales.
1. Introduction
Global biodiversity is in decline [1,2], and the decline of aquatic organisms has outpaced that of their terrestrial counterparts [3,4]. Habitat degradation and alteration, invasive species, barriers to movement, and water pollution associated with anthropogenic land and water use have been implicated in these declines [5]. For example, Muhlfeld, et al. [6] found that 73% of 67 global trout and char species (family: Salmonidae) assessed under the International Union for the Conservation of Nature (IUCN) framework were threatened with extinction. Invasive species, overfishing, pollution, dams, and agriculture/grazing were the five most-cited threats to the assessed species. A total of 57 of the 124 trout and char species recognized by IUCN had not yet been assessed, highlighting an important biodiversity information gap [7].
The protection of freshwater habitats is one strategy to conserve aquatic species. Protection can take the form of threat abatement, such as excluding livestock from streams because of the damage they cause [8,9]. Protection can also include formal protected area designations with regulations focused on minimizing human impact (e.g., designated wilderness in the United States), national river conservation systems (e.g., USA National Wild and Scenic Rivers System), decrees and other executive policies, and more [10]. Despite being a cornerstone of conservation, protected areas to date have had limited utility for freshwater systems, because invasive species, fishing, water use, and habitat degradation still occur within them [11].
Aquatic habitat restoration has received considerable attention and funding in the last three decades, sometimes with a goal of recovering imperiled species [12]. Many approaches to habitat restoration and enhancement exist [9], but they are often implemented one reach at a time because of limited funding. These small, individual projects can seem disconnected from project goals, implementation, and evaluation if they are not part of a larger watershed or regional plan [13,14]. Luckily, frameworks exist to prioritize aquatic restoration within and among watersheds [15], and these frameworks can explicitly incorporate the presence and abundance of species of conservation concern [9].
Williams et al. [16] proposed the Native Fish Conservation Areas (NFCAs) concept as watersheds with diverse aquatic communities where integrated management should emphasize (1) maintaining ecological processes that create habitat complexity, (2) nurturing all life stages of species in the fish community, (3) including a large enough watershed to facilitate the long-term persistence of fish populations, and (4) providing management that is sustainable over time. Williams et al. [16] suggested a network of NFCAs could anchor aquatic conservation needs across the United States. The NFCA concept has been used by the USA state of Texas to identify watersheds based on native fish diversity in the state—termed the Texas Native Fish Conservation Areas Network—that have been the focus of watershed planning and conservation implementation [17,18]. Similar concepts have been used to identify strategic conservation priorities for native black basses, Micropterus spp., in the southeastern USA [19]. Spatial conservation assessment frameworks now exist to identify networks of watersheds that together maximize the representation and redundancy of biodiversity in a complimentary way, while accounting for the interconnected and dendritic nature of aquatic ecosystems [20,21,22].
Here, we provide a spatial conservation assessment of watersheds for native fishes in the Lahontan and central Nevada basins (primarily in Nevada, USA) (Figure 1). The assessment identified the conservation value (i.e., rank) of all subwatersheds (hydrologic unit code 12) using existing data and complementarity-based methods, whereby high-ranking subwatersheds, together as a set, maximized the representation of native fish diversity across the study basins, including the ecological diversity of native salmonids and subspecific diversity of non-game taxa. The assessment also accounted for the aquatic connectivity among subwatersheds and the risk of degradation to aquatic habitats. The landscape rankings highlight watersheds where strategic conservation investments could benefit the persistence of native fishes across the landscape. The assessment will be used to inform decision making by the Desert Fish Habitat Partnership, such as determining whether projects proposed to their funding program are located in high-value watersheds for native fishes in a region with a high level of endemism [23].
2. Materials and Methods
2.1. Study Area
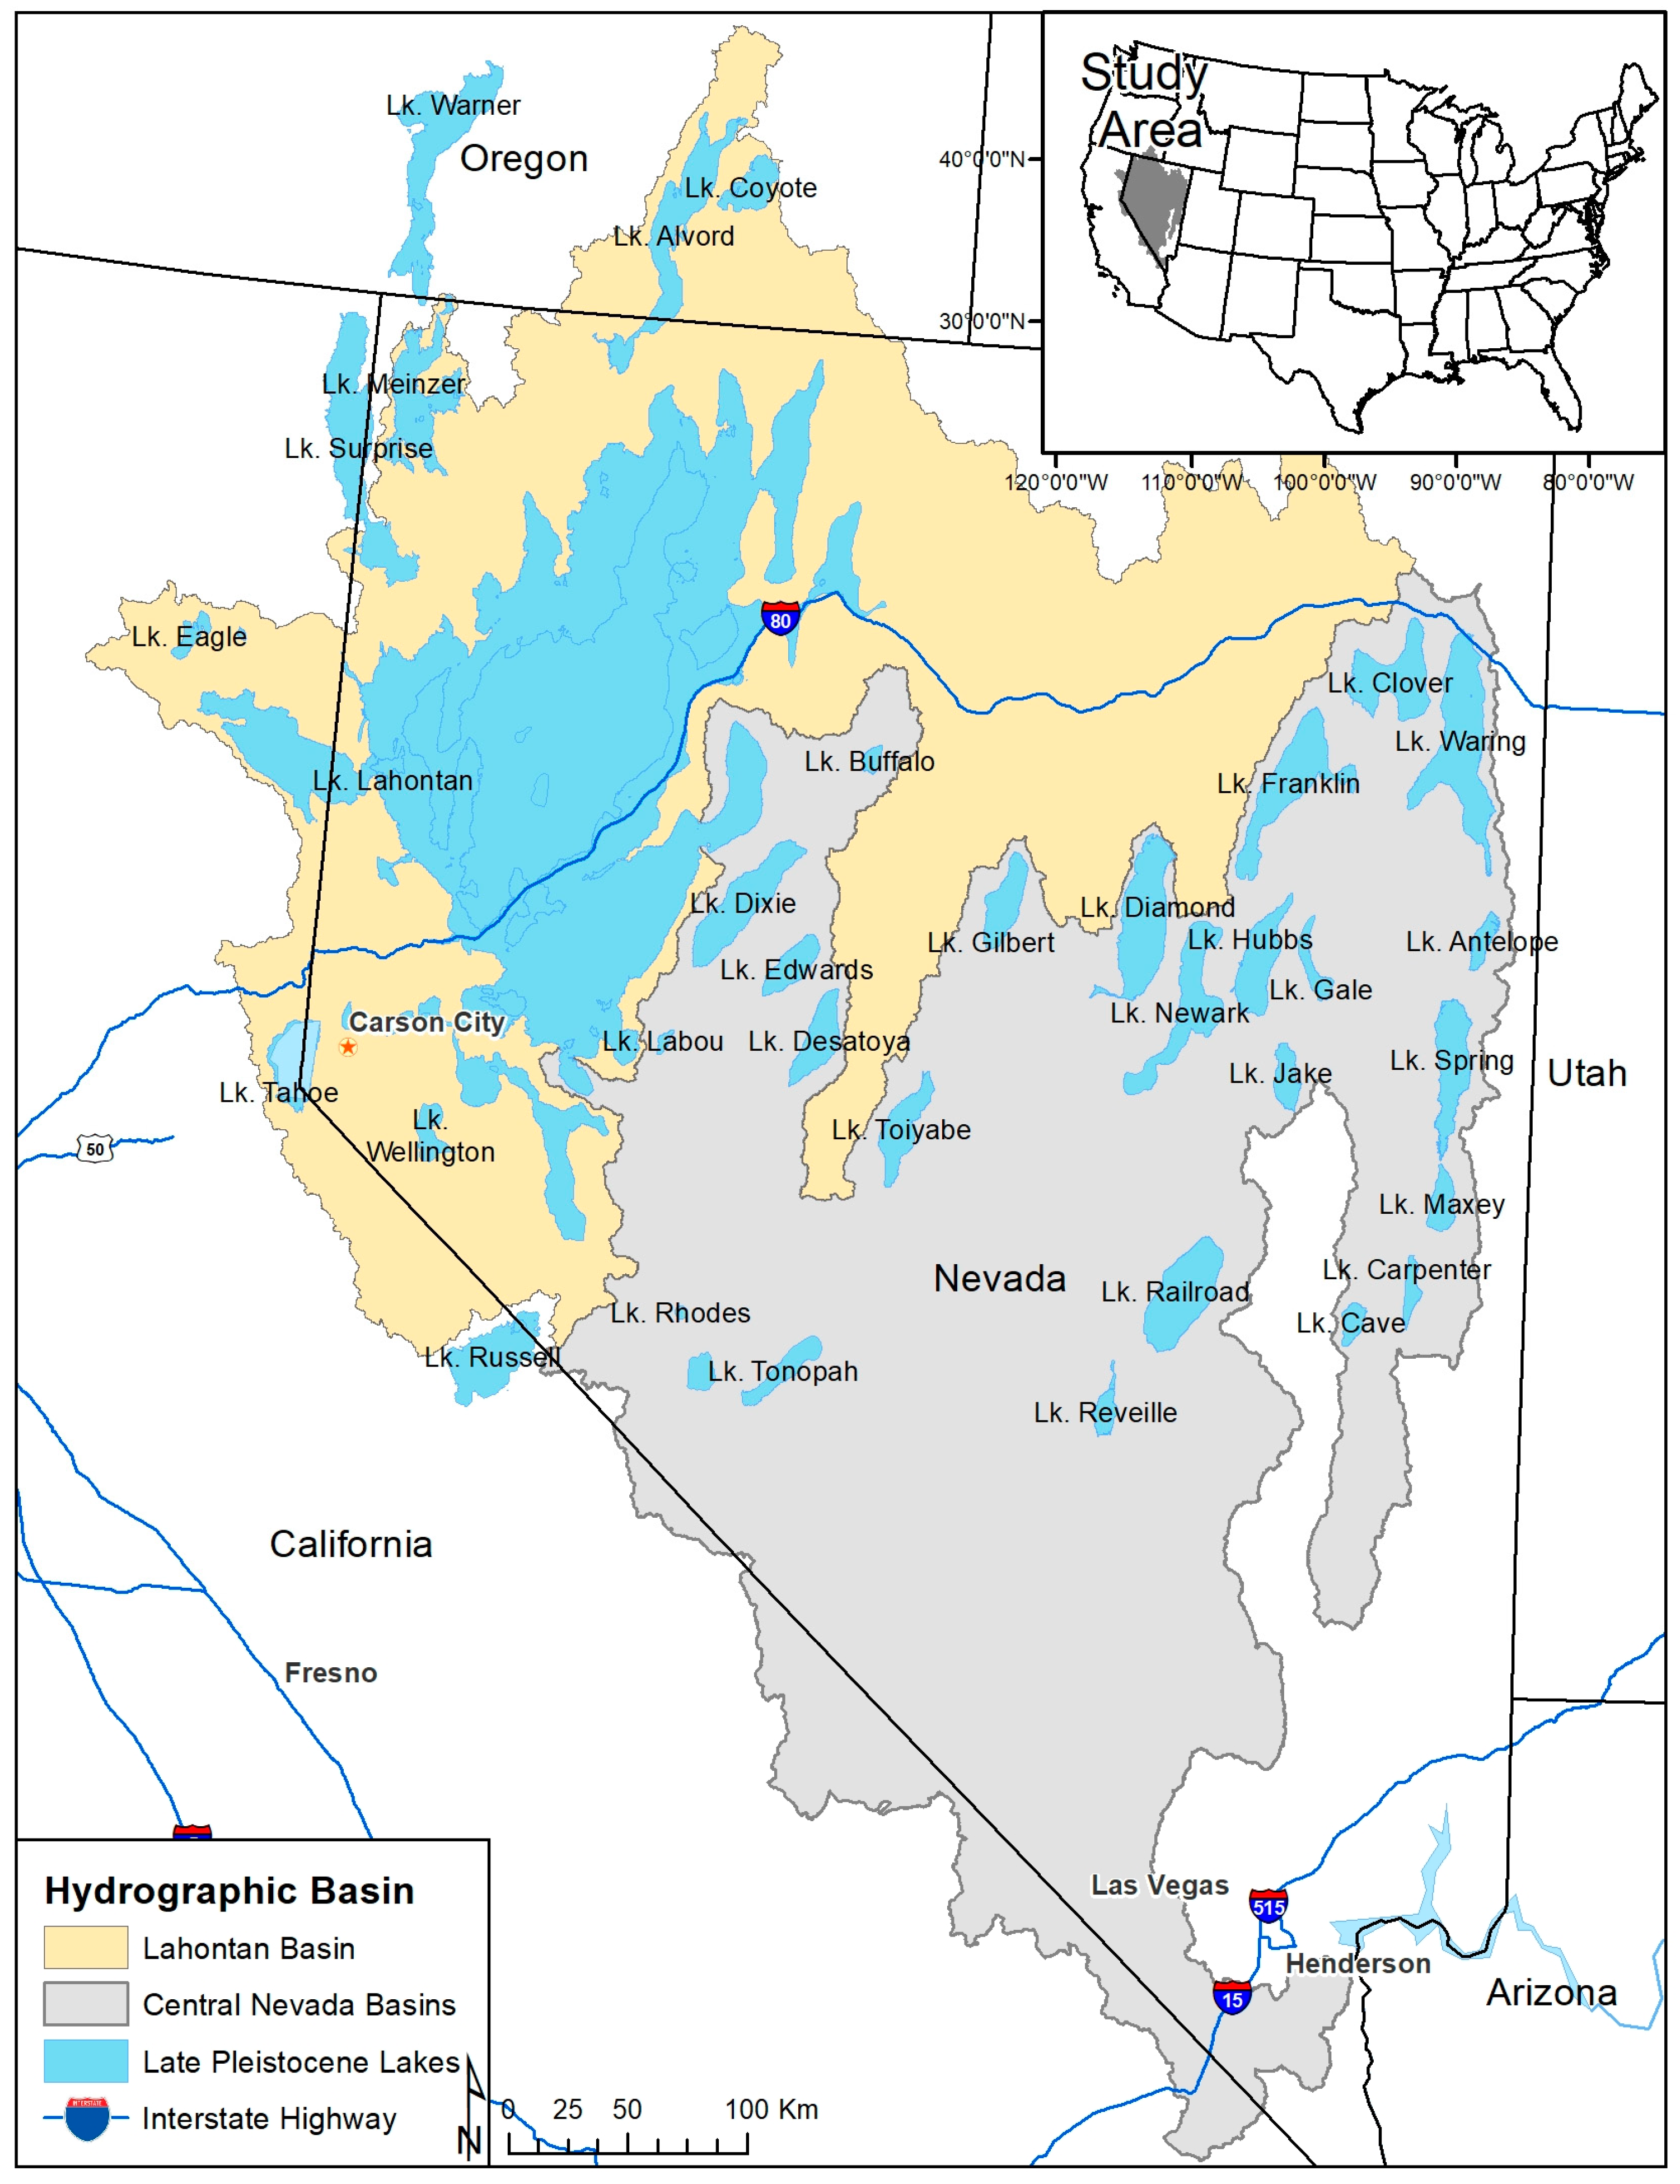
The Great Basin in the western United States is the largest inland drainage in North America with no outlet to the sea [25]. It resides between the Rocky Mountains to the east and Sierra Nevada to the west, and it is south of the Columbia River basin to the north and north of the Colorado River basin to the south. The Great Basin is not one drainage basin, but rather numerous drainages resulting from geological folds and is a region characterized by mountains and deserts that drive large environmental gradients (0 m elevation near Death Valley to 2000 m elevation near Lake Tahoe). Lake Bonneville and Lake Lahontan were the two largest pluvial lakes in the Great Basin, with maximum elevations reached across various periods of the Pleistocene [24,26] (Figure 1). Other basins include the central (mostly in Nevada but also in California), northwest desert, and northwest Oregon lakes basins, as well as the Mojave–Death Valley region. While some separate the Humboldt basin from Lake Lahontan and combine it with the central basin [25], for this project, the Humboldt was retained with the pluvial Lake Lahontan basin due to a shared fish species pool. The central basins are the collective basins to the south [26,27] (Figure 1). Fishes in the Great Basin reflect broader patterns of the southwestern USA, in that some species are found nowhere else on Earth, and many of them are in peril, as evidenced by the fact that nearly half are listed as threated or endangered under the USA Endangered Species Act (ESA) [28].
2.2. The Approach: Native Fish Conservation Value of Subwatersheds
The spatial conservation assessment of native fishes at the subwatershed scale (12-digit hydrologic unit code) in the Lahontan and central Nevada basins was conducted using core-area zonation (CAZ). CAZ is a complementarity-based algorithm implemented in the software Zonation 4.0 [29]. It results in a conservation value for each planning unit—in our case, subwatersheds—in the analysis landscape that ranges from 0 (lowest value) to 1 (highest value). Core-area zonation is a hierarchical analysis that iteratively removes the planning unit that results in the smallest aggregate loss in value across all species inputs, while accounting for varying species weights, species-specific connectivity needs, and potentially other factors (e.g., threats and uncertainties). It gives the highest value to rare and highly weighted species (or other features of interest), and the lowest value to areas with a small number of common and widespread species. The least valuable planning unit is removed first, the next least valuable planning unit remaining is then removed, and this removal process continues iteratively until there is only one planning unit left—the most important one based on the collective species inputs. The iterative removal process through CAZ results in the hierarchical ranking of all planning units in the focal landscape that are then scaled from 0 to 1. The highest value areas complement each other as a set to maximize the representation of all species included in the analysis.
2.3. Core-Area Zonation
More specifically, the CAZ algorithm bases the conservation value on the most important feature (i.e., species) in a planning unit, and thus gives high value to areas with a single, rare, or highly weighted species. It is based on the minimum marginal loss for a planning unit across species-specific input values [29]:
where δi = the marginal loss across all j species (see below) for subwatershed planning unit i; ci = the cost associated with the planning unit i, set at 1 for all planning units in our analysis (i.e., it has no influence); and wj = the weight for species j, which, in our case, was based on DFHP species rankings. DFHP species rankings are based on Global Heritage Rank (natureserve.org, accessed on 15 January 2023), desert endemism, the need for cross-jurisdictional cooperation, federal listing status, population status, and level of management available for the species, as outlined in DFHP’s strategic plan [30,31]; and qij = the proportion of the remaining distribution of species j located in planning unit i for a given set of planning units (subwatersheds; see below) remaining during the current iteration. The species inputs were defined as the known occurrence (present = 1; absent = 0) or occurrence probability from a species distribution model (range: 0–1) for non-game species, and the input was a linear density (#/km) for cutthroat trout populations, based on field data (see below). The equation identifies the planning unit (subwatershed) with the highest species input values across all species, while also retaining biodiversity-poor catchments that have high occurrence values for rare (and highly weighted) species [31]. The planning unit removal process was repeated iteratively until only one planning unit remained on the landscape during the last iteration. This last planning unit was the most important, and thus the highest valued or ranked, watershed across all watersheds in the analysis landscape. All features included in the CAZ analysis were converted to rasters with a 300 m cell size.
2.4. Planning Units
Core-area zonation is a cell-based removal algorithm, but it allows the use of planning units so that all cells within a planning unit are removed together. We used 12-digit hydrologic unit code subwatersheds (HUC12) from the Watershed Boundary Dataset [32] as planning units. The Watershed Boundary Dataset (WBD) is a USA-based hydrologic unit dataset, where units represent the areal extent of surface water drainage to an outlet point on the dendritic stream network. A unit may represent only part of the total drainage area for an outlet point. Subwatersheds are approximately 12,000 ha in size on average. As mentioned above, all inputs were rasters with a 300 m cell size, and all grid cells within a subwatershed were removed simultaneously during the iterative removal algorithm.
2.5. Fish Species Data
2.5.1. The 3 Rs for Native Trout
The 3 Rs—representation, redundancy, and resiliency—have provided a foundation for efficient conservation assessment and planning, including for native trout [33]. Maximizing the representation and redundancy of genetic purity, life history diversity, and geographic diversity across populations, and managing for a high likelihood of population persistence conferring resilience (high abundance and occupancy of large habitat patches), has been suggested to provide the best hedge for cutthroat trout in an uncertain future [33]. We integrated the representative elements of life history diversity and genetic diversity, as well as linear density as a measure of resiliency, as subspecific ecological features of Lahontan cutthroat trout, O. c. henshawi, in our spatial conservation assessment. To do so, we used information from a rangewide database compiled to inform the status of the subspecies where populations were delineated, using field data and professional judgment on the 1:24,000 National Hydrography Dataset (NHD) flowline and waterbody feature classes [34,35]. The database was attributed with information on genetic purity, life history (resident, fluvial, and adfluvial), and historical habitat (Figure 2A). Uniquely identifiable evolutionary units (UIEU) proposed by Peacock, Neville, and Finger [27] were used to capture the representation of geographic and genetic diversity: eastern Lahontan, western Lahontan, northwestern Lahontan, and Coyote Lake units (the Lake Alvord unit was outside of our analysis domain). We treated unique ecological elements of populations as separate ‘species’ in the analysis and divided the species-level weight among these representative elements (Table 1).
2.5.2. Nevada Division of Natural Heritage Database
Species inputs for non-game species were either known occurrences or occurrence probabilities from species distribution models (SDMs). Known occurrences were lines (streams or rivers) or polygons (lakes, ponds, or wetlands) delineated with species occurrences (value = 1) from the Nevada Division of Natural Heritage (Figure 2B). These delineations were based on data gathered and mapped from state and federal agency fishery surveys, museum specimens, scientific collection permits, and academic research projects. The mapping procedures followed the data standard methodologies set forth by NatureServe in the Biotics database [36]. Non-game taxa were recognized at the subspecies level tracked by NDNH, which recognizes genetic variation associated with hydrologic basins for species such as the speckled dace, Rhinichthys osculus [37,38,39], and relict dace, Relictus solitarius [40,41]. Many undescribed subspecies of Siphateles, Rhinichthys, and Catostomus spp. in the Lahontan basin have been recognized as unique and/or isolated to the extent that they are genetically and or morphologically distinct and warrant conservation status. We included habitats of three subspecies thought to be extinct—the Grass Valley speckled dace, High Rock Spring tui chub, and Ash Meadows poolfish (Heritage rank includes ‘SX’; Table 1)—because strains of species once thought to be extinct from the region have been rediscovered elsewhere [42], and so we wanted these historical habitats represented in the assessment, similar to including historical habitats for Lahontan cutthroat trout.
2.5.3. Species Distribution Models
For broadly distributed species for which distribution data are not curated by NDNH, occurrence probability predictions from SDMs were used as species inputs. Random forest models were used to develop SDMs. When fit to binary (presence–absence) data, random forest models are an ensemble of classification trees that predict a binary outcome from a suite of environmental predictor variables [43]. Species presence data for the SDMs were obtained from the Global Biodiversity Information Facility database [44]. These were coupled with randomly generated pseudo-absences and environmental predictor variables to fit random forest models for each species [43]. The number of pseudo-absences was 10 times the number of occurrences for each species to maximize model accuracy [45]. The environmental predictor variables, known to influence the distributions of similar species in nearby regions [46], were mean August stream temperature (°C), percent canopy cover, latitude (Albers Equal Area Northing), stream slope (unitless), mean annual precipitation in watershed (mm), and cumulative drainage area (km2) from the National Stream Internet dataset for the Lahontan basin [47,48]. The performance of each SDM was assessed using the out-of-bag error and area under the curve (AUC) of a receiver operating characteristic (ROC) plot. A generalized linear model for Lahontan cutthroat trout was also developed using the same covariates as an SDM to provide a measure of the suitability of the streams identified as historical habitats for the species in the status assessment [34]. The SDM occurrence probability predictions were made on the National Stream Internet hydrography, which is based on NHD medium-resolution (a 1:100,000 scale) hydrography (Figure 2C).
2.6. Distribution Discounting
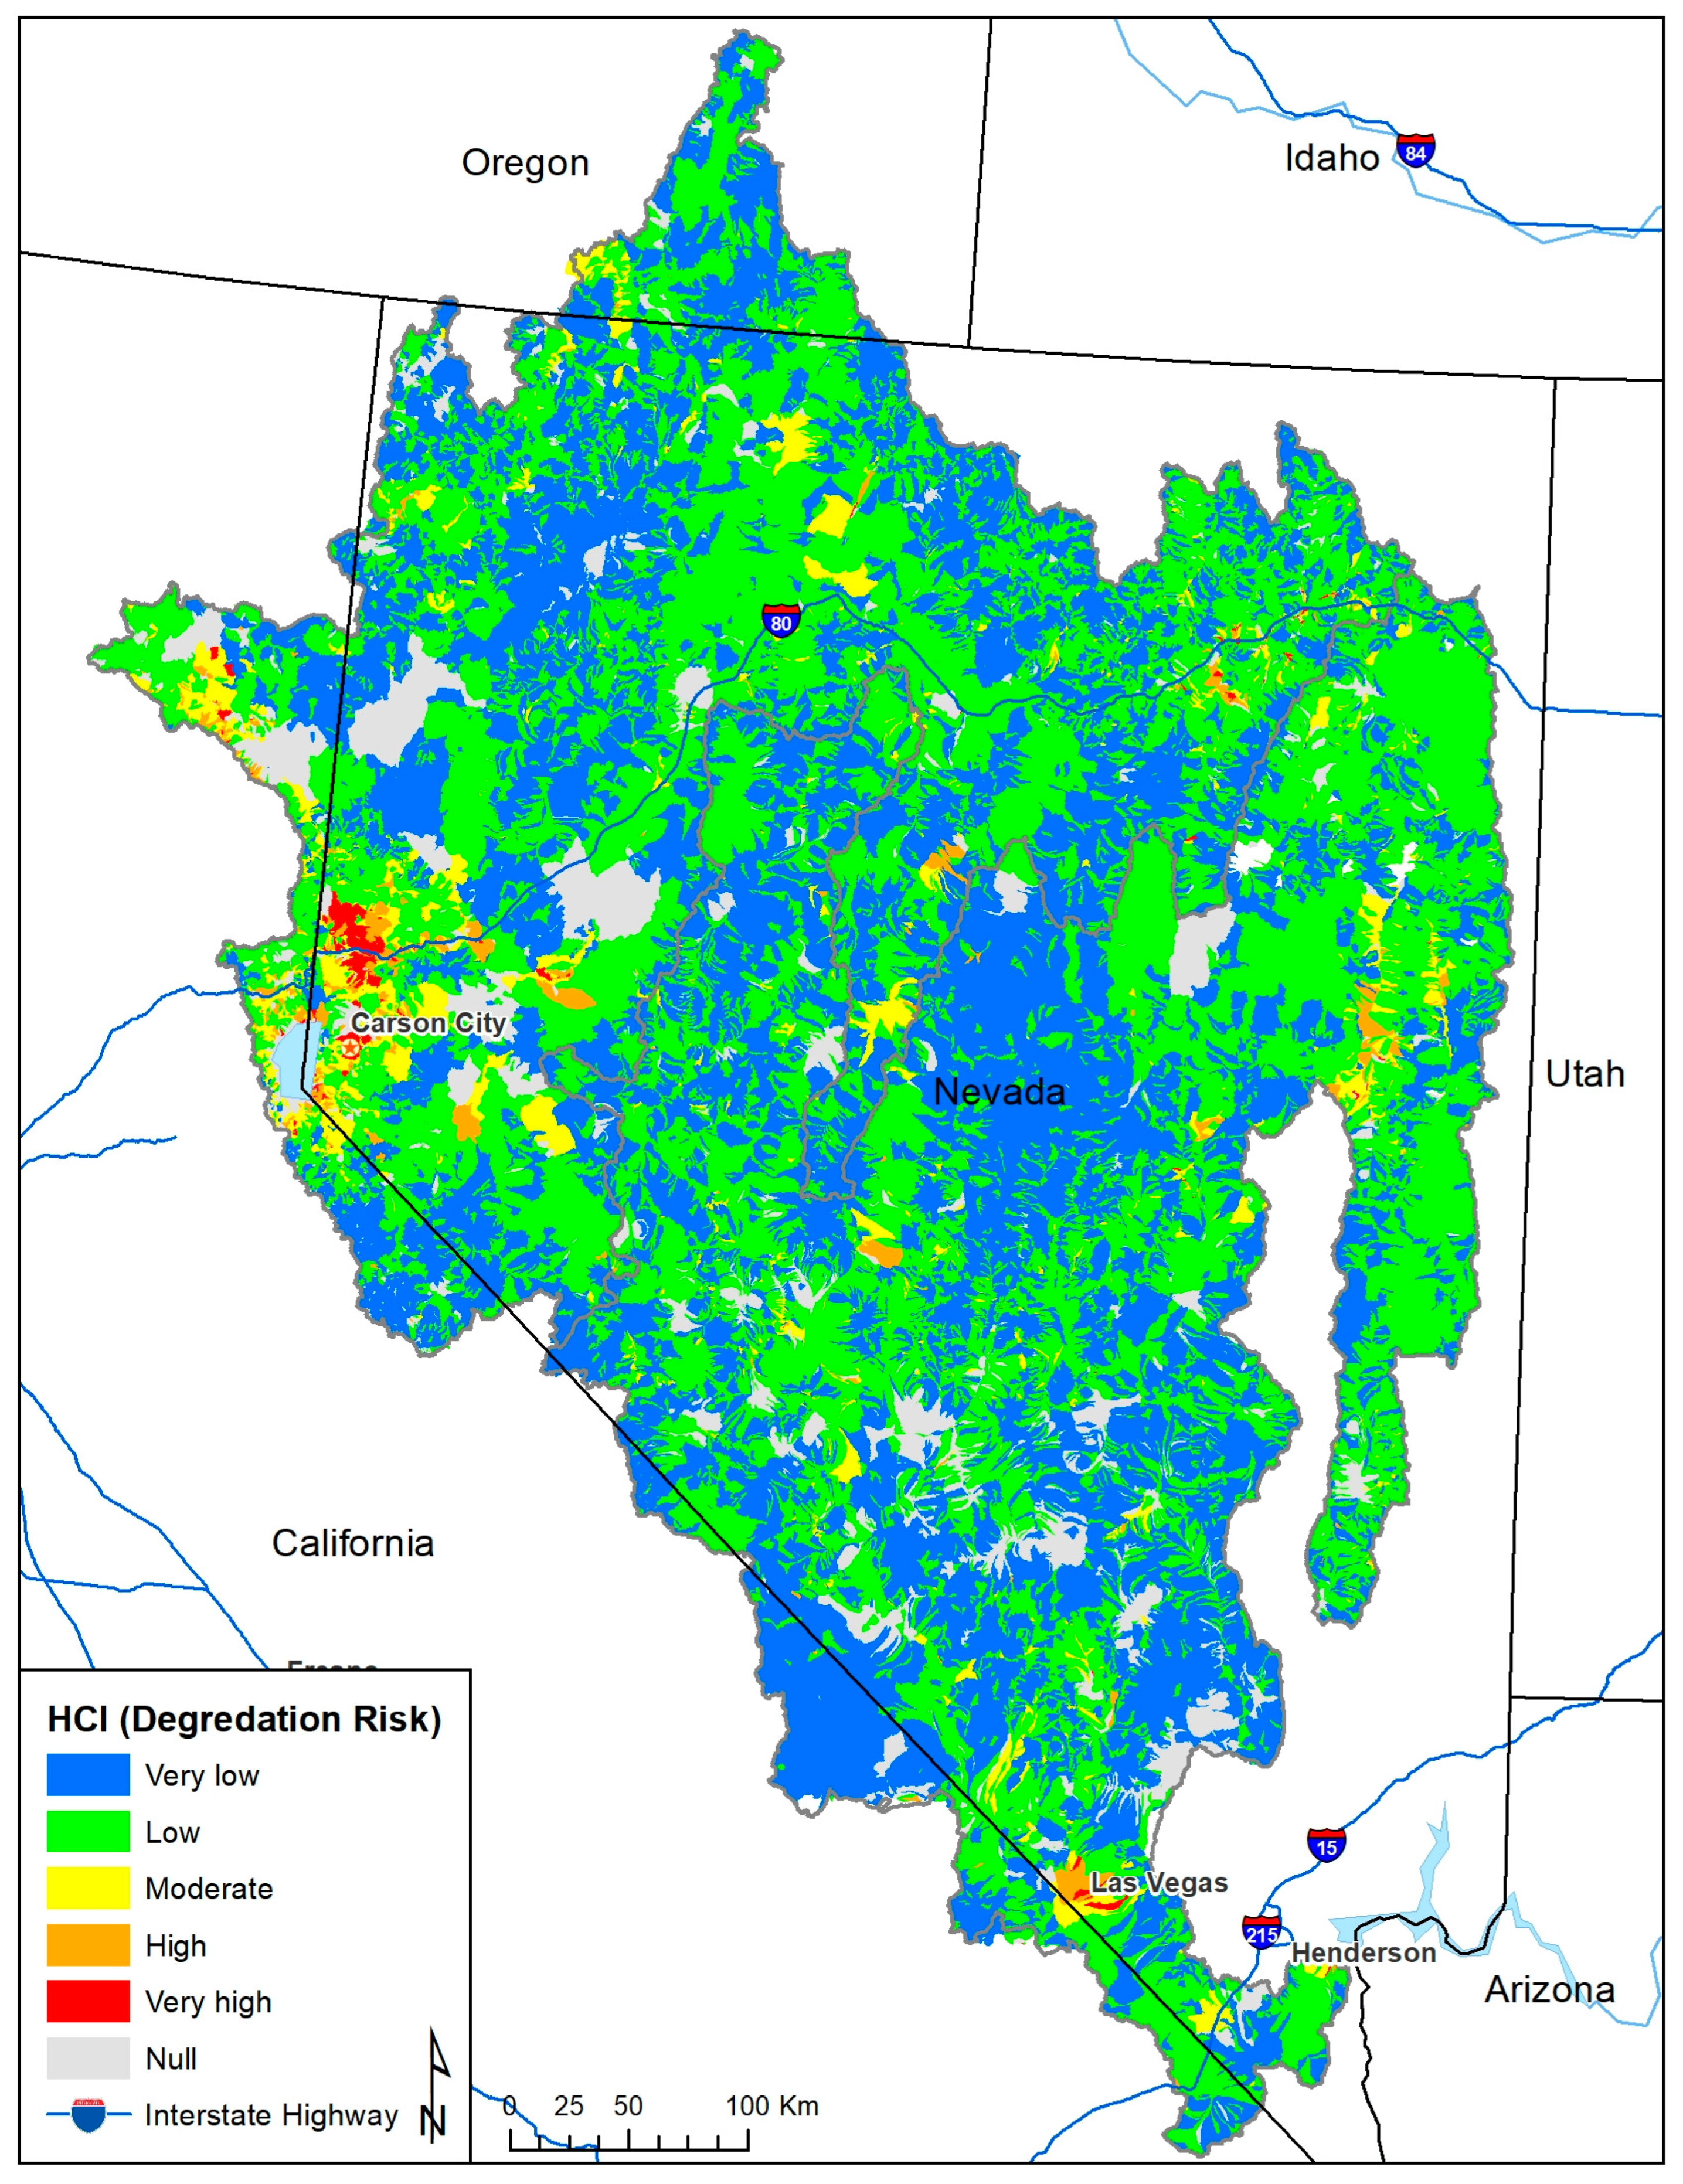
Robust assessment outputs account for the uncertainty associated with inputs [49]. We used distribution discounting to down weight species data in the watersheds with a high risk of aquatic habitat degradation using the habitat condition index (HCI) developed for the 2015 National Fish Habitat Partnership (NFHP) National Assessment of Fish Habitat [50,51]. The HCI describes the risk of stream habitat degradation for each catchment associated with a ~1 km stream segment using a cumulative index that ranges from 1 (very high risk of habitat degradation) to 5 (very low risk) (Figure 3). Whelan [52] describes the conceptual foundation for the NFHP assessment.
Species inputs were discounted using the HCI and distribution discounting in CAZ. Distribution discounting reduces species input values based on uncertainty, where α is the degree of uncertainty. When α = 0.0, then there is no uncertainty, and when α = 0.5, then the uncertainty is one half of the nominal estimate of the uncertainty model (e.g., SE of the predicted value) [29]. Habitat condition index (HCI) scores were computed for the catchments associated with each medium-resolution NHD stream segment (~1 km), and the scores were used as a measure of uncertainty. The HCI scores reflect risk of degradation as: 1 = very high, 2 = high, 3 = moderate, 4 = low, and 5 = very low (Figure 3). Since habitats with a low risk of degradation were scored highest (very low risk = 5), HCI scores were rescaled from 0 (low risk) to 1 (high risk) as a measure of species distribution uncertainty so that high-risk areas represented the highest uncertainty (UC): UC = (5 − HCI)/(4 − 1). Then, α was set to 0.5, and so species input data were discounted by species valuediscounted = species value − α × UC. Thus, if a stream segment had an occurrence probability of 0.5 for a species, and the HCI was 3 (moderate risk of degradation; UC = (5 − 3)/(4 − 1) = 0.67), then the species input (discounted occurrence probability = Pocc_discounted) for that stream segment was Pocc_discounted = Pocc − α × UC = 0.5 − 0.67 × 0.5 = 0.165; that is, the species input was reduced from a probability of 0.5 to 0.165. The HCI for a stream segment was used to discount all species inputs in the same way for that segment.
2.7. Aquatic Connectivity
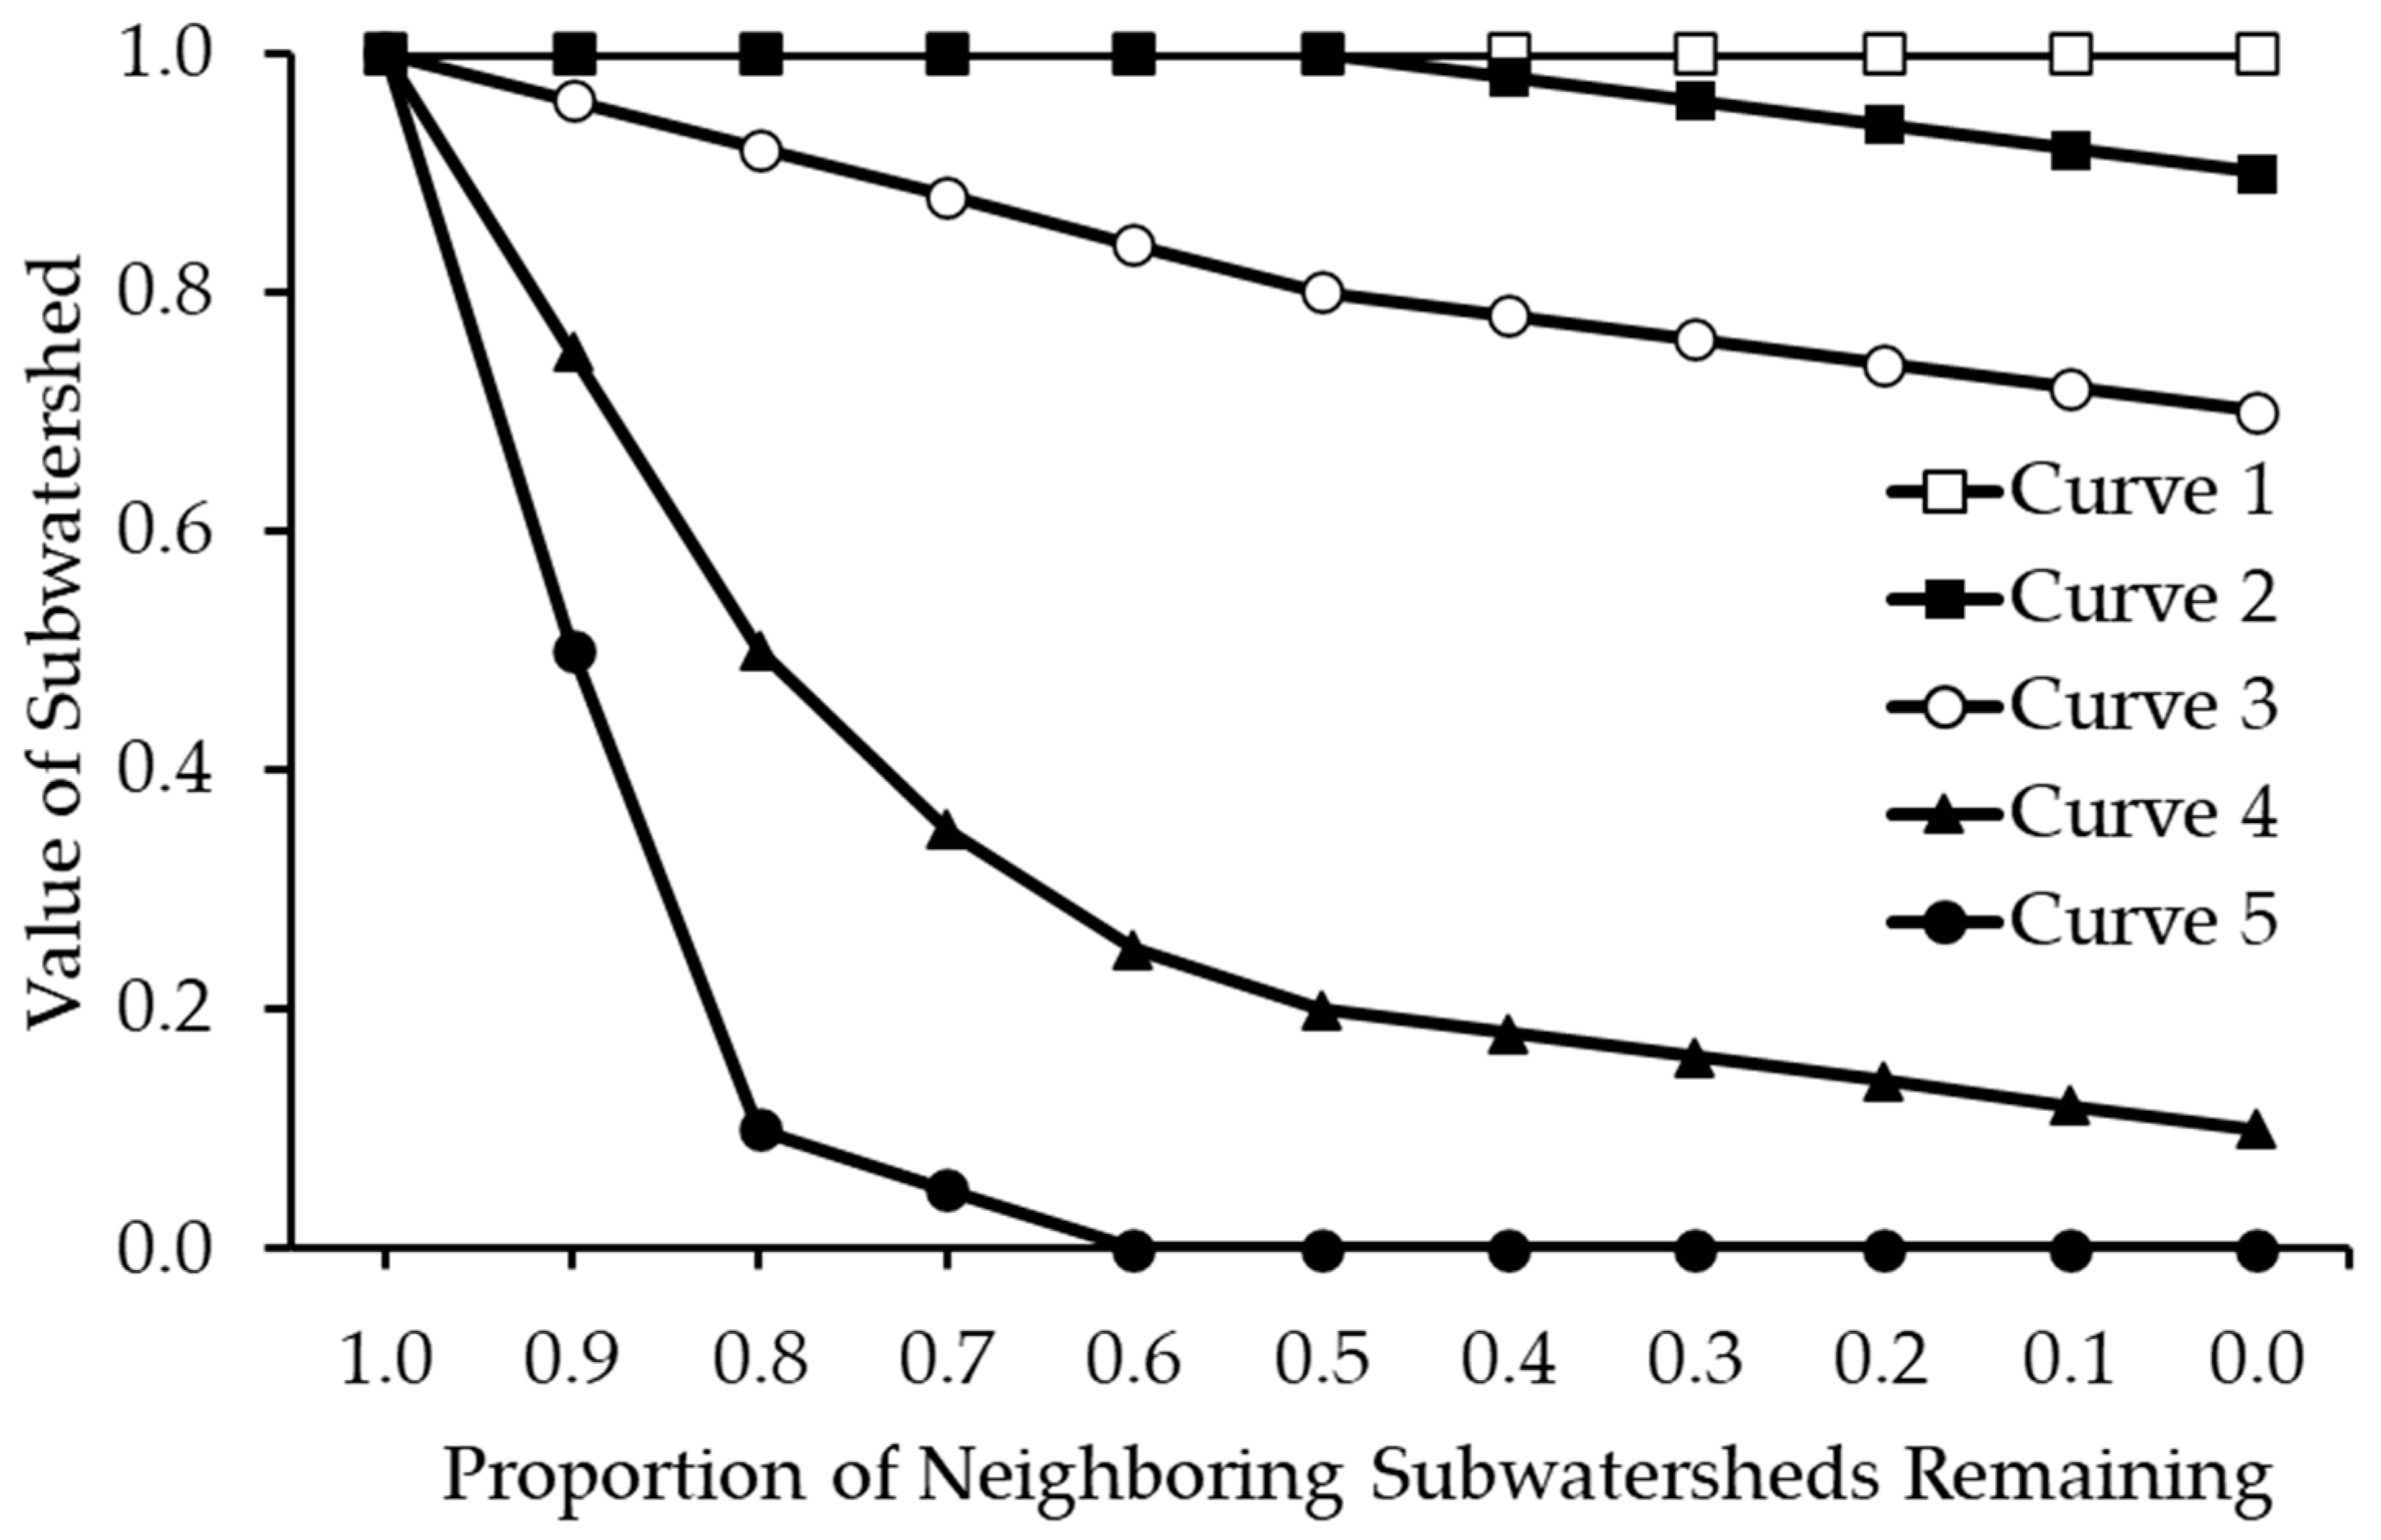
Directed aquatic connectivity was used in CAZ to account for the connectivity of dendritic stream networks [21]. Connectivity was accounted for through a proportional loss function. The assessed value of a planning unit (δi; subwatershed) was penalized based on the proportion of planning units upstream or downstream of the focal planning unit that had already been removed during prior iterations of the planning unit removal process (Figure 4). The WBD tabular data specify which subwatersheds are upstream and downstream of focal subwatersheds. Different loss curves were used for different species depending on their connectivity needs (Table 1). For example, connectivity was unimportant to the Devils Hole pupfish that resides in a single water-filled cavern in Death Valley National Park (Curve 1 in Figure 4 for both upstream and downstream connectivity; Table 1), but very important to adfluvial populations of cutthroat trout that migrate between lakes and streams to meet life history requirements (Curve 5 in Figure 4 for both upstream and downstream connectivity; Table 1). Penalties for upstream connectivity were sometimes slightly stronger than downstream to account for the fact that many fishes move upstream to spawn (Table 1) [53]. However, connectivity was intentionally interrupted at large dams (>6168 hectare-meters, or >50,000 acre-feet), according to the National Inventory of Dams database [54]; smaller dams or other barriers were not used to break connectivity, because they are more capable of being managed for fish passage [46].
3. Results
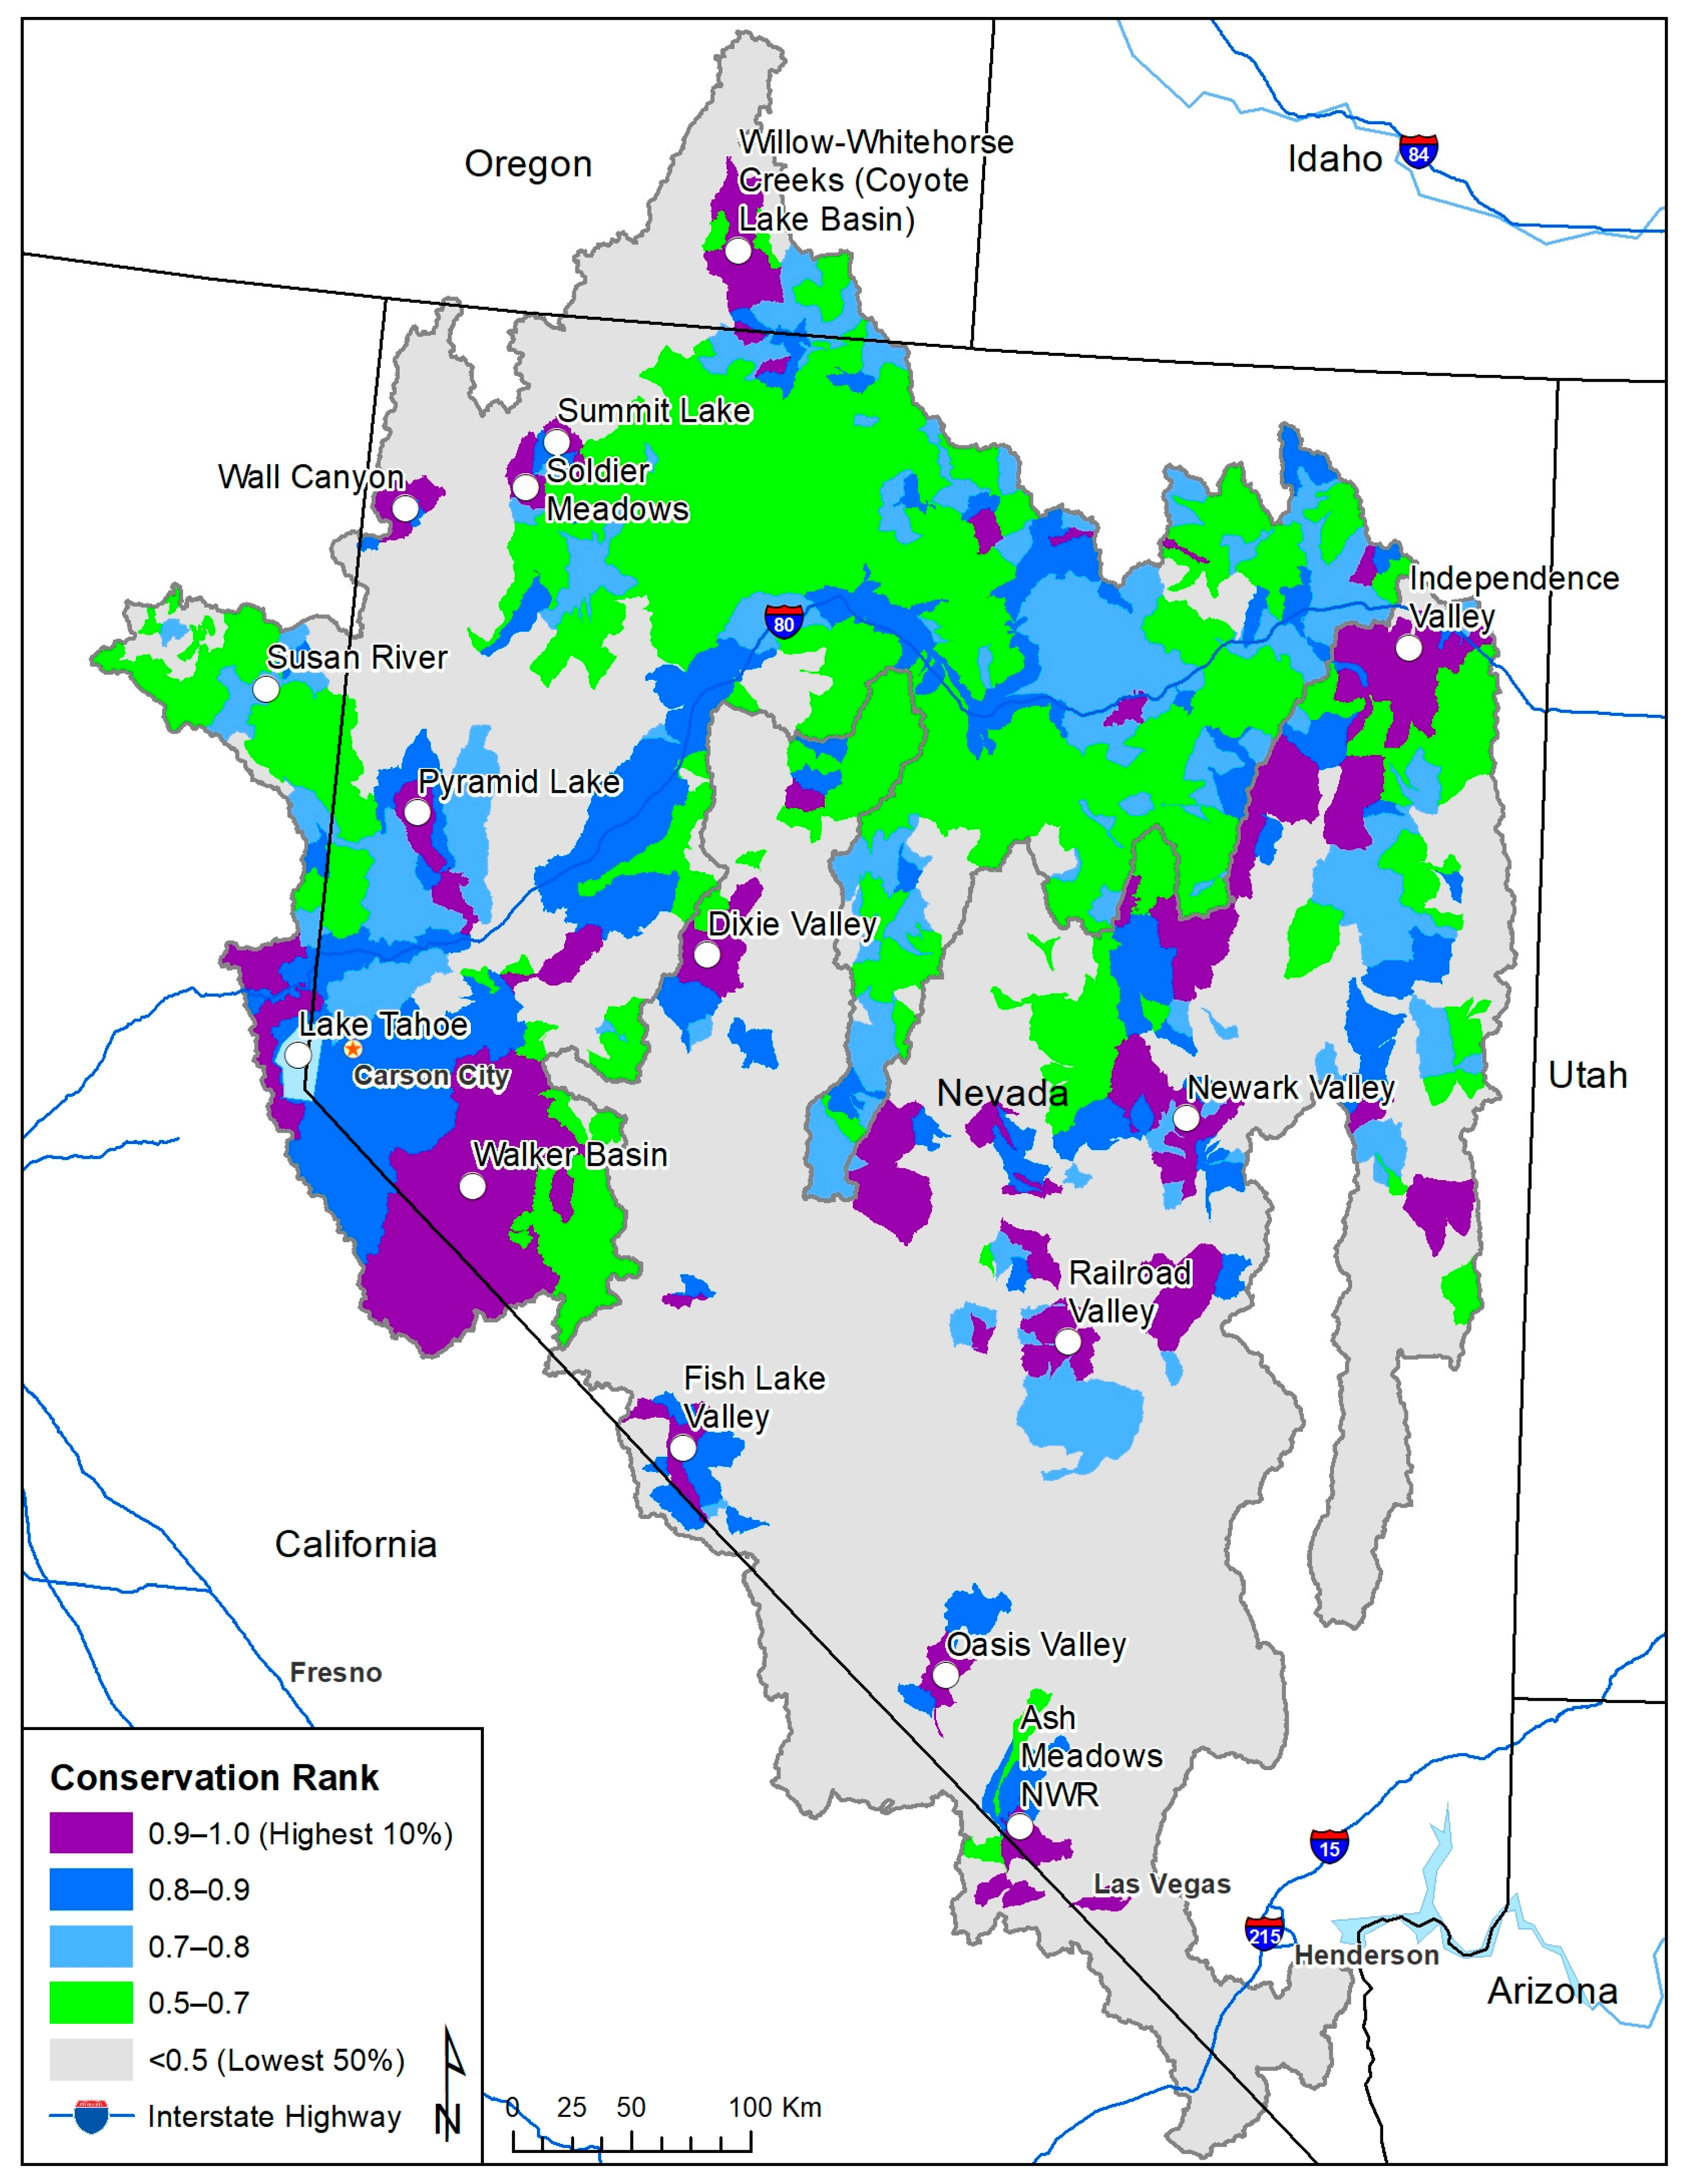
The rankings of 2042 subwatersheds (12-digit hydrologic unit code) in the Lahontan and central Nevada basins (including the Coyote Lake and Susan River basins) using core-area zonation highlighted several regions of high conservation value for native fishes (Figure 5). The rankings were based on 40 native fish species and subspecies—as well as the life history diversity, genetic diversity, abundance, and historical distribution of Lahontan cutthroat trout. The six random forest models for common, widespread non-game species fit well (AUC ≥ 0.99; out-of-bag error ≤ 3.9%), and the generalized linear model used to provide resolution to the Lahontan cutthroat trout’s historical range also fit well (AUC = 0.80).
First, much of the western Lahontan basin that heads in the Sierra Nevada mountains ranked high, including the Walker River basin (Figure 5). Also ranking high was the Truckee River basin from its headwaters, including Lake Tahoe, down to Pyramid Lake—a terminal lake. This highlights the importance of the western basin to Lahontan cutthroat trout life history and genetic diversity, the presence of endemics such as cui-ui, Chasmistes cujus, in Pyramid Lake, the connectivity needs of species such as Lahontan cutthroat trout and mountain whitefish, and habitat for other widely distributed non-game species, such as the Lahontan redside Richardsonius egregius, Tahoe sucker Catostomus tahoensis, and mountain sucker. Second, many of the small valleys throughout central Nevada that coincide with remnants of Pleistocene lakes contain endemic subspecies or forms of speckled dace, Rhinichthys osculus, and tui chub, Siphateles bicolor. Examples include: Newark Valley, Railroad Valley, Fish Lake Valley, Oasis Valley, Independence Valley, and Dixie Valley (Figure 1 and Figure 5). Other subwatersheds also ranked high, such as the Soldier Meadows region that is a habitat to the desert dace Eremichthys acros. Third, Ash Meadows National Wildlife Refuge is home to several endemic species, and Devils Hole, the only habitat occupied by the Devils Hole pupfish Cyprinodon diabolis, are in the same subwatershed. Fourth, Lahontan cutthroat trout in Willow and Whitehorse Creeks in the Coyote Lake basin represent a uniquely identifiable ecological unit [27], the Susan River basin historically had Lahontan cutthroat trout and has populations of other native fishes, and Summit Lake, Independence Lake, and Pyramid Lake have Lahontan cutthroat trout populations with an adfluvial life history. The high ranks of subwatersheds reflect these unique attributes, but also reflect habitats for non-game species predicted by the species distribution models. Last, other subwatersheds in the eastern Lahontan basin that are tributaries to the Humboldt River (by the Interstate 80 corridor) ranked 0.7 and higher, indicating that habitats may exist across the eastern Lahontan/Humboldt basin for a diverse suite of common but widespread native fishes (Figure 5).
4. Discussion
The Great Basin is a unique geographic region consisting of numerous mountain ranges separated by contemporarily disconnected hydrographic basins that contain unique aspects of ichthyofaunal diversity [25]. Our spatial conservation assessment is the first to provide a landscape-scale ranking of watersheds in the Lahontan and central Nevada basins based on species, subspecies, and some aspects of within-species ecological diversity. The high-ranking watersheds together complement each other to maximize the representation of this diversity while accounting for risk of habitat degradation. Additionally, the rankings account for the dendritic and connected nature of aquatic systems, rather than being constrained by state, county, or other administrative boundaries. In general, our assessment highlights high-value watersheds for native fishes, where conservation investments in the high-ranking subwatersheds will help ensure the persistence of native fish diversity in these basins into the future. This landscape perspective compliments the traditional conservation focus on individual small patches of habitat occupied by a single imperiled fish species [3].
The landscape rankings were applied at the spatial resolution of 12-digit hydrologic unit code (HUC12) subwatersheds that encompass ~12,000 ha, even though many native fishes in southern Nevada do, in fact, live in small patches of habitat [25,55]. While this may initially appear to be a scale mismatch, ranking the subwatersheds that encompass these small patches of critical habitat does have utility. As one example, groundwater withdrawal from an aquifer can impact water levels or streamflows in a critical habitat occupied by a species of conservation concern elsewhere in the watershed [56,57]. Watersheds can also route sediment, contaminants, and nutrients from upstream anthropogenic use, even in intermittent streams, into these critical habitats [58]. Habitats near developed areas, especially in our sparsely populated study region, are also at higher risk of future development. This spatial dependency is often reflected in build-out scenarios [59], but is not captured in the habitat condition index we used to discount species data. Using a watershed planning unit reduces the need to account for spatial processes in defining risk of habitat degradation, because the entire planning unit is given the same conservation value. Hence, a watershed approach to landscape rankings for native fishes is important for reflecting the interconnected and dendritic nature of aquatic systems, as terrestrial and aquatic impacts elsewhere in the watershed can negatively impact small patches of aquatic habitat [56,57]. Species occupying a single habitat, characteristic of several species in our analysis, are susceptible to the threat of a single catastrophic event, such as the introduction of non-native species or habitat degradation, thus highlighting the local protection needs but also consideration of threats within the broader watershed [11,60].
The Lahontan and central Nevada basins assessment will be used by the Desert Fish Habitat Partnership for decision making, but it also has broader applications. It will be used as part of DFHP’s granting program to assess whether projects proposed to them for funding occur in important watersheds for native fishes, and this assessment fills an important assessment gap in DFHP’s geography for this purpose [23]. To facilitate its use, the assessment has already been built into a webmap that allows DFHP to easily extract the conservation ranking of any watershed for grant making, conservation planning, or other purposes. The webmap also serves as an education tool for the general public, as it is available on the DFHP website (www.desertfhp.org/multispecies-aquatic-assessments, accessed on 15 January 2023).
The rankings are also available for use by natural resource agencies to inform habitat and species protection and restoration efforts. For example, they can be used to determine whether development is proposed in high-priority watersheds for native fishes. Urban and exurban development can increase water demand [56] and alter stream ecology in ways injurious to aquatic organisms, including native fishes [61]. Nevada has a rich mining history, and contemporary proposals for new mines or mine expansion could be weighed against the importance of watersheds for regional native fish diversity [62]. High-priority watersheds could also be the focus of agricultural best management practices, including livestock grazing enclosures or grazing management changes, to benefit aquatic ecosystem health [63,64,65,66,67]. High-ranking watersheds could be the focus of proactive management or land acquisition to preserve sensitive populations of native fishes, as exemplified by those species already residing within the USA National Wildlife Refuge System.
The Lahontan cutthroat trout is listed as threatened under the USA Endangered Species Act, and given that more is typically known about native trout than native non-game species, it could be used to jumpstart broader conservation planning for native fishes [68]. For example, Lahontan cutthroat trout restoration is happening in the headwaters of the Truckee River [69], and efforts to restore that species and its habitat in the watershed could benefit downstream species, such as the cui-ui that resides only in Pyramid Lake—the Truckee River terminus [42]. Conservation action focused on Lahontan cutthroat trout and cui-ui at the watershed scale could benefit other species that are not the focus of conservation, such as the mountain sucker, Tahoe sucker, and other more widely distributed native fishes.
Naturally, then, the landscape rankings in the Lahontan and central Nevada basins could be used to identify NFCAs [16,70]. While some native fishes in our analysis domain reside in one or a few small habitats, some that are currently protected (Devils Hole), other watersheds contain a diverse suite of native fishes. For example, the ESA-listed and designated sportfish Lahontan cutthroat trout could serve to anchor one or more NFCAs to identify watershed-scale connectivity and restoration needs that would extend populations downstream, facilitate migratory life histories, and potentially increase access to thermal refugia and increase population productivity [71]. As previously mentioned, spatial conservation prioritization has been used to identify a network of NFCAs in the state of Texas. The Texas NFCA Network has been used to synergize aquatic conservation planning and achieve conservation outcomes for the benefit of aquatic habitats and native fishes at watershed scales [17,18].
Our landscape assessment used the spatial analysis of quantitative data to identify a set of high-value watersheds in which conservation investments could benefit native fish diversity in the Lahontan and central Nevada basins and, generally, in the state of Nevada. Several endemic species in our analysis have been the focus of conservation efforts for over a half century [57], including land acquisitions for formal protection as national parks or national wildlife refuges. Our spatial conservation assessment highlights how these known conservation priorities compliment other watersheds to encapsulate native fish diversity at a landscape scale [72]. This includes highlighting how various watersheds that are harboring widely distributed species, such as those listed in the Endangered Species Act or not, have value (or not) within the regional context of native fish diversity. Such a comprehensive assessment can be used to understand the value of watersheds to regional biodiversity. Thus, it could drive conservation planning and strategic action to best ensure the broader suite of native fish diversity, including subspecies and unique ecological units within species, persists on the landscape into the future.
Author Contributions
Conceptualization, D.C.D.; methodology, D.C.D.; software, D.C.D.; validation, D.C.D., E.M. and C.C.; formal analysis, D.C.D.; investigation, D.C.D.; resources, D.C.D., E.M. and C.C.; data curation, D.C.D. and E.M.; writing—original draft preparation, D.C.D.; writing—review and editing, D.C.D., E.M. and C.C.; visualization, D.C.D.; supervision, D.C.D.; project administration, D.C.D.; funding acquisition, D.C.D. All authors have read and agreed to the published version of the manuscript.
Funding
Funding was provided by the Desert Fish Habitat Partnership through the United States Fish and Wildlife Service agreement F20AP11350-00.
Data Availability Statement
The watershed rankings and spatial results can be viewed here: https://www.desertfhp.org/multispecies-aquatic-assessments (accessed on 15 January 2023).
Acknowledgments
We thank anonymous reviewers and the editors for comments that improved the manuscript, and the Desert Fish Habitat Partnership for supporting the project.
Conflicts of Interest
The authors declare no conflict of interest.
References
- Isbell, F.; Balvanera, P.; Mori, A.S.; He, J.-S.; Bullock, J.M.; Regmi, G.R.; Seabloom, E.W.; Ferrier, S.; Sala, O.E.; Guerrero-Ramírez, N.R.; et al. Expert perspectives on global biodiversity loss and its drivers and impacts on people. Front. Ecol. Environ. 2023, 21, 94–103. [Google Scholar] [CrossRef]
- Harrison, I.; Abell, R.; Darwall, W.; Thieme, M.L.; Tickner, D.; Timboe, I. The freshwater biodiversity crisis. Science 2018, 362, 1369. [Google Scholar] [CrossRef] [PubMed]
- Williams, J.E. Multispecies conservation: Bringing efficiency to the science of native fish conservation. In Multispecies and Watershed Approaches to Freshwater Fish Conservation; Dauwalter, D.C., Birdsong, T.W., Garrett, G.P., Eds.; American Fisheries Society: Bethesda, MD, USA, 2019; pp. 1–9. [Google Scholar]
- Darwall, W.R.T.; Freyhof, J. Lost fishes, who is counting? The extent of the threat to freshwater fish biodiversity. In Conservation of Freshwater Fishes; Closs, G.P., Krkosek, M., Olden, J.D., Eds.; Cambridge University Press: Cambridge, UK, 2016; pp. 1–36. [Google Scholar]
- Closs, G.P.; Angermeier, P.L.; Darwall, W.R.T.; Balcombe, S.R. Why are freshwater fishes so imperiled? In Conservation of Freshwater Fishes; Closs, G.P., Krkosek, M., Olden, J.D., Eds.; Cambridge University Press: Cambridge, UK, 2016; pp. 37–75. [Google Scholar]
- Muhlfeld, C.C.; Dauwalter, D.C.; D’Angelo, V.S.; Ferguson, A.; Giersch, J.J.; Impson, N.D.; Kiozumi, I.; Kovach, R.P.; McGinnity, P.; Schoeffmann, J.; et al. Global status of freshwater trout and char: Conservation challenges in the 21st Century. In Status and Conservation of Trout and Char Worldwide; Kershner, J.L., Williams, J.E., Gresswell, R.E., Lobon-Cervia, J., Eds.; American Fisheries Society: Bethesda, MD, USA, 2019; pp. 717–760. [Google Scholar]
- Dauwalter, D.C.; Duchi, A.; Epifanio, J.; Gandolfi, A.; Gresswell, R.; Juanes, F.; Kershner, J.; Lobón-Cerviá, J.; McGinnity, P.; Meraner, A.; et al. A call for global action to conserve native trout in the 21st century and beyond. Ecol. Freshw. Fish 2020, 29, 429–432. [Google Scholar] [CrossRef]
- Higgins, J.; Zablocki, J.; Newsock, A.; Krolopp, A.; Tabas, P.; Salama, M. Durable freshwater protection: A framework for establishing and maintaining long-term protection for freshwater ecosystems and the values they sustain. Sustainability 2021, 13, 1950. [Google Scholar] [CrossRef]
- Roni, P.; Beechie, T.J.; Bilby, R.E.; Leonetti, F.E.; Pollock, M.M.; Pess, G.R. A review of stream restoration techniques and a hierarchical strategy for prioritizing restoration in Pacific Northwest watersheds. N. Am. J. Fish. Manag. 2002, 22, 1–20. [Google Scholar] [CrossRef]
- Perry, D.; Harrison, I.; Fernandes, S.; Burnham, S.; Nichols, A. Global analysis of durable policies for free-flowing river protections. Sustainability 2021, 13, 2347. [Google Scholar] [CrossRef]
- Acreman, M.; Hughes, K.A.; Arthington, A.H.; Tickner, D.; Dueñas, M.-A. Protected areas and freshwater biodiversity: A novel systematic review distils eight lessons for effective conservation. Conserv. Lett. 2020, 13, e12684. [Google Scholar] [CrossRef]
- Bernhardt, E.S.; Palmer, M.A.; Allan, J.D.; Alexander, G.; Barnas, K.; Brooks, S.; Carr, J.; Clayton, S.; Dahm, C.; Follstad-Shah, J.; et al. Synthesizing U.S. river restoration efforts. Science 2005, 308, 636–637. [Google Scholar] [CrossRef] [PubMed]
- Bernhardt, E.S.; Sudduth, E.B.; Palmer, M.A.; Allan, J.D.; Meyer, J.L.; Alexander, G.; Follastad-Shah, J.; Hassett, B.; Jenkinson, R.; Lave, R.; et al. Restoring rivers one reach at a time: Results from a survey of U.S. river restoration practitioners. Restor. Ecol. 2007, 15, 482–493. [Google Scholar] [CrossRef] [Green Version]
- Roni, P.; Åberg, U.; Weber, C. A review of approaches for monitoring the effectiveness of regional river habitat restoration programs. N. Am. J. Fish. Manag. 2018, 38, 1170–1186. [Google Scholar] [CrossRef] [Green Version]
- Beechie, T.; Pess, G.; Morley, S.; Butler, L.; Downs, P.; Maltby, A.; Skidmore, P.; Clayton, S.; Muhlfeld, C.; Hanson, K. Watershed assessments and identification of restoration needs. In Stream and Watershed Restoration; Roni, P., Beechie, T., Eds.; John Wiley & Sons: Chichester, UK, 2013; pp. 50–113. [Google Scholar]
- Williams, J.E.; Williams, R.N.; Thurow, R.F.; Elwell, L.; Philipp, D.P.; Harris, F.A.; Kershner, J.L.; Martinez, P.J.; Miller, D.; Reeves, G.H.; et al. Native Fish Conservation Areas: A vision for large-scale conservation of native fish communities. Fisheries 2011, 36, 267–277. [Google Scholar] [CrossRef]
- Birdsong, T.W.; Garrett, G.P.; Labay, B.J.; Bean, M.; Bean, P.; Botros, J.; Casarez, M.; Cohen, A.; Heger, T.; Kalmback, A.; et al. Texas Native Fish Conservation Areas Network: Strategic investments in restoration and preservation of freshwater fish diversity. In Multispecies and Watershed Approaches to Freshwater Fish Conservation; Dauwalter, D.C., Birdsong, T.W., Garrett, G.P., Eds.; American Fisheries Society: Bethesda, MD, USA, 2019; pp. 183–229. [Google Scholar]
- Garrett, G.P.; Birdsong, T.W.; Bean, M.G.; Labay, B.J. Chihuahuan Desert Native Fish Conservation Areas: A multispecies and watershed approach to preservation of freshwater fish diversity. In Multispecies and Watershed Approaches to Freshwater Fish Conservation; Dauwalter, D.C., Birdsong, T.W., Garrett, G.P., Eds.; American Fisheries Society Symposium 91: Bethesda, MD, USA, 2019; pp. 231–252. [Google Scholar]
- Birdsong, T.W.; Allen, M.S.; Claussen, J.E.; Garrett, G.P.; Grabowski, T.B.; Graham, J.; Harris, F.; Hartzog, A.; Hendrickson, D.A.; Krause, R.A.; et al. Native Black Bass Initiative: Implementing watershed-scale approaches to conservation of endemic black bass and other native fishes in the southern United States. In Black Bass Diversity: Multidisciplinary Science for Conservation; Tringali, M.D., Long, J.M., Birdsong, T.W., Allen, M.S., Eds.; American Fisheries Society: Bethesda, MD, USA, 2015; pp. 363–378. [Google Scholar]
- Ferrier, S.; Wintle, B. Quantitative approaches to spatial conservation prioritization: Matching the solution to the need. In Spatial Conservation Prioritization; Moilanen, A., Wilson, K.A., Possingham, H.P., Eds.; Oxford University Press: Oxford, UK, 2009; pp. 1–15. [Google Scholar]
- Moilanen, A.; Leathwick, J.; Elith, J. A method for spatial freshwater conservation prioritization. Freshw. Biol. 2008, 53, 577–592. [Google Scholar] [CrossRef]
- Hermoso, V.; Linke, S.; Prenda, J.; Possingham, H.P. Addressing longitudinal connectivity in the systematic conservation planning of fresh waters. Freshw. Biol. 2011, 56, 57–70. [Google Scholar] [CrossRef]
- Dauwalter, D.C.; Vail-Muse, S.L.; Thompson, T.R.; Whittier, J.B.; Johnson, K.M.; Bean, M.G. Partnering on multispecies aquatic assessments to inform efficient conservation delivery. In Multispecies and Watershed Approaches to Freshwater Fish Conservation; Dauwalter, D.C., Birdsong, T.W., Garrett, G.P., Eds.; American Fisheries Society, Symposium 91: Bethesda, MD, USA, 2019; pp. 11–32. [Google Scholar]
- Reheis, M. Extent of Pleistocene Lakes in the Western Great Basin: USGS Miscellaneous Field Studies Map. 1999. Available online: https://pubs.er.usgs.gov/publication/mf2323 (accessed on 7 January 2023).
- Sigler, W.F.; Sigler, J.W. Fishes of the Great Basin: A Natural History; University of Nevada Press: Reno, NV, USA, 1987. [Google Scholar]
- Reheis, M.C.; Sarna-Wojcicki, A.M.; Reynolds, R.L.; Repenning, C.A.; Mifflin, M.D. Pliocene to middle Pleistocene lakes in the western Great Basin: Ages and connections. In Great Basin Aquatic Systems History; Hershler, R., Madsen, D.B., Currey, D.R., Eds.; Smithsonian Institution Press: Washington, DC, USA, 2002; pp. 53–108. [Google Scholar]
- Peacock, M.M.; Neville, H.M.; Finger, A.J. The Lahontan Basin evolutionary lineage of Cutthroat Trout. In Cutthroat Trout: Evolutionary Biology and Taxonomy; Trotter, P.C., Bisson, P.A., Schultz, L.D., Roper, B.B., Eds.; American Fisheries Society: Bethesda, MD, USA, 2018; pp. 231–259. [Google Scholar]
- Overpeck, J.T.; Bonar, S.A. Southwestern fish and aquatic systems: The climate challenge. In Standing between Life and Extinction; Propst, D.L., Williams, J.E., Bestgen, K.R., Hoagstrom, C.W., Eds.; University of Chicago Press: Chicago, IL, USA, 2021; pp. 137–152. [Google Scholar]
- Moilanen, A.; Pouzols, F.M.; Meller, L.; Veach, V.; Arponen, A.; Leppänen, J.; Kujala, H. Zonation: Spatial Conservation Planning Methods and Software, Version 4.0; University of Helsinki: Helsinki, Finland, 2014. [Google Scholar]
- DFHP. Framework for Strategic Conservation of Desert Fishes; Desert Fish Habitat Partnership (DFHP): Salt Lake City, UT, USA, 2015; p. 31. [Google Scholar]
- Di Minin, E.; Veach, V.; Lehtomaki, J.; Montesino Pouzols, F.; Moilanen, A. A Quick Introduction to Zonation; University of Helsinki: Helsinki, Finland, 2014; Available online: https://researchportal.helsinki.fi/en/publications/a-quick-introduction-to-zonation (accessed on 7 January 2023).
- USGS. Watershed Boundary Dataset; U.S. Geological Survey: Washington, DC, USA, 2019.
- Haak, A.L.; Williams, J.E. Spreading the risk: Native trout management in an warmer and less-certain future. N. Am. J. Fish. Manag. 2012, 32, 387–401. [Google Scholar] [CrossRef]
- USFWS. Lahontan Cutthroat Trout (Oncorhynchus Clarkii Henshawi) 5-Year Review: Summary and Evaluation; United States Fish and Wildlife Service (USFWS): Reno, NV, USA, 2009. [Google Scholar]
- May, B.; Albeke, S. Proposed Protocol—Lahontan Cutthroat Trout Range-Wide Database Update: Historical Range, Current Status, Risk and Population Health Determinations and Population Restoration Potential Protocols; Unpublished report; 2008; p. 31. [Google Scholar]
- NatureServe. Element Occurrence Data Standard; NatureServe: Arlington, VA, USA, 2002; p. 201. [Google Scholar]
- Billman, E.J.; Lee, J.B.; Young, D.O.; McKell, M.D.; Evans, R.P.; Shiozawa, D.K. Phylogenetic divergence in a desert fish: Differentiation of speckled dace within the Bonneville, Lahontan, and Upper Snake River basins. West. N. Am. Nat. 2010, 70, 39–47. [Google Scholar] [CrossRef] [Green Version]
- Su, Y.; Moyle, P.B.; Campbell, M.A.; Finger, A.J.; O’Rourke, S.M.; Baumsteiger, J.; Miller, M.R. Population genomic analysis of the Speckled Dace species complex identifies three distinct lineages in California. Trans. Am. Fish. Soc. 2022, 151, 695–710. [Google Scholar] [CrossRef]
- Deacon, J.E.; Williams, J.E. Annotated list of the fishes of Nevada. Proc. Biol. Soc. Wash. 1984, 97, 103–118. [Google Scholar]
- Houston, D.D.; Evans, R.P.; Shiozawa, D.K. Evaluating the genetic status of a Great Basin endemic minnow: The relict dace (Relictus solitarius). Conserv. Genet. 2012, 13, 727–742. [Google Scholar] [CrossRef]
- Finger, A.J.; Benjamin, A.; Crookshanks, C.; Campbell, M.A.; Sağlam, İ.K. Broad- and fine-scale structure across the distribution of the relict dace (Relictus solitarius) in the Great Basin desert, USA. Conserv. Sci. Pract. 2022, 4, e12672. [Google Scholar] [CrossRef]
- Al-Chokhachy, R.; Heki, L.; Loux, T.; Peka, R. Return of a giant: Coordinated conservation leads to the first wild reproduction of Lahontan Cutthroat Trout in the Truckee River in nearly a century. Fisheries 2020, 45, 63–73. [Google Scholar] [CrossRef]
- Breiman, L. Random forests. Mach. Learn. 2001, 45, 5–32. [Google Scholar] [CrossRef] [Green Version]
- GBIF.org. GBIF Occurrence Download. 2020. Available online: https://doi.org/10.15468/dl.txanmk (accessed on 19 December 2020).
- Liu, C.; Newell, G.; White, M. The effect of sample size on the accuracy of species distribution models: Considering both presences and pseudo-absences or background sites. Ecography 2019, 42, 535–548. [Google Scholar] [CrossRef] [Green Version]
- Williams, R.N.; Dauwalter, D.C.; Thurow, R.F.; Philipp, D.P.; Williams, J.E.; Walser, C.A. Identification and utility of native fish conservation areas in the Upper Snake River basin. In Multispecies and Watershed Approaches to Freshwater Fish Conservation; Dauwalter, D.C., Birdsong, T.W., Garrett, G.P., Eds.; American Fisheries Society: Bethesda, MD, USA, 2019; pp. 135–159. [Google Scholar]
- Nagal, D.; Peterson, E.; Isaak, D.; Ver Hoef, J.; Horan, D. National Stream Internet Protocol and User Guide; US Forest Service, Rocky Mountain Research Station Air, Water, and Aquatic Environments Program: Boise, ID, USA, 2015; p. 46. Available online: https://www.fs.usda.gov/rm/boise/AWAE/projects/NationalStreamInternet.html (accessed on 7 January 2023).
- Isaak, D.J.; Wenger, S.J.; Peterson, E.E.; Ver Hoef, J.M.; Nagel, D.E.; Luce, C.H.; Hostetler, S.W.; Dunham, J.B.; Roper, B.B.; Wollrab, S.P.; et al. The NorWeST summer stream temperature model and scenarios for the western U.S.: A crowd-sourced database and new geospatial tools foster a user-community and predict broad climate warming of rivers and streams. Water Resour. Res. 2017, 53, 9181–9205. [Google Scholar] [CrossRef] [Green Version]
- Moilanen, A.; Wintle, B.A.; Elith, J.; Burgman, M. Uncertainty analysis for regional-scale reserve selection. Conserv. Biol. 2006, 20, 1688–1697. [Google Scholar] [CrossRef]
- Crawford, S.; Whelan, G.; Infante, D.M.; Blackhart, K.; Daniel, W.M.; Fuller, P.L.; Birdsong, T.; Wieferich, D.J.; McClees-Funinan, R.; Stedman, S.M.; et al. Through a Fish’s Eye: The Status of Fish Habitats in the United States 2015; National Fish Habitat Partnership: Washington, DC, USA, 2016. Available online: https://pubs.er.usgs.gov/publication/70200345 (accessed on 7 January 2023).
- Wang, L.; Infante, D.; Esselman, P.; Cooper, A.; Wu, D.; Taylor, W.; Beard, D.; Whelan, G.; Ostroff, A. A hierarchical spatial framework and database for the National River Fish Habitat Condition Assessment. Fisheries 2011, 36, 436–449. [Google Scholar] [CrossRef] [Green Version]
- Whelan, G.E. The really big picture for fish habitat: The conceptual underpinnings and vision for the National Fish Habitat Partnership’s National Fish Habitat Assessment. In Multispecies and Watershed Approaches to Freshwater Fish Conservation; Dauwalter, D.C., Birdsong, T.W., Garrett, G.P., Eds.; American Fisheries Society: Bethesda, MD, USA, 2019; pp. 33–55. [Google Scholar]
- Carlson, A.J.; Rahel, F.J. Annual intrabasin movement and mortality of adult Bonneville Cutthroat Trout among complementary riverine habitats. Trans. Am. Fish. Soc. 2010, 139, 1360–1371. [Google Scholar] [CrossRef]
- USACE. National Inventory of Dams; U.S. Army Corps of Engineers: Hanover, NH, USA, 2008.
- La Rivers, I. Fishes and Fisheries of Nevada; Nevada State Fish and Game Commission: Reno, NV, USA, 1962. [Google Scholar]
- Deacon, J.E.; Williams, A.E.; Deacon Williams, C.; Williams, J.E. Fueling population growth in Las Vegas: How large-scale groundwater withdrawal could burn regional biodiversity. BioScience 2007, 57, 688–698. [Google Scholar] [CrossRef] [Green Version]
- Minckley, W.L.; Deacon, J.E. Southwestern fishes and the enigma of “endangered species”. Science 1968, 159, 1424–1432. [Google Scholar] [CrossRef] [Green Version]
- Meyer, J.L.; Strayer, D.L.; Wallace, J.B.; Eggert, S.L.; Helfman, G.S.; Leonard, N.E. The contribution of headwater streams to biodiversity in river networks. J. Am. Water Resour. Assoc. 2007, 43, 86–103. [Google Scholar] [CrossRef] [Green Version]
- Dauwalter, D.C. Fish assemblage associations and thresholds with existing and projected oil and gas development. Fish. Manag. Ecol. 2013, 20, 289–301. [Google Scholar] [CrossRef]
- Williams, J.E.; Macdonald, C.A.; Deacon Williams, C.; Weeks, H.; Lampman, G.; Sada, D.W. Prospects for recovering endemic fishes pursuant to the U.S. Endangered Species Act. Fisheries 2005, 30, 24–29. [Google Scholar] [CrossRef]
- Booth, D.B.; Roy, A.H.; Smith, B.; Capps, K.A. Global perspectives on the urban stream syndrome. Freshw. Sci. 2016, 35, 412–420. [Google Scholar] [CrossRef] [Green Version]
- O’Neal, S.; Hughes, R.M. Fisheries and Hard Rock Mining: AFS Symposium Synopsis. Fisheries 2012, 37, 54–55. [Google Scholar] [CrossRef]
- Dauwalter, D.C.; Fesenmyer, K.A.; Miller, S.W.; Porter, T. Response of riparian vegetation, instream habitat, and aquatic biota to riparian grazing exclosures. N. Am. J. Fish. Manag. 2018, 38, 1187–1200. [Google Scholar] [CrossRef] [Green Version]
- Fesenmyer, K.A.; Dauwalter, D.C.; Evans, C.; Allai, T. Livestock management, beaver, and climate influences on riparian vegetation in a semi-arid landscape. PLoS ONE 2018, 13, e0208928. [Google Scholar] [CrossRef]
- Hughes, R.M.; Vadas, R.L. Agricultural effects on streams and rivers: A western USA focus. Water 2021, 13, 1901. [Google Scholar] [CrossRef]
- Dauwalter, D.C.; Baker, M.A.; Baker, S.M.; Lee, R.; Walrath, J.D. Physical habitat complexity partially offsets the negative effect of Brook Trout on Yellowstone Cutthroat Trout in the peripheral Goose Creek subbasin. West. N. Am. Nat. 2022, 82, 660–676. [Google Scholar] [CrossRef]
- Swanson, S.; Wyman, S.; Evans, C. Practical grazing management to maintain or restore riparian functions and values on rangelands. J. Rangel. Appl. 2015, 2, 1–28. [Google Scholar]
- Haak, A.L.; Williams, J.E. Using native trout restoration to jumpstart freshwater conservation planning in the Interior West. J. Conserv. Plan. 2013, 9, 38–52. [Google Scholar]
- Al-Chokhacky, R.; Peacock, M.; Heki, L.G.; Thiede, G. Evaluating the reintroduction potential of Lahontan cutthroat trout in Fallen Leaf Lake, California. N. Am. J. Fish. Manag. 2009, 29, 1296–1313. [Google Scholar] [CrossRef]
- Dauwalter, D.C.; Sanderson, J.S.; Williams, J.E.; Sedell, J.R. Identification and implementation of Native Fish Conservation Areas in the Upper Colorado River Basin. Fisheries 2011, 36, 278–288. [Google Scholar] [CrossRef]
- Armstrong, J.B.; Fullerton, A.H.; Jordan, C.E.; Ebersole, J.L.; Bellmore, J.R.; Arismendi, I.; Penaluna, B.E.; Reeves, G.H. The importance of warm habitat to the growth regime of cold-water fishes. Nat. Clim. Chang. 2021, 11, 354–361. [Google Scholar] [CrossRef] [PubMed]
- Wilson, K.A.; Cabeza, M.; Klein, C.J. Fundamental concepts of spatial conservation prioritization. In Spatial Conservation Prioritization; Moilanen, A., Wilson, K.A., Possingham, H.P., Eds.; Oxford University Press: New York, NY, USA, 2009; pp. 16–27. [Google Scholar]
Figure 1.
Lahontan basin and central Nevada basins region, USA, as well as late Pleistocene lakes [24] that help shape contemporary ichthyological diversity. State boundaries, interstate highways, and city labels (Carson City, Las Vegas, Henderson)are shown for context.
Figure 1.
Lahontan basin and central Nevada basins region, USA, as well as late Pleistocene lakes [24] that help shape contemporary ichthyological diversity. State boundaries, interstate highways, and city labels (Carson City, Las Vegas, Henderson)are shown for context.

Figure 2.
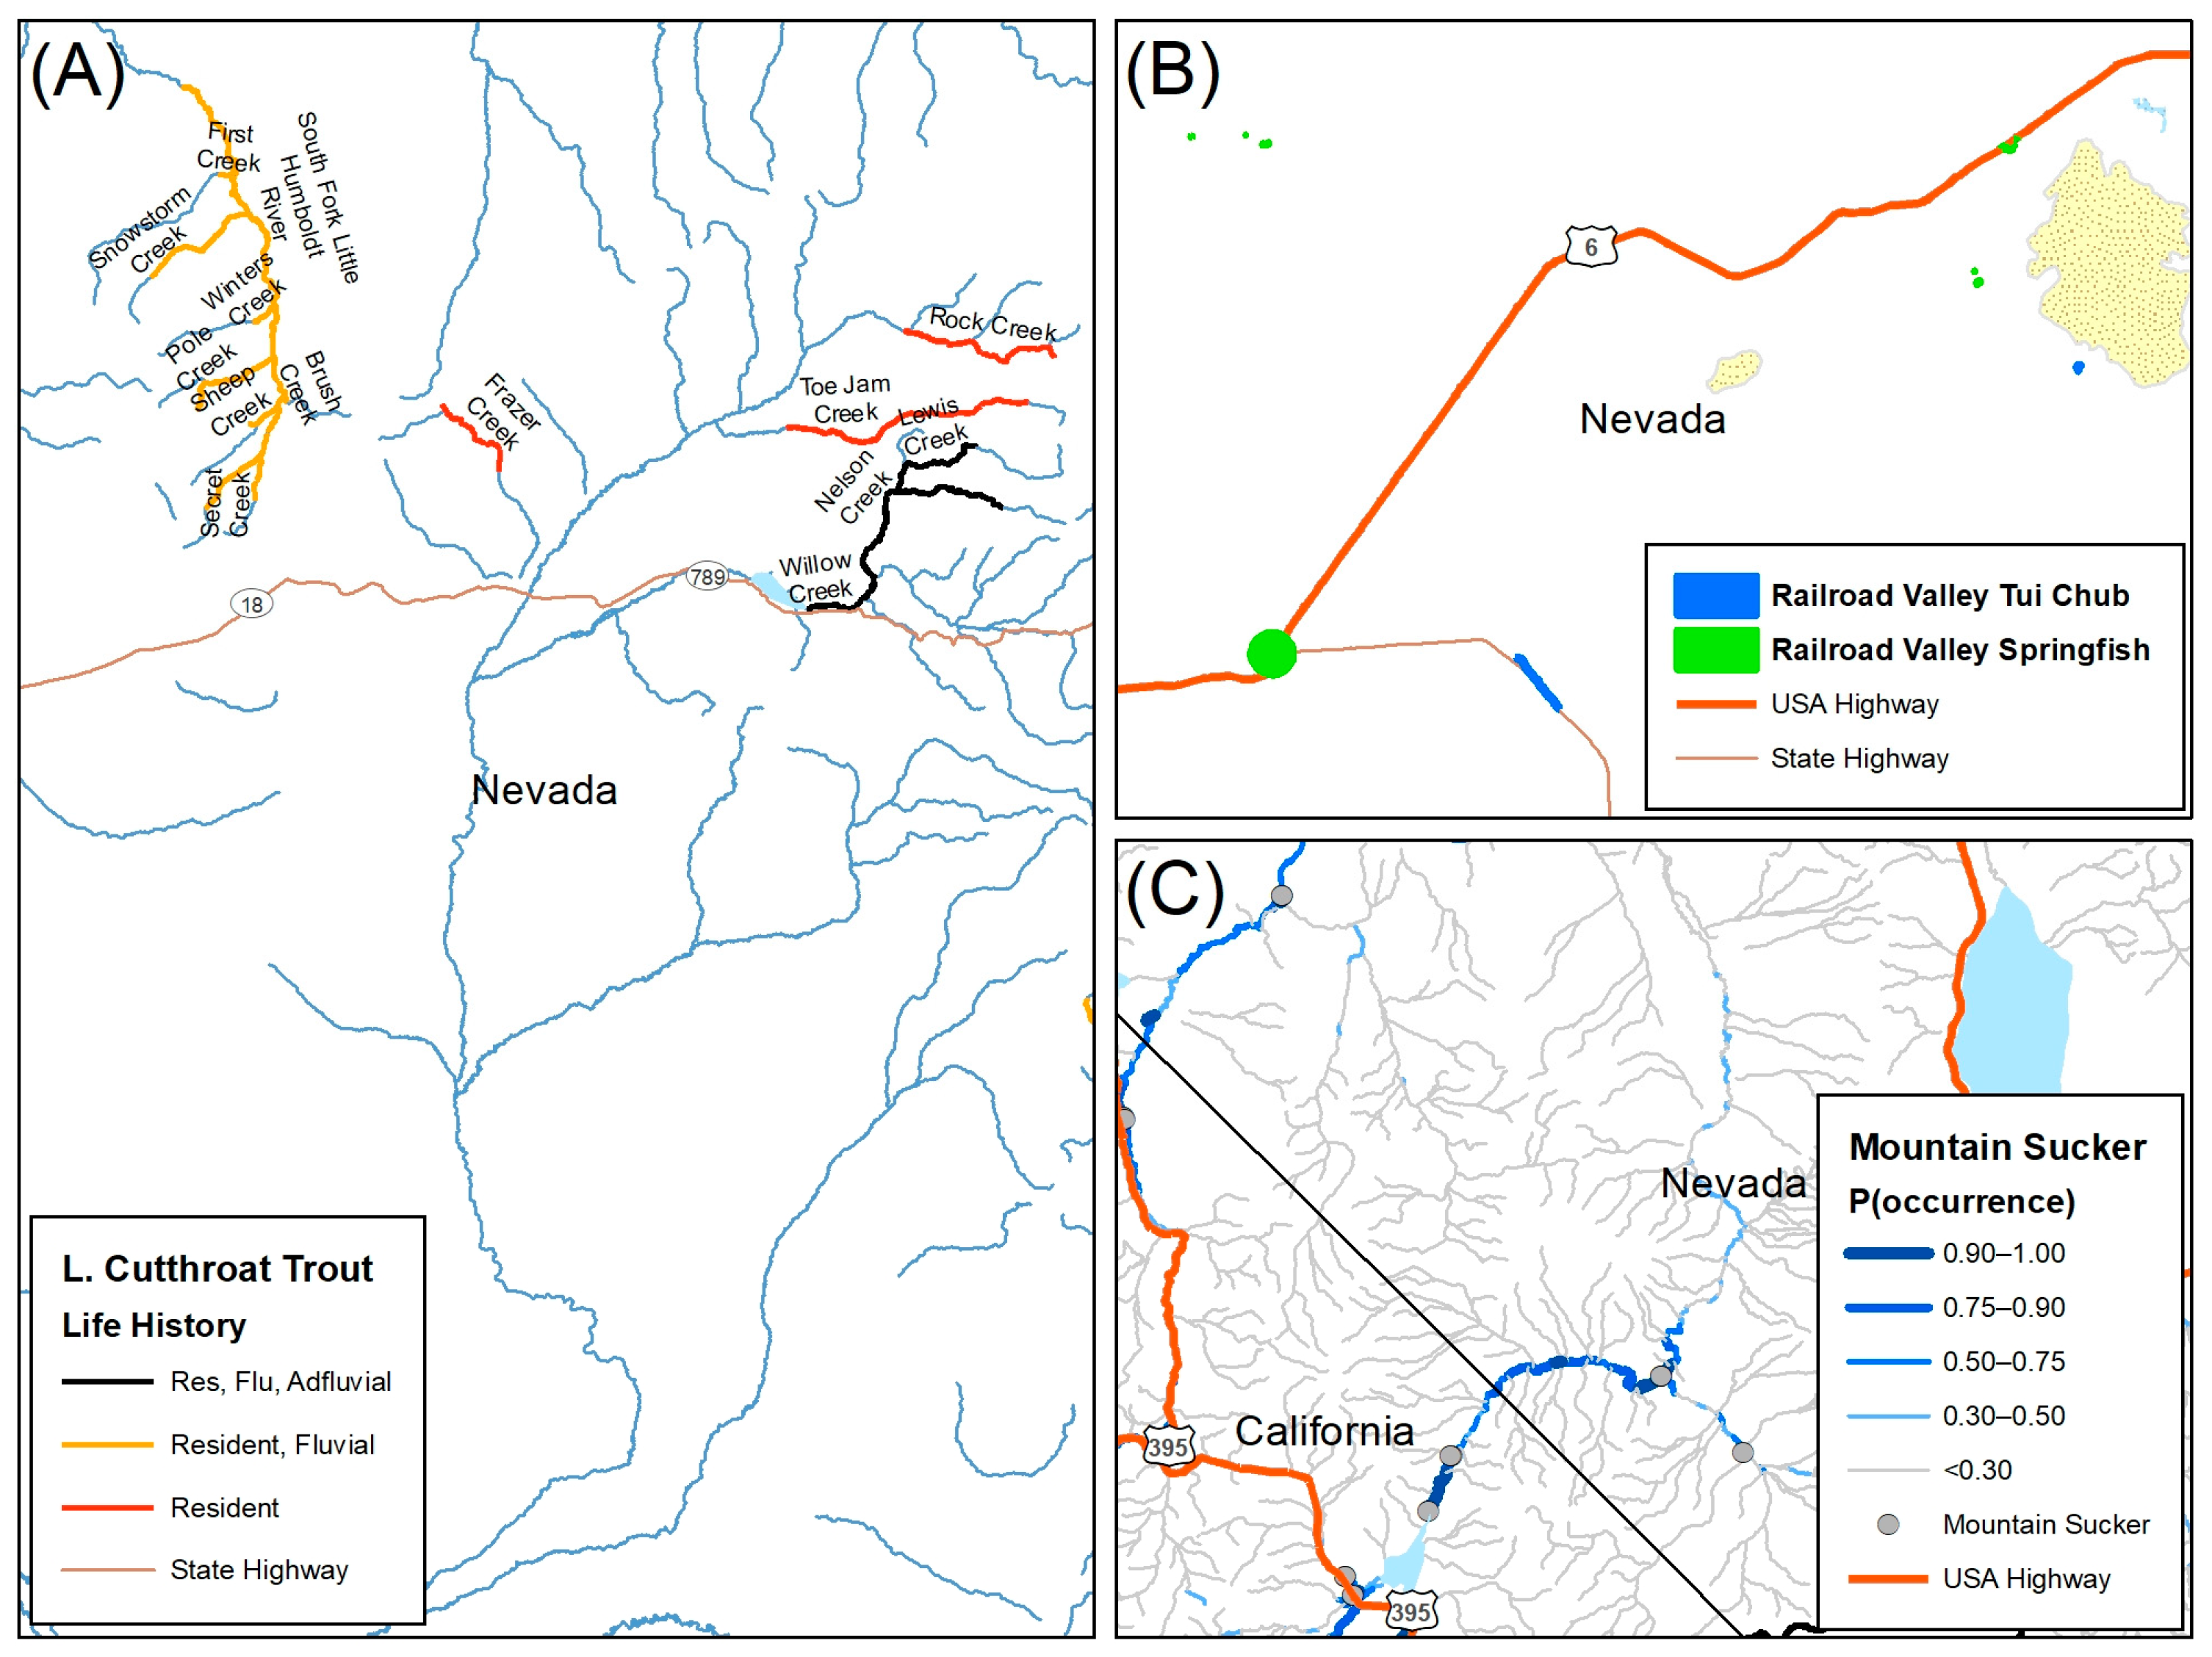
Examples of species inputs for the Lahontan and central Nevada basins native fish conservation assessment that included: (A) life history form for each Lahontan cutthroat trout population from the 2009 status assessment, (B) lines representing streams, and polygons representing lacustrine habitat of Railroad Valley tui chub and Railroad Valley springfish from the Nevada Division of Natural Heritage (NDNH) database, and (C) occurrence probabilities from species distribution models when data were not available from the NDNH (mountain sucker); Global Biodiversity Information Facility (GBIF) occurrence records are shown for mountain sucker (in grey).
Figure 2.
Examples of species inputs for the Lahontan and central Nevada basins native fish conservation assessment that included: (A) life history form for each Lahontan cutthroat trout population from the 2009 status assessment, (B) lines representing streams, and polygons representing lacustrine habitat of Railroad Valley tui chub and Railroad Valley springfish from the Nevada Division of Natural Heritage (NDNH) database, and (C) occurrence probabilities from species distribution models when data were not available from the NDNH (mountain sucker); Global Biodiversity Information Facility (GBIF) occurrence records are shown for mountain sucker (in grey).

Figure 3.
Habitat condition index (HCI) reflecting the risk of stream and river degradation for catchments in the Lahontan and central Nevada basins and used to discount species data in CAZ.
Figure 3.
Habitat condition index (HCI) reflecting the risk of stream and river degradation for catchments in the Lahontan and central Nevada basins and used to discount species data in CAZ.

Figure 4.
Proportional loss function curves specifying how the species-specific value of a subwatershed is reduced based on the proportion of neighboring subwatersheds, upstream and downstream of the focal subwatershed, that are removed during prior iterations of the removal process. Each species is assigned a connectivity curve to specify the importance of both upstream and downstream connectivity (Table 1).

Figure 5.
Subwatershed conservation rankings for native fishes in the Lahontan and central Nevada basins. Values <0.5 represent the lowest-ranking 50% of subwatersheds across the landscape, whereas values from 0.9 to 1.0 represent the highest 10% of watershed rankings. High-ranking subwatersheds and other areas of interest are labeled.


Table 1.
Common name, scientific name, Heritage ranks, model input type (presence from Nevada Division of Natural Heritage [NDNH] or occurrence probability from a species distribution model [SDM]), connectivity curve (upstream, downstream;), and DFHP rank for fish species and subspecies included in the Lahontan and central Nevada basins native fish conservation assessment. Heritage ranks are from Nevada Wildlife Action Plan. Species occurring in Nevada but outside our focal basins are not listed. * indicates species was omitted from analysis due to data deficiency.
| Common Name | Scientific Name | Heritage Rank | Model Input | Curve (Up, Down) | DFHP Rank (Weight) |
|---|---|---|---|---|---|
| Devils Hole Pupfish | Cyprinodon diabolis | G1S1 | NDNH (0 or 1) | 1, 1 | 1.89 |
| Ash Meadows Amargosa Pupfish | Cyprinodon nevadensis mionectes | G2T2S2 | NDNH (0 or 1) | 2, 2 | 1.67 |
| Warm Springs Amargosa Pupfish | Cyprinodon nevadensis pectoralis | G2T1S1 | NDNH (0 or 1) | 2, 2 | 2.22 |
| Desert Dace | Eremichthys acros | G1S1 | NDNH (0 or 1) | 2, 2 | 2.22 |
| Relict Dace | Relictus solitarius | G2G3S2S3 | NDNH (0 or 1) | 2, 2 | 2.56 |
| Ash Meadows Speckled Dace | Rhinichthys osculus nevadensis | G5T1S1 | NDNH (0 or 1) | 2, 2 | 2.00 |
| Big Smoky Valley Speckled Dace | Rhinichthys osculus lariversi | G5T1S1 | NDNH (0 or 1) | 2, 1 | 1.89 |
| Clover Valley Speckled Dace | Rhinichthys osculus oligoporus | G5T1S1 | NDNH (0 or 1) | 2, 1 | 1.89 |
| Diamond Valley Speckled Dace | Rhinichthys osculus ssp. | G5THSH | NDNH (0 or 1) | 2, 1 | 2.33 |
| Grass Valley Speckled Dace | Rhinichthys osculus reliquus | G5T5SX | NDNH (0 or 1) | 2, 1 | 2.11 |
| Independence Valley Speckled Dace | Rhinichthys osculus lethoporus | G5T1S1 | NDNH (0 or 1) | 2, 1 | 1.89 |
| Lahontan Basin Speckled Dace | Rhinichthys osculus | G5S5 | SDM (0–1) | 2, 1 | 1.00 |
| Monitor Valley Speckled Dace | Rhinichthys osculus spp. | G5T1S1 | NDNH (0 or 1) | 2, 1 | 2.44 |
| Oasis Valley Speckled Dace | Rhinichthys osculus spp. | G5T1S1 | NDNH (0 or 1) | 2, 1 | 2.11 |
| Lahontan Redside | Richardsonius egregius | G5SNR | SDM (0–1) | 1, 1 | 1.56 |
| Big Smoky Valley Tui Chub | Siphateles bicolor ssp. 8 | G4T1S1 | NDNH (0 or 1) | 2, 1 | 2.33 |
| Charnock Springs Tui Chub | Siphateles bicolor ssp. 10 | G4T1QS1 | NDNH (0 or 1) | 2, 1 | 2.33 |
| Dixie Valley Tui Chub | Siphateles bicolor ssp. 9 | G4T1QS1 | NDNH (0 or 1) | 2, 1 | 2.33 |
| Duckwater Creek Tui Chub | Siphateles bicolor ssp. 3 | G4T1S1 | NDNH (0 or 1) | 2, 1 | 2.33 |
| Fish Creek Springs Tui Chub | Siphateles bicolor euchila | G4T1QS1 | NDNH (0 or 1) | 2, 1 | 2.33 |
| Fish Lake Valley Tui Chub | Siphateles bicolor ssp. 4 | G4T1QS1 | NDNH (0 or 1) | 2, 1 | 2.44 |
| High Rock Spring Tui Chub | Siphateles bicolor ssp. 11 | G4TXSX | NDNH (0 or 1) | 2, 1 | 2.22 |
| Hot Creek Valley Tui Chub | Siphateles bicolor ssp. 5 | G4T1QS1 | NDNH (0 or 1) | 2, 1 | 2.33 |
| Independence Valley Tui Chub | Siphateles bicolor isolata | G4T1QS1 | NDNH (0 or 1) | 2, 1 | 2.33 |
| Lahontan Creek Tui Chub | Siphateles bicolor obesa | G4T4S4 | NDNH (0 or 1) | 2, 1 | 1.44 |
| Little Fish Lake Valley Tui Chub | Siphateles bicolor ssp. 6 | G4T1S1 | NDNH (0 or 1) | 2, 1 | 2.33 |
| Newark Valley Tui Chub | Siphateles bicolor newarkensis | G1T1S1 | NDNH (0 or 1) | 2, 1 | 2.11 |
| Railroad Valley Tui Chub | Siphateles bicolor ssp. 7 | G4T1QS1 | NDNH (0 or 1) | 2, 1 | 2.00 |
| Railroad Valley Springfish | Crenichthys nevadae | G2S2 | NDNH (0 or 1) | 1, 1 | 1.89 |
| Ash Meadows Poolfish | Empetrichthys merriami | GXSX | NDNH (0 or 1) | 1, 1 | 2.11 |
| Pahrump Poolfish | Empetrichthys latos latos | G1T1S1 | NDNH (0 or 1) | 1, 1 | 2.11 |
| Big Spring Spinedace | Lepidomeda bicolor pratensis | G2T1S1 | NDNH (0 or 1) | 2, 2 | 1.89 |
| Paiute Sculpin | Cottus beldingii | G5SNR | SDM (0–1) | 2, 2 | 1.33 |
| * Shorthead Sculpin | Cottus confusus | G5S1 | NDNH (0 or 1) | 1.33 * | |
| Meadow Valley Wash Desert Sucker | Catostomus clarkii spp. 2 | G3G4T2S2 | NDNH (0 or 1) | 2, 2 | 2.22 |
| Mountain Sucker | Catostomus platyrhynchus | G5SNR | SDM (0–1) | 2, 2 | 0.89 |
| Tahoe Sucker | Catostomus tahoensis | G5S5 | SDM (0–1) | 2, 2 | 1.89 |
| Wall Canyon Sucker | Catostomus sp. | G1S1 | NDNH (0 or 1) | 2, 2 | 2.67 |
| Cui-ui | Chasmistes cujus | G1S1 | NDNH (0 or 1) | 2, 2 | 1.56 |
| Mountain Whitefish | Prosopium williamsoni | G5S3 | SDM (0–1) | 4, 4 | 1.44 |
| Lahontan Cutthroat Trout | Oncorhynchus clarkii henshawi | G4T3S3 | Rangewide DB | (2.25) * | |
| Western Lahontan UIEU Resident | #/km | 3, 3 | 0.250 | ||
| Adfluvial | #/km | 5, 5 | 0.250 | ||
| NW Lahontan UIEU Resident | #/km | 3, 3 | 0.250 | ||
| Adfluvial | #/km | 5, 5 | 0.250 | ||
| Eastern Lahontan UIEU Resident | #/km | 3, 3 | 0.167 | ||
| Fluvial | #/km | 4, 4 | 0.167 | ||
| Adfluvial | #/km | 5, 5 | 0.167 | ||
| Coyote Lakes UIEU Resident | #/km | 3, 3 | 0.500 | ||
| Historical Streams | SDM (0–1) | 3, 3 | 0.125 | ||
| Lakes | Presence = 1 | 4, 3 | 0.125 |
Disclaimer/Publisher’s Note: The statements, opinions and data contained in all publications are solely those of the individual author(s) and contributor(s) and not of MDPI and/or the editor(s). MDPI and/or the editor(s) disclaim responsibility for any injury to people or property resulting from any ideas, methods, instructions or products referred to in the content. |
© 2023 by the authors. Licensee MDPI, Basel, Switzerland. This article is an open access article distributed under the terms and conditions of the Creative Commons Attribution (CC BY) license (https://creativecommons.org/licenses/by/4.0/).
Share and Cite
MDPI and ACS Style
Dauwalter, D.C.; Miskow, E.; Crookshanks, C. Spatial Conservation Assessment for Native Fishes in the Lahontan and Central Nevada Basins, USA. Water 2023, 15, 1087. https://doi.org/10.3390/w15061087
AMA Style
Dauwalter DC, Miskow E, Crookshanks C. Spatial Conservation Assessment for Native Fishes in the Lahontan and Central Nevada Basins, USA. Water. 2023; 15(6):1087. https://doi.org/10.3390/w15061087
Chicago/Turabian StyleDauwalter, Daniel C., Eric Miskow, and Chris Crookshanks. 2023. "Spatial Conservation Assessment for Native Fishes in the Lahontan and Central Nevada Basins, USA" Water 15, no. 6: 1087. https://doi.org/10.3390/w15061087
Note that from the first issue of 2016, this journal uses article numbers instead of page numbers. See further details here.