

Optimal Allocation of Water Resources Based on GWAS Model in Handan, China

1
School of Water Conservancy and Hydroelectric Power, Hebei University of Engineering, Handan 056021, China
2
School of Earth Science and Engineering, Hebei University of Engineering, Handan 056021, China
3
Hebei Key Laboratory of Intelligent Water Conservancy, Handan 056001, China
*
Author to whom correspondence should be addressed.
Water 2023, 15(6), 1090; https://doi.org/10.3390/w15061090
Submission received: 3 February 2023
/
Revised: 8 March 2023
/
Accepted: 9 March 2023
/
Published: 13 March 2023
(This article belongs to the Section Water Resources Management, Policy and Governance)
Abstract
:Optimal allocation of water resources is an effective way to solve the supply and demand contradiction between water resources and water users. Recently, the rapid economic and social development of Handan has significantly increased water demand in various industries. Superimposed on the reduction of incoming water in upstream rivers and the limitation of the total amount of groundwater extraction, a large number of water sources such as South-to-North Water Diversion, Yellow River Water Diversion, and Weihe River Water Diversion are used to replace domestic and industrial water. In support of Handan’s dynamic supply and demand of water resources, the transported water was generalized as a virtual reservoir and introduced into the GWAS model. The allocation results show that the total water shortage volume and rate of Handan was 527.60 × 10⁶ m3 and 17.92% in 2025 at a P = 50%, respectively. Water shortage was concentrated in the primary industry. The allocation results align with actual water use conditions. The allocation of transported water is more reasonable than the conventional allocation scheme, and the domestic water is completely replaced by the South-to-North Water Diversion in the eastern plain of Handan. These research results can provide a technical reference for water resource allocation in Handan.
1. Introduction
China’s total water resources are 2.8 trillion m3, accounting for 6% of the global water resources, ranking fourth in the world. However, the per capita water resources are only 2300 m3, which is only a quarter of the world average level, ranking 110th in the world, and listed by the United Nations as one of the 13 countries with the poorest per capita water resources in the world [1,2]. With the rapid development of China’s economy and society, the demand for water in various industries has increased significantly. Simultaneously, with the frequent occurrence of water pollution incidents, the contradiction between the supply and demand of water resources has become increasingly prominent. Therefore, the rational and effective allocation of limited water resources and ensuring the normal development of the national economy to the greatest extent is an important issue in water resource research [3,4].
The optimal allocation of water resources is an important means of solving the contradiction between the production and life of human society and the supply and demand of water resources. Scholars have conducted research aimed at water resource problems that arise in different stages by studying water resource allocation methods and models under the framework of the theoretical system of water resource optimal allocation [5]. In 1962, Professor Maass systematically expounded on the connotation of water resources in his book Design of Water Resource Systems and explained the feasibility of using computer technology to construct a sub-model of a water resource system [6]. With the development of the mathematical programming theory, large-scale system decomposition, and coordination theory, many scholars have used the analytic hierarchy process, linear, stochastic, dynamic, and fuzzy programming, or a combination of multiple methods to establish optimal allocation models for water resources with different functions [7,8,9,10,11,12,13,14]. Multi-objective programming (MOP) is widely used in studying the optimal allocation of water resources to solve the problem of coordinated development of water resources and complex systems such as society and the economy. MOP is widely used in the ecological allocation of water resources [15,16,17,18]. In 1987, the concept of sustainable development was formally proposed by the United Nations World Commission on Environment and Development [19,20]. Since then, taking social, economic, and ecological benefits as objectives, and taking into account constraints such as regional geographic characteristics, climate change, demand for water resource management, water quantity, water quality, and water conservancy projects, the concept of sustainable development reflects the multi-objective allocation of water resources [21,22,23,24]. Wang et al. [25] proposed a theory for the optimal allocation of regional water resources based on macroeconomics. Furthermore, Chang et al. [26] used macroeconomic methods to study the rational allocation and optimal dispatch of water resources in the Yellow River Basin. This approach is based on the principles of sustainable development. In addition, Feng et al. [27,28] proposed a theoretical framework for sustainable utilization planning of new water resource systems. Huang et al. [29] established a deterministic multi-objective optimization model for the joint deployment of multiple water sources using systematic scientific methods and proposed solution ideas and methods for the multi-objective optimization model, laying a theoretical foundation for the optimal dispatching of urban water supply sources.
In terms of water resources optimal allocation models, scholars have developed models such as OOGIS, Waterware, Aquarius, ICMS, WMS, WROOM, MIKEBASIN, and WEAP [30]. Among them, MIKEBASIN and WEAP have been the most widely used. MIKEBASIN [31] is an integrated decision support software for basin water resources planning and management developed by the Danish Water and Environment Institute (DHI). MIKEBASIN takes the river system as the backbone, projects, users, and catchment points as nodes and corresponding hydraulic connections, constructs a watershed system diagram, and realizes dynamic simulation with the systems established by users and the corresponding attributes of select objects [32]. The model has been applied in water resource planning and management for several watersheds and regions [33,34,35]. While MIKEBASIN had achieved good results across many areas, it was not effective in areas with strong human activities [36,37]. The WEAP model [38] was developed by Raskin in 1992. Yates et al. [39] improved the WEAP model in 2005 and put forward the integrated water resource management model WEAP21. The reliable design principle and good GUI interface of the model provided convenience for researchers to construct a model network. Many researchers had applied it to river basins or regional water resource planning and management [40,41,42,43,44]. However, the WEAP model was demand-driven. If there were no crops in the winter farmland, the WEAP model could not directly generate irrigation water demand. This did not meet the requirements for winter irrigation in northern China. Although the latest version of the WEAP model had been adjusted to solve this problem, the setup process was tedious [45]. In addition, reservoirs operated according to water demand in the WEAP model, which may cause the simulated operation of the reservoir to be inconsistent with the actual situation [46,47].
In 2019, Sang et al. [48] developed a water resources simulation and allocation system model software platform, the GWAS model, where the second-generation non-dominated sorting genetic (NSGA-II-S) algorithm with elitist strategy is embedded in the model for model solving [49]. The GWAS model has the advantages of a high degree of interface visualization, strong operability, and convenient data management and has been used by many water resource researchers in studying water resource allocation in different regions and basins [50,51,52,53,54,55,56,57,58]. However, when dealing with water distribution through manual water diversion channels, GWAS cannot follow the water distribution principle of natural rivers from upstream to downstream and can only distribute water according to a fixed distribution scheme. The result of water distribution cannot be adjusted dynamically according to actual water demand.
With the rapid social and economic development in Handan, the demand for water resources in different industries has increased significantly, and the contradiction between the supply and demand of water resources in Handan is very prominent. Since 2014, a comprehensive control project for groundwater overexploitation has been implemented which has limited the scale of regional groundwater exploitation, and new construction of a water diversion project from the Yellow River was finished. Simultaneously, after 2018, the South-to-North Water Diversion gradually replaced domestic and industrial water in the eastern plains of Handan, and the form of the water supply has undergone major changes. Making good use of the South-to-North Water Diversion, flexible use of Yellow River transferred water, and limiting groundwater exploitation are new problems facing water resource management in Handan. Therefore, this study used the GWAS model to study the rational allocation of water resources in Handan in the new era. In the process of model construction, the conception of virtual reservoirs was added to the model, and the South-to-North Diversion Water, Yellow River Transferred Water, Weihe River Transferred Water, and Yuefeng Channel Transferred Water were generalized as virtual reservoirs, which made the transported water project have dynamic regulation characteristics and capacity.
2. Materials and Methods
2.1. The GWAS Model: Computational Unit Division
The establishment of the GWAS model [59] first requires the division of hydrological calculation units, which are mainly obtained by the nested division of water resources and administrative divisions. The model needs to input the reservoir, river system, water resources basin zoning, and administrative area layers. These layers must have the same projected coordinate system. The GWAS model automatically identifies the geographical information characteristics of the water resource and administrative divisions in the research area and then generates and extracts basic hydrological calculation units according to the principle of GIS superposition and division.
2.2. Establishing the Topological Relationship between Water Supply and Consumption
The GWAS model needs to manually establish the topological relationship of the water supply based on actual river reservoir conditions, water user distribution, and hydraulic engineering facilities in the study area. The topological relationship of water supply includes three parts: reservoir–reservoir, reservoir–unit, and unit–unit relationships. The reservoir–reservoir relationship indicates that the reservoir supplies water to another reservoir, and the water supply relationship is established according to whether there is a channel or an upstream–downstream connection relationship between the reservoirs. The reservoir–unit relationship indicates that the reservoir supplies water to the hydrological calculation unit and is established according to the actual water supply route and water supply objects of the reservoir. The unit–unit relationship represents the confluence relationship or drainage relationship between units in the study area and is established according to the upstream and downstream relationships of the river system and the connection relationship of the channel system in the study area.
2.3. Model Building
GWAS builds a multi-objective water resource optimal allocation model with a minimum load-balancing objective function and a spatial equilibrium objective function [48]. The load-balancing object is reflected by the minimum index of the industry water shortage rate, which can indicate the degree of satisfaction of industrial water demand within the calculated unit. The spatial equilibrium object is reflected by the variance index of the water scarcity rate in industrial spatial units, which is expressed as the fairness of water use in the different units of each industry. The smaller the final result of the model output, after the two objective function values are weighted by the fairness coefficient and the water shortage rate coefficient, the stronger the global optimization ability.
2.3.1. Objective Function
(1) Load-balancing object:
(2) Spatial equilibrium object:
2.3.2. Restrictions
(1) Water supply capacity constraint: The allocated water volume of the water source should be less than or equal to the available water volume of the water source.
where is the water supply of industry users from the water source to unit and is the available water resource from the water source to the unit .
(2) Water demand constraints. The water demand of each unit shall be between the corresponding maximum and minimum water demand.
(3) Water transport capacity constraints. The total water supply of each source shall not exceed the upper limit of the water transfer capacity of the source:
where is the upper limit of the water transmission capacity of water source to supply water to each unit .
(4) Ecological flow constraints: River flow should meet the constraints of the river’s ecological base flow:
where is the flow of the river course during the period ; is the minimum water consumption of the river course during the period , that is, the ecological base flow of the river course.
2.3.3. Configuration Parameters
The allocation parameters of GWAS include the distribution ratio coefficient of water sources in the industry and the optimal allocation parameters. The distribution ratio coefficient of water sources in the industry is a ratio of the water supply quantity to the water demand quantity. It can represent how much of the total water demand of each industry belongs to this type of water source. Optimized allocation parameters include the industry weight coefficient, water shortage rate weight coefficient, and fairness weight coefficient. The numerical value of the industry weight coefficient reflects the degree of social and economic harm caused by water shortages for each industry. The water shortage rate weight coefficient and fairness weight coefficient are a medium to link the spatial equalization objective and the load equalization objective, and can be set according to the water resource manager’s preference.
2.3.4. Solution Method
The model is solved using the second-generation non-dominated sorting genetic (NSGAII-S) algorithm with an elitist strategy. For multi-objective problems, the traditional genetic algorithm assumes that the importance weights of multiple engineering objectives are the same, which is inconsistent with reality. The NSGA-II algorithm is used to solve multi-objective problems. After the continuous evolution of the crossover and mutation mechanisms of the genetic algorithm, a non-dominated subset with a Pareto front can be obtained, but it easily falls into a local optimum. In this study, the expert experience was used to select the optimal genetic seed, intervening in the mating strategy of the genetic algorithm such that the genetic algorithm without a mechanism can be explained mechanically. It not only maintains the solution advantages of the NSGA-II algorithm but also shortens the calculation time, effectively solves the dimensionality problem, and improves the calculation efficiency.
2.4. Case Study
2.4.1. Study Area
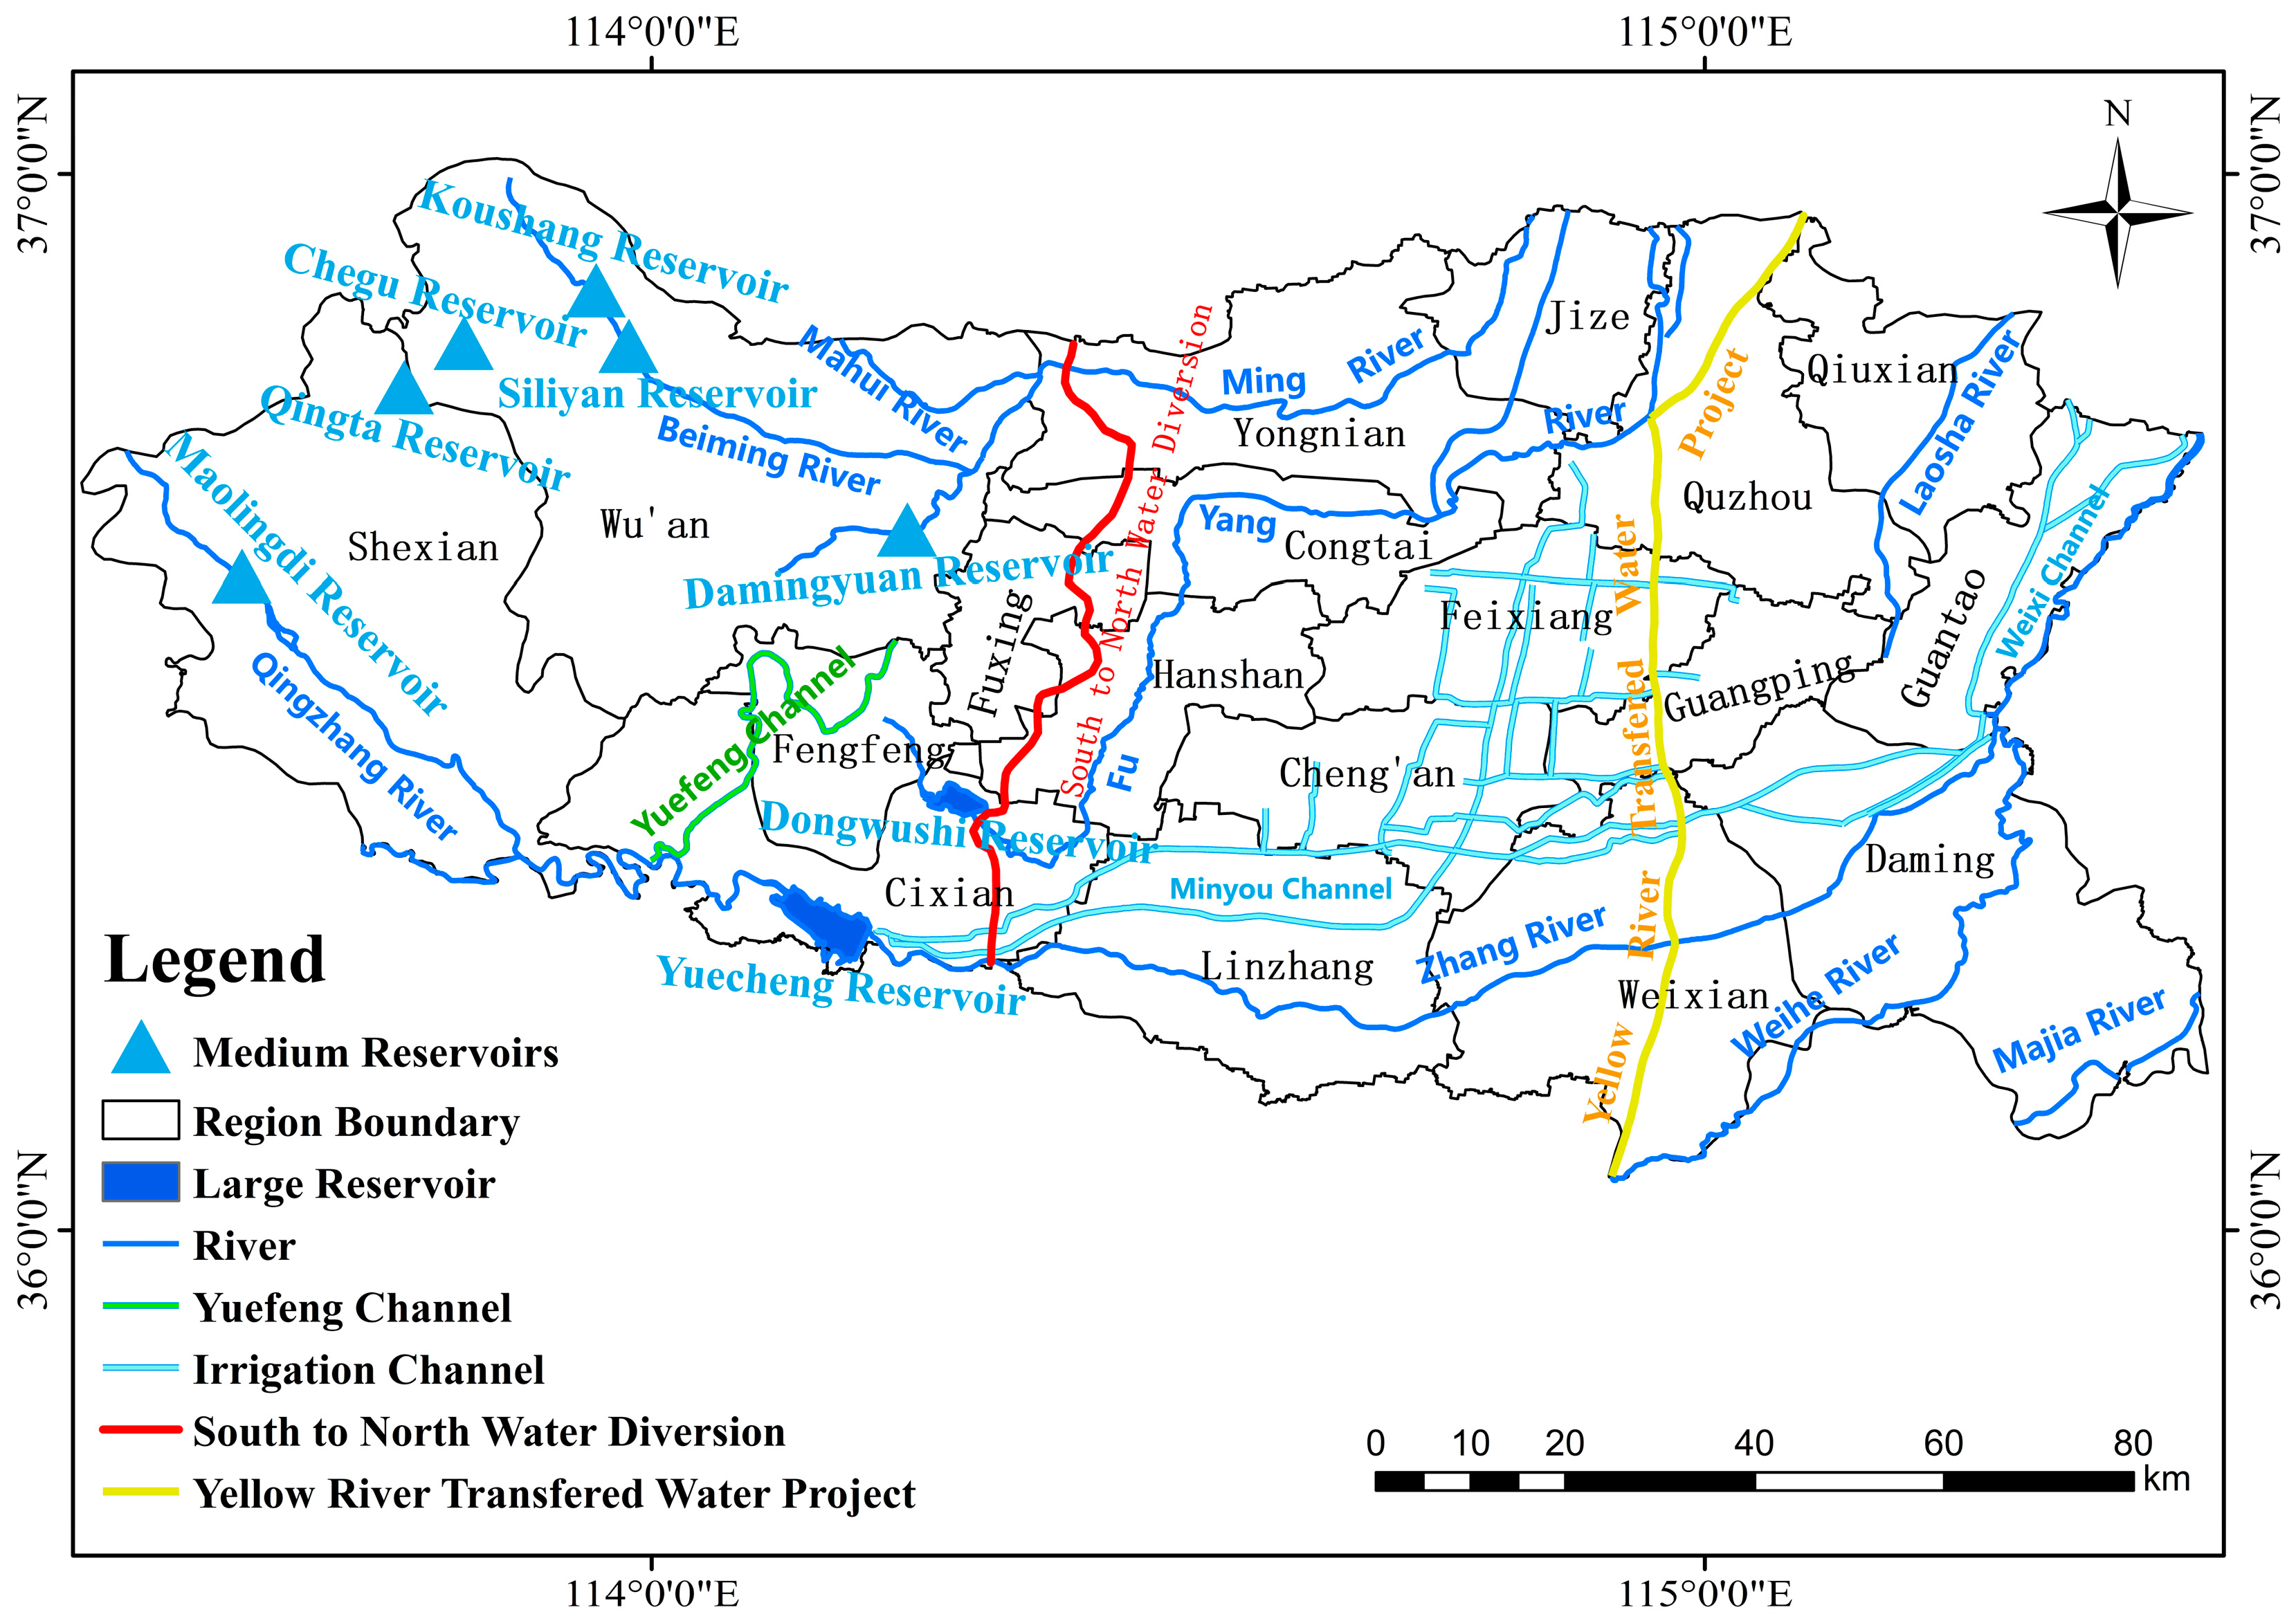
Located in the south of Hebei Province, Handan has 18 administrative districts under its jurisdiction with a total area of 12,047 km2 and a permanent population of 9.416 million. Handan is in a semi-humid and semi-arid continental monsoon climate zone in the warm temperate zone. The annual average temperature is 12.5–14.2 °C, the annual sunshine hours are 2300–2780 h, the frost-free period is 194–218 days, the annual average precipitation is 537.6 mm, and the annual average water surface evaporation is 1157.9 mm. The terrain of Handan is high in the west and low in the east, sloping from the southwest to the northeast. As shown in Figure 1, the main rivers in Handan are the Qingzhang, Zhang, Beiming, Ming, Fuyang, Liulei, Laosha, Wei, and Majia rivers. The main water conservancy engineering facilities include the two large-scale reservoirs Dongwushi Reservoir and Yuecheng Reservoir, and six medium-sized reservoirs, Qingta, Chegu, Maolingdi, Koushang, Siliyan, and Damingyuan. The main water supply channels are the Yuefeng, Minyou, Dongfeng, Mingyou, and Weixi channels. The middle route of the South-to-North Water Diversion Project runs through the junction of the western mountainous area and the eastern plain area of Handan. The Yellow River Water Diversion Project enters from Weixian and flows out from Quzhou.
2.4.2. Water Demand Forecasting
This study takes 2019 as the base year; according to the Handan Statistical Yearbook [60], it is based on the long-term development plan of Handan and the water consumption quota of Hebei Province (DB 13/T 5448.1-2021), and uses the water quota forecasting method to predict the water demand of different industries in various administrative districts of Handan by 2025. The prediction results are presented in Table 1. Under the guaranteed rate of P = 50%, the total water demand in Handan is 2943.89 × 106 m3, of which the total domestic water demand is 360.84 × 10⁶ m3, the total ecological water demand is 206.28 × 10⁶ m3, the total water demand for the primary industry is 1939.82 × 106 m3, the total water demand of the secondary industry is 211.43 × 10⁶ m3, and the total water demand of the tertiary industry is 225.52 × 10⁶ m3.
2.4.3. Prediction of Available Water Supply
The water supply sources of Handan include groundwater, reclaimed water, water diversion from the South-to-North Water Diversion, Yellow River transferred water, Weihe River transferred water, the Yuefeng Channel, and reservoir water. The available supply of groundwater was taken from the Third Water Resources Evaluation in Handan [61,62]. The available supply of recycled water was predicted based on urban domestic and industrial water usage. The South-to-North Water Diversion Project was predicted based on the results of the Supporting Project Planning of Handan of Hebei Province’s South-to-North Water Diversion Project (Middle Line) [63]. The available water supply of the Yellow River Diversion Project in Handan and the Yellow River Diversion Project in Hebei Province were used for the prediction. The available water supply of the Weihe River diversion, Yuefeng Channel diversion, and reservoir water was predicted by the distribution and utilization of surface water in Handan [64]. Table 2 shows the predicted results of the water supply with a P = 50% guarantee rate in different administrative regions of Handan in 2025. The total water supply in Handan is approximately 2646.53 × 106 m3, including 928.40 × 10⁶ m3 groundwater, 359.23 × 10⁶ m3 recycled water, 352.02 × 10⁶ m3 water diverted from the South-to-North Water Diversion Project, 179.00 × 10⁶ m3 water diverted from the Yellow River, 87.00 × 10⁶ m3 diverted from the Weihe River, and 226.38 × 10⁶ m3 water diverted from the Yuefeng Channel; the reservoir water is approximately 514.5 × 10⁶ m3.
The South-to-North Water Diversion Project supplies water through urban water supply networks and water plants, whereas the Yellow River Diversion Project, the Weihe River Diversion Project, and the Yuefeng Channel Diversion Project supply water through artificially constructed channels and pumping stations. They all have fixed water supply nodes, but they do not have the characteristics of natural river water supply, which is a process of strong human activities controlling water resources, making it difficult to establish the topological relationship between water supply and consumption in the GWAS model. Therefore, virtual reservoirs were constructed to represent the above four water diversion sources for optimal allocation of water resources. In addition, this study further generalized the other small reservoirs with water supply characteristics in the western mountainous area of Handan.
2.4.4. Determination of Topological Relationship and Model Parameters
Topological Relationship between Water Supply and Consumption
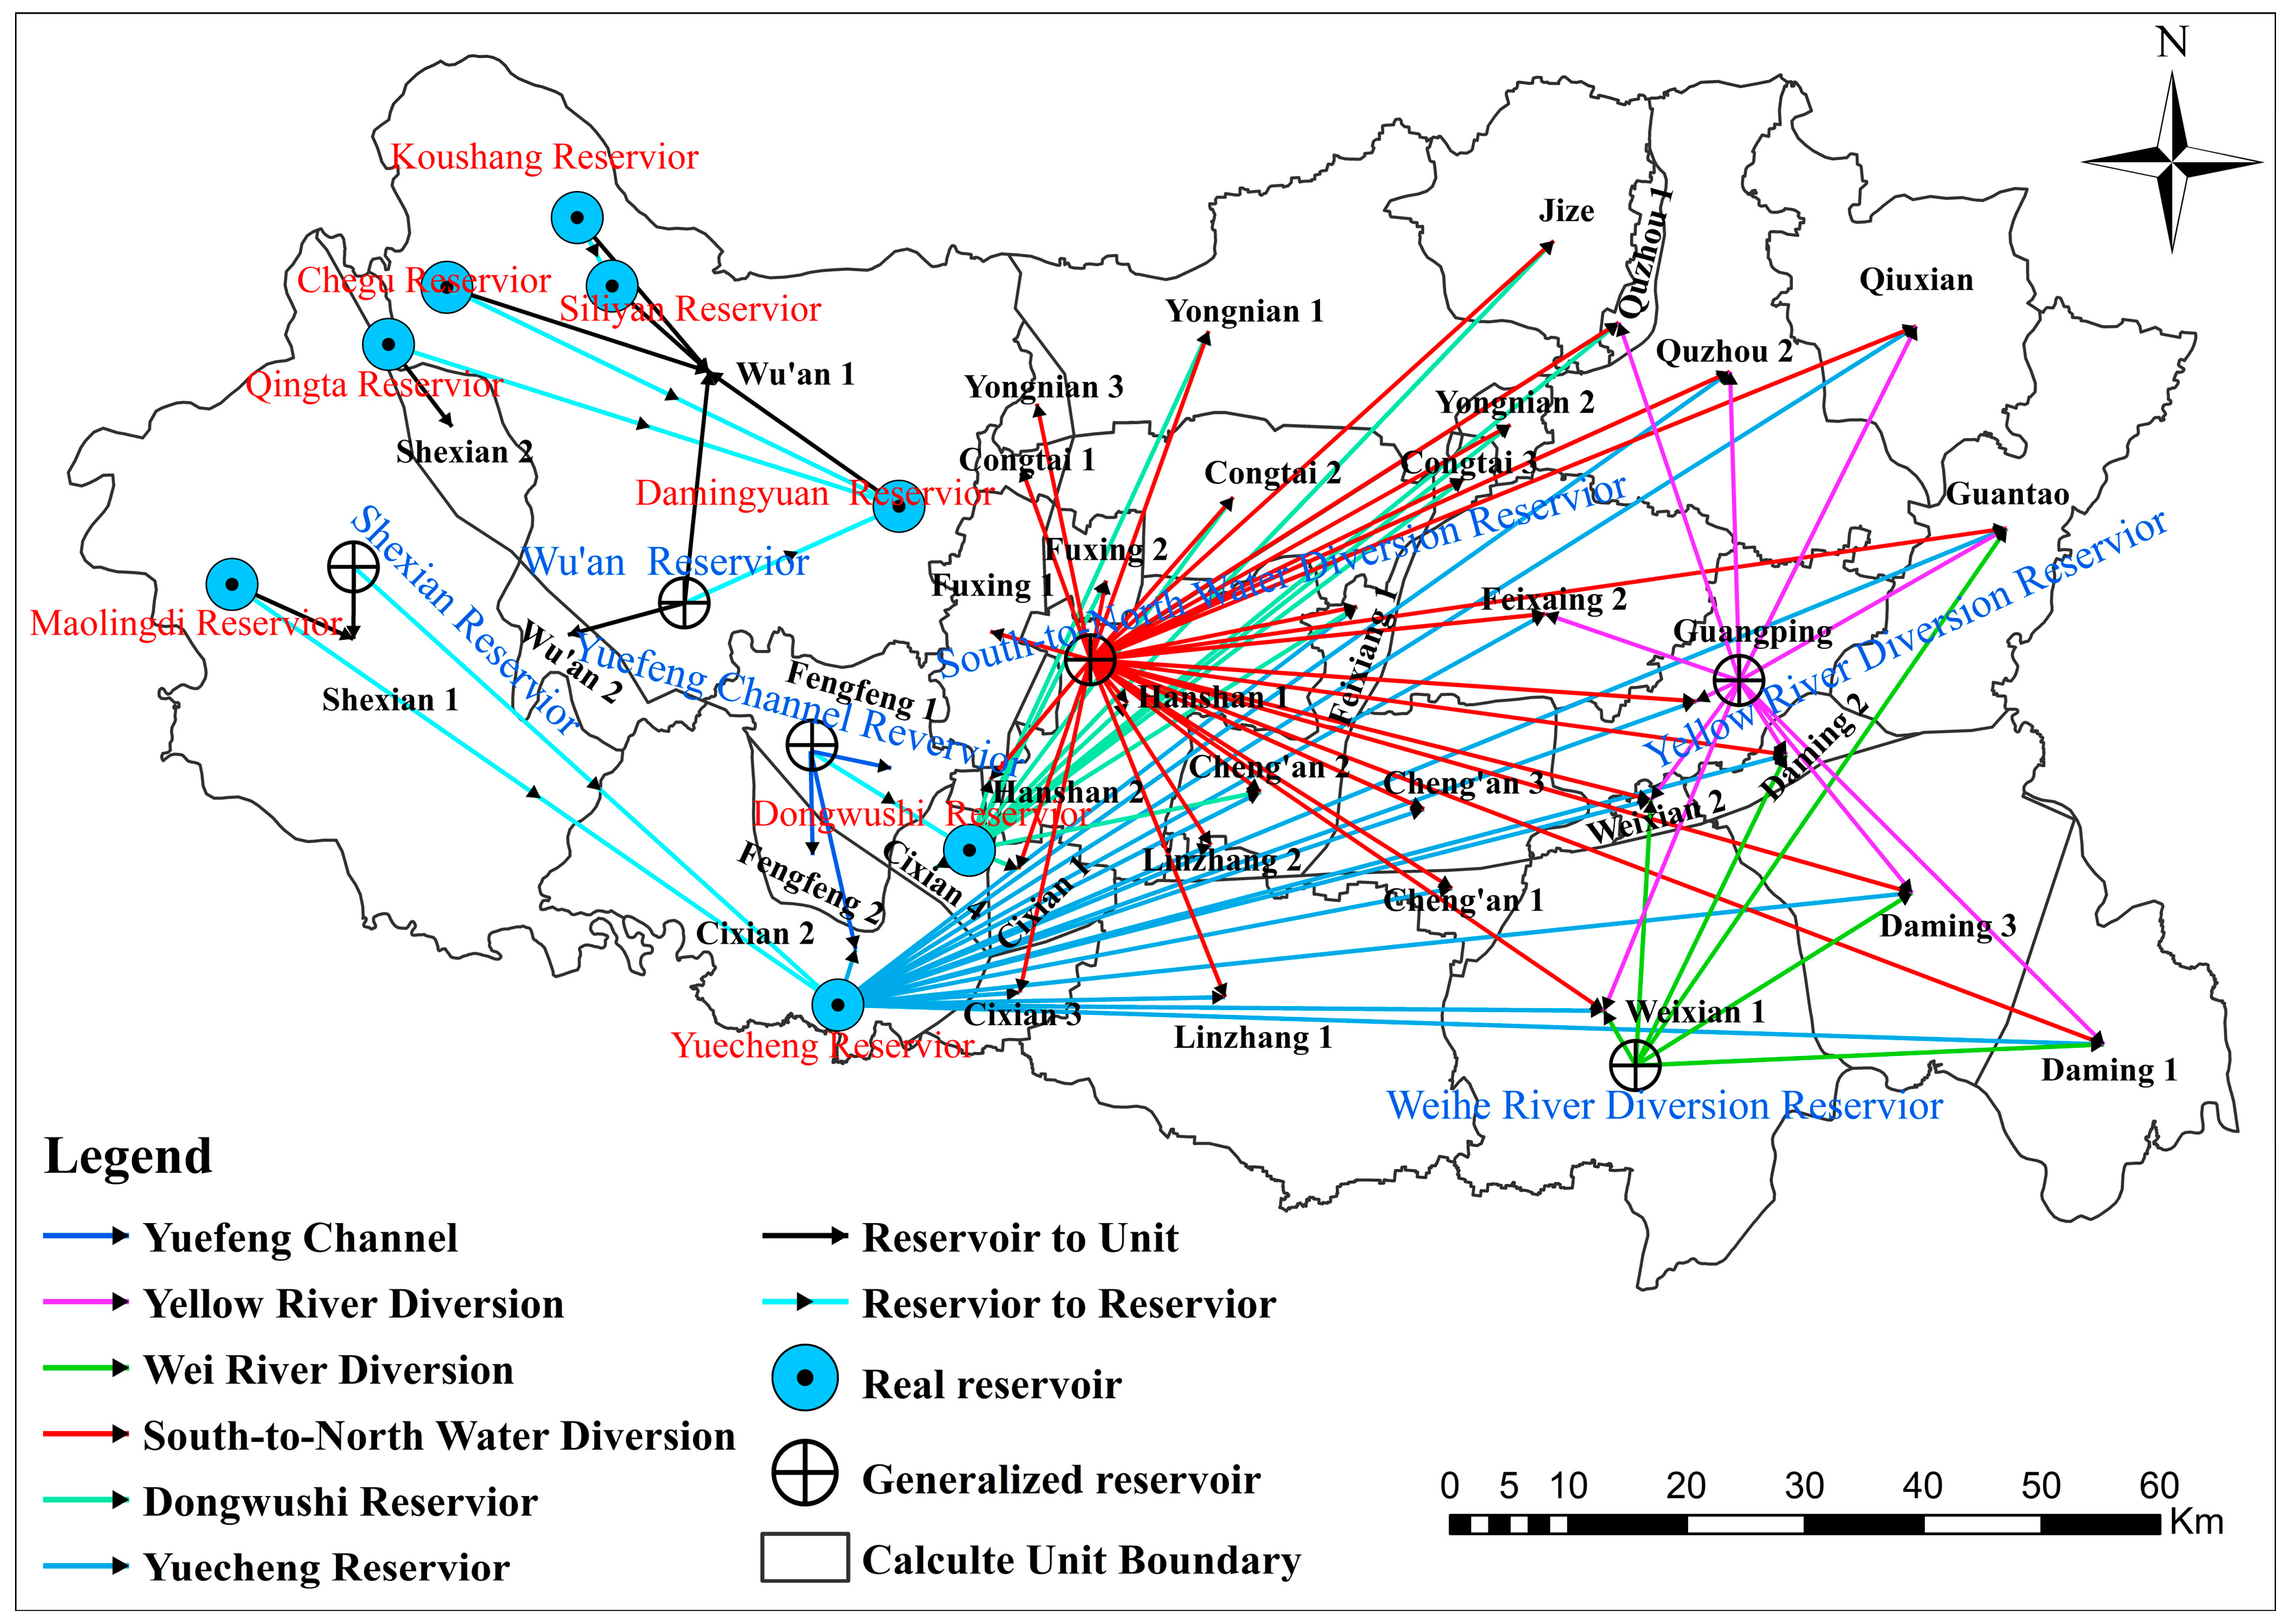
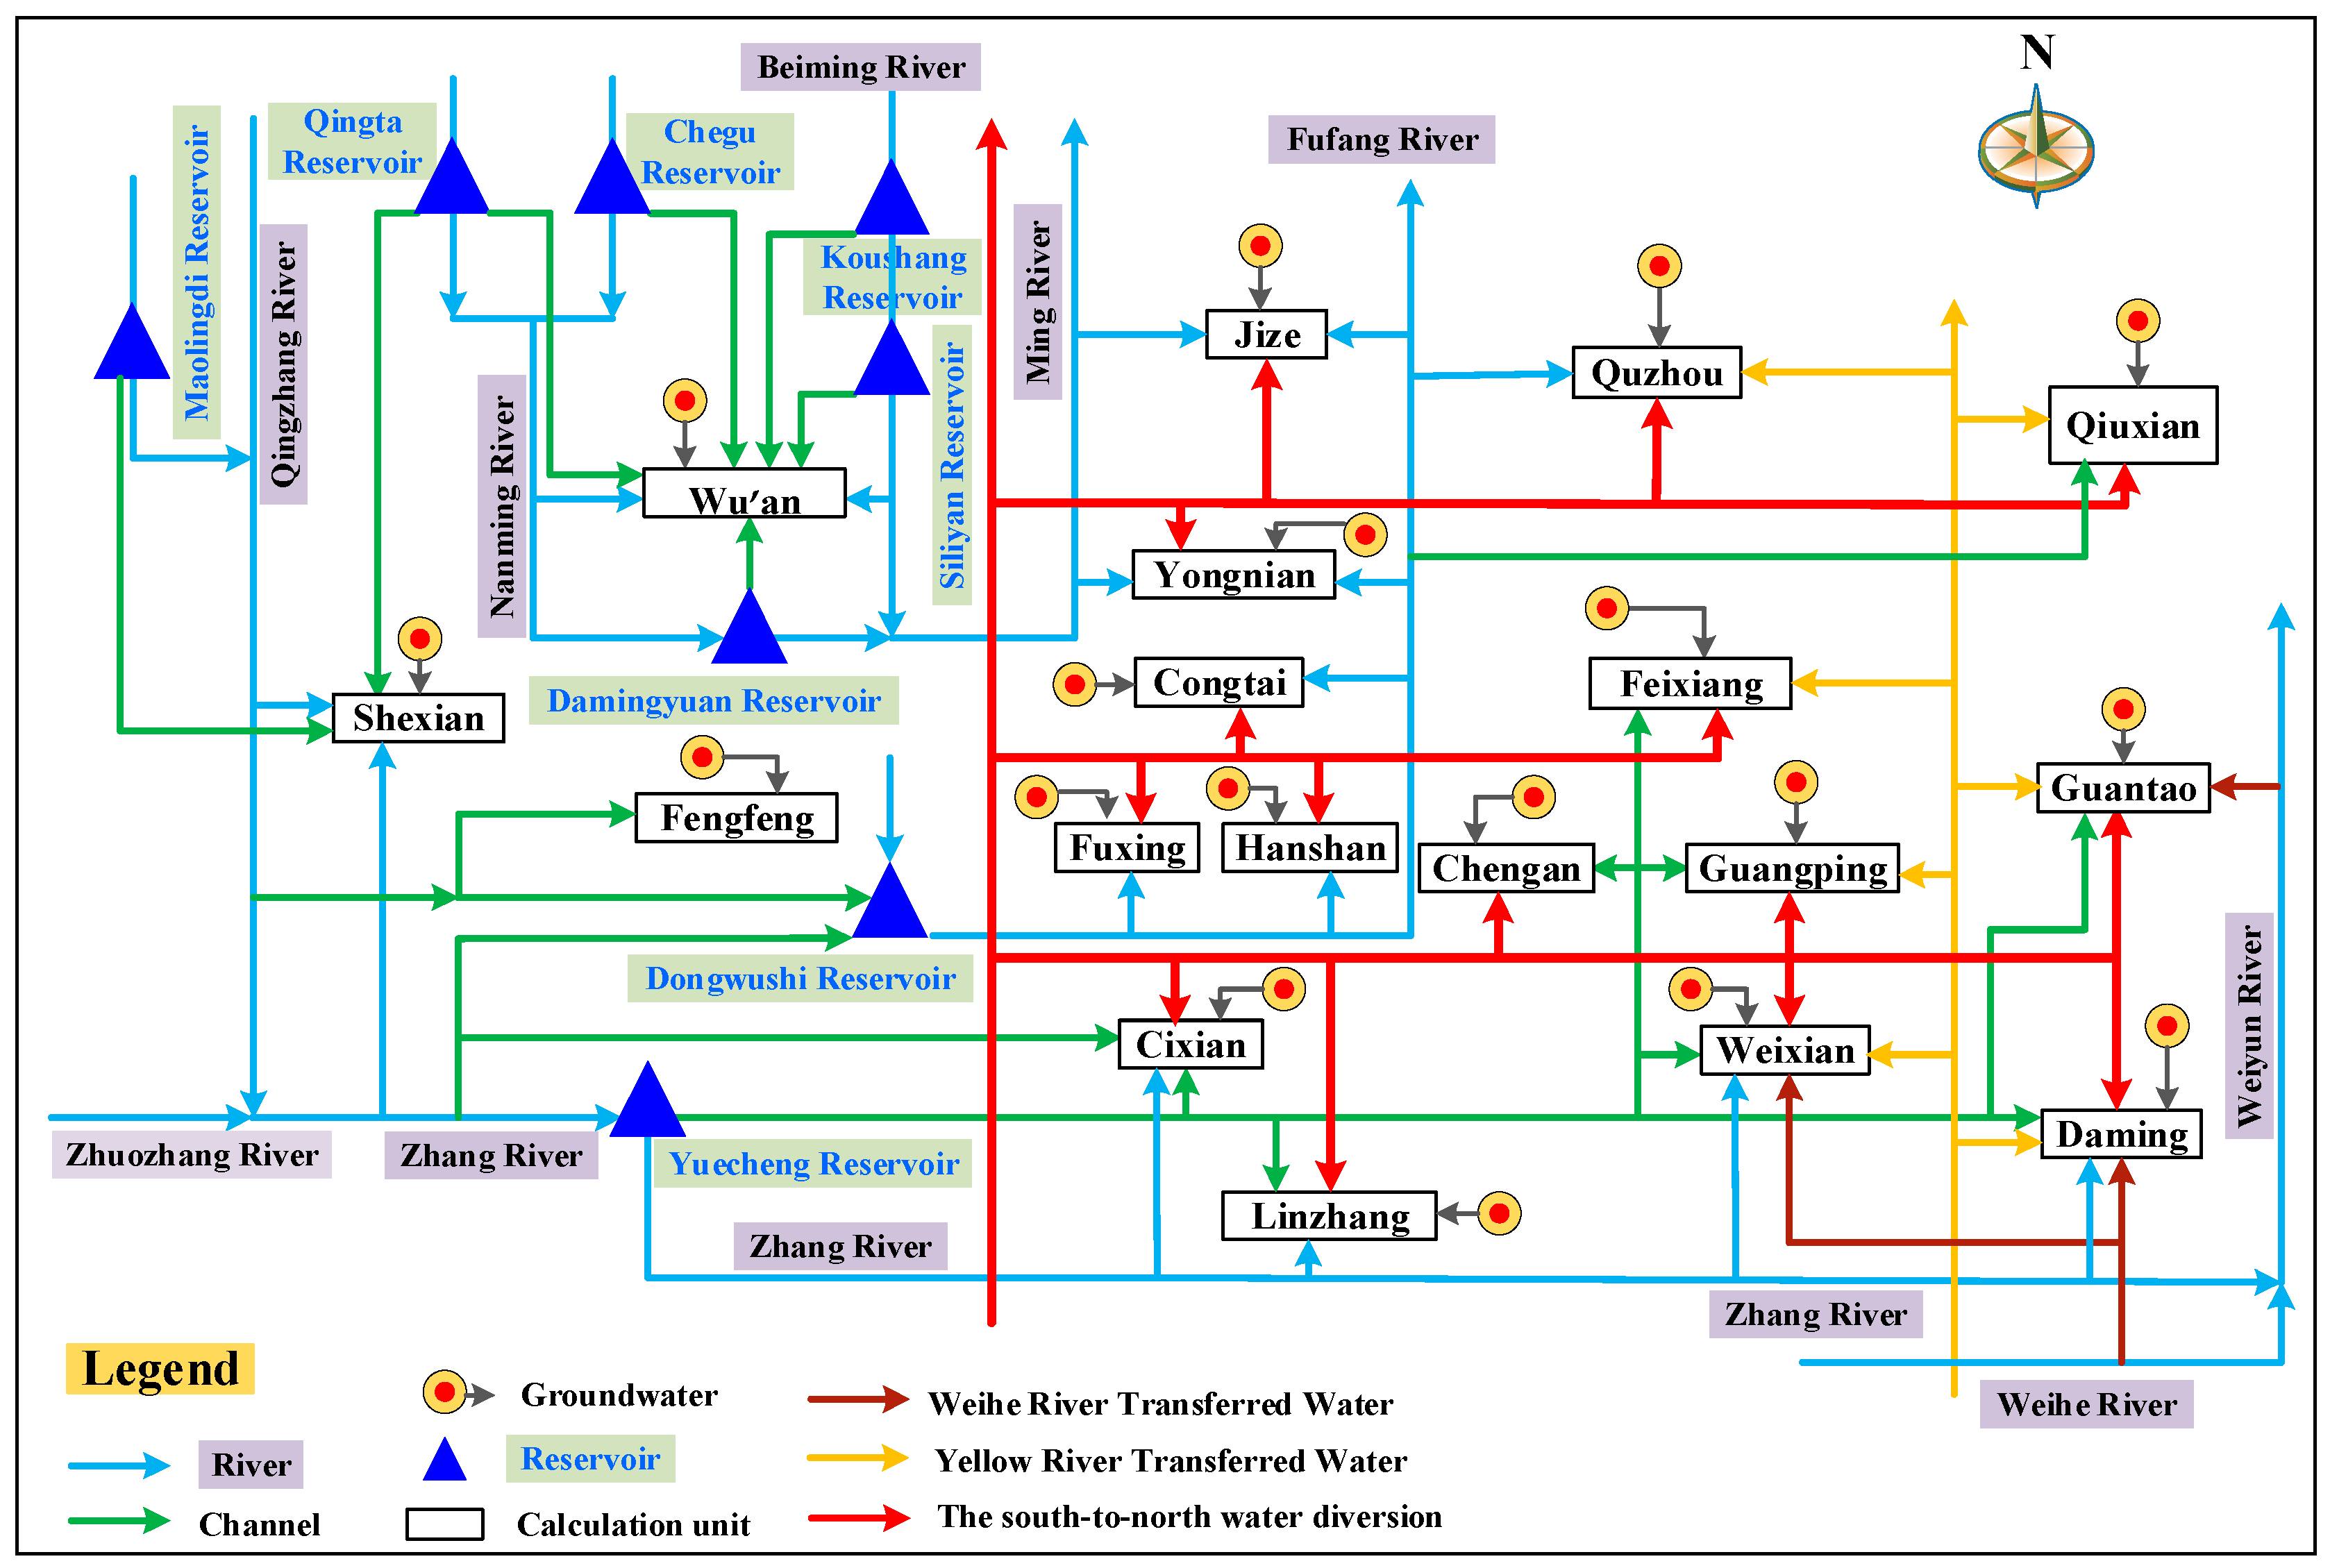
The study area was divided into 38 hydrological units, including 12 sub-computing units in the Handan west mountainous area and 26 sub-computing units in the eastern plain area. Among them, Wu’an, Shexian, and Fengfeng are all mountainous areas; a small part of Congtai, Fuxing, Yongnian, and Hanshan are mountainous; the rest are plains. The topological relationship between water supply and demand in Handan established in the GWAS model is shown in Figure 2, and the network diagram of the water supply relationship is shown in Figure 3.
Parameters Setting
The allocation ratio coefficient of water sources of the industry is set. According to the requirements of different water users for water supply sources, the water allocation ratio of different water sources to the corresponding industries for each calculation unit in Handan is determined. The industry weight coefficient is set to 1 for domestic and tertiary industry, 0.95 for ecology, 0.8 for primary industry, and 0.9 for second industry. Overall considering the actual situation of the socio-economic development and the characteristics of the distribution of water conservancy projects in Handan, the water shortage rate weights are as important as the fairness weights and are both set to 1. The NSGAII-S parameter settings are the following: the maximum number of running times is 1000, the population size is 50, the gene length is 0, the cross probability is 0.3, and the mutation probability is 0.05.
Reservoir Water Supply Characteristics
Table 3 represents the water supply characteristics of the reservoir, ”√” indicates that the reservoir can supply water to corresponding industries; numbers 1 to 5 indicate the priority of water supply from the reservoir to different industries, where number 1 indicates the highest priority and number 5 indicates the least.
2.4.5. Model Validation
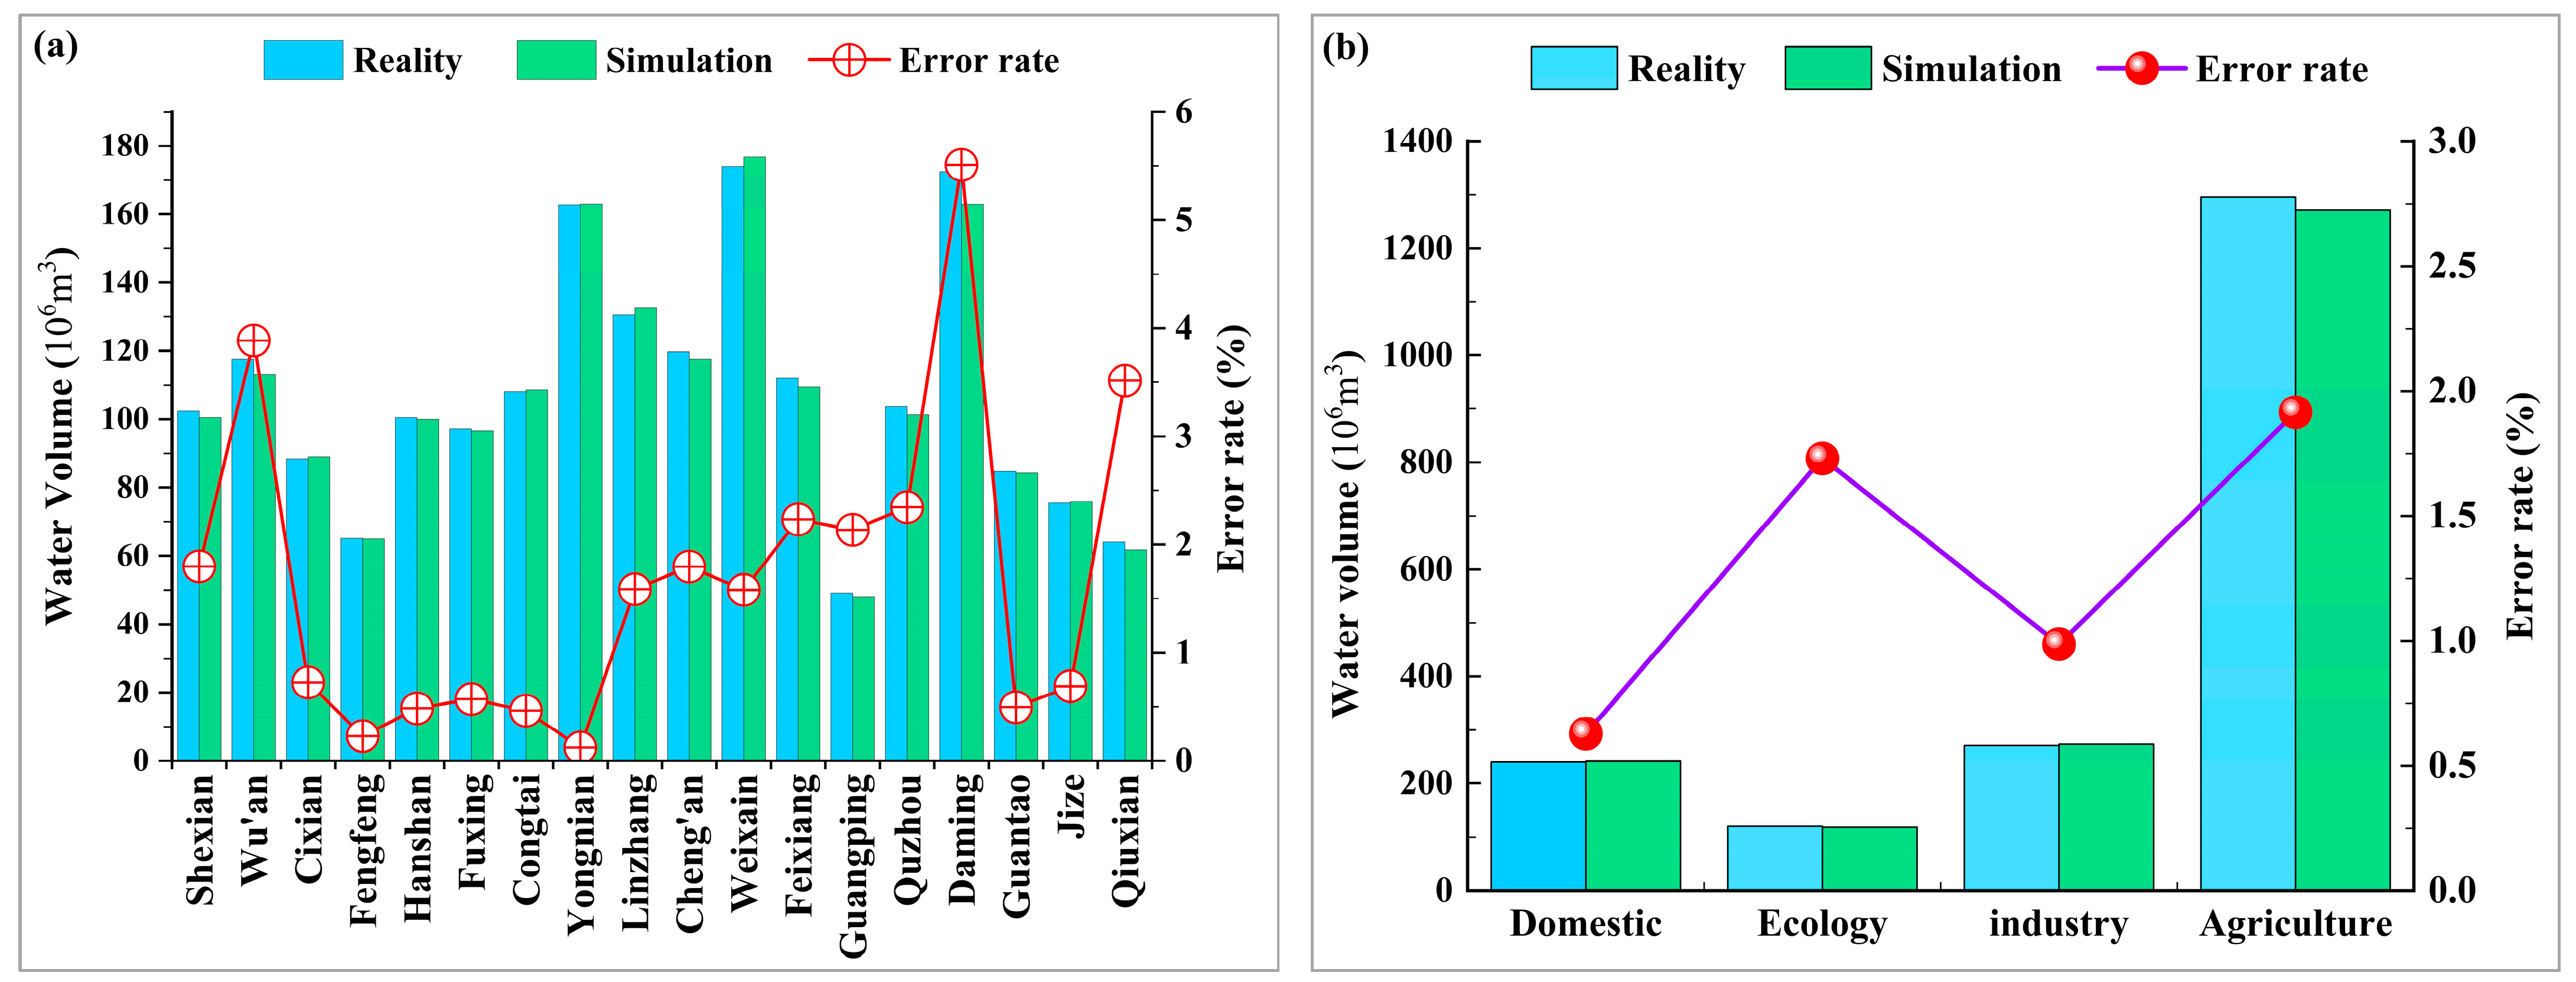
In order to validate the rationality of the model and the accuracy of the parameters, the actual water supply and water usage of Handan in 2019 were input into the model [65]. By comparing the simulated water supply volume with the actual water supply, the total error rate is 1.10%, and the error rate of each calculation unit is between 0–6%; among them, the highest rate is 5.51% in Daming, and the lowest rate is 0.12% in Yongnian, as shown in Figure 4a. Through the comparative analysis of the water supply of different industries and the simulated water supply, the error rate of different industrial water supplies for domestic (0.21%), ecological (0.75%), industrial (0.62%), and agricultural (1.88%) uses, respectively, is shown in Figure 4b. The Pearson correlation coefficient for simulated versus actual water supply in Handan was strong (0.9890). The error rate of simulation results and correlation coefficient are within the acceptable range. Therefore, the multi-objective optimal allocation model of water resources based on GWAS in Handan is reasonable and the model parameters are accurate.
3. Analysis of Results and Discussion
3.1. Results and Analysis
3.1.1. Analysis of Industry Water Shortage Rate
The results of the optimal allocation of water resources with a P = 50% guarantee rate for different industries in Handan by 2025 are shown in Table 4. The total water demand is predicted to be 2943.89 × 106 m3, the total water allocation is 2416.92 × 106 m3, the total water shortage is 527.60 × 10⁶ m3, and the total water shortage rate is 17.92%. Shexian, Cixian, Fengfeng, and Congtai are not short of water, while Linzhang has the largest water shortage of 76.62 × 10⁶ m3; the water shortage rate is 34.53%.
The domestic and ecological water needs of Handan were fully allocated. The total water demand of the primary industry is 1939.85 × 106 m3, the total water distribution is 1416.42 × 106 m3, the total water shortage is 523.43 × 10⁶ m3, the total water shortage rate is 26.98%, and the highest water shortage rate is 44.12%. The total water demand of the secondary industry is 211.43 × 10⁶ m3, the total water distribution is 211.30 × 10⁶ m3, the total water shortage is 0.13 × 10⁶ m3, the total water shortage rate is 0.10%, Wu’an is short of water (0.13 × 10⁶ m3), and the water shortage rate is 0.34%. The total water demand of the tertiary industry is 222.52 × 10⁶ m3, the total allocated water is 221.97 × 10⁶ m3, the total water shortage is 3.55 × 10⁶ m3, and the water shortage rate is 1.57%. Eight administrative districts of Wu’an, Cheng’an, Feixiang, Guangping, Daming, Quzhou, Guantao, and Qiuxian are short of water, among which Wu’an has the highest water shortage rate of 6.62%. Water shortage in the primary industry accounts for 99.21% of the total water shortage in the industry.
3.1.2. Analysis of Water Allocation from Different Water Supply Sources
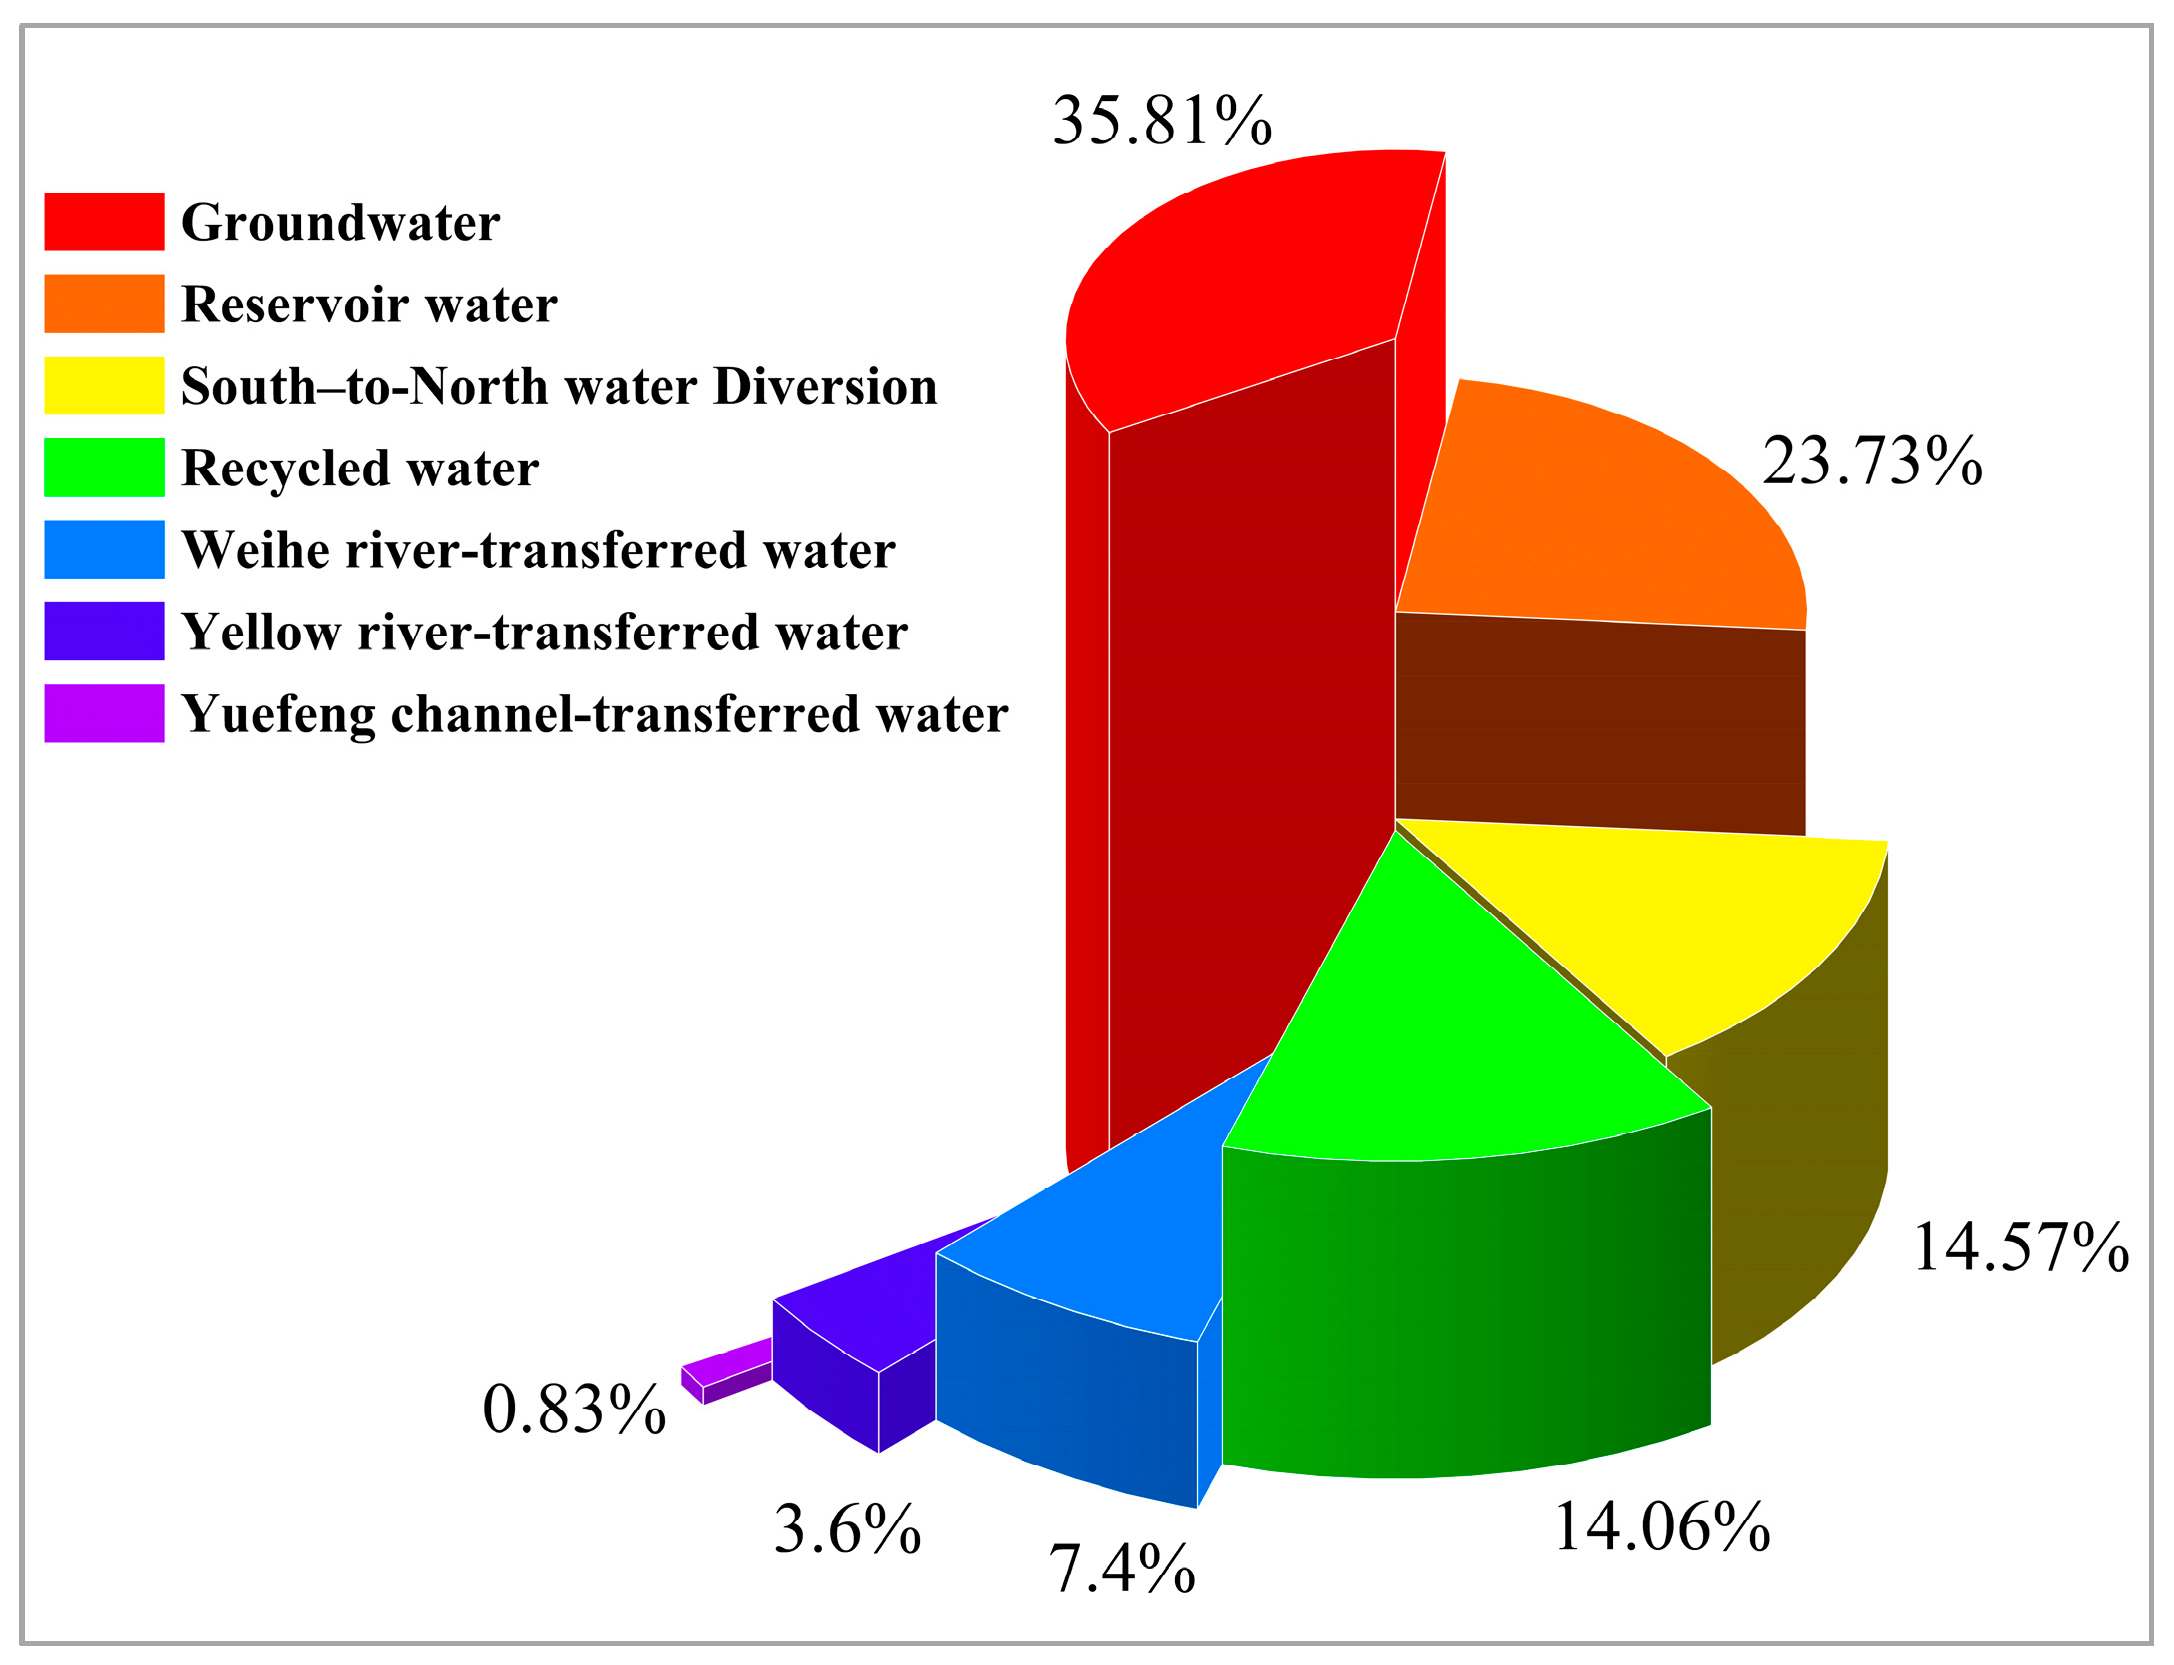
The allocation of water from different water supply sources to each administrative district of Handan is presented in Table 5. Figure 5 shows the water supply proportion of the water sources, representing the ratio of the total water distribution of a single water supply source to the total water distribution of all water supply sources. Because the Yuefeng Channel participates in the joint optimal operation of the reservoir, the independent water supply of the Yuefeng Channel and reservoir cannot be accurately calculated.
Therefore, the water supply proportion of the Yuefeng Channel shown in Figure 5 is only calculated using its allocation results in Fengfeng and Cixian; the total allocated water volume of different water supply sources in Handan is 2416.92 × 106 m3, of which groundwater distribution is 865.40 × 10⁶ m3, accounting for 35.81%, and the water allocation rate is 93.22%. Recycled water distribution is 339.74 × 10⁶ m3, accounting for 14.06%, and the allocation rate is 94.58%. The allocation ratio is approximately 100% for the South-to-North, Weihe River, and Yellow River Water diversion projects with water distributions of 352.00 × 10⁶ m3, 86.91 × 10⁶ m3, and 178.82 × 10⁶ m3, respectively, and water supply accounting for 14.57, 7.40, and 3.60%, respectively. The Yuefeng Channel water supply is 19.97 × 10⁶ m3, accounting for 0.83%, and the reservoir water supply is 573.45 × 10⁶ m3, accounting for 23.73%.
3.1.3. Analysis of Reservoir Water Allocation
The allocated water volume of the reservoir shown in Table 6 is greater than the available water volume of the reservoir shown in Table 2, whereas the allocated water volume of the Yuefeng Channel is less than the available water volume. The main reason is that the Yuefeng Channel undertakes two tasks: supplying water to Cixian and Fengfeng as well as the Dongwushi Reservoir. When the water demands of Cixian and Fengfeng are met, the remaining water in the Yuefeng Channel flows into the Dongwushi Reservoir. Table 7 shows the results of the reservoir’s optimal operation, and the total dispatching water volume of the reservoir is 210.94 × 10⁶ m3. The Koushang Reservoir supplies 12.00 × 10⁶ m3 of water to the Siliyan Reservoir, the Qingta Reservoir supplies 0.12 × 10⁶ m3 of water to the Damingyuan Reservoir, the Maolingdi and Shexian reservoirs supply water to the Yuecheng Reservoir 42.96 × 10⁶ m3 and 1.49 × 10⁶ m3, respectively, and the Yuefeng Channel supplies 154.37 × 10⁶ m3 of water to the Dongwushi Reservoir.
3.1.4. Analysis of Water Distribution of Different Water Sources
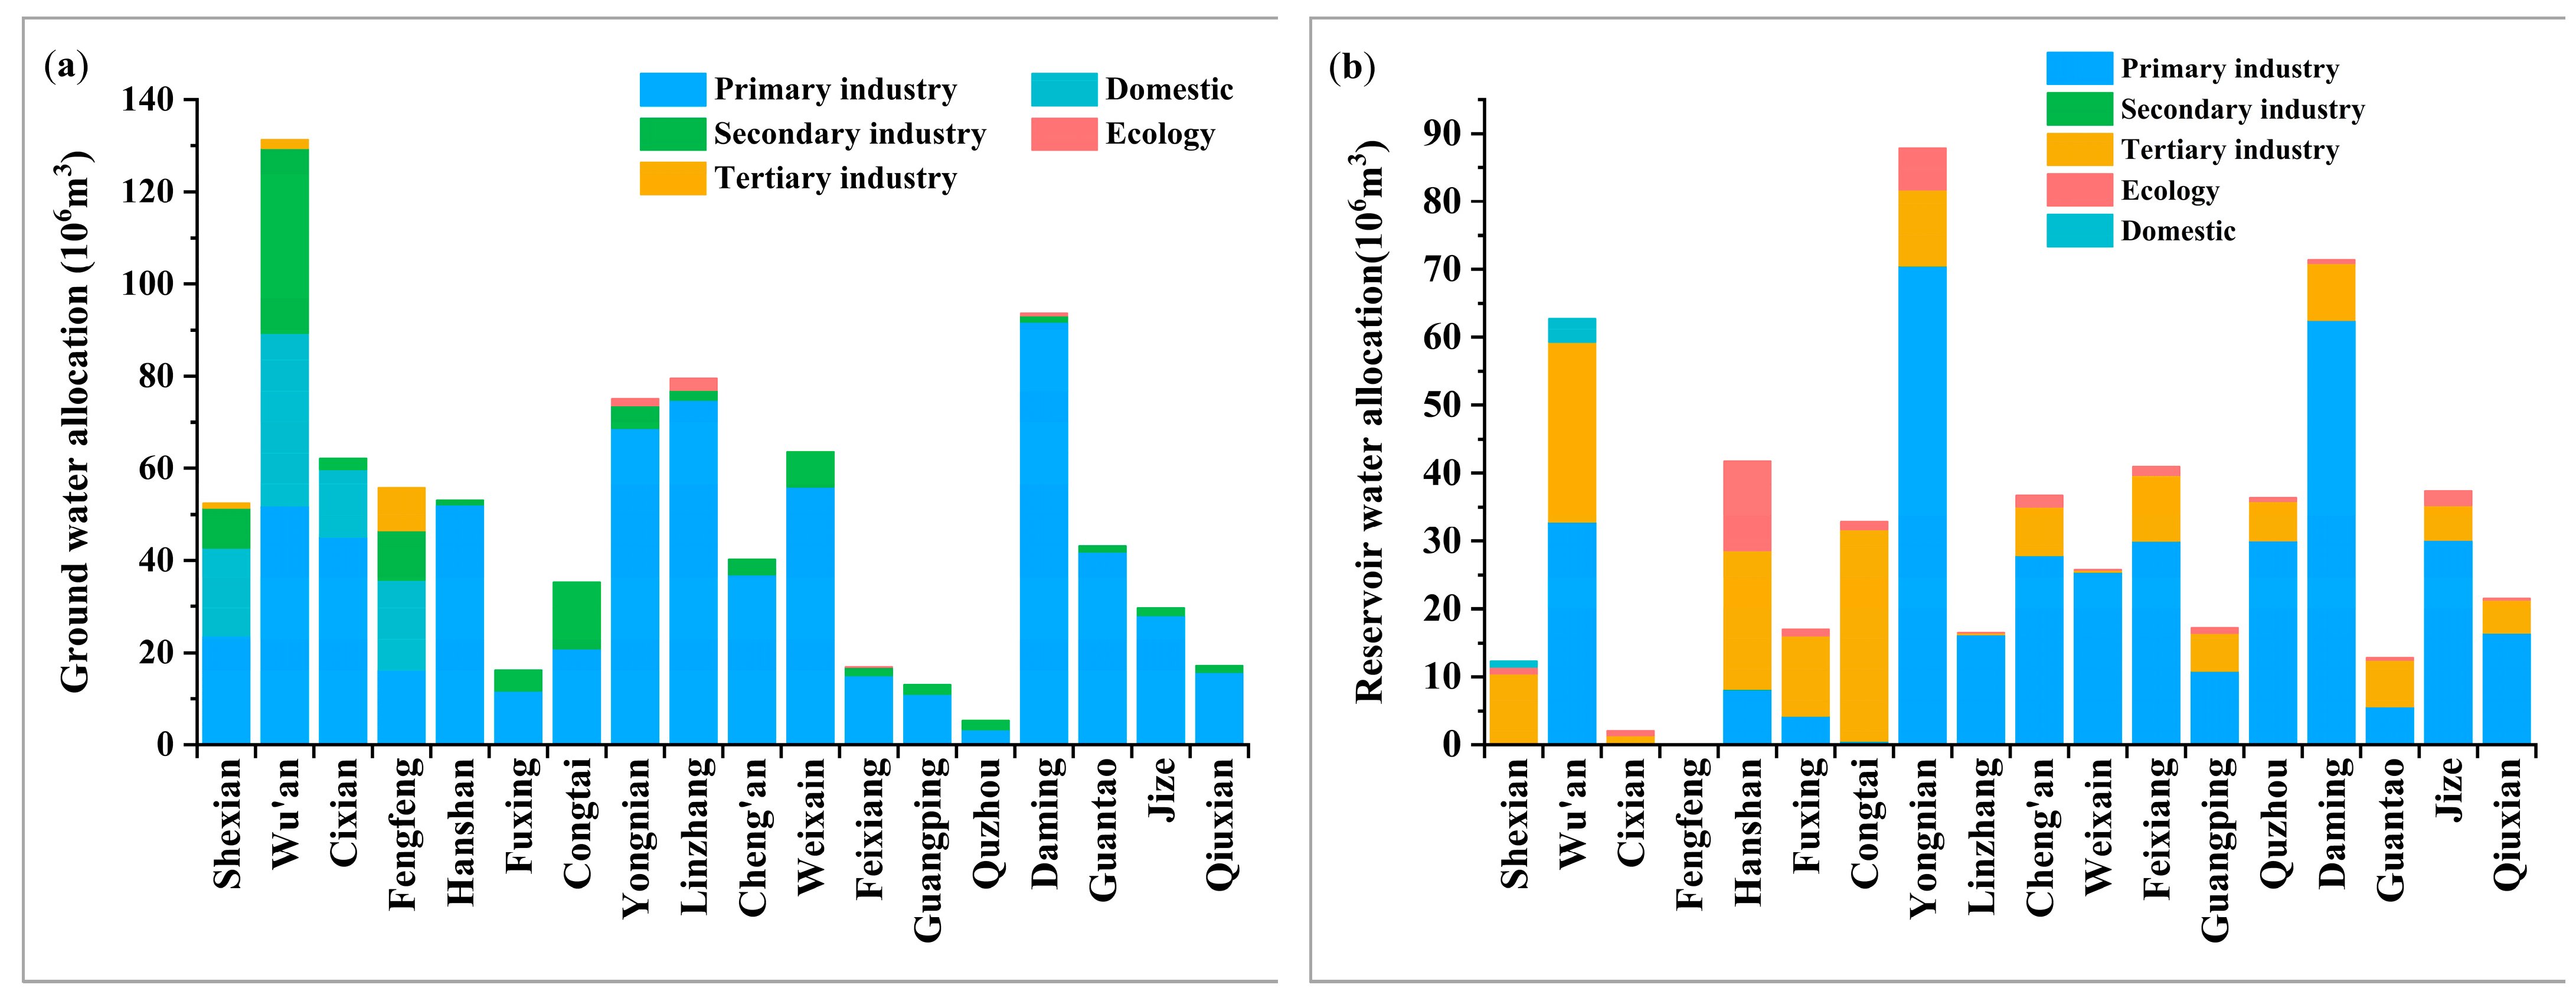
Figure 6 shows the water supply of different water sources to different industries in each administrative district of Handan. Figure 6a shows that the total distribution of groundwater to different industries is 865.40 × 10⁶ m3. The distribution includes 72.73 × 10⁶ m3 supplied to domestic water, and the water supply areas are Wu’an, Cixian, Fengfeng, and Shexian counties. In addition, 4.61 × 10⁶ m3 is supplied to ecological water, and the water supply areas are Linzhang, Feixiang, Yongnian, and Daming. Water supply to primary and secondary industries is 664.48 × 10⁶ m3 and 111.38 × 10⁶ m3, respectively, and the scope of water supply is all areas of Handan. The water supply to the tertiary industry is 12.20 × 10⁶ m3, and the water supply areas are Wu’an, Fengfeng, and She counties.
Figure 6b shows the amount of water the reservoir supplies to different industries. The reservoir mainly supplies water to the primary and tertiary industries. The total water distribution of the reservoir is 556.11 × 10⁶ m3, the water supply in Yongnian is the largest, and no water is supplied to Fengfeng. The reservoir supplies 4.38 × 10⁶ m3 of domestic water to Shexian and Wu’an, 30.82 × 10⁶ m3 of ecological water supply, except for Wu’an and Fengfeng, and 371.40 × 10⁶ m3 of water supply to the primary industry, except for Shexian and Fengfeng. The secondary industrial water supply is 0.23 × 10⁶ m3, and that to the tertiary industry is 166.62 × 10⁶ m3.
Figure 6c shows the distribution of water resources in the South-to-North Water Diversion Project. The total allocated water volume of this water source is 352.00 × 10⁶ m3, of which the water supply for domestic use is 283.73 × 10⁶ m3, 25.64 × 10⁶ m3 for the secondary industry, and 42.63 × 10⁶ m3 for the tertiary industry. Its water supply is largest in Weixian, and it does not supply water to Shexian, Wu’an, or Fengfeng, nor does it supply water to ecological areas and primary industries.
Figure 6d shows the distribution of recycled water, which had the largest water supply in Wu’an and the smallest in Jize. The total distribution of recycled water is 351.97 × 10⁶ m3, of which 102.84 × 10⁶ m3 is supplied to the primary industry, 71.10 × 10⁶ m3 to the secondary industry, and 165.80 × 10⁶ m3 to ecological regions.
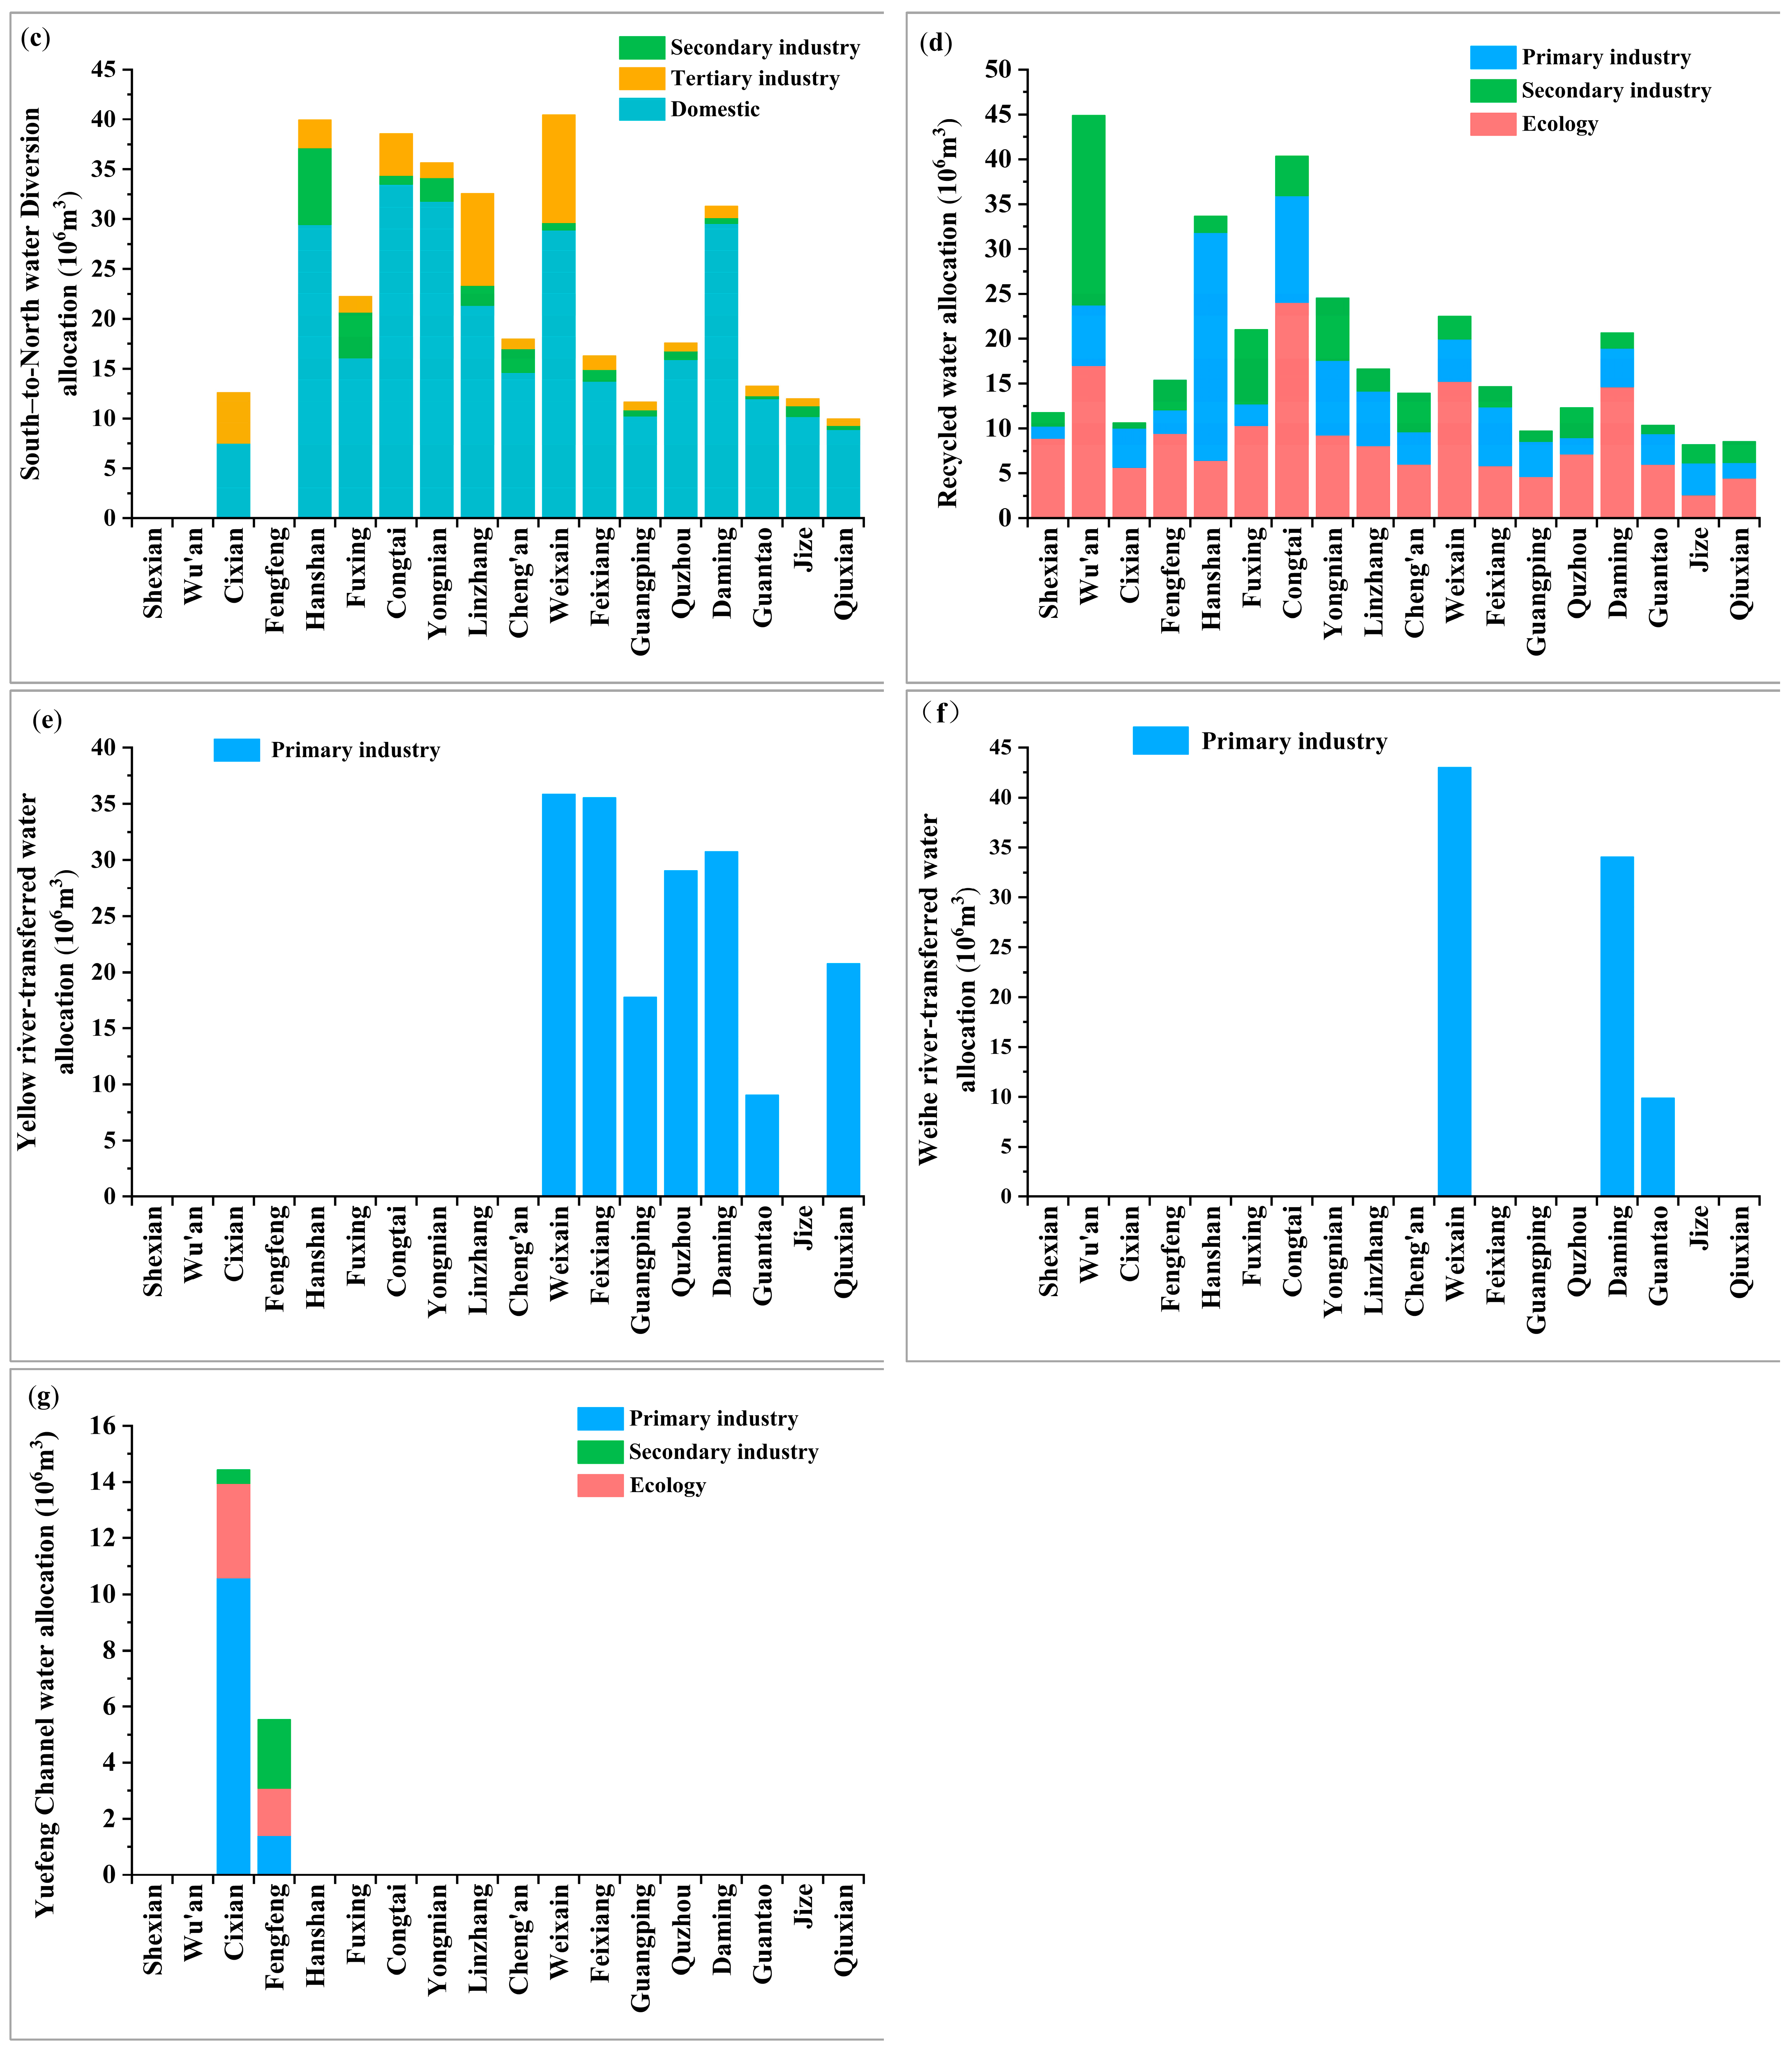
Figure 6e shows the allocation of water resources transferred from the Yellow River. This water source supplies water only to the primary industry. The total allocated water volume is 178.80 × 10⁶ m3. The water supply areas include Weixian, Feixiang, Guangping, Quzhou, Daming, Guantao, and Qiuxian, among which the largest amount of water is supplied to Weixian.
Figure 6f shows the allocation of the water resources diverted from the Weihe River. This water source only supplies water to the primary industry; the total allocated water volume is 86.91 × 10⁶ m3. Of this, 42.99 × 10⁶ m3 is supplied to Weixian, 32.28 × 10⁶ m3 to Daming, and 10.23 × 10⁶ m3 to Guantao.
Figure 6g shows the distribution of the water resources diverted from the Yuefeng Canal, which supplies water to ecological regions and primary and secondary industries in Cixian and Fengfeng. The total allocated water volume is 19.97 × 10⁶ m3, of which 5.05 × 10⁶ m3 is supplied to ecological regions, 11.97 × 10⁶ m3 is supplied to the primary industry, and 2.95 × 10⁶ m3 is supplied to the secondary industry.
3.1.5. Analysis of the Water Supply Ratio from Water Sources to Industry
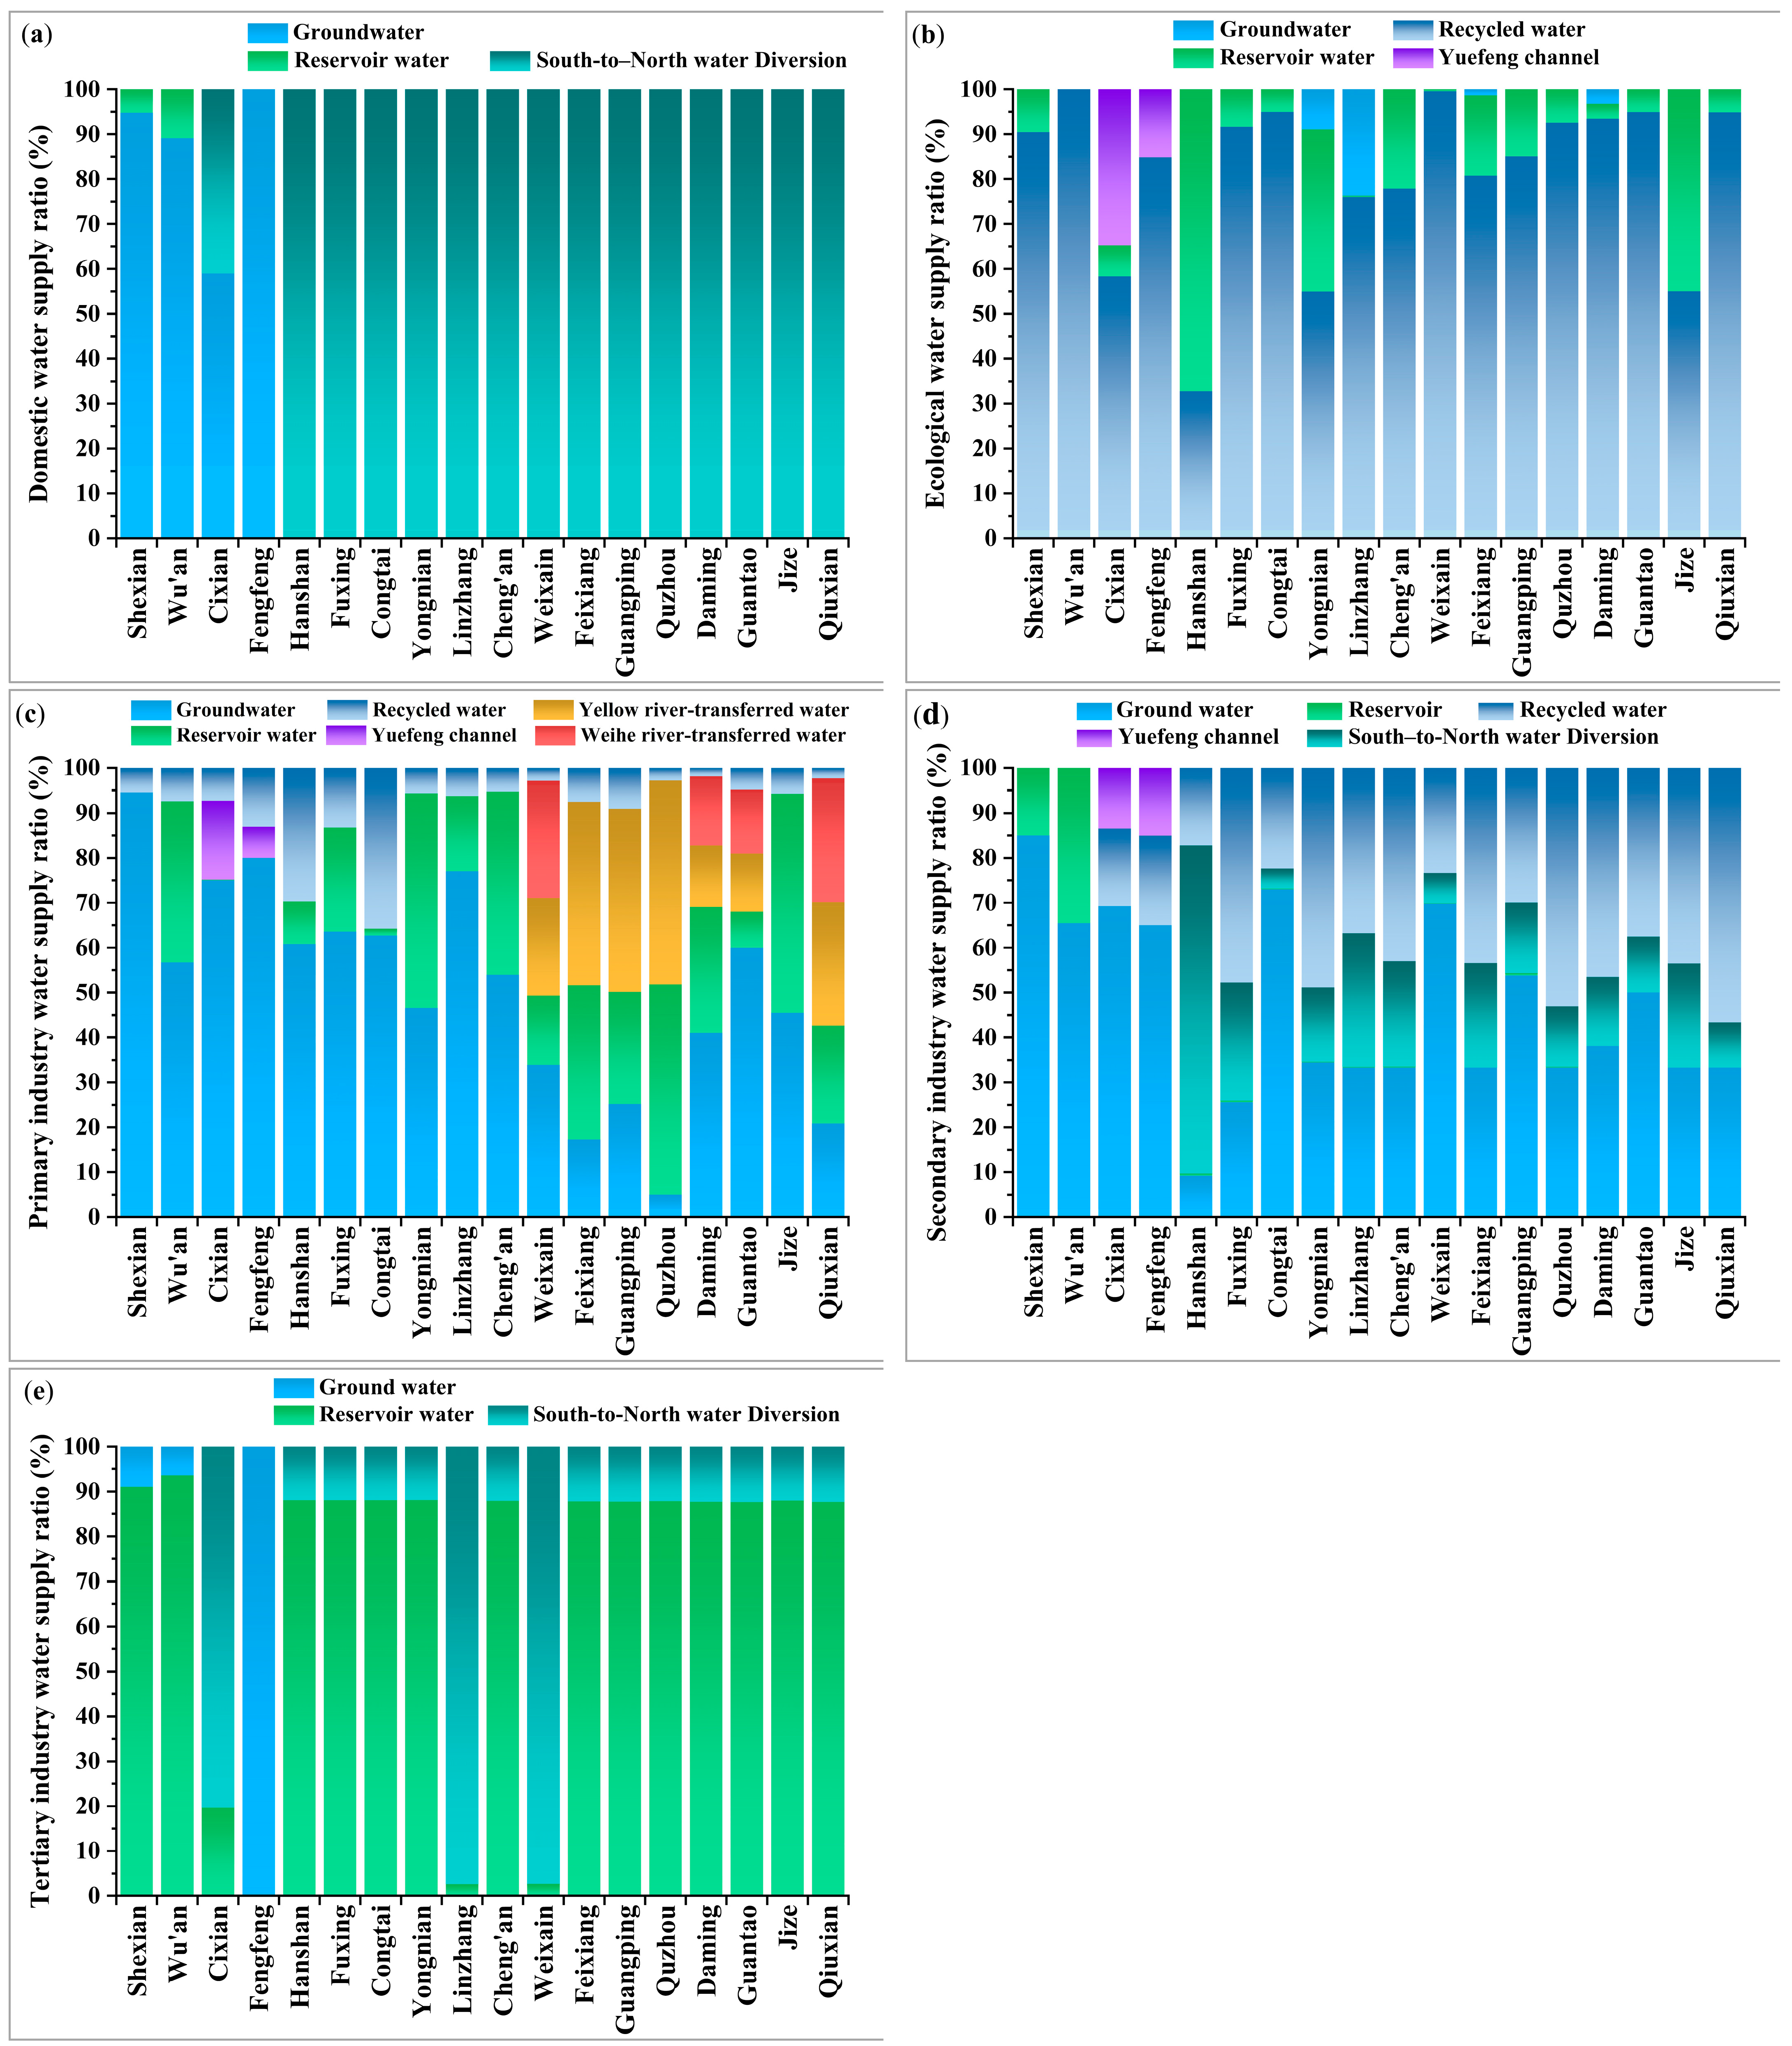
Figure 7 shows the proportions of water supply from different water sources to different industries in each administrative area of Handan. Figure 7a shows the proportions of different water sources in the domestic water supply. Water supply sources include groundwater, reservoir water, and South-to-North Water Diversion. Groundwater and reservoir water jointly supply the domestic water needs of Shexian and Wu’an, with groundwater accounting for 94.81 and 89.08% and reservoir water accounting for 5.19 and 10.92%, respectively. Cixian’s domestic water needs are supplied by both groundwater (59.01%) and South-to-North Water Diversion (40.99%). All domestic water in Fengfeng is supplied by groundwater, and all domestic water in other administrative regions is supplied by South-to-North Water Diversion.
Figure 7b shows the proportions of different water sources to the ecological water supply. Water supply sources include groundwater, recycled water, reservoir water, and water diversions from the Yuefeng Channel. The ecological regions are mainly supplied by reclaimed water and reservoirs. Reservoirs account for the largest proportion (67.19%) of the ecological water supply in Hanshan, and the rest of the area had the largest proportion of recycled water supply. Wu’an’s ecology is entirely supplied by recycled water. Cixian’s ecological water demand is jointly supplied by recycled water, water diversion from the Yuefeng Channel, and reservoir water, which account for 58.35, 34.74, and 6.91% of the water supply, respectively. Fengfeng’s water demand is supplied by recycled water and water diversion from the Yuefeng Channel, accounting for 84.88 and 15.12% of the water supply, respectively. The ecological areas of Yongnian, Linzhang, Feixiang, and Daming are jointly supplied by groundwater, recycled water, and reservoir water, while the ecological water needs of other areas are jointly supplied by reclaimed and reservoir water.
Figure 7c shows the proportion of water supply for the primary industry. Water supply sources include groundwater, recycled water, reservoir water, Yellow River water, Weihe River water, and Yuefeng Channel water. Reservoir water accounts for 47.76, 46.84, and 48.76% of the water supply in Yongnian, Quzhou, and Jize, respectively. The proportion of water diverted from the Yellow River to the Feixiang, Guangping, and Qiu counties is 40.83, 40.86, and 45.33%, respectively. In the rest of the region, the proportion of groundwater supply was the largest, among which Shexian had the largest proportion (94.56%).
Figure 7d shows the proportion of water supply for the secondary industry. Water supply sources include groundwater, recycled water, reservoir water, the South-to-North Water Diversion, and Yuefeng Canal water. The South-to-North Water Diversion accounts for 73.15% of the water supply in the Hanshan area. Groundwater accounts for the largest proportion of water supply in Shexian, Wu’an, Fengfeng, Cixian, Congtai, Weixian, Guangping, and Guantao, while recycled water supplies the largest proportion in other areas, and reservoir water only supplies a small amount of water resources.
Figure 7e shows the proportion of water supply for the tertiary industry. Water supply sources include South-to-North Water Diversion, groundwater, and reservoir water. Wu’an and Shexian are supplied by groundwater and reservoirs, accounting for the largest proportions at 91.04 and 93.55%, respectively. Fengfeng is supplied by groundwater, while the rest of the area is jointly supplied by reservoirs and the South-to-North Water Diversion. The South-to-North Water Diversion Project contributed the largest proportion of water supply to Cixian, Linzhang, and Weixian, accounting for 80.38, 97.36, and 97.30%, respectively, and the reservoir water supply proportion in other units was the largest.
3.2. Discussion
The transported water includes South-to-North Water Diversion, Yellow River diversion, Weihe River diversion, and Yuefeng Channel diversion. In the conventional water resources allocation, the water supply amount of the four types of water sources to each unit was determined according to the fixed distribution water indicators [66]. However, in this study, the four types of water sources were generalized into virtual reservoirs with dynamic regulation characteristics for optimal allocation. The GWAS model allocation results were compared with the traditional method distribution results, as shown in Table 7. The results show that the total amount of transported water allocation based on the GWAS model was the same as that of the traditional method. However, in different calculation units, the allocation of transported water volume was very different; the main reason is that the GWAS model not only considers the load-balancing object of the minimum water shortage rate of each calculation unit, but also considers the spatial balance of water shortage between each calculation unit. The allocation results of the GWAS model avoided the large difference in water shortage rate between each calculation unit, and effectively coordinate the balanced allocation of various water sources between regions and water users.
A comparative analysis with other research was also carried out. Ma et al. [67] treated transported water as a uniform source without subdivision. Suo et al. [68] used a fuzzy-interval dynamic programming (FIDP) model to allocate water resources in Handan without subdividing the sources of external transferred water. Yan et al. [69] also allocated the transported water according to a fixed water distribution scheme without dynamic adjustments. This study introduced virtual reservoirs into the model to enable each transported water source to dynamically adjust to demand from the calculation units, which assisted in the later development of transported water schemes.
4. Conclusions
According to the characteristics of water resources and the distribution characteristics of water conservancy projects and the transported water projects in Handan, this study, based on forecasts of water resource supply and demand, used GWAS to construct an optimal allocation model of water resources in Handan. The model introduced the concept of the virtual reservoir and generalized the South-to-North Water Diversion, Yellow River Transferred Water, Weihe River Transferred Water, and Yuefeng Channel Transferred Water as virtual reservoirs, which are jointly allocated with local surface water, groundwater, and recycled water. The results show that in 2025, the total water demand of Handan at a P = 50% guarantee rate is 2943.89 × 106 m3, the total allocated water is 2416.92 × 106 m3, the total water shortage is 527.60 × 10⁶ m3, and the water shortage rate is 17.92%. There was no water shortage in some calculation units, such as Shexian, Cixian, Fengfeng and Congtai. The highest water shortage rate was in Linzhang, at 34.53%. For the different industry sectors, no water shortage occurred in domestic and ecological water users. Water scarcity was mainly concentrated in the primary industry where the water shortage rate was 26.98%. Only Wu’an has a certain shortage of water in the secondary industry, mainly due to the large water usage of the steel industry.
One challenge in the present modeling process was that the GWAS parameters required manual adjustment, which is cumbersome and inconvenient and needs to be improved in future research. Secondly, the model cannot input the water demand data of the tertiary industry. In this study, the water demand of the tertiary industry was added to the domestic water demand. This may lead to an increase in the water supply from the South-to-North Water Diversion for domestic uses, indirectly affecting the accuracy of the allocation results and compromising the realization of the delicate management of regional water resources in Handan. Finally, due to the many small rainwater interception and storage projects in Handan, it was impossible to generalize them in the model; this paper did not consider the water supply of small rainwater storage projects, and these sources should be added to subsequent research.
Overall, the GWAS model had strong applicability in Handan, and the allocation results were reliable. In the GWAS model, the transported water is not allocated according to a fixed water distribution scheme but is dynamically adjusted according to the water demand of different calculation units, which can provide a technical reference for the management of transported water.
Author Contributions
Conceptualization, Y.L. and B.L.; methodology, Y.L., J.S. and B.L.; validation, Y.L., J.S., B.L., Y.Z. and J.Y.; data curation, Y.L., Y.Z. and J.Y.; writing—original draft preparation, Y.L.; writing—review and editing, B.L. and J.S. All authors have read and agreed to the published version of the manuscript.
Funding
This research was funded by the National Natural Science Foundation of China (Grant no. 51879066).
Data Availability Statement
All data used during the study are proprietary or confidential and may only be provided with restrictions.
Acknowledgments
The authors are also thankful for the support from the Hebei University of Engineering.
Conflicts of Interest
The authors declare no conflict of interest.
References
- Wang, Y.; Sheng, L.X.; Li, K.; Sun, H.Y. Analysis of Present Situation of Water Resources and Countermeasures for Sustainable Development in China. J. Water Resour. Water Eng. 2008, 3, 10–14. [Google Scholar]
- Chen, Z.K. Sustainable Utilization of Water Resources in China. J. China Water Resour. 2000, 8, 38–40. [Google Scholar]
- Zhang, L.P.; Xia, J.; Hu, Z.F. Situation and Problem Analysis of Water Resource Security in China. J. Resour. Environ. Yangtze Basin 2009, 18, 116–120. [Google Scholar]
- Xia, J.; Zhu, Y.Z. Measuring Water Resources Security: Research and Challenges of Water Resources Carrying Capacity. J. Nat. Resour. 2002, 3, 262–269. [Google Scholar]
- Li, X.P. Overview of Research on Water Resource Allocation at Home and Abroad. J. Haihe Water Conserv. 2002, 5, 13–15. [Google Scholar]
- Shen, X.J. Research on Synergetics Theory-Based Water Resource Allocation Model and Its Application. Doctoral Thesis, China Institute of Water Resources and Hydropower Research, Beijing, China, 2018. (In Chinese). [Google Scholar]
- Stephenson, D. Optimum Allocation of Water Resources by Mathematical Programming. J. Hydrol. 1969, 9, 20–33. [Google Scholar] [CrossRef]
- Dudley, N.J.; Howell, D.T.; Musgrave, W.F. Optimal Intraseasonal Irrigation Water Allocation. J. Water Resour. Res. 1971, 7, 770–788. [Google Scholar] [CrossRef]
- Clyde, C.G.; King, A.B. Optimal allocation of water resources in Utah. J. Hydraul. Div. 1973, 99, 1777–1794. [Google Scholar] [CrossRef]
- Smith, D.V. Systems analysis and irrigation planning. J. Irrig. Drain. Div. 1973, 99, 89–107. [Google Scholar] [CrossRef]
- Becker, L.; Yeh, W.W.G. Optimization of real-time operation of a multiple-reservoir system. J. Water Resour. Res. 1974, 10, 1107–1112. [Google Scholar] [CrossRef]
- Haimes, Y.Y. Hierarchical modeling of regional total water resources systems. J. Autom. 1975, 11, 25–36. [Google Scholar] [CrossRef]
- Haimes, Y.Y.; Dreizin, Y.C. Management of groundwater and surface water via decomposition. J. Water Resour. Res. 1977, 13, 69–77. [Google Scholar] [CrossRef]
- Jønch-Clausen, T. Optimal allocation of regional water resources. J. Hydrol. Res. 1979, 10, 7–24. [Google Scholar] [CrossRef]
- Romijn, E.; Tamiga, M. Multi-objective optimal allocation of water resources. J. Water Resour. Plan. Manag. ASCE 1982, 108, 217–229. [Google Scholar] [CrossRef]
- Yaron, D.; Dinar, A. Optimal allocation of farm irrigation water during peak seasons. Am. J. Agric. Econ. 1982, 64, 681–689. [Google Scholar] [CrossRef]
- Louie, P.W.F.; Yeh, W.W.G.; Hsu, N.S. Multi-objective water resources management planning. J. Water Resour. Plan. Manag. 1984, 110, 39–56. [Google Scholar] [CrossRef]
- Willis, R.; Liu, P. Optimization model for ground-water planning. J. Water Resour. Plan. Manag. 1984, 110, 333–347. [Google Scholar] [CrossRef]
- Holden, E.; Linnerud, K.; Banister, D. Sustainable Development: Our Common Future Revisited. J. Glob. Environ. Chang. 2014, 26, 130–139. [Google Scholar] [CrossRef] [Green Version]
- Wang, J.; Wu, J. On the Initiation of the Idea of Sustainable Development and Its Meaning. J. Tongren Univ. 2014, 16, 62–65. [Google Scholar]
- Wang, H.; You, J.J. 30 Years of Water Resources Allocation in China. J. Hydraul. Eng. 2016, 47, 265–271+282. [Google Scholar]
- Feng, Y.L.; Hang, W.X.; Wang, H.J.; Lian, J.J. Study on Sustainable Development Oriented Optimal Allocation to Region Water Resources. J. Syst. Eng. Theory Pract. 2003, 23, 133–138. [Google Scholar]
- Fang, C.L. Research on Regional Sustainable Development and Optimum Allocation of Water Resources—Taking Chaidamu Basin in Arid Region of Northwest China as an Example. J. Nat. Resour. 2001, 16, 341–347. [Google Scholar]
- Li, L.Y.; Gan, H. Remark on the Relationship between Water Resources Rational Allocation, Carrying Capacity and Sustainable Development. J. Adv. Water Sci. 2000, 11, 307–313. [Google Scholar]
- Xu, X.Y.; Wang, H.; Gan, H. Theory and Method of Macroeconomic Water Resources Planning in North China; Yellow River Water Conservancy Press: Zhengzhou, China, 1997. (In Chinese) [Google Scholar]
- Chang, B.Y.; Xue, S.G.; Zhang, H.Y. Rational Allocation and Optimal Dispatch of Water Resources in the Yellow River Basin; Yellow River Water Conservancy Press: Zhengzhou, China, 1998. (In Chinese) [Google Scholar]
- Feng, S.Y.; Liu, G.Q. Framework for Sustainable Utilization of Water Resources. J. Adv. Water Sci. 1997, 4, 2–8. [Google Scholar]
- Feng, S.Y.; Mei, Y.D. System Planning for Sustainable Utilization of Water Resources. J. Adv. Water Sci. 1998, 1, 2–7. [Google Scholar]
- Huang, Q.; Wang, Z.F.; Chang, J.X.; Liang, Z.; Tian, F.W. Research on Joint Optimal Dispatch of Urban Water Supply Sources. J. Hydraul. Eng. 1999, 5, 58–63. [Google Scholar]
- You, J.J.; Gan, H.; Wang, H. Research status and Prospect of Water Resource Allocation Model. J. Water Resour. Water Eng. 2005, 16, 1–5. [Google Scholar]
- Mo, K.; Li, J.; Jia, P. Development and Application of Complex Reservoir Operation Program Based on MIKE BASIN Water Resource Model. J. Water Sci. Eng. Technol. 2008, 88, 19–22+39. [Google Scholar]
- Wang, Y.Y.; Dong, J.; Chen, X.Q.; Mo, Y.G.; Hong, Y.M.; Miao, J.Y. Research on Water Resources Allocation in Laizhou City Based on Mike Basin Model. J. Shandong Agric. Univ. (Nat. Sci. Ed.) 2021, 52, 984–989. [Google Scholar]
- Wang, X.N.; Wang, X.X.; Hou, L. Application of MIKE BASIN Model in Songhua River Basin. J. Water Resour. Hydropower Northeast China 2011, 29, 4–5+71. [Google Scholar]
- Mo, K. Application of MIKE BASIN for Water Resources Study of Daling River Basin in WRDMAP. J. Water Sci. Eng. Technol. 2008, 147(05), 16–19. [Google Scholar] [CrossRef]
- Gu, S.X.; Li, Y.H.; He, D.M.; Cui, Y.L. Watershed Water Resources Three-allocation Based on MIKE BASIN. J. Water Resour. Water Eng. 2007, 18, 5–10+28. [Google Scholar]
- Wang, Y.Y. Research on Water Resources Allocation in Laizhou City Based on Mike Basin Model. Master’s Thesis, Shandong Agricultural University, Tai’an, Chian, 2020. [Google Scholar]
- Lu, S.C. A Water Resource Management Model for Shiyang Basin Based on MIKE BASIN; D. Tsinghua University: Beijing, China, 2016. [Google Scholar]
- Raskin, P.; Hansen, E.; Zhu, Z.; Stavisky, D. Simulation of Water Supply and Demand in the Aral Sea Region. J. Water Int. 1992, 17, 55–67. [Google Scholar] [CrossRef]
- Yates, D.; Sieber, J.; Purkey, D.; Huber-Lee, A. WEAP21—A Demand-, Priority-, and Preference-driven Water Planning Model: Part 1: Model Characteristics. J. Water Int. 2005, 30, 487–500. [Google Scholar] [CrossRef]
- Wei, G.H.; Jiang, Z.Y. Study on Water Resource Allocation Scheme in Tarim River Trunk Stream Based on WEAP Model. J. Pearl River 2019, 40, 77–81. [Google Scholar]
- Yang, M.Z.; Xue, L.Q.; Zhen, G.; Lian, J.; Li, J.Y. Optimized allocation of Water Resources in Yarkand River Basin Based on WEAP Model. J. Hohai Univ. (Nat. Sci.) 2013, 41, 493–499. [Google Scholar]
- Hatamkhani, A.; Moridi, A.; Asadzadeh, M. Water Allocation Using Ecological and Agricultural Value of Water. J. Sustain. Prod. Consum. 2022, 33, 49–62. [Google Scholar] [CrossRef]
- Hou, X.L.; Yang, R.X.; Hou, B.D.; Lu, F.; Zhao, Y.; Zhou, Y.Y.; Xao, W.H. Joint Allocation of Multiple Water Sources in Xiongan New Area Under Complex and Uncertain Environment. J. Water Resour. Hydropower Eng. 2022, 53, 45–54. [Google Scholar]
- Hatamkhani, A.; KhazaiePoul, A.; Moridi, A. Sustainable water resource planning at the basin scale with simultaneous goals of agricultural development and wetland conservation. J. AQUA Water Infrastruct. Ecosyst. Soc. 2022, 71, 768–781. [Google Scholar] [CrossRef]
- Li, X.N. Water Resource System Resilience Assessment of Jinghuiqu Irrigation District Based on WEAP-MODFLOW. Master’s Thesis, Northwest A & F University, Yulin, Chian, 2021. [Google Scholar]
- Li, Y. Optimized Allocation of Water Resources in Ningxia Yellow River Basin Based on WEAP; D. Southwest University: Chongqing, China, 2014. [Google Scholar]
- Sun, X.B. Urban Water Supply and Demand Balance Analysis Based on SWAT and WEAP Models. Master’s Thesis, Beijing University of Civil Engineering and Architecture, Beijing, China, 2020. [Google Scholar]
- Sang, X.F.; Wang, H.; Wang, J.H.; Zhao, Y.; Zhou, Z.H. Water resources comprehensive simulation and allocation model WAS (Ⅰ): Model principle and construction. J. Hydraul. Eng. 2018, 49, 1451–1459. [Google Scholar]
- Sang, X.F.; Zhao, Y.; Zhai, Z.L.; Chang, H.Y. Water resources comprehensive simulation and allocation model WAS (Ⅱ): Application. J. Water Resour. 2019, 50, 201–208. [Google Scholar]
- Chang, H.Y. Development and Improvement of WAS Model and Application of Water Resources Allocation in Beijing-Tianjin-Hebei Region. Master’s Thesis, China Institute of Water Resources & Hydropower Research, Beijing, China, 2019. [Google Scholar]
- Yan, Z.Q.; Zhou, Z.H.; Wang, H.; Jia, Y.W. Studies on Ecological Water Supplement in Pingshan River Basin Based on Generalized Water Allocation and Simulation Model. J. China Water Resour. 2020, 22, 28–30+33. [Google Scholar]
- Yan, X.B. Research on Water Resources Allocation in the Agro-Pastoral Ecotone of the Northern Shaanxi Province Based on WAS Model. Master’s Thesis, Xi’an University of Technology, Xi’an, China, 2020. [Google Scholar]
- Liu, S.Y. Study on the Water Resources Regulation on the Suitable Scale Land Agricultural Utilization in Agro-Pastoral Ecotone of Northern Shaanxi. Doctoral’s Thesis, Xi’an University of Technology, Xi’an, China, 2021. [Google Scholar]
- Cao, Y.Q.; Li, L. Simulation Analysis of Water Resources in Beijing Based on the Integrated Comprehensive Water Simulation and Allocation Model. J. Adv. Sci. Technol. Water Resour. 2021, 41, 25–31. [Google Scholar]
- Du, L.J.; Chen, G.F.; Liu, C.S.; Wang, X.N.; Liu, J.L.; Wang, H.L. GWAS Model Based on Allocation of Water Resources in Irrigated District. J. Water Resour. Hydropower Eng. 2020, 51, 26–35. [Google Scholar]
- Han, X.X.Q. Optimal Allocation of Regional Water Resources From the Perspective of Water-Energy-Food Nexus: A Case Study of Yulin. Master’s Thesis, Northwest A & F University, Yulin, China, 2021. [Google Scholar]
- Chang, H.Y.; Zhao, Y.; Sang, X.F.; Li, H.H.; He, F.; Zhai, J.Q. Research on the Coordinated Regulation of Resources-Food-Energy-Ecology in Beijing-Tianjin-Hebei Ⅰ: Methods and Model. J. Water Resour. 2022, 53, 655–665. [Google Scholar]
- Zhao, Y.; Chang, H.Y.; Sang, X.F.; He, G.H.; Wang, Q.M.; Jiang, S. Research on the Coordinated Regulation of Resources-Food-Energy-Ecology in Beijing-Tianjin-Hebei Region II: Application. J. Hydraul. Eng. 2022, 53, 1251–1261. [Google Scholar]
- Sang, X.F.; Zhao, Y.; Zhai, Z.L. The GWAS User Manual and Example Tutorial for General Configuration and Simulation Software of Water Resources; Publishing House of Electronics Industry: Beijing, China, 2019. [Google Scholar]
- Huo, H.S. Handan Statistical Yearbook (2019); China Statistics Press: Beijing, China, 2020; pp. 33–316. [Google Scholar]
- Hebei Handan Hydrology and Water Resources Survey Bureau. Assessment of Water Resources in Handan (Third); Hebei Handan Hydrology and Water Resources Survey Bureau: Handan, China, 2019; pp. 71–165. (In Chinese) [Google Scholar]
- Hebei University of Engineering. Research Report on Development and Utilization of Reclaimed Water in Handan; Hebei University of Engineering: Handan, China, 2018; pp. 213–219. (In Chinese) [Google Scholar]
- Handan Water Resources and Hydropower Survey and Design Institute. The Planning of Handan in the South to North Water Transfer Project (Middle Line) of Hebei Province; Handan Water Resources and Hydropower Survey and Design Institute: Handan, China, 2002; pp. 102–110. (In Chinese) [Google Scholar]
- Water Conservancy Bureau of Handan. Allocation and Utilization of Surface Water in Handan; Water Conservancy Bureau of Handan: Handan, China, 2020; pp. 1–22. (In Chinese) [Google Scholar]
- Guo, J.P.; Wang, X.H.; Li, C.Y.; Yan, X.T.; Liu, H.L. Handan Water Resources Bulletin (2019); Handan Water Resources Management Center: Handan, China, 2020; pp. 1–43. [Google Scholar]
- Hebei University of Engineering. Research on Optimal Scheduling and Allocation Technology of Water Resources in Handan; Hebei University of Engineering: Handan, China, 2017; pp. 239–265. [Google Scholar]
- Ma, J.; Liu, H.; Wu, W.; Zhang, Y.; Dong, S. Research on Optimal Allocation of Water Resources in Handan City Based on the Refined Water Resource Allocation Model. J. Water 2022, 15, 154. [Google Scholar] [CrossRef]
- Suo, M.Q.; Xia, F.; Fan, Y. A Fuzzy-Interval Dynamic Optimization Model for Regional Water Resources Allocation under Uncertainty. J. Sustain. 2022, 14, 1096. [Google Scholar] [CrossRef]
- Yan, Z.; Sha, J.; Liu, B.; Tian, W.; Lu, J. An ameliorative whale optimization algorithm for multi-objective optimal allocation of water resources in Handan, China. J. Water 2018, 10, 87. [Google Scholar] [CrossRef] [Green Version]
Figure 1.
Distribution of water systems, water conservancy projects, and administrative divisions in Handan.
Figure 1.
Distribution of water systems, water conservancy projects, and administrative divisions in Handan.

Figure 2.
Topological diagram of water supply and consumption in the GWAS model.

Figure 3.
The network diagram of the water supply relationship in Handan.

Figure 4.
The comparative analysis of water supply between simulation and actual: (a) calculation units and (b) different industries.
Figure 4.
The comparative analysis of water supply between simulation and actual: (a) calculation units and (b) different industries.

Figure 5.
The proportion of water supply from different sources.

Figure 6.
Allocation of different water supply sources in Handan. (a) Groundwater, (b) Reservoir water, (c) South-to-North Water Diversion, (d) Recycled water, (e) Yellow river-transferred water, (f) Weihe river-transferred water, and (g) Yuefeng channel water.
Figure 6.
Allocation of different water supply sources in Handan. (a) Groundwater, (b) Reservoir water, (c) South-to-North Water Diversion, (d) Recycled water, (e) Yellow river-transferred water, (f) Weihe river-transferred water, and (g) Yuefeng channel water.


Figure 7.
The proportion of water supply from different industries in each administrative district of Handan. (a) Domestic, (b) Ecological, (c) Primary industry, (d) Secondary industry, (e) Tertiary industry.
Figure 7.
The proportion of water supply from different industries in each administrative district of Handan. (a) Domestic, (b) Ecological, (c) Primary industry, (d) Secondary industry, (e) Tertiary industry.


Table 1.
Forecast results of water demand of different industries in Handan in 2025 (P = 50%; 106 m3).
Table 1.
Forecast results of water demand of different industries in Handan in 2025 (P = 50%; 106 m3).
| Subregion | Domestic | Ecology | Primary Industry | Secondary Industry | Tertiary Industry | Total |
|---|---|---|---|---|---|---|
| Shexian | 16.75 | 9.83 | 25.00 | 10.21 | 11.49 | 73.28 |
| Wu’an | 32.14 | 17.02 | 154.29 | 61.39 | 30.22 | 295.06 |
| Cixian | 18.32 | 9.70 | 60.07 | 3.64 | 6.32 | 98.05 |
| Fengfeng | 17.41 | 11.11 | 20.29 | 16.38 | 9.35 | 74.54 |
| Hanshan | 29.45 | 19.66 | 90.33 | 10.54 | 23.20 | 173.18 |
| Fuxing | 16.07 | 11.24 | 21.62 | 17.37 | 13.37 | 79.67 |
| Congtai | 33.49 | 25.31 | 33.33 | 19.76 | 35.32 | 147.21 |
| Yongnian | 31.80 | 16.84 | 188.05 | 14.18 | 12.82 | 263.69 |
| Linzhang | 21.34 | 10.64 | 173.66 | 6.78 | 9.47 | 221.89 |
| Cheng’an | 14.63 | 7.74 | 104.84 | 10.02 | 8.37 | 145.60 |
| Weixain | 28.91 | 15.31 | 228.10 | 10.91 | 11.13 | 294.36 |
| Feixiang | 13.73 | 7.27 | 136.86 | 5.16 | 11.41 | 174.43 |
| Guangping | 10.26 | 5.43 | 69.65 | 3.88 | 6.60 | 95.82 |
| Quzhou | 15.92 | 7.73 | 103.79 | 6.33 | 6.89 | 140.66 |
| Daming | 29.56 | 15.65 | 271.03 | 3.70 | 9.94 | 329.88 |
| Guantao | 11.97 | 6.34 | 92.77 | 2.48 | 8.05 | 121.61 |
| Jize | 10.21 | 4.76 | 83.55 | 4.62 | 5.85 | 108.99 |
| Qiuxian | 8.88 | 4.70 | 82.59 | 4.08 | 5.72 | 105.97 |
| Total | 360.84 | 206.28 | 1939.82 | 211.43 | 225.52 | 2943.89 |
Table 2.
Prediction results of the available water supply of different water sources in Handan in 2025 (P = 50%; 106 m3).
Table 2.
Prediction results of the available water supply of different water sources in Handan in 2025 (P = 50%; 106 m3).
| Subunit | Ground Water | Recycled Water | South-to-North Water Diversion | Yellow River Transferred Water | Weihe River Transferred Water | Yuefeng Channel | Reservoir Water |
|---|---|---|---|---|---|---|---|
| Shexian | 70.46 | 17.81 | √ | ||||
| Wu’an | 122.51 | 45.02 | √ | ||||
| Cixian | 60.64 | 13.23 | √ | √ | |||
| Fengfeng | 91.57 | 18.61 | √ | √ | |||
| Hanshan | 53.09 | 33.77 | √ | ||||
| Fuxing | 16.12 | 21.06 | √ | ||||
| Congtai | 36.79 | 45.15 | √ | ||||
| Yongnian | 75.09 | 25.51 | √ | ||||
| Linzhang | 79.53 | 16.64 | √ | ||||
| Cheng’an | 40.26 | 13.93 | √ | √ | |||
| Weixain | 63.58 | 22.51 | √ | √ | √ | √ | |
| Feixiang | 16.86 | 14.65 | √ | √ | √ | ||
| Guangping | 13.07 | 9.71 | √ | √ | √ | ||
| Quzhou | 5.35 | 12.33 | √ | √ | √ | ||
| Daming | 93.67 | 20.81 | √ | √ | √ | √ | |
| Guantao | 43.09 | 11.20 | √ | √ | √ | √ | |
| Jize | 29.62 | 8.76 | √ | √ | |||
| Qiuxian | 17.10 | 8.53 | √ | √ | √ | ||
| Total | 928.40 | 359.23 | 352.02 | 179.00 | 87.00 | 226.38 | 514.50 |
Table 3.
Water supply relationship and water supply level of the reservoir to industry.
| Reservoir Name | Domestic | Ecology | Primary Industry | Secondary Industry | Tertiary Industry | |||||
|---|---|---|---|---|---|---|---|---|---|---|
| Maolingdi | √ | 1 | √ | 2 | √ | 5 | √ | 3 | √ | 4 |
| Qingta | √ | 1 | √ | 2 | √ | 5 | √ | 3 | √ | 4 |
| Chegu | √ | 1 | √ | 2 | √ | 5 | √ | 3 | √ | 4 |
| Koushang | 5 | √ | 1 | √ | 4 | √ | 2 | √ | 3 | |
| Siliyan | √ | 1 | √ | 2 | √ | 5 | √ | 3 | √ | 4 |
| Damingyuan | 5 | √ | 1 | √ | 3 | √ | 2 | 4 | ||
| Yuecheng | 5 | √ | 1 | √ | 4 | √ | 2 | √ | 3 | |
| Dongwushi | 5 | √ | 1 | √ | 4 | √ | 2 | √ | 3 | |
| Wu’an | 5 | 4 | √ | 2 | √ | 1 | 3 | |||
| Shexian | 5 | 4 | √ | 1 | 2 | 3 | ||||
| Yuefeng Channel | 5 | √ | 1 | √ | 3 | √ | 2 | 4 | ||
| South-to-North Water Diversion | √ | 1 | 4 | 5 | √ | 2 | √ | 3 | ||
| Weihe River Transferred | 5 | 4 | √ | 1 | 2 | 3 | ||||
| Yellow River Transferred | 5 | √ | 1 | √ | 2 | 3 | 4 | |||
Table 4.
Optimal allocation results and water shortage rate for water resources in different industries in Handan in 2025 (106 m3, %).
Table 4.
Optimal allocation results and water shortage rate for water resources in different industries in Handan in 2025 (106 m3, %).
| Subunit | Domestic | Ecology | Primary Industry | Secondary Industry | Tertiary Industry | Total | ||||||||||||
|---|---|---|---|---|---|---|---|---|---|---|---|---|---|---|---|---|---|---|
| Demand | Allocated | Shortage Rate | Demand | Allocated | Shortage Rate | Demand | Allocated | Shortage Rate | Demand | Allocated | Shortage Rate | Demand | Allocated | Shortage Rate | Demand | Allocated | Shortage Rate | |
| Shexian | 16.75 | 16.75 | 0 | 9.83 | 9.83 | 0 | 25.00 | 25.00 | 0 | 10.21 | 10.21 | 0 | 11.49 | 11.49 | 0 | 73.28 | 73.28 | 0 |
| Wu’an | 32.14 | 32.14 | 0 | 17.02 | 17.02 | 0 | 154.29 | 91.50 | 40.70 | 61.39 | 61.26 | 0.34 | 30.22 | 28.22 | 6.62 | 295.06 | 230.14 | 22.00 |
| Cixian | 18.32 | 18.32 | 0 | 9.70 | 9.70 | 0 | 60.07 | 60.07 | 0 | 3.64 | 3.64 | 0 | 6.32 | 6.32 | 0 | 98.05 | 98.05 | 0 |
| Fengfeng | 17.41 | 17.41 | 0 | 11.11 | 11.11 | 0 | 20.29 | 20.29 | 0 | 16.38 | 16.38 | 0 | 9.35 | 9.35 | 0 | 74.54 | 74.54 | 0 |
| Hanshan | 29.45 | 29.45 | 0 | 19.66 | 19.66 | 0 | 90.33 | 85.63 | 5.20 | 10.54 | 10.54 | 0 | 23.20 | 23.20 | 0 | 173.18 | 168.48 | 2.71 |
| Fuxing | 16.07 | 16.07 | 0 | 11.24 | 11.24 | 0 | 21.62 | 18.34 | 15.17 | 17.37 | 17.37 | 0 | 13.37 | 13.37 | 0 | 79.67 | 76.39 | 4.12 |
| Congtai | 33.49 | 33.49 | 0 | 25.31 | 25.31 | 0 | 33.33 | 33.33 | 0 | 19.76 | 19.76 | 0 | 35.32 | 35.32 | 0 | 147.21 | 147.21 | 0 |
| Yongnian | 31.80 | 31.80 | 0 | 16.84 | 16.84 | 0 | 188.05 | 147.48 | 21.57 | 14.18 | 14.18 | 0 | 12.82 | 12.82 | 0 | 263.69 | 223.12 | 15.39 |
| Linzhang | 21.34 | 21.34 | 0 | 10.64 | 10.64 | 0 | 173.66 | 97.04 | 44.12 | 6.78 | 6.78 | 0 | 9.47 | 9.47 | 0 | 221.89 | 145.27 | 34.53 |
| Cheng’an | 14.63 | 14.63 | 0 | 7.74 | 7.74 | 0 | 104.84 | 68.36 | 34.8 | 10.02 | 10.02 | 0 | 8.37 | 8.14 | 2.75 | 145.60 | 108.89 | 25.21 |
| Weixain | 28.91 | 28.91 | 0 | 15.31 | 15.31 | 0 | 228.1 | 164.97 | 27.68 | 10.91 | 10.91 | 0 | 11.13 | 11.13 | 0 | 294.36 | 231.23 | 21.45 |
| Feixiang | 13.73 | 13.73 | 0 | 7.27 | 7.27 | 0 | 136.86 | 87.10 | 36.36 | 5.16 | 5.16 | 0 | 11.41 | 11.02 | 3.42 | 174.43 | 124.28 | 28.75 |
| Guangping | 10.26 | 10.26 | 0 | 5.43 | 5.43 | 0 | 69.65 | 43.52 | 37.52 | 3.88 | 3.88 | 0 | 6.6 | 6.34 | 3.94 | 95.82 | 69.43 | 27.54 |
| Quzhou | 15.92 | 15.92 | 0 | 7.73 | 7.73 | 0 | 103.79 | 64.09 | 38.25 | 6.33 | 6.33 | 0 | 6.89 | 6.61 | 4.06 | 140.66 | 100.68 | 28.42 |
| Daming | 29.56 | 29.56 | 0 | 15.65 | 15.65 | 0 | 271.03 | 223.40 | 17.57 | 3.70 | 3.70 | 0 | 9.94 | 9.56 | 3.82 | 329.88 | 281.87 | 14.55 |
| Guantao | 11.97 | 11.97 | 0 | 6.34 | 6.34 | 0 | 92.77 | 69.84 | 24.72 | 2.48 | 2.48 | 0 | 8.05 | 7.74 | 3.85 | 121.61 | 98.37 | 19.11 |
| Jize | 10.21 | 10.21 | 0 | 4.76 | 4.76 | 0 | 83.55 | 61.73 | 26.12 | 4.62 | 4.62 | 0 | 5.85 | 5.85 | 0 | 108.99 | 87.17 | 20.02 |
| Qiuxian | 8.88 | 8.88 | 0 | 4.70 | 4.70 | 0 | 82.59 | 54.73 | 33.73 | 4.08 | 4.08 | 0 | 5.72 | 5.50 | 3.85 | 105.97 | 77.89 | 26.50 |
| Total | 360.84 | 360.84 | 0 | 206.28 | 206.28 | 0 | 1939.85 | 1416.42 | 26.98 | 211.43 | 211.30 | 0.10 | 225.52 | 221.45 | 1.80 | 2943.89 | 2416.29 | 17.92 |
Table 5.
Distribution of water from different water sources in Handan in 2025 (P = 50%; 106 m3).
| Subunit | Ground Water | Recycled Water | Reservoir Water | South-to-North Water Diversion | Yellow River Transferred Water | Weihe River Transferred Water | Yuefeng Channel | Total |
|---|---|---|---|---|---|---|---|---|
| Shexian | 49.23 | 11.78 | 12.27 | 0 | 0 | 0 | 0 | 73.28 |
| Wu’an | 122.46 | 44.91 | 62.77 | 0 | 0 | 0 | 0 | 230.14 |
| Cixian | 58.37 | 10.65 | 2.01 | 12.59 | 0 | 0 | 14.43 | 98.05 |
| Fengfeng | 53.65 | 15.35 | 0 | 0 | 0 | 0 | 5.54 | 74.54 |
| Hanshan | 53.07 | 33.66 | 41.83 | 39.92 | 0 | 0 | 0 | 168.48 |
| Fuxing | 16.12 | 21.03 | 17.00 | 22.24 | 0 | 0 | 0 | 76.39 |
| Congtai | 35.34 | 40.37 | 32.93 | 38.57 | 0 | 0 | 0 | 147.21 |
| Yongnian | 75.08 | 24.52 | 87.85 | 35.67 | 0 | 0 | 0 | 223.12 |
| Linzhang | 79.53 | 16.64 | 16.52 | 32.58 | 0 | 0 | 0 | 145.27 |
| Cheng’an | 40.25 | 13.93 | 36.75 | 17.96 | 0 | 0 | 0 | 108.89 |
| Weixain | 63.57 | 22.51 | 25.81 | 40.47 | 35.88 | 42.99 | 0 | 231.23 |
| Feixiang | 16.86 | 14.65 | 40.93 | 16.28 | 35.56 | 0 | 0 | 124.28 |
| Guangping | 13.06 | 9.71 | 17.23 | 11.65 | 17.78 | 0 | 0 | 69.43 |
| Quzhou | 5.33 | 12.32 | 36.41 | 17.57 | 29.05 | 0 | 0 | 100.68 |
| Daming | 93.67 | 20.67 | 71.45 | 31.31 | 30.73 | 34.04 | 0 | 281.87 |
| Guantao | 43.09 | 10.34 | 12.77 | 13.24 | 9.05 | 9.88 | 0 | 98.37 |
| Jize | 29.62 | 8.18 | 37.39 | 11.98 | 0 | 0 | 0 | 87.17 |
| Qiuxian | 17.10 | 8.52 | 21.53 | 9.97 | 20.77 | 0 | 0 | 77.89 |
| Total | 865.40 | 339.74 | 573.45 | 352.00 | 178.82 | 86.91 | 19.97 | 2416.29 |
Table 6.
Results of reservoir optimal operation in Handan (106 m3).
| Reservoirs Name | Koushang | Qingta | Maolingdi | Shexian | Yuefeng Channel | Total |
|---|---|---|---|---|---|---|
| Siliyan | 12.00 | 12.00 | ||||
| Damingyuan | 0.12 | 0.12 | ||||
| Yuecheng | 42.96 | 1.49 | 44.45 | |||
| Dongwushi | 154.37 | 154.37 | ||||
| Total | 12.00 | 0.12 | 42.96 | 1.49 | 154.37 | 210.94 |
Table 7.
Results of reservoir optimal operation in Handan (106 m3).
| Subunit | South-to-North Water Diversion | Yellow River Transferred Water | Weihe River Transferred Water | Yuefeng Channel | ||||
|---|---|---|---|---|---|---|---|---|
| GWAS | Tradition | GWAS | Tradition | GWAS | Tradition | GWAS | Tradition | |
| Shexian | ||||||||
| Wu’an | ||||||||
| Cixian | 12.59 | 30.74 | 14.43 | 15.00 | ||||
| Fengfeng | 5.54 | 5.00 | ||||||
| Hanshan | 39.92 | 77.49 | ||||||
| Fuxing | 22.24 | 44.56 | ||||||
| Congtai | 38.57 | 71.68 | ||||||
| Yongnian | 35.67 | 36.00 | ||||||
| Linzhang | 32.58 | 7.38 | ||||||
| Cheng’an | 17.96 | 6.74 | ||||||
| Weixain | 40.47 | 21.00 | 35.88 | 36.24 | 42.99 | 40.00 | ||
| Feixiang | 16.28 | 10.00 | 35.56 | 19.78 | 2.00 | |||
| Guangping | 11.65 | 7.00 | 17.78 | 22.53 | ||||
| Quzhou | 17.57 | 5.53 | 29.05 | 24.02 | ||||
| Daming | 31.31 | 7.90 | 30.73 | 24.46 | 34.04 | 25.00 | ||
| Guantao | 13.24 | 7.00 | 9.05 | 24.00 | 9.88 | 20.00 | ||
| Jize | 11.98 | 6.00 | ||||||
| Qiuxian | 9.97 | 13.00 | 20.77 | 27.93 | ||||
| Total | 352.00 | 352.02 | 178.82 | 178.96 | 86.91 | 87.00 | 19.97 | 20.00 |
Disclaimer/Publisher’s Note: The statements, opinions and data contained in all publications are solely those of the individual author(s) and contributor(s) and not of MDPI and/or the editor(s). MDPI and/or the editor(s) disclaim responsibility for any injury to people or property resulting from any ideas, methods, instructions or products referred to in the content. |
© 2023 by the authors. Licensee MDPI, Basel, Switzerland. This article is an open access article distributed under the terms and conditions of the Creative Commons Attribution (CC BY) license (https://creativecommons.org/licenses/by/4.0/).
Share and Cite
MDPI and ACS Style
Luo, Y.; Sha, J.; Liu, B.; Zhang, Y.; Yang, J. Optimal Allocation of Water Resources Based on GWAS Model in Handan, China. Water 2023, 15, 1090. https://doi.org/10.3390/w15061090
AMA Style
Luo Y, Sha J, Liu B, Zhang Y, Yang J. Optimal Allocation of Water Resources Based on GWAS Model in Handan, China. Water. 2023; 15(6):1090. https://doi.org/10.3390/w15061090
Chicago/Turabian StyleLuo, Yun, Jinxia Sha, Bin Liu, Yinqin Zhang, and Jie Yang. 2023. "Optimal Allocation of Water Resources Based on GWAS Model in Handan, China" Water 15, no. 6: 1090. https://doi.org/10.3390/w15061090
Note that from the first issue of 2016, this journal uses article numbers instead of page numbers. See further details here.