
Monitoring the Dew Amount in Typical Ecosystems of Northeast China from 2005 to 2021

Key Laboratory of Songliao Aquatic Environment, Ministry of Education, Jilin Jianzhu University, No. 5088 Xin Cheng Road, Changchun 130118, China
*
Author to whom correspondence should be addressed.
Water 2023, 15(6), 1091; https://doi.org/10.3390/w15061091
Submission received: 20 February 2023
/
Revised: 8 March 2023
/
Accepted: 9 March 2023
/
Published: 13 March 2023
(This article belongs to the Section Ecohydrology)
Abstract
:Dew is a part of the water cycle of ecosystems and is a source of water and humidity. The climate characteristics of the frost-free period in Northeast China are suitable for dew condensation, and dew is an important factor of water balance in this area. Northeast China is among the most significant warming areas in China, with an obvious “warm and dry” climate trend, which may affect dew condensation. To determine the dew amounts in different ecosystems in Northeast China and the influence of climate change on these amounts, dew condensation in farmland (corn), wetland (Carex lasiocarpa) and urban ecosystems (Syringa oblata Lindl.) was monitored during the growing period (May to October) from 2005 to 2021. The results showed that the annual average number of dew days was 132.8 in a wetland in Fujin, 122.9 in a farmland in Lishu and 118.1 in an urban area in Changchun. The daily dew intensity in the three ecosystems was lowest in May and highest in July and August. The average daily dew intensity was higher in the wetland (0.125 ± 0.069 mm) than the farmland (0.061 ± 0.026 mm) and urban area (0.028 ± 0.009 mm). The annual dew amount was also highest in the wetland (44.09 ± 7.51 mm) compared to the farmland (34.46 ± 3.54 mm) and much higher than that in the urban ecosystem (25.32 ± 3.29 mm). The annual dew in the farmland, wetland and urban ecosystems accounted for 7.92 ± 2.76%, 14.98 ± 5.93% and 6.71 ± 2.66% of the rainfall in the same period, respectively. The results indicated that dew was an important source of water and that wetlands had greater dew deposition than farmlands and urban areas. Considering the climate data during the dew condensation period from 1957 to 2021, the annual dew amount showed a decreasing trend of −0.40 mm/10a (p < 0.05) in Changchun. However, under the joint influence of relative humidity (RH) and wind speed (V), the impact of climate change on dew condensation was not obvious. This study further clarified the impact of climate change on the near-surface water cycle.
1. Introduction
With the current shortage of water resources, an increasing number of researchers have paid attention to dew, which frequently condenses in various ecosystems [1,2]. Dew is an important water source for animals, plants, and microorganisms [3,4]. It can be absorbed through leaves, which can supplement the water and nutrient elements such as N, K and P that are necessary to prolong leaf life [5,6]. Dew can also maintain the water balance of leaves [7] and increase photosynthesis [8]. Whether in desert [9,10], farmland [11,12], grassland [13], island [14], or urban areas [15], dew is a stable water resource. The amount of dew condensation is considerable; even in the urban area of hyper-arid Abu Dhabi, the average daily dew amount is 0.016 mm [16]. Lekouch et al. collected dew on the roofs of Morocco and found that dew can provide 18.85 mm of drinking water for households each year [17]. The average dew amount during the summer half-year was 17.2 mm, which accounted for 50% of the annual rainfall in the Taklimakan Desert forest ecosystem, and the total dew amount was higher than the annual rainfall during one-fifth of the year from 1960 to 2010 [18]. In Kenya, farmers irrigated mango seedlings with dew water [19], and dew is a good alternative source of water for alleviating agricultural drought in arid and semiarid regions in Iran [20] and China [21,22]. Therefore, it is important to quantify the dew amount.
At present, it is common to use the subtraction method to measure the dew amount, that is, by calculating the difference in the monitored weight before and after dew condensation. There are several types of monitors for different types of underlying surface characteristics, namely, microlysimeters [23], cloth plates [24], woodsticks [25], PVC containers [9,10], steel sheets [15,17], and plastic sheets [26]. This method is more accurate in monitoring the dew amount, but the subtraction method requires manpower to weigh the monitor at the beginning and end of dew condensation. This leads to the lack of long-term monitoring of dew amounts of more than 10 years.
Climate change is an indisputable fact, and the warming trend is significantly altering various environmental variables, especially the water cycle, in many countries across the world [27]. Many studies on climate change in Northeast China have focused on surface temperature, precipitation, wind speed, evaporation, and other factors [28,29]. In the past 60 years, the temperature increase rate in China was 0.25–0.30 °C/10a [30,31], and Northeast China is among the regions with the most significant temperature increase. The near-surface temperature increased by 0.35 °C/10a in Northeast China during 1961–2010 [28,32]. Studies have shown that the temperature in Northeast China will continue to have a “warm and dry trend” until the late 21st century due to the impact of increased human emissions [31]. With the condensation of water vapor on underlying surfaces, dew formation is affected by local meteorological factors. Climate change may significantly affect dew formation, which is sensitive to variations in relative humidity (RH) and temperature.
Northeast China is among the regions with the largest area of wetlands, and it is also an important commodity grain base. The ecosystem types in Northeast China are diverse, with mainly farmland, wetland and urban ecosystems. The climate characteristics of this region in the frost-free period are suitable for dew condensation, and dew is among the most important factors in determining the water balance. The variation trend of the dew amount is likely to affect the hydrological cycle and the quantity and availability of fresh water. Dew formation is significantly affected by the underlying surface type, and the dew amount of different ecosystems varies greatly. However, systematic and long-term monitoring studies on dew amounts in different ecosystems in Northeast China have not been carried out. The objective of this study is to distinguish and identify the dew amount in different ecosystems (farmland, urban and wetland) in Northeast China by long-term (2005–2021) monitoring of dew, to analyze the related main meteorological factors affecting dew condensation, and to estimate the impact of climate change on dew condensation in Northeast China.
2. Materials and Methods
2.1. Study Area
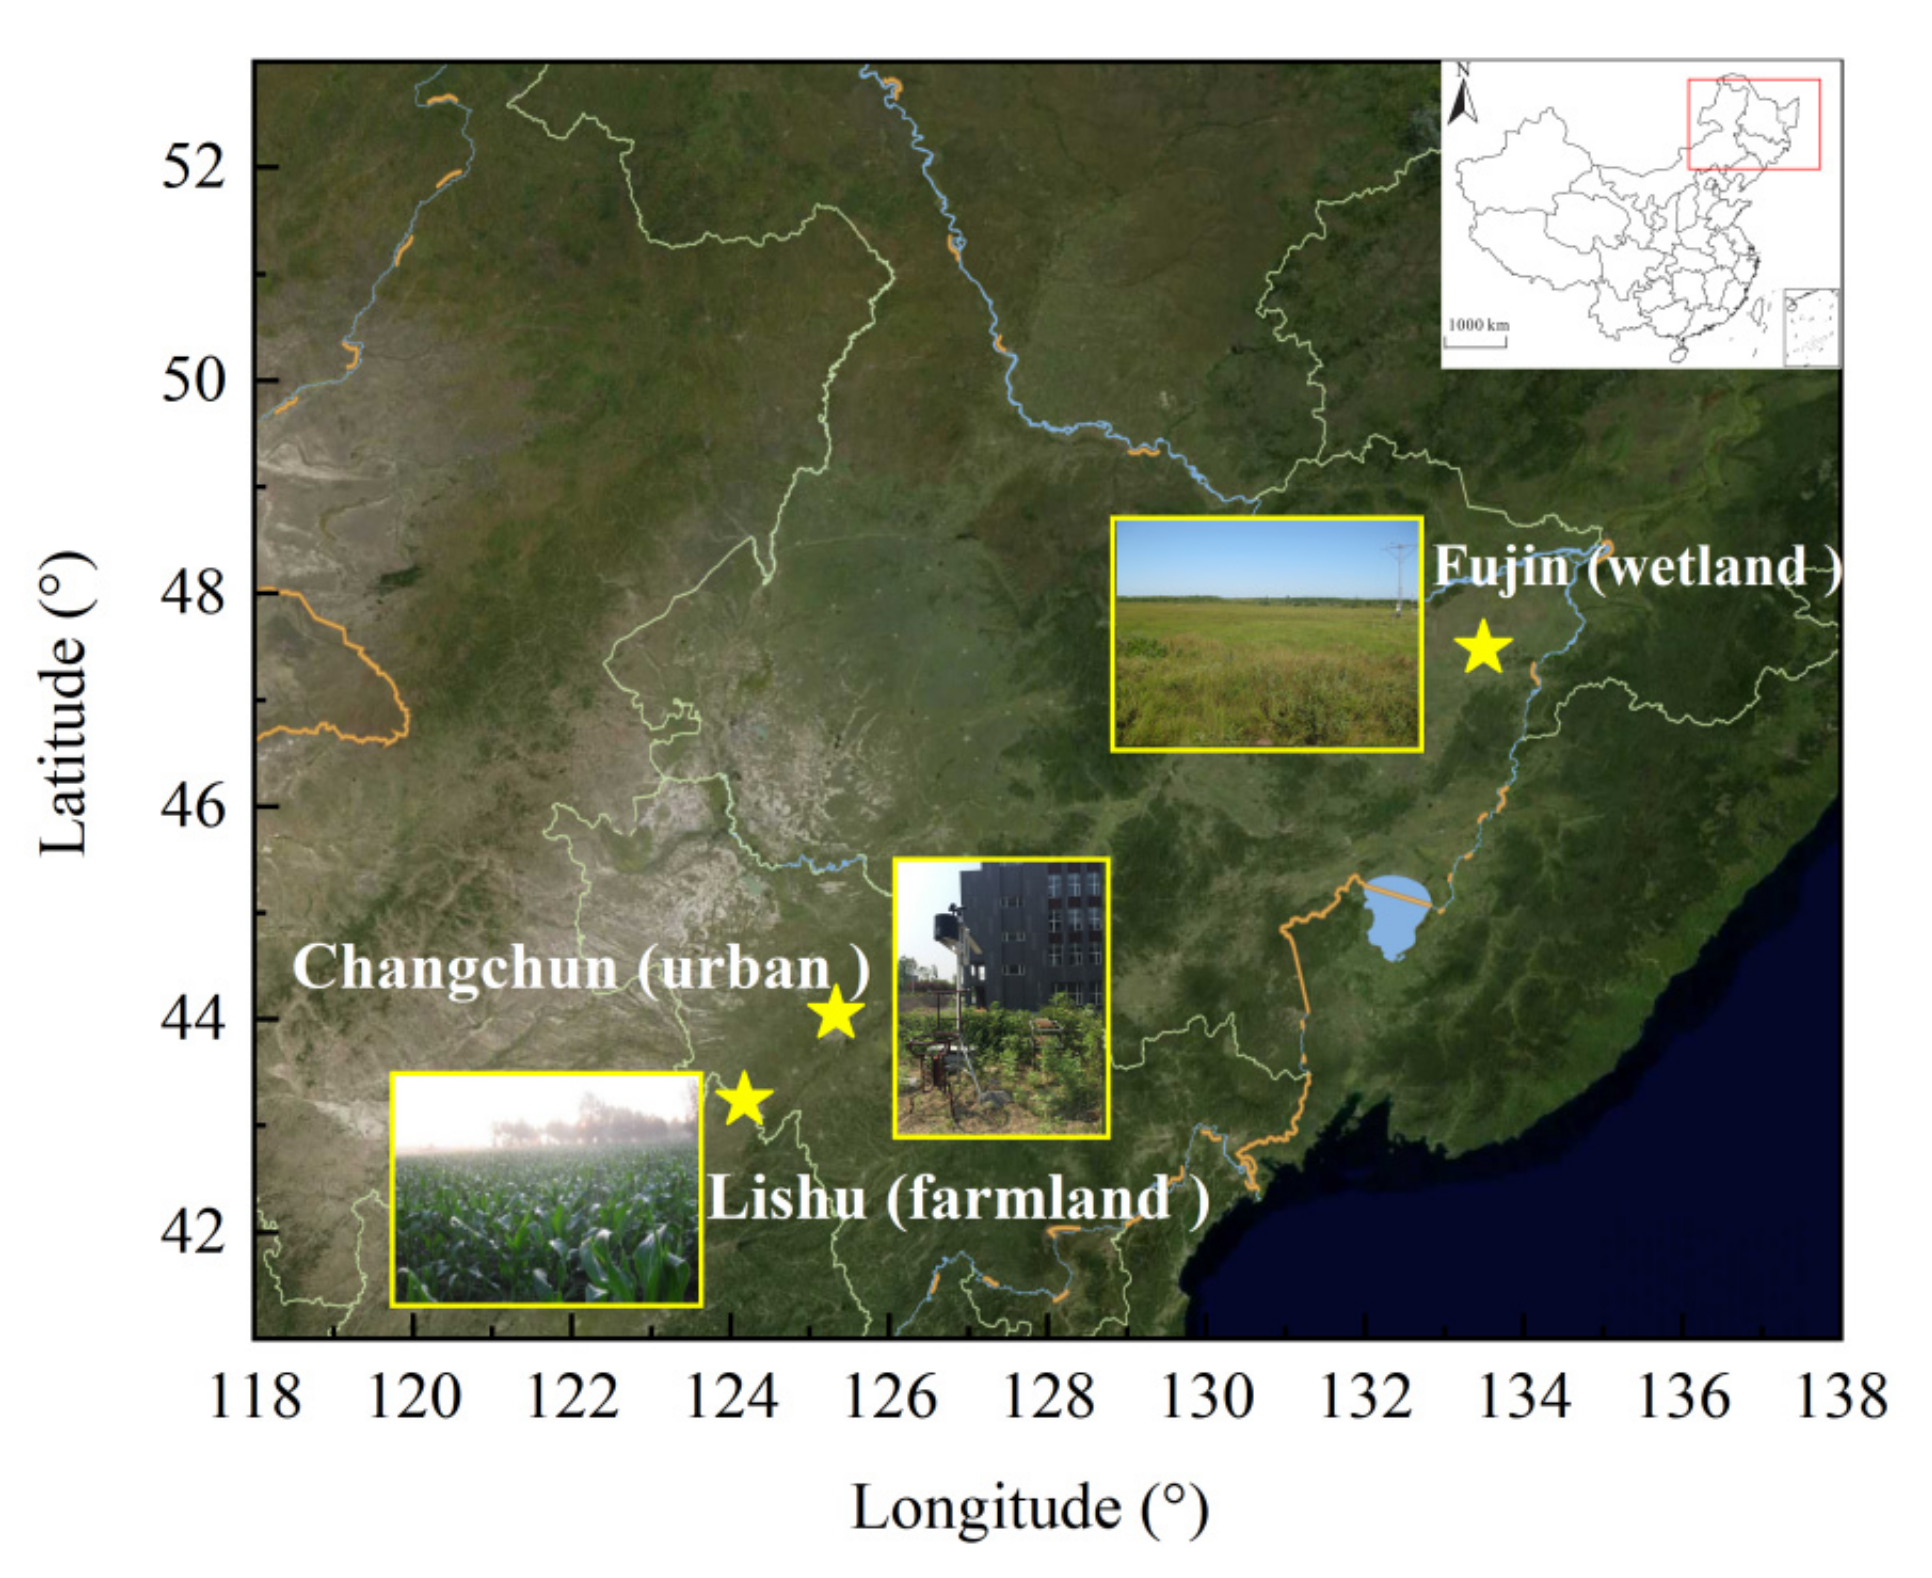
Sampling plots were set up in Lishu, Fujin and Changchun (Figure 1). Lishu, as a representative farmland ecosystem, is located in the northeast Songnen Plain, which is considered the world’s “Golden Corn Belt” with annual corn (Zea mays) cultivation. As a wetland ecosystem, Fujin is located in the hinterland of the Sanjiang Plain, the largest marsh plain area in China. The dominant plant species is Carex lasiocarpa, which has perennial ponding, and the water depth is approximately 10–25 cm. Changchun, the capital of Jilin Province, is located in the geographic center of Northeast China. Syringa oblata Lindl., a shrub commonly used in urban greening in northeast China, was selected as the representative plant in Changchun. The three sampling plots are all in a subhumid area and have a temperate continental monsoon climate with four distinct seasons (Table 1). The weather in summer and autumn is characterized by high humidity and low wind speed, which is suitable for dew condensation at night. The experiment was synchronously carried out at three sampling plots during the plant growth period from 2005 to 2021, and dew condensation on different types of underlying surfaces was observed daily. The monitoring period of the farmland ecosystem was from May 11 to October 31 of each year, while that of the wetland (Fujin) and urban (Changchun) ecosystems was from May 1 to October 31 of each year.
2.2. Dew Monitoring
An observation shelf was set up at each sampling point, the height of which could be adjusted according to plant height. Polished poplar woodsticks with dimensions of 18 cm × 3.5 cm × 3.5 cm (length × width × height) were used as dew condensers. The poplar woodsticks were accurately weighed with an electronic balance (accuracy within 0.001 g). Half an hour after sunset, three woodsticks were placed in the plant canopy. The woodsticks were weighed again half an hour before sunrise. The actual dew per unit area for each plot was computed as the average of the three woodsticks. The leaf area index (LAI) was measured using a LAI-2000 Plant Canopy Analyzer (LAI-2200C, LI-COR Co. Ltd., Lincoln, NE, USA) over a 10-day interval. As it is difficult to distinguish between dew condensation and rainfall, if a precipitation event had occurred after sunset or before sunrise, the dew was recorded as zero.
The daily dew intensity in each sampling plot was calculated with the following formula:
I = (Wr − Ws) × 10/S
The total dew amount was calculated with the following formula:
I is the daily dew intensity (mm), which is the ability of dew to condense per unit area. Ws is the weight of the woodstick after sunset (g), Wr is the weight of the woodstick before sunrise (g), S is the surface area (cm2) of the woodstick, 10 is the conversion factor, DF is the dew amount in a particular period (month or year) (mm), Dd is the number of dew days in a particular period (month or year) (days), 2 is a coefficient to account for both sides of the leaf, and LAI is the leaf area index (cm2/cm2).
2.3. Meteorological Factors
The meteorological factors, including relative humidity (RH, %), air temperature (Ta, °C), dew point temperature (Td, °C), wind speed (V) at 1.0 m near the surface (m/s), and rainfall (mm), were measured at hourly intervals during the dew condensation time from 2005 to 2021 by a MILOS 520 automatic weather station (VAISALA Co. Ltd., Helsinki, Finland) at each plot. The cloud cover data in Lishu, Changchun and Fujin were provided by https://rp5.ru/ (accessed on 31 January 2023). The historical climate data of Changchun were all from the Changchun Meteorological Bureau, including the RH (%), Ta (°C), Td (°C), V at 1.0 m near the surface (m/s), cloud cover during dew condensation time, and rainfall (mm) from May to October during 1957–1964 and 1973–2004.
2.4. Data Analysis and Model Selection
The normal distribution test and significant differences analysis of the experimental data were analyzed by SPSS 16.0 software (SPSS Inc., Chicago, IL, USA). To further explore the impact of climate change on dew condensation, the monitored dew intensity from 2005 to 2019 (n = 1764) was used in this study to build a model, and the monitored dew intensity from 2020 to 2021 (n = 242) was used to verify the model. It should be noted that due to the maturity of the dew condenser subtraction method, the dew intensity calculated by this method (Equation (1)) is regarded as the real value; meanwhile, the value calculated by the model is the simulated value. In this study, meteorological factors were considered the independent variables and the dew intensity was considered the dependent variable. The multiple linear stepwise regression method was selected to build a simulation model. The reason that a multiple linear stepwise regression model was selected was to avoid the possibility of collinearity between the dependent variable and independent variables. In addition, the dependent variable was normally distributed, and the residual between the simulated value and the measured value showed a normal distribution. The values of each dependent variable were independent, which was suitable for the use of a multiple linear stepwise regression model.
3. Results and Discussion
3.1. Dew Days and Intensity
The annual average number of dew days in Fujin, Lishu and Changchun were 132.8, 122.9 and 118.1 days, which accounted for 72.2%, 72.7% and 64.2% of the growing season, respectively (Table 2). The absence of dew days in the study area was due to the occurrence of precipitation events at night, and it could be seen that nighttime condensation of water vapor is a common meteorological phenomenon in Northeast China. The highest number of dew days were all in September and October in the wetland, farmland and urban ecosystems, which was due to the frequent precipitation from June to August during the same period of rain-heat in the study area. The annual number of dew days in our study area was similar to those in a Gansu farmland (135 days) [21] and in the Tengger Desert (128 days) [10]. Northeast China has four distinct seasons, and the low temperature and high wind speed in winter and spring make these seasons unsuitable for dew condensation. The annual number of dew days were lower than those in Kenya (265 days) [33] and the Mu Us Desert (166) [34], in which the climate is suitable for dew condensation throughout the year.
The daily average dew intensity was 0.125 ± 0.069 mm, with the highest accumulation of 0.315 mm in Fujin, which was higher than that in Lishu (0.061 ± 0.026 mm) and Changchun (0.028 ± 0.009 mm) (Table 2). The factors that affect dew formation are complicated, as dew is influenced mainly by regional factors (altitude, slope, aspect, etc.), meteorological factors (RH, wind speed, temperature, etc.), and underlying surfaces (plants, bare soil, hardened ground, etc.) [35]. The three monitoring sites were all located in the Northeast Plain of China and had a temperate continental monsoon climate. The different local meteorological factors were essential factors that dominated the difference in dew intensity. As shown in Table 3, correlation analysis between the dew intensity and nocturnal meteorological data showed that the dew intensity in Lishu was positively correlated with RH, dew point temperature (Td), and air temperature (Ta) (n = 2091, p < 0.01) and negatively correlated with wind speed (V) and cloud cover (n = 2091, p < 0.01). The dew intensity in Fujin was positively correlated with RH, Td, and Ta (n = 2256, p < 0.01) and negatively correlated with V (n = 2256, p < 0.01). The dew intensity in Changchun was positively correlated with RH and Td (n = 2006, p < 0.01) and negatively correlated with V (n = 2006, p < 0.01). In Fujin, Lishu and Changchun, RH and V were the most important factors affecting dew condensation. The maximum dew intensity occurred in July and August in all three studied ecosystems (Table 2). Abundant rainfall in July and August enriched the atmosphere with moisture, and the higher dew intensity could be explained by the higher RH. The Td increased accordingly with RH. Wetlands are characterized by higher RH [25], the average RH (75.41%) of Fujin was significantly higher than that of Lishu (70.75%) and Changchun (61.55%) during the experimental period, and the dew intensity was higher in the wetland than in the farmland and urban areas (p < 0.01). Dew rarely forms during calm nights with wind speeds near 0 m/s, and breezy conditions are more favorable for the formation of dew. Light winds are conducive to heat emission, and the near-surface temperature quickly reaches Td. However, a high wind speed limits dew accumulation. Tuure et al. found that wind speeds under 2.4 m/s were good for dew formation [36]. Zhuang and Zhao also reported that wind speeds under 4.27 m/s were conducive to dew formation [9]. In this study, the dew formation threshold of RH was 42%, 47% and 45% in Lishu, Fujin and Changchun, respectively. The maximum wind speeds during dew nights were 5.0 m/s, 5.6 m/s and 6.0 m/s in Lishu, Fujin and Changchun, respectively.
The meteorological factors that determined the dew amount were found to be RH, Td, V, cloud cover, Ta, net radiation, soil heat flux, etc. In this study, the meteorological factors related to our study area were selected for comparison with other reported sites. As shown in Table 4, the factors affecting dew condensation vary from place to place, while RH appears to be the main factor influencing dew condensation. Dew condensation is closely related to water vapor in the atmosphere, and dew intensity is positively related to RH nearly everywhere. Dew intensity is negatively correlated with wind speed in most areas, while dew intensity is not related to wind speed in some places. For example, in Kenya, the wind speed was low and mainly concentrated in the threshold range of dew formation. Dew is insensitive to changes in wind speed [37]. In some dry desert areas, wind can effectively supply water vapor to the near surface and increase the dew amount. This leads to dew being positively correlated with wind speed [18]. Dew intensity increased with increasing Ta in places where rain and heat occurred in the same period. In some arid regions, such as the Gurbantunggut Desert, rain is rare [38]. The temperature is low at night, and water vapor is prone to condense when the temperature difference between day and night is large, so the dew intensity is negatively correlated with Ta. In general, cloudy weather does not promote the easy loss of surface heat and is unfavorable to dew formation. However, low cloud cover is always accompanied by blustery weather in some areas, such as Fujin and Changchun. Cloud cover was not an important factor affecting dew formation in these areas.
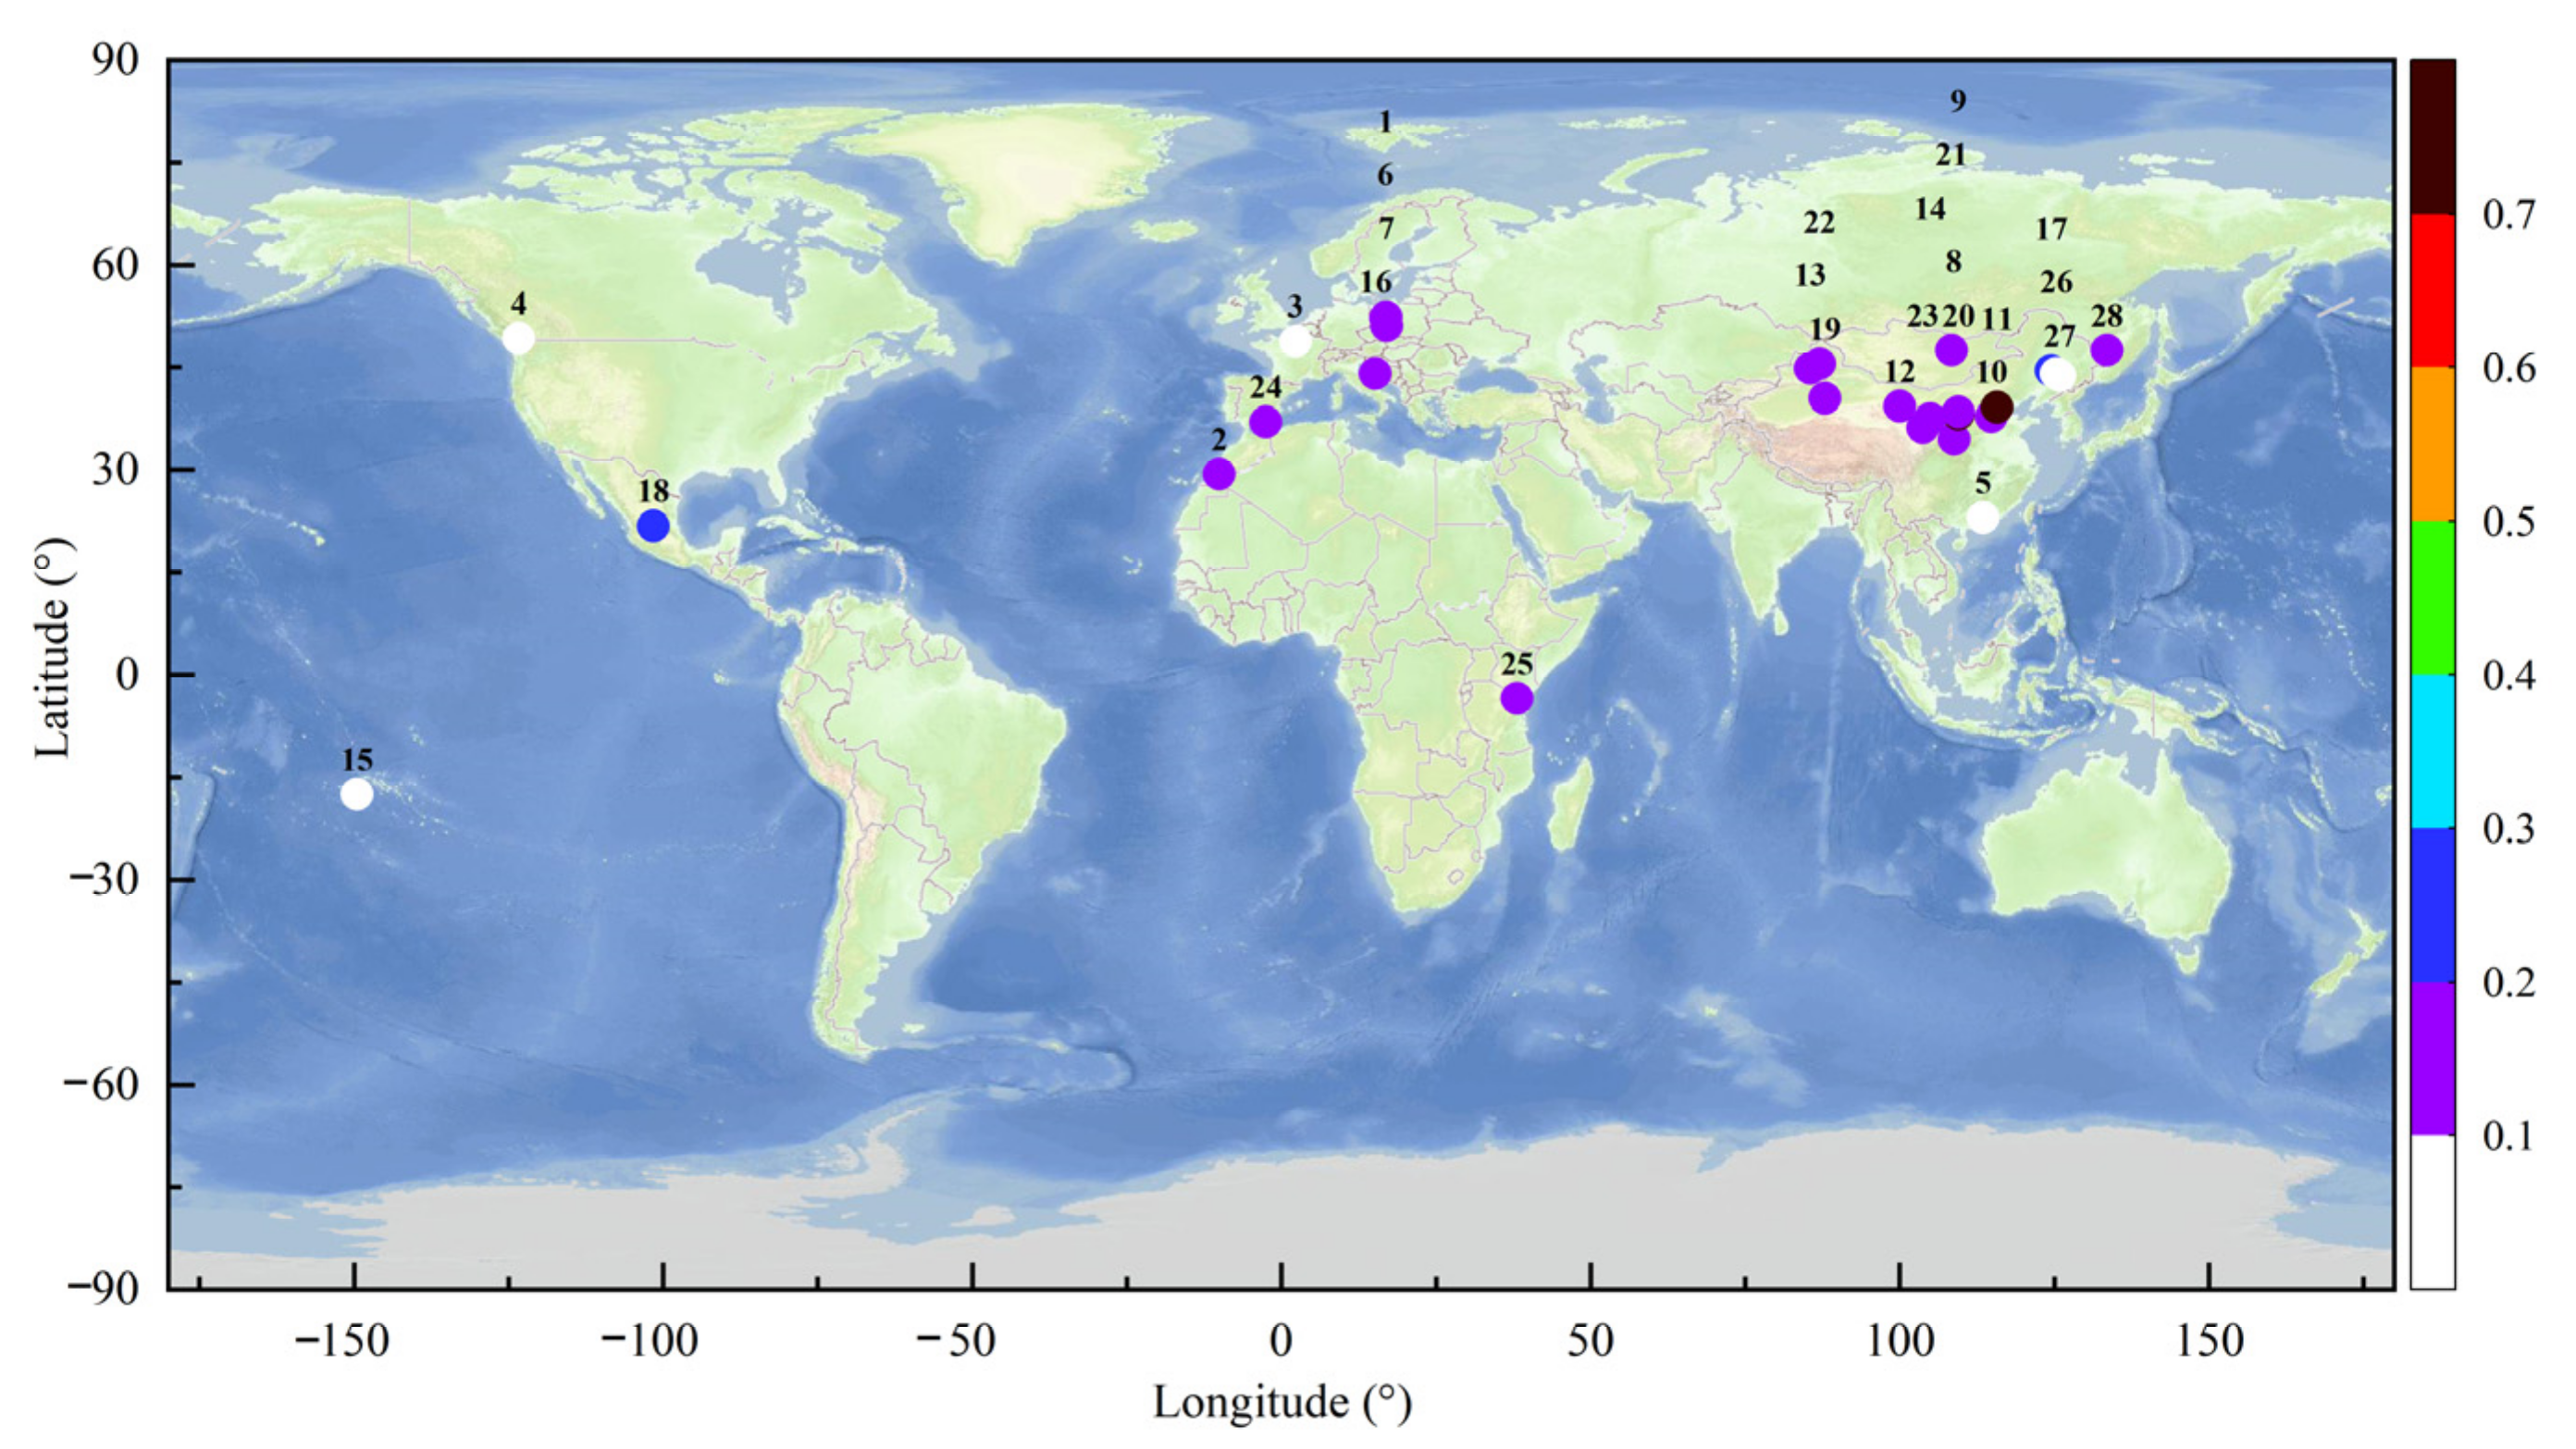
As shown in Figure 2, the daily dew intensity in most areas can reach 0.1–0.2 mm, with the exception of Mizhi (0.75 mm), Gucheng (0.75 mm), and Momoge (0.27 mm) in China. The dew intensity in urban ecosystems was concentrated between 0.022 mm (Guangzhou, China) and 0.13 mm (Pozan, Poland), which was slightly lower than that in other ecosystems. As a result of the population density, intense transportation activity and surface hardening in urban areas, the temperature was higher in those areas than in suburban and rural areas. Akinbode et al. found that the urban heat island intensity (UHI) spanned between 0.5 and 2.5 °C in southwest Nigeria [40]. Urban heat island effects and atmospheric pollution in urban environments lead to less dew formation [15,16,24,41]. The dew intensity of urban ecosystems in China is significantly lower than that in Mirleft, Morocco (0.11 mm), Paris, France (0.055 mm), and Vancouver, Canada (0.07 mm). This is mainly due to the higher population density and degree of surface hardening in Chinese cities. It exacerbated the urban heat island effect.
3.2. Dew Amount
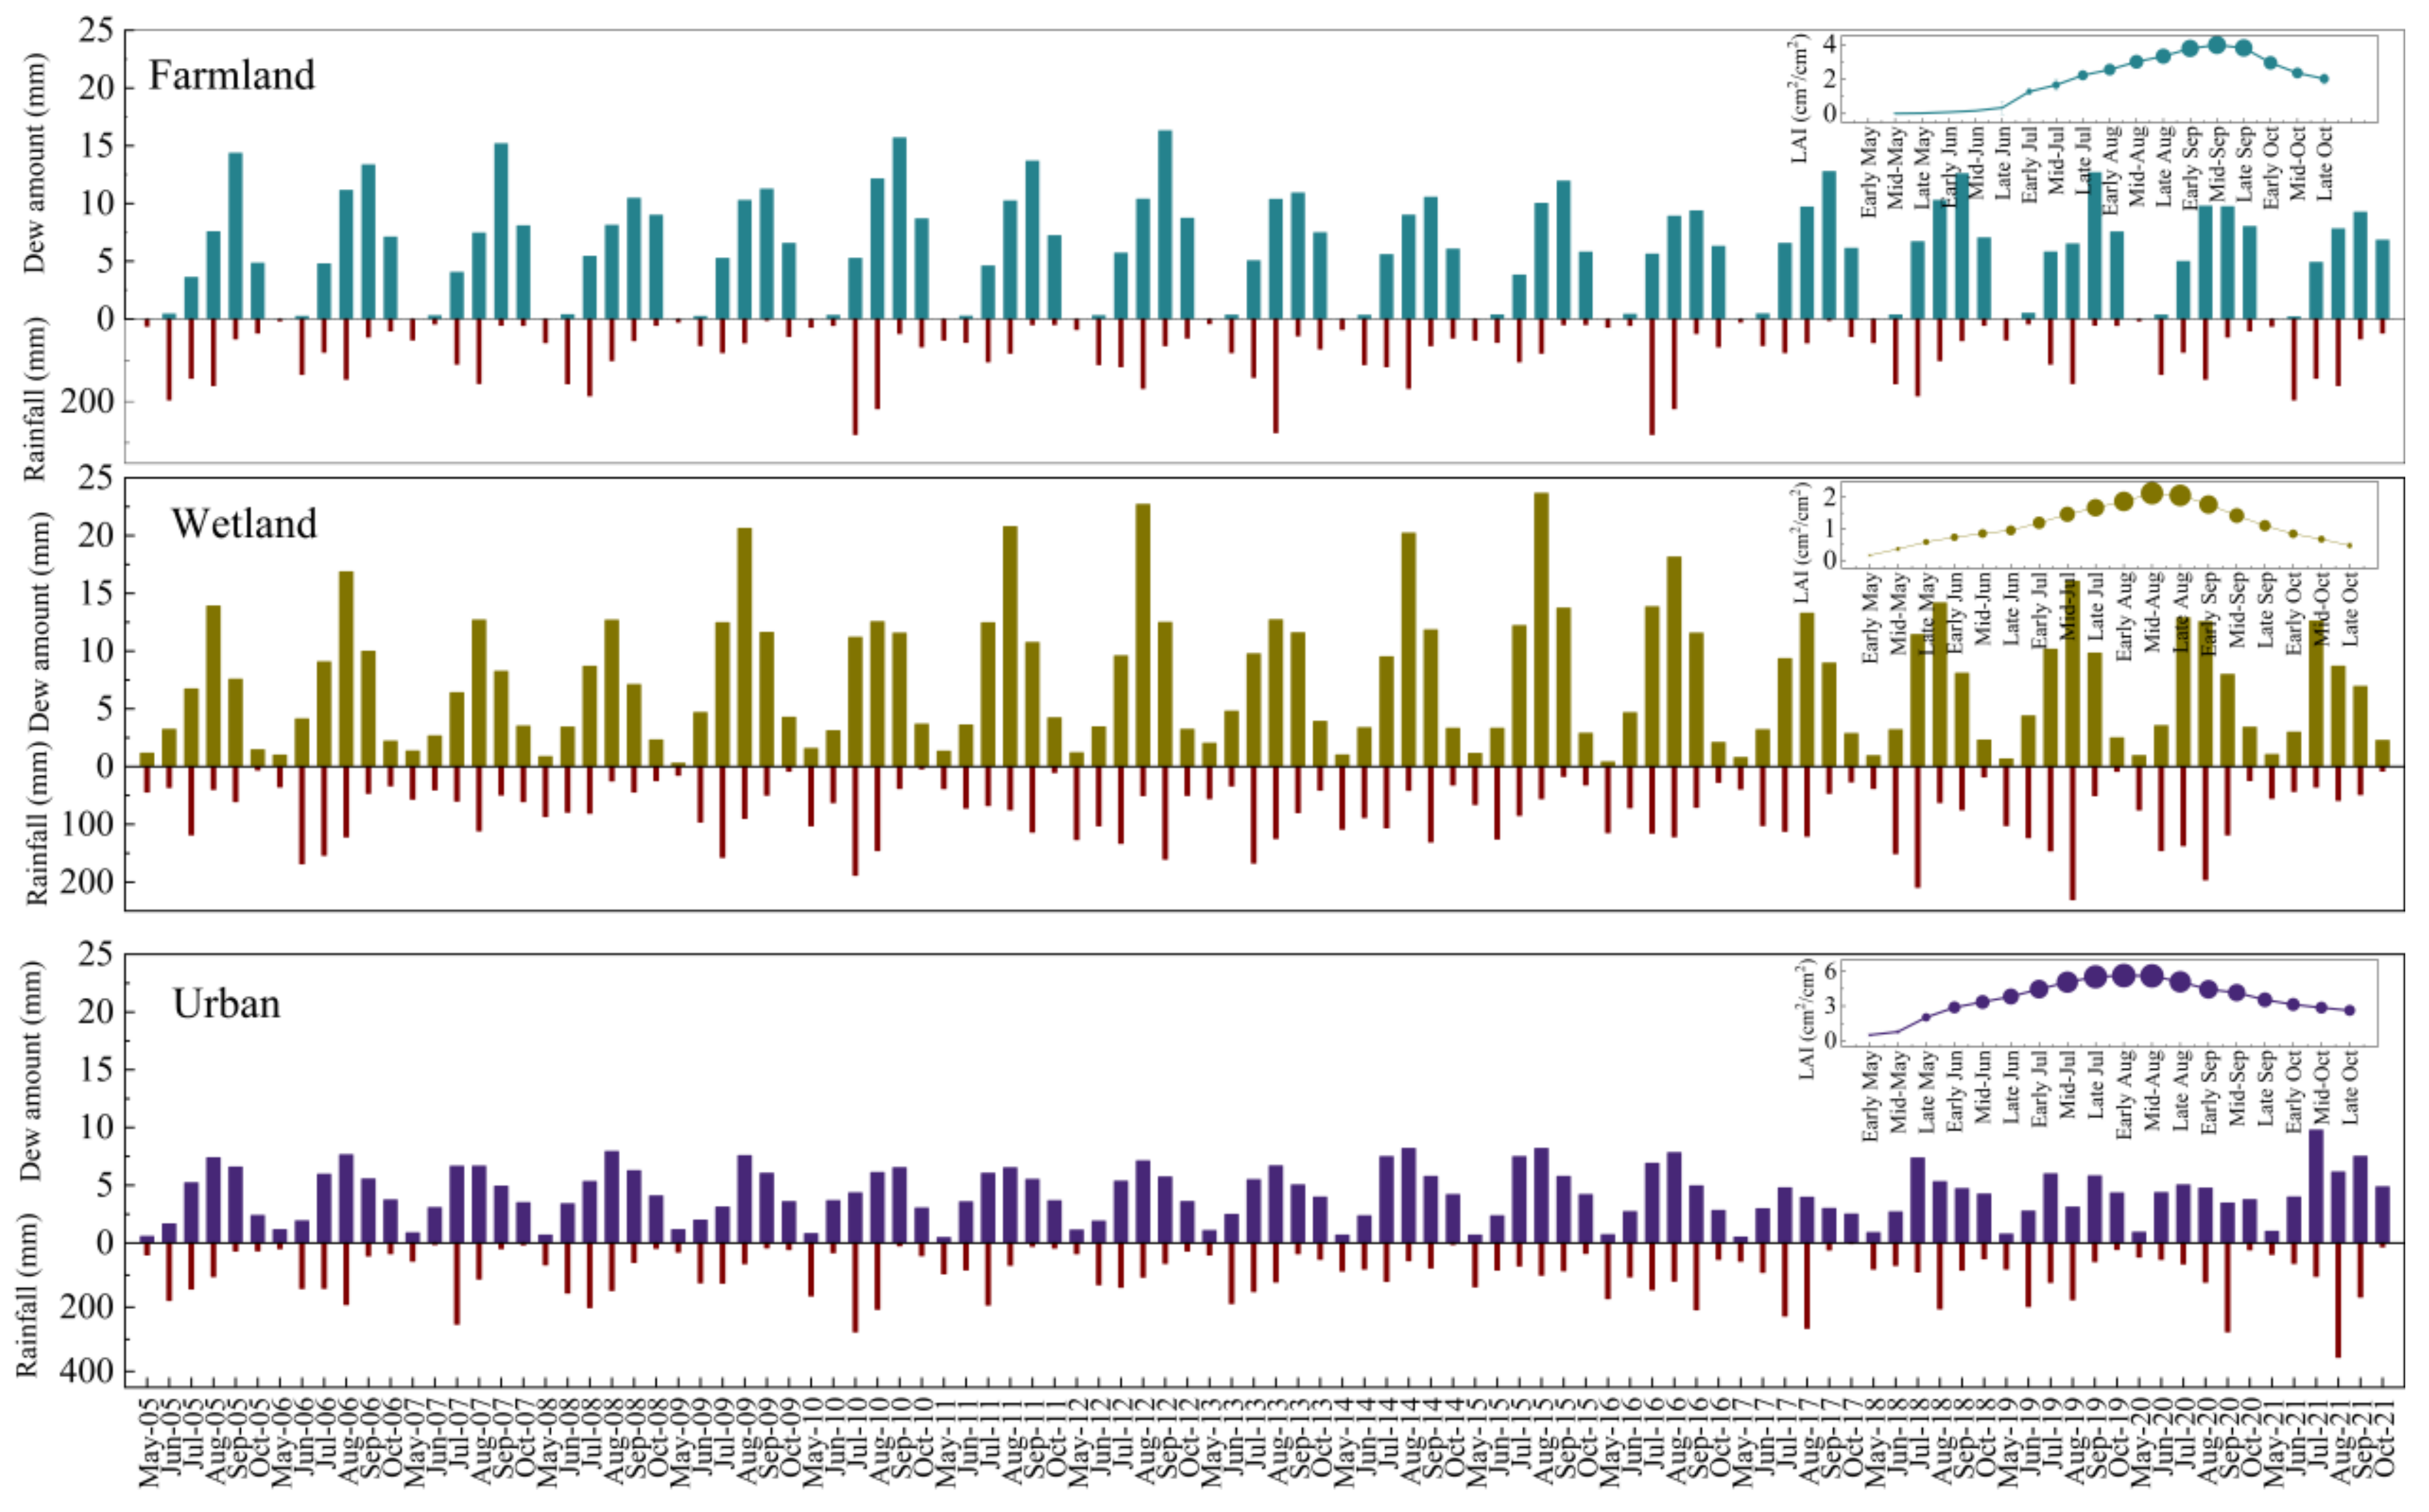
The annual dew amount ranged from 29.09 to 42.17 mm, with a mean of 34.46 ± 3.54 mm, in Lishu from 2005 to 2021. The annual dew amount in Fujin was higher than that in Lishu and ranged between 33.99 and 56.89 mm, with a mean of 44.09 ± 7.51 mm. Dew contributed 17.69 to 33.27 mm (mean of 25.32 ± 3.29 mm) to the annual water amount in Changchun. The annual dew amount in Lishu, Fujin and Changchun accounted for 7.92 ± 2.76%, 14.98 ± 5.93% and 6.71 ± 2.66% of the rainfall in the same period, respectively. Dew is an important water input and can not be ignored. The maximum monthly dew amount occurred in September in Lishu and in August in Fujin and Changchun (Figure 3). The dew amount is closely related to the daily dew intensity, and LAI is also an important factor affecting the dew amount (Equation (2)). Using Lishu as an example, the dew intensity was highest in August (0.080 ± 0.021 mm) (Table 2), while the LAI of maize reached a maximum in September (3.97 ± 0.19 cm2/cm2). In terms of values, the LAI was two orders of magnitude higher than the dew intensity. Therefore, the variation trend of the monthly dew amount was basically consistent with that of the LAI (Figure 3).
The annual dew amount was obviously affected by the climate type. The three monitoring sites were all located in subhumid areas, and the annual dew amount was greater than that in arid areas such as Kenya (18.9–25.3 mm) [36], the Gurban Tunggut Desert (12.21 mm) [37], the Badian Jaran Desert (16.1 mm) [9], and the Tengger Desert (15.3 mm) [10]. For the same ecosystem type, climate is also an important factor affecting the annual dew amount. Using farmland ecosystems as an example, the annual dew amount in our study was 34.46 ± 3.54 mm in Lishu, which was higher than those in the farmland located in the plateau monsoon transition zone in Gansu (25.9 mm) [21], the arid artificial oasis cropland in Zhangye (9.9 mm) [12], and the semiarid loess in Shaanxi (32.8 mm) [11].
3.3. Effect of Climate Change on Dew Amount
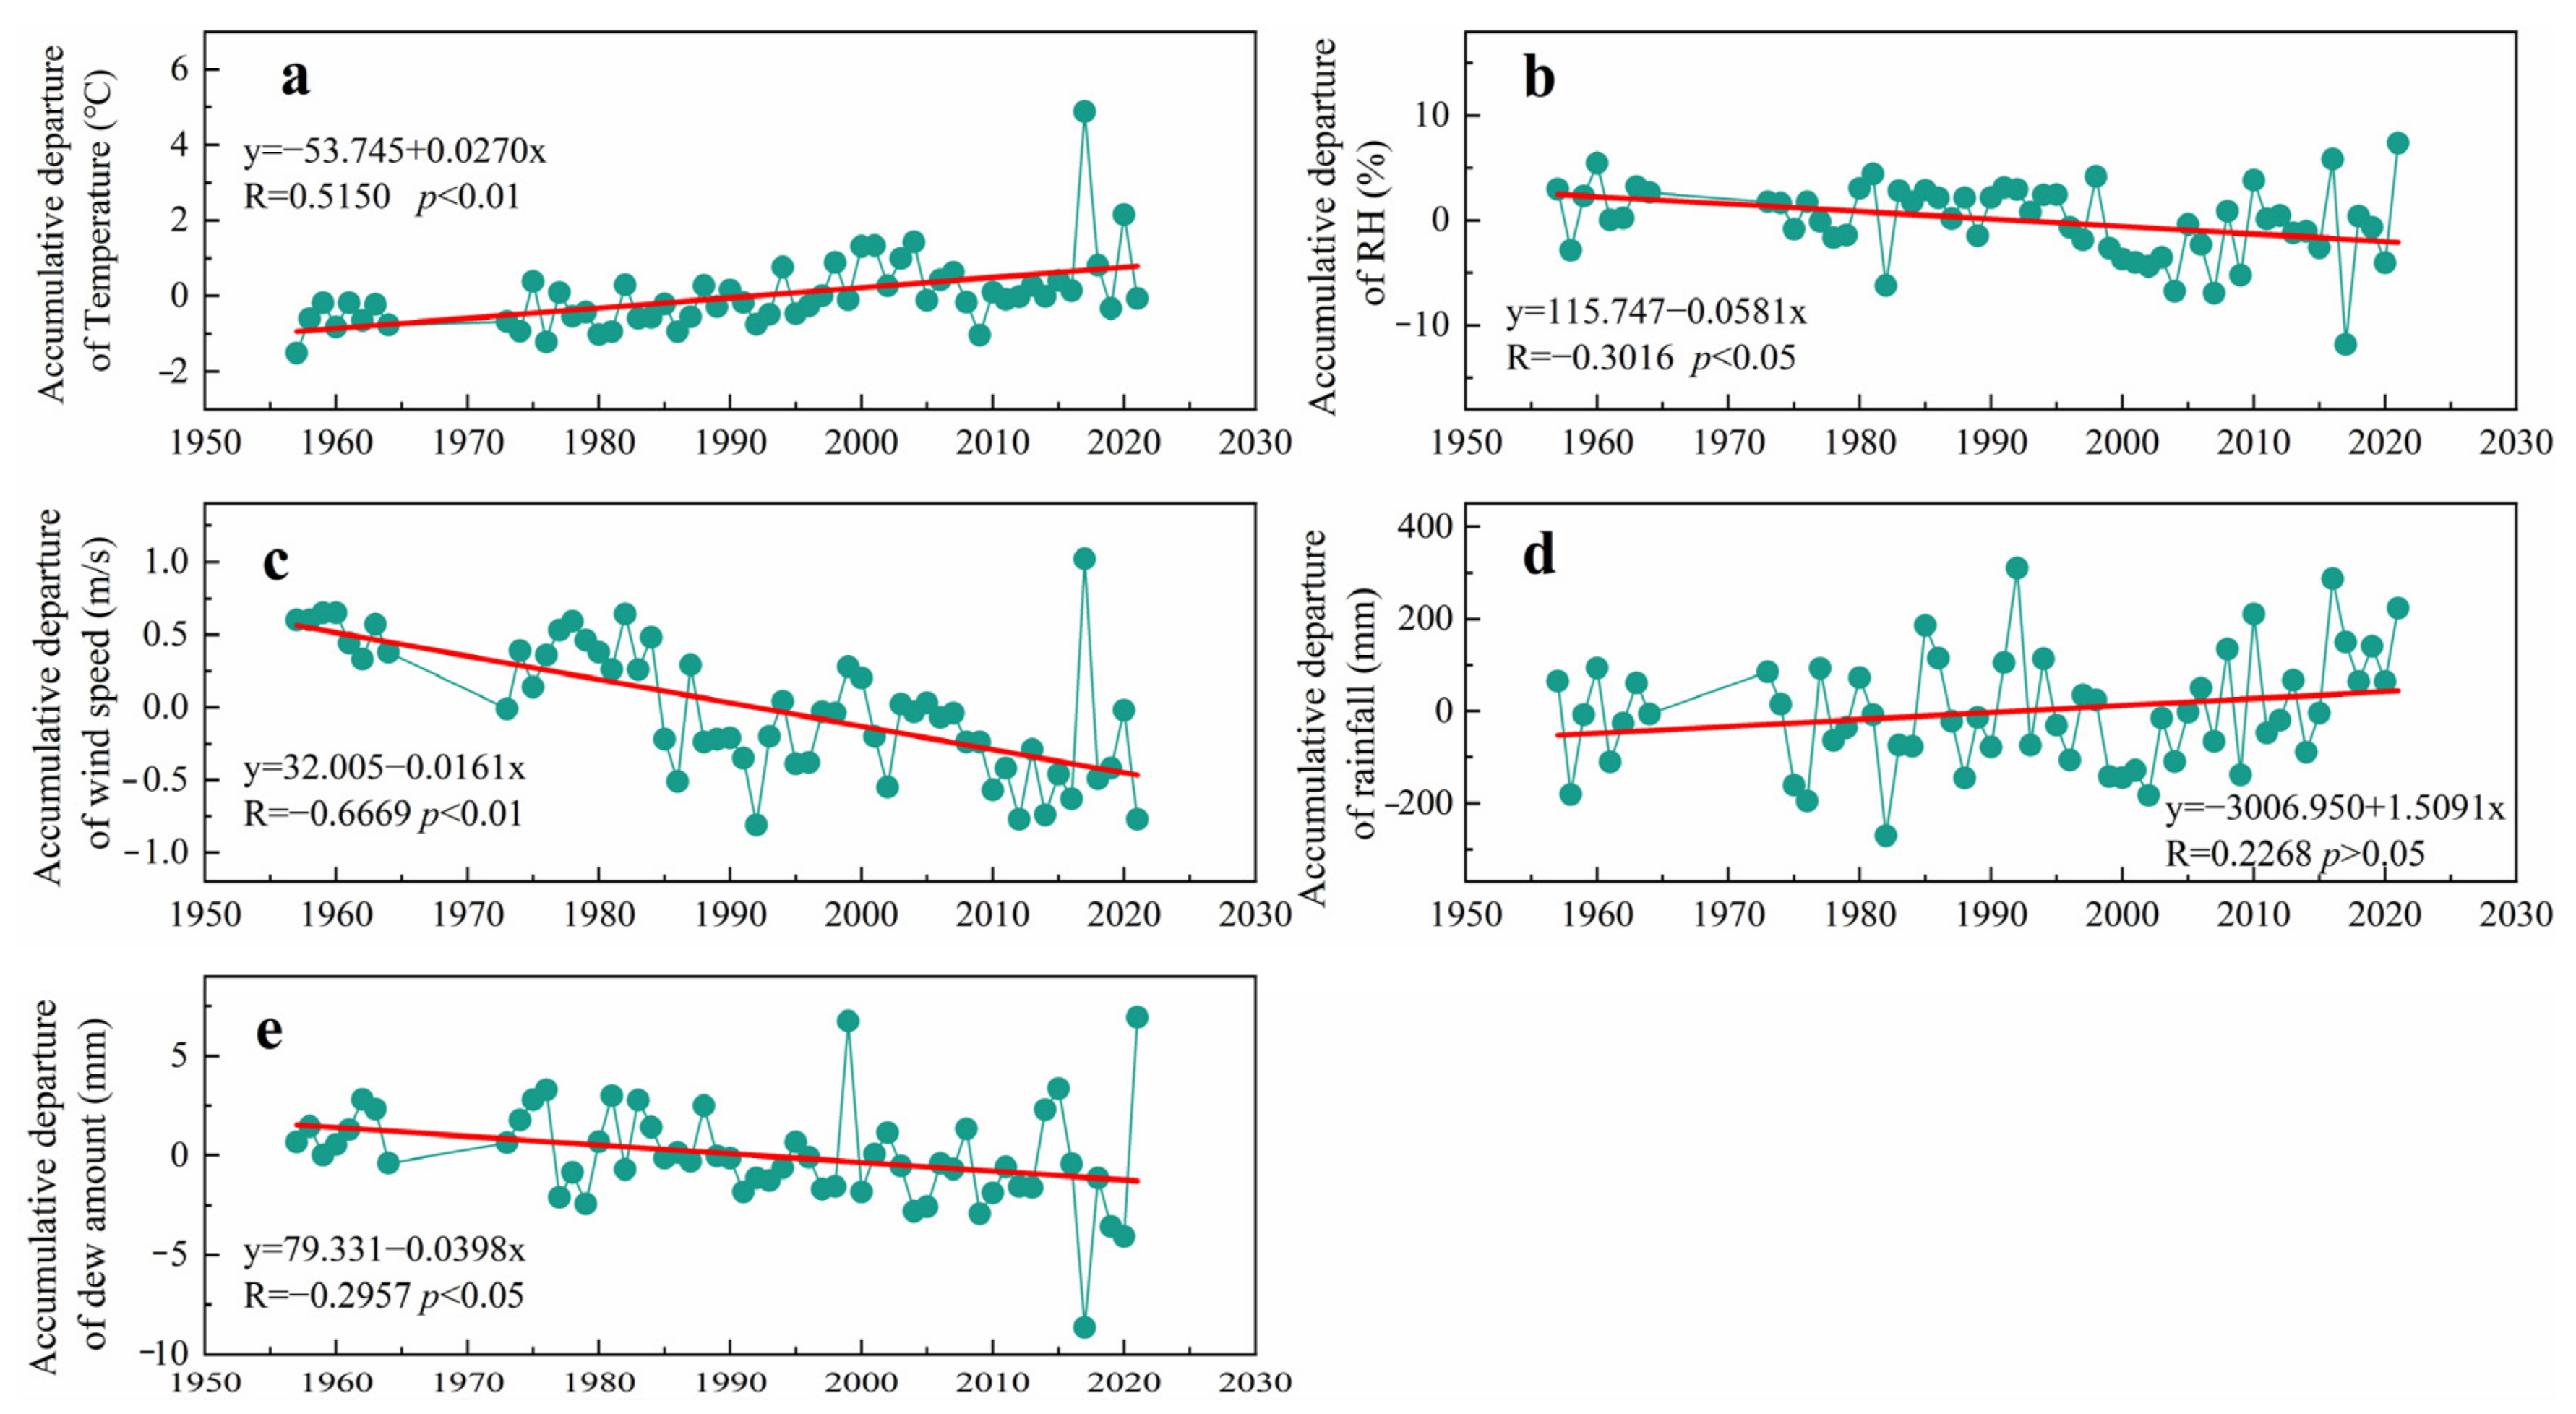
In this section, we use Changchun as an example. Human activities, especially urbanization and industrialization, have had an important impact on climate change. In the past 65 years, the meteorological factors during the dew condensation period in Changchun have changed significantly, and the area is mainly experiencing warming and drying climate change processes (Figure 4). Since the 1990s, with increased urban development, vegetation surfaces have been replaced by asphalt and other hardened underlying surfaces. Motor vehicles and industrial production in cities emit large amounts of greenhouse gases, which also play an important role in temperature increases [27,53]. Figure 4a shows that the average temperature during the dew condensation period in Changchun fluctuated but increased gradually at a rate of 0.27 °C/10a (p < 0.01). The nocturnal temperature rise in the growing season was lower than the average temperature rise of 0.35 °C/10a in Northeast China in the past 50 years [28,32]. The interannual variation trend of rainfall showed a nonsignificant but increasing trend overall, and the rainfall tendency rate was 15 mm/10a (p > 0.05) (Figure 4d). The period of 1995–2015 experienced less rainfall, and the 2016–2021 period experienced more concentrated rainfall. The increasing trend of rainfall was not significant, but the temperature gradually increased, leading to a decreasing trend of RH, with a rate of −0.58%/10a (p < 0.05) (Figure 4b), especially during 1999–2009. The average wind speed near the surface showed an overall downward trend, with a rate of −0.16 m/(s·10a) (p < 0.01) (Figure 4c). The nocturnal average wind speed showed a climatic jump from strong to weak around 1983, and the average wind speed significantly weakened after 1984. The change in wind speed in the study area was negatively correlated with the change in air temperature. The wind speed was stronger in the cold period than in the warm period.
To explore the effect of climate change on dew condensation, 1764 sets of dew intensity monitoring data from 2005 to 2019 were selected to build a stepwise multiple linear regression model (Formula (3)), and 242 sets of dew intensity monitoring data from 2020 and 2021 were used to verify the model. The process of model establishment and verification are shown in the Appendix A and Appendix B. Dew formation was largely dependent on nocturnal RH and V.
I = (6 + 0.429RH − 2V) × 10−3 (R2 = 0.928)
According to continuous observations from 2005 to 2021, the variation trend of the LAI in each growth stage of Syringa in Changchun was not significant. Assuming that the LAI of Syringa in Changchun from May to October remained unchanged, the change rate of the annual dew amount simulated by the model (Equation (3)) was −0.40 mm/10a (p < 0.05) (Figure 4e). With the decrease in nocturnal RH, the dew amount showed a downward trend, while dew condensation was negatively correlated with the V (Table 3). With climate change, the wind speed in Northeast China showed a downward trend, which made nighttime water vapor condensation easier. This trend was well reflected by the temporal variation series and the linear fitting line of the accumulative departure of the dew amount. Using 2017 as an example, the RH was the lowest (anomaly: −11.84%) and the wind speed was the highest (anomaly: 1.02 m/s) from 1957 to 2021. The annual dew amount in 2017 decreased significantly to only 17.69 mm (anomaly: −8.48 mm). This dew decline phenomenon was also reported in other areas due to climate change. During 1966–2005, the annual RH increased by 0.28–1.3%/10a, while the annual Td increased by 0.15–0.29 °C/10a in the coastal area of Iran, showing an obvious trend of warming and drying [54]. Atashi et al. found that the dew intensity during 2001–2014 was lower than the overall mean during the past 40 years as a result of climate change in Iran [20]. Tomaszkiewicz et al. forecasted trends under future climatic scenarios and showed a 27% decline in the dew amount during the critical summer months in 2080 in the Mediterranean region [55]. Compared with other parts of the world, climate change has a weak impact on the annual dew amount in Changchun. This is because the climate characteristics in Changchun are suitable for dew condensation. Although the warming and drying trend is obvious, the wind speed shows a declining trend, which is conducive to dew condensation.
4. Conclusions
The average number of dew days in Lishu, Fujin and Changchun were 122.9, 132.8 and 118.1, respectively, during the plant growth period (May–October) in Northeast China from 2005 to 2021. The highest daily dew intensity was in Fujin and ranged from 0.001 to 0.315 mm, with an average of 0.125 ± 0.069 mm. The average daily dew intensities in Lishu and Changchun were 0.061 ± 0.026 mm and 0.028 ± 0.009 mm, respectively. Dew most frequently condensed in September and October, and the daily dew intensity was highest in July and August. The average annual dew amounts on corn (Zea mays) (Lishu), Carex lasiocarpa (Fujin) and Syringa (Changchun) areas were 34.46 ± 3.54 mm, 44.09 ± 7.51 mm, and 25.32 ± 3.29 mm, respectively, and accounted for 7.92 ± 2.76%, 14.98 ± 5.93% and 6.71 ± 2.66% of the rainfall in the same period. Dew was an important input of water resources in the farmland, wetland and urban ecosystems. RH and V were the main factors influencing dew formation. In the past 64 years (1957–2021) in Northeast China, the trend rates of the average temperature, RH and V at 1 m from the surface during the dew condensation period were 0.27 °C/10a (p < 0.01), −0.58%/10a (p < 0.05), and −0.16 m/(s·10a) (p < 0.01), respectively. The overall trend was “warm and dry”, and the wind speed declined. With the decrease in the nocturnal RH in the study area, the dew amount showed a downward trend, while the dew intensity was negatively correlated with the wind speed. With climate change, the wind speed in Northeast China also showed a downward trend, which more easily condensed the water vapor at night. Considering the RH and wind speed, the change rate of the annual dew amount was −0.40 mm/10a (p < 0.05) in Changchun, and the decreasing trend was not obvious. Due to the lack of historical meteorological data in other regions, a model to evaluate the impact of climate change on dew in China cannot be constructed. Moreover, dew is easily absorbed by plants. The effect of dew on plant growth and its ecological significance in various ecosystems need further study.
Author Contributions
Conceptualization, Y.X.; methodology, Y.X.; validation, Y.X., C.J. and X.L.; formal analysis, C.J., Y.Z., X.Y., Y.D. and Y.Y.; data curation, Y.Z. and X.L.; writing—original draft preparation, Y.X.; writing—review and editing, Y.X.; visualization, C.J. and X.Y.; supervision, Y.X.; project administration, Y.X.; funding acquisition, Y.X. All authors have read and agreed to the published version of the manuscript.
Funding
This research was funded by National Nature Science Foundation of China, grant number 42175140.
Data Availability Statement
Data available on request due to restrictions, e.g., privacy. The data presented in this study are available from the corresponding author by request ([email protected]).
Conflicts of Interest
The authors declare no conflict of interest.
Appendix A. Model Establishment
As shown in Table A1, the number of meteorological factors included in Model 1 to Model 4 gradually increased, and the correlation coefficient (R) between dew intensity and meteorological factors increased from Model 1 to Model 4. The better the fit of the regression equation, the closer the coefficient of determination (R2) to 1. Model 1 contained only the RH variable, and the R2 was 0.850, which explained 85.0% of the dependent variable (dew intensity) value. Models 2 and 3 contained the variables of RH, V, and Td, which explained 92.8% of the dependent variable value. Model 4 contained variables of RH, V, Td and Ta, which explained 93.7% of the dependent variable changes. Therefore, Models 2, 3 and 4 showed a better prediction ability for dew intensity in urban areas.

Table A1.
Model Summary e.
| Model | R | R Square | Adjusted R Square | Std. Error of the Estimate |
|---|---|---|---|---|
| 1 | 0.922 a | 0.850 | 0.850 | 0.004 |
| 2 | 0.963 b | 0.928 | 0.928 | 0.002 |
| 3 | 0.963 c | 0.928 | 0.928 | 0.002 |
| 4 | 0.968 d | 0.937 | 0.937 | 0.002 |
Notes:. a Predictors: (Constant), RH. b Predictors: (Constant), RH, V. c Predictors: (Constant), RH, V, Td. d Predictors: (Constant), RH, V, Td, Ta. e Dependent Variable: dew intensity.
Table A2 shows the coefficients of each model in the process of regression calculation. The p values of each coefficient in Models 1–4 were all less than 0.01, which is statistically significant. However, in Model 4, the tolerance of RH, Td, and Ta was 0.060, 0.021 and 0.037, respectively. These values were close to 0. Meanwhile, the variance inflation factor (VIF) values of RH, Td, and Ta were 16.686, 47.349 and 27.089, respectively. These values were considered high. This shows the possibility of collinearity between the factors. Compared with Models 2 and 3, Model 2 had fewer variables and a lower possibility of collinearity. In conclusion, Model 2 was chosen, and the best equation to predict the dew intensity in urban areas is as Equation (3).
Table A2.
Coefficients a.
| Model | Unstandardized Coefficients | Standardized Coefficients | t | Sig. | Collinearity Statistics | |||
|---|---|---|---|---|---|---|---|---|
| B | Std. Error | Beta | Tolerance | VIF | ||||
| 1 | (Constant) | −0.003 | 0.000 | −9.334 | 0.000 | |||
| RH | 4.943 × 10⁻⁴ | 0.000 | 0.922 | 99.782 | 0.000 | 1.000 | 1.000 | |
| 2 | (Constant) | 0.006 | 0.000 | 20.541 | 0.000 | |||
| RH | 4.294 × 10⁻⁴ | 0.000 | 0.801 | 114.888 | 0.000 | 0.842 | 1.187 | |
| V | −0.002 | 0.000 | −0.305 | −43.739 | 0.000 | 0.842 | 1.187 | |
| 3 | (Constant) | 0.007 | 0.000 | 19.132 | 0.000 | |||
| RH | 4.226 × 10⁻⁴ | 0.000 | 0.788 | 83.202 | 0.000 | 0.455 | 2.195 | |
| V | −0.002 | 0.000 | −0.308 | −43.181 | 0.000 | 0.804 | 1.244 | |
| Td | 1.843 × 10⁻⁴ | 0.000 | 0.017 | 1.988 | 0.002 | 0.533 | 1.875 | |
| 4 | (Constant) | 0.023 | 0.001 | 20.854 | 0.000 | |||
| RH | 2.311 × 10⁻⁴ | 0.000 | 0.431 | 17.613 | 0.000 | 0.060 | 16.686 | |
| V | −0.002 | 0.000 | −0.295 | −43.898 | 0.000 | 0.792 | 1.262 | |
| Td | 0.001 | 0.000 | 0.650 | 15.769 | 0.000 | 0.021 | 47.349 | |
| T | −6.352 × 10⁻⁴ | 0.000 | −0.488 | −15.660 | 0.000 | 0.037 | 27.089 | |
Note: a Dependent variable: dew intensity.
Appendix B. Model Verification
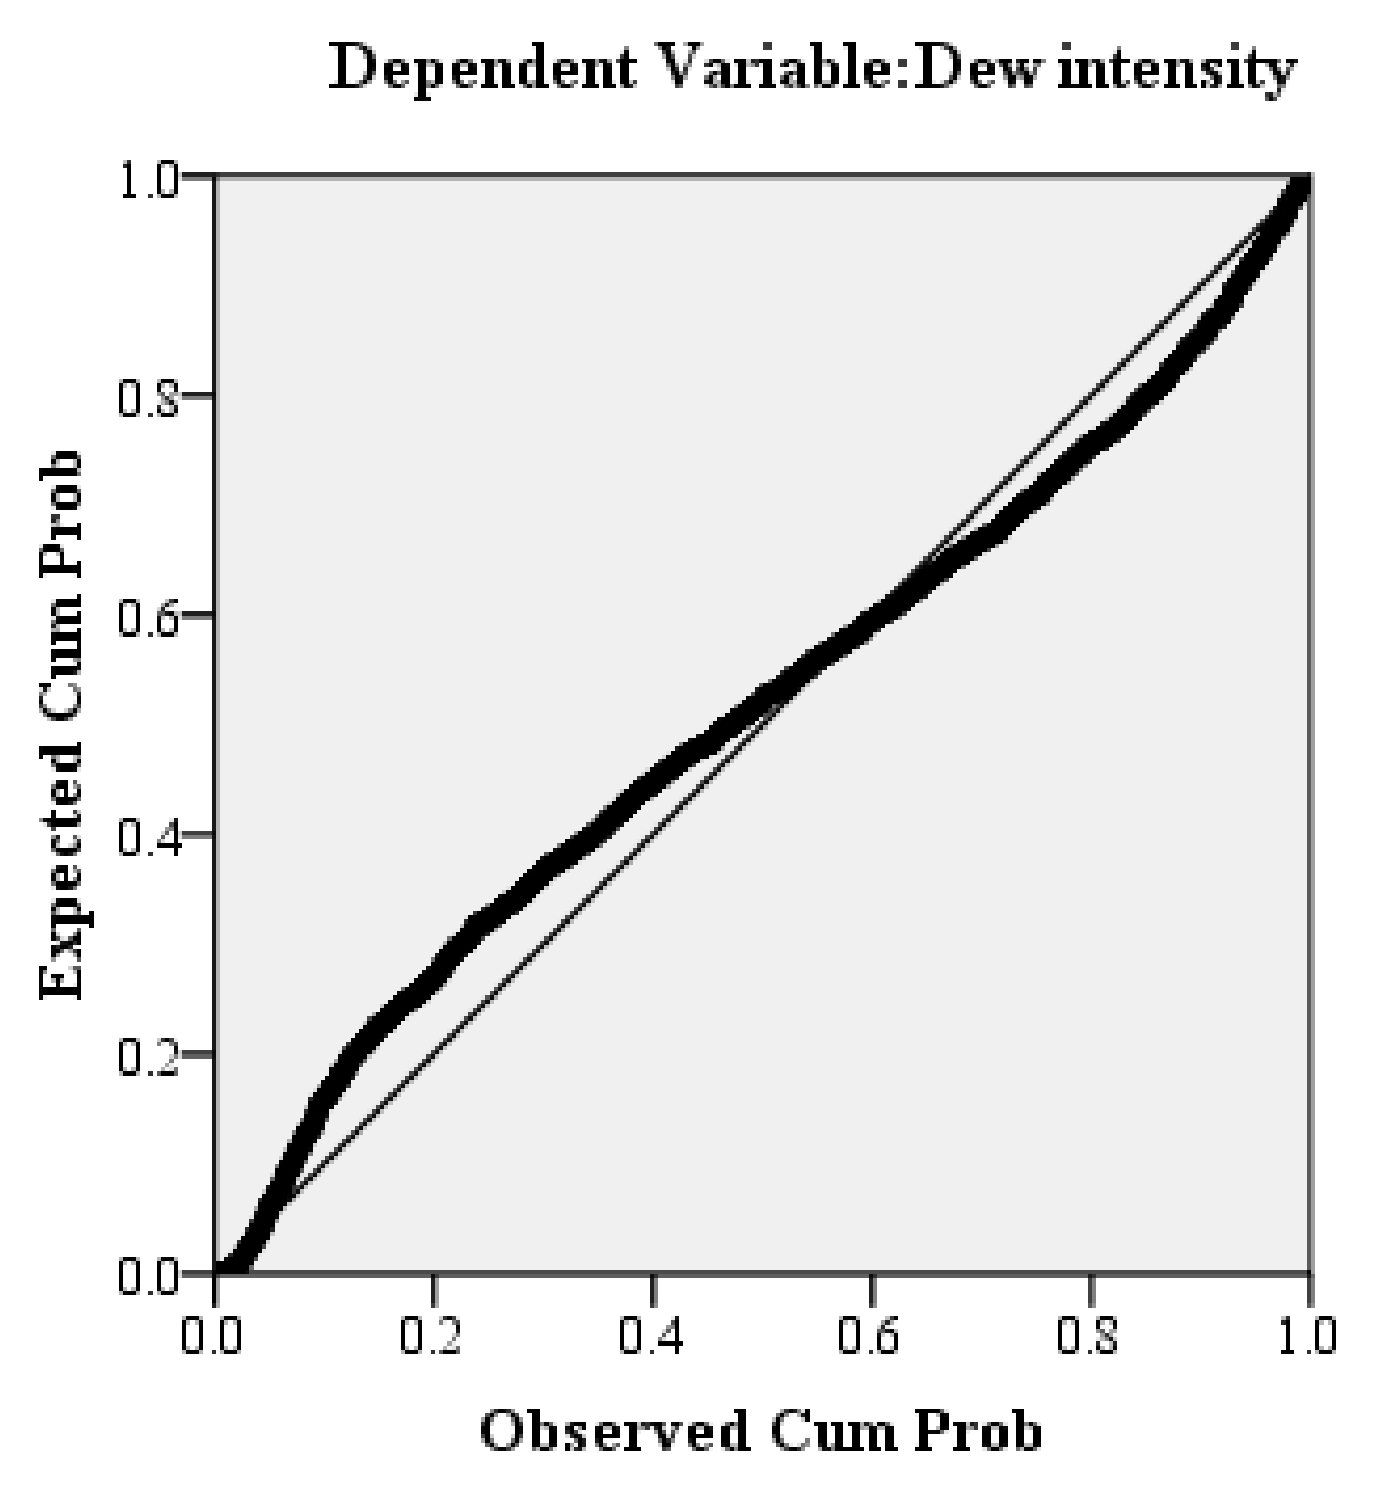
Appendix B.1. P–P Plots
The most intuitive and simplest way to verify a model is to normalize the P–P plots of the regression standardized residual (P–P plots), which is used to determine whether the distribution of a variable is consistent with a specified distribution. In assessing how the residual (curve) of the observed data is distributed around an assumed line (normal distribution), if the two distributions are essentially the same, the points in the P–P plots should be plotted on a 45° line. As shown in Figure A1, the points in the P–P plots basically surrounded both sides of the diagonal, indicating that the residual error of the simulated data of this model was normally distributed.
Figure A1.
Normal P–P plots of the regression standardized residual.

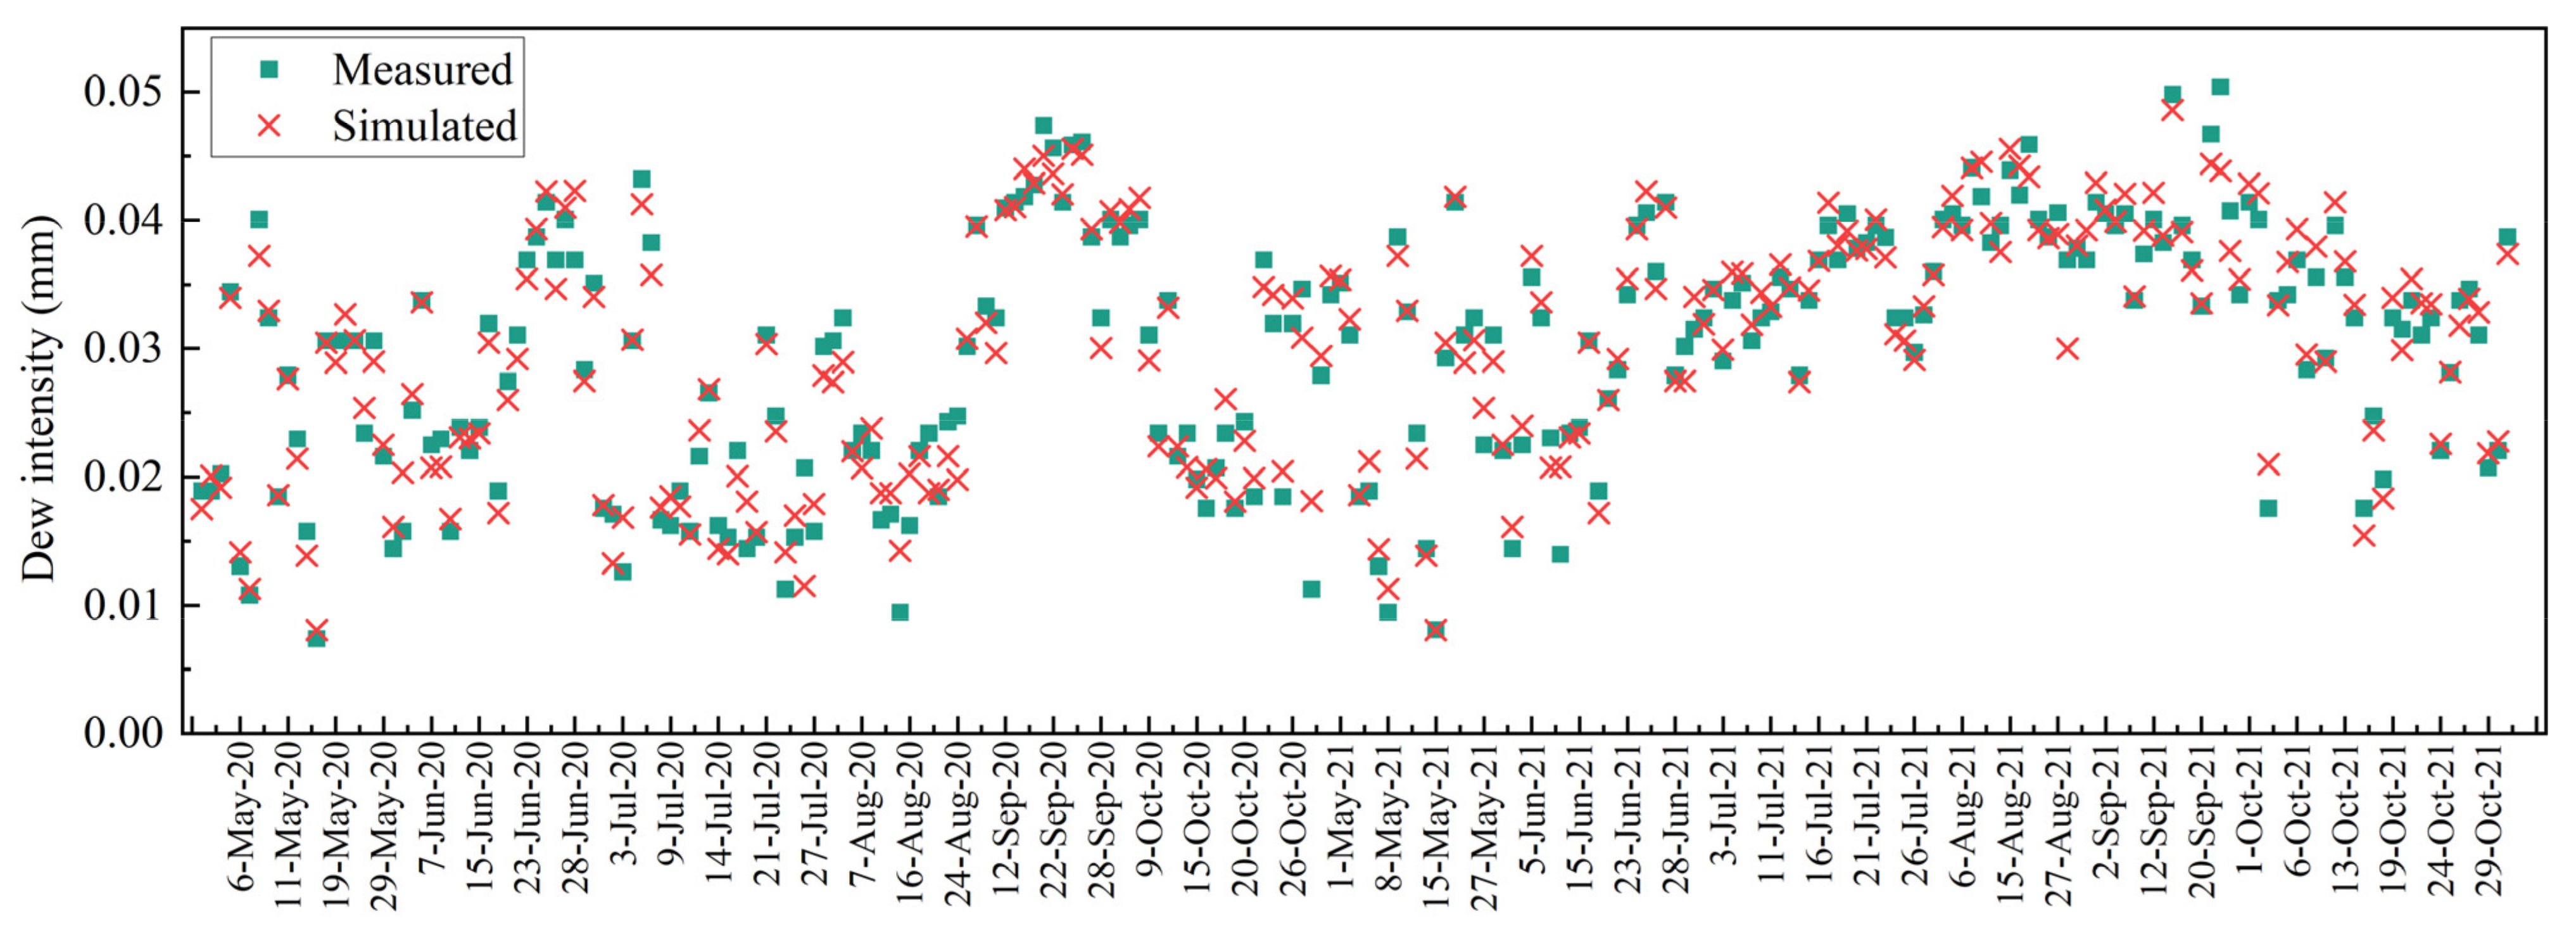
Appendix B.2. Simulated and Measured Values
A total of 242 sets of data from 2020 and 2021 were used to verify the relationship between the simulated values and measured values. The simulated and measured values of the daily dew intensity are shown in Figure A2. The values of the simulated and measured values were basically consistent. To further verify the relationship between the simulated and measured values of the model, an independent-samples test was conducted (Table A3). There was no significant difference between the mean values of the two groups (n = 242, p > 0.05), indicating that the simulated values and the measured values came from the same sample population. It can be concluded that the model can well express the relationship between the meteorological factors and dew intensity.
Figure A2.
Relationship between measured and simulated dew intensity in 2020 and 2021.

Table A3.
Independent-Samples Test.
| Levene’s Test for Equality of Variances | t-Test for Equality of Means | ||||||||
|---|---|---|---|---|---|---|---|---|---|
| F | Sig. | t | df | Sig. (2 Tailed) | Mean Difference | Std. Error Difference | 95% Confidence Interval of the Difference | ||
| Lower | Upper | ||||||||
| Equal variances assumed | 0.140 | 0.708 | 0.464 | 482 | 0.643 | 0.0001 | 0.001 | −0.001 | 0.002 |
| Equal variances not assumed | 0.464 | 481.534 | 0.643 | 0.0001 | 0.001 | −0.001 | 0.002 | ||
References
- Holanda, A.E.R.; Souza, B.C.; Carvalho, E.C.D.; Oliveira, R.S.; Soares, A.A. How do leaf wetting events affect gas exchange and leaf lifespan of plants from seasonally dry tropical vegetation? Plant Biol. 2019, 21, 1097–1109. [Google Scholar] [CrossRef]
- Cynthia, G.S.; Koohafkan, M.C.; Michaella, C.; Rockwell, F.E.; Sally, T.; Caylor, K.K. Dew deposition suppresses transpiration and carbon uptake in leaves. Agric. Forest Meteorol. 2018, 259, 305–316. [Google Scholar] [CrossRef]
- Piao, H.C.; Li, S.L.; Yan, Z.F.; Li, C. Understanding nutrient allocation based on leaf nitrogen isotopes and elemental ratios in the karst region of Southwest China. Agric. Ecosyst. Environ. 2020, 294, 106864. [Google Scholar] [CrossRef]
- Eduardo, C.S.; Jose, L.A.; Gerhard, Z.; Casandra, R.G. Dew can prolong photosynthesis and water status during drought in some epiphytic bromeliads from a seasonally dry tropical forest. Trop. Conserv. Sci. 2019, 12, 479–488. [Google Scholar] [CrossRef]
- Waseem, M.; Nie, Z.F.; Yao, G.Q.; Hasan, M.M.; Xiang, Y.; Fang, X.W. Dew absorption by leaf trichomes in Caragana korshinskii: An alternative water acquisition strategy for withstanding drought in arid environments. Physiol. Plant. 2021, 172, 528–539. [Google Scholar] [CrossRef]
- Zhang, W.G.; Meng, J.Y.; Liu, B.; Zhang, S.C.; Zhang, J.; Jiang, M.; Lv, X.G. Sources of monsoon precipitation and dew assessed in a semiarid area via stable isotopes. Hydrol. Process. 2017, 31, 1990–1999. [Google Scholar] [CrossRef]
- Masrahi, Y.S. Glochids microstructure and dew harvesting ability in Opuntia stricta (Cactacerae). J. King Saud Univ. Sci. 2020, 32, 3307–3312. [Google Scholar] [CrossRef]
- Yasutake, D.; Yokoyama, G.; Maruo, K.; Wu, Y.R.; Wang, W.Z.; Mori, M.; Kitano, M. Analysis of leaf wetting effects on gas exchanges of corn using a whole-plant chamber system. Plant Soil Environ. 2018, 64, 233–239. [Google Scholar] [CrossRef] [Green Version]
- Zhuang, Y.L.; Zhao, W.Z. Dew formation and its variation in Haloxylon ammodendron plantations at the edge of a desert oasis, northwestern China. Agric. Forest Meteorol. 2017, 247, 541–550. [Google Scholar] [CrossRef]
- Pan, Y.X.; Wang, X.P.; Zhang, Y.F.; Hu, R. Dew formation characteristics at annual and daily scale in xerophyte shrub plantations at Southeast margin of Tengger desert, Northern China. Ecohydrology 2018, 11, e1968. [Google Scholar] [CrossRef]
- Jia, Z.F.; Wang, Z.; Wang, H. Characteristics of dew formation in the semi-arid loess plateau of central Shaanxi Province, China. Water 2019, 11, 126. [Google Scholar] [CrossRef] [Green Version]
- Meng, Y.; Wen, X.F. Characteristics of dew events in an arid artificial oasis cropland and a sub-humid cropland in China. J. Arid Land. 2016, 8, 399–408. [Google Scholar] [CrossRef] [Green Version]
- Aguirre-Gutiérrez, C.A.; Holwerda, F.; Goldsmith, G.R.; Delgado, J.; Yepez, E.; Carbajal, N.; Escoto-Rodríguez, M.; Arredondo, J.T. The importance of dew in the water balance of a continental semiarid grassland. J. Arid Environ. 2019, 168, 26–35. [Google Scholar] [CrossRef]
- Muselli, M.; Beysens, D.; Mileta, M.; Milimouk, I. Dew and rain water collection in the Dalmatian coast, Croatia. Atmos. Res. 2009, 92, 455–463. [Google Scholar] [CrossRef]
- Beysens, D.; Mongruel, A.; Acker, K. Urban dew and rain in Paris, France: Occurrence and physico-chemical characteristic. Atmos. Res. 2017, 189, 152–161. [Google Scholar] [CrossRef] [Green Version]
- Sizirici, B. Dew, fog and rain collector in a hyper-arid climate: Case study in Abu Dhabi. E3S Web Conf. 2019, 122, 01006. [Google Scholar] [CrossRef]
- Lekouch, I.; Lekouch, K.; Muselli, M.; Mongruel, A.; Kabbachi, B.; Beysens, D. Rooftop dew, fog and rain collection in southwest Morocco and predictive dew modeling using neural networks. J. Hydrol. 2012, 448–449, 60–72. [Google Scholar] [CrossRef]
- Hao, X.M.; Li, C.; Guo, B.; Ma, J.X.; Ayup, M.; Chen, Z.S. Dew formation and its long-term trend in a desert riparian forest ecosystem on the eastern edge of the Taklimakan Desert in China. J. Hydrol. 2012, 472–473, 90–98. [Google Scholar] [CrossRef]
- Tuure, J.; Korpela, A.; Hautala, M.; Rautkoski, H.; Hakojärvi, M.; Mikkola, H.; Duplissy, J.; Pellikka, P.; Petäjä, T.; Kulmala, M.; et al. Comparing plastic foils for dew collection: Preparatory laboratory-scale method and field experiment in Kenya. Biosyst. Eng. 2020, 196, 145–158. [Google Scholar] [CrossRef]
- Atashi, N.; Rahimi, D.; Goortani, B.M.; Duplissy, J.; Vuollekoski, H.; Kulmala, M.; Vesala, T.; Hussein, T. Spatial and temporal investigation of dew potential based on long-term model simulations in Iran. Water 2019, 11, 2463. [Google Scholar] [CrossRef] [Green Version]
- Zhang, Q.; Wang, S.; Yue, P.; Wang, S.S. Variation characteristics of non-rainfall water and its contribution to crop water requirements in China’s summer monsoon transition zone. J. Hydrol. 2019, 578, 124039. [Google Scholar] [CrossRef]
- Liu, X.Y.; Xu, J.Z.; Yang, S.H. Vapor condensation in rice fields and its contribution to crop evapotranspiration in the subtropical monsoon climate of China. J. Hydrometeorol. 2018, 19, 1043–1057. [Google Scholar] [CrossRef]
- Zhang, J.; Zhang, Y.M.; Alison, D.; Cheng, J.H.; Zhou, X.B.; Zhang, B.C. The influence of biological soil crusts on dew deposition in Gurbantunggut Desert, Northwestern China. J. Hydrol. 2009, 379, 220–228. [Google Scholar] [CrossRef]
- Ye, Y.H.; Zhou, K.; Song, L.Y.; Jin, J.H.; Peng, S.L. Dew amounts and its correlations with meteorological factors in urban landscapes of Guangzhou, China. Atmos. Res. 2007, 86, 21–29. [Google Scholar] [CrossRef]
- Xu, Y.Y.; Yan, B.X.; Luan, Z.Q.; Zhu, H. Dewfall variation by large-scale reclamation in Sanjiang Plain. Wetlands 2012, 32, 783–790. [Google Scholar] [CrossRef]
- Hanisch, S.; Lohrey, C.; Buerkert, A. Dewfall and its ecological significance in semi-arid coastal south-western Madagascar. J. Arid Environ. 2015, 121, 24–31. [Google Scholar] [CrossRef]
- Ramanathan, V.; Crutzen, P.J.; Kiehl, J.T.; Rosenfeld, D. Aerosols, climate, and the hydrological cycle. Science 2001, 294, 2119–2124. [Google Scholar] [CrossRef] [Green Version]
- Zhao, C.Y.; Wang, Y.; Zhou, X.Y.; Cui, Y.; Liu, Y.L.; Shi, D.M.; Yu, H.M.; Liu, Y.Y. Changes in climatic factors and extreme climate events in Northeast China during 1961–2010. Adv. Clim. Chang. Res. 2013, 4, 11. [Google Scholar] [CrossRef]
- Liang, L.Q.; Li, L.J.; Liu, Q. Precipitation variability in Northeast China from 1961 to 2008. J. Hydrol. 2011, 404, 67–76. [Google Scholar] [CrossRef]
- Zuo, H.C.; Li, D.L.; Hu, Y.Q.; Bao, Y.; Lv, S.H. Characteristics of climatic trends and correlation between pan-evaporation and environmental factors in the last 40 years over China. Chin. Sci. Bull. 2005, 50, 1235–1241. [Google Scholar] [CrossRef]
- Shi, P.J.; Sun, S.; Wang, M.; Li, N.; Wang, J.A.; Jin, Y.Y.; Gu, X.T.; Yin, W.X. Climate change regionalization in China (1961–2010). Sci. China Earth Sci. 2014, 57, 2676–2689. [Google Scholar] [CrossRef]
- Chu, Z.; Guo, J.P.; Zhao, J.F. Impacts of future climate change on agroclimatic resources in Northeast China. J. Geogr. Sci. 2017, 27, 1044–1058. [Google Scholar] [CrossRef]
- Atashi, N.; Tuure, J.; Alakukku, L.; Rahimi, D.; Pellikka, P.; Zaidan, M.A.; Vuollekoski, H.; Räsänen, M.; Kulmala, M.; Vesala, T.; et al. An attempt to utilize a regional dew formation model in Kenya. Water 2021, 13, 1261. [Google Scholar] [CrossRef]
- Guo, X.N.; Zha, T.S.; Jia, X.; Wu, B.; Feng, W.; Xie, J.; Gong, J.N.; Zhang, Y.Q.; Peltola, H. Dynamics of dew in a cold desert-shrub ecosystem and its abiotic controls. Atmosphere 2016, 7, 32. [Google Scholar] [CrossRef] [Green Version]
- Yu, R.H.; Zhang, Z.Z.; Lu, X.X.; Chang, I.-S.; Liu, T.X. Variations in dew moisture regimes in desert ecosystems and their influencing factor. WIREs Water 2020, 7, e1482. [Google Scholar] [CrossRef]
- Tuure, J.; Korpela, A.; Hautala, M.; Hakojärvi, M.; Mikkola, H.; Räsänen, M.; Duplissy, J.; Pellikka, P.; Petäjä, T.; Kulmala, M.; et al. Comparison of surface foil materials and dew collectors location in an arid area: A one year field experiment in Kenya. Agric. Forest Meteorol. 2019, 276, 107613. [Google Scholar] [CrossRef]
- Beysens, D.; Muselli, M.; Nikolayev, V.; Narhe, R.; Milimouk, I. Measurement and modelling of dew in island, coastal and alpine areas. Atmos. Res. 2005, 73, 1–22. [Google Scholar] [CrossRef] [Green Version]
- Jia, Z.F.; Zhao, Z.Q.; Zhang, Q.Y.; Wu, W.C. Dew yield and its influencing factors at the western edge of Gurbantunggut Desert, China. Water 2019, 11, 733. [Google Scholar] [CrossRef] [Green Version]
- Xiao, H.J.; Meissner, R.; Seeger, J.; Rupp, H.; Borg, H.; Zhang, Y.Q. Analysis of the effect of meteorological factors on dewfall. Sci. Total Environ. 2013, 452, 384–393. [Google Scholar] [CrossRef]
- Akinbode, O.M.; Eludoyin, A.O.; Fashae, O.A. Temperature and relative humidity distributions in a medium-size administrative town in southwest Nigeria. J. Environ. Manag. 2008, 87, 95–105. [Google Scholar] [CrossRef]
- Richards, K. Urban and rural dewfall, surface moisture, and associated canopy-level air temperature and humidity measurements for Vancouver, Canada. Bound-Lay. Meteorol. 2005, 114, 143–163. [Google Scholar] [CrossRef]
- Kurzyca, I.; Frankowski, M. Scavenging of nitrogen from the atmosphere by atmospheric (rain, snow) and occult (dew, frost) precipitation. Comparison of urban and nonurban deposition profiles. J. Geophys. Res. Biogeosci. 2019, 124, 2288–2304. [Google Scholar] [CrossRef]
- Lekouch, I.; Muselli, M.; Kabbachi, B.; Ouazzani, J.; Melnytchouk-Milimouk, I.; Beysens, D. Dew, fog, and rain as supplementary sources of water in south-western Morocco. Energy 2011, 36, 2257–2265. [Google Scholar] [CrossRef] [Green Version]
- Gałek, G.; Sobik, M.; Błaśa, M.; Polkowska, Ż.; Cichała-Kamrowska, K. Dew formation and chemistry near a motorway in Poland. Pure Appl. Geophys. 2011, 169, 1053–1066. [Google Scholar] [CrossRef] [Green Version]
- Wang, X.; Gao, Z.Y.; Wang, Y.K.; Wang, Z.; Jin, S.S. Dew measurement and estimation of rain-fed jujube (Zizyphys jujube Mill) in a semi-arid loess hilly region of China. J. Arid Land 2017, 9, 547–557. [Google Scholar] [CrossRef] [Green Version]
- Kuang, Y.; Xu, W.Y.; Lin, W.L.; Meng, Z.Y.; Zhao, H.R.; Ren, S.X.; Zhang, G.; Liang, L.L.; Xu, X.B. Explosive morning growth phenomena of NH3 on the North China Plain: Cause and potential impacts on aerosol formation. Environ. Pollut. 2019, 257, 113621. [Google Scholar] [CrossRef]
- Muselli, M.; Clus, O.; Ortege, P.; Milimouk, I.; Beysens, D. Physical, chemecal and biological characteristics of dew and rainwater during the dry season of tropical island. Atmosphere 2021, 12, 69. [Google Scholar] [CrossRef]
- Lekouch, I.; Mileta, M.; Muselli, M.; Milimouk-Melnytchouk, I.; Sojat, V.; Kabbachi, B.; Beysens, D. Comparative chemical analysis of dew and rain water. Atmos. Res. 2010, 95, 224–234. [Google Scholar] [CrossRef]
- Sun, Y.L.; Li, X.Y.; Xu, H.Y.; Yang, Z.P.; Tang, J.; Zhang, X.Y. Effect of soil crust on evaporation and dew deposition in Mu Us sandy land, China. Front. Environ. Sci. Eng. China 2008, 2, 480–486. [Google Scholar] [CrossRef]
- Rao, B.Q.; Liu, Y.D.; Wang, W.B.; Hu, C.X.; Li, D.H.; Lan, S.B. Influence of dew on biomass and photosystem II activity of cyanobacterial crusts in the Hopq Desert, northwest China. Soil Biol. Biochem. 2009, 41, 2387–2393. [Google Scholar] [CrossRef]
- Li, X.Y. Effects of gravel and sand mulches on dew deposition in the semiarid region of China. J. Arid Environ. 2002, 260, 151–160. [Google Scholar] [CrossRef]
- Uclés, O.; Villagarcía, L.; Canton, Y.; Lazaro, R.; Domingo, F. Non-rainfall water inputs are controlled by aspect in a semiarid ecosystem. J. Arid Environ. 2015, 113, 43–50. [Google Scholar] [CrossRef]
- Roderick, M.L.; Farquhar, G.D. The cause of decreased pan evaporation over the past 50 years. Science 2002, 298, 1410–1411. [Google Scholar] [CrossRef] [PubMed]
- Talaee, P.H.; Sabziparvar, A.A.; Tabari, H. Observed changes in relative humidity and dew point temperature in coastal regions of Iran. Theor. Appl. Climatol. 2012, 110, 385–393. [Google Scholar] [CrossRef]
- Tomaskiewicz, M.; Najm, A.M.; Beysens, D.; Alameddine, I.; Zeid, E.B.; Fadel, E.M. Projected climate change impacts upon dew yield in the Mediterranean basin. Sci. Total Environ. 2016, 566, 1339–1348. [Google Scholar] [CrossRef]
Figure 1.
Distribution of sampling plots in Northeast China.

Figure 2.
Daily dew intensity (mm) at other reported sites. 1. [42] (Poznan, Poland); 2. [43] (Mirleft, Morocco); 3. [15] (Paris, France); 4. [41] (Vancouver, Canada); 5. [24] (Guangzhou, China); 6. [42] (Wielkopolski National Park, Poland); 7. [44] (Wrocław, Poland); 8. [11] (Gaoling, China); 9. [45] (Mizhi, China); 10. [12] (Luancheng, China); 11. [46] (Gucheng, China); 12. [9] (Badain Jaran Desert, China); 13. [37] (Gurban Tunggut Desert, China); 14. [10] (Tengger Desert, China); 15. [47] (Polynesia, France); 16. [48] (Zadar, Croatia); 17. [6] (Momoge, China); 18. [13] (Jalisco, Mexico); 19. [18] (Taklimakan Desert, China); 20. [49] (Mu Us, China); 21. [50] (Hopq, China); 22. [21] (Gurban tunggut Desert, China); 23. [51] (Gaolan, China); 24. [52] (Tabernas, Spain); 25. [33] (Maktau, Kenya); 26. This study (Lishu); 27. This study (Changchun); 28. This study (Fujin).

Figure 3.
The monthly dew amount, rainfall and LAI in Lishu, Fujin and Changchun in the growing seasons from 2005 to 2021.
Figure 3.
The monthly dew amount, rainfall and LAI in Lishu, Fujin and Changchun in the growing seasons from 2005 to 2021.

Figure 4.
Accumulative departure of meteorological factors ((a) Temperature; (b) RH%; (c) wind speed; (d) rainfall) and dew amount (e) during the dew condensation period in Changchun from 1957 to 2021.
Figure 4.
Accumulative departure of meteorological factors ((a) Temperature; (b) RH%; (c) wind speed; (d) rainfall) and dew amount (e) during the dew condensation period in Changchun from 1957 to 2021.

Table 1.
The climate characteristics and underlying surfaces in each sampling plot.
| Sampling Plots | Ecosystem | Underlying Surface | Annual Average Temperature (°C) | Annual Average Rainfall (mm) |
|---|---|---|---|---|
| Lishu (43°24′ N, 124°18′ E) | farmland | corn (Zea mays) | 5.8 | 577 |
| Fujin (47°35′ N, 133°30′ E) | wetland | Carex lasiocarpa | 3.6 | 540 |
| Changchun (44°05′ N, 125°20′ E) | urban | Syringa oblata Lindl. | 4.8 | 550 |
Table 2.
The monthly and yearly characteristic values of dew days and daily dew intensity in Lishu, Fujin and Changchun from 2015 to 2021.
Table 2.
The monthly and yearly characteristic values of dew days and daily dew intensity in Lishu, Fujin and Changchun from 2015 to 2021.
| Lishu (Farmland) | Fujin (Wetland) | Changchun (Urban) | ||||||||||
|---|---|---|---|---|---|---|---|---|---|---|---|---|
| Dew Days (Days) | Dew Intensity (mm) | Dew Days (Days) | Dew Intensity (mm) | Dew Days (Days) | Dew Intensity (mm) | |||||||
| Mean | Mean ± SD | Max | Min | Mean | Mean ± SD | Max | Min | Mean | Mean ± SD | Max | Min | |
| May | 14.7 | 0.033 ± 0.020 | 0.104 | 0.001 | 20.9 | 0.065 ± 0.049 | 0.248 | 0.001 | 20.1 | 0.018 ± 0.009 | 0.043 | 0.001 |
| June | 19 | 0.051 ± 0.022 | 0.113 | 0.004 | 20.6 | 0.104 ± 0.05 | 0.256 | 0.001 | 16.1 | 0.026 ± 0.008 | 0.042 | 0.004 |
| July | 20.5 | 0.072 ± 0.020 | 0.123 | 0.007 | 21.1 | 0.170 ± 0.05 | 0.306 | 0.032 | 18.4 | 0.032 ± 0.006 | 0.043 | 0.006 |
| August | 19.5 | 0.080 ± 0.021 | 0.132 | 0.029 | 21.5 | 0.183 ± 0.049 | 0.314 | 0.049 | 18.0 | 0.033 ± 0.006 | 0.046 | 0.005 |
| September | 22.8 | 0.069 ± 0.022 | 0.130 | 0.006 | 22.2 | 0.154 ± 0.06 | 0.315 | 0.010 | 21.2 | 0.031 ± 0.007 | 0.052 | 0.007 |
| October | 26.4 | 0.055 ± 0.022 | 0.130 | 0.010 | 26.5 | 0.081 ± 0.051 | 0.306 | 0.005 | 24.2 | 0.026 ± 0.008 | 0.045 | 0.005 |
| Year | 122.9 | 0.061 ± 0.026 | 0.132 | 0.001 | 132.8 | 0.125 ± 0.069 | 0.315 | 0.001 | 118.1 | 0.028 ± 0.009 | 0.052 | 0.001 |
Table 3.
Correlation coefficients between the dew intensity and meteorological factors in Lishu, Fujin and Changchun.
Table 3.
Correlation coefficients between the dew intensity and meteorological factors in Lishu, Fujin and Changchun.
| Ta | RH | V | Cloud Cover | Td | |
|---|---|---|---|---|---|
| Lishu | 0.800 ** | 0.813 ** | −0.476 ** | −0.101 ** | 0.453 ** |
| Fujin | 0.382 ** | 0.916 ** | −0.490 ** | 0.019 | 0.617 ** |
| Changchun | 0.005 | 0.945 ** | −0.620 ** | −0.012 | 0.694 ** |
Notes: ** Correlation is significant at the 0.01 level (2 tailed).
Table 4.
Meteorological factors affecting dew intensity at reported sites.
| References | Study Sites | Ta (°C) | RH (%) | Td (°C) | V (m/s) | Cloud Cover |
|---|---|---|---|---|---|---|
| [36] | Kenya | NA | + | NA | × | NA |
| [38] | Gurban tunggut Desert, China | − | + | NA | − | − |
| [13] | Jalisco, Mexico | + | NA | NA | × | NA |
| [11] | Shaanxi, China | × | + | NA | × | NA |
| [21] | Gansu, China | × | + | NA | − | NA |
| [22] | Taihu, China | NA | + | NA | − | NA |
| [6] | Jilin, China | NA | + | NA | − | NA |
| [9] | Badain Jaran Desert, China | + | + | ✕ | − | NA |
| [26] | Madagascar, Germany | − | + | + | − | NA |
| [39] | − | − | + | NA | − | − |
| [18] | Taklimakan Desert, Chian | + | NA | NA | + | NA |
| [14] | Zadar, Croatia | NA | + | NA | − | − |
| [15] | Guangzhou, China | × | + | NA | × | NA |
| [37] | Ajaccio, France | NA | + | NA | − | − |
| This study | Changchun, China | + | + | + | − | × |
| Lishu, China | + | + | + | − | − | |
| Fujin, China | × | + | + | − | × |
Notes: “NA” stands for not mentioned; “+” stands for positive correlation; “−” stands for negative correlation; “×” stands for uncorrelated.
Disclaimer/Publisher’s Note: The statements, opinions and data contained in all publications are solely those of the individual author(s) and contributor(s) and not of MDPI and/or the editor(s). MDPI and/or the editor(s) disclaim responsibility for any injury to people or property resulting from any ideas, methods, instructions or products referred to in the content. |
© 2023 by the authors. Licensee MDPI, Basel, Switzerland. This article is an open access article distributed under the terms and conditions of the Creative Commons Attribution (CC BY) license (https://creativecommons.org/licenses/by/4.0/).
Share and Cite
MDPI and ACS Style
Xu, Y.; Jia, C.; Liu, X.; Zhao, Y.; Dou, Y.; Yang, X.; Yi, Y. Monitoring the Dew Amount in Typical Ecosystems of Northeast China from 2005 to 2021. Water 2023, 15, 1091. https://doi.org/10.3390/w15061091
AMA Style
Xu Y, Jia C, Liu X, Zhao Y, Dou Y, Yang X, Yi Y. Monitoring the Dew Amount in Typical Ecosystems of Northeast China from 2005 to 2021. Water. 2023; 15(6):1091. https://doi.org/10.3390/w15061091
Chicago/Turabian StyleXu, Yingying, Chenzhuo Jia, Xiaoteng Liu, Yunze Zhao, Yingbo Dou, Xu Yang, and Yan Yi. 2023. "Monitoring the Dew Amount in Typical Ecosystems of Northeast China from 2005 to 2021" Water 15, no. 6: 1091. https://doi.org/10.3390/w15061091
Note that from the first issue of 2016, this journal uses article numbers instead of page numbers. See further details here.