
Nutrients and Saltwater Exchange as Drivers of Environmental Change in a Danish Brackish Coastal Lake over the Past 100 Years
 ,
,
Abstract
:1. Introduction
2. Materials and Methods
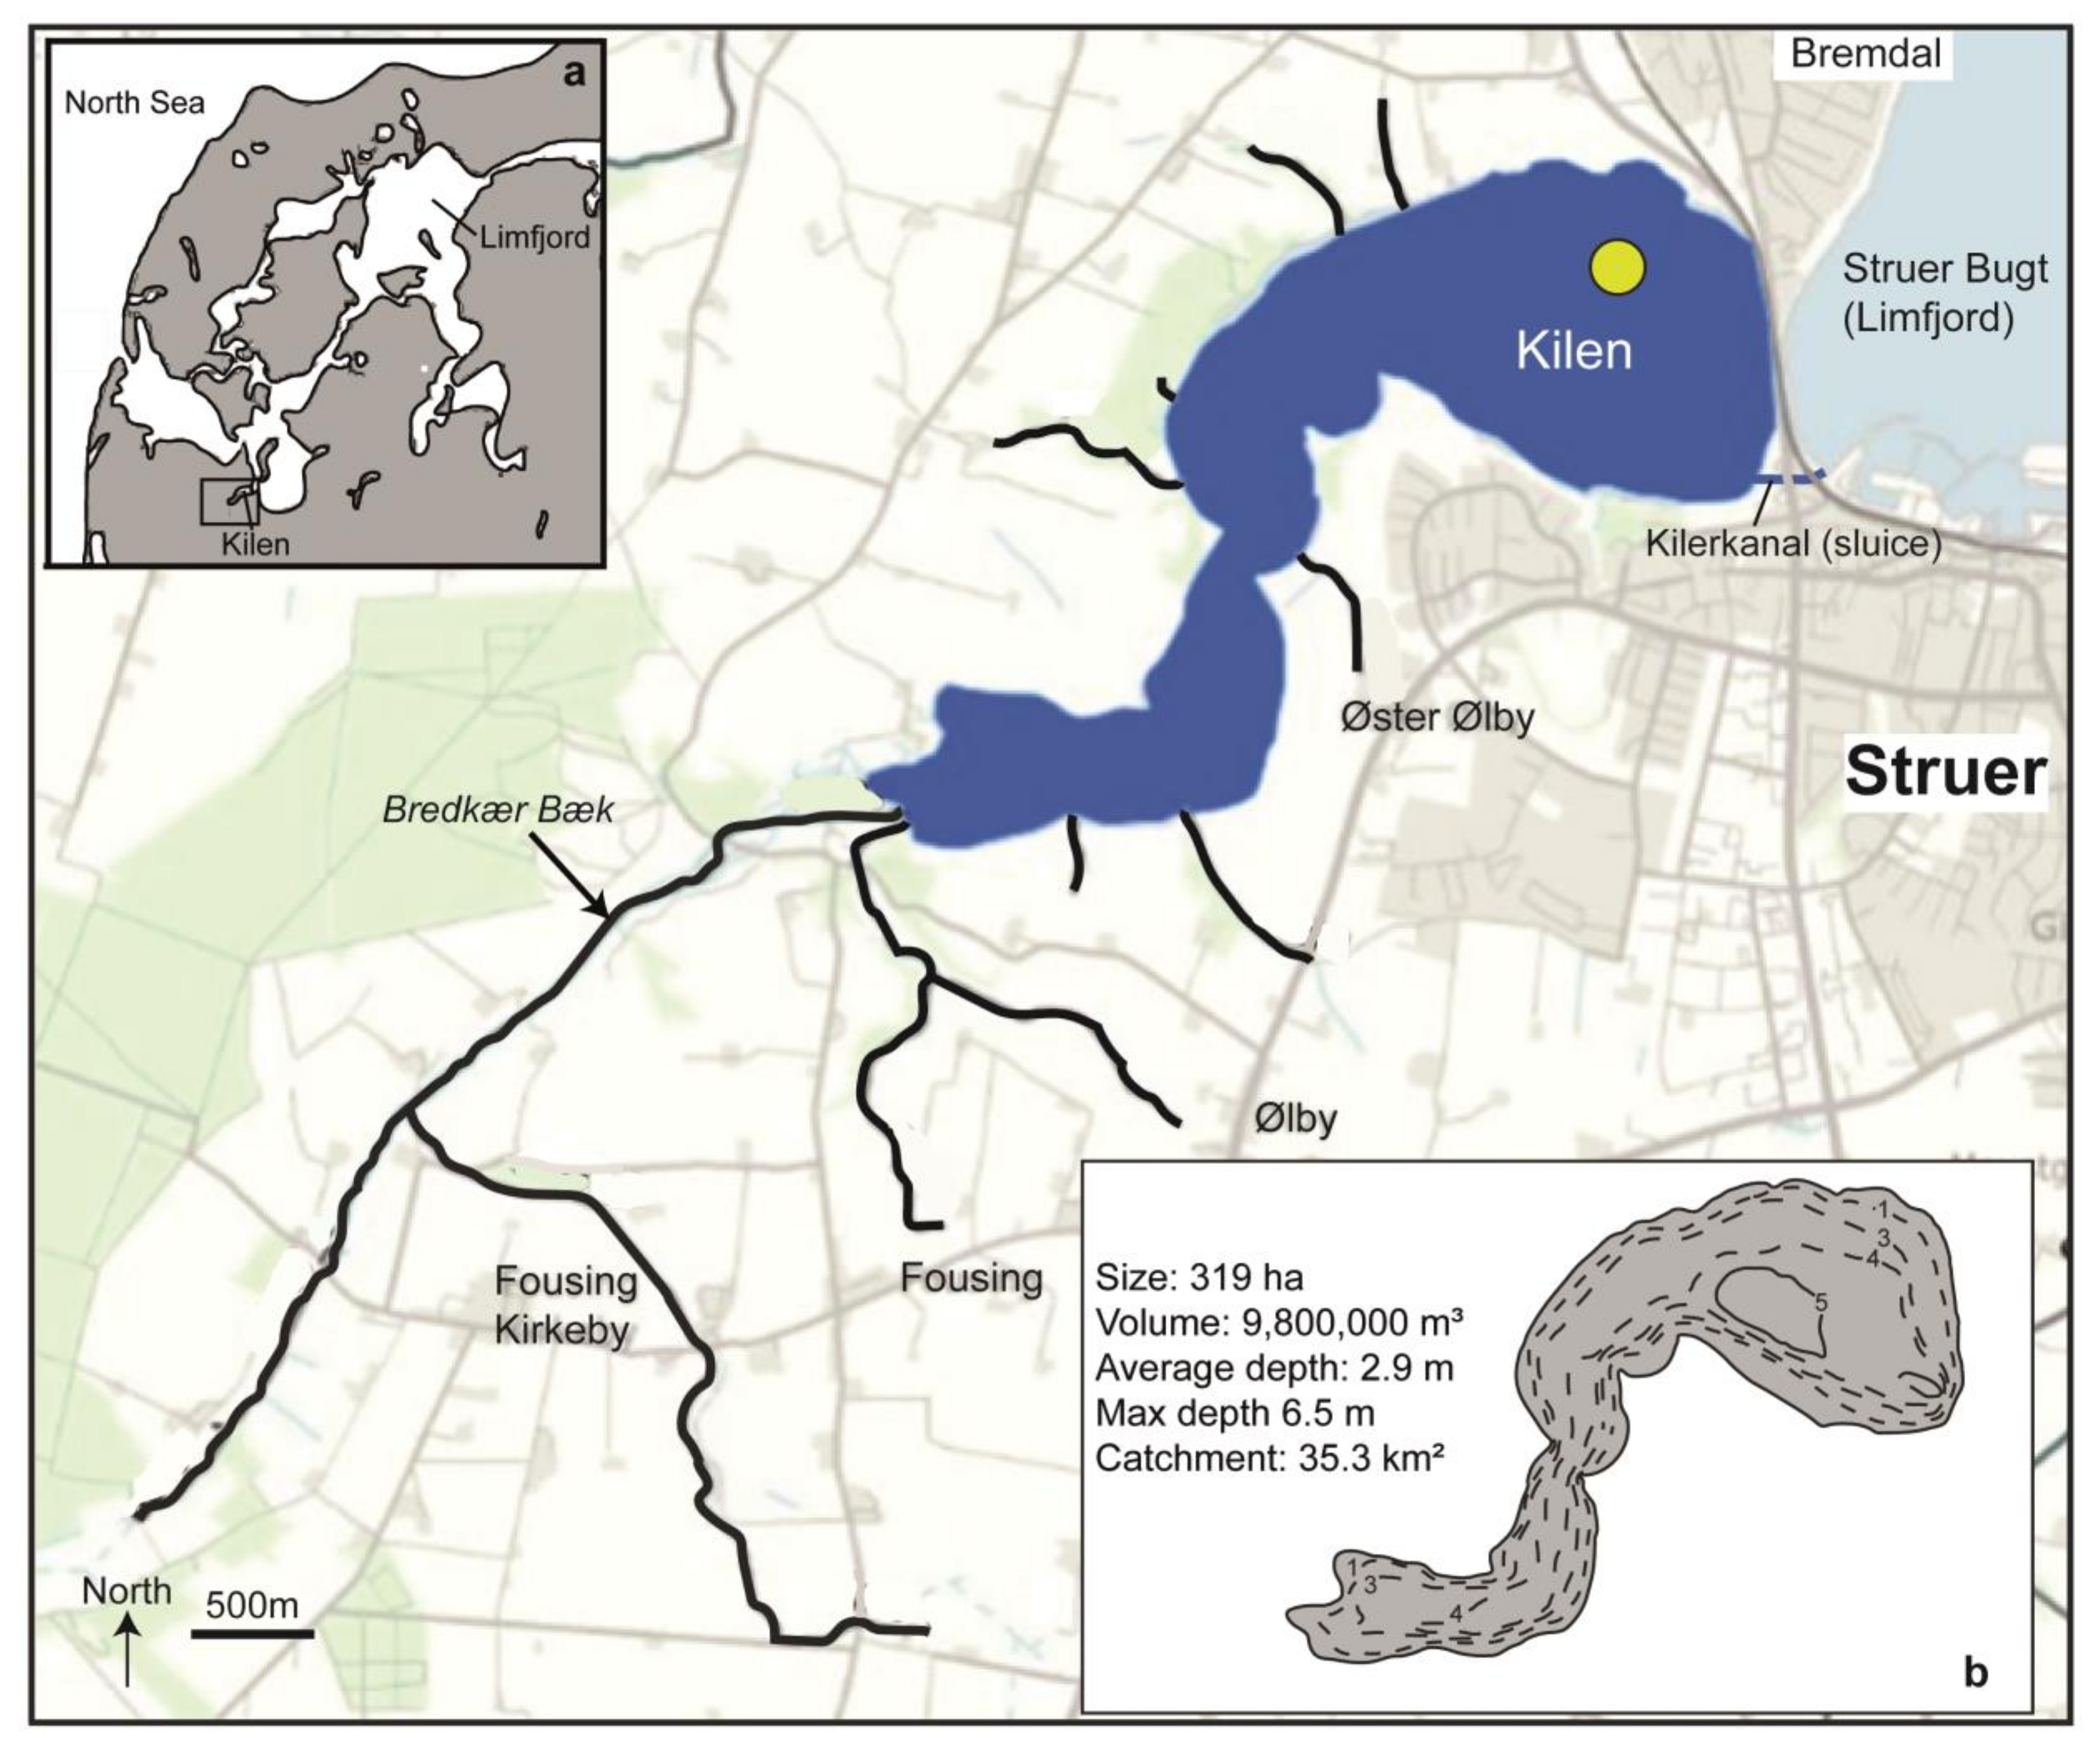
2.1. Study Area
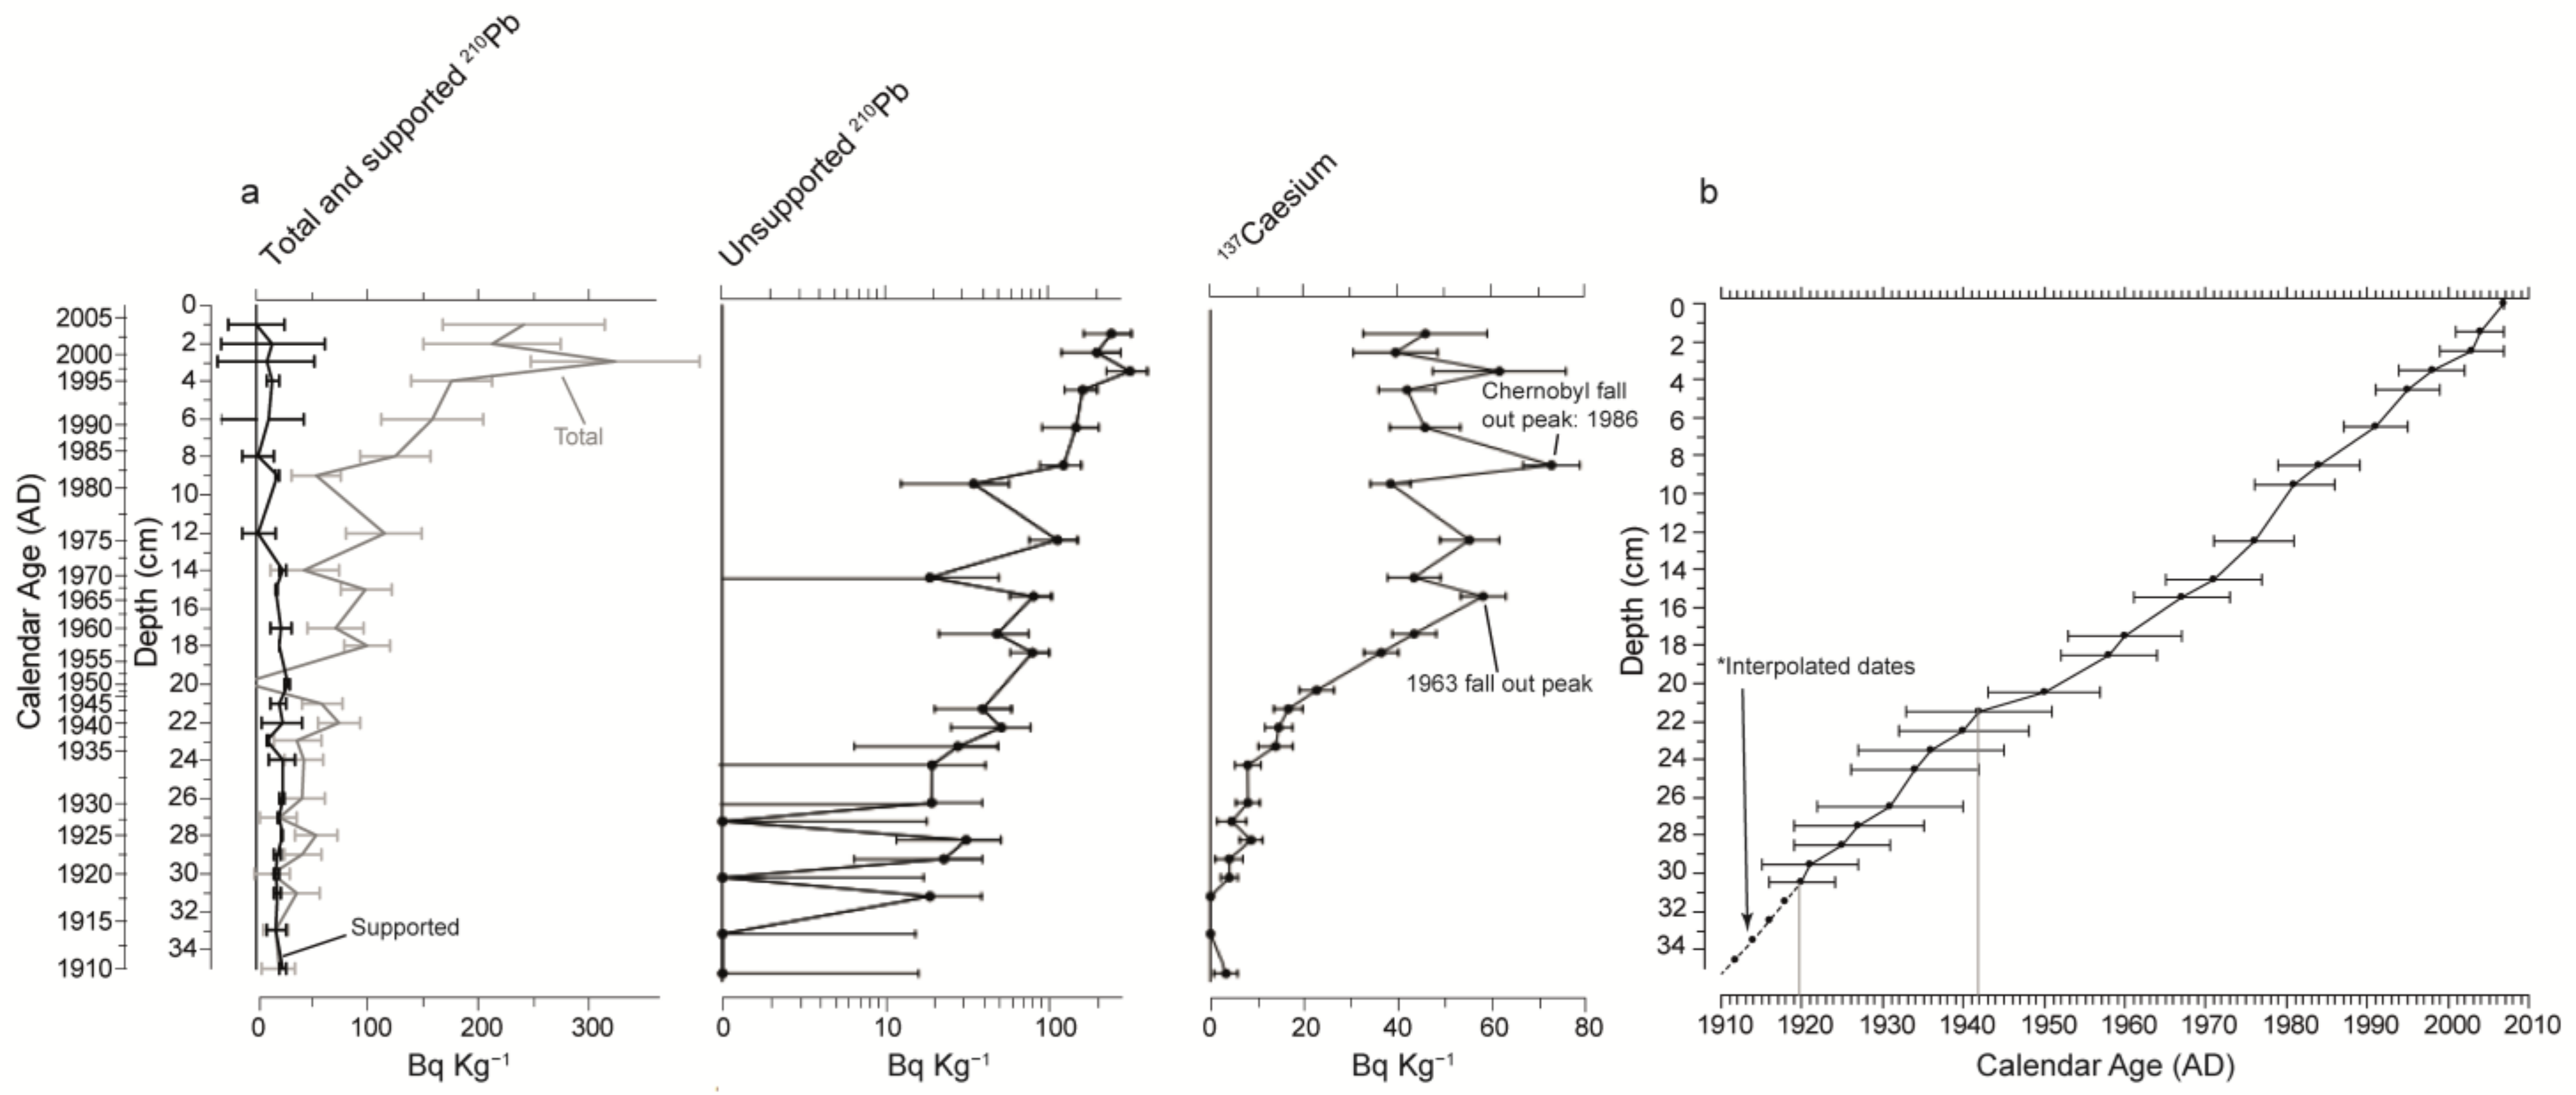
2.2. Sediment Sampling and Core Chronology
2.3. Proxy Analyses
2.4. Statistical Analyses and Diatom-Based Inference Model
2.5. Monitoring Data
3. Results
3.1. Age-Depth Model
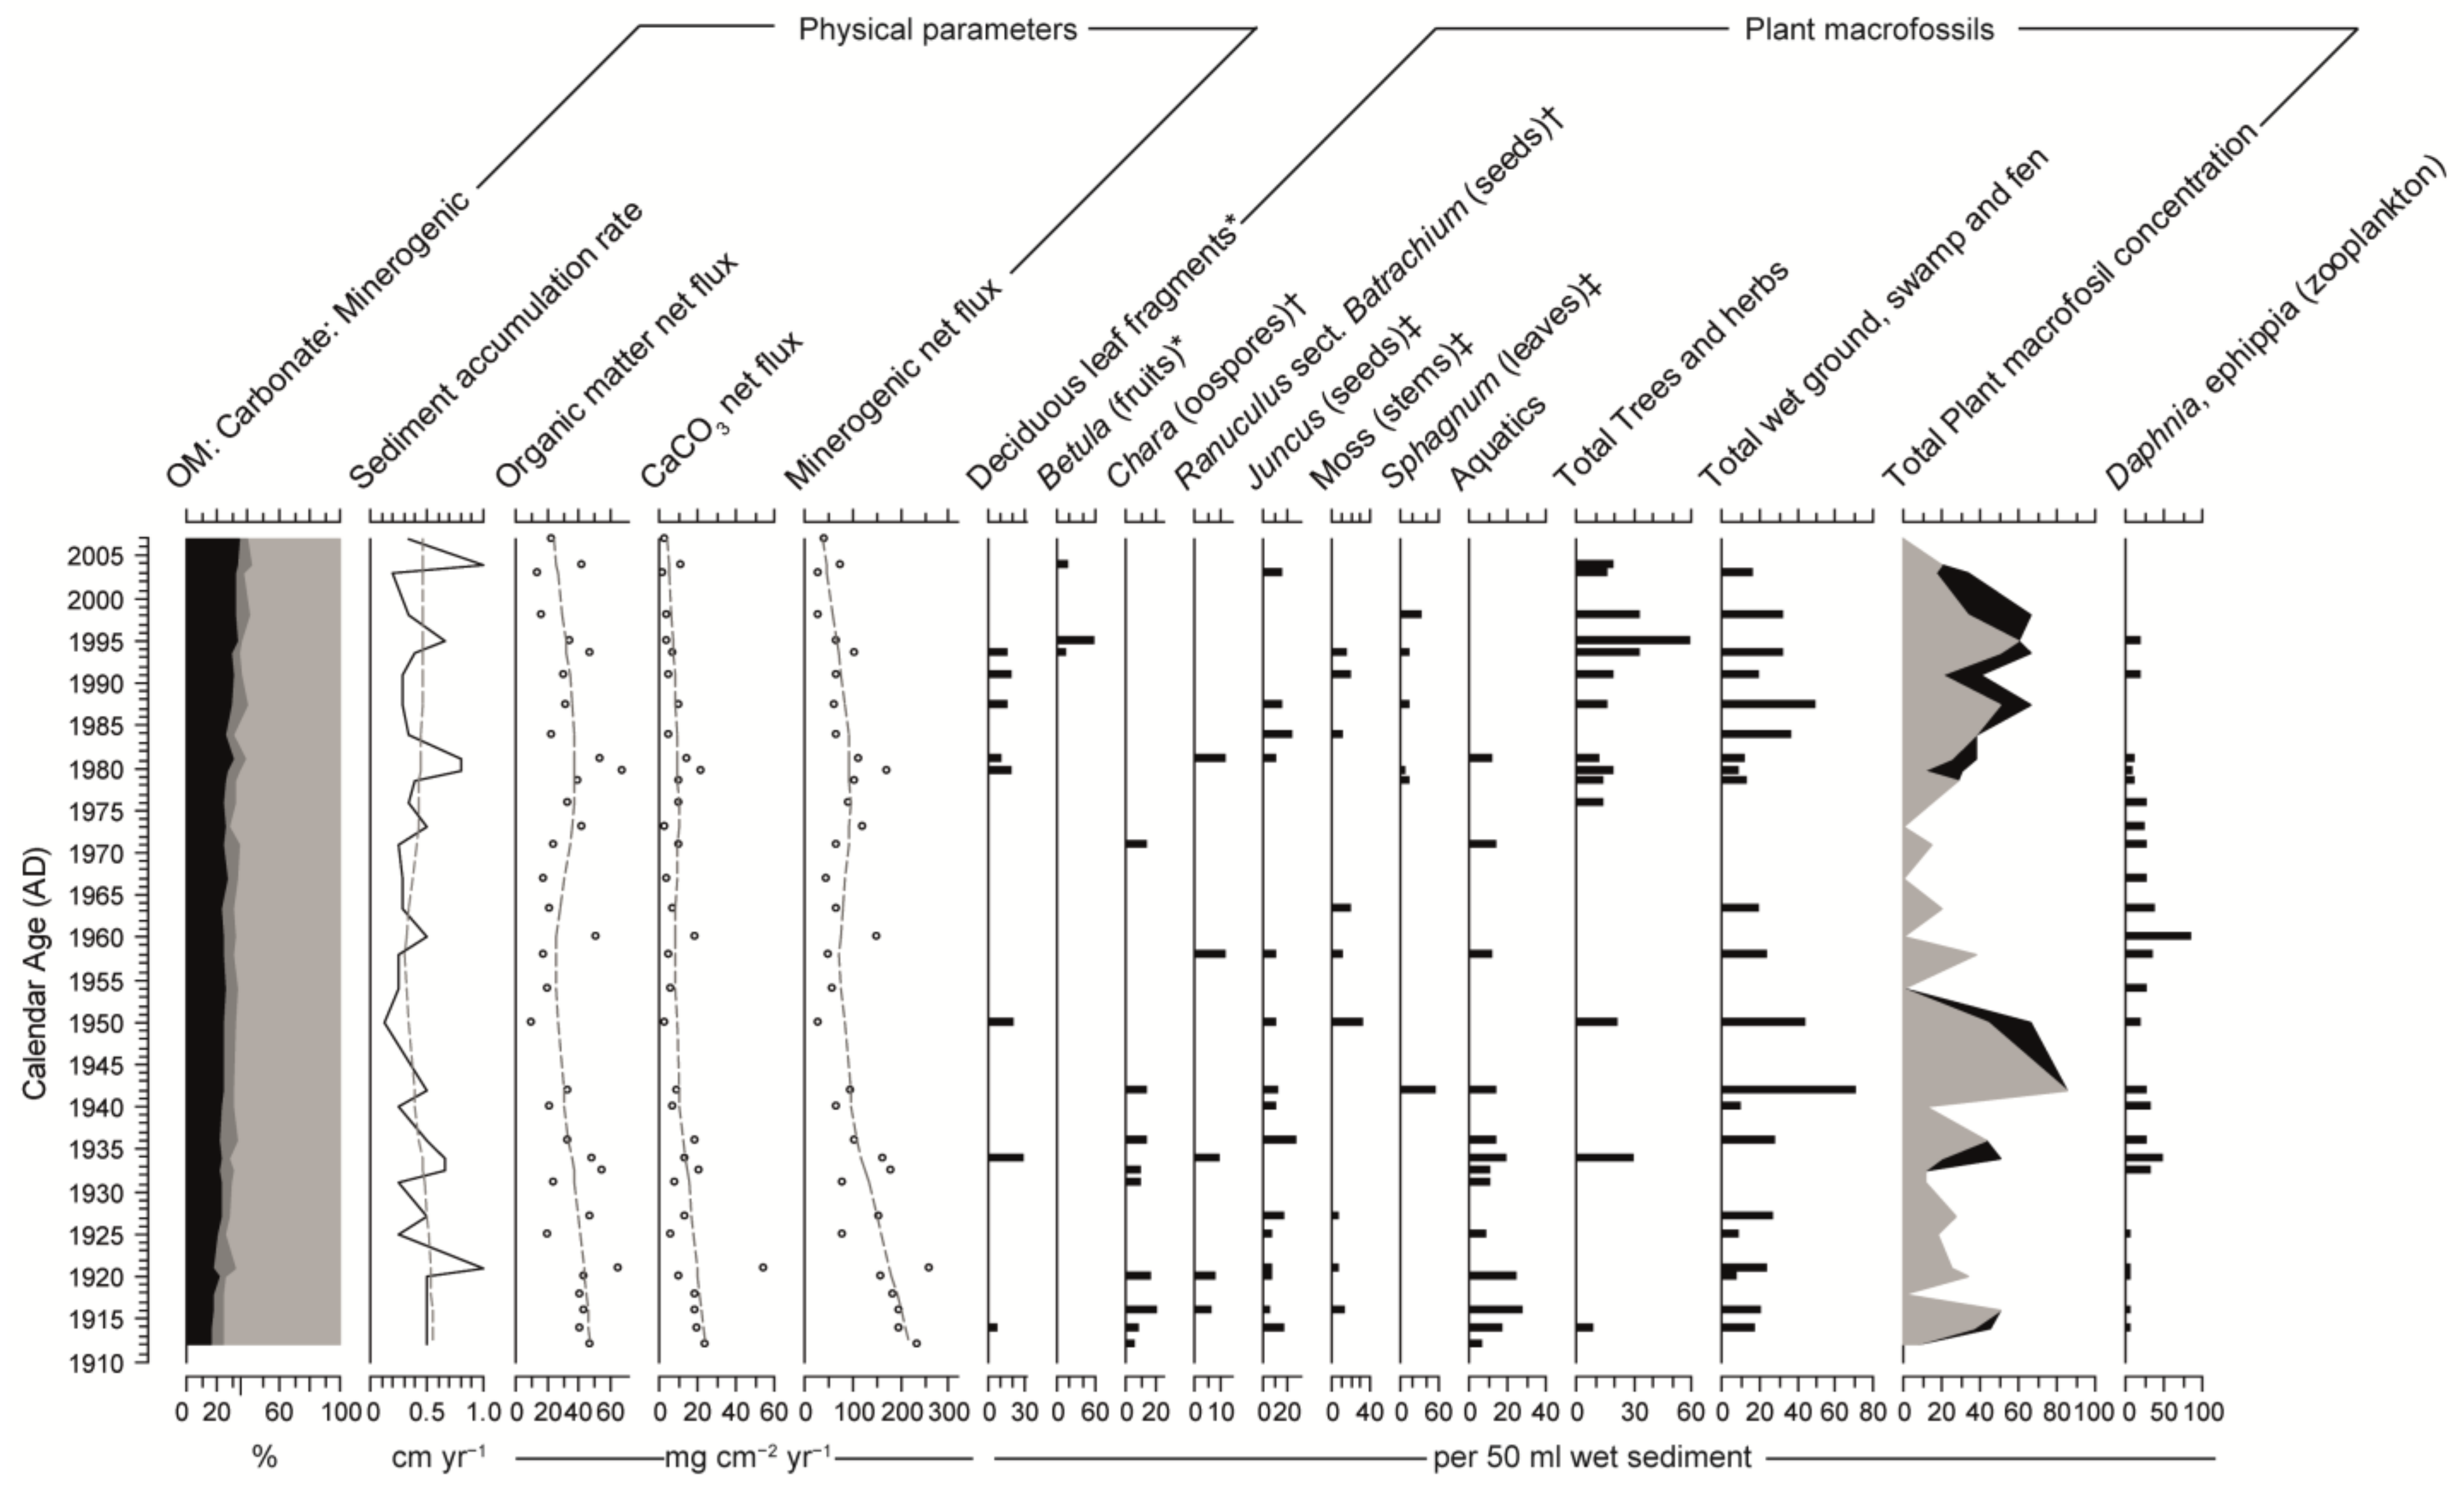
3.2. Physical Sedimentary Parameters
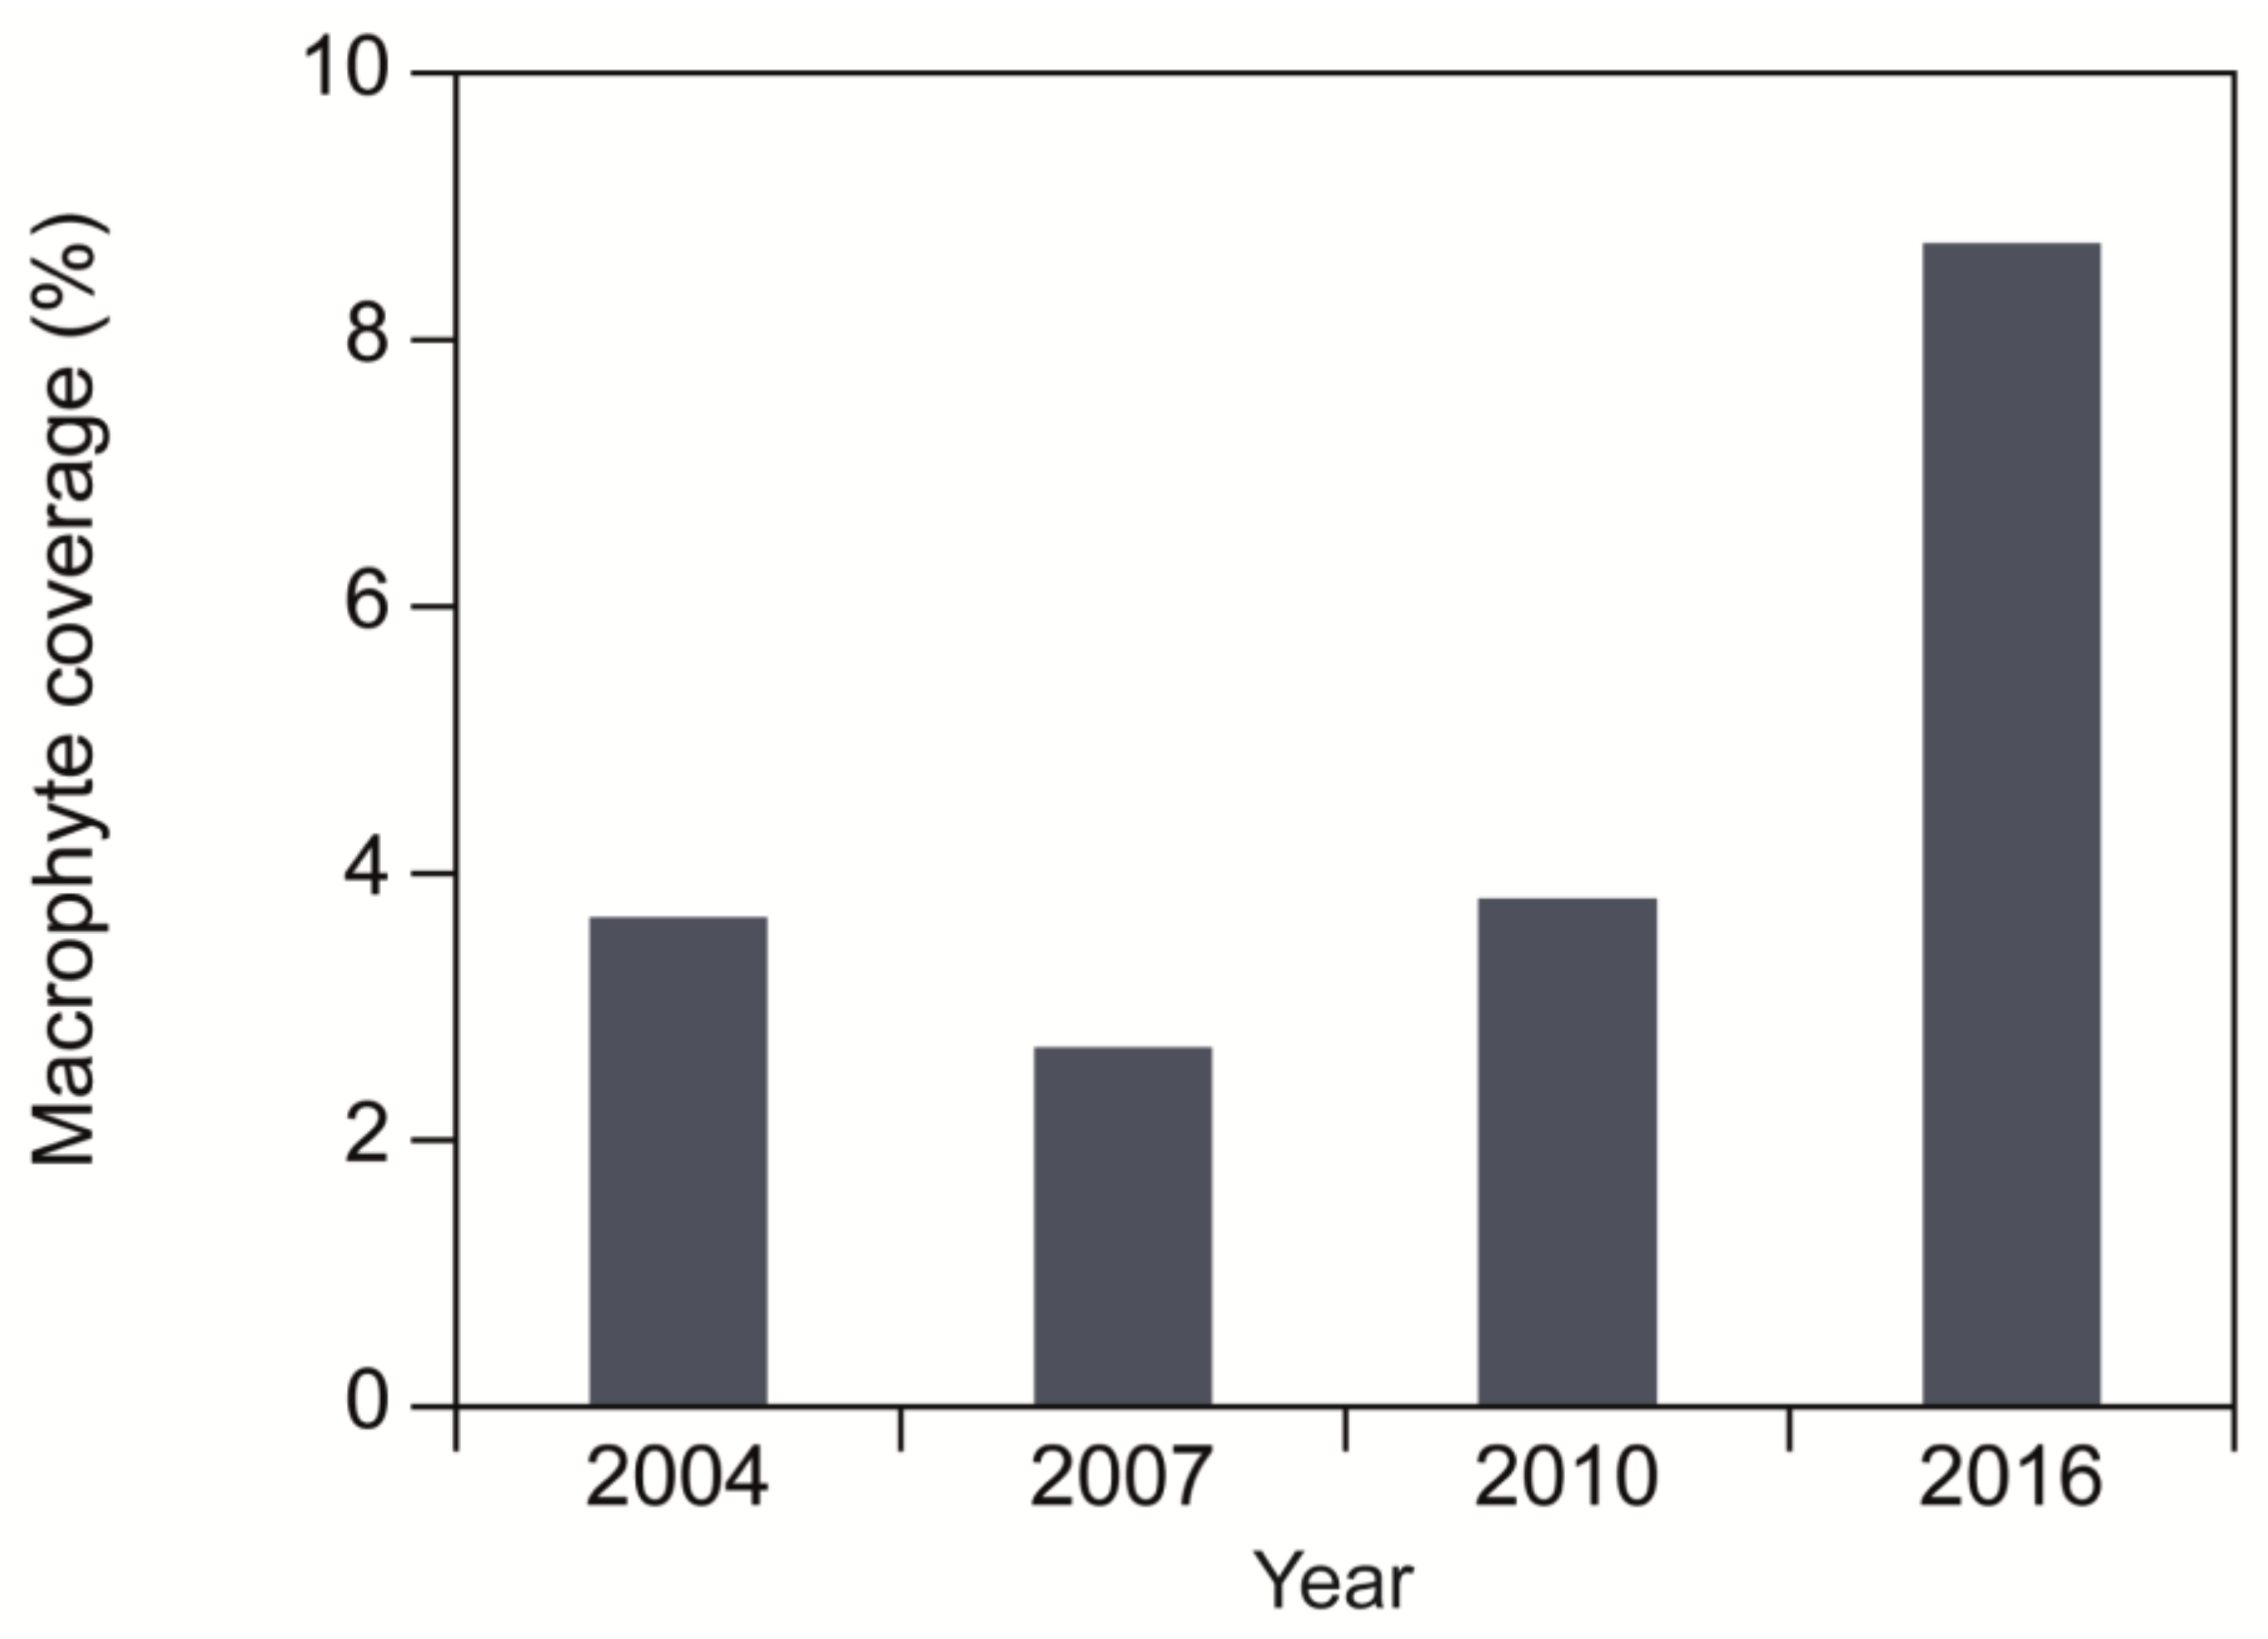
3.3. Macrofossils
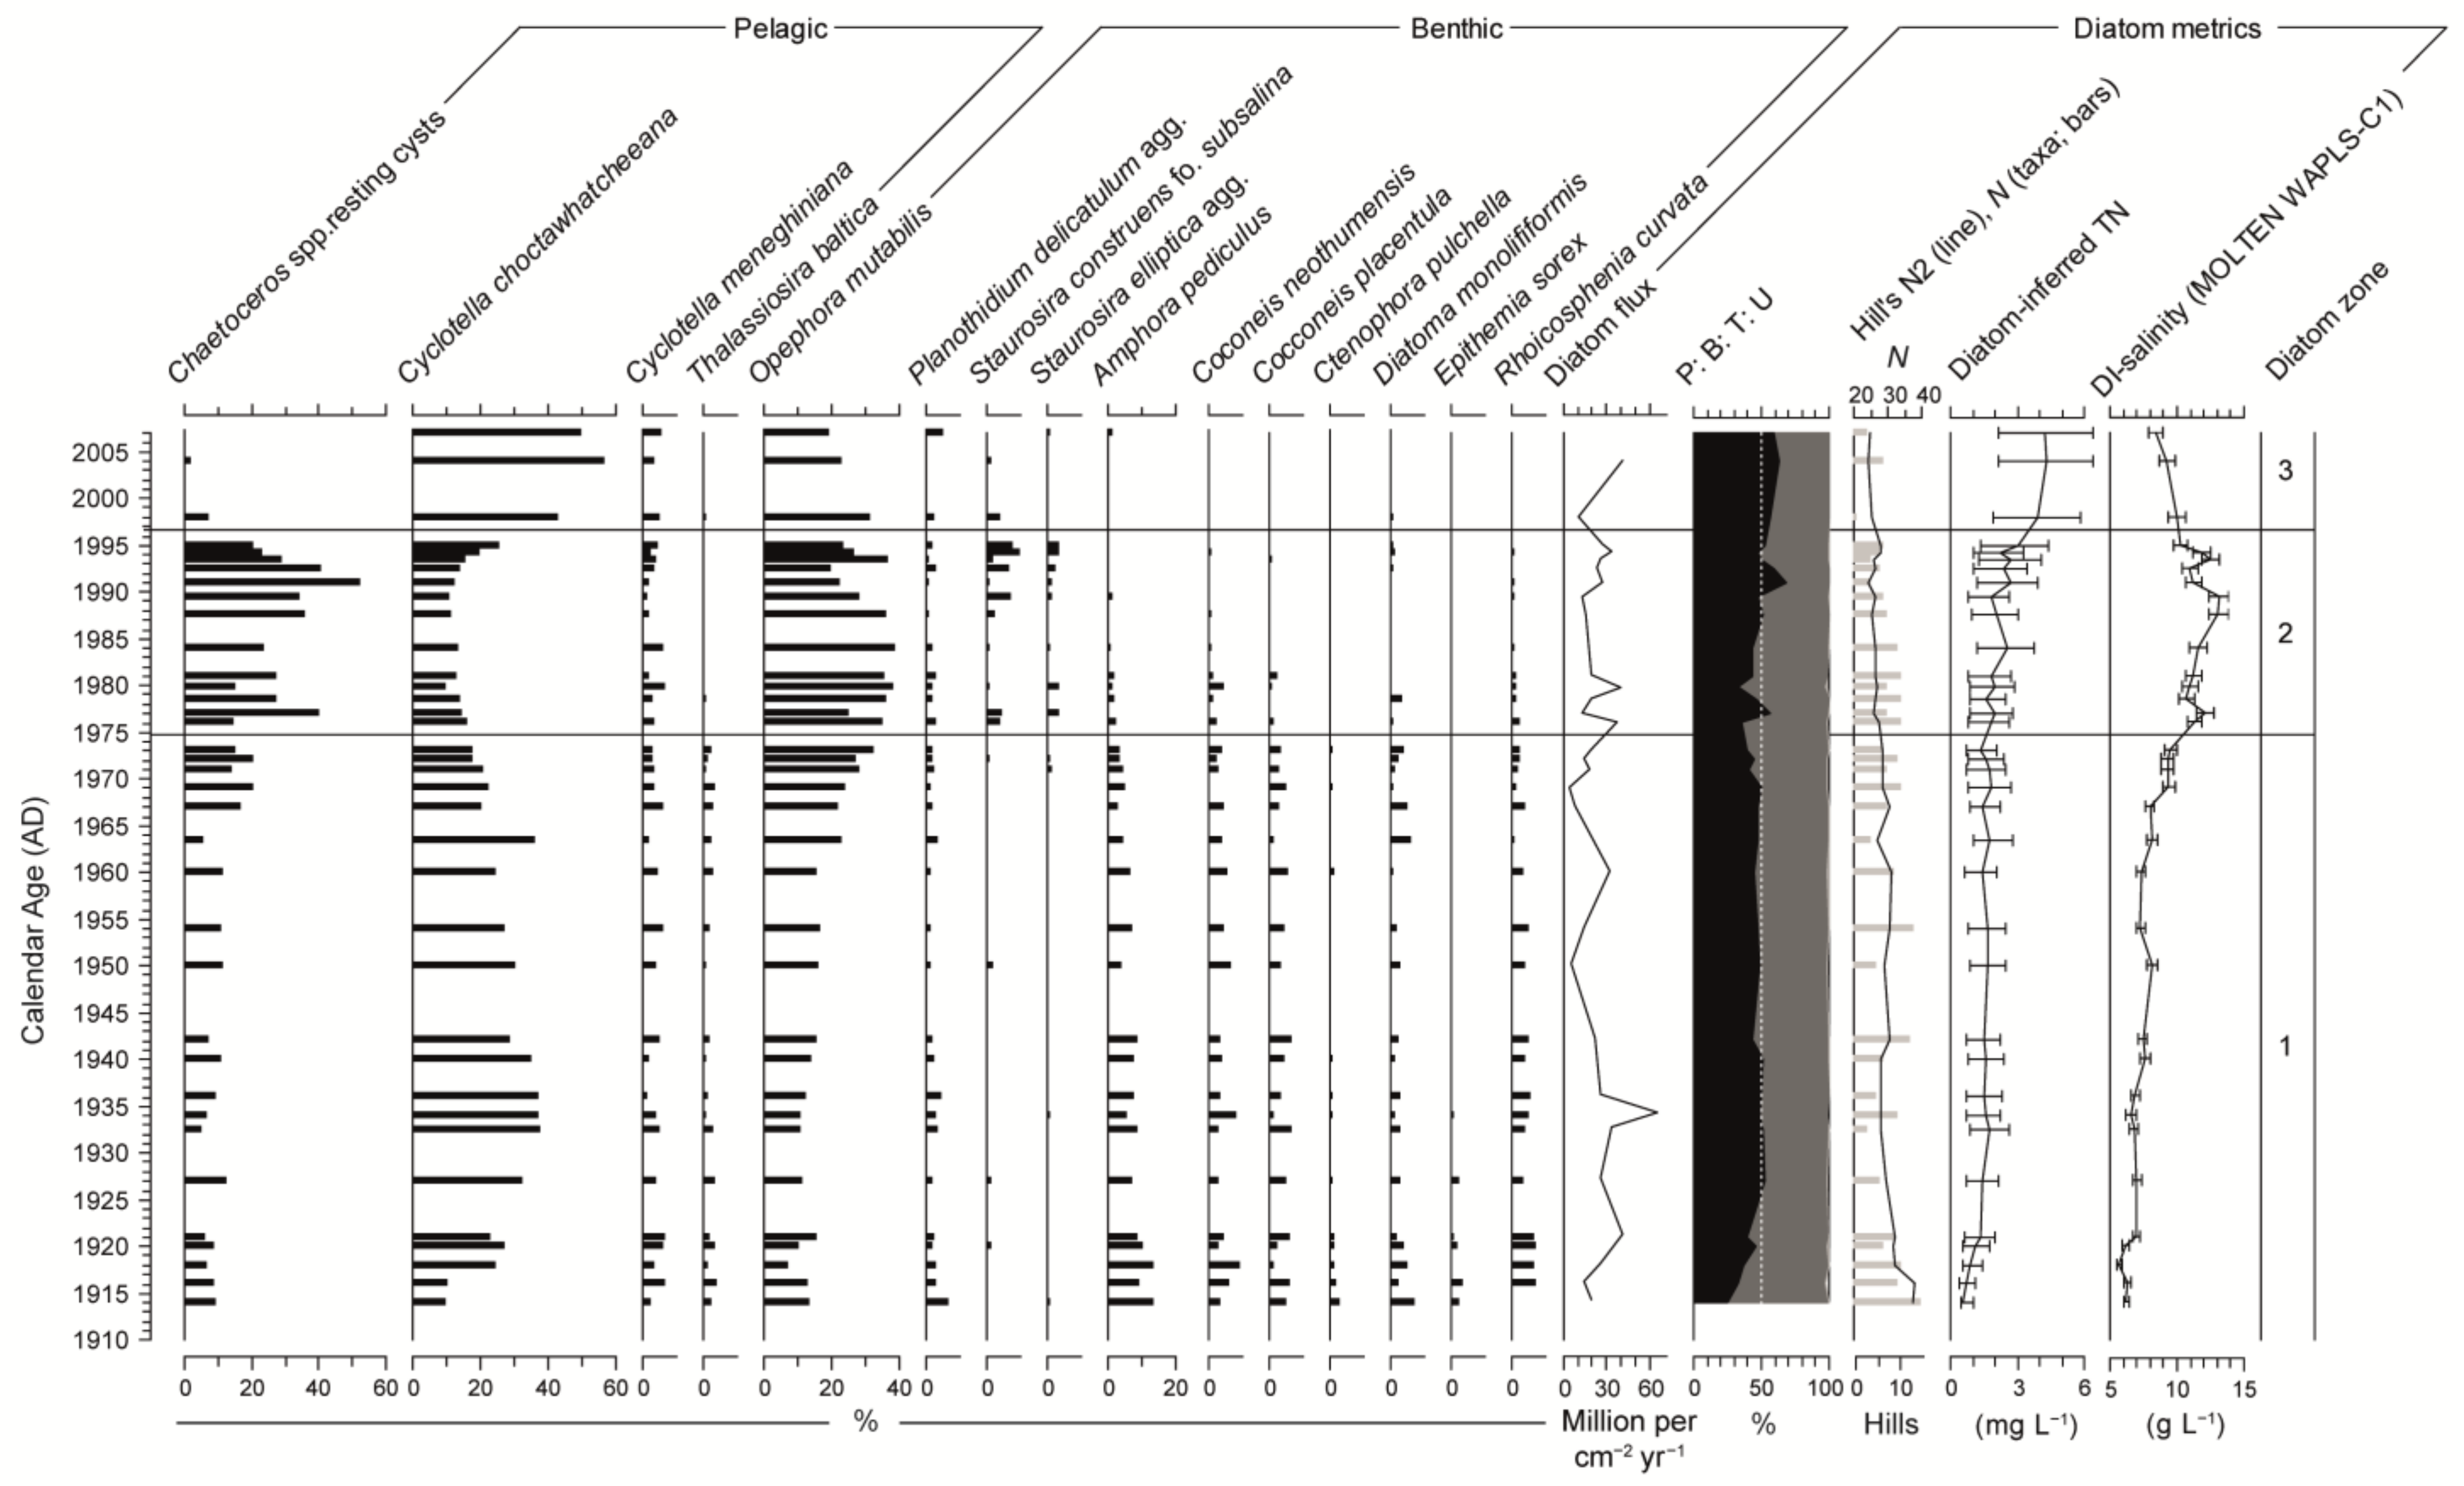
3.4. Diatoms
3.5. Diatom Metrics
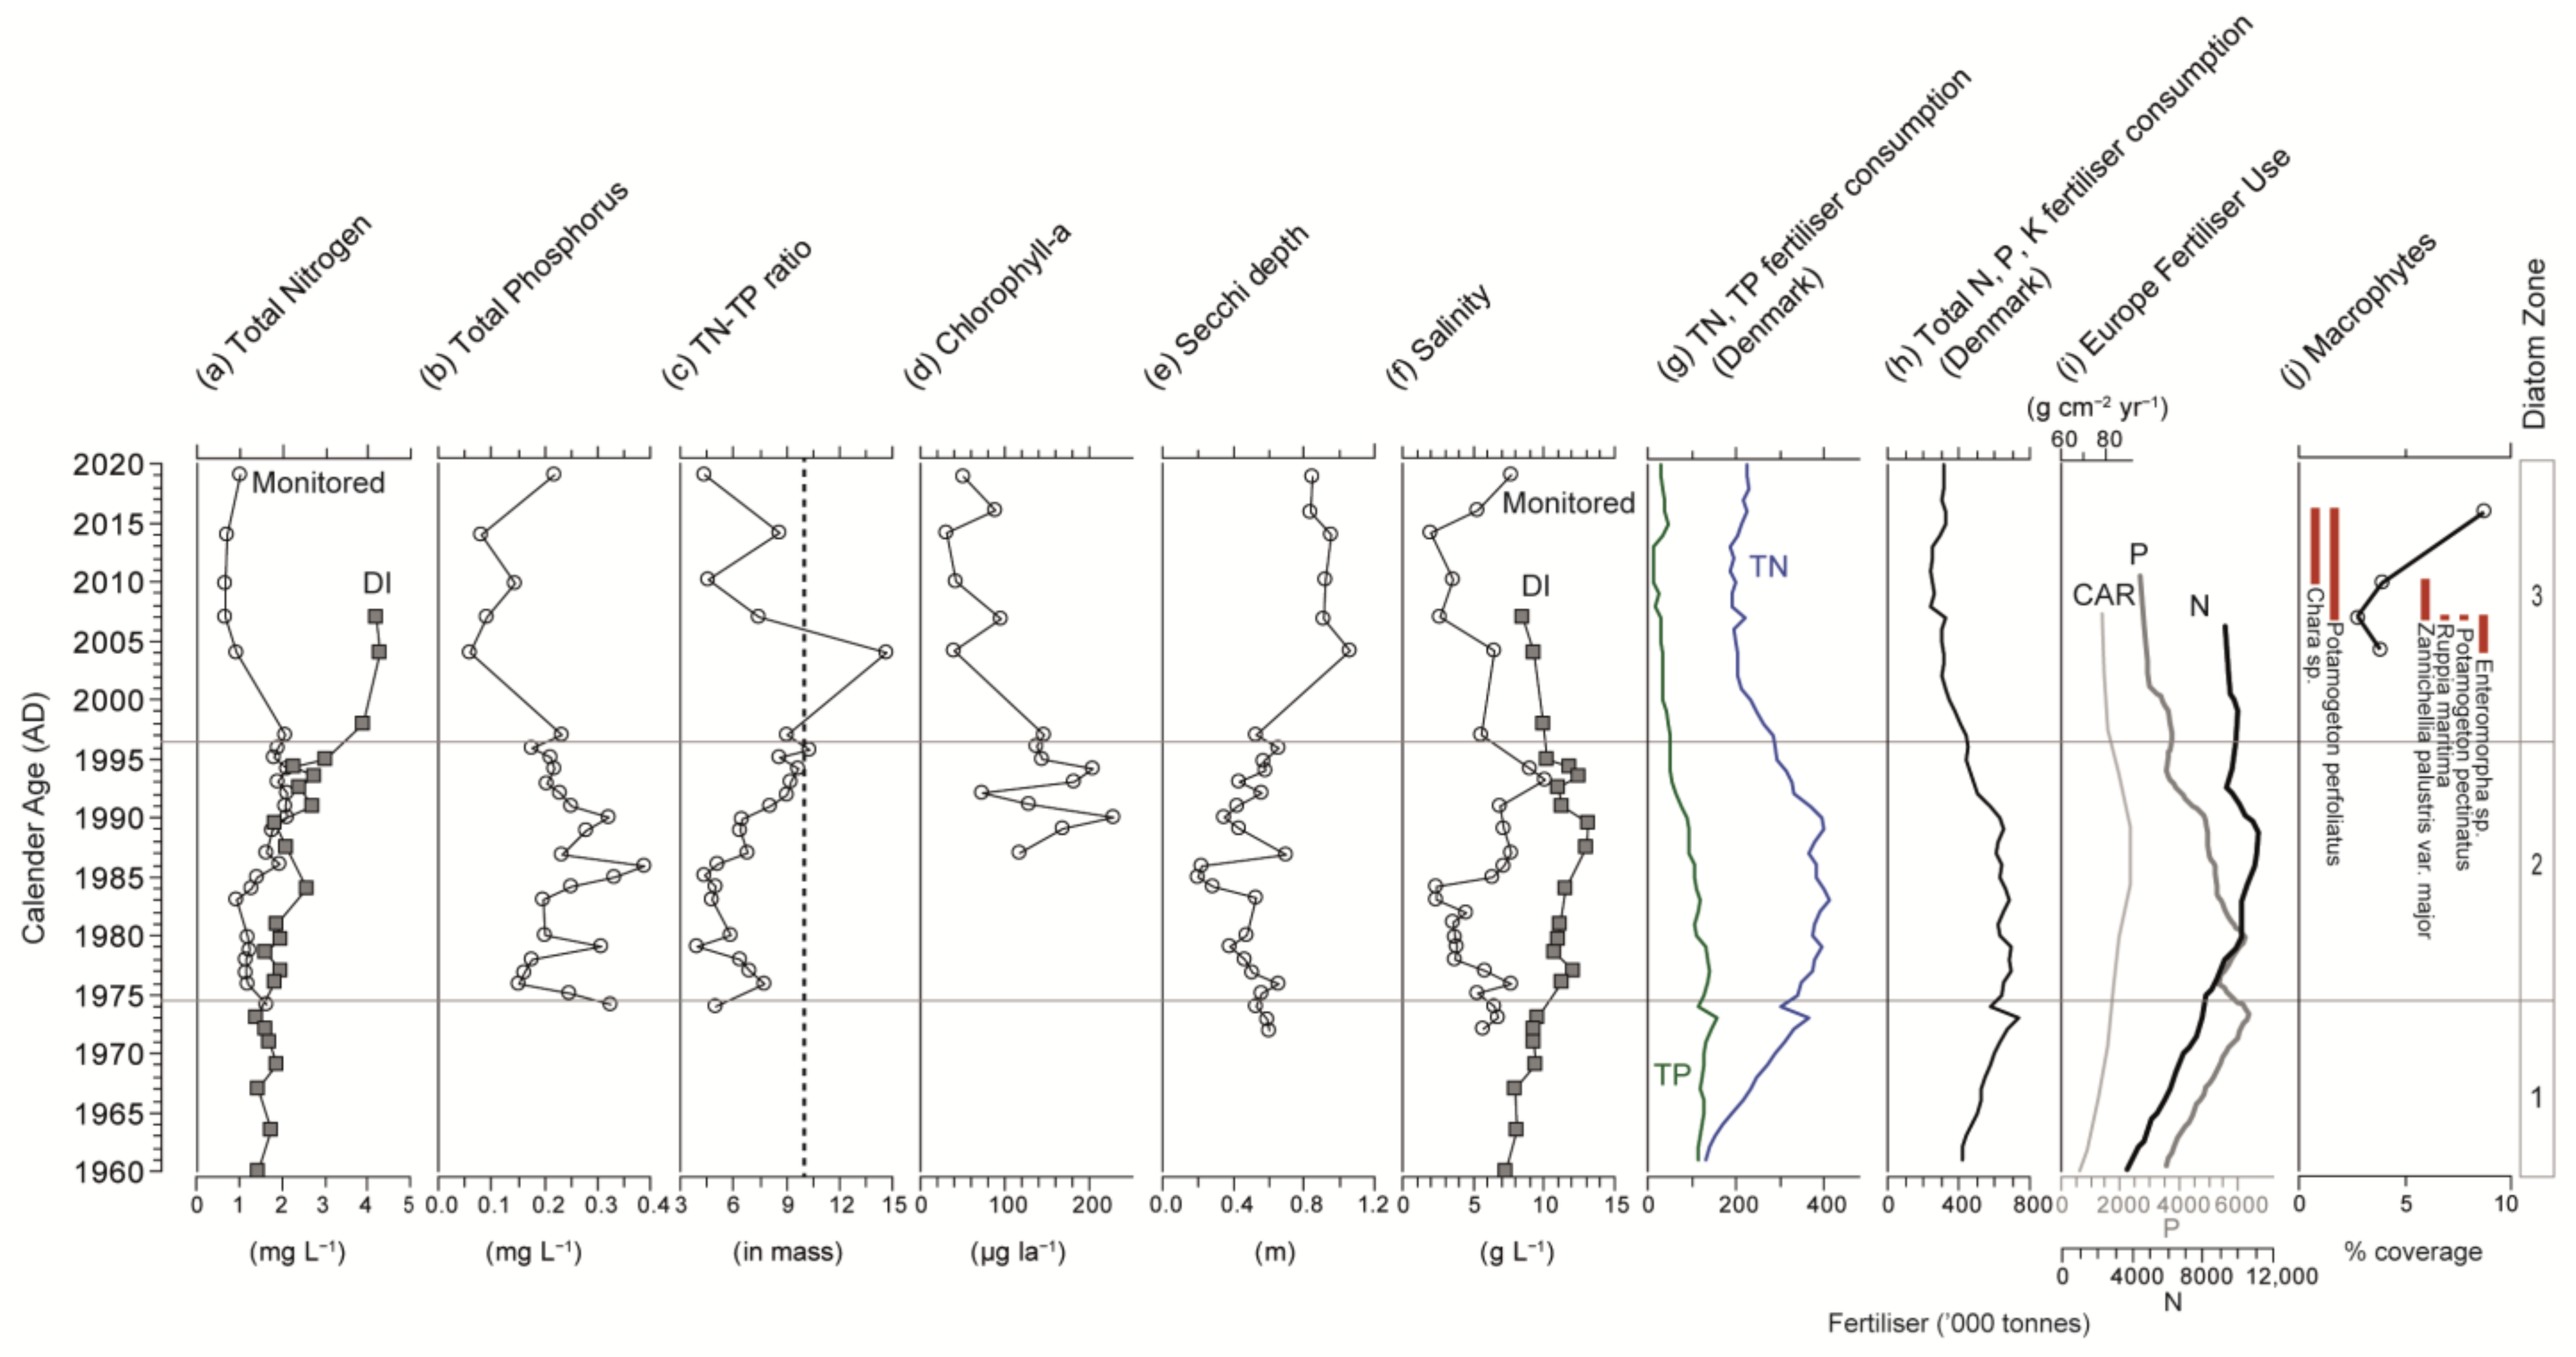
3.6. Monitoring Data
3.7. Inferred Total Nitrogen and Salinity from Diatoms and Validation
4. Discussion
4.1. Onset of Nutrient Enrichment: Early 20th Century
4.2. Increasing Impacts of Eutrophication: Mid to Late 20th Century
4.3. Lake Recovery: Late 20th Century to the Present Day
4.4. Drivers of Ecological Change in Brackish Systems: Nutrients and Salinity
4.5. Problems and Potential of Transfer Functions
5. Conclusions
Author Contributions
Funding
Data Availability Statement
Acknowledgments
Conflicts of Interest
References
- Bradshaw, E.G.; Nielsen, A.B.; Anderson, N.J. Using diatoms to assess the impacts of prehistoric, pre-industrial and modern land-use on Danish lakes. Reg. Environ. Chang. 2006, 6, 17–24. [Google Scholar] [CrossRef]
- Jensen, J.P.; Pedersen, A.R.; Jeppesen, E.; Søndergaard, M. An empirical model describing the seasonal dynamics of phosphorus in 16 shallow eutrophic lakes after external loading reduction. Limnol. Oceanogr. 2006, 51, 791–800. [Google Scholar] [CrossRef] [Green Version]
- Schindler, D.W. Evolution of phosphorus limitation in lakes. Science 1977, 195, 260–262. [Google Scholar] [CrossRef] [PubMed] [Green Version]
- Carpenter, S.R.; Caraco, N.F.; Correll, D.L.; Howarth, R.W.; Sharpley, A.N.; Smith, V.H. Nonpoint pollution of surface waters with phosphorus and nitrogen. Ecol. Appl. 1998, 8, 559–568. [Google Scholar] [CrossRef]
- Schindler, D.W. Recent advances in the understanding and management of eutrophication. Limnolgy Oceanogr. 2006, 51, 356–363. [Google Scholar] [CrossRef] [Green Version]
- Ellegaard, M.; Clarke, A.L.; Reuss, N.; Drew, S.; Weckström, K.; Juggins, S.; Anderson, N.J.; Conley, D.J. Multi-proxy evidence of long-term changes in ecosystem structure in a Danish marine estuary, linked to increased nutrient loading. Estuar. Coast. Shelf Sci. 2006, 68, 567–578. [Google Scholar] [CrossRef]
- Nixon, S.W. Coastal marine eutrophication: A definition, social causes and future concerns. Ophelia 1995, 41, 199–219. [Google Scholar] [CrossRef]
- Howarth, R.W.; Marino, R. Nitrogen as the limiting nutrient for eutrophication in coastal marine ecosystems: Evolving views over three decades. Limnol. Oceanogr. 2006, 51, 364–376. [Google Scholar] [CrossRef] [Green Version]
- Paerl, H.W.; Scott, J.T.; McCarthy, M.J.; Newell, S.E.; Gardner, W.S.; Havens, K.E.; Hoffman, D.K.; Wilhelm, S.W.; Wurtsbaugh, W. It takes two to tango: When and where dual nutrient (N & P) reductions are needed to protect lakes and downstream ecosystems. Environ. Sci. Technol. 2016, 50, 10805–10813. [Google Scholar]
- Søndergaard, M.; Lauridsen, T.L.; Johnsson, L.S.; Jeppesen, E. Nitrogen or phosphorus limitation in lakes and its impact on phytoplankton biomass and submerged macrophyte covers. Hydrobiologia 2017, 795, 35–48. [Google Scholar] [CrossRef]
- Nørring, N.P.; Jørgensen, E. Eutrophication and agriculture in Denmark: 20 years of experience and prospects for the future. Hydrobiologia 2009, 629, 65–70. [Google Scholar] [CrossRef]
- Agency, D.E.P. Environmental Impacts of Nutrient Emissions in Denmark; No. 1.; Redegørelse fra Miljøstyrelsen: Odense, Denmark, 1991. [Google Scholar]
- Conley, D.J.; Markager, S.; Andersen, J.; Ellermann, T.; Svendsen, L.M. Coastal eutrophication and the Danish National Aquatic Monitoring and Assessment Program. Estuaries 2002, 25, 848–861. [Google Scholar] [CrossRef]
- Kronvang, B.; Andersen, H.E.; Borgesen, C.; Dalgaard, T.; Larsen, S.E.; Bøgestrand, J.; Blicher-Mathiasen, G. Effects of policy measures implemented in Denmark on nitrogen pollution of the aquatic environment. Environ. Sci. Policy 2008, 11, 144–152. [Google Scholar] [CrossRef]
- Søndergaard, M.; Jensen, J.P.; Jeppesen, E.; Møller, P.H. Seasonal dynamics in the concentrations and retention of phosphorus in shallow Danish lakes after reduced loading. Aquat. Ecosyst. Health Manag. 2002, 5, 19–29. [Google Scholar] [CrossRef]
- Søndergaard, M.; Jeppesen, E.; Lauridsen, T.L.; Skov, C.; Van Nes, E.H.; Roijackers, R.; Lammens, E.; Portielje, R. Lake restoration: Successes, failures and long-term effects. J. Appl. Ecol. 2007, 44, 1095–1105. [Google Scholar] [CrossRef]
- Trolle, D.; Nielsen, A.; Rolighed, J.; Thodsen, H.; Andersen, H.E.; Karlsson, I.; Refsgaard, J.; Olesen, J.; Bolding, K.; Kronvang, B.; et al. Projecting the future ecological state of lakes in Denmark in a 6 degree warming scenario. Clim. Res. 2015, 64, 55–72. [Google Scholar] [CrossRef] [Green Version]
- Søndergaard, M.; Davidson, T.A.; Lauridsen, T.L.; Johansson, L.S.; Jeppesen, E. Submerged macrophytes in Danish lakes: Impact of morphological and chemical factors on abundance and species richness. Hydrobiologia 2022, 849, 3789–3800. [Google Scholar] [CrossRef]
- Riemann, B.; Carstensen, J.; Dahl, K.; Fossing, H.; Hansen, J.W.; Jakobsen, H.H.; Josefson, S.B.; Krause-Jensen, D.; Markager, S.; Stæhr, P.A.; et al. Recovery of Danish coastal ecosystems after reductions in nutrient loading: A holistic ecosystem approach. Estuaries Coasts 2016, 39, 82–97. [Google Scholar] [CrossRef] [Green Version]
- Schindler, D.W. The dilemma of controlling cultural eutrophication of lakes. Proc. R. Soc. B 2012, 279, 4322–4333. [Google Scholar] [CrossRef] [Green Version]
- Roberts, L.R.; Sayer, C.D.; Hoare, D.; Tomlinson, M.; Holmes, J.A.; Horne, D.J.; Kelly, A. The role of monitoring, documentary and archival records for coastal shallow lake management. Geo Geogr. Environ. 2019, 6, e00083. [Google Scholar] [CrossRef]
- Williams, W.D.; Boulton, A.J.; Taaffe, R.G. Salinity as a determinant of salt lake fauna: A question of scale. Hydrobiologia 1990, 197, 257–266. [Google Scholar] [CrossRef]
- Conley, D.; Cartensen, J.; Ærtebjerg, G.; Christensen, P.B.; Dalsgaard, T.; Hansen, J.L.S.; Josefson, A.B. Long-term changes and impacts of hypoxia in Danish coastal waters. Ecol. Appl. 2007, 17, 165–184. [Google Scholar] [CrossRef]
- Jeppesen, E.; Søndergaard, M.; Kanstrup, E.; Petersen, B.; Eriksen, R.B.; Hammershøj, M.; Mortensen, E.; Jensen, J.P.; Have, A. Does the impact of nutrients on the biological structure and function of brackish and freshwater lakes differ? Hydrobiologia 1994, 275, 15–30. [Google Scholar] [CrossRef]
- Moss, B. Brackish and freshwater shallow lakes-different systems or variations on the same theme? Hydrobiologia 1994, 275, 1–14. [Google Scholar]
- He, H.; Jeppesen, E.; Bruhn, D.; Yde, M.; Kjerulf Hansen, J.; Spanggaard, L.; Madsen, N.; Liu, W.; Søndergaard, M.; Lauridsen, T.L. Decadal changes in zooplankton biomass, composition and body mass in four temperate shallow brackish lakes subjected to various degrees of eutrophication. Inland Waters 2020, 10, 186–196. [Google Scholar] [CrossRef]
- Christensen, I.; Pedersen, L.K.; Søndergaard, M.; Lauridsen, T.L.; Tserenpil, S.; Richardson, K.; Amorim, C.A.; Pacheco, J.P.; Jeppesen, E. Impact of zooplankton grazing on phytoplankton in north temperate coastal lakes: Changes along gradients in salinity and nutrients. Hydrobiologia 2023, 1–18. [Google Scholar] [CrossRef]
- Wu, H.; Liao, M.; Guo, J.; Zhang, Y.; Liu, Q.; Li, Y. Diatom assemblage responses to multiple environmental stressors in a deep brackish plateau lake, SW China. Environ. Sci. Pollut. Res. 2022, 29, 33117–33129. [Google Scholar] [CrossRef] [PubMed]
- Mortensen, E.; Jeppesen, E.; Søndergaard, M.; Kamp Nielsen, L. (Eds.) Nutrient Dynamics and Biological Structure in Shallow Freshwater and Brackish Lakes; Springer: Dordrecht, The Netherlands, 1994; Volume 94, p. 507. [Google Scholar]
- Alprol, A.E.; Ashour, M.; Mansour, A.T.; Alzahrani, O.M.; Mahmoud, S.F.; Gharib, S.M. Assessment of water quality and phytoplankton structure of eight Alexandria beaches, southeastern Mediterranean Sea, Egypt. J. Mar. Sci. Eng. 2021, 9, 1328. [Google Scholar] [CrossRef]
- Smith, V.H.; Tilman, G.D.; Nekola, J.C. Eutrophication: Impacts of excess nutrient inputs on freshwater, marine, and terrestrial ecosystems. Environ. Pollut. 1999, 100, 179–196. [Google Scholar] [CrossRef]
- Scheffer, M.; Carpenter, S.; Foley, J.A.; Folke, C.; Walker, B. Catastrophic shifts in ecosystems. Nature 2001, 413, 591–596. [Google Scholar] [CrossRef]
- Davidson, T.A.; Sayer, C.D.; Jeppesen, E.; Søndergaard, M.; Lauridsen, T.L.; Johansson, L.S.; Baker, A.; Graeber, D. Bimodality and alternative equilibria do not help explain long-term patterns in shallow lake chlorophyll-a. Nat. Commun. 2023, 14, 398. [Google Scholar] [CrossRef] [PubMed]
- Feike, M.; Heerkloss, R. Long-term stability of the seasonal succession of different zooplankton species in a brackish water lagoon (southern Baltic Sea). Hydrobiologia 2008, 611, 17–28. [Google Scholar] [CrossRef]
- Ringkjøbing Amtskommune. Kilen. Tilstand 1972–1986 samt Udviklingsmuligheder. Ringkjøbning Amtskommune, Teknik-og Miljøforvaltningen, Recipientafdelingen; Ringkjøbing Amtskommune: Ringkobing, Denmark, 1988; p. 26. (In Danish) [Google Scholar]
- Jeppesen, E.; Johansson, L.S.; Bøgestrand, J.; Tserenpil, S. Kilen. Report to Struer Kommune; Ringkjøbing Amtskommune: Ringkobing, Denmark, 2019; p. 33. (In Danish) [Google Scholar]
- Mills, K.; Schillereff, D.; Saulnier-Talbot, E.; Gell, P.; Anderson, N.J.; Arnaud, F.; Dong, X.; Jones, M.; McGowan, S.; Massaferro, J.; et al. Deciphering long-term records of natural variability and human impact as recorded in lake sediments: A palaeolimnological puzzle. WIREs Water 2017, 4, e1404. [Google Scholar] [CrossRef] [Green Version]
- Juggins, S. Quantitative reconstructions in palaeolimnology: New paradigm or sick science? Quat. Sci. Rev. 2013, 64, 20–32. [Google Scholar] [CrossRef]
- Anderson, N.J. Miniview: Diatoms, temperature and climatic change. Eur. J. Phycol. 2000, 35, 307–314. [Google Scholar] [CrossRef]
- Telford, R.J.; Birks, H.J.B. The secret assumption of transfer functions: Problems with spatial autocorrelation in evaluating model performance. Quat. Sci. Rev. 2005, 24, 2173–2179. [Google Scholar] [CrossRef]
- Jeppesen, E.; Canfield, D.E.; Bachmann, R.W.; Søndergaard, M.; Havens, K.E.; Johansson, L.S.; Lauridsen, T.L.; Tserenpil, S.; Rutter, R.P.; Warren, G.; et al. Toward predicting climate change effects on lakes: A comparison of 1656 shallow lakes from Florida and Denmark reveals substantial differences in nutrient dynamics, metabolism, trophic structure, and top-down control. Inland Waters 2020, 10, 197–211. [Google Scholar] [CrossRef]
- IPCC. Summary for Policymakers. In Climate Change 2021: The Physical Science Basis. Contribution of Working Group I to the Sixth Assessment Report of the Intergovernmental Panel on Climate Change; Masson-Delmotte, V., Zhai, P., Pirani, A., Connors, S.L., Péan, C., Berger, S., Caud, N., Chen, Y., Goldfarb, L., Gomis, M.I., et al., Eds.; Cambridge University Press: Cambridge, UK; New York, NY, USA, 2021; pp. 3–32. [Google Scholar]
- Windolf, J.; Jeppesen, E.; Jensen, J.P.; Kristensen, P. Modelling of seasonal variation in nitrogen retention and in-lake concentration: A four-year mass balance study in 16 shallow Danish lakes. Biogeochemistry 1996, 33, 25–44. [Google Scholar] [CrossRef]
- Lewis, J.P.; Ryves, D.B.; Rasmussen, P.; Knudsen, K.L.; Petersen, K.S.; Olsen, J.; Leng, M.J.; Kristensen, P.; McGowan, S.; Phillipsen, B. Environmental change in the Limfjord, Denmark (ca 7500–1500 cal yrs BP): A multiproxy study. Quat. Sci. Rev. 2013, 78, 126–140. [Google Scholar] [CrossRef] [Green Version]
- Miljøstyrelsen. Miljøtilstanden i Kilen 1989–2004; Miljøstyrelsen: Odense, Denmark, 2004. [Google Scholar]
- Renberg, I. The HON-Kajak sediment corer. J. Paleolimnol. 1991, 6, 167–170. [Google Scholar] [CrossRef]
- Appleby, P.G. Chronostratigraphic techniques in recent sediments. In Tracking Environmental Change Using Lake Sediments; Basin analysis, coring and chronological techniques; Last, W.M., Smol, J.P., Eds.; Kluwer Academic Publishers: Dordrecht, The Netherlands, 2001; Volume 1, pp. 171–203. [Google Scholar]
- Dean, W.E. Determination of carbonate and organic-matter in calcareous sediments and sedimentary-rocks by loss on ignition-comparison with other methods. J. Sediment. Petrol. 1974, 44, 242–248. [Google Scholar]
- Heiri, O.; Lotter, A.F.; Lemcke, G. Loss on ignition as a method for estimating organic and carbonate content in sediments: Reproducibility and comparability of results. J. Paleolimnol. 2001, 25, 101–110. [Google Scholar] [CrossRef]
- Renberg, I. A procedure for preparing large sets of diatom slides from sediment cores. J. Paleolimnol. 1990, 4, 87–90. [Google Scholar] [CrossRef]
- Battarbee, R.W.; Carvalho, L.; Jones, V.J.; Flower, R.J.; Cameron, N.G.; Bennion, H.; Juggins, S. Diatoms. In Tracking Environmental Change Using Lake Sediments; Terrestrial, Algal, and Siliceous Indicators; Smol, J.P., Birks, H.J.B., Last, W.M., Smol, J.P., Eds.; Developments in Paleoenvironmental Research; Kluwer Academic Publishers: Dordrecht, The Netherlands, 2001; Volume 3, pp. 155–202. [Google Scholar]
- Battarbee, R.W.; Kneen, M.J. The use of electronically counted microspheres in absolute diatom analysis. Limnol. Oceanogr. 1982, 27, 184–188. [Google Scholar] [CrossRef]
- Bennett, K.D. Psimpoll. 2003–2009. Available online: http://www.chrono.qub.ac.uk/psimpoll/psimpoll.html (accessed on 3 March 2023).
- Lewis, J.P. Holocene Environmental Change in Coastal Denmark: Interactions between Land, Sea and Society; Loughborough University: Loughborough, UK, 2011. [Google Scholar]
- Lewis, J.P.; Ryves, D.B.; Rasmussen, P.; Olsen, J.; van der Sluis, L.G.; Reimer, P.J.; Knudsen, K.-L.; McGowan, S.; Anderson, N.J.; Juggins, S. Marine resource abundance drove pre-agricultural population increase in Stone Age Scandinavia. Nat. Commun. 2020, 11, 2006. [Google Scholar] [CrossRef] [PubMed] [Green Version]
- Andrén, E.; Clarke, A.L.; Telford, R.J.; Wesckström, K.; Vilbaste, S.; Aigars, J.; Conley, D.; Johnsen, T.; Juggins, S.; Korhola, A. Defining reference conditions for coastal areas in the Baltic Sea. TemaNord 2007, 583, 81. [Google Scholar]
- Juggins, S. C2 Data Analysis, Version 1.6.2; Newcastle University: Newcastle, UK, 2014; Available online: https://www.staff.ncl.ac.uk/stephen.juggins/software/C2Home.htm (accessed on 2 January 2020).
- Telford, R.J.; Birks, H.J.B. Evaluation of transfer functions in spatially structured environments. Quat. Sci. Rev. 2009, 28, 1309–1316. [Google Scholar] [CrossRef]
- Juggins, S.; Birks, H.J.B. Chapter 14: Quanitative environmental reconstructions from biological data. In Tracking Environmental Change in Lake Sediments; Data handling and numerical techniques; Birks, H.J.B., Lotter, A.F., Juggins, S., Smol, J.P., Eds.; Kluwer Academic Publishers: Dordrecht, The Netherlands, 2012; Volume 5, pp. 431–494. [Google Scholar]
- Warnock, J.; Andrén, E.; Juggins, S.; Lewis, J.P.; Ryves, D.B.; Weckström, K. A high-resolution diatom-based Middle and Late Holocene environmental history of the Little Belt region, Baltic Sea. Boreas 2020, 49, 1–16. [Google Scholar] [CrossRef]
- Lewis, J.P.; Ryves, D.B.; Rasmussen, P.; Olsen, J.; Knudsen, K.-L.; Andersen, S.H.; Weckström, K.; Clarke, A.L.; Andrén, E.; Juggins, S. The shellfish enigma across the Mesolithic-Neolithic transition in southern Scandinavia. Quat. Sci. Rev. 2016, 151, 315–320. [Google Scholar] [CrossRef] [Green Version]
- Kronvang, B.; Ærtebjerg, G.; Grant, R.; Kristensen, P.; Hovmand, M.; Kirkegaard, J. Nationwide monitoring of nutrients and their ecological effects: State of the Danish aquatic environment. Ambio 1993, 22, 176–187. [Google Scholar]
- Kronvang, B.; Jeppesen, E.; Conley, D.J.; Søndergaard, M.; Larsen, S.E.; Ovesen, N.B.; Carstensen, J. Nutrient pressures and ecological responses to nutrient loading reductions in Danish streams, lakes and coastal waters. J. Hydrol. 2005, 304, 274–288. [Google Scholar] [CrossRef]
- Jeppesen, E.; Søndergaard, M.; Jensen, J.P.; Havens, K.E.; Anneville, O.; Carvalho, L.; Coveney, M.F.; Deneke, R.; Dokulil, M.T.; Foy, B.; et al. Lake responses to reduced nutrient loading—An analysis of contemporary long-term data from 35 case studies. Freshw. Biol. 2005, 50, 1747–1771. [Google Scholar] [CrossRef]
- Anderson, N.J.; Bennion, H.; Lotter, A.F. Lake eutrophication and its implications for organic carbon sequestration in Europe. Glob. Chang. Biol. 2014, 20, 2741–2751. [Google Scholar] [CrossRef] [Green Version]
- Clarke, A.; Juggins, S.; Conley, D. A 150-yr reconstruction of the history of coastal eutrophication in Roskilde Fjord, Denmark. Mar. Pollut. Bull. 2003, 46, 1615–1629. [Google Scholar] [CrossRef]
- Weckström, K.; Juggins, S.; Korhola, A. Quantifying background nutrient concentrations in coastal waters: A case study from an urban embayment of the Baltic Sea. Ambio 2004, 33, 324–327. [Google Scholar] [CrossRef]
- Weckström, K. Assessing recent eutrophication in coastal waters of the Gulf of Finland (Baltic Sea) using subfossil diatoms. J. Paleolimnol. 2006, 35, 571–592. [Google Scholar] [CrossRef]
- Håkansson, H. Cyclotella striata complex: Typification and new combinations. Diatom Res. 1996, 11, 241–260. [Google Scholar] [CrossRef]
- Prasad, A.K.S.K.; Nienow, J.A.; Livingston, R.J. The Genus Cyclotella (Bacillariophyta) in Choctawhatchee Bay, Florida, with Special Reference to C. Striata and C. Choctawhatcheeana sp.-nov. Phycologia 1990, 29, 418–436. [Google Scholar] [CrossRef]
- Ryves, D.B.; Clarke, A.L.; Appleby, P.G.; Amsinck, S.L.; Jeppesen, E.; Landkildehus, F.; Anderson, N.J. Reconstructing the salinity and environment of the Limfjord and Vejlerne Nature Reserve, Denmark, using a diatom model for brackish lakes and fjords. Can. J. Fish. Aquat. Sci. 2004, 61, 1988–2006. [Google Scholar] [CrossRef] [Green Version]
- Cooper, S. Chesapeake Bay watershed historical land use: Impact on water quality and diatom communities. Ecol. Appl. 1995, 5, 702–723. [Google Scholar] [CrossRef]
- Andrén, E. Changes in the composition of the diatom flora during the last century indicate increased eutrophication of the Oder estuary, south-western Baltic Sea. Estuar. Coast. Shelf Sci. 1999, 48, 665–676. [Google Scholar] [CrossRef]
- Rines, J.E.B.; Hargraves, P.E. The Chaetoceros Ehrenberg (Bacillariophyceae) Flora of Narragansett Bay, Rhode Island, U.S.A.; J. Crammer: Berlin/Stuttgart, Germany, 1988; Volume 79, p. 196. [Google Scholar]
- Conley, D.J.; Kaas, H.; Mohlenberg, F.; Rasmussen, B.; Windolf, J. Characteristics of Danish estuaries. Estuaries 2000, 23, 820–837. [Google Scholar] [CrossRef]
- Carstensen, J.; Conley, D.J.; Andersen, J.H.; Ærtebjerg, G. Coastal eutrophication and trend reversal: A Danish case study. Limnol. Oceanogr. 2006, 51, 398–408. [Google Scholar] [CrossRef] [Green Version]
- Sabbe, K.; Vyverman, W. Taxonomy, morphology and ecology of some widespread representatives of the diatom genus Opephora. Eur. J. Phycol. 1995, 30, 235–249. [Google Scholar] [CrossRef] [Green Version]
- Fishcon APS. Kilen-Miljø ved Ferskvand Eller Saltvand; Fishcon APS: Wädenswil, Switzerland, 2004. (In Danish) [Google Scholar]


| Period (Average) | Sewage and Rainwater | Fish Ponds | Scattered Villages | Open Land (Diffuse Sources) | Atmospheric Deposition | Total Input from Catchment | |
|---|---|---|---|---|---|---|---|
| TP (kg y−1) | 1989–1993 | 224 (8) | 936 (34) | 309 (11) | 1204 (44) | 50 (2) | 2723 (100) |
| 1993–2001 | 52 (3) | 344 (18) | 70 (4) | 1386 (73) | 50 (2) | 1902 (100) | |
| TN (kg y−1) | 1989–2003 | 621 (0.5) | 7325 (6) | 906 (0.8) | 101,945 (87) | 6680 (6) | 117,477 (100) |
| 2001–2005 | 196 (0.2) | 3202 (4) | 302 (0.3) | 74,240 (88) | 6680 (8) | 84,620 (100) |
| Taxa | 2004 | 2007 | 2010 | 2016 |
|---|---|---|---|---|
| Enteromorpha sp. | X | X | ||
| Potamogeton crispus | X | X | X | |
| Potamogeton pectinatus | X | X | X | X |
| Potamogeton perfoliatus | X | X | X | X |
| Potamogeton berchtoldii | X | |||
| Ranunculus peltatus ssp. baudotii | X | |||
| Ruppia cirrhosa | X | |||
| Ruppia maritima | X | |||
| Zannichellia palustris var. major | X | X | X | X |
| Zannichellia palustris var. repens | X | |||
| Batrachium sp. | X | X | ||
| Chara sp. | X | X |
Disclaimer/Publisher’s Note: The statements, opinions and data contained in all publications are solely those of the individual author(s) and contributor(s) and not of MDPI and/or the editor(s). MDPI and/or the editor(s) disclaim responsibility for any injury to people or property resulting from any ideas, methods, instructions or products referred to in the content. |
© 2023 by the authors. Licensee MDPI, Basel, Switzerland. This article is an open access article distributed under the terms and conditions of the Creative Commons Attribution (CC BY) license (https://creativecommons.org/licenses/by/4.0/).
Share and Cite
Lewis, J.P.; Ryves, D.B.; Søndergaard, M.; Lauridsen, T.L.; Johansson, L.S.; Tserenpil, S.; Rasmussen, P.; Jeppesen, E. Nutrients and Saltwater Exchange as Drivers of Environmental Change in a Danish Brackish Coastal Lake over the Past 100 Years. Water 2023, 15, 1116. https://doi.org/10.3390/w15061116
Lewis JP, Ryves DB, Søndergaard M, Lauridsen TL, Johansson LS, Tserenpil S, Rasmussen P, Jeppesen E. Nutrients and Saltwater Exchange as Drivers of Environmental Change in a Danish Brackish Coastal Lake over the Past 100 Years. Water. 2023; 15(6):1116. https://doi.org/10.3390/w15061116
Chicago/Turabian StyleLewis, Jonathan P., David B. Ryves, Martin Søndergaard, Torben Linding Lauridsen, Lisolette Sander Johansson, Sh. Tserenpil, Peter Rasmussen, and Erik Jeppesen. 2023. "Nutrients and Saltwater Exchange as Drivers of Environmental Change in a Danish Brackish Coastal Lake over the Past 100 Years" Water 15, no. 6: 1116. https://doi.org/10.3390/w15061116