Article

Environmental Sustainability of Water Resources in Coastal Aquifers, Case Study: El-Qaa Plain, South Sinai, Egypt

by
Hossam H. Elewa
1,
Ahmed M. Nosair
2,
Martina Zelenakova
3,*,
Viktoria Mikita
4,
Nermeen A. Abdel Moneam
1 and
Elsayed M. Ramadan
5
1
Water Resources Department, Engineering Applications and Water Division, National Authority for Remote Sensing & Space Sciences (NARSS), Cairo 11843, Egypt
2
Environmental Geophysics Lab. (ZEGL), Geology Department, Faculty of Science, Zagazig University, Zagazig 44519, Egypt
3
Department of Environmental Engineering, Faculty of Civil Engineering, Technical University of Kosice, 04200 Kosice, Slovakia
4
Faculty of Earth Science, University of Miskolc, 3515 Miskolc, Hungary
5
Water and Water Structures Engineering Department, Faculty of Engineering, Zagazig University (ZU), Zagazig 44519, Egypt
*
Author to whom correspondence should be addressed.
Water 2023, 15(6), 1118; https://doi.org/10.3390/w15061118
Submission received: 21 January 2023 / Revised: 26 February 2023 / Accepted: 2 March 2023 / Published: 14 March 2023
(This article belongs to the Special Issue Assessment and Management of Hydrological Risks Due to Climate Change)

Abstract

:
Water resources management is a vital need in arid and semi-arid regions such as Sinai Peninsula, Egypt. Accordingly, the sustainability of water resources in this arid environment should be examined in terms of the possibility of groundwater recharge, particularly through runoff water, while identifying the most appropriate potential sites for drilling new water wells to cover current and future needs. The aquifer system of El-Qaa Plain in South Sinai is considered one of the structural basins associated with the tectonic setting of the Gulf of Suez. It is the main source of high-quality water in South Sinai. The present work provided an integration of mathematical flow modeling, hydrochemical composition, environmental isotopic signature, watershed modeling system (WMS), and remote sensing (RS) tools to determine the aquifer sustainability and recharge mechanisms. The obtained results indicated the following: (a) the salinity of the water ranged between 326.4 and 2261 ppm, while the environmental isotope values ranged between −6.28 to −4.48‰ for δ18O and −29.87 to −21.7‰ for δ2H, which reveals the phase of recharge and mixing between ancient water and recent rainwater; (b) sites for three dams in three sub-watersheds were proposed to harvest approximately 790,000 m3/y of runoff water to enhance groundwater recharge of the aquifer system; (c) and five scenarios using MODFLOW indicated that water drawdown is acceptable by adding 10 new production wells (discharge rate increased by 3600 m3/day). Moreover, increasing the recharge rate by 2% from the base case, leads to an increase in the piezometric water level with an average value of 0.13 masl, which reflects the positive effects of the proposed runoff water harvesting facilities. The integration applied in this work represents an integrated management system for water resources (surface and groundwater) which is suitable for application in arid or semi-arid coastal and similar areas.

1. Introduction

Water scarcity is a global issue, especially in arid and semi-arid regions. Consequently, sustainable management of water resources can be maintained by maximizing the utilization of surface water and groundwater in these regions [1]. The global documentation of groundwater depletion compared with the natural renewal and the supply need to support ecosystems, led to a vital need to study the possibility of enhancing recharge possibilities [2]. Overpopulation, high urbanization, anthropogenic activities, and unplanned use of groundwater are the main factors for water shortage [3,4]. Management and sustainability of groundwater resources under variable hydrogeological conditions are studied globally by many researchers (i.e., [5,6,7,8,9]). Located in the arid and semi-arid belt of Egypt, the Sinai Peninsula is increasingly suffering from scarcity of water resources. Sinai Peninsula is one of the important developmental areas of Egypt. It is one of the target areas of the Egyptian national development plan 2023. Consequently, additional fresh water quantities are required to fulfill the needs of these developmental activities. Therefore, the water resources in the Sinai Peninsula require updated plans to sustain and conserve fresh water for various purposes [10]. The groundwater reserves in the Peninsula are limited and are represented by the Miocene–Quaternary sediments, Eocene fissured limestones, Mesozoic Jurassic and Cretaceous sandstones, Paleozoic sandstones, and crystalline fractured basement rocks [11]. These aquifers are distributed in different parts of the peninsula, in different watersheds, and at coastal areas. Hundreds of groundwater wells were drilled in these aquifers at shallow and deep depths. These aquifers provide many parts of the Peninsula with fresh water for drinking and agricultural purposes [11]. The management of the aquifer in terms of improving the recharge mechanism and controlling the withdrawal scenarios has become an urgent need for the development of the aquifer, keeping pace with the requirements and overcoming the problem of water scarcity. The coastal aquifer in El-Qaa Plain region is considered one of most promising groundwater units in South Sinai (Figure 1). It supplies fresh water to many cities in South Sinai, in addition to irrigation water for many modern agricultural activities. The El-Qaa Plain area is considered a vital area in South Sinai suitable for agricultural development, yet it is frequently exposed to natural hazards, especially flash floods [11,12,13,14,15]. Water resources in El-Qaa Plain were addressed based on different research tools (i.e., [16,17,18,19,20]). According to the results obtained from these previous studies, there is a gap in understanding the sustainability of the El-Qaa Plain coastal aquifer under continuous and increasing pumping process to keep pace with the recent development activities of land reclamation. Consequently, the El-Qaa Plain region needs more studies of the recharge mechanisms and discharge (withdrawal) scenarios. Accordingly, the current work aims to study the recharge mechanisms of the aquifer, and the current withdrawal operations using mathematical simulations to assess productivity of the aquifer, in addition to studying the different operating scenarios of water wells and flow systems with reference to the increased recharge rate, which is expected to occur after the application of runoff water harvesting (RWH) techniques. These goals are achieved through the integration of interdisciplinary approaches from hydrochemical, isotope signature, mathematical flow modeling (MODFLOW), watershed modeling system (WMS), remote sensing (RS), and geographic information systems (GISs). Isotope signature and hydrochemistry are vital tools in determining the recent recharge potential of groundwater aquifers [20,21,22]. Understanding and quantification of the recharge process is significant for protection and sustainable management of the groundwater resources, especially in arid regions [23,24,25]. WMS, RS, and GIS are very effective in defining and analyzing watershed hydro-morphometric characteristics and RWH capabilities [10,18,19,26,27]; MODFLOW is an important mathematical flow model that quantifies discharge rates and the change in drawdown with the expected excess discharge of groundwater. It is widely used in water resources management and planning purposes [28,29]. The applied integration is useful in understanding the recharge mechanism and groundwater sustainability in coastal and rift aquifer systems. This research ensemble is an example to be replicated in other similar coastal areas of the world, especially where data scarcity is an overwhelming problem. All research tools were integrated to fulfill the article’s objective.

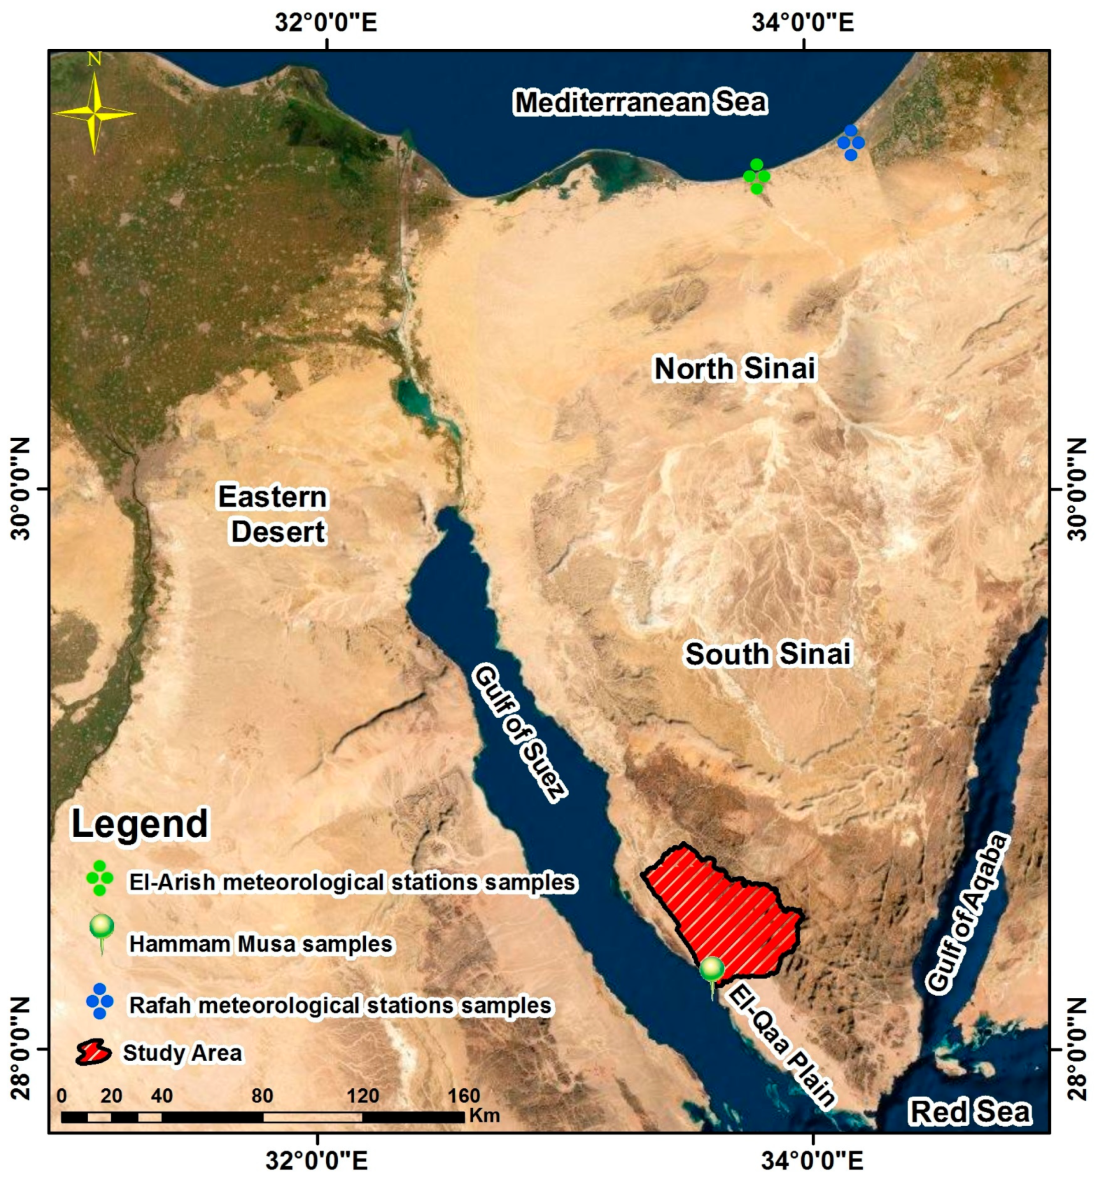
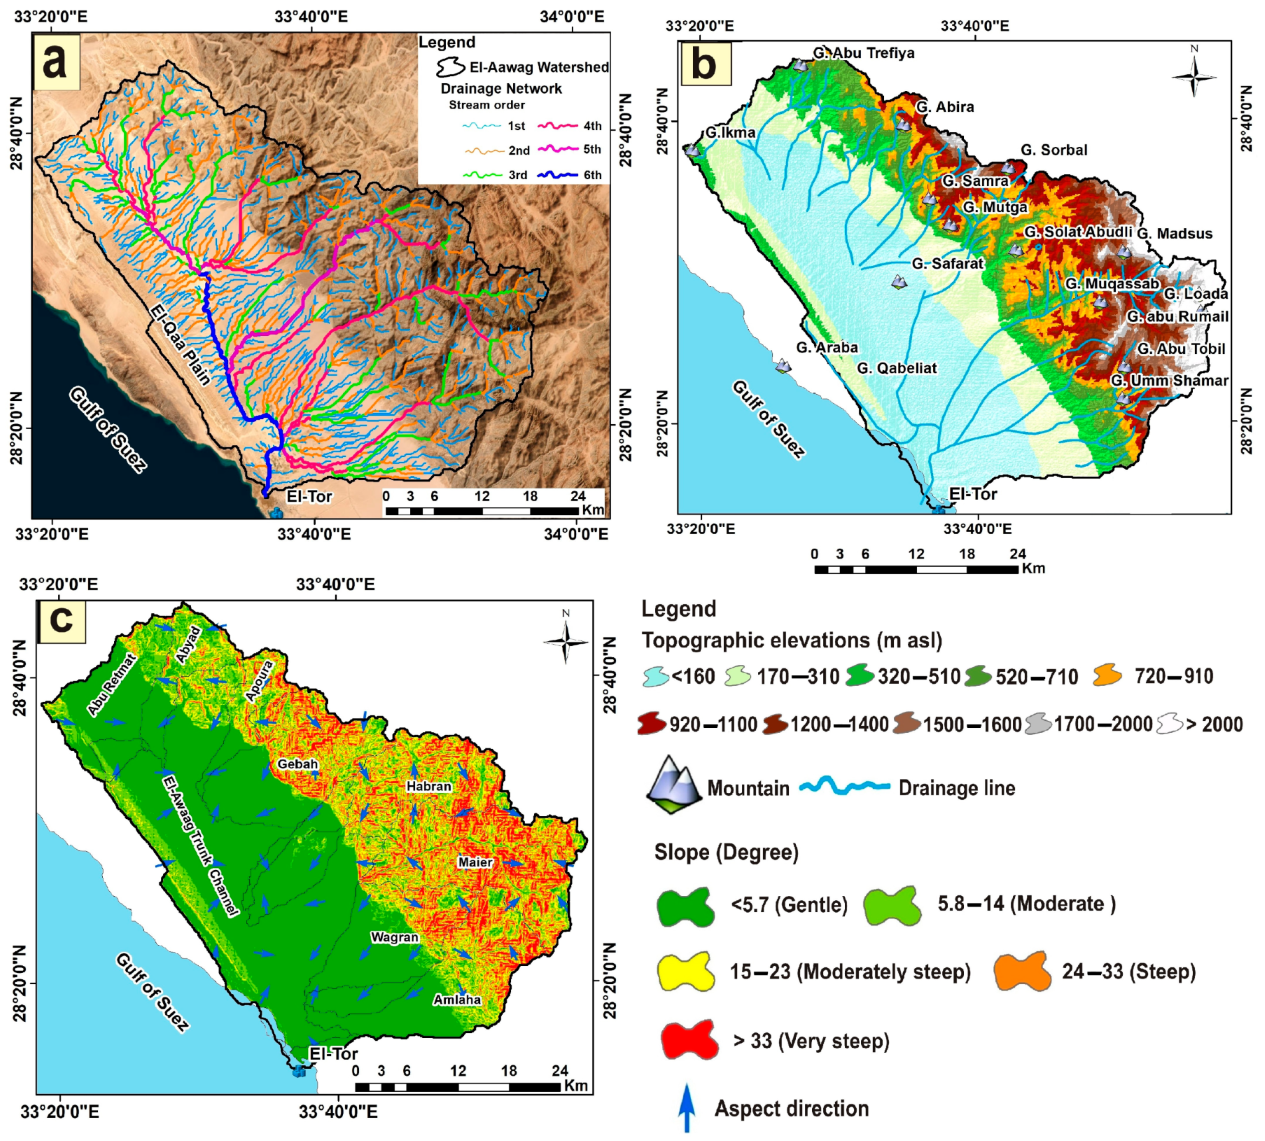
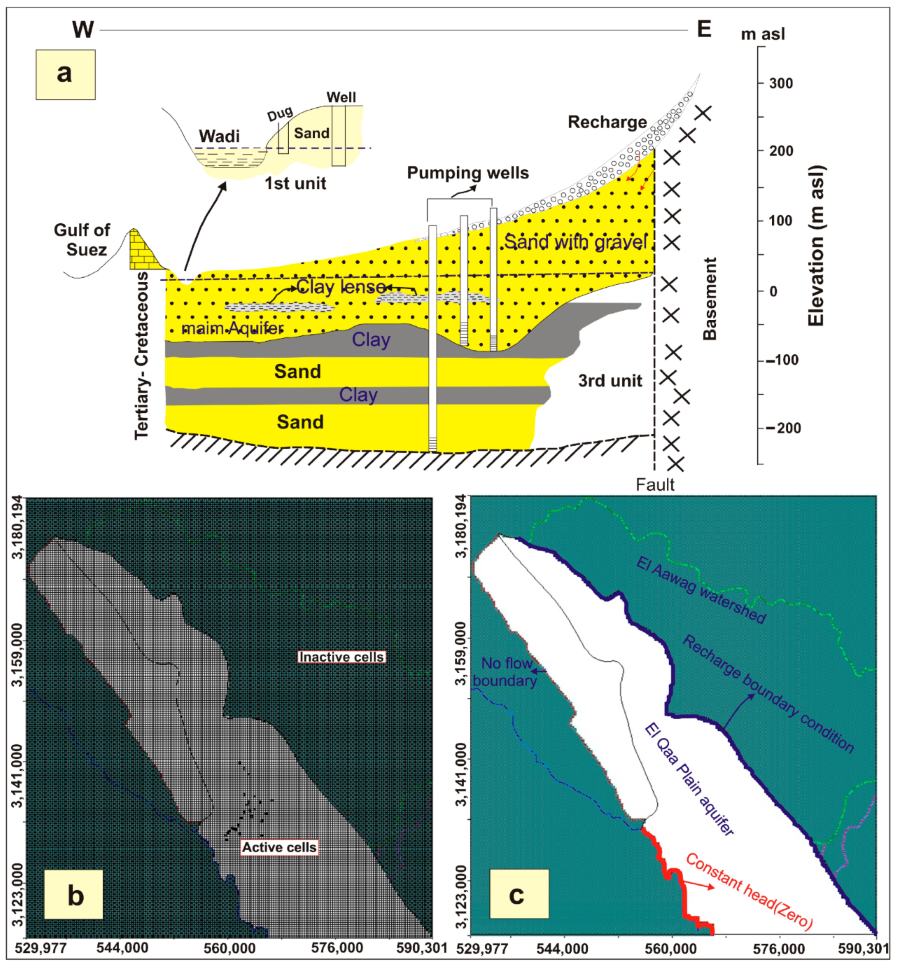
2. Site Description and Hydrogeological Setting of El-Qaa Plain Aquifer System
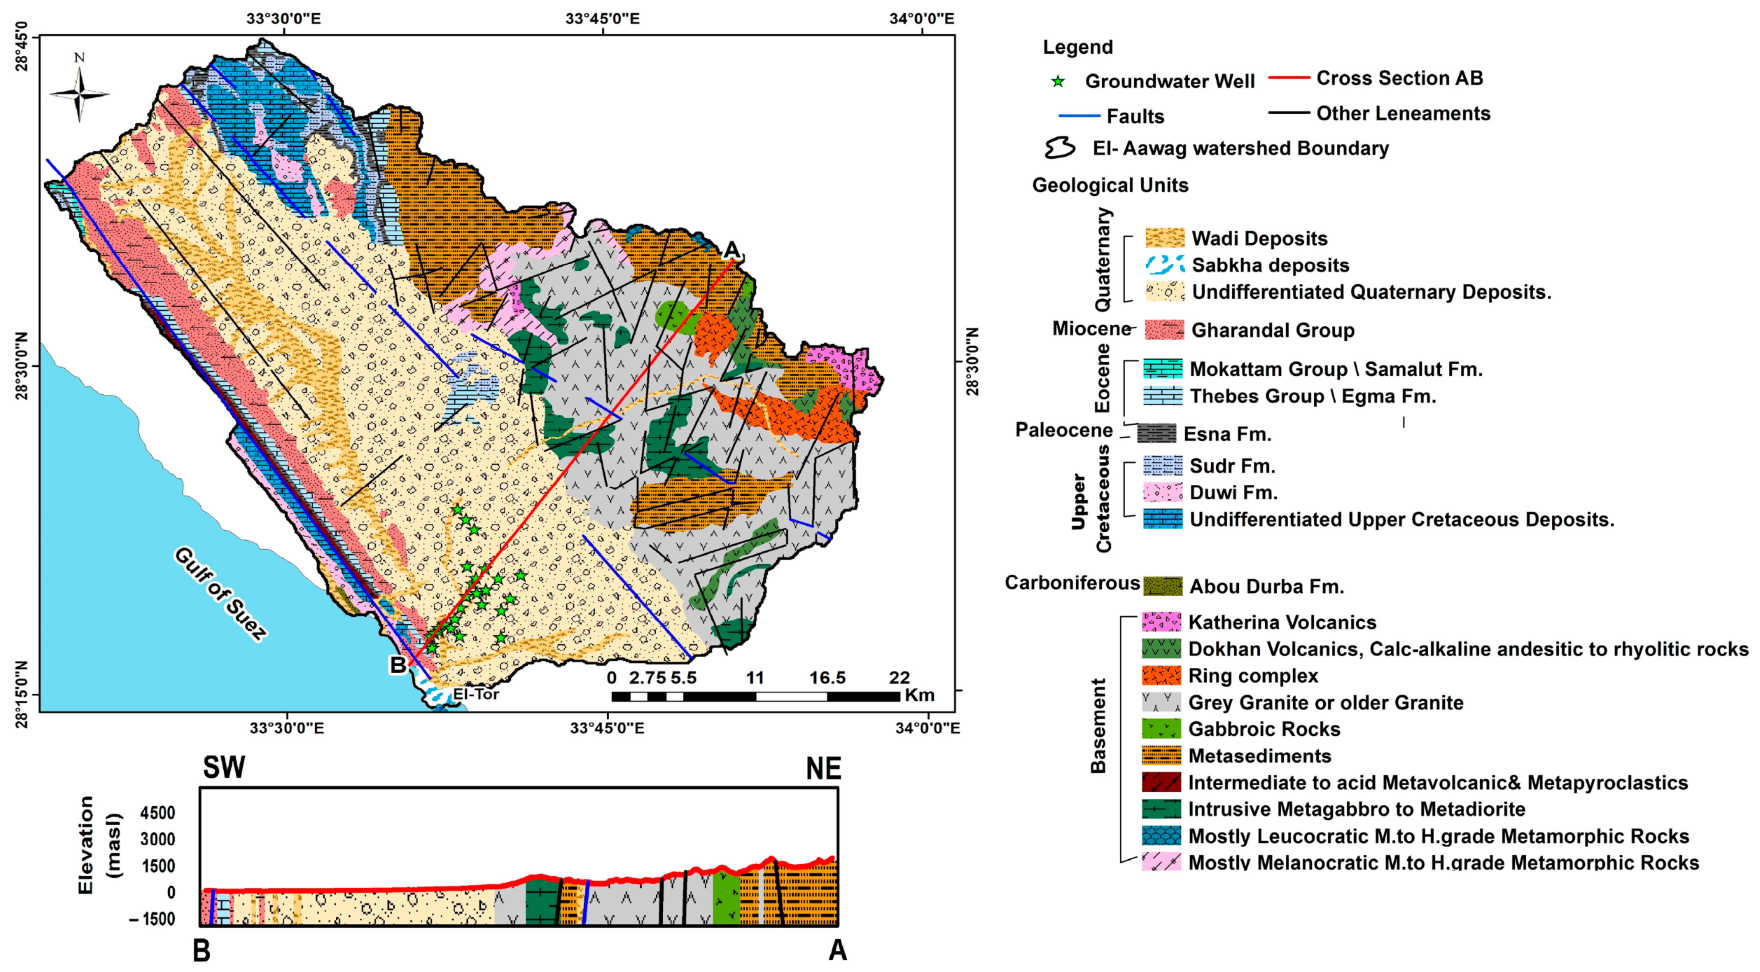
El-Qaa Plain is an oblong alluvial fan of many eastern watersheds that is a major recharge source for the aquifer [30,31]. The El-Qaa Plain aquifer system is structurally described as a semi-graben of NW–SE direction, and it makes the eastern boundary of the Gulf of Suez rift [12,13] (Figure 2). El-Qaa Plain is bounded on the east by Precambrian basement rocks and on the west by the Gulf of Suez. It is a longitudinal plain that runs parallel to the Gulf of Suez and is considered an outlet for many watersheds in which runoff waters and sediments of El-Aawag, Esla, and Thoman watersheds flow into it. It occupies an area of about 3500 km² and is considered a promising area for planning land uses and agricultural activities, as it has a long coastline (about 180 km) with suitable low surface soil of sand and gravels, which differ significantly from the high mountainous hard rocks adjacent to South Sinai (Figure 2).
The groundwater production area is located at the downstream of El-Aawag watershed, which is considered one of the largest basins in the drainage system of the Gulf of Suez. Accordingly, the El-Aawag watershed was considered as a study area to implement the research objectives (Figure 1). It has an area of about 1960.75 km2. The main channel of Wadi El-Aawag watershed extends generally from north–northeast to southwest for about 58 km according to with the major geological structures and rock contacts, reaching the 6th order (Figure 2a). Its topographic heights range from 5 masl on the western side, which is occupied by the El-Qaa Plain area, to high mountains of 2614 masl on the eastern side, which are represented by the elevated hard rocks of South Sinai (Figure 2b). Generally, topographic elevations decreased in the westward direction. Wadi El-Aawag consists of twelve sub-watersheds where the slopes range from gentle slopes to steep slopes (Figure 2c). The steep slopes are represented by the eastern parts, while the gentle slopes are occupied by the western side of the watershed. The drainage lines of these sub-watersheds are mainly starting from the mountainous area towards the El-Qaa Plain and eventually towards the Gulf of Suez. El-Aawag Trunk Channel sub-watershed constitutes the main land suitable for agriculture in Wadi El-Aawag watershed and South Sinai, as it is part of El-Qaa Plain (Figure 2c). It is represented by suitable soils for agriculture in this plain, especially where profitable groundwater reserves occur in it [32]. The aquifer of El-Qaa Plain contains thick sediments of sand and gravel with intercalations of clay and silt, and has recent recharge from runoff water. In addition, the aquifer has a hydraulic conductivity (K) of about 50 m/day and 43.1% effective porosity (Φ) with 40–50 km2 of water storage volume, and the water quality of the aquifer will deteriorate as a result of the over-pumping process within 45 years [16,17,18,19,20]).
The high mountain range in the eastern part of the study area plays an important role in the development of this coastal plain. A large number of wadi basins drain into the coastal plain, where they originate from these huge granite mountains that form part of the drainage system of the Gulf of Suez. These wadis were buried in the El-Qaa Plain during different cycles of sedimentation and heavy rains during the Quaternary era, becoming active during the rainy periods [33,34]. These basins transport sediments from the source rocks of the granitic mountains to the gravelly coastal plain. They also represent the main recharge source for the coastal aquifer, which is fed by seasonal floods [35].

3. Geologic Setting

Geologically, the W. El-Aawag watershed consists mostly of rocks that ranged from the Precambrian to the Quaternary (Figure 3). Quaternary sediments occupy mainly the El-Qaa Plain, which is a promising area for groundwater reserves. The Precambrian rocks varied between igneous and metamorphic rocks and extend mainly in the eastern side [36,37]. The northeastern part of the watershed is mainly covered by successions that range from Carboniferous to Miocene rocks (Figure 3). Structurally, the El-Qaa Plain is formed as a result of the fault of the tectonic structure of the Gulf of Suez and consists of sediments of the eroded rocks of great thickness [36]. These sediments cover various structures of horst, half grabens, and normal faults formed through tectonic faulting [20,38].

4. Materials and Methods

Water sustainability was conducted through in the El-Qaa Plain were conducted through an integrated methodology consisting of multiple field trips, sample collection, and analysis of these samples to achieve isotope analysis and hydrochemistry and then watershed modeling to verify aquifer recharge and aquifer simulation.

4.1. Site Investigations

Sampling was carried out for twenty-three active pumping and drilling wells representing the Quaternary aquifer system in the El-Qaa Plain region (Figure 4). Each well was pumped for ~30 min before sampling until stability in pH value was reached, then the sample was taken and poured into a clean 500 mL bottle and kept in an ice box. The collected water samples were sent to laboratories for chemical analysis for major cations and anions. The pH, total dissolved salts (TDSs), and electrical conductivity (EC) were measured in situ. Six water samples were selected from the total collected samples for the stable isotopic composition of Oxygen-18 (δ O18) and deuterium (D; δ 2H). The samples were analyzed at the Egyptian Atomic Energy Authority (EAEA). Accurate measurements of D and O18 in natural waters are almost always made by mass spectrometry [40].

4.2. Data Acquisition

Hydrogeological data (i.e., well depths, lithology, water levels, and discharge rates) were collected from previous published works, and unpublished groundwater well reports of the South Sinai Groundwater institute. In addition, the depth of the water level was measured in many of the observation wells and production wells.
The hydraulic parameters of the mathematical flow model were based on data collected from JICA [32], pumping test data for production wells, which tap the aquifer system, and data collected from the ‘‘Holding Co. for drinking water and wastewater of Southern Sinai branch’’ and data collected from ‘‘Water Resource Research Institute (WRRI), South Sinai branch’’, in addition to measurements made by the current working group. All these data were used as input parameters to construct the model.

4.3. Data Processing

Different data types were used through the present work form differnet sources as described in Table 1.

Remote Sensing, Watershed Modeling System (WMS) and Geographic Information System (GIS)

Landsat 7 and topographic maps were used for the identification of watersheds and sub-watersheds boundaries, and names. DEMs in WMS 8.1 © [41] were used to delineate watersheds and drainage system.
Table 1. Data types and sources.
Data TypeSource
Enhanced satellite imagery of the Landsat 7 Thematic Map Planner (ETM+)http://landsat7.usgs.gov. Accessed on 5 August 2022.
Systeme Probatoire d’Observation de la Terre (Spot 4)http://www.spotimage.com/web/en/3319-spot-6-and-spot-7 extending-spot-continuity-to-high-resolution-wide-swath-imagery.php. Accessed on 10 August 2022.
Digital elevation models (DEMs) (SRTM 90 m, ASTER 30 m resolution (bands 3N and 3B from the ASTER Level 1A dataset)http://lpdaac.usgs.gov/;https://lpdaac.usgs.gov/lpdaac/products/aster_products_table/on_demand/digital_elevation_model/v1/ast14dem). Accessed on 3 August 2022.
Sinai topographic maps (scales 1:250,000 and 1:100,000) 2 sheets.[42]; https://www.intercom.com.eg/home/insights/customers/defense-references/military-survey-department/ Accessed on 7 June 2022.

4.4. Runoff Calculation

The runoff of W. El-Aawag sub-watersheds was calculated by the method of [43]. Finkel [43] used his method for Wadi Araba, which has similar climatic conditions to the Sinai Peninsula. It is a simple graphical method for determining the probability and frequency of annual or seasonal rainfall. Annual precipitation in the El-Qaa Plain region averaged 10–50 mm/y, and reached 60 mm/y on the tops of the eastern basement rocks [14,44]. Frequent rainstorms in the study area are widely known for high-velocity flash floods [14].
The empirical Finkel method [43] uses the following parameters (Equations (1) and (2)):
Peak flood flow (Qmax)
Q max = K 1 A 0.67
where Qmax is the peak flood flow in cubic meters/sec.
Annual flood volume (v) in 1000 cubic meters
V = K 2 A 0.67
where A is the area of the basin in km2, and K1 and K2 are constants according to the probability of occurrence:
Probability of occurrence 10% in a given year:
K1 K2
1.58 26.5
We used 10% here because it is very suitable for development conditions and climate uncertainty.

4.5. Mathematical Groundwater Flow Model

A three-dimensional finite difference model was developed using MODFLOW [45] to simulate the aquifer in the study area. Several data (i.e., aquifer boundaries, groundwater levels, rock succession, well depth, aquifer water-bearing layers, discharge, and recharge rates) were used to build the model. Visual MODFLOW 3.1 [46] is the most complete and user-friendly modeling platform for practical 3D groundwater flow simulation. MODFLOW numerically solves the three-dimensional groundwater flow equation for porous media using the finite differential method. The partial differential equation for groundwater flow used in MODFLOW is the Equation (3):
t K x x h x + y K y y h y + z K z z h z + W = S s h t
where Kxx, Kyy, and Kzz are the values of hydraulic conductivity along the coordinates of the x-, y-, and z-axes, which are assumed to be parallel to the major axes of hydraulic conductivity (L/T); h is the piezometric head (L); W is the volumetric flux per unit volume representing sources and/or basin water, with W < 0.0 for flow out of the groundwater system, and W > 0.0 for flow in (T−1) (negative values are extractions, positive values are injections (T−1); SS is the specific storage of the porous material (L−1); t is time (T).
When groundwater flow equation is equalized along with the boundary and initial conditions, it describes the 3D transient groundwater flow in a homogeneous and anisotropic medium, provided that the principal axes of hydraulic conductivity are consistent with the coordinate directions. The groundwater flow process solves the groundwater flow equation using the finite-differential method, in which the groundwater flow system is divided into a grid of cells; for each cell, there is one point, called the node, at which head is calculated [45].

5. Results and Discussions

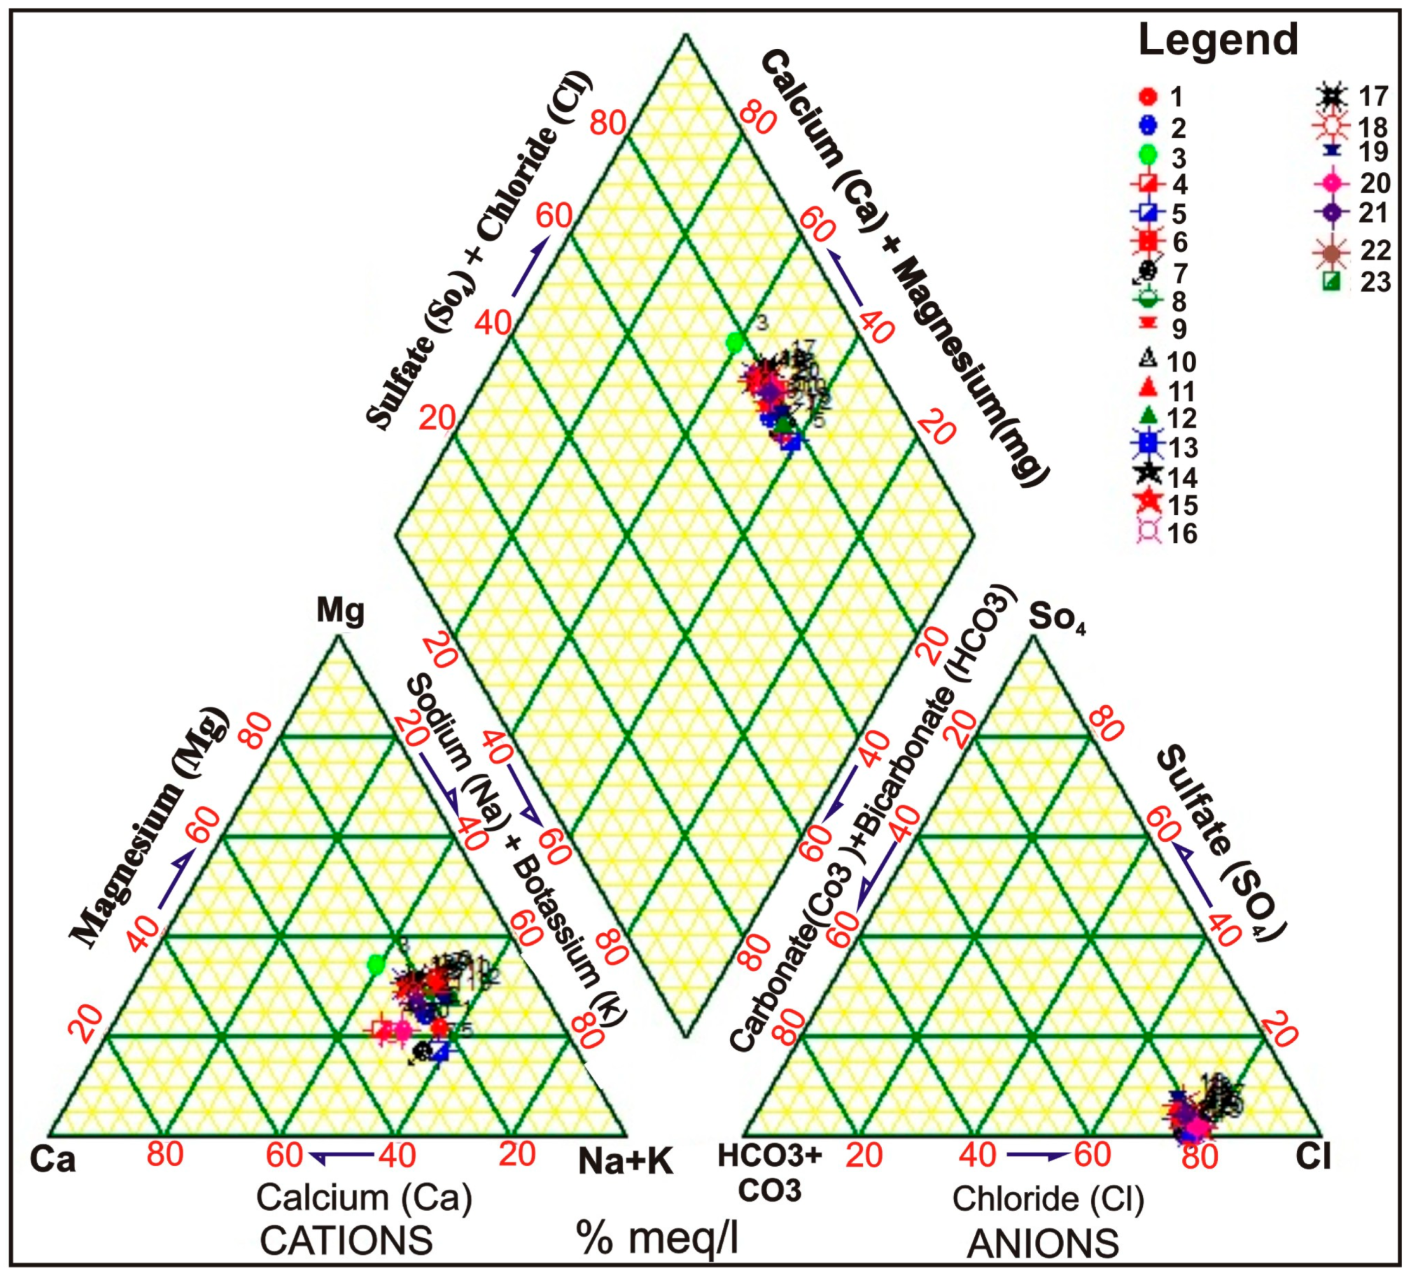
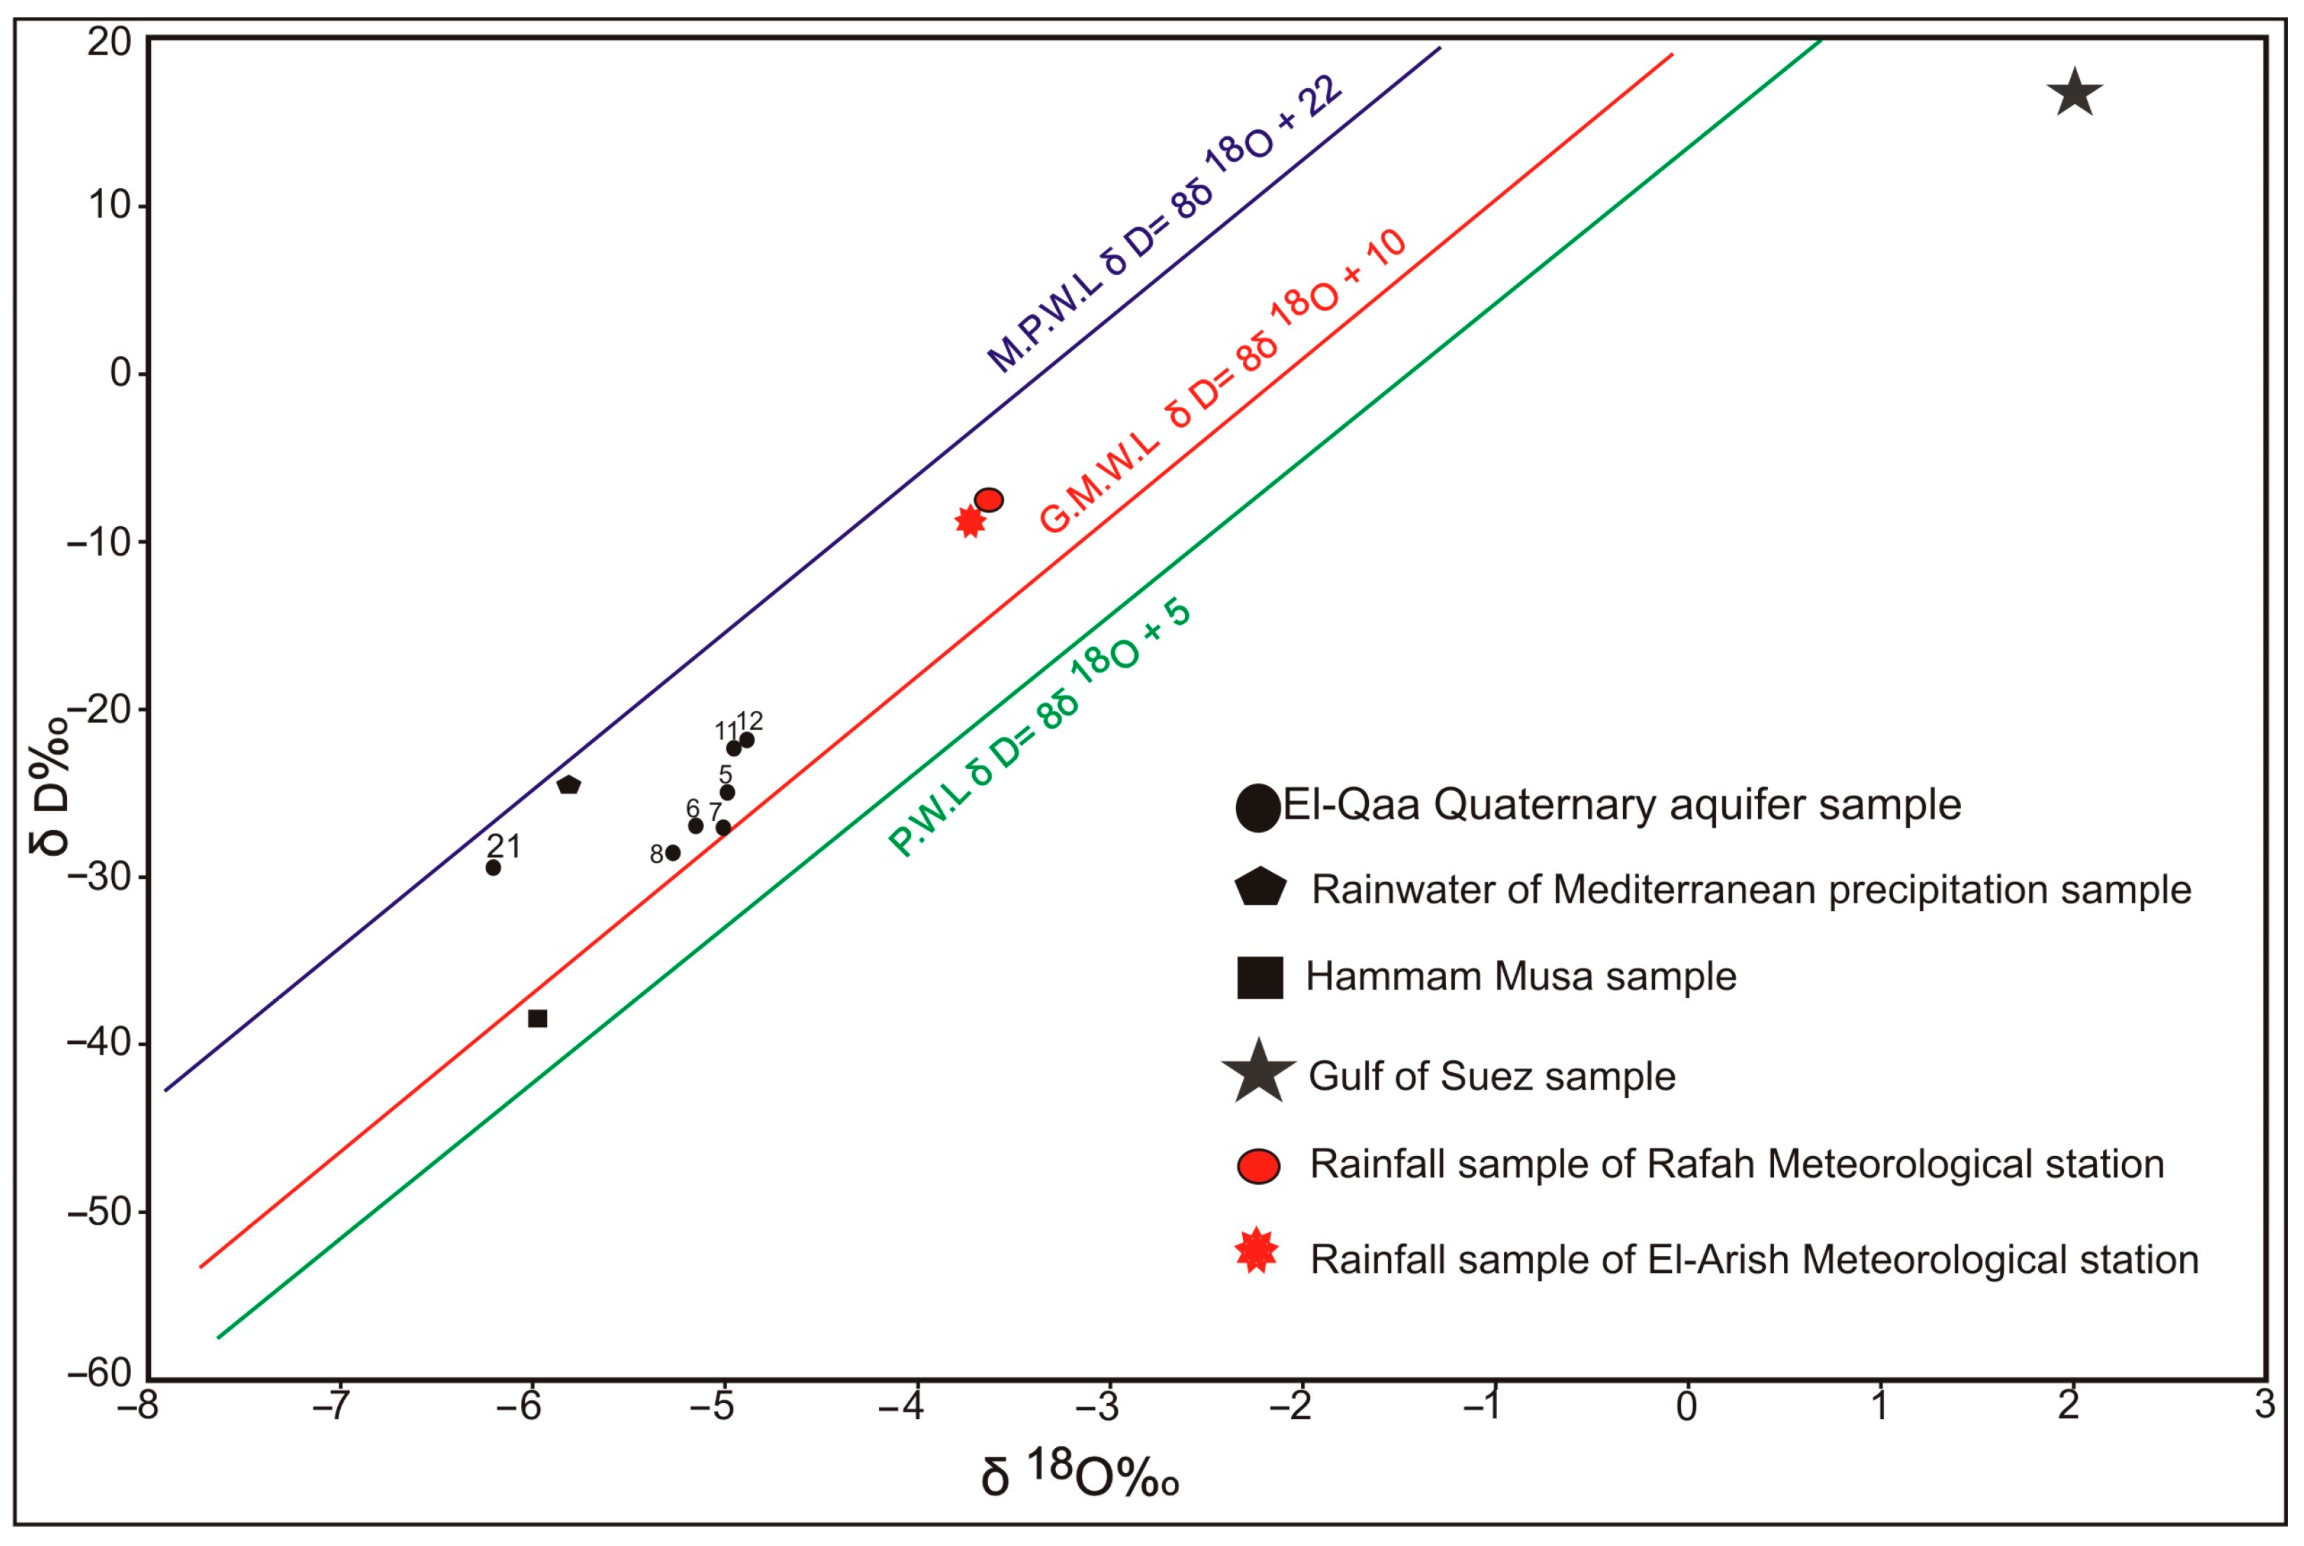
5.1. Hydrochemistry and Isotopes as Guides for Determining Groundwater Recharge Potential

An important question that should be asked frequently is “how sustainable are the water resources to cope with on-going or planned development activities?” In other words, are these water resources renewable or not? Accordingly, the source of groundwater in the El-Qaa Plain was verified using the “stable environmental isotopes” of Oxygen-18 (δO18) and deuterium (D; δ2H) and chemical composition. The isotopic ratios of hydrogen and oxygen are ideal tracing tools for the origin and evolution of groundwater, because they are composed of water molecules and are sensitive to physical processes such as atmospheric circulation, groundwater mixing, and evaporation [47,48]. Stable-isotopic values of δO18, δ2H, and/or the excess deuterium (D) in precipitation are useful indicators of various parameters in the water cycle [49,50,51]. Environmental isotopes are a very important and vital tool for determining groundwater recharge potentials from runoff water [52,53]. On the other hand, geochemical indices play an important role in determining the groundwater origin and recharge source and solving many problems in hydrogeology, especially in semi-arid and arid regions [47,54].
Total dissolved solids of the analyzed groundwater samples for the El-Qaa Plain’s Quaternary aquifer ranged between 326.4 ppm for sample No. 9 and 2261 ppm for sample No. 23 (Table 2). TDS values for samples 1 through 21 have TDS values of less than 1000 ppm which indicate fresh water types that reflect the probability of recent groundwater recharge with runoff water. Samples No. 22 and 23 had TDS values above 1000 ppm indicating the brackish water type (Table 2). The water samples analyzed in the El-Qaa Plain showed the presence of Na, Ca, Cl, and HCO3 ions almost in all analyzed samples in representative proportions, indicating water recharge in the El-Qaa Plain aquifer through recent and ancient precipitation events, as well as the contribution of ancient water and the impact of the interaction between water and rocks.
The samples analyzed show the water type of NaCl on a Piper diagram (Figure 5). This water type reflects the dominance of sodium and chloride ions in all water samples, which may reflect the effect of saltwater intrusion from the Gulf of Suez that is reflecting the footprints of mixing facies, where the same samples show the low salinity values as mentioned above, despite the effect of mixing processes. Accordingly, the assumption of this type of water is attributed to the presence of intercalations of clay and evaporites inside the aquifer succession. This assumption is also consistent with the findings of [20,44,55], where they reported the interaction of hydrated rocks for the dominance of the sodium and chloride ions in the same region. They also indicated that the uplifting of the impermeable Paleocene crystalline and carboniferous rocks of Gebel El Qebliat Mountain led to the isolation of most parts of the groundwater-producing layer from the saltwater in the Gulf of Suez. The saltwater intrusion in this area extends to only a few hundred meters. The rNa/Cl ionic ratio values exceed those of seawater (0.852 rNa/Cl epm; [56]) for all samples analyzed except for samples 22 and 23 (Na/Cl values of 0.65 and 0.55 epm, respectively) (Table 2). These values indicate the effect of the interaction between groundwater and aquifer materials [57]. This is also indicated by the values of the rCl/HCO3 ratio, which is a very important ratio showing severe water contamination with sea water (near sea water) (>15.5 epm ([57,58,59,60]). All analyzed samples have rCl/HCO3 values far from that of seawater except for samples 22 and 23 (rCl/HCO3: 4.29 and 6.26, respectively). The values of the rCl/HCO3 ratio for inland water range between 0.1 and 5 and for sea water between 20 and 50 [61]. Accordingly, samples 22 and 23 may also be affected by the influx of seawater from the Gulf of Suez, where the samples are nearest to it.
The stable environmental ratios of isotopes O18 and D are expressed according to the slope deviation (‰) of the ratio 18O/16O or 2H/1H versus Standard Mean Ocean Water (SMOW) according to the following equation [40] (Equation (4)):
δsample%o = [(Rsample – Rstandard)/Rstandard × 1000]
where R represents the ratios of 18O/16O and 2H/1H for the samples and the standard value, respectively.
The results of the analyzed samples showed that O18 differs between −4.84 for the sample No. 12 (Well No. 29) and −6.28 for sample No. 21 (Well No. 5). Deuterium values range from −21.7 for sample No. 12 (Well No. 29) and −29.87 for sample No. 21 (Well No. 5) (Figure 6 and Table 3).
The standard graph of δ 18O/δ 2H shows the position of all samples relative to the Global Meteoric Water Line (GMWL: δ2H = 8 δ18O + 10) [40] and the Mediterranean Precipitation Water Line (MWL: δ2H = 8 δ18O + 22) [62], which are plotted as reference lines. Rainwater and Gulf of Suez samples [63], the Hammam Musa sample [64], and rainwater for the two weather stations in El-Arish and Rafah [65] are shown in the graph (Figure 6). It is observed from Figure 6 that all analyzed water samples lie between the Mediterranean Precipitation (rainwater) Line and the Global Meteoric Water Line around the rainwater reference sample [63], which reflects the presence of significant recharge from the new continental and Mediterranean rains, in addition to precipitated water from the prevailing wet climatic periods. The differences in the isotopic composition of the water samples collected with respect to the samples of the Gulf of Suez and Hammam Musa (Musa Bath) represent different degrees of mixing between the two end members; one is fossil water deposited by intense ancient water that occurred in past cold and wet climatic systems, and the other is modern rain falling in dry and warm climatic conditions [21]. This assumption is observed in samples No. 21 and 8 which show some depletion in isotopic values compared with the other samples, which indicates mixing with ancient waters from deep aquifers through fault systems in South Sinai or mixing with ancient water from the ancient rainstorms.
The slightly enriched isotopic composition of the analyzed samples (δ18O and δ2H) reflects recent recharge from runoff water during recent precipitation events. This is largely seen in samples No. 11, 12, 13, and 16. By comparing the values of δ18O and δ2H for the analyzed samples with the recent average precipitation in the cities of El-Arish and Rafah in North Sinai [65], which have average values of −3.73 and −3.62 for δ18O, and −8.75 and −7.55 for δ2H at the two weather stations in El-Arish and Rafah, respectively, it is observed that they also occur between the Global Meteoric Water Line (GMWL) and the Mediterranean Precipitation Water Line (MPWL) (Figure 6), which reflects a good correlation between them and the analyzed water samples, indicating a recent groundwater recharge from recent rainstorms. This is clearly seen in samples No. 11 and 12. It also indicates that fractured bedrock in the upstream parts (catchment areas) is directly recharged by rainwater. Moreover, the excess of D is another evidence for the origin of groundwater recharge (Table 3), which is calculated by Equation (5) [48]:
dexcess = δD‰ − 818O‰
Several studies have attempted to use differences in dexcess values to determine the time and origin of groundwater recharge under different climatic conditions [47,64,66]. The dexcess values for the analyzed groundwater samples ranged between 10.49 (Sample No. 16) and 21.17 (Sample No. 21). All samples have a dexcess of more than 10‰ (˃10‰), reflecting the recent recharge of the aquifer system. An excess D value of about 10 reflects groundwater replenishment under wetter climatic conditions during earlier times [64,67,68]. This assumption was fulfilled in sample No. 16 (Table 3). Low dexcess values (<10‰) reflect the contribution of ancient water through faults, dykes, and deep-rooted joints, while high dexcess (˃10‰) reflects the recent recharge from precipitation in the eastern Mediterranean region [66,69].
Finally, the evidence of recent groundwater recharge potential in the El-Qaa Plain provides an optimistic view about the future of on-going or planned development activities. From this point of view, the runoff water represents the main source of groundwater recharge, which must be managed to increase recharge capability.

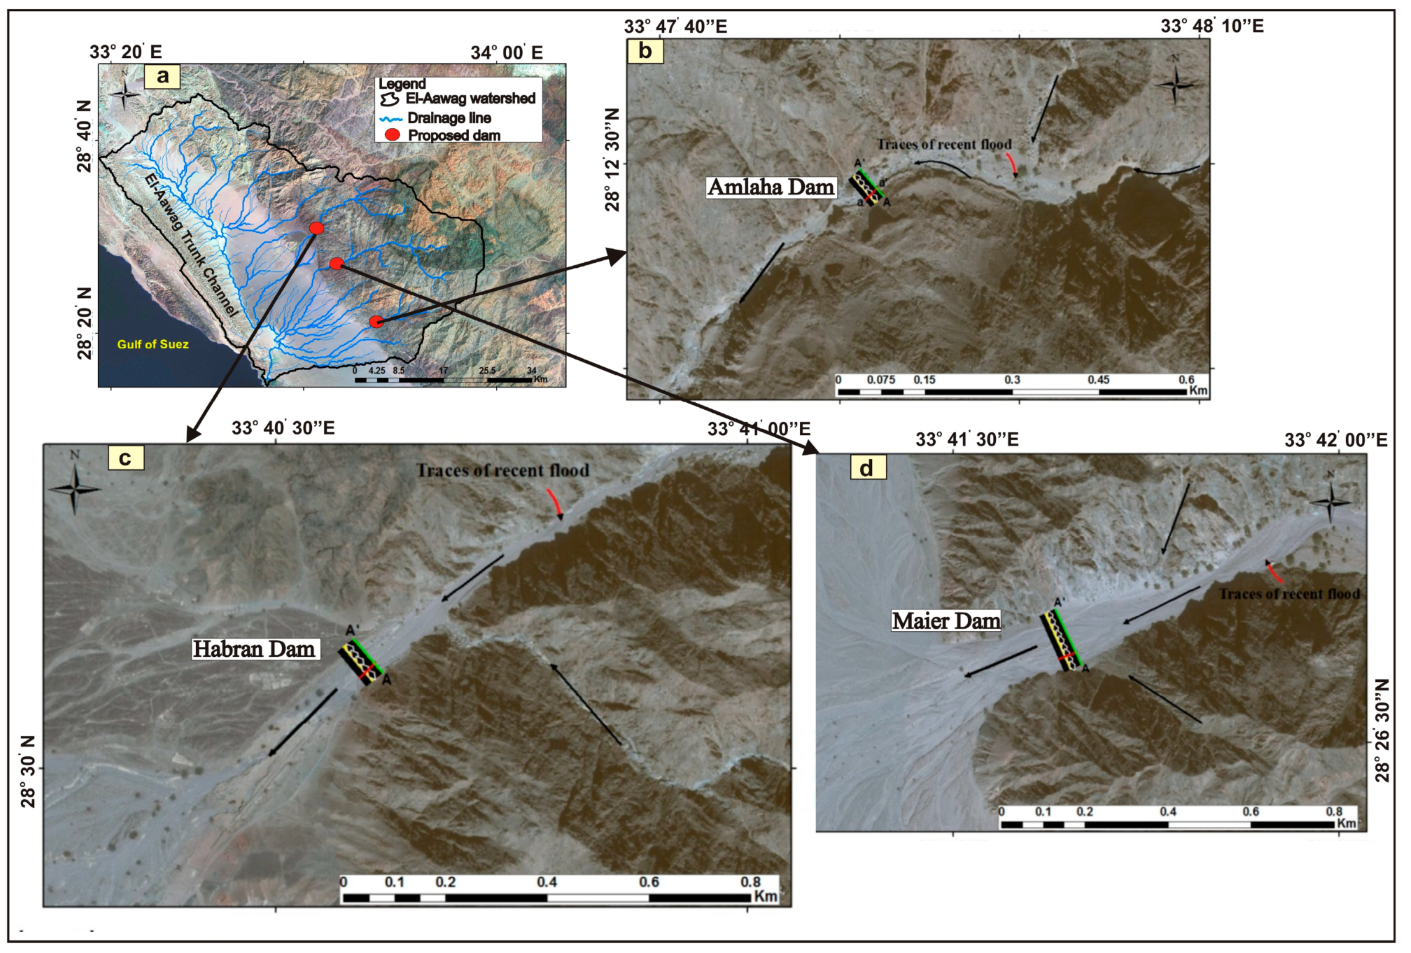
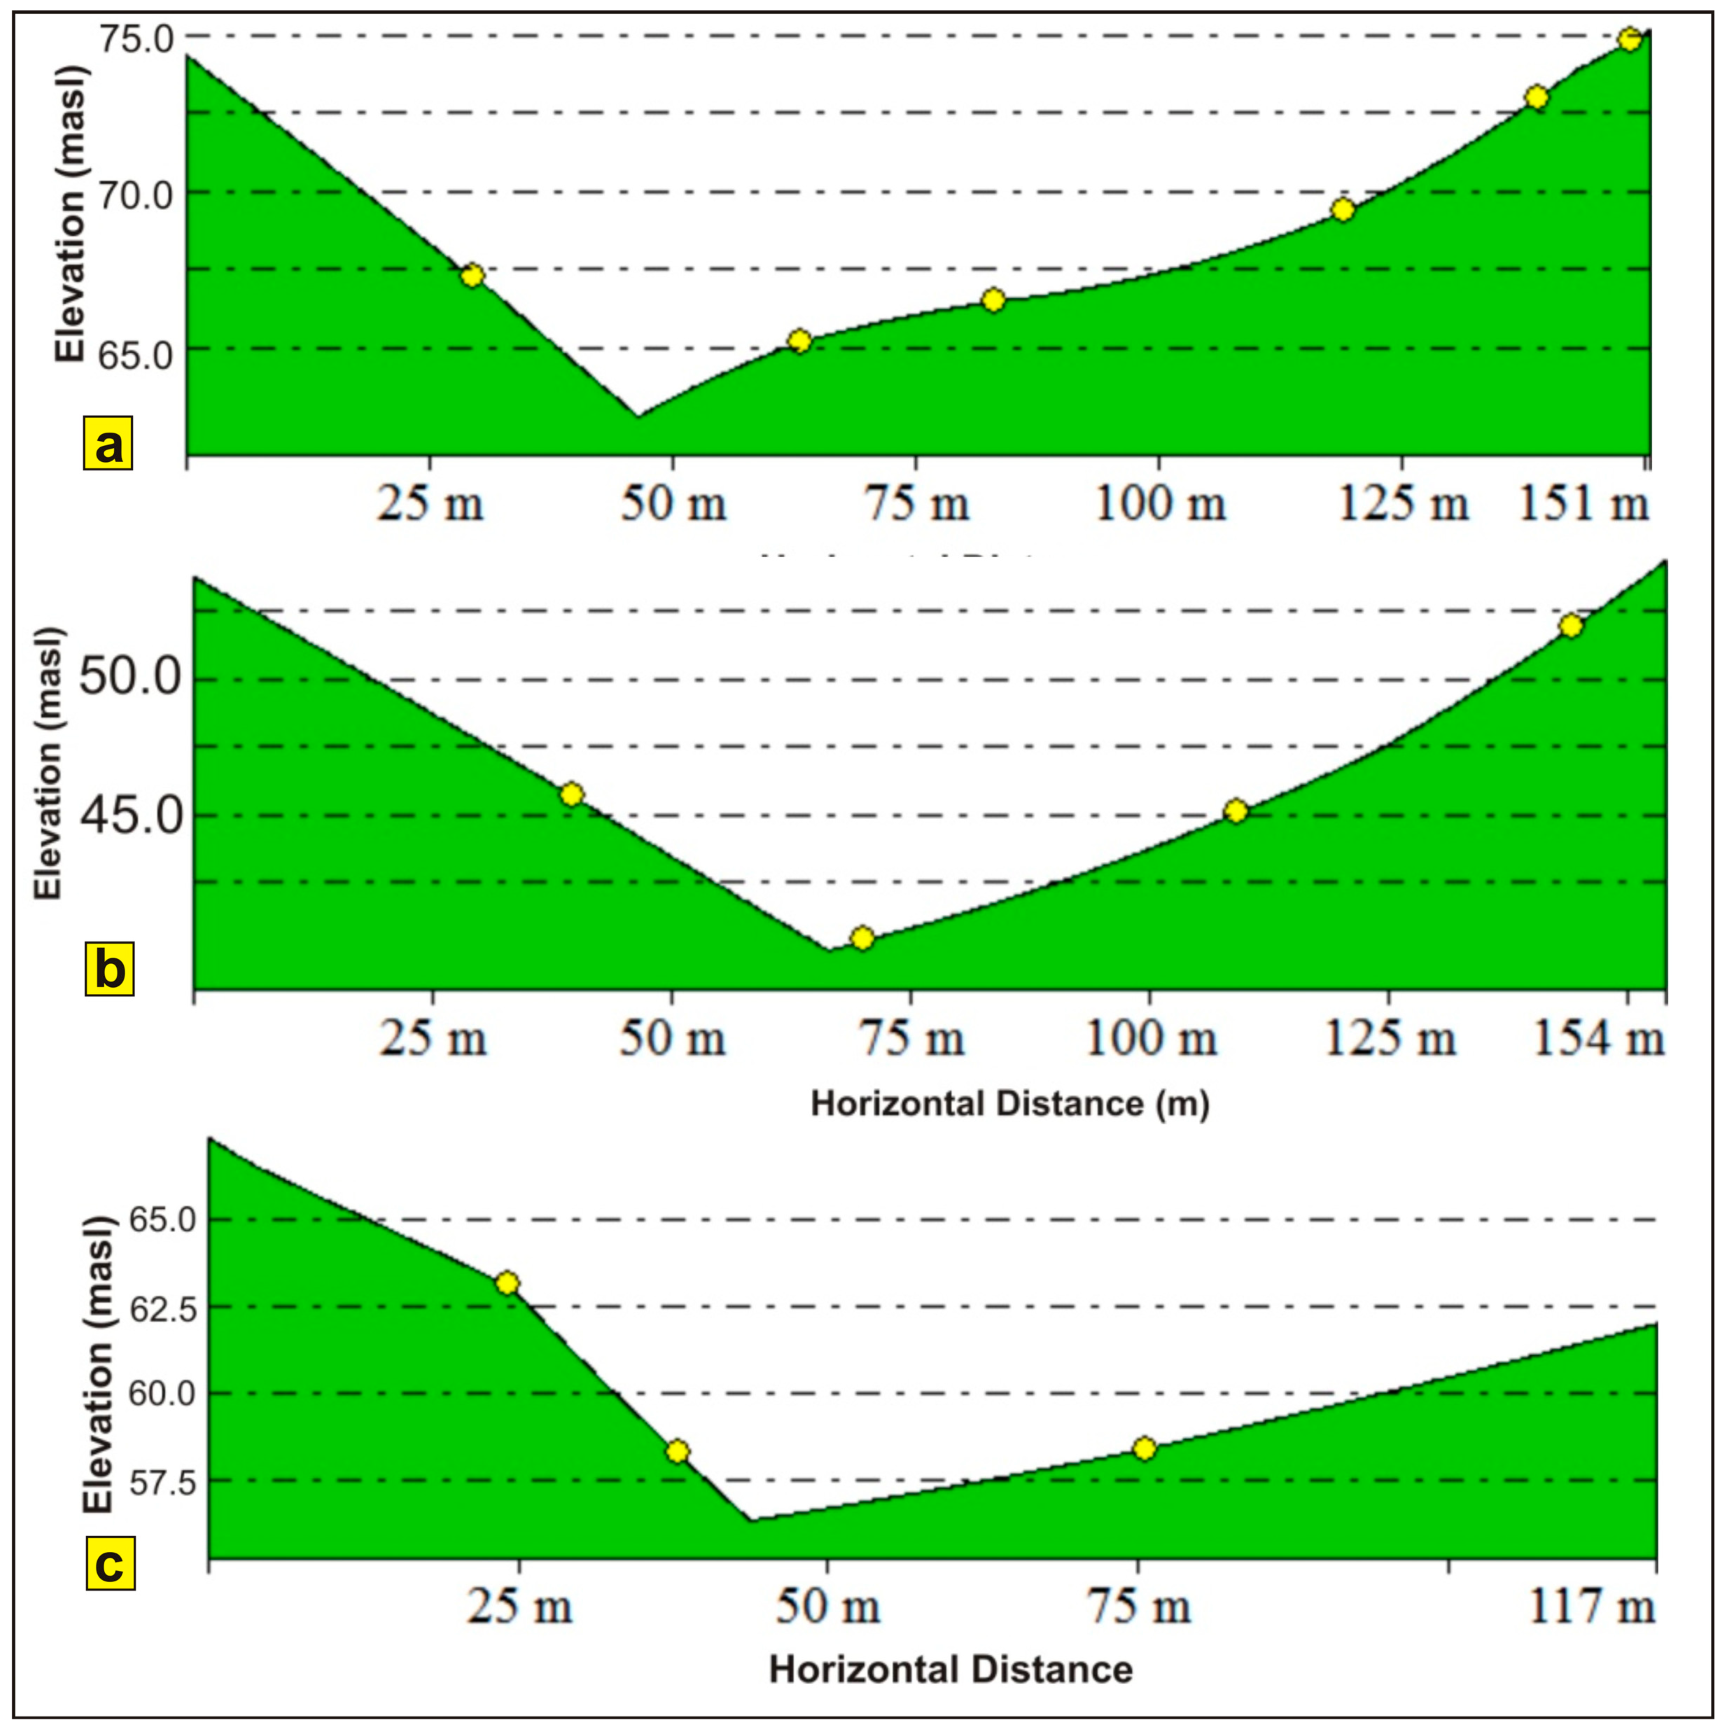
5.2. Runoff Water Management

The runoff water is calculated for the sub-watersheds in the El-Aawag watershed using the Finkel method, as shown in Equations (1) and (2) and Table 4. The runoff water harvesting (RWH) plan for W. El-Aawag is to increase the chance for water infiltration in El-Qaa groundwater aquifer system. This occurs by increasing the chance of water intrusion into the bottom aquifer system by increasing the lag time (the residence time of the water on the ground surface), taking into account the need for periodic maintenance of the bottom of the reservoir upstream of the dam. This plan will be achieved through the construction of three proposed dams across the sub-watersheds of Amlaha, Maier, and Habran (Figure 7 and Figure 8). These dams are located in the upstream parts of these sub-watersheds in the main channels of wadi deposits and are bounded on both sides by the shoulders of the basement. The sediments have high infiltration rates, porosity, and permeability [14,70], which enhances groundwater recharge as well as helps mitigate flood risks. Construction cross sections at the dam sites in the WMS© software (Aquaveo LLC, U.S. Army Corps of Engineers, Engineer Research & Development Center) (Figure 7) indicated storage capacities of 90,000, 350,000, and 350,000 m3/ y for the sub-watersheds of Amlaha, Maier, and Habran, respectively. These dams, if engineered with optimal designs, constructions and management systems, will help provide promising amounts of runoff water, especially with heavy rainstorms. Based on the above results of hydrochemistry, hydrology of environmental isotopes, and the proposed system of RWH, groundwater productivity of the El-Qaa Plain aquifer is examined using mathematical flow models to build a complete view of the water resources in arid regions.

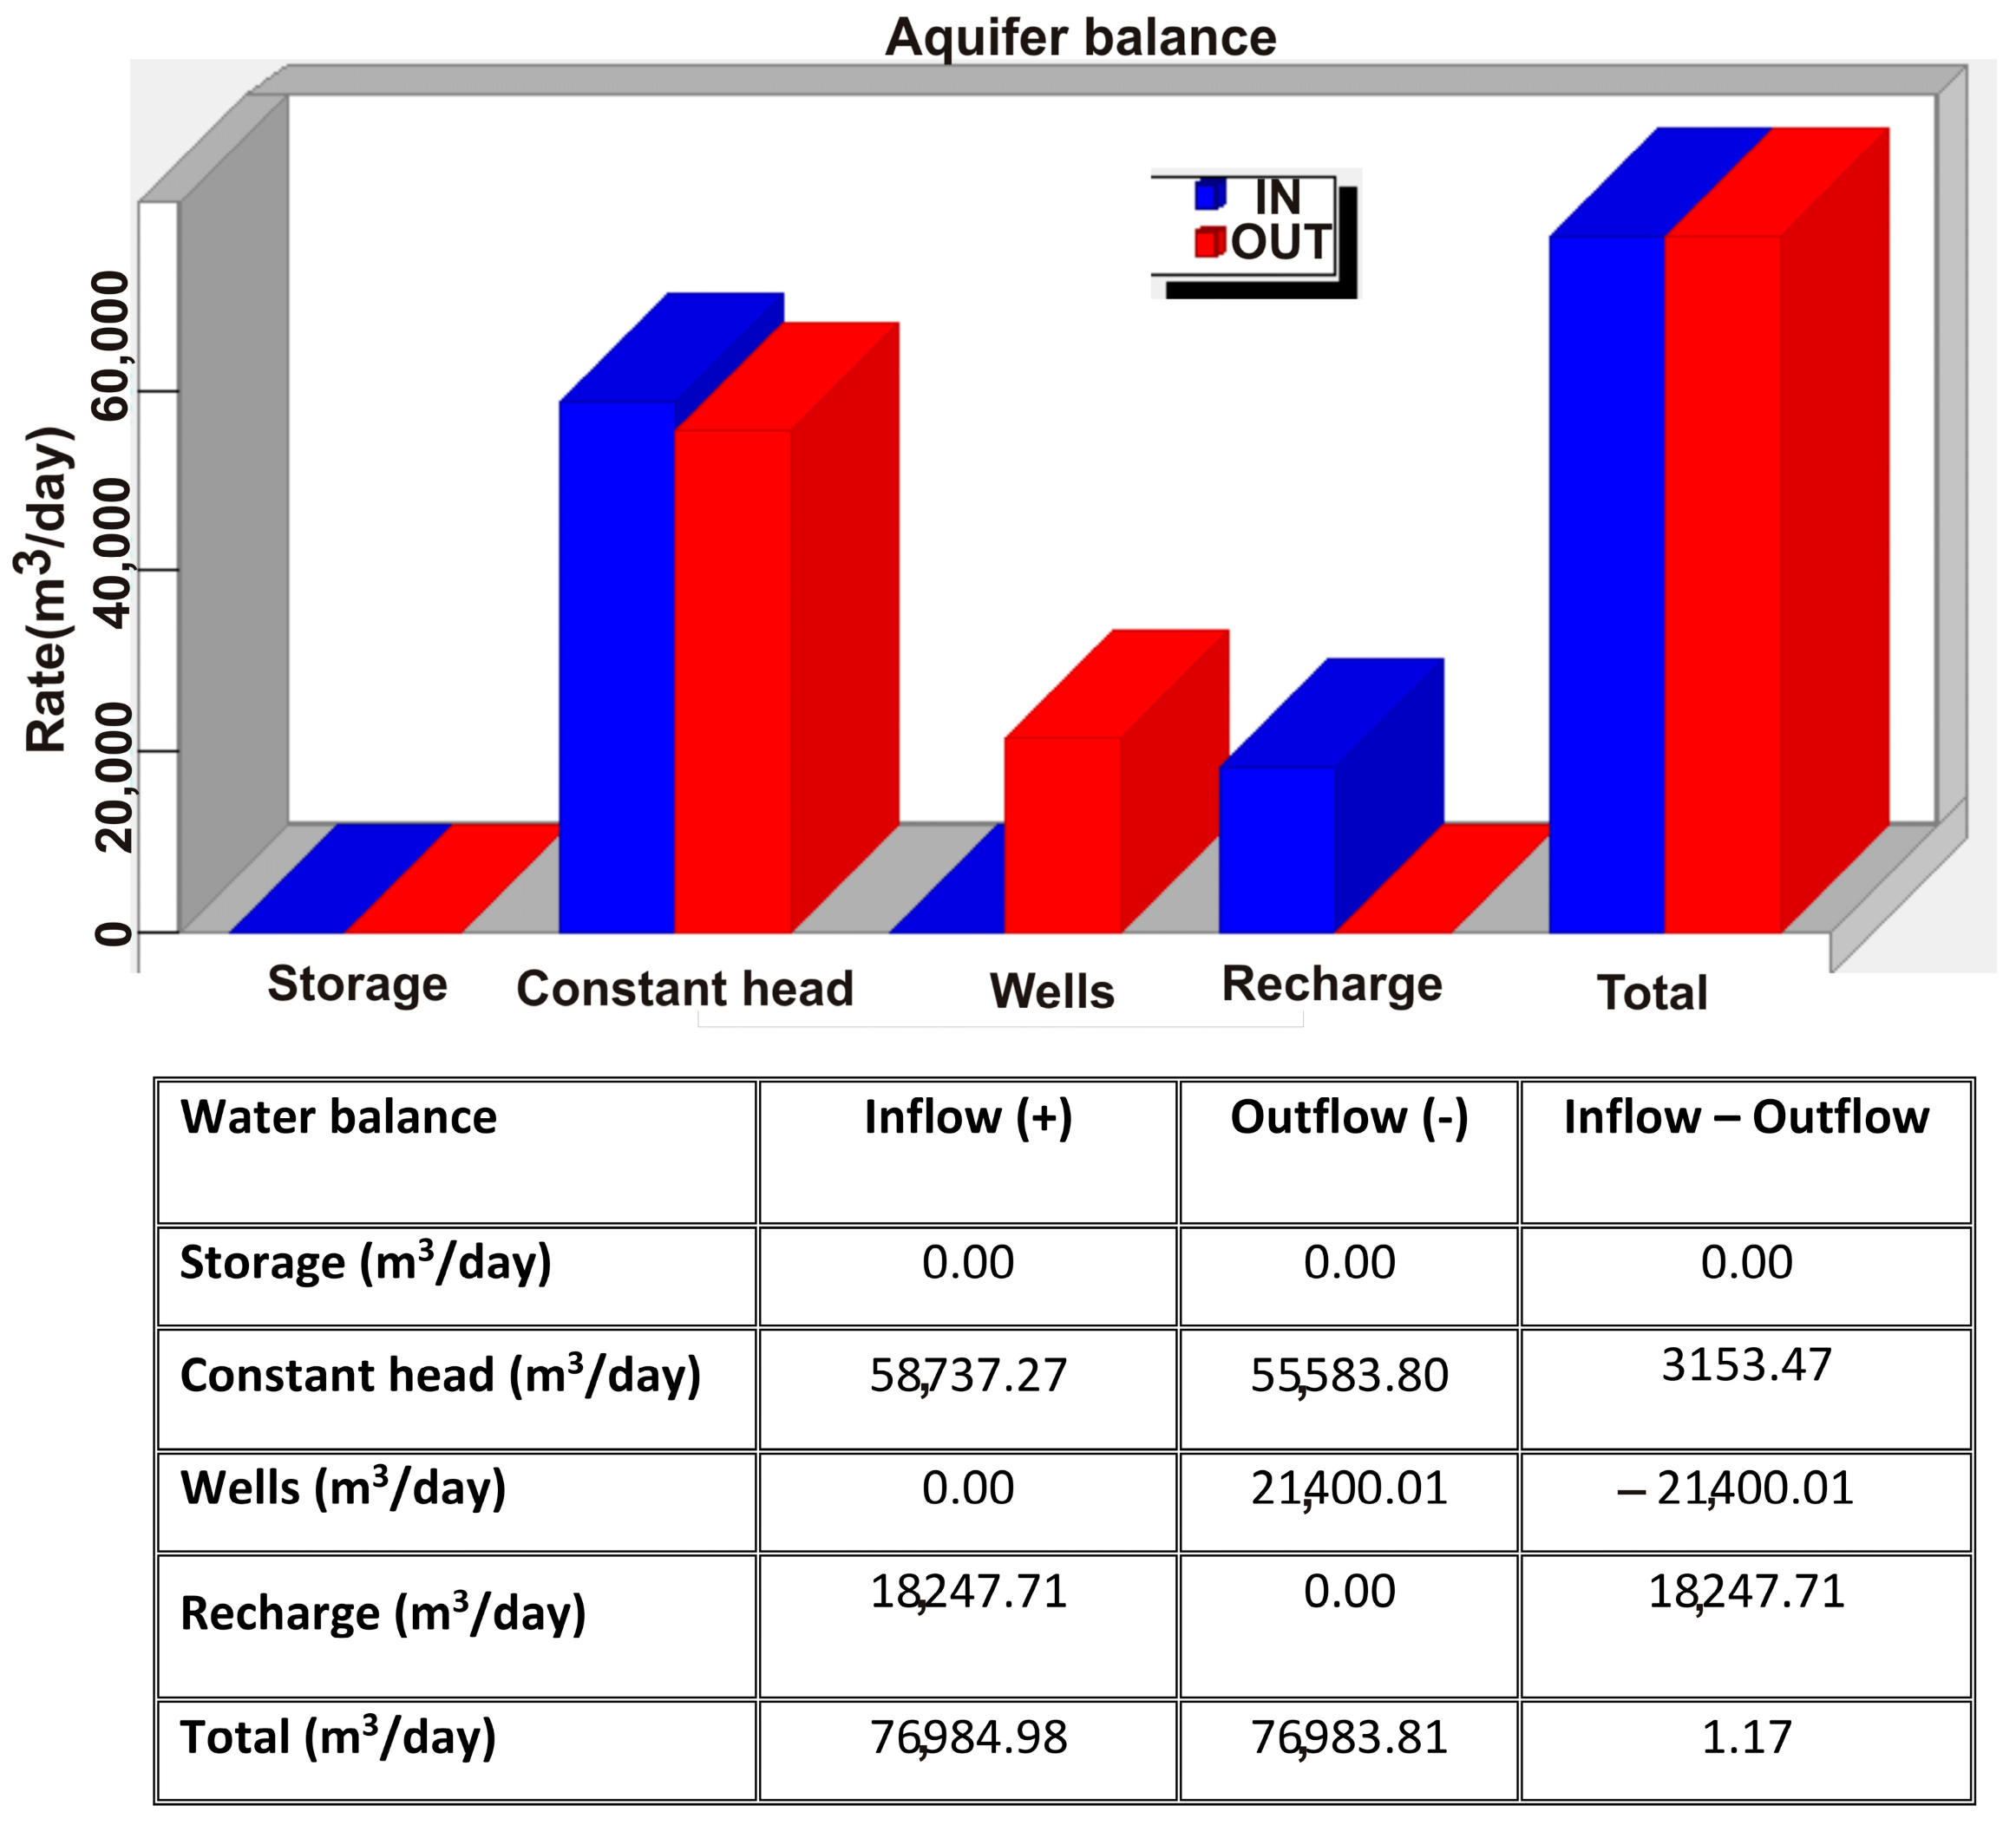
5.3. Mass Balance and Flow Modeling

The MODFLOW modeling code was used to envisage the relationship of groundwater withdrawal and water level restoration for different scenarios of discharge. MODFLOW is used globally to study the groundwater levels of coastal aquifers [71] and assess the interaction of groundwater levels and stream-aquifers [72]. MODFLOW is also a very effective modeling code for the numerical assessment of the managed aquifer recharge (MAR) to achieve sustainable groundwater development [73].
The conceptual model was built based on the topographic, geological, and hydrogeological studies conducted on the aquifer system (Figure 9a). The hydrogeological map of Sinai at scale of 1:500,000 [32] is the main source of model data, as well as data collected from field trips carried out to South Sinai, and previous instrumental data and the database of pumping wells.
The hydrogeological environment in El-Qaa Plain region was classified into three units related to the Pleistocene aquifer (Figure 9a) [32]:
The upper part consists of coarse gravel with sand and is found in the shallow zone in a limited area around the city of El-Tur. In general, a high electrical resistance value (˃100 ohm-m) indicates no water reserve. The middle part is about 100 m thick, 60 km long, and 10 km wide, occupies about 600 km2, and consists of coarse to medium sand and gravel with interfering of clay lenses. It is the main source of fresh water extraction. It has no distribution in the southern part of El-Qaa Plain, where its electrical resistance is 10–50 ohm-m. The bottom consists of sand and gravel with silt and clay. It represents the third aquifer zone, which is less productive than the second aquifer. Its resistance is less than 10 ohm-m and this represents water that may be of low quality. Its thickness may exceed 1000 m.
The model has rectangular dimensions of 60,324 m in width and 65,380 m in height to represent an active aquifer dimension of 66 km (maximum length) and 24 km (maximum width). The number of rows and columns is 200 and 200, respectively (Figure 9b). The active cells represent the investigated aquifer system, which is represented by the Quaternary water-bearing deposits, while the inactive cells represent the impervious boundaries of the eastern basement rocks and the western rocks of Mountain Qabaliat. The 3D grid was generated by producing three surfaces, which were digitized using Surfer8® Package Software (http://www.ssg-surfer.com/html/surfer_details.html, accessed on 5 May 2020) (Scientific Software Group). A grid file is then produced for each surface, bearing in mind that the surface grid cell size must be smaller than the model grid cell size to accurately import these surfaces into the model.
Boundary conditions are essential parameters for constructing a flow model, as they represent the relationship between the studied aquifer system and the surrounding systems. They also describe the flow and exchange communication between the model and the surrounding external systems. The model region boundary conditions are shown in Figure 9c.
The boundary conditions surrounding the Quaternary aquifer of the El-Qaa Plain are classified into: The eastern boundary, which is considered a recharge boundary, as it receives recharge from the runoff water of W. El-Aawag watershed, especially from W. Habran, W. Maier, and Gebah sub-watersheds. The El-Aawag watershed receives an annual volume of runoff of about 9,163,812 m3, which was calculated in the present work by the Finkel’s Method [43]. On the other hand, the recharge amount from the watersheds surrounding the aquifer system from the eastern side is about 5.9 MCM/yr [32,74,75]. The western boundary of the model is represented by a constant head condition, which represents the zero head of the Gulf of Suez. This boundary condition is assigned to all three layers of the model. The no-flow boundary represents the areas of no flow into the aquifer system. This boundary condition is assigned to the three layers of the model for the remaining sides of the aquifer system.
The hydraulic conductivity of the aquifer ranges between 4.6 and 71.6 m/day with an average value of 23.9 m/day. The transmissivity (T) of the aquifer ranges between 106 and 2150 m2/day with an average value of 768 m2/day. The storage capacity (Sc) varies between 0.33 and 6.11 with an average value of 2.64. Well production (Q) ranges between 20 and 115 m3/h, with an average value of 56.7 m3/h [32]. The Water Resources Research Institute (WRRI) monitored the static water level in El-Qaa Plain periodically by some observation wells from 1989 to 1997, where piezometric levels ranged from 5 masl near the city of El-Tur to 25 masl in the central part of El-Qaa Plain. It decreases by 6–7 cm/year with a gradient of 0.6/1000. Through this study, the water level was measured in six observation wells in El-Qaa Plain region by the research team and it was found at 4.9, 15, 10, 15, 25, and 10 masl.
The pumping wells in the study area are increasing epidemically with the passage of time, consequently, the amount of extracted groundwater is also increasing, which necessitates the need for a simultaneous increase in the recharge rate through the application of the new proposed RWH techniques, which is the vital objective of the current work. It is noticed from the field trips to the El-Qaa Plain that there is a noticeable increase in agricultural activities during the last ten years, especially those owned by the private sector with large areas, each with one or more pumping wells. All of these wells mainly rely on the El-Qaa Quaternary aquifer system, which leads to an increase in the rate of groundwater extraction. Table 5 describes the increase in groundwater extraction due to increased agricultural activities in El-Qaa Plain region.

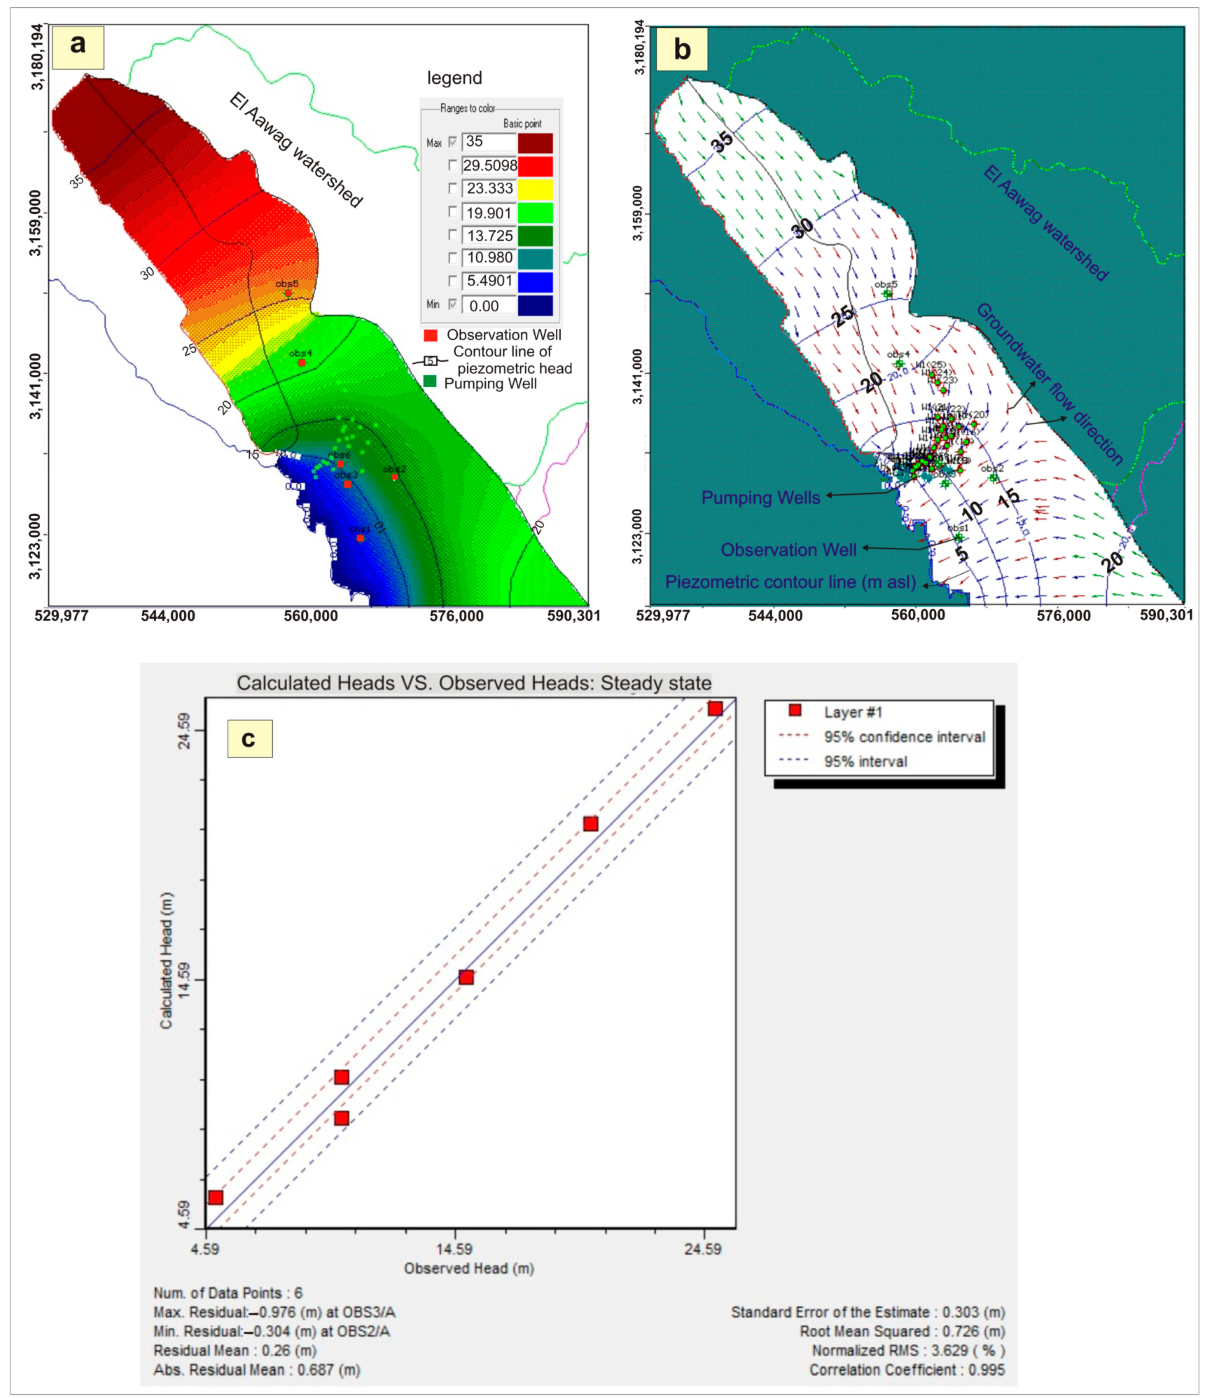
5.3.1. Model Calibration

The model was calibrated against the average available groundwater piezometric levels for six observation wells. The calibration of the model is based on non-linear steady-state conditions. The calibration process was carried out through several experiments by adjusting the hydraulic conductivity. The piezometric level ranges between 35 masl in the northern part of the study area and 5 masl in the southwestern part, near the city El-Tur (Figure 10a). The general flow direction is from the east to west in the southern half of the study area, while it is from northwest to east–west in the northern half of the study area (Figure 10b). The model is found to be sensitive to changes in hydraulic conductivity, specific head along the boundaries, groundwater recharge, and extraction from the aquifer system (Figure 10c; Table 6).
The model results are described to illustrate the water balance, flow regime and origin of groundwater supply (Figure 11).

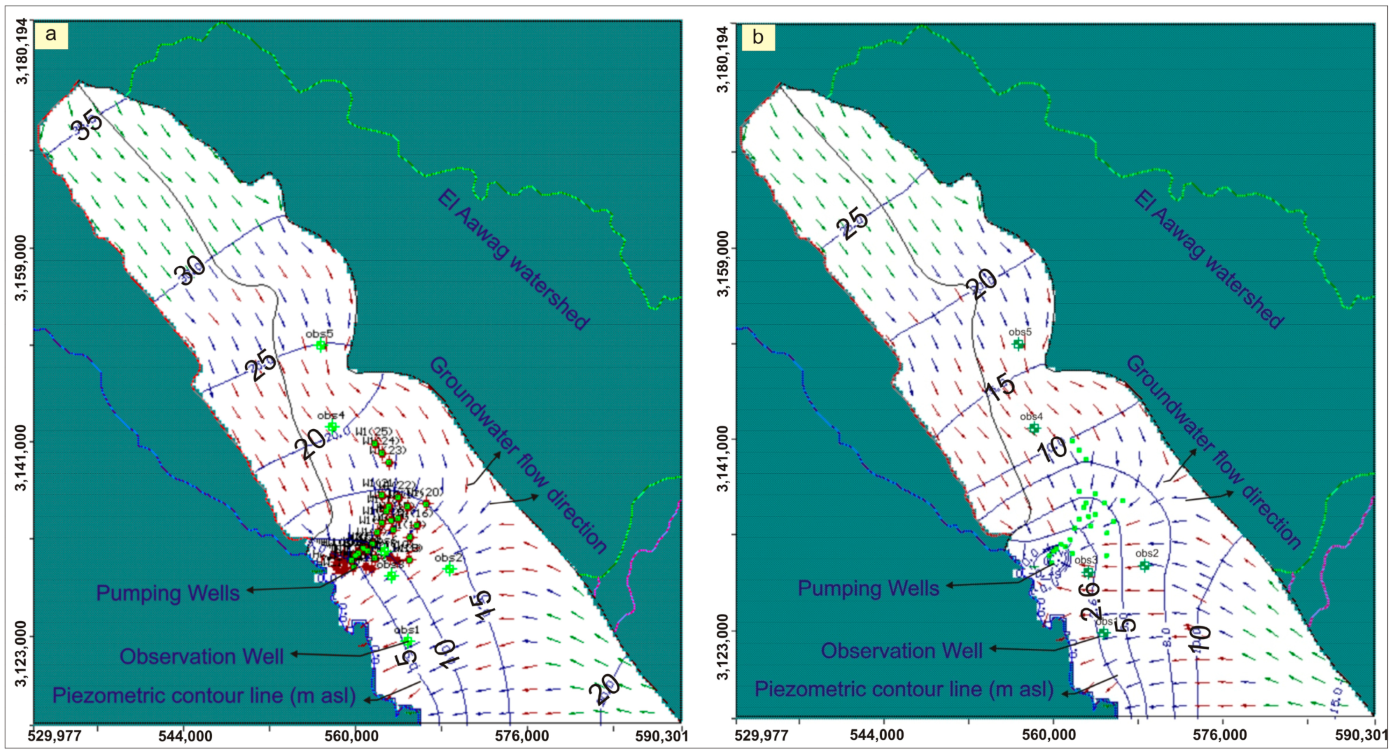
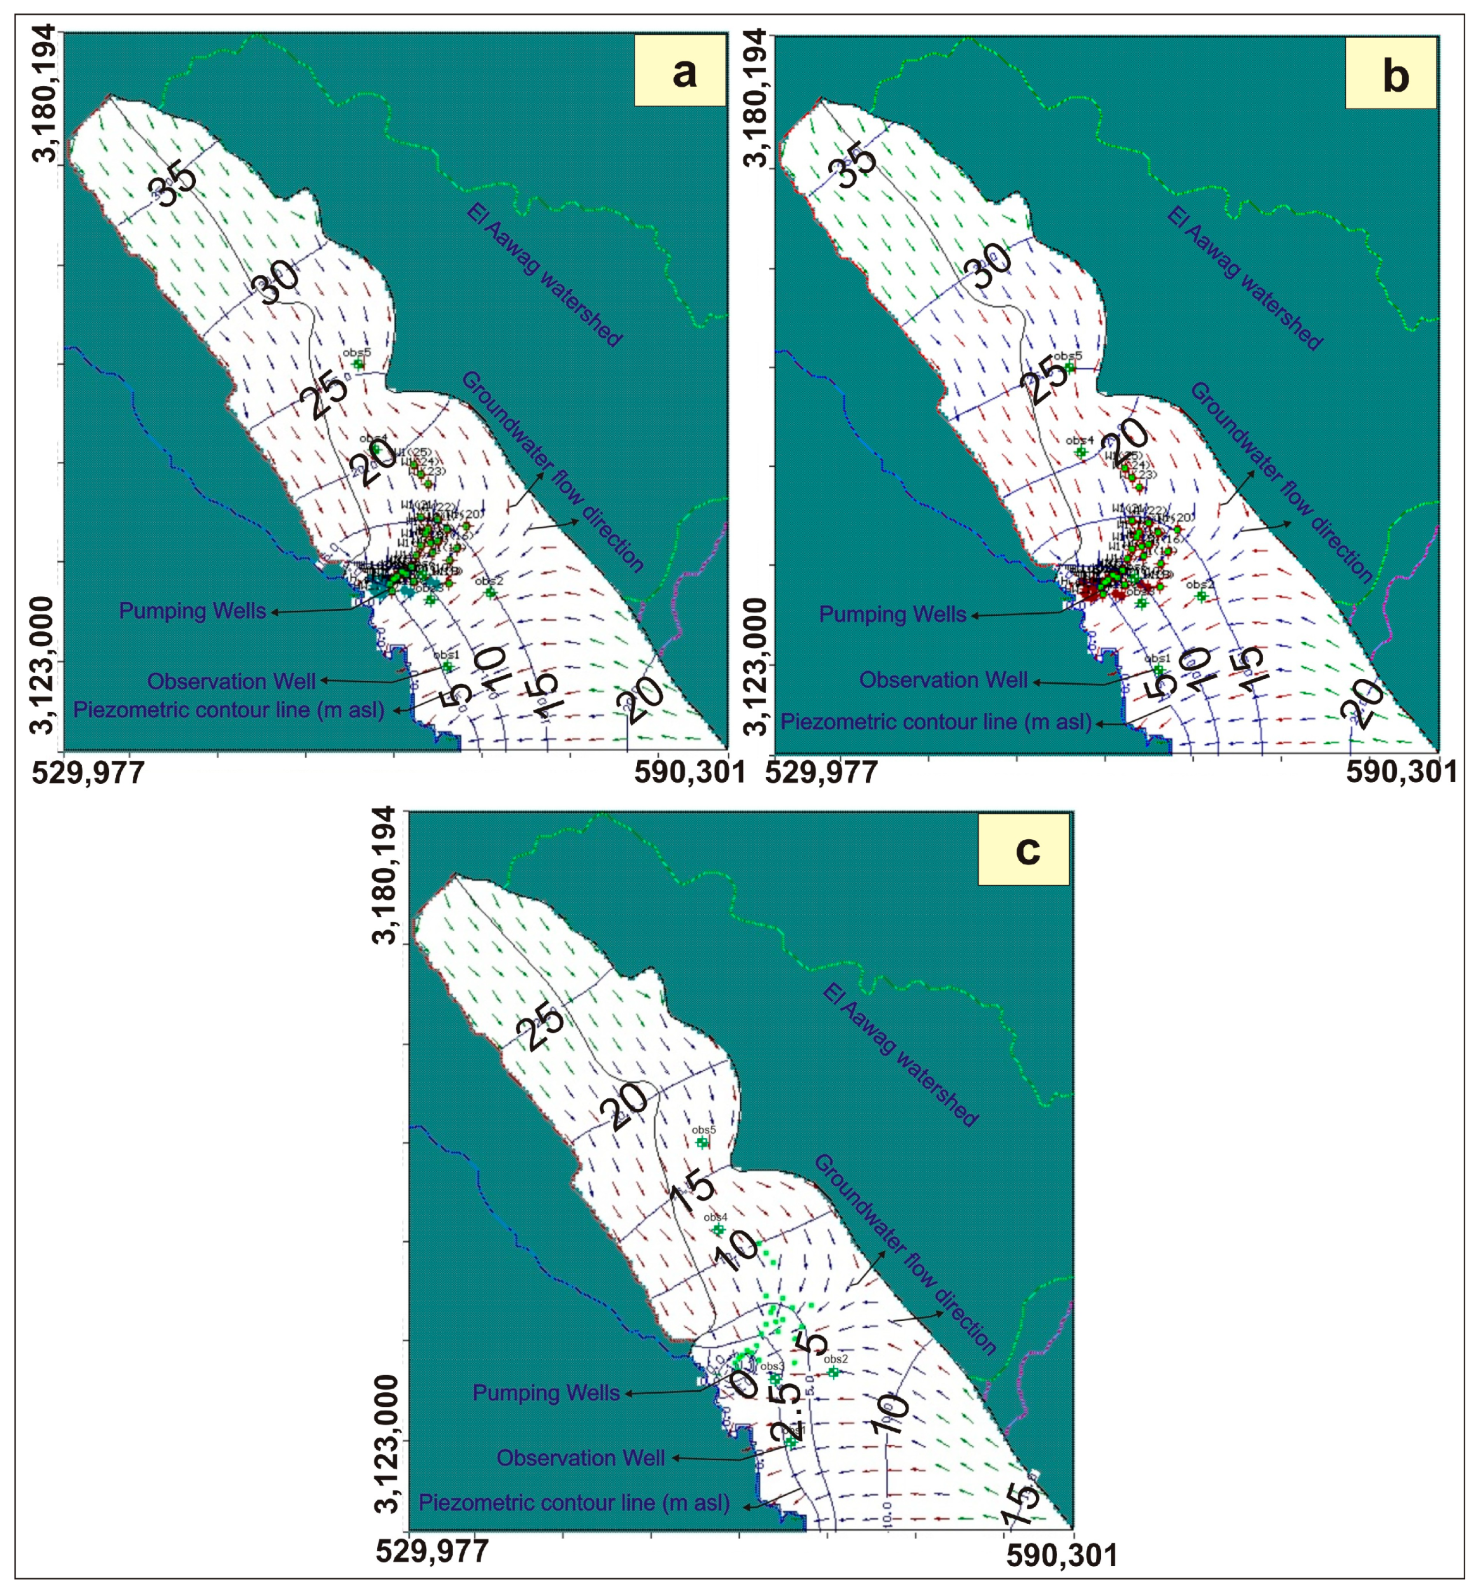
5.3.2. Selection and Testing Scenarios

In the present work, the primary criteria used to establish a groundwater development strategy include:
The calibrated model provides a prediction of the response of the aquifer system as a result of different groundwater extraction scenarios relative to the incremental rate of recharge scenarios. Based on the main control for the rate of safe extraction, which can be maintained below the short-term depletion program, the following should be taken into consideration:
(a)
Avoid complete dewatering of the aquifer system in any part of the development area, where extraction from the system is envisaged;
(b)
Keep the pumping head within the acceptable limit for the management period.
The tested scenarios are proposed to serve the sustainability of the aquifer under the influence of:
  • Increasing the rate of discharge due to the implementation of new development activities, especially the new reclaimed lands;
  • Possibility of aquifer recharge through the proposed runoff water harvesting structures.
Scenario #1:
In this scenario, the extraction rate is increased by about 3600 m3/day, indicating the need to add new wells (10 pumping wells) which increases the extraction rate. These wells were proposed to provide additional quantities of water to meet the new agricultural activities. When running this scenario, it is observed from the results (Table S1, Figure 12a) that there is a slight decrease in piezometric heads in the observation wells with an average value of 0.44 masl. Thus, this scenario is suitable for additional water supply, as it results in a slight change in piezometric heads in response to this pumping rate.
Scenario #2:
Model scenario No. 2 was proposed to study the impact of intense extraction from the studied aquifer as a result of the noticeable increase in the number of drilled groundwater wells. In this scenario, the model was run at twice the extraction rates compared with the baseline (double the baseline) from the same well field. It is noted that there is a significant difference between calculated piezometric heads for the baseline and those for the second scenario, ranging from 2.7 masl for Well No. 1 and 9.05 masl for Well No. 6, with an average value of 6.97 masl (Table S2 and Figure 12b). This large difference causes higher drawdown values and piezometric heads to fall below zero values in wells located near the Gulf of Suez, which consequently leads saltwater intrusion into the aquifer (Figure 12b). Therefore, we recommend that any increase in the extraction rate be within the safe yield and under control to protect the aquifer from saltwater invasion. However, the drilling of groundwater wells and rates of extraction from the El-Qaa Plain aquifer system must be under government monitoring and oversight.
The present work proposed new techniques for evaluating the groundwater reserves in South Sinai, especially in the El-Qaa Plain region, to increase the recharge rates of the Quaternary aquifer system, which is mainly fed by the runoff water coming from the eastern catchments. Therefore, we propose a new a new scenario to increase the aquifer recharge rate by 2%, which can be achieved by applying RWH constructions. This scenario was applied to the three cases (i.e., baseline, addition of new wells, and doubling the extraction rate, respectively).
Scenario #3 (increasing recharge rate by 2% for the baseline):
When running the model for this scenario, it was observed that the increase in piezometric water level varied from 0.08 masl in Well No. 3 to 0.19 masl in Well No. 5, with an average value of 0.13 masl (Table S3). Flow direction and piezometric heads resulted from scenario No. 3 is shown in Figure 13a.
Scenario #4 (2% increase in recharge rate, if new wells are added to the well field):
When the model for this scenario is run, it is observed that the drawdown ranges between 0.1 masl in Well No. 1 to 0.58 m in Well No. 6, with an average value of 0.37 masl (Table S4), while the average drawdown in the case of scenario No. 1 (add 10 new wells) was 0.44 masl. Flow directions and piezometric heads that resulted from scenario No. 4 are shown in Figure 13b.
Scenario #5 (increase the recharge rate by 2 % if the extraction rate is doubled):
Running the model for this scenario, the drawdown was observed to range between 2.58 masl in Well No. 1 to 8.93 masl in Well No. 6 with an average value of 6.85 masl (Table S5), while the average drawdown in the case of scenario 2 (doubling the extraction rate) was 6.97 masl. Thus, it is also observed that by increasing the recharge rate, the drawdown is very high, and there is a high chance of saltwater intrusion from the Gulf of Suez. Figure 13c shows the flow directions and piezometric heads, which were a result of Scenario 5, where heads below zero are also represented by wells that occur near the Gulf of Suez.

6. Conclusions

The management of water resources in the Sinai Peninsula is an urgent need for future developmental activities. The present work provided successful integration of mathematical flow modeling (MODFLOW), RS, GIS, WMS, hydrochemistry, and isotope hydrology (O18 and D) to understand groundwater quality, recharge mechanisms, and current and future discharge rates of the El-Qaa Plain aquifer. In addition to studying the possibility of improving natural groundwater recharge conditions by suggesting rainwater harvesting structures to enhance the aquifer storage and productivity, the relationship between surface runoff water and groundwater was investigated and different scenarios of groundwater discharge rates under new agricultural activities was presented. The results indicated that the drilling of additional wells in the El-Qaa Plain aquifer system must be under strict control, and their operation should be within safe withdrawal rates to keep the aquifer away from high drawdown and saltwater intrusion. Finally, the application of optimal rainwater harvesting techniques have its own effect on enhancing the potential for groundwater recharge possibilities, which in turn, increases its sustainability for current and future development requirements. For this same clue, the isotope signatures (O18 and D) indicate recent recharge and ancient waters. Three storage dams in the sub-watersheds of Habran, Maier, and Amlaha have been proposed to harvest surface runoff water, thus enhancing groundwater recharge into the aquifer. If adapted and managed wisely, these dams will help to harvest promising amounts of runoff water, particularly through intense rainstorms, helping to mitigate flash floods and enhance the ecosystem in these arid regions.

Supplementary Materials

The following supporting information can be downloaded at: https://www.mdpi.com/article/10.3390/w15061118/s1, Table S1. Calculated piezometric heads of scenario No. 1 with reference to the calculated piezometric heads in the groundwater baseline; Table S2. Calculated piezometric heads of scenario No. 2 with reference to the calculated heads in the baseline; Table S3. Calculated piezometric heads of scenario No. 3 with reference to calculated heads of baseline; Table S4. Calculated piezometric heads of scenario No. 4 with reference to the calculated heads of baseline; Table S5. Calculated piezometric heads of scenario No. 5 with reference to calculated heads of the baseline.

Author Contributions

Conceptualization, H.H.E., E.M.R., V.M., M.Z., N.A.A.M. and A.M.N.; methodology, H.H.E., E.M.R. and A.M.N.; software, H.H.E., E.M.R., N.A.A.M. and A.M.N.; validation, H.H.E., E.M.R., M.Z., V.M., N.A.A.M. and A.M.N.; formal analysis, H.H.E. and A.M.N.; writing—original draft preparation, H.H.E., E.M.R. and A.M.N.; writing—review and editing, H.H.E., N.A.A.M., E.M.R., V.M., M.Z. and A.M.N.; visualization, H.H.E. and A.M.N.; supervision, H.H.E., E.M.R., M.Z. and A.M.N.; funding, V.M., M.Z.; project administration, M.Z.; resources V.M., M.Z. and A.M.N. All authors have read and agreed to the published version of the manuscript.

Funding

This research was funded by the Science and Technology Development Fund (STDF) Number 1381 and projects HUSKROUA/1702/6.1/0072, HUSKROUA/1901/8.1/0088 VEGA 1/0308/20 and 011TUKE-2-1/2021.

Institutional Review Board Statement

Not applicable.

Informed Consent Statement

Not applicable.

Data Availability Statement

Data available according to MDPI Research Data Policies.

Acknowledgments

The authors wish to express their deep gratitude to the Science and Technology Development Fund (STDF) for kindly supporting and funding the current work. The authors are grateful to the projects HUSKROUA/1702/6.1/0072, HUSKROUA/1901/8.1/0088 VEGA 1/0308/20 and 011TUKE-2-1/2021 for financial support of this work.

Conflicts of Interest

The authors declare no conflict of interest.

References

  1. Scanlon, B.R.; Fakhreddine, S.; Rateb, A.; de Graaf, I.; Famiglietti, J.; Gleeson, T.; Grafton, R.Q.; Jobbagy, E.; Kebede, S.; Kolusu, S.R. Global water resources and the role of groundwater in a resilient water future. Nat. Rev. Earth Environ. 2023, 4, 1–15. [Google Scholar] [CrossRef]
  2. Gleeson, T.; Wada, Y.; Bierkens, M.F.; van Beek, L.P. Water balance of global aquifers revealed by groundwater footprint. Nature 2012, 488, 197–200. [Google Scholar] [CrossRef]
  3. Ahmad, N.; Khan, S.; Ehsan, M.; Rehman, F.U.; Al-Shuhail, A. Estimating the total volume of running water bodies using geographic information system (GIS): A case study of Peshawar Basin (Pakistan). Sustainability 2022, 14, 3754. [Google Scholar] [CrossRef]
  4. Sohail, M.T.; Hussan, A.; Ehsan, M.; Al-Ansari, N.; Akhter, M.M.; Manzoor, Z.; Elbeltagi, A. Groundwater budgeting of Nari and Gaj formations and groundwater mapping of Karachi, Pakistan. Appl. Water Sci. 2022, 12, 267. [Google Scholar] [CrossRef]
  5. Elewa, H.H. Prediction of future drawdown of water levels of the Pleistocene aquifer system of Wadi El-Assiuti Area, Eastern Desert, Egypt, as a criterion for management and conservation. Resour. Conserv. Recycl. 2008, 52, 1006–1014. [Google Scholar] [CrossRef]
  6. Dawood, F.; Akhtar, M.M.; Ehsan, M. Evaluating urbanization impact on stressed aquifer of Quetta Valley, Pakistan. Desalin. Water Treat. 2021, 222, 103–113. [Google Scholar] [CrossRef]
  7. Malekzadeh, M.; Kardar, S.; Shabanlou, S. Simulation of groundwater level using MODFLOW, extreme learning machine and Wavelet-Extreme Learning Machine models. Groundw. Sustain. Dev. 2019, 9, 100279. [Google Scholar] [CrossRef]
  8. Chen, G.; Meng, T.; Wu, W.; Si, B.; Li, M.; Liu, B.; Wu, S.; Feng, H.; Siddique, K.H. Evaluating potential groundwater recharge in the unsteady state for deep-rooted afforestation in deep loess deposits. Sci. Total Environ. 2023, 858, 159837. [Google Scholar] [CrossRef]
  9. Lebon, Y.; François, C.; Navel, S.; Vallier, F.; Guillard, L.; Pinasseau, L.; Oxarango, L.; Volatier, L.; Mermillod-Blondin, F. Aquifer recharge by stormwater infiltration basins: Hydrological and vadose zone characteristics control the impacts of basins on groundwater chemistry and microbiology. Sci. Total Environ. 2023, 865, 161115. [Google Scholar] [CrossRef]
  10. Elewa, H.H.; Zelenakova, M.; Nosair, A.M. Integration of the analytical hierarchy process and GIS spatial distribution model to determine the possibility of runoff water harvesting in dry regions: Wadi Watir in Sinai as a case study. Water 2021, 13, 804. [Google Scholar] [CrossRef]
  11. Elewa, H.H.; Qaddah, A.A. Groundwater potentiality mapping in the Sinai Peninsula, Egypt, using remote sensing and GIS-watershed-based modeling. Hydrogeol. J. 2011, 19, 613–628. [Google Scholar] [CrossRef] [Green Version]
  12. Meshref, W.M. Tectonic framework of Egypt. In The Geology of Egypt, 1st ed.; Said, R., Ed.; Balkema: Rotterdam, The Netherlands, 1990; p. 43. [Google Scholar]
  13. Abdel-Raouf, O.; Mesalam, M. Implementation of magnetic, gravity and resistivity data in identifying groundwater occurrences in El Qaa Plain area, Southern Sinai, Egypt. J. Asian Earth Sci. 2016, 128, 1–26. [Google Scholar]
  14. Sherief, Y. Flash Floods and Their Effects on the Development in El-Qaá Plain Area in South Sinai, Egypt, a Study in Applied Geomorphology Using GIS and Remote Sensing. 2008. Available online: https://openscience.ub.uni-mainz.de/handle/20.500 (accessed on 20 October 2008).
  15. Sultan, A.; Abdel Rahman, N.; Ramadan, T.M.; Salem, S. The use of geophysical and remote sensing data analysis in the groundwater assessment of El Qaa Plain, South Sinai, Egypt. Aust. J. Basic Appl. Sci. 2013, 7, 394–400. [Google Scholar]
  16. Sultan, S.A.; Mohameden, M.I.; Santos, F.M. Hydrogeophysical study of the El Qaa Plain, Sinai, Egypt. Bull. Eng. Geol. Environ. 2009, 68, 525–537. [Google Scholar] [CrossRef]
  17. Ahmed, M.; Sauck, W.; Sultan, M.; Yan, E.; Soliman, F.; Rashed, M. Geophysical constraints on the hydrogeologic and structural settings of the Gulf of Suez rift-related basins: Case study from the El Qaa Plain, Sinai, Egypt. Surv. Geophys. 2014, 35, 415–430. [Google Scholar] [CrossRef]
  18. Elewa, H.H.; Ramadan, E.-S.M.; Nosair, A.M. Spatial-based hydro-morphometric watershed modeling for the assessment of flooding potentialities. Environ. Earth Sci. 2016, 75, 1–24. [Google Scholar] [CrossRef]
  19. Abuzied, S.M.; Alrefaee, H.A. Mapping of groundwater prospective zones integrating remote sensing, geographic information systems and geophysical techniques in El-Qaà Plain area, Egypt. Hydrogeol. J. 2017, 25, 2067–2088. [Google Scholar] [CrossRef]
  20. Yousif, M.; Hussien, H.M.; Abotalib, A.Z. The respective roles of modern and paleo recharge to alluvium aquifers in continental rift basins: A case study from El Qaa plain, Sinai, Egypt. Sci. Total Environ. 2020, 739, 139927. [Google Scholar] [CrossRef]
  21. Sultan, M.; Metwally, S.; Milewski, A.; Becker, D.; Ahmed, M.; Sauck, W.; Soliman, F.; Sturchio, N.; Yan, E.; Rashed, M. Modern recharge to fossil aquifers: Geochemical, geophysical, and modeling constraints. J. Hydrol. 2011, 403, 14–24. [Google Scholar] [CrossRef]
  22. Abouelmagd, A.; Sultan, M.; Sturchio, N.C.; Soliman, F.; Rashed, M.; Ahmed, M.; Kehew, A.E.; Milewski, A.; Chouinard, K. Paleoclimate record in the Nubian sandstone aquifer, Sinai Peninsula, Egypt. Quat. Res. 2014, 81, 158–167. [Google Scholar] [CrossRef]
  23. Ferede, M.; Haile, A.T.; Walker, D.; Gowing, J.; Parkin, G. Multi-method groundwater recharge estimation at Eshito micro-watershed, Rift Valley Basin in Ethiopia. Hydrol. Sci. J. 2020, 65, 1596–1605. [Google Scholar] [CrossRef]
  24. Uugulu, S.; Wanke, H. Estimation of groundwater recharge in savannah aquifers along a precipitation gradient using chloride mass balance method and environmental isotopes, Namibia. Phys. Chem. Earth Parts A/B/C 2020, 116, 102844. [Google Scholar] [CrossRef]
  25. Yenehun, A.; Dessie, M.; Nigate, F.; Belay, A.S.; Azeze, M.; van Camp, M.; Taye, D.F.; Kidane, D.; Adgo, E.; Nyssen, J. Spatial and temporal simulation of groundwater recharge and cross-validation with point estimations in volcanic aquifers with variable topography. J. Hydrol. Reg. Stud. 2022, 42, 101142. [Google Scholar] [CrossRef]
  26. Gabr, S.; Ghulam, A.; Kusky, T. Detecting areas of high-potential gold mineralization using ASTER data. Ore Geol. Rev. 2010, 38, 59–69. [Google Scholar] [CrossRef]
  27. Elewa, H.H.; Nosair, A.M.; Ramadan, E.M. Determination of potential sites and methods for water harvesting in sinai peninsula by the application of RS, GIS, and WMS techniques. In Flash Floods in Egypt; Springer: Berlin/Heidelberg, Germany, 2020; pp. 313–345. [Google Scholar]
  28. Ayars, J.E.; Christen, E.W.; Hornbuckle, J. Controlled drainage for improved water management in arid regions irrigated agriculture. Agric. Water Manag. 2006, 86, 128–139. [Google Scholar] [CrossRef]
  29. Rao, Y.S.; Prasad, Y.S. Groundwater flow modeling—A tool for water resources management in the khondalite and sandstone formations. Groundw. Sustain. Dev. 2020, 11, 100454. [Google Scholar]
  30. Rohais, S.; Rouby, D. Source-to-Sink analysis of the Plio-Pleistocene deposits in the Suez rift (Egypt). In Arabian Plate and Surroundings: Geology, Sedimentary Basins and Georesources; Springer: Berlin/Heidelberg, Germany, 2020; pp. 115–133. [Google Scholar]
  31. Blair, T.C. Tectonic and hydrologic controls on cyclic alluvial fan, fluvial, and lacustrine rift-basin sedimentation, Jurassic-Lowermost Cretaceous Todos Santos Formation, Chiapas, Mexico. J. Sediment. Res. 1987, 57, 845–862. [Google Scholar]
  32. JICA—Japan International Cooperation Agency. South Sinai Groundwater Resources Study in the Arab Republic of Egypt Study Report; Pacific Consultants International and Sanyu Consaltants Inc.: Tokyo, Japan, 1999; p. 261. [Google Scholar]
  33. Gilboa, Y. Post Eocene Clastics Distribution along the El Qaa Plain, Southern Sinai. Isr. J. Earth Sci. 1980, 29, 197–206. [Google Scholar]
  34. Hammad, F.; Fa, H. Geomorphological and hydrogeological aspects of Sinai Peninsula. Ann. Geol. Surv. Egypt 1980, X, 807–817. [Google Scholar]
  35. Sultan, M.; Yan, E.; Sturchio, N.; Wagdy, A.; Gelil, K.A.; Becker, R.; Manocha, N.; Milewski, A. Natural discharge: A key to sustainable utilization of fossil groundwater. J. Hydrol. 2007, 335, 25–36. [Google Scholar] [CrossRef]
  36. Said, R. Geology of Egypt; Balkema Pub: Rotterdam, The Netherlands, 1990; 722p. [Google Scholar]
  37. Massoud, U.; Santos, F.; El Qady, G.; Atya, M.; Soliman, M. Identification of the shallow subsurface succession and investigation of the seawater invasion to the Quaternary aquifer at the northern part of El Qaa plain, Southern Sinai, Egypt by transient electromagnetic data. Geophys. Prospect. 2010, 58, 267–277. [Google Scholar] [CrossRef]
  38. McClay, K.; Nichols, G.; Khalil, S.; Darwish, M.; Bosworth, W. Extensional tectonics and sedimentation, eastern Gulf of Suez, Egypt. In Sedimentation and Tectonics in Rift Basins Red Sea:-Gulf of Aden; Springer: Berlin/Heidelberg, Germany, 1998; pp. 223–238. [Google Scholar]
  39. CONOCO (Continental Oil Company). Geological Map of Egypt (Scale 1: 500,000); Continental Oil Company Inc.; Freie Universitat Berlin—Universitat Berlin: Berlin, Germany, 1987. [Google Scholar]
  40. Craig, H. Standard for reporting concentrations of deuterium and oxygen-18 in natural waters. Science 1961, 133, 1833–1834. [Google Scholar] [CrossRef] [PubMed]
  41. Aquaveo. Water Modeling Solutions. Support Forum for Sub-Watershed Modeling System Software (WMS), 8.1; Aquaveo LLC.: Provo, UT, USA, 2008; Available online: www.aquaveo.com (accessed on 20 August 2009).
  42. Egyptian Military Survey Department. Sinai Topographic Maps; Egyptian Series; Egyptian Military Survey Department: Cairo, Egypt, 1995.
  43. Finkel, H.H. Water Resources in Arid Zone Settlement, A Case Study in Arid Zone Settlement. The Israeli Experience, 1st ed.; Golany, G., Ed.; Pergamon Press: New York, NY, USA, 1979. [Google Scholar]
  44. Górski, J.; Ghodeif, K. Salinization of shallow water aquifer in El-Qaa coastal plain, Sinai, Egypt. In Proceedings of the 16th Salt Water Intrusion Meeting, Wolin Island, Poland, 12–15 June 2000; Volume 80, pp. 63–72. [Google Scholar]
  45. McDonald, M.G.; Harbaugh, A.W. A Modular Three-Dimensional Finite-Difference Ground-Water Flow Model; US Geological Survey; Superseding Publications: Vienna, Austria, 1988. [Google Scholar]
  46. McDonald, M.G.; Harbaugh, A.W. The history of MODFLOW. Ground Water 2003, 41, 280. [Google Scholar] [CrossRef] [PubMed]
  47. Clark, I.; Fritz, P. Environmental Isotopes in Hydrology; Lewis Publishers: Boca Raton, FL, USA, 1997. [Google Scholar]
  48. Dansgaard, W. Stable isotopes in precipitation. Tellus 1964, 16, 436–468. [Google Scholar] [CrossRef]
  49. Fisher, D.A.; Koerner, R.M.; Paterson, W.S.B.; Dansgaard, W.; Gundestrup, N.; Reeh, N. Effect of wind scouring on climatic records from ice-core oxygen-isotope profiles. Nature 1983, 301, 205–209. [Google Scholar] [CrossRef]
  50. Joussaume, S.; Sadourny, R.; Jouzel, J. A general circulation model of water isotope cycles in the atmosphere. Nature 1984, 311, 24–29. [Google Scholar] [CrossRef]
  51. Jouzel, J.; Merlivat, L. Deuterium and oxygen 18 in precipitation: Modeling of the isotopic effects during snow formation. J. Geophys. Res. Atmos. 1984, 89, 11749–11757. [Google Scholar] [CrossRef]
  52. Sacks, L.A.; Tihansky, A.B. Geochemical and isotopic composition of ground water, with emphasis on sources of sulfate. In The Upper Floridan Aquifer and Intermediate Aquifer System in Southwest Florida; US Department of the Interior; US Geological Survey; Superseding Publications: Vienna, Austria, 1996; Volume 96. [Google Scholar]
  53. Subyani, A.M. Use of chloride-mass balance and environmental isotopes for evaluation of groundwater recharge in the alluvial aquifer, Wadi Tharad, western Saudi Arabia. Environ. Geol. 2004, 46, 741–749. [Google Scholar] [CrossRef]
  54. Cook, P.G.; Böhlke, J.-K. Determining timescales for groundwater flow and solute transport. In Environmental Tracers in Subsurface Hydrology; Springer: Berlin/Heidelberg, Germany, 2000; pp. 1–30. [Google Scholar]
  55. Abu Risha, U.; Mosaad, S.; El Abd, E.S.; Hasanein, A.M. The impact of the geologic setting on the Quaternary aquifer, El-Tur area, Southwest Sinai, Egypt. Arab. J. Geosci. 2017, 10, 1–18. [Google Scholar] [CrossRef]
  56. Collins, A. Geochemistry of Oilfield Waters; Elsevier: Amsterdam, The Netherlands, 1975. [Google Scholar]
  57. Elewa, H.H.; Shohaib, R.E.; Qaddah, A.A.; Nousir, A.M. Determining groundwater protection zones for the Quaternary aquifer of northeastern Nile Delta using GIS-based vulnerability mapping. Environ. Earth Sci. 2013, 68, 313–331. [Google Scholar] [CrossRef]
  58. Revelle, R. Criteria for recognition of the sea water in ground-waters. EOS Trans. Am. Geophys. Union 1941, 22, 593–597. [Google Scholar] [CrossRef]
  59. Sarada, P.; Bhushanavathi, P. Cl-/(CO3 2- + HCO3 -) ratio to evaluate salt water intrusion: A Case Study of Gnanapuram Area of Visakhapatnam, AP, India. Int. J. Sci. Res. 2015, 4, 1311–1313. [Google Scholar]
  60. Nosair, A.M.; Shams, M.Y.; AbouElmagd, L.M.; Hassanein, A.E.; Fryar, A.E.; Abu Salem, H.S. Predictive model for progressive salinization in a coastal aquifer using artificial intelligence and hydrogeochemical techniques: A case study of the Nile Delta aquifer, Egypt. Environ. Sci. Pollut. Res. 2022, 29, 9318–9340. [Google Scholar] [CrossRef] [PubMed]
  61. Custodio, E.; Bruggeman, G. Groundwater Problems in Coastal Areas; UNESCO: Paris, France, 1987. [Google Scholar]
  62. Sonntag, C.; Muennich, K.; Junghans, C.; Klitzsch, E.; Thorweihe, U.; Weistroffer, K.; Loehnert, E.; El-Shazly, E.; Swailem, F. Palaeoclimatic information from deuterium and oxygen-18 in carbon-14-dated north Saharian groundwaters. Groundwater formation in the past. In Isotope Hydrology; International Atomic Enerhy: Vienna, Austria, 1978. [Google Scholar]
  63. Mazor, E.; Nadler, A.; Molcho, M. Mineral springs in the Suez rift valley—Comparison with waters in the Jordan rift valley and postulation of a marine origin. J. Hydrol. 1973, 20, 289–309. [Google Scholar] [CrossRef]
  64. Gat, J.R.; Issar, A. Desert isotope hydrology: Water sources of the Sinai Desert. Geochim. Cosmochim. Acta 1974, 38, 1117–1131. [Google Scholar] [CrossRef]
  65. Wiser, I. Water Isotope System for Data Analysis, Visualization and Electronic Retrieval, Global Isotopes in Precipitation; The GNIP Database; WISER Version 0.7; GNIP: Boulder, CO, USA, 2013. [Google Scholar]
  66. Tantawi, M.; El-Sayed, E.; Awad, M. Hydrochemical and stable isotope study of groundwater in the Saint Catherine-Wadi Feiran area, south Sinai, Egypt. J. Afr. Earth Sci. 1998, 26, 277–284. [Google Scholar] [CrossRef]
  67. Gat, J.R.; Magaritz, M. Climatic variations in the eastern Mediterranean Sea area. Naturwissenschaften 1980, 67, 80–87. [Google Scholar] [CrossRef]
  68. Abd El Samie, S.; Sadek, M. Groundwater recharge and flow in the Lower Cretaceous Nubian Sandstone aquifer in the Sinai Peninsula, using isotopic techniques and hydrochemistry. Hydrogeol. J. 2001, 9, 378–389. [Google Scholar] [CrossRef]
  69. Yechieli, Y.; Starinsky, A.; Rosenthal, E. Evolution of brackish groundwater in a typical arid region: Northern Arava Rift Valley, southern Israel. Appl. Geochem. 1992, 7, 361–374. [Google Scholar] [CrossRef]
  70. Chorley, R.J. Climate and morphometry. J. Geol. 1957, 65, 628–638. [Google Scholar] [CrossRef]
  71. Lyazidi, R.; Hessane, M.A.; Moutei, J.F.; Bahir, M. Developing a methodology for estimating the groundwater levels of coastal aquifers in the Gareb-Bourag plains, Morocco embedding the visual MODFLOW techniques in groundwater modeling system. Groundw. Sustain. Dev. 2020, 11, 100471. [Google Scholar] [CrossRef]
  72. Karki, R.; Srivastava, P.; Kalin, L.; Mitra, S.; Singh, S. Assessment of impact in groundwater levels and stream-aquifer interaction due to increased groundwater withdrawal in the lower Apalachicola-Chattahoochee-Flint (ACF) River Basin using MODFLOW. J. Hydrol. Reg. Stud. 2021, 34, 100802. [Google Scholar] [CrossRef]
  73. Liu, S.; Zhou, Y.; Luo, W.; Wang, F.; McClain, M.E.; Wang, X.-S. A numerical assessment on the managed aquifer recharge to achieve sustainable groundwater development in Chaobai River area, Beijing, China. J. Hydrol. 2022, 613, 128392. [Google Scholar] [CrossRef]
  74. WRRI (Water Resources Research Institute). South Sinai Water Resources; Internal Report; WRRI: St. Thomas, VI, USA, 1999; p. 236. [Google Scholar]
  75. Abel Hafez, H.M.; Gamal, A.A.; Shawki, S.H.; Safaa, S. Numerical modelling for groundwater potentiality in the Quaternary aquifer in El-Qaa Plain area, south Sinai, Egypt. J. Water Sci. 2008, 44, 1–12. [Google Scholar]
Figure 1. The location of the study area.
Water 15 01118 g001
Figure 2. El-Aawag Watershed: (a) Spot 4 satellite image and drainage network; (b) orographic features and topographical elevations (based on an accuracy of 30 m ASTER DEM); (c) slope degree and the names of the sub-basins.
Water 15 01118 g002
Figure 3. Geological map of W. El-Aawag Watershed and El-Qaa Plain (Modified after CONOCO map [39]).
Water 15 01118 g003
Figure 4. Location map of the collected groundwater samples.
Water 15 01118 g004
Figure 5. Piper diagram of the analyzed water samples.
Water 15 01118 g005
Figure 6. Environmental stable isotopes composition (δ18O and δ2H) of groundwater samples from the selected groundwater wells.
Water 15 01118 g006
Figure 7. Site map of the proposed RWH system: (a) the proposed locations of El-Aawag watershed; (b) Wadi Amlaha dam; (c) Wadi Habran dam; (d) Wadi Maier dam.
Water 15 01118 g007
Figure 8. Cross section A-A’ along the site of the proposed dams: (a) Wadi Amlaha; (b) Wadi Maier; (c) Wadi Habran Sub-Watershed.
Water 15 01118 g008
Figure 9. (a) Conceptual (schematic) cross-section of El-Qaa Plain (after [32]); (b) model grids showing rows, columns, active, and inactive cells; (c) model boundary conditions.
Water 15 01118 g009
Figure 10. (a) Aquifer simulated piezometric heads; (b) directions of groundwater flow; (c) piezometric heads of observed wells and those of the piezometric heads calculated in their locations for the simulated model with RMS calculations.
Water 15 01118 g010
Figure 11. Water balance components of the calibrated model.
Water 15 01118 g011
Figure 12. Flow directions and piezometric heads: (a) model scenario No. 1; (b) model scenario No. 2.
Water 15 01118 g012
Figure 13. Flow direction and piezometric heads: (a) scenario No. 3; (b) scenario No. 4; (c) scenario No. 5.
Water 15 01118 g013
Table 2. Chemical compositions and field data of groundwater samples in the El-Qaa Plain aquifer system.
S. No.TDS
(ppm)
pHK+Na+Mg2+Ca2+ClSO4HCO3CO3Na/ClCl/HCO3
ppmepm
1716.87.97216518482447.2522301.041.88
2838.48.03318424602803.7125801.011.86
3531.27.824114234417815.591570.00.991.95
44807.89310312481701.231470.00.941.99
5665.67.91168134921420.431920.01.211.92
63557.99180.514201326.03101.50.00.942.23
76087.941138125020515.631720.01.042.05
8332.88.1273.6122111510.831010.00.991.96
9326.48.08271.31219116.35.99110.50.00.951.81
10339.28.1375.9121811798.5095.50.01.002.11
11345.68.1178.2131911420.43100.50.01.061.95
12364.88.1285.1121912510.831080.01.051.99
13518.47.883103.519381755.991460.00.912.06
14332.88.1365.612241128.5796.50.00.901.99
15339.28.09267.7122511712.881000.00.892.01
16499.27.994105124717015.59134.50.00.952.17
17473.68.13106183216520.4121.50.00.992.33
18345.68.12270.79122511719.398.50.00.932.04
193848.11386.25122212422.8109.50.01.071.95
20588.88.095125145120010.7157.50.00.962.18
213848.08384122813014.7110.50.01.002.02
2212568.017230511065502522000.654.30
2322618.38.13782533710653129200.556.27
Table 3. Stable environmental isotope data (δO18 and δD) for groundwater samples collected from El-Qaa Plain region.
Sample No.δO18‰ vs. SMOWδD%o vs. SMOWDexcess
21−6.28−29.8721.17
8−5.26−27.914.18
11−4.92−22.4216.94
12−4.84−21.717.02
13−4.98−25.0414.8
19−5.1−26.714.1
16−4.99−28.3610.49
Table 4. The annual flood volume of W. El-Aawag sub-watersheds.
Sub-WatershedAverage Volume of Annual Flood
(VAF) (m3)
Peak Flood Flow (Qmax)
(m3/s)
Abyad506,763.0730.21
Amlaha892,588.5653.22
Apoura440,508.7526.26
Araba313,212.4418.67
El-Aawag Trunk Channel1,501,229.9189.50
Gebah953,211.3556.83
Habran979,709.8158.41
Maier1,295,801.2177.26
Moreikh278,182.1916.59
Wagran777,908.2746.38
Waraka514,862.8130.70
Abu Retmat709,834.2742.32
Table 5. Average groundwater extraction over the years.
YearAverage Groundwater Extraction (m3/day) (Domestic and Irrigation Purposes)Source
19712000[32]
19848550
198713,040
199010,270
19928820
200417,000[75]
200818,000
201821,400Current work (based on field investigations and data inventory from the Drinking Water Company, and Water Resource Institute (WRI), South Sinai Branches)
Table 6. The observed well piezometric heads and the computed heads at their locations for the simulated model with of root mean square error (RMS) calculations.
Observation Well No.Observed HeadCalculated HeadErrorAbsolute ErrorSquared Error
155.80.80.80.64
21514.69−0.30.30.9
3109.02−0.90.90.81
42020.80.80.80.64
52525.460.460.460.2116
61010.680.680.680.4624
Root Mean Square Error (RMS) = 0.726
Disclaimer/Publisher’s Note: The statements, opinions and data contained in all publications are solely those of the individual author(s) and contributor(s) and not of MDPI and/or the editor(s). MDPI and/or the editor(s) disclaim responsibility for any injury to people or property resulting from any ideas, methods, instructions or products referred to in the content.

