
Characteristics of Soil Calcium Content Distribution in Karst Dry-Hot Valley and Its Influencing Factors
by
 ,
,
Ya Luo
1,2,*, 
Chunmao Shi
1,2,
Shengtian Yang
3,4,
Yang Liu
1,5,
Shuang Zhao
1,2 and
Chunchang Zhang
1,2 1
School of Geography and Environmental Sciences, Guizhou Normal University, Guiyang 550025, China
2
State Key Laboratory Incubation Base for Karst Mountain Ecology Environment of Guizhou Province, Guiyang 550025, China
3
Academy of Ecological Civilization, Guizhou Normal University, Guiyang 550025, China
4
College of Water Sciences, Beijing Normal University, Beijing 100875, China
5
Guizhou Shiqian Middle School, Tongren 554300, China
*
Author to whom correspondence should be addressed.
Water 2023, 15(6), 1119; https://doi.org/10.3390/w15061119
Submission received: 13 February 2023
/
Revised: 8 March 2023
/
Accepted: 13 March 2023
/
Published: 14 March 2023
(This article belongs to the Special Issue High-Resolution Monitoring and Modelling for Water Resources Management: New Sensors, New Approaches and Applications)
Abstract
:Calcium is an essential macronutrient in soils and plays an important role in the structure and function of an ecosystem. In this study, we selected the Huajiang dry-hot valley region in southwest China as our research object, aiming to comprehend the soil calcium distribution characteristics of different altitudes and vegetation types in this karst dry-hot valley region. The results showed that the mean value of total soil calcium content in the karst dry-hot valley was 13.00 ± 3.28 g·kg−1, and the mean value of the proportion of exchangeable calcium content to total calcium was 50.31%. In the vertical profile, total soil and exchangeable calcium contents decreased with increasing soil depth. With increasing altitude, total soil and exchangeable calcium contents increased. Among the different vegetation types, the total and exchangeable calcium contents of crops were higher than the three natural vegetation types of forest, scrub, and grassland, and the soil calcium content of forest was the lowest. Total soil and exchangeable calcium content in the karst dry-hot valley were affected by rock exposure rate, vegetation coverage, soil thickness, soil organic matter and soil pH. In addition, the unique environmental gradient characteristics at different elevations in the dry-hot valley area may redistribute soil calcium, and the positive vegetation succession may cause a gradual decrease of soil calcium content in the area.
1. Introduction
Calcium is an essential component of soils and plants and plays a key role in the structure and function of ecosystems [1,2]. There is a wide range of calcium content in soils, and the average calcium content of soils in most regions is higher than that of plant nutrients such as N, P, S, and Mg [3]. Karst regions with widespread carbonate rocks and high rock exposure have soils rich in calcium due to the chemical properties inherited from the parent rock [4,5]. The soil calcium content in southwest China is 1 to 3%, which is two to three times higher than that of silicate rock soils at the same latitude [6]. A high calcium level is an important ecological factor in karst regions [7], which obviously affects the plant diversity of karst ecosystems and determines the species and number of soil microorganisms [8,9]. However, changes in climatic conditions affect soil calcium retention and transport, resulting in differences in the stability and longevity of soil calcium under different climatic conditions. Due to these disparities, it is impossible to provide a comprehensive picture of soil calcium distribution patterns based on the findings of studies conducted in one or two climatic zones. Therefore, a clear understanding of soil calcium distribution patterns under different climatic conditions remains an important research question in the field of soil calcium ecological cycle and balance.
Numerous researchers have conducted studies on soil calcium in different climatic zones and made substantial progress. In humid areas, soil calcium content increases with altitude and decreases with soil depth [10]. In different geomorphic regions, soil calcium content is ranked as follows: slope > depression > saddle area > plain area [11]. In humid karst areas, soil calcium content near bare rock is significantly higher than near non-bare rock, and soil calcium content gradually increases with the degree of stone desertification [12]. In semi-arid areas, soil calcium is susceptible to loss due to water or wind erosion, and slope and elevation are significant factors affecting soil calcium content at various depths [13]. In arid regions, the soil calcium content of broadleaf forests is over three times higher than that in coniferous forests. The soil surface calcium loss of mature broadleaf forests is higher than that of mixed coniferous forests [14]. Soil calcium content is significantly higher in the arid regions of northwest China than in the humid regions of southeast China, which is related to the calcium content of the parent rock in this region [15]. The characteristics of soil calcium distribution and influencing factors are obverted in different climatic zones.
Different climatic zones impact the distribution of soil calcium due to their specific climatic characteristics. In contrast, the dry-hot valley, as a valley-type arid zone embedded in a subtropical humid and semi-humid climate [16], shows a distinct environmental gradient in temperature, precipitation, and soil properties within the valley. The dry and wet seasons are distinct, and moisture and light and heat conditions are highly imbalanced [17,18], resulting in soils in the region being subject to both humid and arid climatic conditions within a hydrological year. How the combination of a typical karst region and a dry-hot valley climate leads to the distribution of soil calcium in karstic dry and hot river valleys remains unclear. The answer to this question is an important addition to the body of knowledge of the soil calcium ecological cycle and balance and a realistic need to guide ecological construction and sustainable land management in the karst dry-hot valley region.
This study selected a small watershed with similar soil and lithology substratum conditions inside the dry-hot valley as the sampling area. The soil samples were obtained through in situ sampling, while the environmental conditions of soil and vegetation near the sampling site were investigated. The objectives of this study are: (1) to clarify the status and distribution characteristics of total soil and exchangeable calcium contents of different elevations and vegetation covers in the karst dry-hot valley; (2) to reveal the influencing factors of total soil and exchangeable calcium distribution characteristics in the karst dry-hot valley to discuss the effects of environmental gradient changes at different elevations, and vegetation succession on soil calcium contents.
2. Materials and Methods
2.1. Overview of the Study Area
The study area is located in the Huajiang Canyon area in Guizhou Province, southwestern China, with a geographical location of 105°36′30″ E–105°46′30″ E, 25°39′13″ N–25°41′00″ N (Figure 1). The elevation is 446–1360 m, and the relative height difference is 914 m. The surface landscape distribution is discontinuous, and the rock desertification is severe; the rock desertification area accounts for 53.82% of the total area. The climate in the area is a central subtropical monsoon, dry and hot, with an average annual temperature above 18.4 °C, an average annual rainfall of 1100 mm, and an average annual evaporation of 1200–1300 mm (Figure 2). From May to October, precipitation accounts for about 83% of the total annual precipitation, and the seasonality of precipitation is obvious, with the typical characteristics of a dry-hot valley.
The soil layer in the study area is shallow and discontinuous, with patchy distribution. Soils are mainly sandy, loamy limestone soils, and soil erosion is serious due to the concentration of precipitation and large relative height differences and slope. The vegetation is sparse, with low forest canopy coverage, little native vegetation and mainly artificial vegetation. The distributed plants include compound feather-leaved Koelreuteria bipinnata, Zanthoxylum planispinum var. dintanensis, Broussonetia papyrifera, and many others.
2.2. Soil Sampling and Determination
The sub-basin area is 8.09 km2, and the exposed strata are mainly the Middle and Upper Triassic strata, including the Yangliu and Longtou carbonate formations, which are pure and thick. Soil sampling points with equal spacing (about 0.4 km apart) were set up in the Dingtan sub-basin, and 45 soil sampling points were set up (Figure 1c).
To reduce the effects of continuous rainfall, drought, and rapid vegetation growth period on soil calcium content, field survey sampling was conducted from 25–28 September 2020. Towards the end of the rainy season in the Huajiang dry-hot valley, the weather during the sampling period was cloudy. The sampling types were divided into disturbed samples and in situ soil samples to determine soil calcium content and properties, respectively. Each sampling site consisted of three small soil samples to form a mixed sample, and the individual soil samples collected by the quadrat method weighed about 1 kg. Soil samples were obtained by stratified sampling, as the average soil depth in the study area was 60 cm, with a shallow depth of 40 cm. The soil samples were divided into the surface (0–10 cm), intermediate (10–20 cm), and deep soil (20–30 cm) samples to ensure a consistent soil sampling depth. While collecting soil samples, the basic information such as location, elevation, slope, thickness of the soil layer, exposed rock, and vegetation type of the sampling site were recorded in detail (Table A1 in Appendix A). Soil samples were collected and brought back to the laboratory, naturally dried, ground through a 0.149 mm nylon mesh sieve, and then sealed and stored for the determination of soil calcium content.
2.3. Soil Calcium Content Determination
Soil whole calcium and exchangeable calcium contents were determined by sample pretreatment with concentrated nitric acid–hydrofluoric acid–perchloric acid digestion, ammonium acetate oscillatory leaching, and deionized water oscillatory leaching, respectively, and measured directly on an atomic absorption spectrophotometer (PinAAcle 900H, PerkinElmer, Waltham, MA, USA) [19]. Soil whole calcium and exchangeable calcium contents were reported in (g·kg−1) mass, and their stoichiometric ratios were calculated based on mass (g·kg−1).
The physicochemical properties of the soil were analyzed according to the standard method recommended by the Chinese Society of Soil Science [20] (Table 1). Soil organic matter was determined by the potassium dichromate oxidation–external heating method; soil acidity was measured by pH and determined by potentiometric method (PHS-3C, Shanghai INESA Scientific Instrument Co., Ltd., Shanghai, China); soil particle composition (clay, powder and sand) was determined by Malvern laser particle size meter (Mastersizer 2000, Malvern, Worcestershire, UK); and soil bulk density was determined by the ring knife method.
2.4. Data Processing
The raw data of total soil and exchangeable calcium contents were normally distributed, and the data were analyzed without any transformation. The means of soil calcium contents were compared at p < 0.05 by ANOVA and Duncan’s method with the Least Significant Difference (LSD) test. Correlations between soil calcium content and soil properties and environmental factors were analyzed using Pearson correlation matrices using IBM SPSS Statistics 22.0 software (SPSS Inc., Chicago, IL, USA). Soil calcium content statistics were plotted using OriginPro 2021 (Origin Lab Inc., Northampton, MA, USA).
3. Results
3.1. Soil Calcium Content Statistics
Table 2 show that in the vertical profile, the total soil and exchangeable calcium content decreased with increasing soil depth, and the proportion of exchangeable calcium content to total calcium increased (the mean value of the proportion was 50.31%). In the 0–10, 10–20, and 20–30 cm soil layers, the total soil calcium content was 13.51, 13.07, and 12.41 g·kg−1. The exchangeable calcium content was 6.78, 6.48, and 6.35 g·kg−1, respectively. The proportion of exchangeable calcium to total calcium was 50.19, 49.58, and 51.17%, in that order.
3.2. Soil Calcium Content at Different Altitudes
Figure 3 shows that the total soil and exchangeable calcium contents increased significantly (p < 0.05) with increasing elevation and then gradually decreased. At different altitudes, the mean values of total soil calcium content were 10.44, 14.15, 13.75, and 11.96 g·kg−1, and the mean values of exchangeable calcium content were 6.17, 7.69, 6.25, and 5.66 g·kg−1 at 500–700, 700–900, 900–1100, and 1100 m above elevation, respectively. The total soil and exchangeable calcium contents increased and then decreased in the 0–10, 10–20, 20–30 cm soil layers with increasing elevation.
3.3. Soil Calcium Content of Different Vegetation Types
From Figure 4, it can be seen that in different vegetation types, the whole calcium and exchangeable calcium contents of crops were significantly higher (p < 0.05) than the three natural vegetation types of forest, scrub and grassland; among the three natural vegetation types, the calcium content of scrub was again relatively higher. The mean values of total soil calcium and exchangeable calcium were 11.57, 13.31, 11.87, and 15.30 g·kg−1 for forest, scrub, grassland, and crops, respectively, and 5.88, 6.64, 6.32, and 7.13 g·kg−1 for exchangeable calcium, respectively, among the different vegetation types. In the 10–20 cm soil layer, the lowest total and exchangeable calcium content were found in crops, the highest total and exchangeable calcium content in scrub and the lowest exchangeable calcium content in the forest; in the 20–30 cm soil layer, the highest total and exchangeable calcium content were found in scrub and the lowest total and exchangeable calcium content in forest.
3.4. Relationship between Soil Calcium Content and Environmental Factors and Soil Properties
Pearson correlation coefficient statistics (Figure 5) showed that total soil and exchangeable calcium contents were significantly correlated with soil bulk, soil pH, soil organic matter content, vegetation cover, and rock exposure rate (p < 0.05), and the correlation with soil thickness was not significant (p > 0.05). As seen in Figure 6, both total soil and exchangeable calcium contents decreased with increasing vegetation cover (p < 0.05) and increased with increasing rock exposure rate (p < 0.05) under the influence of environmental factors; total soil calcium content decreased with increasing soil thickness and exchangeable calcium content increased with increasing soil thickness (Figure 6a–c). Under the influence of soil properties, total soil and exchangeable calcium content increased with increasing soil organic matter content (p < 0.05), decreased with increasing soil bulk weight (p < 0.05) and increased with increasing soil pH (Figure 6d–f).
4. Discussion
4.1. Uniqueness of Calcium Content of Soils in Karst Dry-Hot Valleys
From Table 2 and Figure 3, it can be seen that the soil calcium content of the karst dry-hot valley is high, with a mean value of 50.31% of exchangeable calcium content as a proportion of total calcium, which may be due to the combination of calcium-rich properties of carbonate rocks and the dry, hot climate. Compared with karstic hills [12] and karstic crest slopes [21], karst dry-hot valley soils have higher total and exchangeable calcium contents. The mean value of the proportion of exchangeable calcium to total calcium (59.75%) is higher in karst hills [12] than in karst dry-hot valleys. Calcium in soils is mainly derived from the soil-forming parent material, and the high-calcium limestone weathering and dissolution can provide sufficient calcium elements for soils [3]. Carbonate rocks with pure and thick layers are widely distributed in the karst dry-hot valley, and the rate of rock exposure is high. Calcium elements from the weathering and dissolution of carbonate rocks directly enter the surface soil, making the area’s limestone soils rich in calcium elements due to the chemical properties of the inherited parent rock.
The uneven rainfall and heat caused by the dry and hot climate provide dynamic conditions for soil calcium replenishment and transport. The dry and wet seasons in karst dry-hot valleys are differentiated, with high temperatures and concentrated and intense rainfall in the wet season, which largely increases the loss of calcium from the soil. Studies have shown that calcium in groundwater mainly originates from rainwater and bedrock [22], and rock fissures are widely developed in karst areas. During rainfall, calcium in the soil will leak along rock fissures into underground caves or rivers with rainwater, forming underground leakage [23]. However, the high temperature and high intensity of rainfall during the wet season also accelerate the weathering and dissolution rate of carbonate rocks [24,25], and the amount of calcium entering the soil increases, replenishing some or all of the soil calcium lost in the soil due to rainfall. During the dry season, when rainfall is less in the dry-hot karst valley, the temperature is higher than in the same latitude due to the deep topography [26], and the weathering and dissolution of carbonate rocks continue to provide calcium to the soil. Due to the low rainfall, it is difficult to form runoff on the slope, and the lack of water in the soil, the loss and leakage of soil calcium are low and the accumulation increases.
4.2. Complexity of the Effect of Altitude on Soil Calcium Distribution
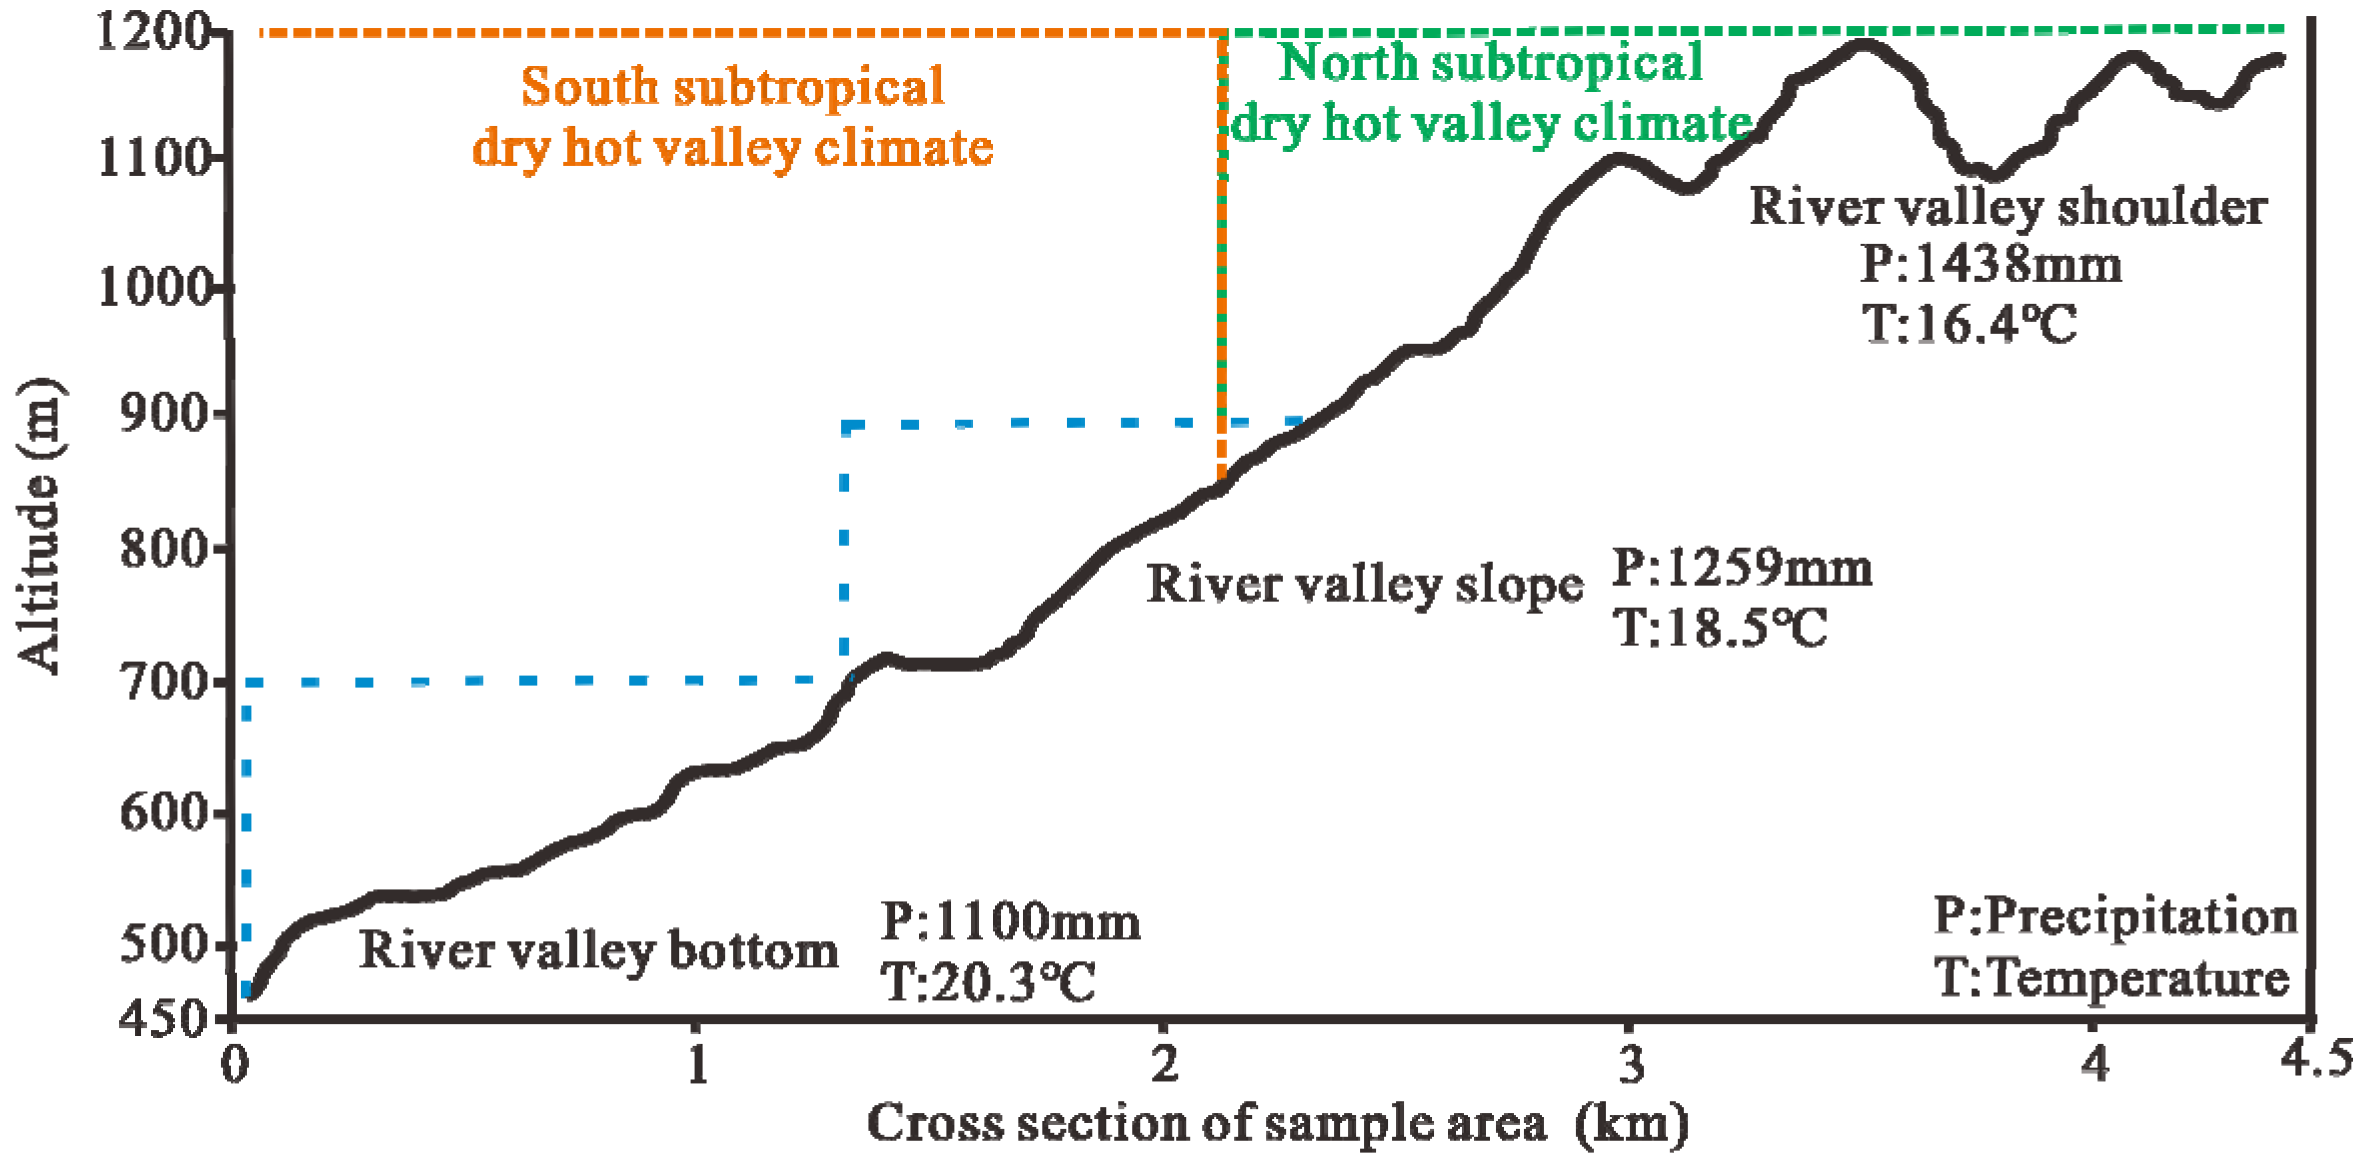
It has been shown that soil calcium content increases with increasing altitude [10,27]. In the present study, soil calcium content increased and then decreased with altitude, showing a significant increase (p < 0.05) at 700–900 m above sea level (Figure 3). Elevation, as a highly integrated topographic factor, can cause changes in environmental factors such as combined water and heat conditions (temperature, precipitation) and soil nutrients [28,29,30]. The vertical climate variation within the Huajiang dry-hot valley is obvious. The average annual rainfall and temperature from the valley floor and slope to the valley shoulder show obvious gradients (Figure 7), and the climate of the southern subtropical dry-hot valley and the northern subtropical dry-hot valley converge at 700–900 m above sea level, forming more complex hydrothermal changes, which may be an important factor causing the soil calcium content at 700–900 m above altitude to be significantly higher than at 500–700, 900–1100, and 1100 m above elevation. The soil organic matter, as an important soil organic matter component, is the most important factor in the soil. As an important soil nutrient, soil organic matter has strong adsorption and complexation of calcium ions in limestone soils, which can inhibit calcium loss and migration to a certain extent [31,32]. It has been shown that the characteristics of low temperature and high humidity at the middle and high altitudes are more favorable for organic matter accumulation [33,34], which may also be one of the reasons for the altitudinal differences in soil calcium content. In conclusion, the hydrothermal conditions and soil properties at different altitudes in the dry-hot valley area show obvious environmental gradient characteristics, which may lead to significant differences in the spatial distribution of soil calcium.
4.3. Specificity of the Effect of Vegetation on Soil Calcium Distribution
It has been shown that soil calcium content is higher in crops fields than in forests, scrubs, and grasslands [22]. Figure 4 shows that crops has the highest soil calcium content among the four different vegetation types. Studies have shown that the application of organic fertilizers increases soil calcium content, the application of nitrogen and phosphorus fertilizers also increases soil calcium content, and the application of potassium fertilizers may reduce the effect on soil calcium content [35,36,37,38]. The types of fertilizers applied in the Huajiang dry-hot valley area are mainly nitrogen, phosphorus, and potassium fertilizers, accompanied by the application of farmyard manure and organic fertilizers, and the simultaneous application of these fertilizer types may directly lead to an increase in soil calcium content under crops.
Soil-vegetation reciprocal feedback loops are important factors influencing the geochemical transformation of calcium in the soil surface system [39,40]. The soil calcium content of this study’s four different vegetation types was, in descending order: crops, scrub, grassland, and forest (Figure 4), with forest having the lowest soil calcium content. As seen in Figure 6a, the soil calcium content decreased significantly with increasing vegetation cover. Related studies have also shown that the natural recovery of vegetation can improve soil development conditions and attenuate soil erosion [41,42]. However, on longer time scales, there was an decrease in soil calcium content with the development of ecosystem positive succession [43]. This is due to the positive vegetation succession leading to an increase in plant growth and vegetation cover as well as in the type and quantity of dead litter, humus, and soil microorganisms in the understory [44,45]. It also enhances the complexation of calcium with organic compounds in the soil, forming more complexed calcium [46]. The complexed calcium in the soil is easily absorbed by plants, and the transpiration of vegetation is enhanced due to the high temperature in the karst dry-hot valley area, while the transpiration of forest is stronger than that of scrub, grassland and crops and the soil calcium absorption capacity of forest was higher than that of the other three vegetations. Generally, the soil is thicker where forest vegetation can grow in karst areas and the root system extends into the rock crevices. During rainfall, a large amount of complexed calcium in the soil is leached [47] and precipitated to deep soil or rock crevices by gravitational potential energy, making the shallow soil calcium content lower than that of scrub, grassland and crops. This suggests that the positive vegetation succession in the karst dry-heat valley may, to some extent, lead to a decrease in soil calcium content.
4.4. Limitations
Due to the lack of typical profiles and research tools, this study only considers the soil calcium distribution characteristics of the shallow surface in the dry-hot valley area, and no research has been conducted on soil calcium in the pores (fissures) of the karst dry-hot valley. The steep topography of the karst dry-hot valley and the concentrated and high intensity of rainfall in the wet season cause more serious soil erosion. Soil nutrients are leaked through solutes, and soil nutrient leakage is positively correlated with rainfall [48,49]. The widespread development of carbonate rocks and pore (fissure) spaces in the study area provide sites and channels for the accumulation and transport of surface soils and solute sediments [50], making surface soil erosion occurring in karst dry-hot valleys accompanied by subsurface leakage processes. Surface soil erosion and subsurface soil leakage may lead to more complex soil calcium fugacity and transport processes.
Although the soil calcium content in the karst dry-hot valley is still high and carbonate rocks continuously input calcium to the soil during weathering and dissolution, the soil calcium content may decrease as the vegetation cover increases and the soil calcium is leached by high-intensity local rainfall. If the soil calcium content in the karst dry-hot valley area continues to decrease, other nutrients in the soil will also change, and the soil may not be sufficient to supply more vegetation growth in the future. Achieving a relative balance between the degree of vegetation restoration, the rate of soil calcium leaching and the rate of calcium input from carbonate rocks in the karst dry-hot valley remains an important issue concerning the sustainable use of local soils.
4.5. Application Value
The soil calcium content of different elevation gradients in the karst dry-hot valley varies significantly. This result inspires vegetation construction and land use in the dry-hot valley area. Soil calcium in the karst dry-hot valley area forms the distribution characteristics of “high altitude with low heat and more water and less calcium, middle altitude with alternating hot and cold water and heat with most calcium, and low altitude with high heat and less water and less calcium” at different altitudes, so changes in soil calcium content at different altitudes may lead to changes in other soil properties. Therefore, the karst dry-hot valley should reasonably allocate land resources and agricultural planting patterns according to the soil fertility and water-heat combination at different altitudes to promote the coordinated use of water-soil resources.
5. Conclusions
This study found that the total soil and exchangeable calcium contents were higher in a karst dry-hot valley. Still, the differences were not significant among different soil layers in the vertical profile. The total soil and exchangeable calcium content increased and decreased with increasing altitude. Among the different vegetation types, the total soil and exchangeable calcium contents of crops were higher than the three natural vegetation types of forest, scrub and grassland, with scrub being higher than grassland and forest being the lowest. The increase in rock exposure rate, soil organic matter, and soil pH increased the soil calcium content, and the increase in vegetation cover and soil bulk weight decreased the soil calcium content. The increase in soil thickness made the total soil calcium content decrease and the exchangeable calcium content increase. Our results indicate that the unique environmental gradient characteristics at different elevations in the dry-hot valley area may redistribute soil calcium, and the positive vegetation succession may cause a gradual decrease of soil calcium content in the area.
Author Contributions
Conceptualization, Y.L. (Ya Luo) and C.S.; methodology, C.S.; software, C.S.; validation, C.S. and S.Z.; formal analysis, C.S.; investigation, C.S., S.Z., C.Z. and Y.L. (Yang Liu); resources, S.Y. and Y.L. (Ya Luo); data curation, C.S. and Y.L. (Yang Liu); writing—original draft preparation, C.S.; writing—review and editing, C.S. and Y.L. (Ya Luo); visualization, C.S.; supervision, Y.L. (Ya Luo) and S.Y.; project administration, Y.L. (Ya Luo); funding acquisition, S.Y. and Y.L. (Ya Luo). All authors have read and agreed to the published version of the manuscript.
Funding
This research was supported by the National Natural Science Foundation of China (Grant number: U1812401), Science and Technology Support Plan in Guizhou Province (Grant number: [2020]4Y016), the Key Project of Philosophy and Social Sciences Planning in Guizhou Province (Grant number: 19GZZD07).
Informed Consent Statement
Not applicable.
Data Availability Statement
Not applicable.
Conflicts of Interest
The authors declare no conflict of interest.
Appendix A

Table A1.
Environmental information sheet for sampling sites.
| Number | Latitude (°N) | Longitude (°E) | Elevation (m) | Vegetation Types |
|---|---|---|---|---|
| 1 | 25°38′0.698″ N | 105°38′34.744″ E | 1103.92 | S |
| 2 | 25°38′0.698″ N | 105°39′4.243″ E | 1153.77 | S |
| 3 | 25°38′16.130″ N | 105°38′19.995″ E | 1062.27 | G |
| 4 | 25°38′16.130″ N | 105°38′34.744″ E | 1087.73 | C |
| 5 | 25°38′16.130″ N | 105°38′49.493″ E | 965.41 | C |
| 6 | 25°38′16.130″ N | 105°39′4.243″ E | 1041.86 | S |
| 7 | 25°38′31.562″ N | 105°38′5.246″ E | 1029.62 | S |
| 8 | 25°38′31.562″ N | 105°38′19.995″ E | 1009.46 | G |
| 9 | 25°38′31.562″ N | 105°38′34.744″ E | 1014.45 | G |
| 10 | 25°38′31.562″ N | 105°38′49.493″ E | 1017.79 | C |
| 11 | 25°38′31.562″ N | 105°39′4.243″ E | 922.52 | S |
| 12 | 25°38′31.562″ N | 105°39′18.992″ E | 910.51 | C |
| 13 | 25°38′46.994″ N | 105°38′5.246″ E | 967.17 | S |
| 14 | 25°38′46.994″ N | 105°38′19.995″ E | 951.72 | F |
| 15 | 25°38′46.994″ N | 105°38′34.744″ E | 955.55 | F |
| 16 | 25°38′46.994″ N | 105°38′49.493″ E | 907.59 | G |
| 17 | 25°38′46.994″ N | 105°39′4.243″ E | 930.00 | G |
| 18 | 25°38′46.994″ N | 105°39′18.992″ E | 935.57 | S |
| 19 | 25°39′2.426″ N | 105°38′5.246″ E | 922.55 | S |
| 20 | 25°39′2.426″ N | 105°38′19.995″ E | 887.91 | S |
| 21 | 25°39′2.426″ N | 105°38′34.744″ E | 893.83 | G |
| 22 | 25°39′2.426″ N | 105°38′49.493″ E | 888.82 | S |
| 23 | 25°39′2.426″ N | 105°39′4.243″ E | 921.15 | G |
| 24 | 25°39′2.426″ N | 105°39′18.992″ E | 912.69 | S |
| 25 | 25°39′2.426″ N | 105°39′33.741″ E | 910.43 | S |
| 26 | 25°39′17.858″ N | 105°38′5.246″ E | 837.64 | F |
| 27 | 25°39′17.858″ N | 105°38′19.995″ E | 834.95 | G |
| 28 | 25°39′17.858″ N | 105°38′34.744″ E | 789.18 | G |
| 29 | 25°39′17.858″ N | 105°38′49.493″ E | 754.05 | F |
| 30 | 25°39′17.858″ N | 105°39′4.243″ E | 903.63 | G |
| 31 | 25°39′17.858″ N | 105°39′18.992″ E | 869.52 | C |
| 32 | 25°39′17.858″ N | 105°39′33.741″ E | 820.41 | C |
| 33 | 25°39′33.290″ N | 105°38′34.744″ E | 775.35 | S |
| 34 | 25°39′33.290″ N | 105°38′49.493″ E | 718.15 | F |
| 35 | 25°39′33.290″ N | 105°39′4.243″ E | 688.53 | G |
| 36 | 25°39′33.290″ N | 105°39′18.992″ E | 689.05 | C |
| 37 | 25°39′33.290″ N | 105°39′33.741″ E | 749.82 | S |
| 38 | 25°39′48.722″ N | 105°38′49.493″ E | 705.53 | C |
| 39 | 25°39′48.722″ N | 105°39′4.243″ E | 628.87 | G |
| 40 | 25°39′48.722″ N | 105°39′18.992″ E | 638.24 | G |
| 41 | 25°39′48.722″ N | 105°39′33.741″ E | 655.93 | G |
| 42 | 25°40′4.154″ N | 105°39′4.243″ E | 615.7 | S |
| 43 | 25°40′4.154″ N | 105°39′18.992″ E | 532.66 | G |
| 44 | 25°40′19.586″ N | 105°39′18.992″ E | 542.58 | S |
| 45 | 25°40′19.586″ N | 105°39′33.741″ E | 513.91 | S |
Note: F: forest; S: scrub; G: grassland; C: crops.
References
- Xu, B.; Hou, Z.-Q.; Griffin, W.L.; Lu, Y.; Belousova, E.; Xu, J.-F.; O’Reilly, S.Y. Recycled volatiles determine fertility of porphyry deposits in collisional settings. Am. Miner. 2021, 106, 656–661. [Google Scholar] [CrossRef]
- Xu, B.; Hou, Z.-Q.; Griffin, W.L.; Yu, J.-X.; Long, T.; Zhao, Y.; Wang, T.; Fu, B.; Belousova, E.; O’Reilly, S.Y. Apatite halogens and Sr-O and zircon Hf-O isotopes: Recycled volatiles in Jurassic porphyry ore systems in southern Tibet. Chem. Geol. 2022, 605, 120924. [Google Scholar] [CrossRef]
- Weil, R.R.; Brady, N.C. The Nature and Properties of Soils, 15th ed.; Pearson Education: Columbus, OH, USA, 2017; pp. 25–45. [Google Scholar]
- Xiao, P.; Xiao, B.; Adnan, M. Effects of Ca2+ on migration of dissolved organic matter in limestone soils of the southwest China karst area. Land Degrad. Dev. 2021, 32, 5069–5082. [Google Scholar] [CrossRef]
- Tang, T. Surface sediment characteristics and tower karst dissolution, Guilin, southern China. Geomorphology 2003, 49, 231–254. [Google Scholar] [CrossRef]
- National Soil Census Office. Soil Acidity, Calcium Carbonate and Base Exchange Capacity. The Soil of China; China Agriculture Press: Beijing, China, 1998; Volume 17, pp. 860–864.
- Meng, W.; Ren, Q.; Tu, N.; Leng, T.; Dai, Q. Characteristics of the Adaptations of Epilithic Mosses to High-Calcium Habitats in the Karst Region of Southwest China. Bot. Rev. 2022, 88, 204–219. [Google Scholar] [CrossRef]
- He, X.J.; Wang, L.; Ke, B.; Yue, Y.M.; Wang, K.L.; Cao, J.H.; Xiong, K.N. Progress on ecological conservation and restoration for China Karst. Acta Ecol. Sin. 2019, 39, 6577–6585. [Google Scholar]
- Cheng, C.; Li, Y.; Long, M.; Gao, M.; Zhang, Y.; Lin, J.; Li, X. Moss biocrusts buffer the negative effects of karst rocky desertification on soil properties and soil microbial richness. Plant Soil 2020, 475, 153–168. [Google Scholar] [CrossRef]
- Shao, H.F.; Xu, Z.C. Relationship between the calcium content in soil and the calcium content of flue-cured tobacco in Enshi tobacco-growing area. Afr. J. Agric. Res. 2011, 6, 2788–2793. [Google Scholar] [CrossRef]
- Hui, Y.; Jianhong, L.; Jiarui, C.; Jianhua, C. Soil Calcium Speciation at Different Geomorphological Positions in the Yaji Karst Experimental Site in Guilin, China. J. Resour. Ecol. 2015, 6, 224–229. [Google Scholar] [CrossRef]
- Wei, X.; Deng, X.; Xiang, W.; Lei, P.; Ouyang, S.; Wen, H.; Chen, L. Calcium content and high calcium adaptation of plants in karst areas of southwestern Hunan, China. Biogeosciences 2018, 15, 2991–3002. [Google Scholar] [CrossRef] [Green Version]
- Sun, Y.Z.; Guo, W.X.; Weindorf, D.C.; Sun, F.J.; Deb, S.; Cao, G.F.; Neupane, J.; Lin, Z.; Raihan, A. Field-scale spatial variability of soil calcium in a semi-arid region: Implications for soil erosion and site-specific management. Pedosphere 2021, 31, 705–714. [Google Scholar] [CrossRef]
- McLaughlin, J.W. Forest Soil Calcium Dynamics and Water Quality: Implications for Forest Management Planning. Soil Sci. Soc. Am. J. 2014, 78, 1003–1020. [Google Scholar] [CrossRef]
- Wang, X.; Liu, X.; Wang, W. National-scale distribution and its influence factors of calcium concentrations in Chinese soils from the China Global Baselines project. J. Geochem. Explor. 2021, 233, 106907. [Google Scholar] [CrossRef]
- Yang, J.D.; Zhang, Z.M.; Shen, Z.H.; Ou, X.Q.; Geng, Y.P.; Yang, M.Y. Review of research on the vegetation and environment of dry-hot valleys in Yunnan. Biodivers. Sci. 2016, 24, 462–474. [Google Scholar] [CrossRef]
- Yang, J.; El-Kassaby, Y.; Guan, W. Multiple Ecological Drivers Determining Vegetation Attributes across Scales in a Mountainous Dry Valley, Southwest China. Forests 2020, 11, 1140. [Google Scholar] [CrossRef]
- Guo, Y.; Wang, Q.; Fan, M. Exploring the Relationship between the Arid Valley Boundary’s Displacement and Climate Change during 1999–2013 in the Upper Reaches of the Min River, China. ISPRS Int. J. Geo-Inf. 2017, 6, 146. [Google Scholar] [CrossRef] [Green Version]
- Jones, J.B., Jr. Soil test methods: Past, present, and future use of soil extractants. Commun. Soil Sci. Plant Anal. 1998, 29, 1543–1552. [Google Scholar] [CrossRef]
- Lu, R.Q. Chemical Analyzing Method on Soil Agriculture; China Agriculture Science and Technology Press: Beijing, China, 2000; Volume 2–23, pp. 12–282. [Google Scholar]
- Li, Z.Y.; Wei, X.H.; Li, B.S.; Guan, G.C.; Xu, X.Z.; Lei, L. Spatial distribution of soil calcium on natural slope of Karst Peak-cluster in Northern Guangdong Province. Bull. Soil Water Conserv. 2016, 36, 62–68. [Google Scholar] [CrossRef]
- Han, G.; Eisenhauer, A.; Zeng, J.; Liu, M. Calcium Biogeochemical Cycle in a Typical Karst Forest: Evidence from Calcium Isotope Compositions. Forests 2021, 12, 666. [Google Scholar] [CrossRef]
- Peng, X.; Dai, Q.; Ding, G.; Li, C. Role of underground leakage in soil, water and nutrient loss from a rock-mantled slope in the karst rocky desertification area. J. Hydrol. 2019, 578, 124086. [Google Scholar] [CrossRef]
- Hattanji, T.; Matsukura, Y. Factors Controlling Weathering Rates of Carbonate Rocks in Soil: An Approach from a Field Weathering Experiment. J. Geogr. 2017, 126, 355–367. [Google Scholar] [CrossRef] [Green Version]
- Zhao, Z.; Shen, Y. Rain-induced weathering dissolution of limestone and implications for the soil sinking-rock outcrops emergence mechanism at the karst surface: A case study in southwestern China. Carbonates Evaporites 2022, 37, 69. [Google Scholar] [CrossRef]
- Shen, Z.; Zhang, Z.; Hu, J.; Han, J.; Yang, J.; Ying, L. Protection and utilization of plant biodiversity resources in dry valleys of Southwest China. Biodivers. Sci. 2016, 24, 475–488. [Google Scholar]
- Liu, J.; Long, J.; Li, J.; Li, H. Differentiation characteristics of calcium bio-absorption capacity of dominant tree species with altitude in typical karst mountain area. Ecol. Environ. Sci. 2021, 30, 1589–1598. [Google Scholar] [CrossRef]
- Soomro, A.G.; Babar, M.M.; Ashraf, A.; Memon, A. The Relationship between Precipitation and Elevation of the Watershed in the Khirthar National Range. Mehran Univ. Res. J. Eng. Technol. 2019, 38, 1067–1076. [Google Scholar] [CrossRef] [Green Version]
- Phan, T.N.; Kappas, M.; Tran, T.P. Land Surface Temperature Variation Due to Changes in Elevation in Northwest Vietnam. Climate 2018, 6, 28. [Google Scholar] [CrossRef] [Green Version]
- Zhao, M.Y.; Zhao, W.W.; Qiu, Y.; Feng, Q.; Zhong, L.N. Scale effect analysis of the influence of land-use types and environmental factors on soil nutrients: A case study in loess areas of Northern Shaanxi, China. Fresenius Environ. Bull. 2014, 23, 787–794. [Google Scholar]
- Chen, X.; Opoku-Kwanowaa, Y.; Li, J.; Wu, J. Application of Organic Wastes to Primary Saline-alkali Soil in Northeast China: Effects on Soil Available Nutrients and Salt Ions. Commun. Soil Sci. Plant Anal. 2020, 51, 1238–1252. [Google Scholar] [CrossRef]
- Rowley, M.C.; Grand, S.; Verrecchia, É.P. Calcium-mediated stabilisation of soil organic carbon. Biogeochemistry 2018, 137, 27–49. [Google Scholar] [CrossRef] [Green Version]
- Huynh, C.V.; Nguyen, P.T.; Pham, T.G.; Nguyen, H.T.; Nguyen, M.T.H.; Tran, P.T. Evaluation of Soil Organic Matter Content under Topographic Influences in Agroforestry Ecosystems: A Study in Central Vietnam. Eurasian Soil Sci. 2022, 55, 1041–1051. [Google Scholar] [CrossRef]
- Li, C.; Xiao, C.; Li, M.; Xu, L.; He, N. A global synthesis of patterns in soil organic matter and temperature sensitivity along the altitudinal gradient. Front. Environ. Sci. 2022, 10, 959292. [Google Scholar] [CrossRef]
- Ma, Y.; Ma, J.; Peng, H.; Weng, L.; Chen, Y.; Li, Y. Effects of iron, calcium, and organic matter on phosphorus behavior in fluvo-aquic soil: Farmland investigation and aging experiments. J. Soils Sediments 2019, 19, 3994–4004. [Google Scholar] [CrossRef]
- Wan, D.; Ma, M.; Peng, N.; Luo, X.; Chen, W.; Cai, P.; Wu, L.; Pan, H.; Chen, J.; Yu, G.; et al. Effects of long-term fertilization on calcium-associated soil organic carbon: Implications for C sequestration in agricultural soils. Sci. Total. Environ. 2021, 772, 145037. [Google Scholar] [CrossRef]
- Nachtigall, G.R.; Carraro, H.R.; Alleoni, L.R.F. Potassium, Calcium, and Magnesium Distribution in an Oxisol under Long-Term Potassium-Fertilized Apple Orchard. Commun. Soil Sci. Plant Anal. 2007, 38, 1439–1449. [Google Scholar] [CrossRef]
- Bednarek, W.; Dresler, S.; Tkaczyk, P.; Hanaka, A. Influence of liquid manure and NPK on selected sorption properties of soil. J. Elem. 2012, 17, 547–557. [Google Scholar] [CrossRef]
- Holmden, C.; Bélanger, N. Ca isotope cycling in a forested ecosystem. Geochim. Cosmochim. Acta 2010, 74, 995–1015. [Google Scholar] [CrossRef] [Green Version]
- Page, B.D.; Bullen, T.D.; Mitchell, M.J. Influences of calcium availability and tree species on Ca isotope fractionation in soil and vegetation. Biogeochemistry 2008, 88, 1–13. [Google Scholar] [CrossRef]
- Yan, Y.; Dai, Q.; Wang, X.; Jin, L.; Mei, L. Response of shallow karst fissure soil quality to secondary succession in a degraded karst area of southwestern China. Geoderma 2019, 348, 76–85. [Google Scholar] [CrossRef]
- Wu, C.; Deng, L.; Huang, C.; Chen, Y.; Peng, C. Effects of vegetation restoration on soil nutrients, plant diversity, and its spatiotemporal heterogeneity in a desert–oasis ecotone. Land Degrad. Dev. 2020, 32, 670–683. [Google Scholar] [CrossRef]
- Xie, L.P.; Wang, S.J.; Xiao, D.A. Ca covariant relation in plant–soil system in a small karst catchment. Earth Environ. 2007, 35, 26–32. [Google Scholar]
- Liu, C.; Huang, Y.; Wu, F.; Liu, W.; Ning, Y.; Huang, Z.; Tang, S.; Liang, Y. Plant adaptability in karst regions. J. Plant Res. 2021, 134, 889–906. [Google Scholar] [CrossRef] [PubMed]
- Pan, F.J.; Zhang, W.; Liang, Y.M.; Liu, S.J.; Wang, K.L. Increased associated effects of topography and litter and soil nutrients on soil enzyme activities and microbial biomass along vegetation successions in karst ecosystem, southwestern China. Environ. Sci. Pollut. Res. 2018, 25, 16979–16990. [Google Scholar] [CrossRef] [PubMed]
- Uren, N.C. Calcium oxalate in soils, its origins and fate—A review. Soil Res. 2018, 56, 443. [Google Scholar] [CrossRef]
- Baba, M.; Abe, S.; Kasai, M.; Sugiura, T.; Kobayashi, H. Contribution of understory vegetation to minimizing nitrate leaching in a Japanese cedar plantation. J. For. Res. 2011, 16, 446–455. [Google Scholar] [CrossRef]
- Luo, W.; Jiang, Z.; Yang, Q.; Li, Y.; Liang, J. The features of soil erosion and soil leakage in karst peak-cluster areas of Southwest China. J. Groundw. Sci. Eng. 2018, 6, 18–30. [Google Scholar]
- Peng, J.; Xu, Y.Q.; Zhang, R.; Xiong, K.N.; Lan, A.J. Soil erosion monitoring and its implication in a limestone land suffering from rocky desertification in the Huajiang Canyon, Guizhou, Southwest China. Environ. Earth Sci. 2012, 69, 831–841. [Google Scholar] [CrossRef]
- Bai, Y.; Liu, Q.; Gu, Z.; Lu, Y.; Sheng, Z. The dissolution mechanism and karst development of carbonate rocks in karst rocky desertification area of Zhenfeng–Guanling–Huajiang County, Guizhou, China. Carbonates Evaporites 2017, 34, 45–51. [Google Scholar] [CrossRef]
Figure 1.
The location of sampling area (a); Elevation in the study area (b); Distribution of sampling sites (c).
Figure 1.
The location of sampling area (a); Elevation in the study area (b); Distribution of sampling sites (c).

Figure 2.
Monthly average variation of temperature, precipitation and evapotranspiration of Huajiang dry-hot valley from 2002 to 2021.
Figure 2.
Monthly average variation of temperature, precipitation and evapotranspiration of Huajiang dry-hot valley from 2002 to 2021.

Figure 3.
Total soil calcium content at different altitudes (a); Soil exchangeable calcium content at different altitudes (b). Different lowercase letters represent significant differences (p < 0.05) in soil calcium content between different elevations, and NS represents non-significant differences (p < 0.05) in soil calcium content between different soil layers. The ranges 0–10, 10–20, 20–30, and 0–30 represent the depths of 0–10 cm, 10–20 cm, 20–30 cm, and 0–30 cm soil layers, the same as below. The ranges 500–700, 700–900, 900–1100, and >1100 represent the elevation at 500–700 m, 700–900 m, 900–1100, and above 1100 m above sea level, respectively.

Figure 4.
Total soil calcium content of different vegetation types (a); Soil exchangeable calcium content of different vegetation types (b). Different lowercase letters represent significant differences in soil calcium content between vegetation types (p < 0.05); F: forest; S: scrub; G: grassland; C: crops.

Figure 5.
Pearson correlation coefficients of soil calcium with environmental factors and soil properties. X1: Soil bulk density. X2: Soil pH. X3: Soil organic matter. X4: Vegetation cover. X5: Soil thickness. X6: Rock exposure rate. X7: Total soil calcium. X8: Soil exchangeable calcium. Pearson correlation was significant (* p < 0.05; ** p < 0.01).

Figure 6.
Effects of vegetation coverage (a), rock exposure rate (b), soil thickness (c), soil organic matter content (d), soil bulk density (e), and soil pH (f) on total soil calcium and exchangeable calcium content. Different lowercase letters represent significant differences in soil calcium content (p < 0.05).

Figure 7.
Diagram of the vertical variation of the climate of Huajiang dry-hot valley.

Table 1.
Soil properties in the study area.
| Soil Depth (cm) | Soil Bulk Density (g·cm−3) | Soil Organic Matter (g·kg−1) | Total Soil Porosity (%) | Soil pH | Soil Grain Composition (%) | ||
|---|---|---|---|---|---|---|---|
| Clay | Powder | Sand | |||||
| 5 cm | 1.23 ± 0.05 | 54.86 ± 3.26 | 53.40 ± 0.86 | 7.81 ± 0.02 | 13.07 | 81.22 | 5.70 |
| 15 cm | 1.22 ± 0.04 | 49.50 ± 1.13 | 53.68 ± 0.64 | 7.82 ± 0.04 | 13.08 | 81.98 | 4.94 |
| 25 cm | 1.22 ± 0.05 | 49.67 ± 1.23 | 53.68 ± 0.56 | 7.82 ± 0.05 | 13.08 | 81.96 | 4.96 |
| Average | 1.22 ± 0.03 | 51.34 ± 2.49 | 53.69 ± 0.13 | 7.82 ± 0.04 | 13.08 | 81.72 | 5.20 |
Table 2.
Statistics of soil calcium content.
| Soil Depth (cm) | TCa (g·kg−1) | ECa (g·kg−1) | ECa/TCa (%) |
|---|---|---|---|
| 0–10 | 13.51 ± 4.99 a | 6.78 ± 1.94 b | 50.19 |
| 10–20 | 13.07 ± 4.79 a | 6.48 ± 1.90 b | 49.58 |
| 20–30 | 12.41 ± 4.81 a | 6.35 ± 1.96 b | 51.17 |
| 0–30 | 13.00 ± 3.28 | 6.54 ± 1.52 | 50.31 |
Note: Same lowercase letter indicates no statistically significant difference between groups (p > 0.05); TCa is total soil calcium, and ECa is soil exchangeable calcium.
Disclaimer/Publisher’s Note: The statements, opinions and data contained in all publications are solely those of the individual author(s) and contributor(s) and not of MDPI and/or the editor(s). MDPI and/or the editor(s) disclaim responsibility for any injury to people or property resulting from any ideas, methods, instructions or products referred to in the content. |
© 2023 by the authors. Licensee MDPI, Basel, Switzerland. This article is an open access article distributed under the terms and conditions of the Creative Commons Attribution (CC BY) license (https://creativecommons.org/licenses/by/4.0/).
Share and Cite
MDPI and ACS Style
Luo, Y.; Shi, C.; Yang, S.; Liu, Y.; Zhao, S.; Zhang, C. Characteristics of Soil Calcium Content Distribution in Karst Dry-Hot Valley and Its Influencing Factors. Water 2023, 15, 1119. https://doi.org/10.3390/w15061119
AMA Style
Luo Y, Shi C, Yang S, Liu Y, Zhao S, Zhang C. Characteristics of Soil Calcium Content Distribution in Karst Dry-Hot Valley and Its Influencing Factors. Water. 2023; 15(6):1119. https://doi.org/10.3390/w15061119
Chicago/Turabian StyleLuo, Ya, Chunmao Shi, Shengtian Yang, Yang Liu, Shuang Zhao, and Chunchang Zhang. 2023. "Characteristics of Soil Calcium Content Distribution in Karst Dry-Hot Valley and Its Influencing Factors" Water 15, no. 6: 1119. https://doi.org/10.3390/w15061119
Note that from the first issue of 2016, this journal uses article numbers instead of page numbers. See further details here.