
A Non-Hybrid Data-Driven Fuzzy Inference System for Coagulant Dosage in Drinking Water Treatment Plant: Machine-Learning for Accurate Real-Time Prediction

 , , , , , , and
Abstract
:1. Introduction
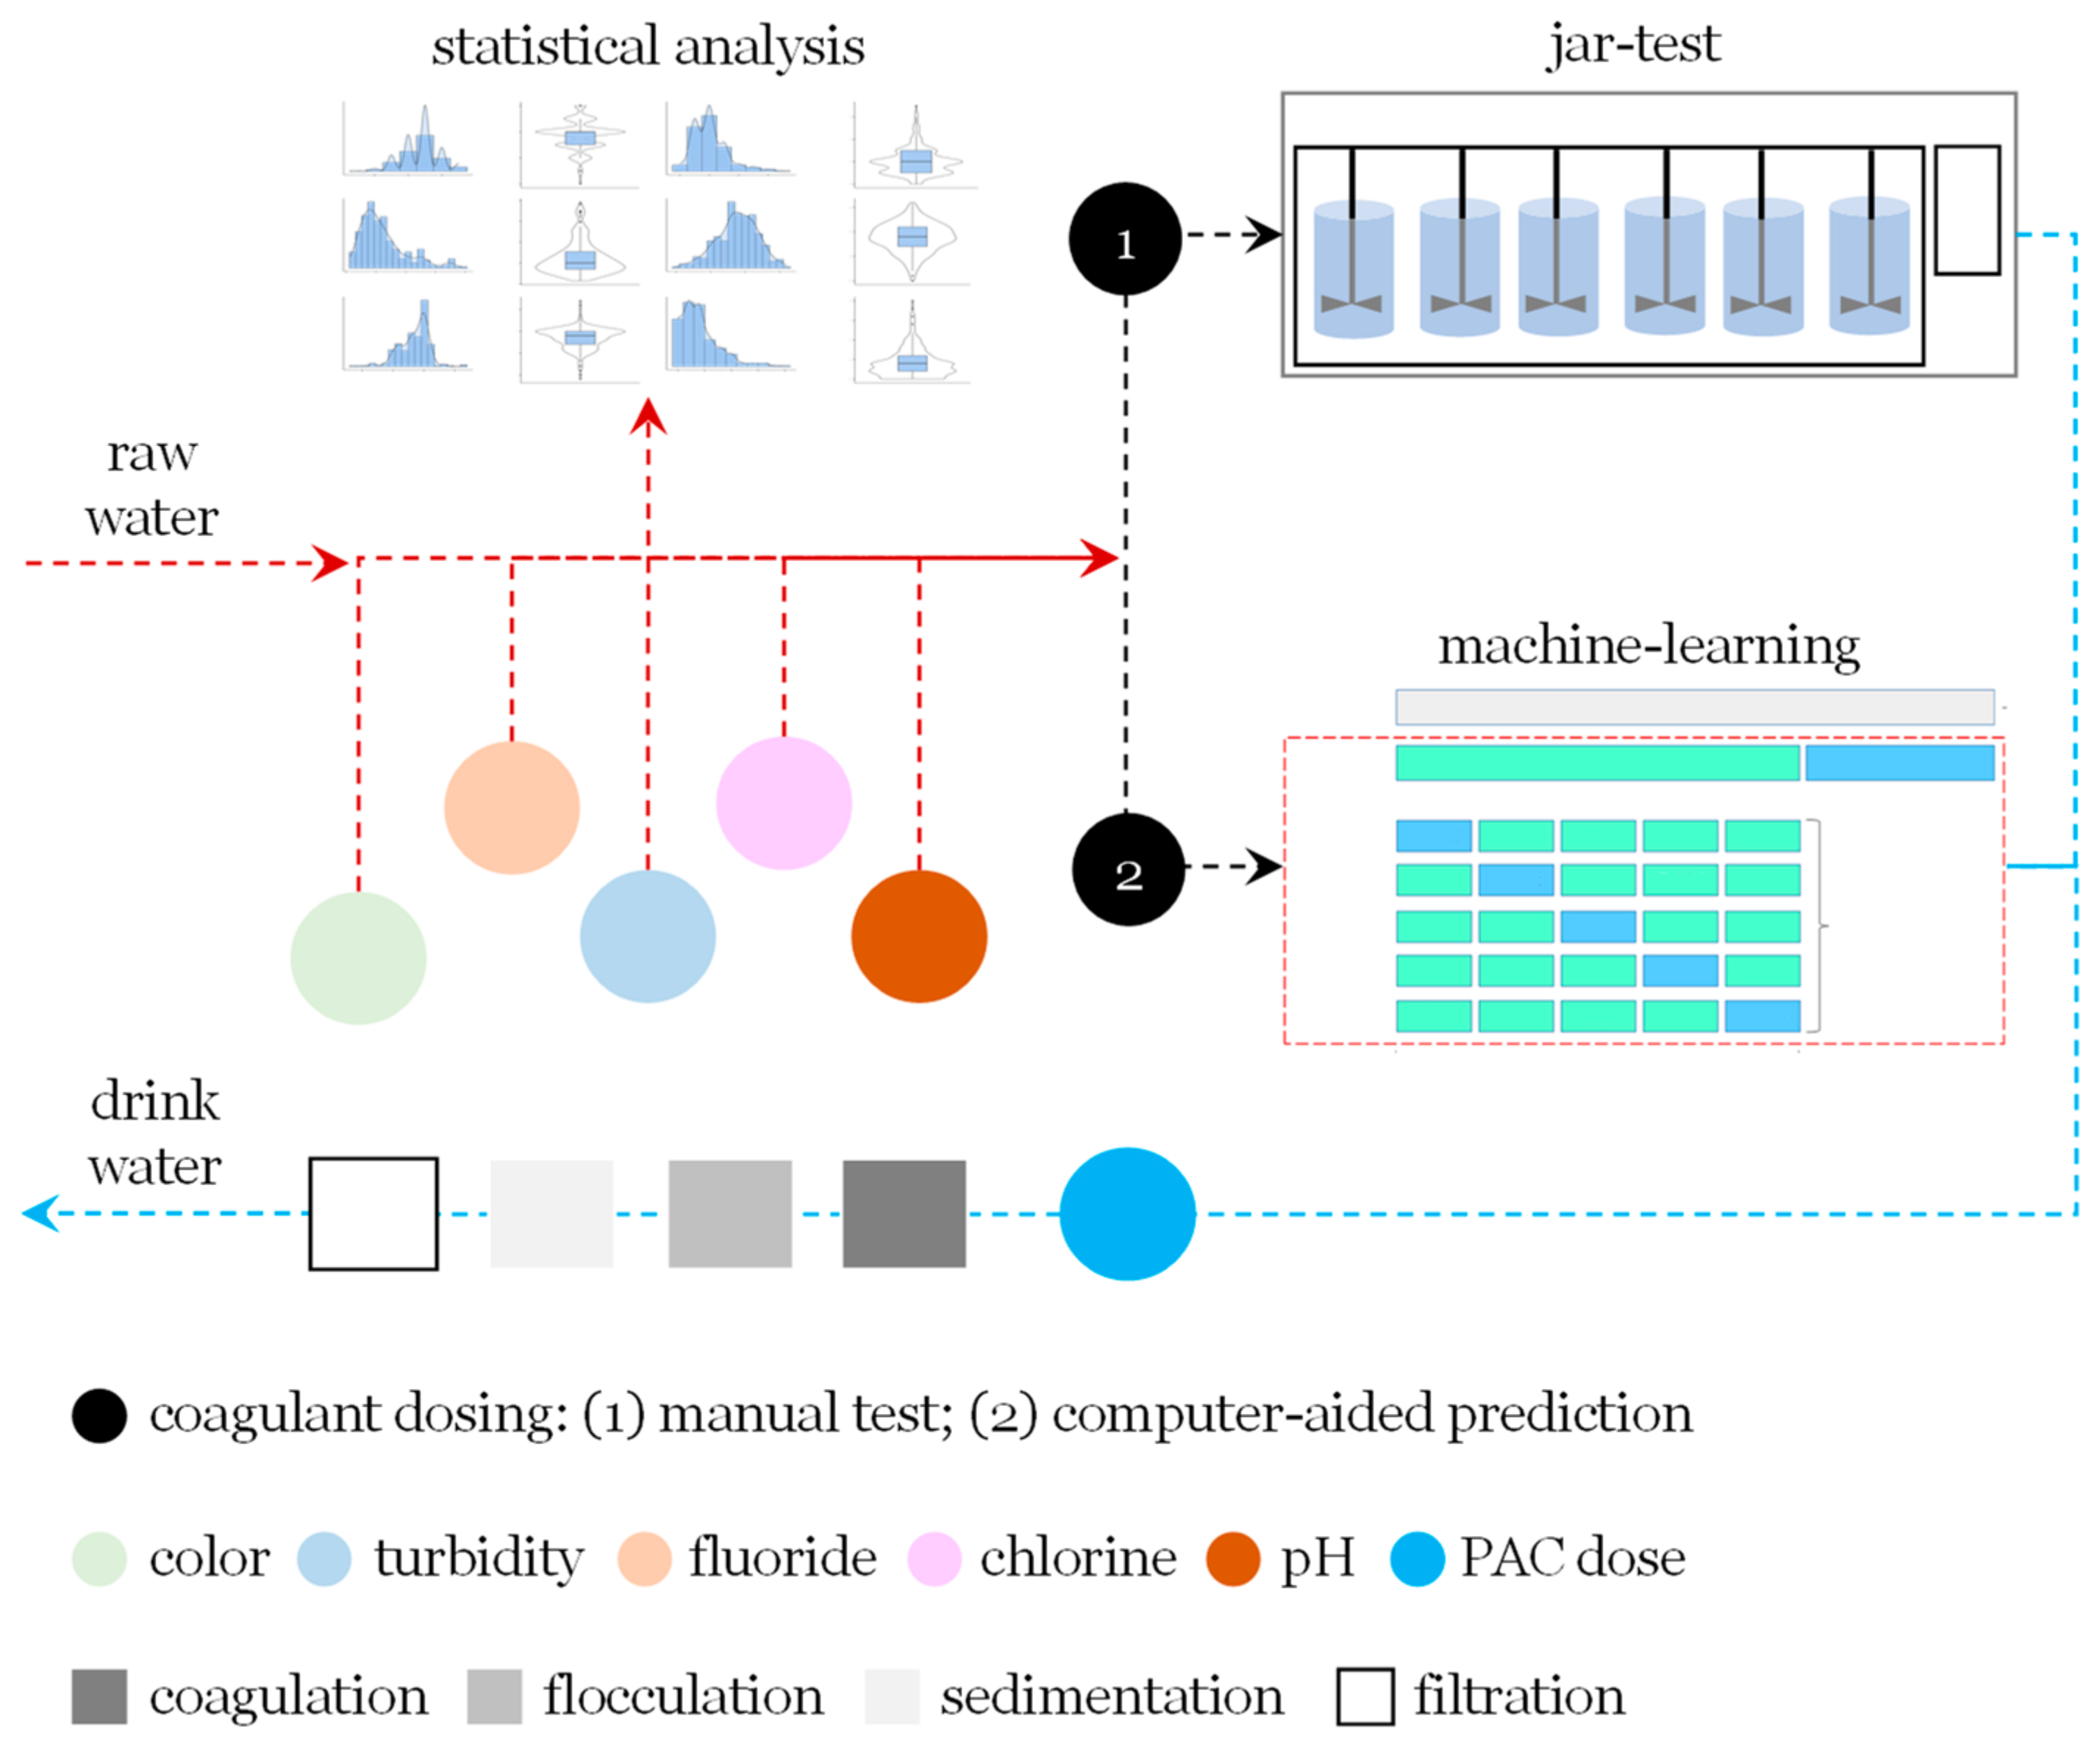
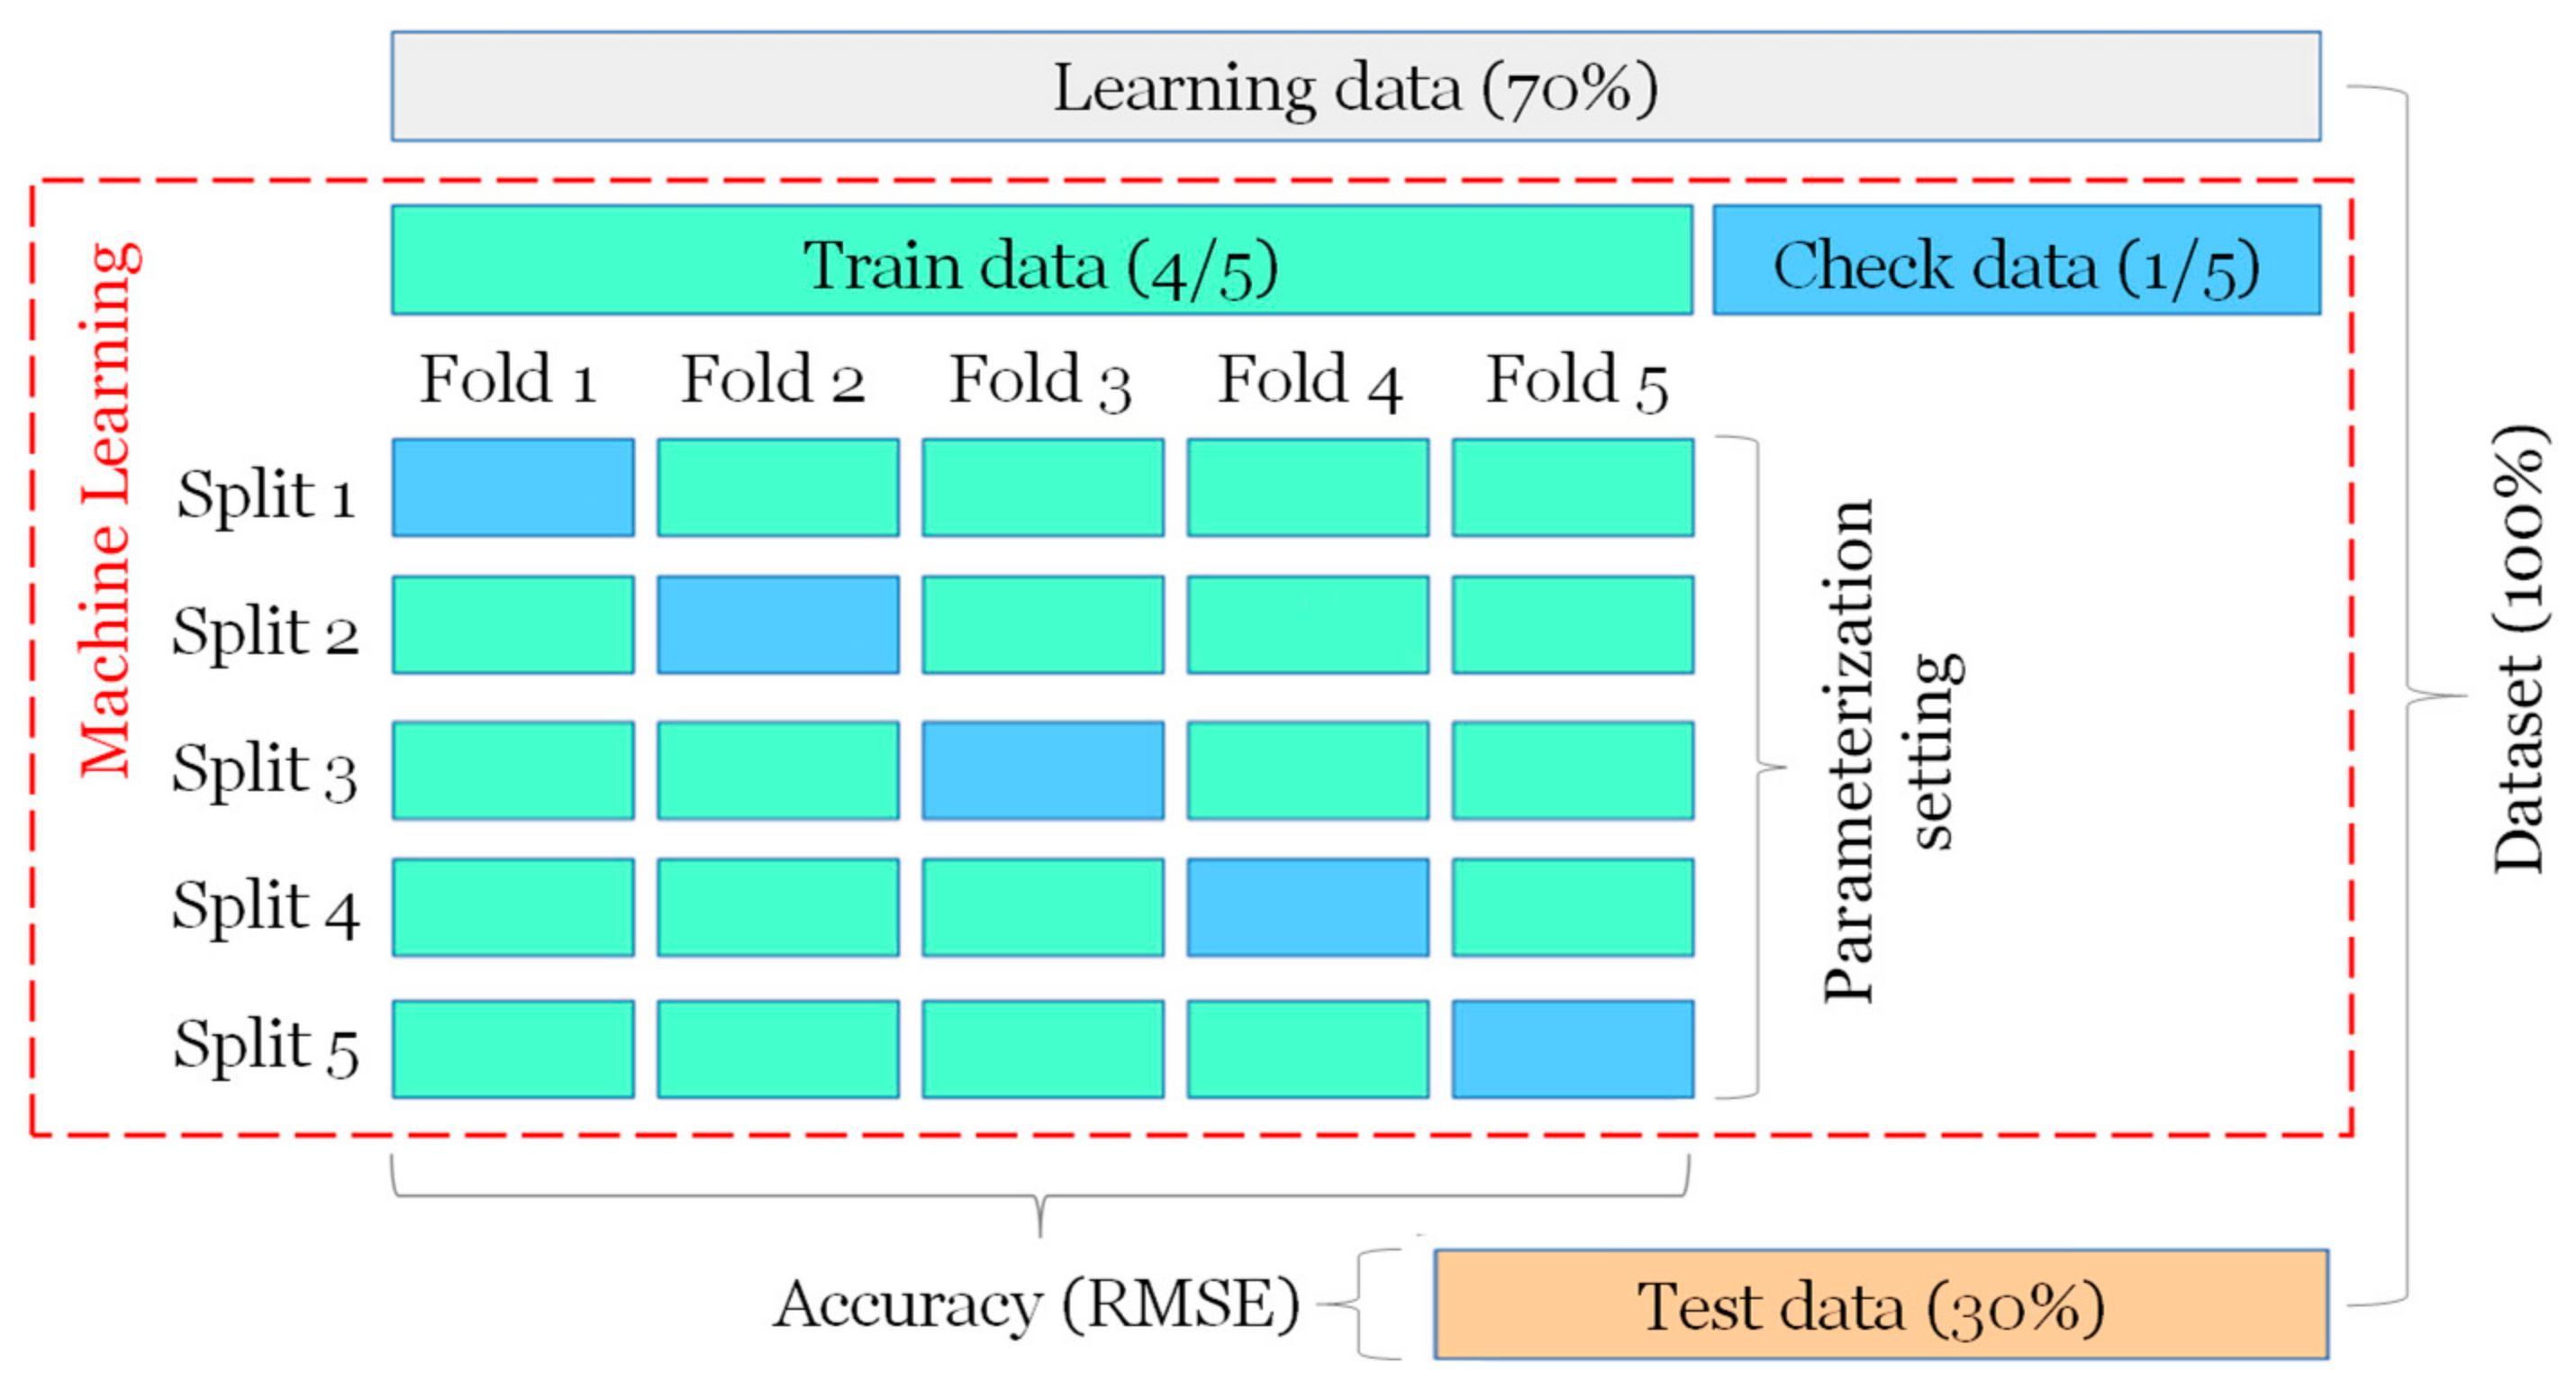
2. Methods
3. Results and Discussion
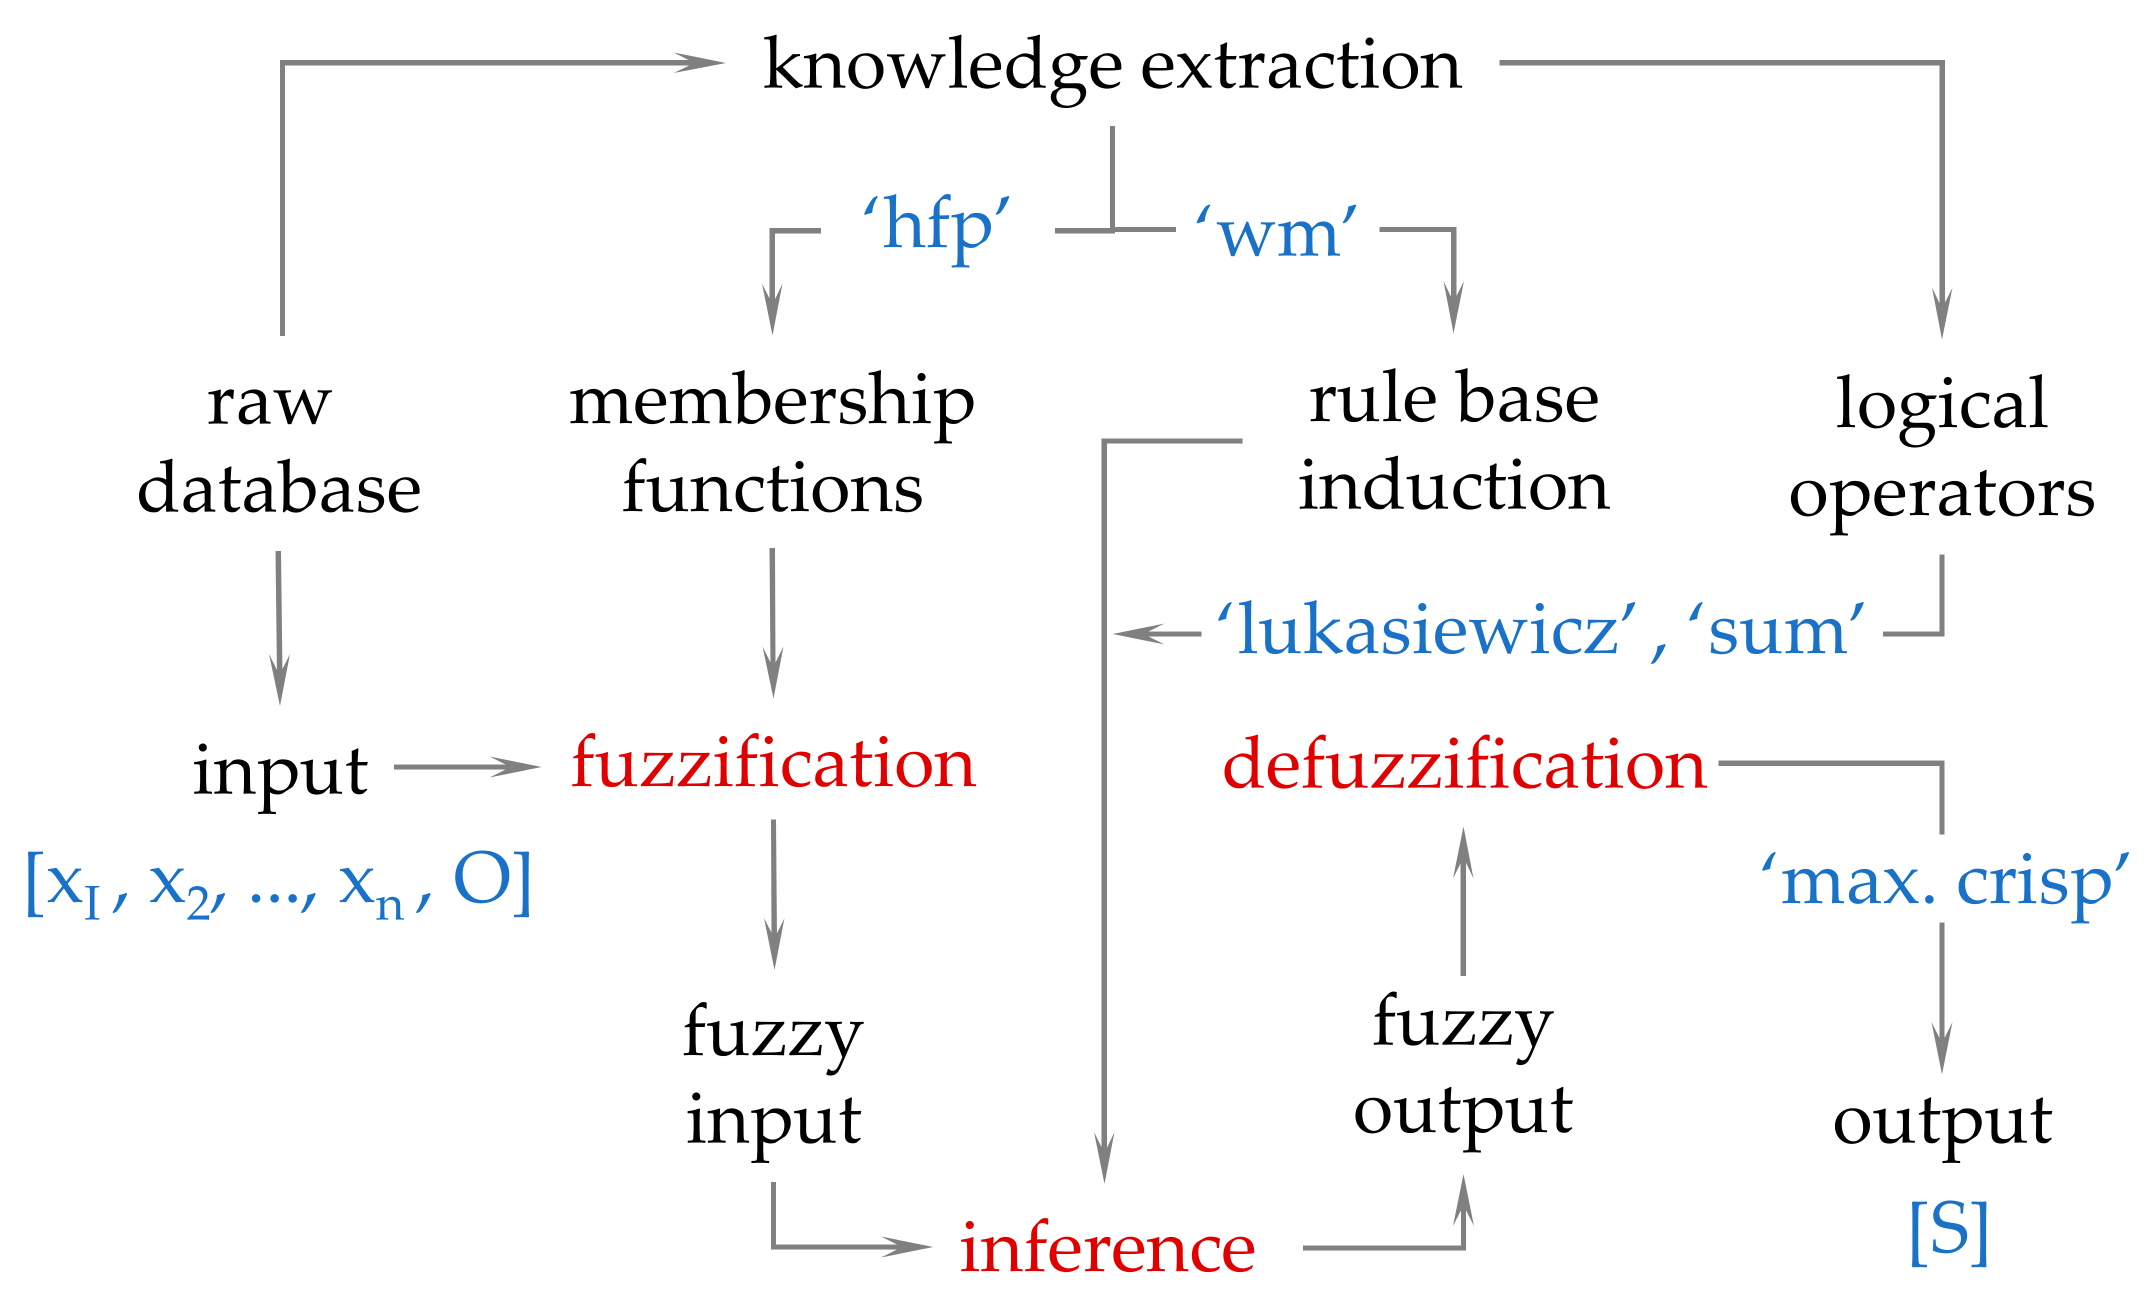
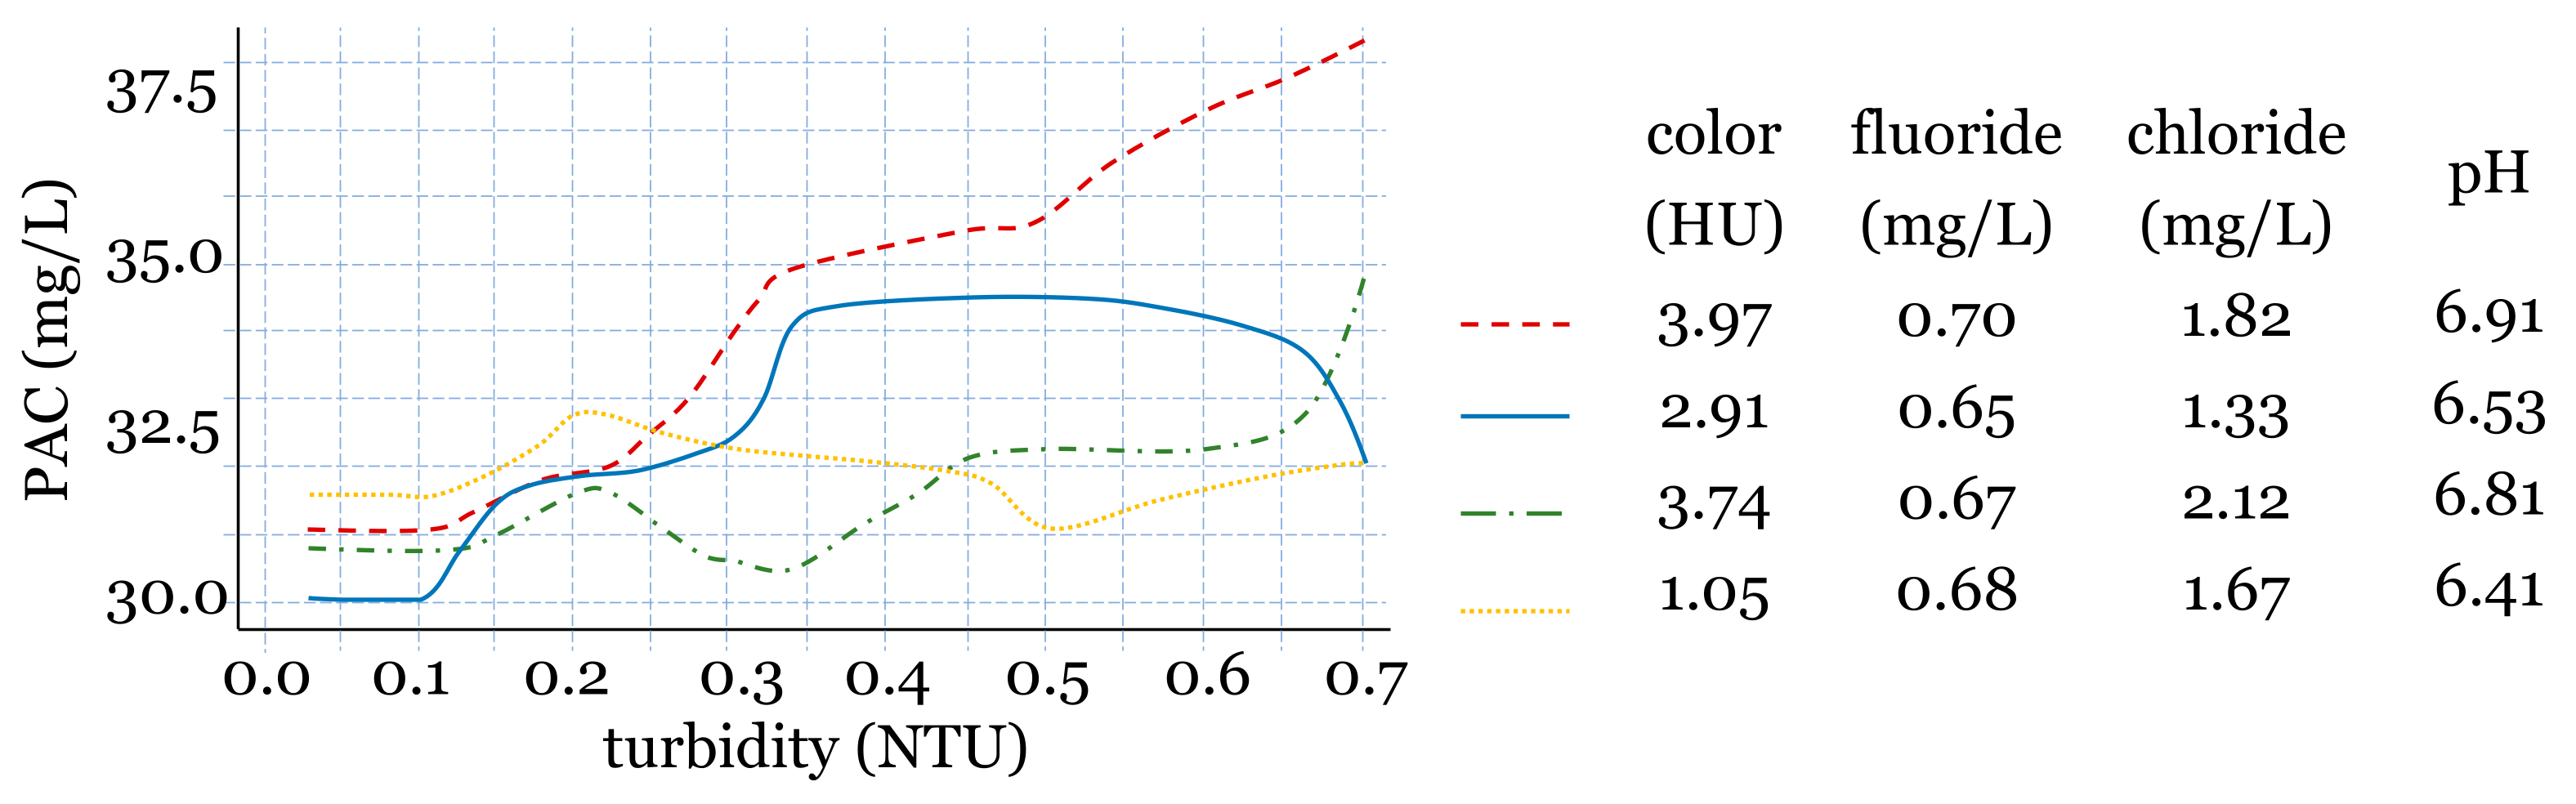
- : if pH is S and color is LL and turbidity is XL and fluoride is M and chloride is SS, then the dosage of coagulant (PAC) = 37 mg/L.
- : if pH is L and color is M and turbidity is XL and fluoride is SS and chloride is LL, then the dosage of coagulant (PAC) = 30 mg/L.
4. Conclusions
Author Contributions
Funding
Data Availability Statement
Conflicts of Interest
References
- Zhang, J.; Luo, Y. Multimodal control by variable-structure neural network modeling for coagulant dosing in water purification process. Complexity 2020, 20, 5392417. [Google Scholar] [CrossRef]
- Wang, D.; Wu, J.; Deng, L.; Li, Z. A real-time optimization control method for coagulation process during drinking water treatment. Nonlinear Dyn. 2021, 105, 3271–3283. [Google Scholar] [CrossRef]
- Menezes, F.C.; Fontes, R.M.; Oliveira-Esquerre, K.P.; Kalid, R. Application of uncertainty analysis of artificial neural networks for predicting coagulant and alkalizer dosages in a water treatment process. Br. J. Chem. Eng. 2018, 35, 1369–1381. [Google Scholar] [CrossRef]
- Jayaweera, C.D.; Aziz, N. Development and comparison of extreme learning machine and multi-layer perceptron neural network models for predicting optimum coagulant dosage for water treatment. J. Phys. 2018, 1123, e012032. [Google Scholar] [CrossRef]
- Narges, S.; Ghorban, A.; Hassan, K.; Mohammad, K. Prediction of the optimal dosage of coagulants in water treatment plants through developing models based on artificial neural network fuzzy inference system (ANFIS). J. Environ. Health Sci. Eng. 2021, 19, 1543–1553. [Google Scholar] [CrossRef]
- Pandilov, Z.; Stojkov, M. Application of intelligent optimization tools in determination and control of dosing of flocculant in water treatment. Int. J. Eng. 2019, 3, 109–116. [Google Scholar]
- Oliveira, A.S.; Lopes, V.S.; Coutinho Filho, U.; Moruzzi, R.B.; Oliveira, A.L. Neural network for fractal dimension evolution. Water Sci. Technol. 2018, 78, 795–802. [Google Scholar] [CrossRef] [Green Version]
- Ghasemi, M.; Hasani Zonoozi, M.; Rezania, N.; Saadatpour, M. Predicting coagulation–flocculation process for turbidity removal from water using graphene oxide: A comparative study on ANN, SVR, ANFIS, and RSM models. Environ. Sci. Pollut. Res. 2022, 29, 72839–72852. [Google Scholar] [CrossRef] [PubMed]
- Zhu, G.; Xiong, N.; Wang, C.; Zhongwu, L.; Hursthouse, A.S. Application of a new HMW framework derived ANN model for optimization of aquatic dissolved organic matter removal by coagulation. Chemosphere 2021, 262, 127723. [Google Scholar] [CrossRef]
- Zangooei, Z.; Delnavaz, M.; Asadollahfardi, G. Prediction of coagulation and flocculation processes using ANN models and fuzzy regression. Water Sci. Technol. 2016, 74, 1296–1311. [Google Scholar] [CrossRef]
- Kim, C.M.; Parnichkun, M. Prediction of settled water turbidity and optimal coagulant dosage in drinking water treatment plant using a hybrid model of k-means clustering and adaptive neuro-fuzzy inference system. Appl. Water Sci. 2017, 7, e3902. [Google Scholar] [CrossRef] [Green Version]
- Zhang, Y.; Gao, X.; Smith, K.; Inial, G.; Liu, S.; Conil, L.B.; Pan, B. Integrating water quality and operation into prediction of water production in drinking water treatment plants by genetic algorithm enhanced artificial neural network. Water Res. 2019, 164, 114888. [Google Scholar] [CrossRef] [PubMed]
- Kennedy, M.J.; Gandomi, A.H.; Miller, C.M. Coagulation modeling using artificial neural networks to predict both turbidity and DOM-PARAFAC component removal. J. Environ. Chem. Eng. 2015, 3, 2829–2838. [Google Scholar] [CrossRef]
- Newhart, K.B.; Holloway, R.W.; Hering, A.S.; Cath, T.Y. Data-driven performance analyses of wastewater treatment plants: A review. Water Res. 2019, 157, 498–513. [Google Scholar] [CrossRef]
- Najafzadeh, M.; Zeinolabedini, M. Prognostication of wastewater treatment plant performance using efficient soft computing models: An environmental evaluation. Measurement 2019, 138, 690–701. [Google Scholar] [CrossRef]
- Ju, J.; Park, Y.; Choi, Y.; Lee, S. Comparison of statistical methods to predict fouling propensity of microfiltration membranes for drinking water treatment. Desalination Water Treat. 2019, 143, e716. [Google Scholar] [CrossRef]
- Wu, G.D.; Lo, S.L. Predicting real-time coagulant dosage in water treatment by artificial neural networks and adaptive network-based fuzzy inference system. Eng. Appl. Artif. Intell. 2008, 21, 1189–1195. [Google Scholar] [CrossRef]
- Robenson, A.; Shukor, S.A.; Aziz, N. Development of process inverse neural network model to determine the required alum dosage at Segama water treatment plant Sabah, Malaysia. Comput. Aided Chem. Eng. 2009, 27, 525–530. [Google Scholar]
- Heddam, S.; Bermad, A.; Dechemi, N. Applications of radial-basis function and generalized regression neural networks for modeling of coagulant dosage in a drinking water-treatment plant: Comparative study. J. Environ. Eng. 2011, 137, 1209–1214. [Google Scholar] [CrossRef]
- Heddam, S.; Dechemi, N. A new approach based on the dynamic evolving neural-fuzzy inference system (DENFIS) for modelling coagulant dosage (Dos): Case study of water treatment plant of Algeria. Desalination Water Treat. 2015, 53, 1045–1053. [Google Scholar]
- Achite, M.; Farzin, S.; Elshaboury, N.; Valikhan Anaraki, M.; Amamra, M.; Toubal, A.K. Modeling the optimal dosage of coagulants in water treatment plants using various machine learning models. Environ. Dev. Sustain. 2022, 65, 1–27. [Google Scholar] [CrossRef]
- Hernandez, H.; Lann, M.V. Development of a neural sensor for on-line prediction of coagulant dosage in a potable water treatment plant in the way of its diagnosis. Iberamia Sbia 2006, 4140, 249–257. [Google Scholar]
- Zhang, K.; Achari, G.; Li, H.; Zargar, A.; Sadiq, R. Machine learning approaches to predict coagulant dosage in water treatment plants. Int. J. Assur. Eng. Manag. 2013, 4, 205–214. [Google Scholar] [CrossRef]
- Zadeh, L.A. Computing with Words; Springer: Berlin/Heidelberg, Germany, 2012. [Google Scholar]
- Barros, L.C.; Bassanezi, R.C.; Lodwick, W.A. A First Course in Fuzzy Logic, Fuzzy Dynamical Systems, and Biomathematics; Springer: Berlin/Heidelberg, Germany, 2017. [Google Scholar]
- Zhang, J.; Qiu, H.; Li, X.; Niu, J.; Neyers, M.B.; Hu, X.; Phanikumar, M.S. Realtime nowcasting of microbiological water quality at recreational beaches: A wavelet and artificial neural network-based hybrid modeling approach. Environ. Sci. Technol. 2018, 52, 8446–8455. [Google Scholar] [CrossRef] [PubMed]
- Mehryar, S.; Sliuzas, R.; Sharifi, A.; Reckien, D.; van Maarseveen, M. A structured participatory method to support policy option analysis in a social-ecological system. J. Environ. Manag. 2017, 15, 360–372. [Google Scholar] [CrossRef] [PubMed]
- Bressane, A.; Biagolini, C.H.; Mochizuki, P.S.; Roveda, J.A.F.; Lourenço, R.W. Fuzzy-based methodological proposal for participatory diagnosis in linear parks management. Ecol. Indic. 2017, 80, 153–162. [Google Scholar] [CrossRef] [Green Version]
- Caniani, D.; Labella, A.; Lioi, D.S.; Mancini, I.M.; Masi, S. Habitat ecological integrity and environmental impact assessment of anthropic activities: A GIS-based fuzzy logic model for sites of high biodiversity conservation interest. Ecol. Indic. 2016, 31, 238–249. [Google Scholar] [CrossRef]
- Bressane, A.; Silva, P.M.; Fiore, F.A.; Carra, T.A.; Ewbank, H.; De-carli, B.P.; Mota, M.T. Fuzzy-based computational intelligence to support screening decision in environmental impact assessment: A complementary tool for a case-by-case project appraisal. Environ. Impact Assess. Rev. 2020, 85, e106446. [Google Scholar] [CrossRef]
- Bressane, A.; Fengler, F.H.; Roveda, J.A.F.; Roveda, S.R.M.M.; Martins, A.C.G. Arboreal identification supported by fuzzy modeling for trunk texture recognition. Trends Appl. Comput. Math. 2018, 19, 111–126. [Google Scholar] [CrossRef]
- Zhang, H.; Sun, T.; Shao, D.; Yang, W. Fuzzy logic method for evaluating habitat suitability in an estuary affected by land reclamation. Wetlands 2016, 36, 19–30. [Google Scholar] [CrossRef]
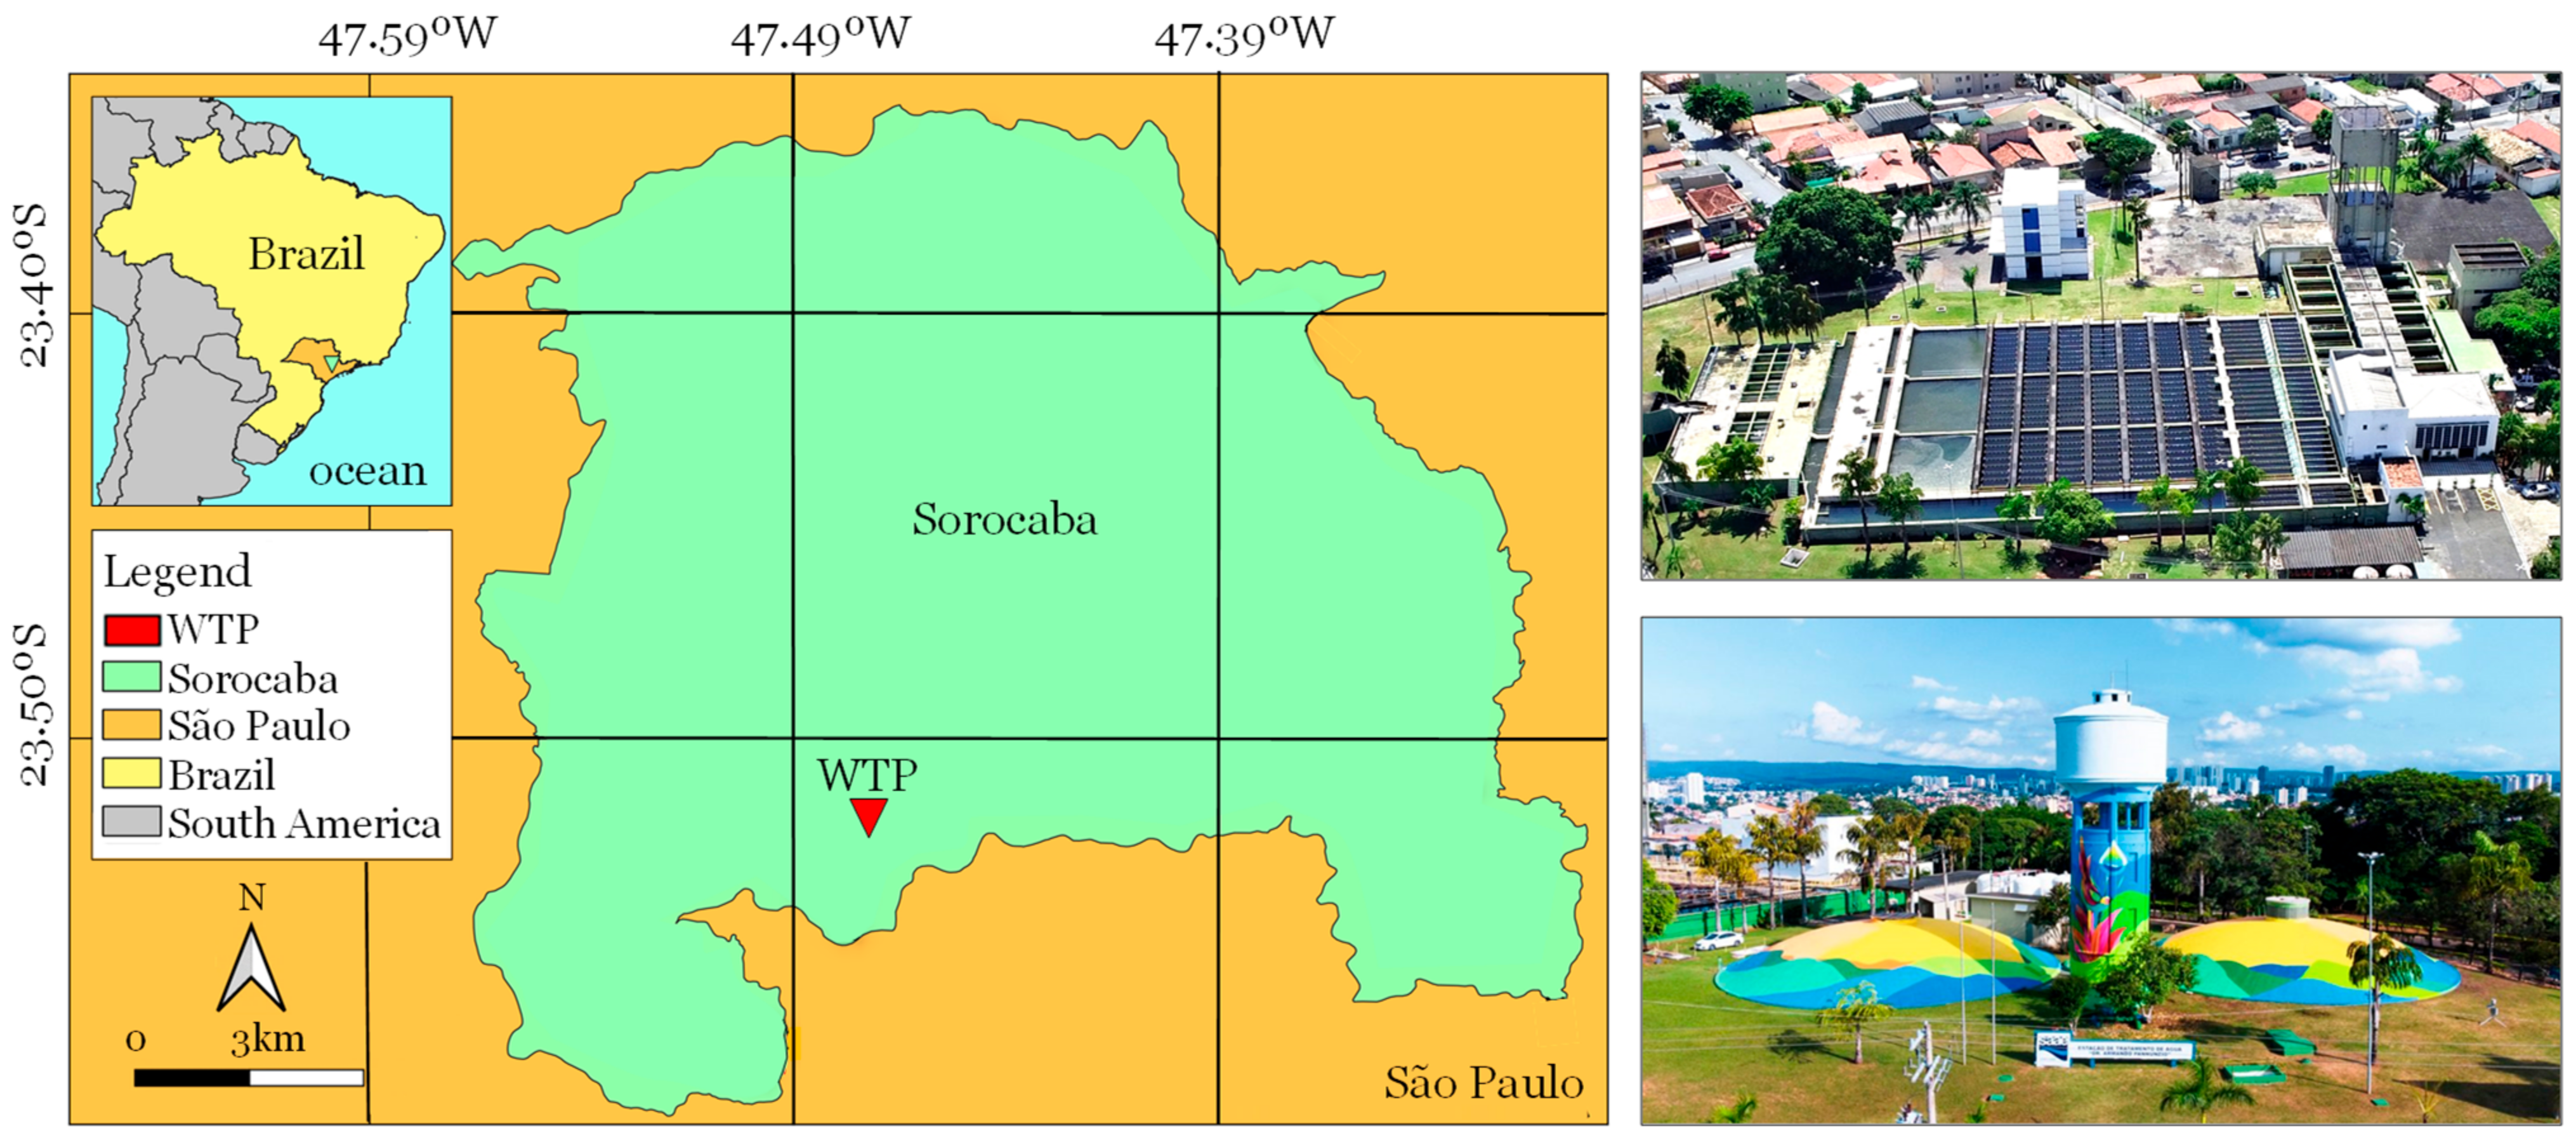
- Brazilian Institute of Geography and Statistics. Sorocaba City. 2022. Available online: https://www.ibge.gov.br/cidades-e-estados/sp/sorocaba.html (accessed on 11 September 2022).
- Santinon, E. Drinking Water Treatment Plant Dr. Armando Pannunzio at Sorocaba City, São Paulo State, Brazil. 2022. Available online: https://noticias.sorocaba.sp.gov.br/saae-sorocaba-realiza-manutencao-preventiva-na-eta-cerrado-neste-domingo-21/ (accessed on 11 September 2022).
- Guillaume, S.; Charnomordic, B.; Lablée, J.; Jones, H.; Desperben, L. FisPro: Fuzzy Inference System, Design and Optimization. R Package Version 1.1.1. 2022. Available online: https://CRAN.R-project.org/package=FisPro (accessed on 11 September 2022).
- Alvarez-Estevez, D.; Moret-Bonillo, V. Revisiting the Wang–Mendel algorithm for fuzzy classification. Expert. Syst. 2018, 35, e12268. [Google Scholar] [CrossRef]
- Zhai, Y.; Lv, Z.; Zhao, J.; Wang, W.; Leung, H. Data-driven inference modeling based on an on-line Wang-Mendel fuzzy approach. Inf. Sci. 2021, 551, 113–127. [Google Scholar] [CrossRef]
- Bressane, A.; Gomes, I.G.; da Rosa, G.C.S.; Brandelik, C.C.M.; Silva, M.B.; Siminski, A.; Negri, R.G. Computer-aided classification of successional stage in subtropical Atlantic Forest: A proposal based on fuzzy artificial intelligence. Environ. Monit. Assess. 2023, 195, e184. [Google Scholar] [CrossRef]
- Hodson, T.O. Root-mean-square error (RMSE) or mean absolute error (MAE): When to use them or not. Geosci. Model Dev. 2022, 15, 5481–5487. [Google Scholar] [CrossRef]
- Yu, T.; Zhu, H. Hyper-parameter optimization: A review of algorithms and applications. Comput. Sci. 2022, in press. [Google Scholar]
- Nguyen, Q.H.; Ly, H.B.; Ho, L.S.; Al-Ansari, N.; Le, H.V.; Tran, V.Q.; Pham, B.T. Influence of data splitting on performance of machine learning models in prediction of shear strength of soil. Math. Probl. Eng. 2021, 2021, 4832864. [Google Scholar] [CrossRef]
- Scikit-Learn Developers. Cross-Validation: Evaluating Performance. 2022. Available online: https://scikit-learn.org/stable/modules/cross_validation.html (accessed on 11 September 2022).
- Negri, R.G. Pattern Recognition: A Directed Study; Edgard Blucher: São Paulo, Brazil, 2021. [Google Scholar]
- Bressane, A.; Spalding, M.; Zwirn, D.; Loureiro, A.I.S.; Bankole, A.O.; Negri, R.G.; Junior, I.D.B.; Formiga, J.K.S.; Medeiros, L.C.D.C.; Bortolozo, L.A.P.; et al. Fuzzy artificial intelligence—Based model proposal to forecast student performance and retention risk in engineering education: An alternative for handling with small data. Sustainability 2022, 14, 14071. [Google Scholar] [CrossRef]
- Wei, Y.; Ding, J.; Yang, S.; Yang, X.; Wang, F. Comparisons of random forest and stochastic gradient treeboost algorithms for mapping soil electrical conductivity with multiple subsets using Landsat OLI and DEM/GIS-based data at a type oasis in Xinjiang, China. Eur. J. Remote Sens. 2021, 54, 158–181. [Google Scholar] [CrossRef]
- Mohamed, S.M.; Mohamed, M.H.; Farghally, M.F. A new cascade-correlation growing deep learning neural network algorithm. Algorithms 2021, 14, 158. [Google Scholar] [CrossRef]
- Wadkar, D.V.; Karale, R.S.; Wagh, M.P. Application of cascade feed forward neural network to predict coagulant dose. J. Appl. Water Eng. Res. 2022, 10, 87–100. [Google Scholar] [CrossRef]
- Kalantar, B.; Pradhan, B.; Naghibi, S.A.; Alireza, M.; Mansor, S. Assessment of the effects of training data selection on the landslide susceptibility mapping: A comparison between support vector machine (SVM), logistic regression (LR) and artificial neural networks (ANN). Geomat. Nat. Hazards Risk 2018, 9, 49–69. [Google Scholar] [CrossRef]
- Salleh, M.N.M.; Talpur, N.; Hussain, K. Adaptive neuro-fuzzy inference system: Overview, strengths, limitations, and solutions. In International Conference on Data Mining and Big Data; Springer: Cham, Switzerland, 2017; pp. 527–535. [Google Scholar]
- Khameneh, A.Z.; Kiliçman, A.; Salleh, A.R. Fuzzy soft boundary. Ann. Fuzzy Math. Inform. 2014, 8, 687–703. [Google Scholar]
- Hussain, S. On some properties of intuitionistic fuzzy soft boundary. Commun. Fac. Sci. Univ. Ank. Ser. Math. Stat. 2020, 69, 1033–1044. [Google Scholar] [CrossRef]
- Ghodousian, A.; Naeeimi, M.; Babalhavaeji, A. Nonlinear optimization problem subjected to fuzzy relational equations defined by Dubois-Prade family of t-norms. Comput. Ind. Eng. 2018, 119, 167–180. [Google Scholar] [CrossRef]
- Naresh, C.; Bose, P.S.C.; Rao, C.S.P. Artificial neural networks and adaptive neuro-fuzzy models for predicting WEDM machining responses of Nitinol alloy: Comparative study. SN Appl. Sci. 2020, 2, 314. [Google Scholar] [CrossRef] [Green Version]


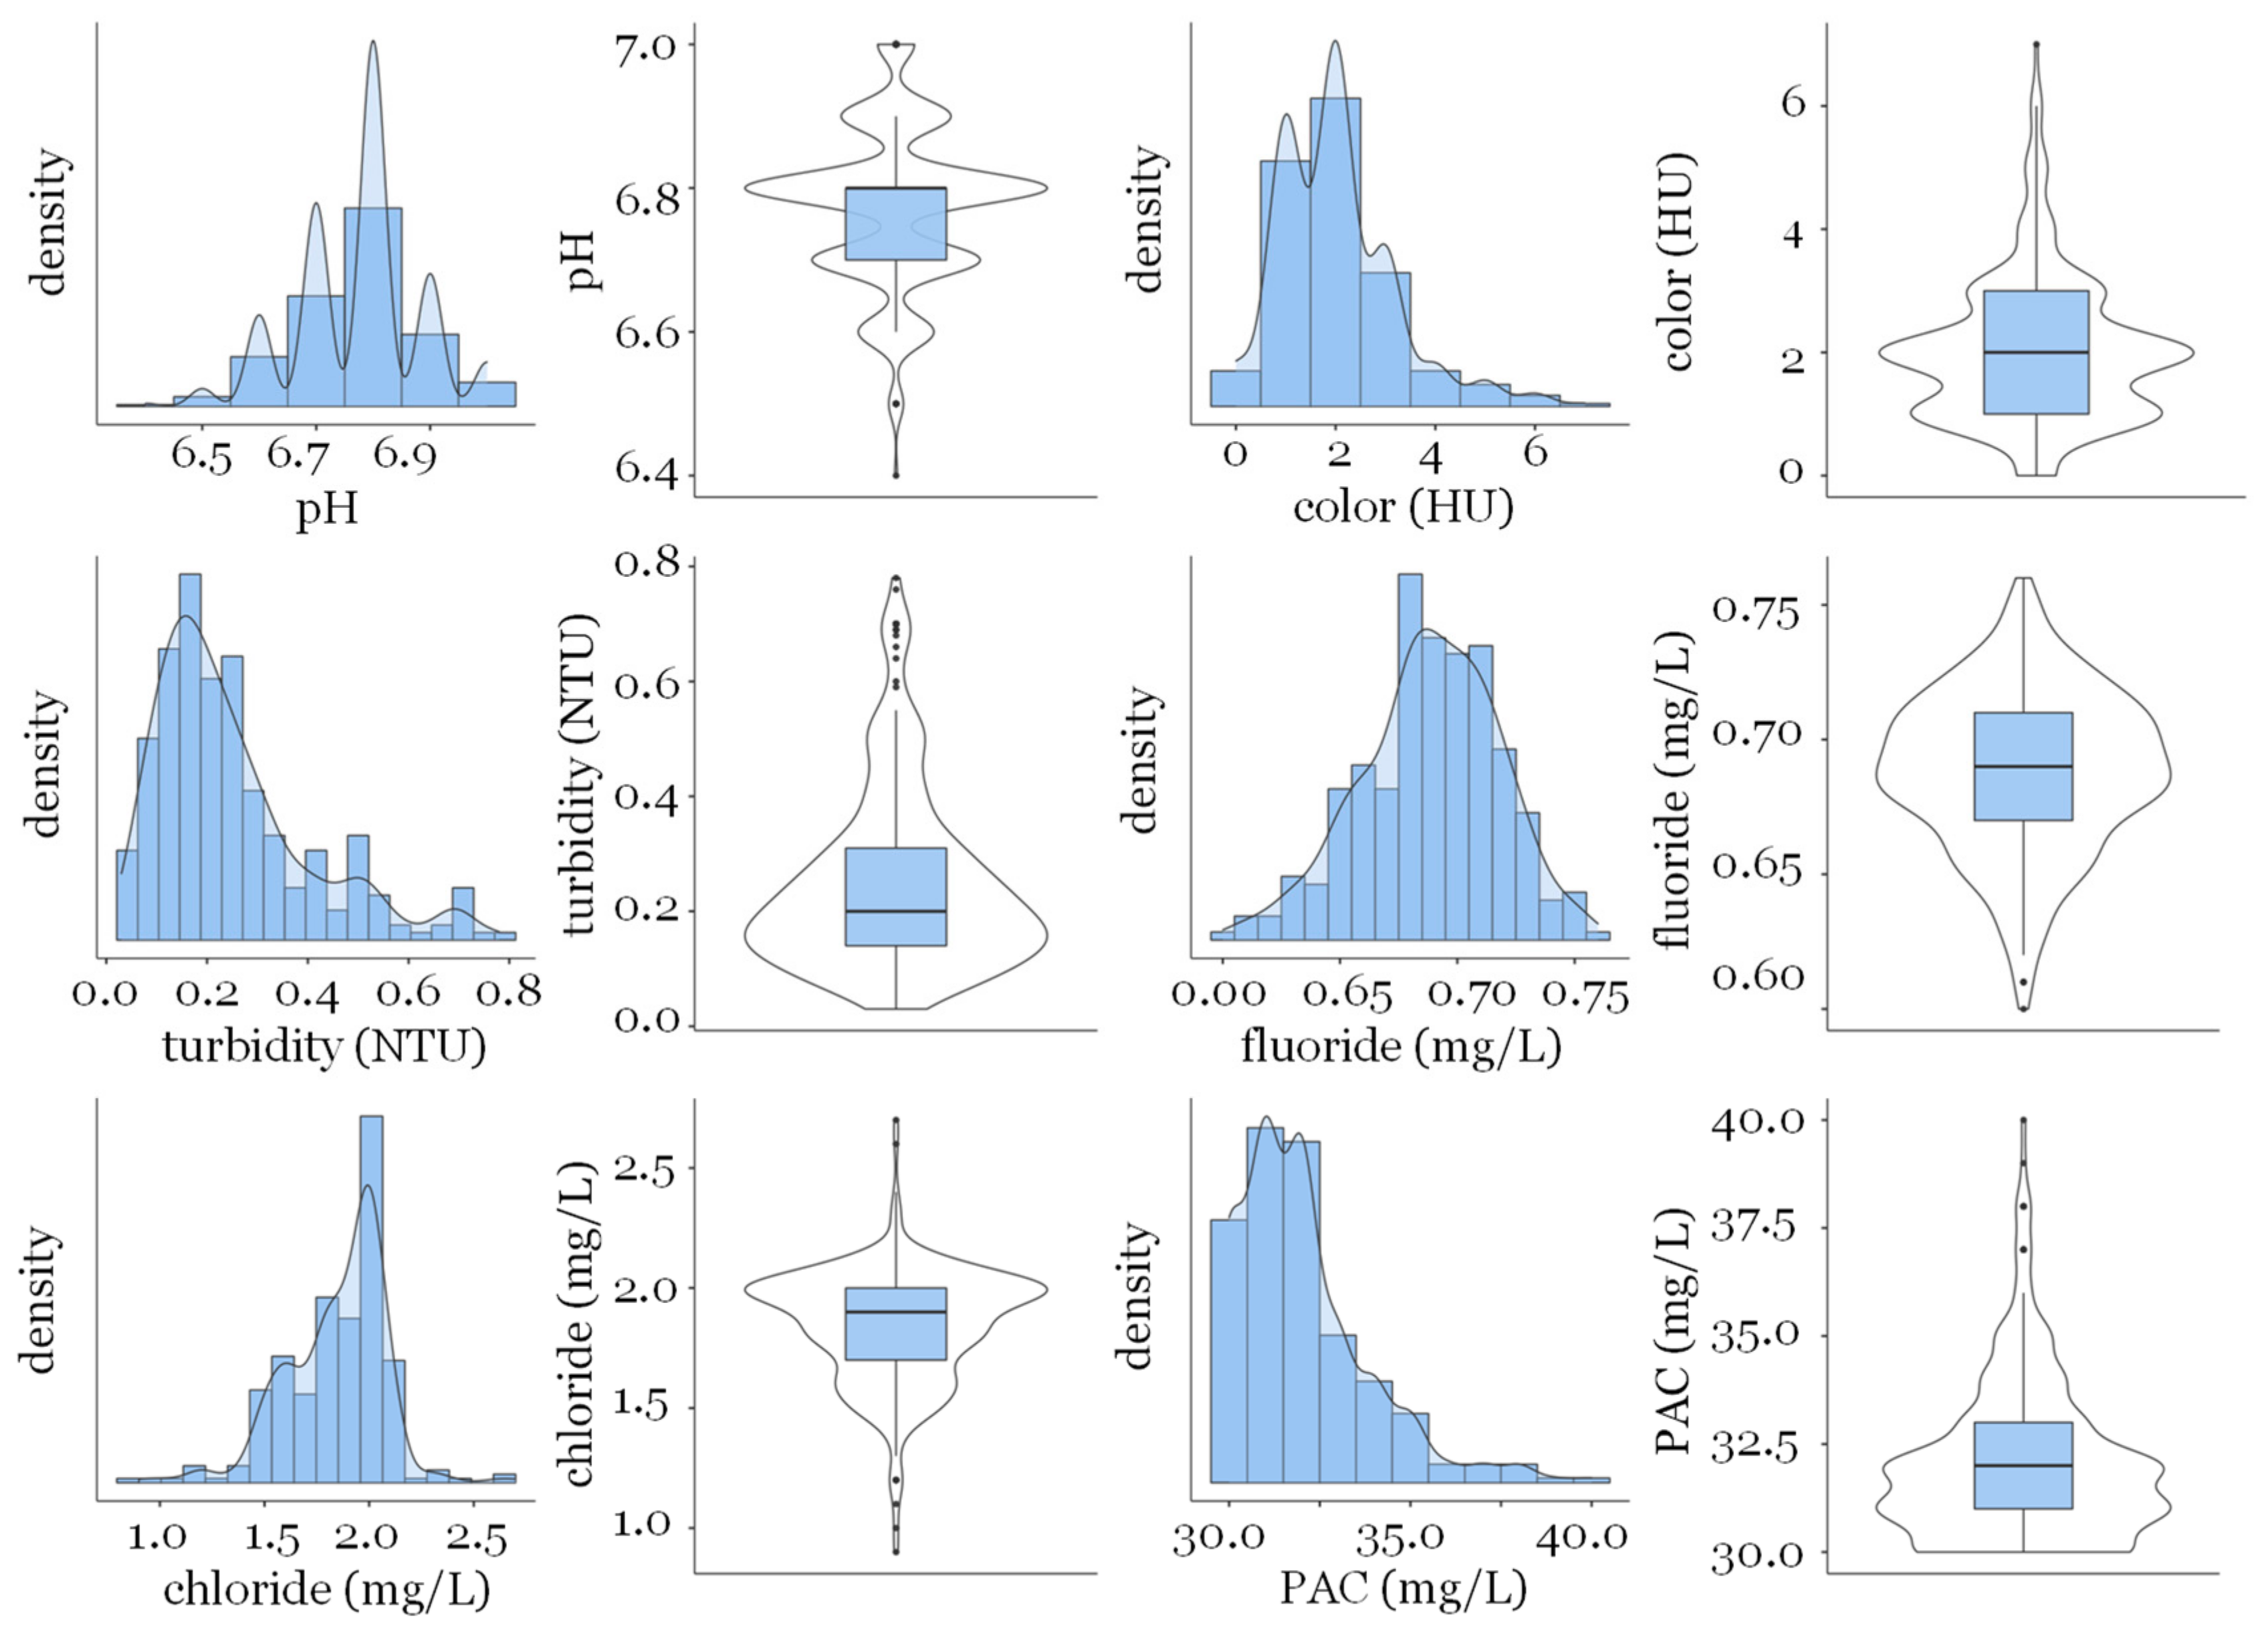
| pH (PAN) * | Color (HU) | Turbidity (NTU) | Fluoride (mg/L) | Chloride (mg/L) | PAC (mg/L) | |
|---|---|---|---|---|---|---|
| Average | 6.76 | 2.01 | 0.25 | 0.69 | 1.84 | 32.0 |
| Median | 6.80 | 2.00 | 0.20 | 0.07 | 1.90 | 32.0 |
| St. Deviation | 0.11 | 1.18 | 0.16 | 0.03 | 0.24 | 1.84 |
| Minimum | 6.40 | 0.00 | 0.03 | 0.60 | 0.90 | 30.0 |
| Maximum | 7.00 | 7.00 | 0.78 | 0.76 | 2.70 | 40.0 |
| Asymmetry | −0.25 | 1.14 | 1.29 | −0.31 | −0.63 | 1.40 |
| Kurtosis | 0.26 | 2.09 | 1.32 | −0.03 | 1.68 | 2.39 |
| Normality (p) ** | <0.001 | <0.001 | <0.001 | <0.001 | <0.001 | <0.001 |
| ML Method | Parameterization Setting | RMSE (mg/L) | |
|---|---|---|---|
| Train | Test | ||
| ANFIS | Model: subtractive clustering; radii: 0.7: functions: 2; pre-overfitting epochs: 96; optimization method: hybrid. | 0.99 | 1.09 |
| CCN | Kernel: gaussian; candidates: 102; epochs: 103; neurons range: [0–103]; overfitting control: cross-validation. | 1.10 | 1.18 |
| D2FIS | Model: ‘wm’; conjunction: Lukasiewicz; disjunction: sum; functions: 6; grid: 150 ‘hfp’; defuzzification: maximum crisp. | 0.44 | 0.86 |
| GEP | Population: 50; maximum tries: 104; genes: 4; gene head length: 10; generations without improvement: 103. | 1.10 | 1.15 |
| GMDH | Layer: 20; polynomial order: 16; neurons per layer: 20; function: linear; connections: to previous layer. | 1.17 | 1.20 |
| MLP | Layer: 3; hidden layer function: smooth; output layer function: linear; train: scaled conjugate gradient. | 1.11 | 1.17 |
| PNN | Kernel: gaussian; steps: 20; sigma: each variable [10−4–10]; prior probability: frequency distribution. | 0.71 | 1.17 |
| RBFN | Neurons: 103; radius: [10−2–103]; population size: 200; generations: 20; generation flat: 5. | 0.96 | 1.28 |
| RF | Number of trees: 860; number of attributes considered at each split: 35; limit depth of individual trees: 15. | 0.48 | 1.26 |
| SGT | Trees: [103–102]; depth: 10; minimum size node: 5; shrink factor: auto; prune: minimum absolute error, smooth: 5. | 0.56 | 1.25 |
| SVM | Kernel: RBF; model: epsilon-SVR; optimize: minimize total error; stopping criteria: 10−3. | 1.12 | 1.17 |
Disclaimer/Publisher’s Note: The statements, opinions and data contained in all publications are solely those of the individual author(s) and contributor(s) and not of MDPI and/or the editor(s). MDPI and/or the editor(s) disclaim responsibility for any injury to people or property resulting from any ideas, methods, instructions or products referred to in the content. |
© 2023 by the authors. Licensee MDPI, Basel, Switzerland. This article is an open access article distributed under the terms and conditions of the Creative Commons Attribution (CC BY) license (https://creativecommons.org/licenses/by/4.0/).
Share and Cite
Bressane, A.; Goulart, A.P.G.; Melo, C.P.; Gomes, I.G.; Loureiro, A.I.S.; Negri, R.G.; Moruzzi, R.; Reis, A.G.d.; Formiga, J.K.S.; da Silva, G.H.R.; et al. A Non-Hybrid Data-Driven Fuzzy Inference System for Coagulant Dosage in Drinking Water Treatment Plant: Machine-Learning for Accurate Real-Time Prediction. Water 2023, 15, 1126. https://doi.org/10.3390/w15061126
Bressane A, Goulart APG, Melo CP, Gomes IG, Loureiro AIS, Negri RG, Moruzzi R, Reis AGd, Formiga JKS, da Silva GHR, et al. A Non-Hybrid Data-Driven Fuzzy Inference System for Coagulant Dosage in Drinking Water Treatment Plant: Machine-Learning for Accurate Real-Time Prediction. Water. 2023; 15(6):1126. https://doi.org/10.3390/w15061126
Chicago/Turabian StyleBressane, Adriano, Ana Paula Garcia Goulart, Carrie Peres Melo, Isadora Gurjon Gomes, Anna Isabel Silva Loureiro, Rogério Galante Negri, Rodrigo Moruzzi, Adriano Gonçalves dos Reis, Jorge Kennety Silva Formiga, Gustavo Henrique Ribeiro da Silva, and et al. 2023. "A Non-Hybrid Data-Driven Fuzzy Inference System for Coagulant Dosage in Drinking Water Treatment Plant: Machine-Learning for Accurate Real-Time Prediction" Water 15, no. 6: 1126. https://doi.org/10.3390/w15061126