1. Introduction
Water losses in water supply systems are a common and worrying worldwide issue since they involve complex and intensive water–energy processes. Water losses represent a waste of treated fresh water and energy resources [
1,
2]. The problem of water losses in municipal water networks can reach up to 80% of the conveyed water or even more in some urban networks [
3]. Machine learning (ML) and internet of things (IoT) platforms based on digital twin (DT) solutions can help reduce water losses and energy consumption by supplying advanced telemetry to control water-energy management toward a smart water network. A problem-solving holistic approach can be presented as a management technology to support a set of conditioning factors, including the following:
Flow management: reduction in water losses through a detection and communication system that intelligently supervises sensors, telemetry, and actuators to regulate water pressure and flow in critical network points.
Water and energy monitoring: a monitoring system transmits the pertinent data to a data acquisition system, control, and management hub.
Water grid control: a remote-control platform, which uses big data analytics, empowers the water–energy network manager to make the system progressively more efficient with real-time control and data-driven decisions.
Due to the generally reduced investment made over the last two decades by water management entities in system renovation efforts, most water systems are now aged, and their infrastructure is often overloaded [
4]. Water networks often operate beyond their intended or predicted lifespan, often with maintenance neglect, not keeping pace with population growth, and consequently increased consumption, causing supply failures, excessive water losses in systems subjected to ruptures and leaks, and reservoir overflows [
5]. System efficiency has become an important concern of management entities. This can be viewed as an opportunity to improve the management of water systems by integrating new concepts and technologies [
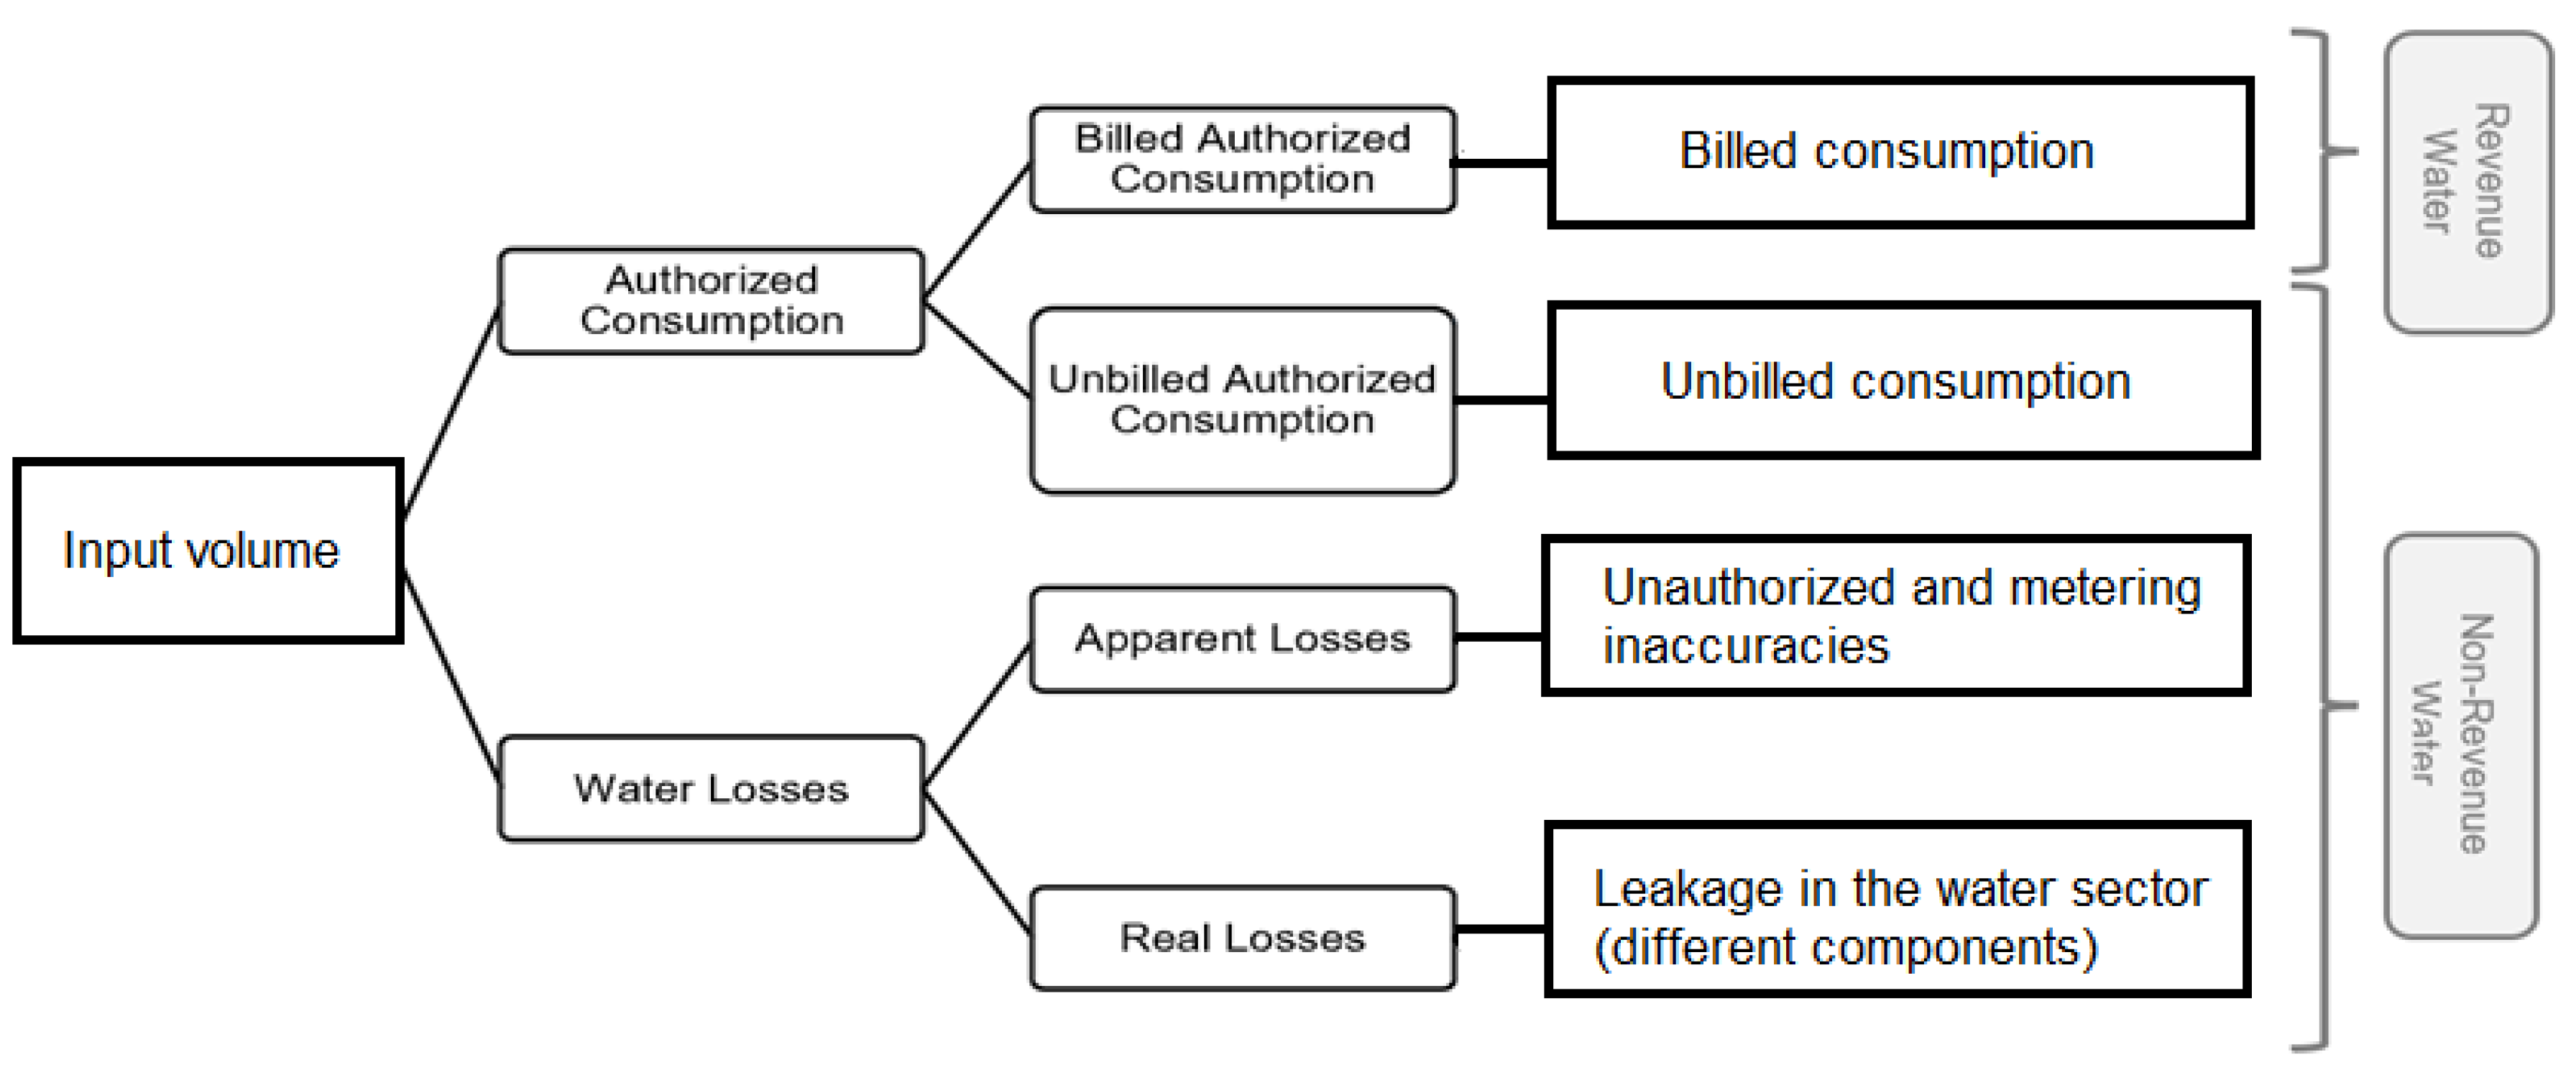
6]. To be able to analyze water losses, it is important to be aware of the various components of water balance (WB) as a methodology developed by the International Water Association (IWA), which subdivides a water system’s input volume into several components (
Figure 1) [
7].
Authorized consumption refers to water consumers utilize, including domestic, commercial, and industrial. It can be billed or unbilled by a managing entity [
8]. Unbilled authorized consumptions include water used for firefighting, street cleaning, and irrigation of municipal gardens. Water losses are reflected in the volume of water that ends up being lost without being associated with authorized consumptions after entering a network. Water losses can be classified as apparent losses (AL) and real losses (RL). AL includes water volumes of unauthorized consumption and flow meter device measurement errors, which end up being unbilled by the management entity, including illicit consumption. Conversely, RL includes the volumes of water resulting from storage tank overflows, leaks, or ruptures along the network [
9,
10,
11,
12,
13,
14,
15,
16,
17,
18].
Data related to a system’s different components of water balance are often estimated or even unknown. Consumption and volume of water extracted from water sources have increased by 1% per year since the 1980s on a global scale, driven by a combination of population growth, socio-economic development, and changing consumption patterns [
14,
15,
16,
17,
18]. Global water demand is expected to continue increasing at a similar rate until 2050, accounting for 20 to 30% above the current level, mainly due to rising demand in the industrial and domestic sectors [
18]. Over two billion people live in countries experiencing high water stress. About four billion people experience severe water scarcity for at least one month a year. Stress levels will continue to increase as water demand grows and the effects of climate change intensify [
19]. However, the volume of water withdrawal appears to have stabilized, showing an improvement in water resource management efficiency [
20,
21,
22,
23].
Considering the abovementioned challenges, smart water grids (SWG), as an integrated element of smart cities, can be deployed as a new generation of water management that considers the integration of information and communications technologies (ICT), such as sensors, meters, digital controls, and analytic tools to automate the monitoring and control of water networks. When applied to the water industry, ICT can also provide an automatic remote collection of data in situ, make wireless transmission easier to analyze and improve system efficiency, quality, and reliability [
6,
8].
An SWG requires a more efficient and complex implementation process and management strategy than conventional grids. The combination of sensors and communication networks allows real-time monitoring, resource quality control, and optimization of distribution and operations. It ensures reliability and customer safety [
11]. The benefits of SWGs can be stated as follows [
1,
2,
3,
4,
5,
6,
7,
8,
9,
10,
11,
12,
13,
14,
15,
16,
17,
18,
19,
20,
21,
22,
23]:
- –
Real-time monitoring of asset conditions: The data collected from advanced sensing technologies supports scheduling, planning, and maintenance.
- –
Real-time monitoring of flow parameters: data from sensors and flow meters help control hydraulic performances. Leaks can be located, thereby minimizing water losses and mitigating the risk of pipe bursts. Actuators, as automated valves, respond to affected areas by preventing major damages, water contamination, or water losses.
- –
Real-time water consumption information: smart water-efficient gadgets provide real-time data on water demand.
An SWG structure is based on two main platforms, i.e., the water grid platform and the ICT [
7]. The fundamental concept of smart water management systems starts with a global balance by comparing water demand with water resource availability. Because of that, a general framework of the modeling system and a list with the necessary modules to cover it are essential [
12,
13].
Although simulations and digital twins both utilize digital models to replicate a system’s behavior, a digital twin is a virtual environment, and what makes it different is that while a simulation typically studies one particular process, a digital twin can run any number of useful simulations in order to study multiple processes. The differences are obvious because simulations usually do not benefit from real-time data. In contrast, digital twins are designed around a two-way flow of information, which occurs when object sensors provide relevant data to the system processor and then ensues again when insights created by the processor are shared back with actions to improve the system behavior. By having better and constantly updated data related to a wide range of components, combined with the added computing power accompanying a virtual environment, digital twins can improve more issues than the solutions obtained by standard simulations, with a greater potential to improve system performance.
The digital water concept should not be viewed as an option but as an imperative management resource since it can be integrated into every key aspect of the water cycle, from the physical infrastructure to customer service. Water systems must be understood as SWGs or cyber-physical systems made of sensors, processors, and actuators constantly communicating with each other and reporting all relevant information in a control management system [
3,
6].
This concept is evolving into an open engagement ecosystem with digital inputs from external stakeholders to utility facilities and other entities. Hence, digital twins are virtual replications of a physical network, integrating virtual engineering models with city-scale reality representations and data from Geographic Information Systems (GIS). Knowing the real physical data, digital twins are continuously updated with operational data from sensors, meters, and other measuring devices, resulting in a model connected to digital infrastructure that supports the management processes of smart water networks (i.e., planning, design, construction, and operation). Digital twins provide accurate and reliable data that utilities can use to analyze a water system’s lifecycle, test disruption scenarios for resilience assessment purposes, and analyze asset prognosis and health status to determine proactive maintenance measures [
7,
18]. Henceforward, digital twins are used in water distribution networks to solve management problems, ranging from system design to supply operation. The main capabilities of digital twins (DT) in water distribution networks (WDN) are as follows [
16]:
- –
Optimal design of network elements to minimize the overall carbon footprint and to comply with quality-of-service constraints.
- –
Asset management to determine an optimal strategy for the renewal of the physical elements of a network.
- –
Model-based leak detection and pre-location to reduce leaks’ duration and associated operational costs.
- –
Determination of optimal daily operation parameters, including water velocity, pressure, and energy efficiency.
- –
Early warning and informed response to emergencies to make fast and effective decisions.
- –
Simulation of network behavior during operation and maintenance procedures.
- –
Simulation of demands and registered consumption and the real behavior of a network according to the data registered by in situ sensors regarding water levels, pressures, and flow calibration to reproduce all the control operations’ performance in the network.
- –
The reliability of the measurements collected by sensors to make real-time decisions and for alarm detection of critical situations.
Digital twin development requires continuous adjustments and learning techniques supported by a large amount of field data stored in big-data platforms [
12,
15]. Therefore, this study’s main objective is to propose a DT model to help water managers reduce water losses, improve system performance, and promote energy nexus efficiency. The next sections of this paper are organized as follows:
Section 2 presents the methodological approach and the information related to the case study;
Section 3 presents the main findings resulting from the case study;
Section 4 discusses the relevance of the findings and the general applicability of the proposed methodology; and finally, the main conclusions drawn from this research work are summarized in
Section 5.
2. Materials and Methods
In the case of water distribution networks, waste of resources is essentially reflected in water losses due to degraded network components, poor pressure management, pipe rupture, illicit connections, and measurement errors in flow meters, among other uncertainties. This paper reports a study on a water distribution system in Madeira (a Portuguese island) managed by a water municipality. The selected system’s current situation, or status quo, is extremely worrisome since only about ~20% of the incoming water is effectively billed to consumers. The remaining ~80% represents water losses.
The municipal entity and Redes e Sistemas de Saneamento, Lda (RSS-
[email protected]) provided all the data used in this study. Relevant lessons can be derived from these projects and associated supporting research studies on reducing water losses, where the existing water distribution network is analyzed and reformulated.
2.1. Methodology
As a virtual representation of the physical network in the heart of an SWG, DTs integrate virtual engineering models with city-scale reality models and Geographic Information System (GIS) data. DTs demonstrate accurate and reliable data that can be used to analyze different aspects of a water system [
7,
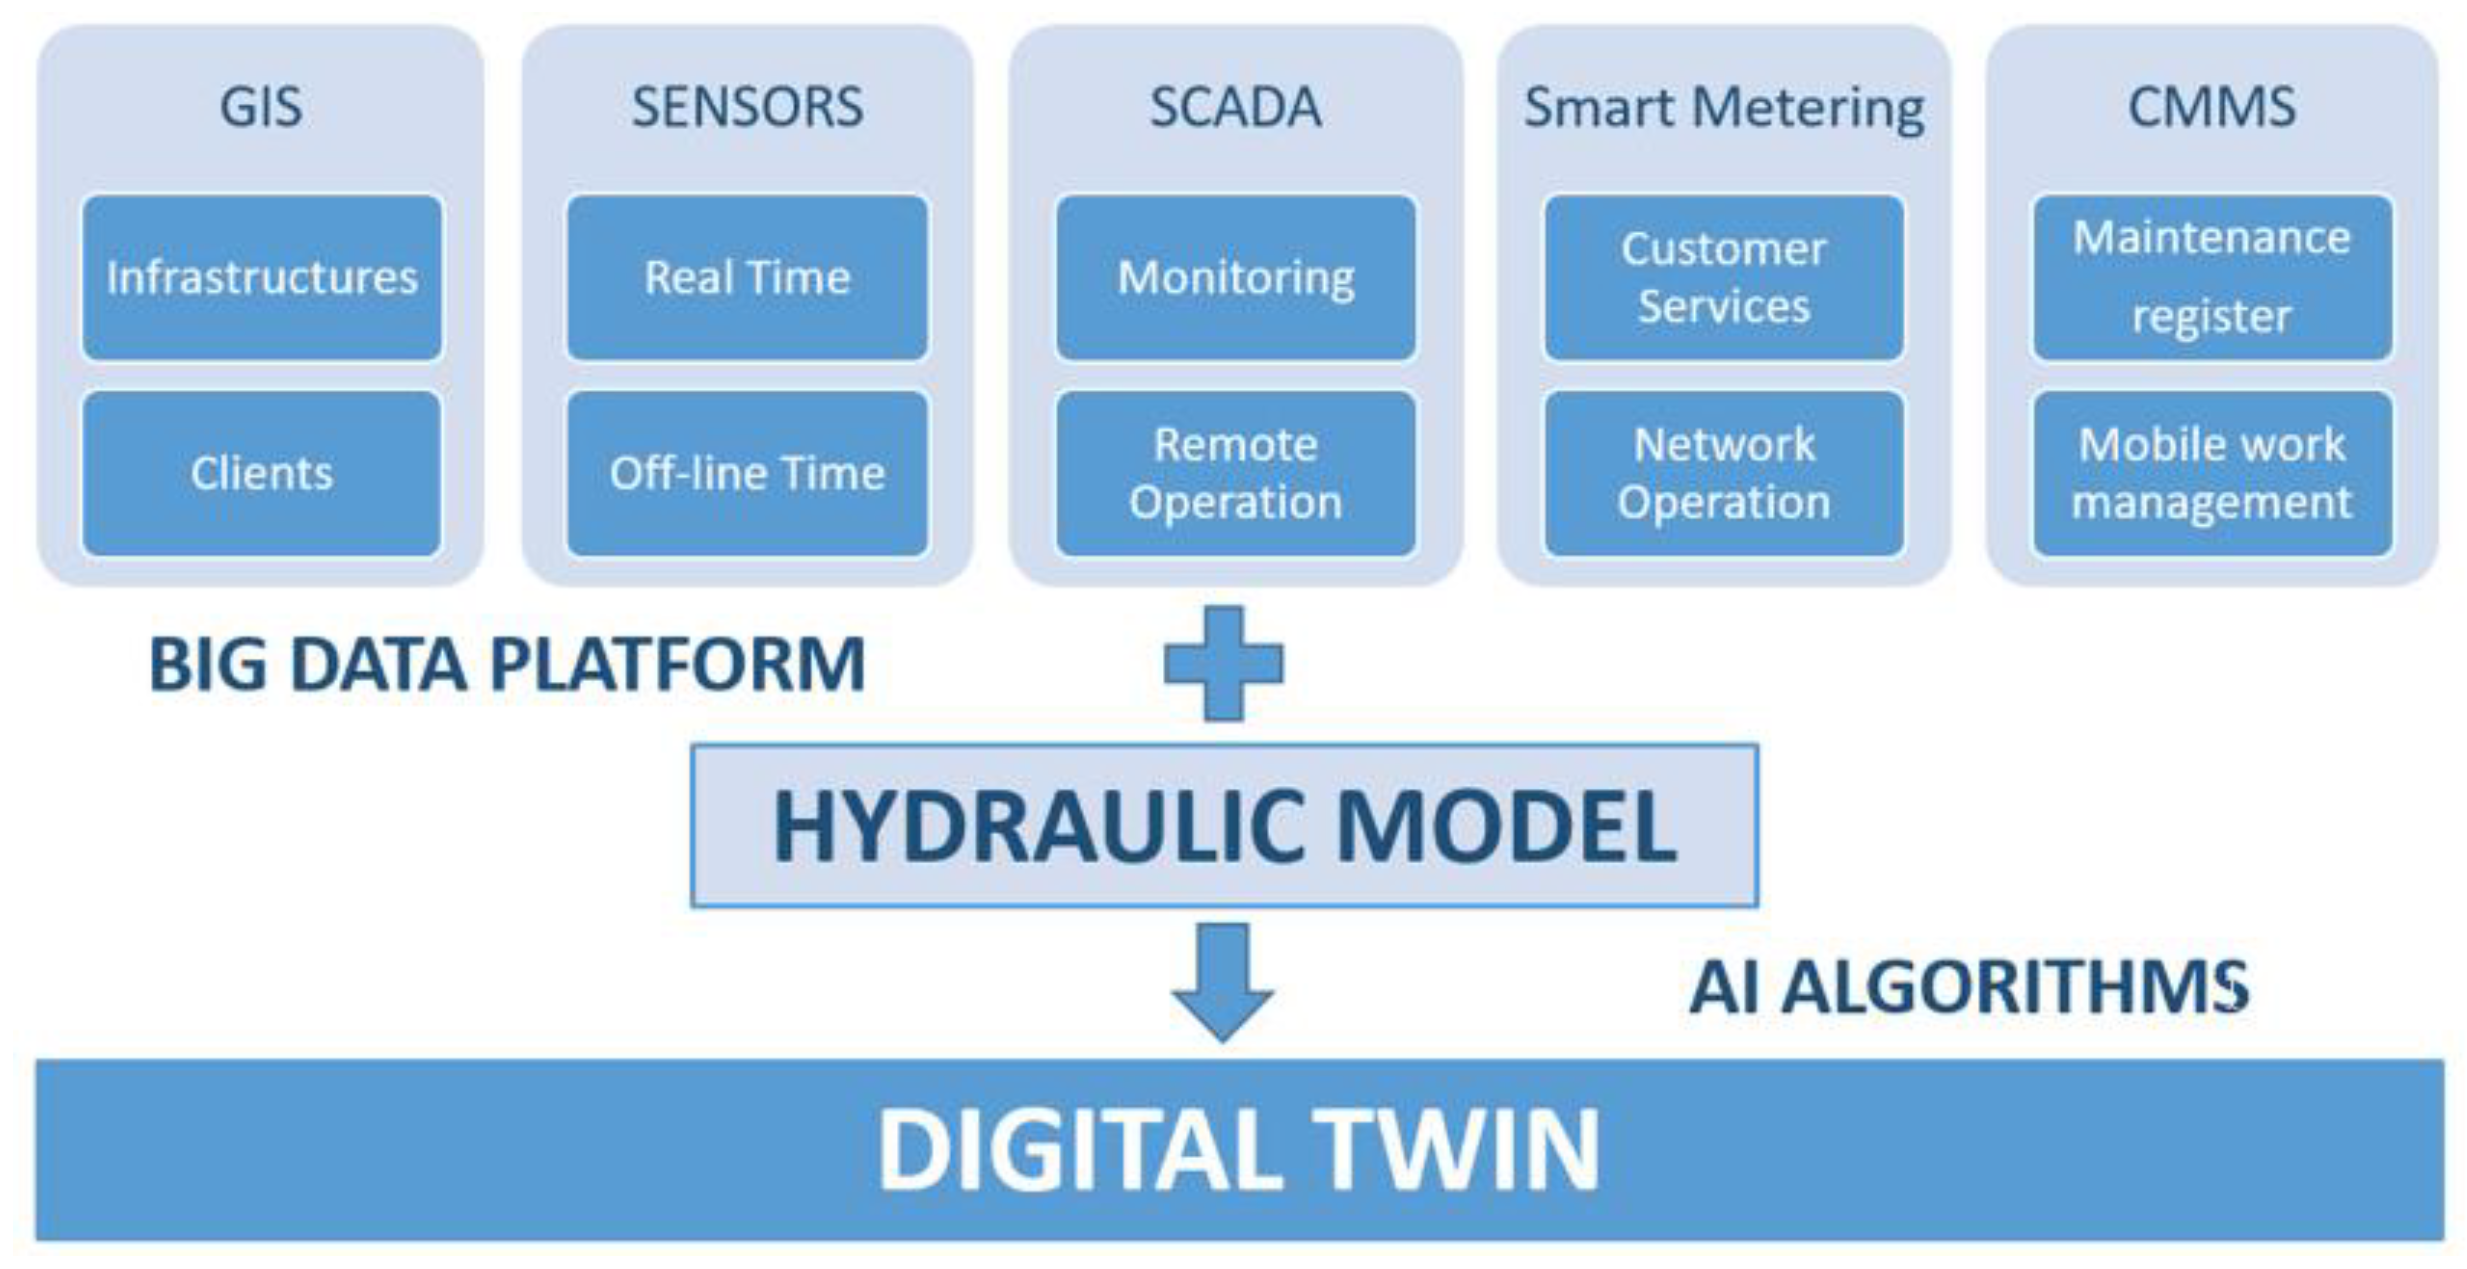
18]. DTs and SWGs foster and help digitize management systems and solve problems caused by bad design or inadequate operation. DT development requires continuous adjustments and learning techniques supported by large field data stored in big-data platforms (
Figure 2).
The main components of the big data platform that supports a DT are as follows: (i) GIS, which provides information regarding the location of system components; (ii) sensors, which measure hydraulic parameters of the water network; (iii) data acquisition (SCADA), which supervises, monitors, and controls the collected data; (iv) smart metering, which controls the network operation and customer service in independent metered areas; and (v) computerized maintenance management system (CMMS), which tracks and maintains stationary assets. As a result of the integration of the former sources in the hydraulic model, with the use of artificial intelligence (AI) algorithms and information and communications technologies (ICTs), a DT model is developed (
Figure 3) with a huge potential to be exploited [
12,
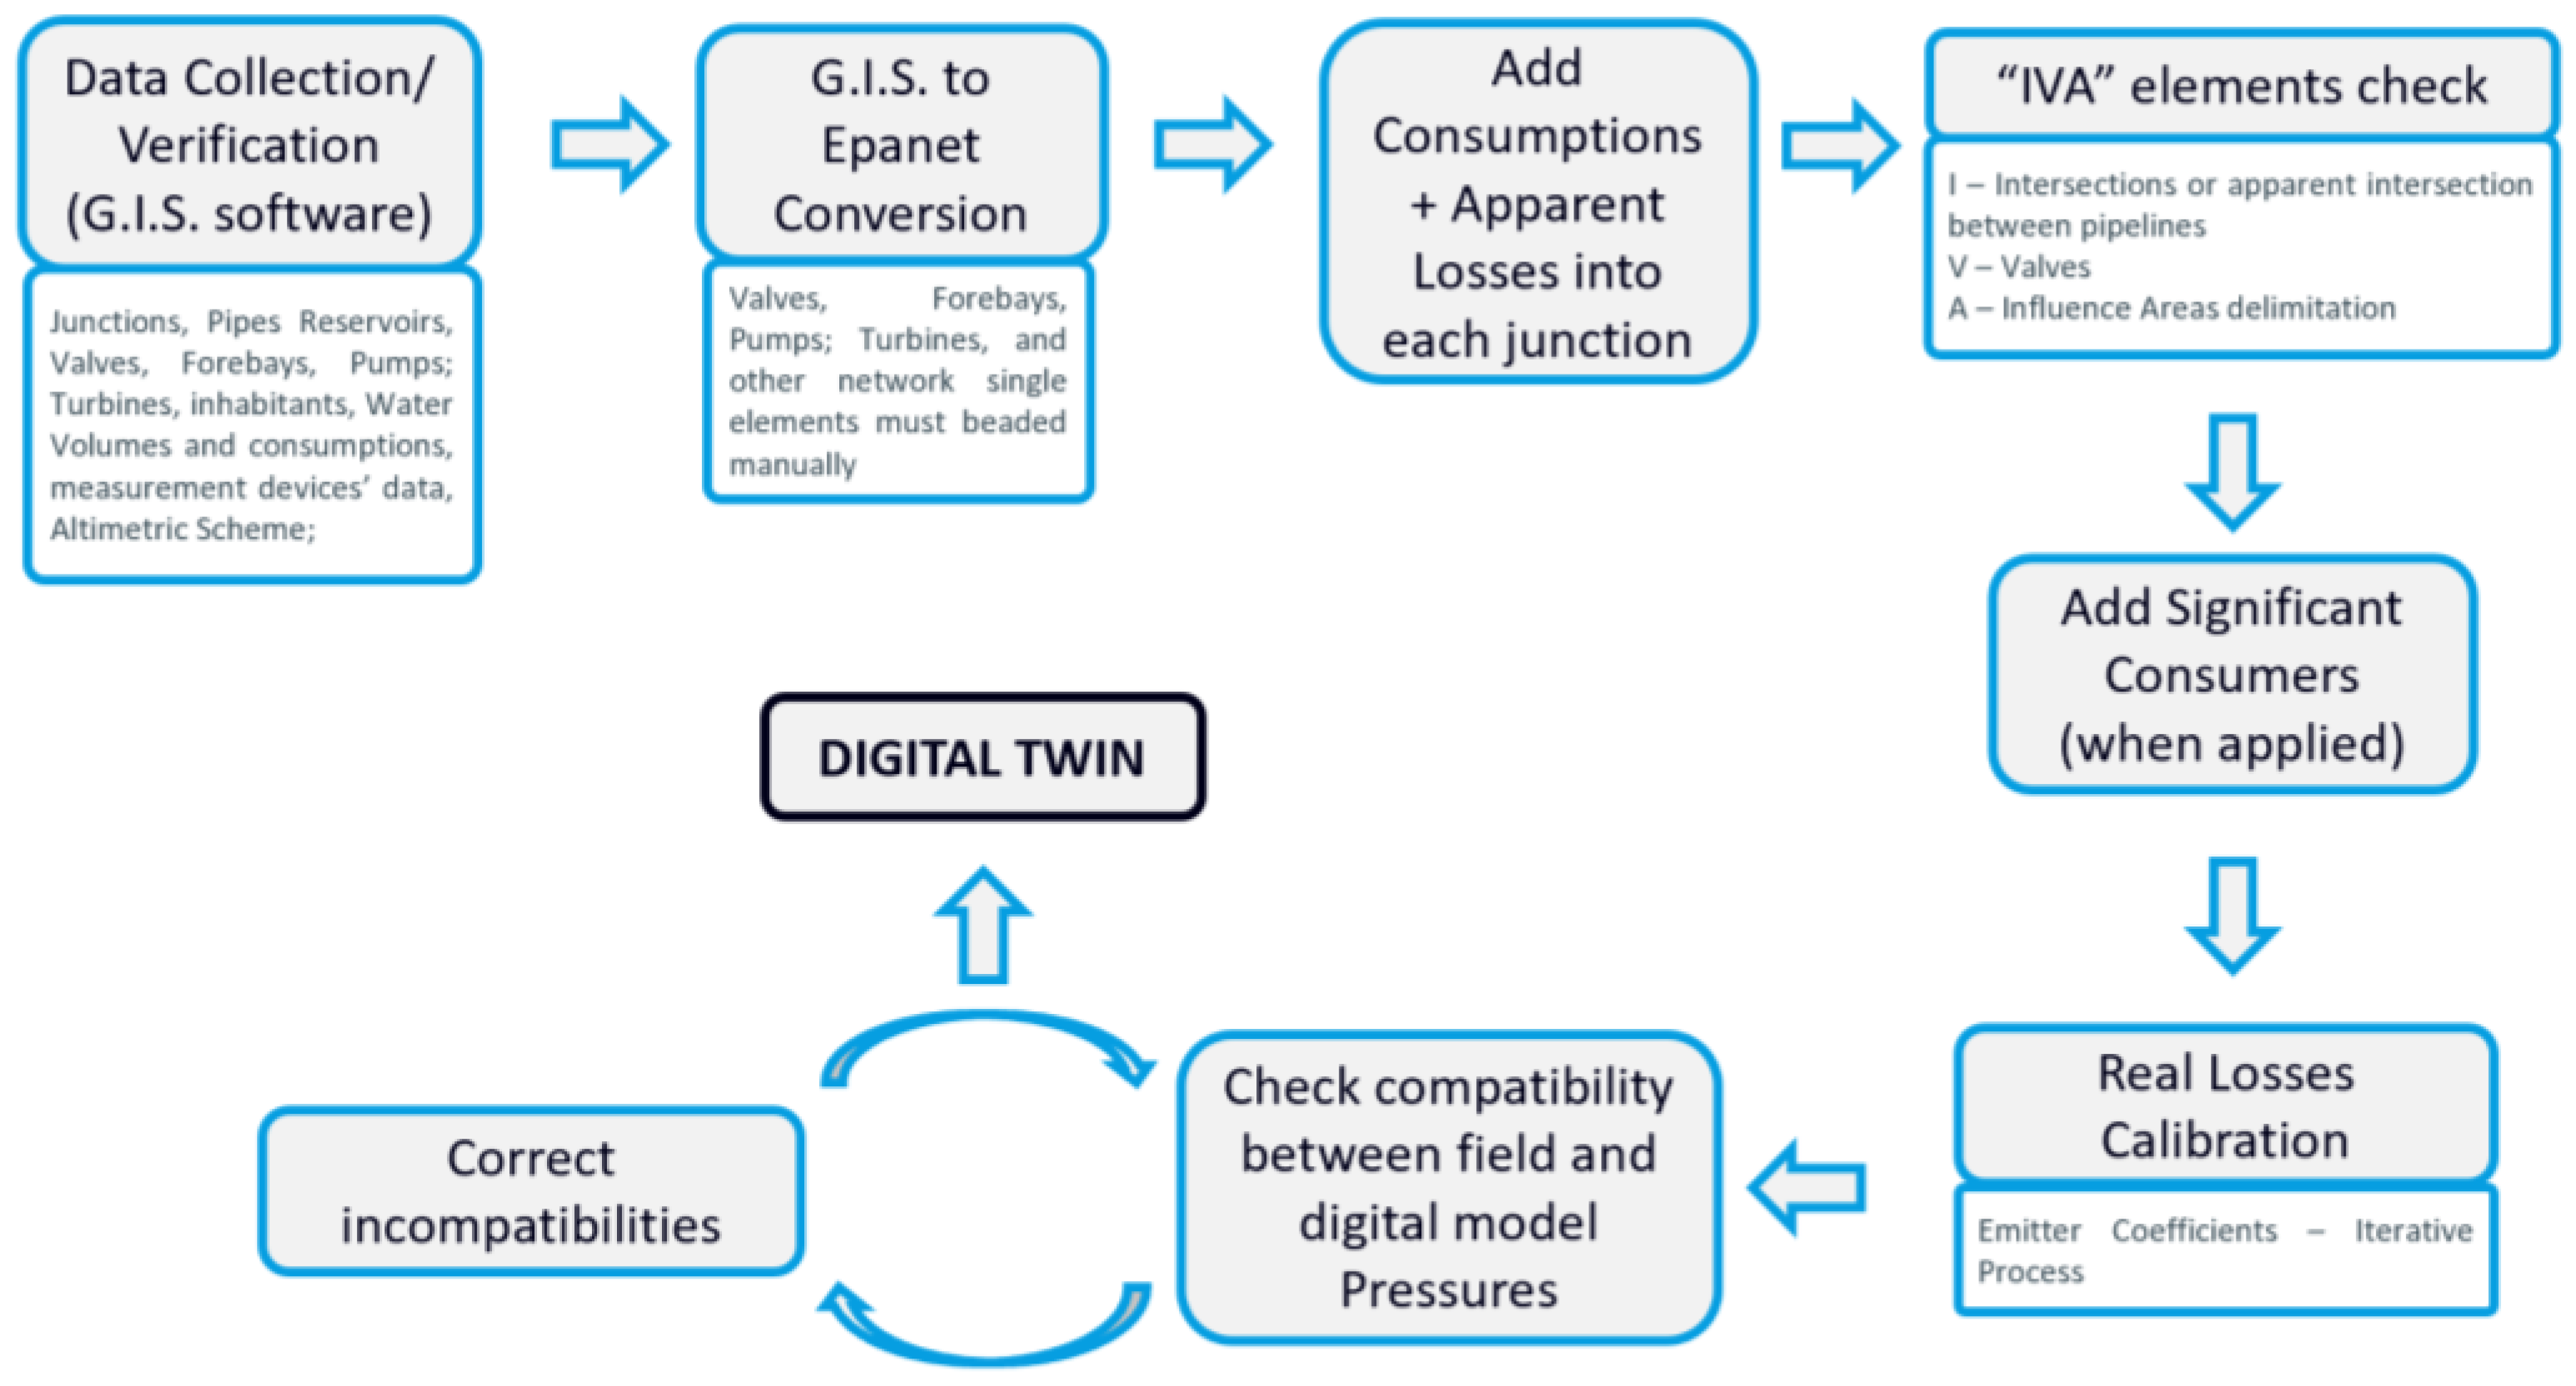
13].
The methodology developed herein includes different stages, as displayed in
Figure 3. The first development is a hydraulic model of the existing network and the big data collection and management provided by the municipal entities to represent the water network’s operation.
GIS topography data and network elements’ data must also be provided (i.e., pipes, junctions, valves, or other existing hydro-mechanical devices, reservoirs, and external connections). Additionally, the cartography and features of buildings (i.e., top elevation, number of floors, and the existence of pumps) are required for understanding pressure distribution and water supply management. Besides physical data, water volumes and all measured information are required to identify flow patterns, water usage of customers, and the overall volume balance of the system according to the definition of water balance. Finally, field pressure measurements are key to calibrating and validating a DT model to describe the real system under analysis accurately.
2.2. Gaula System Characteristics
2.2.1. Gaula WDS Configuration
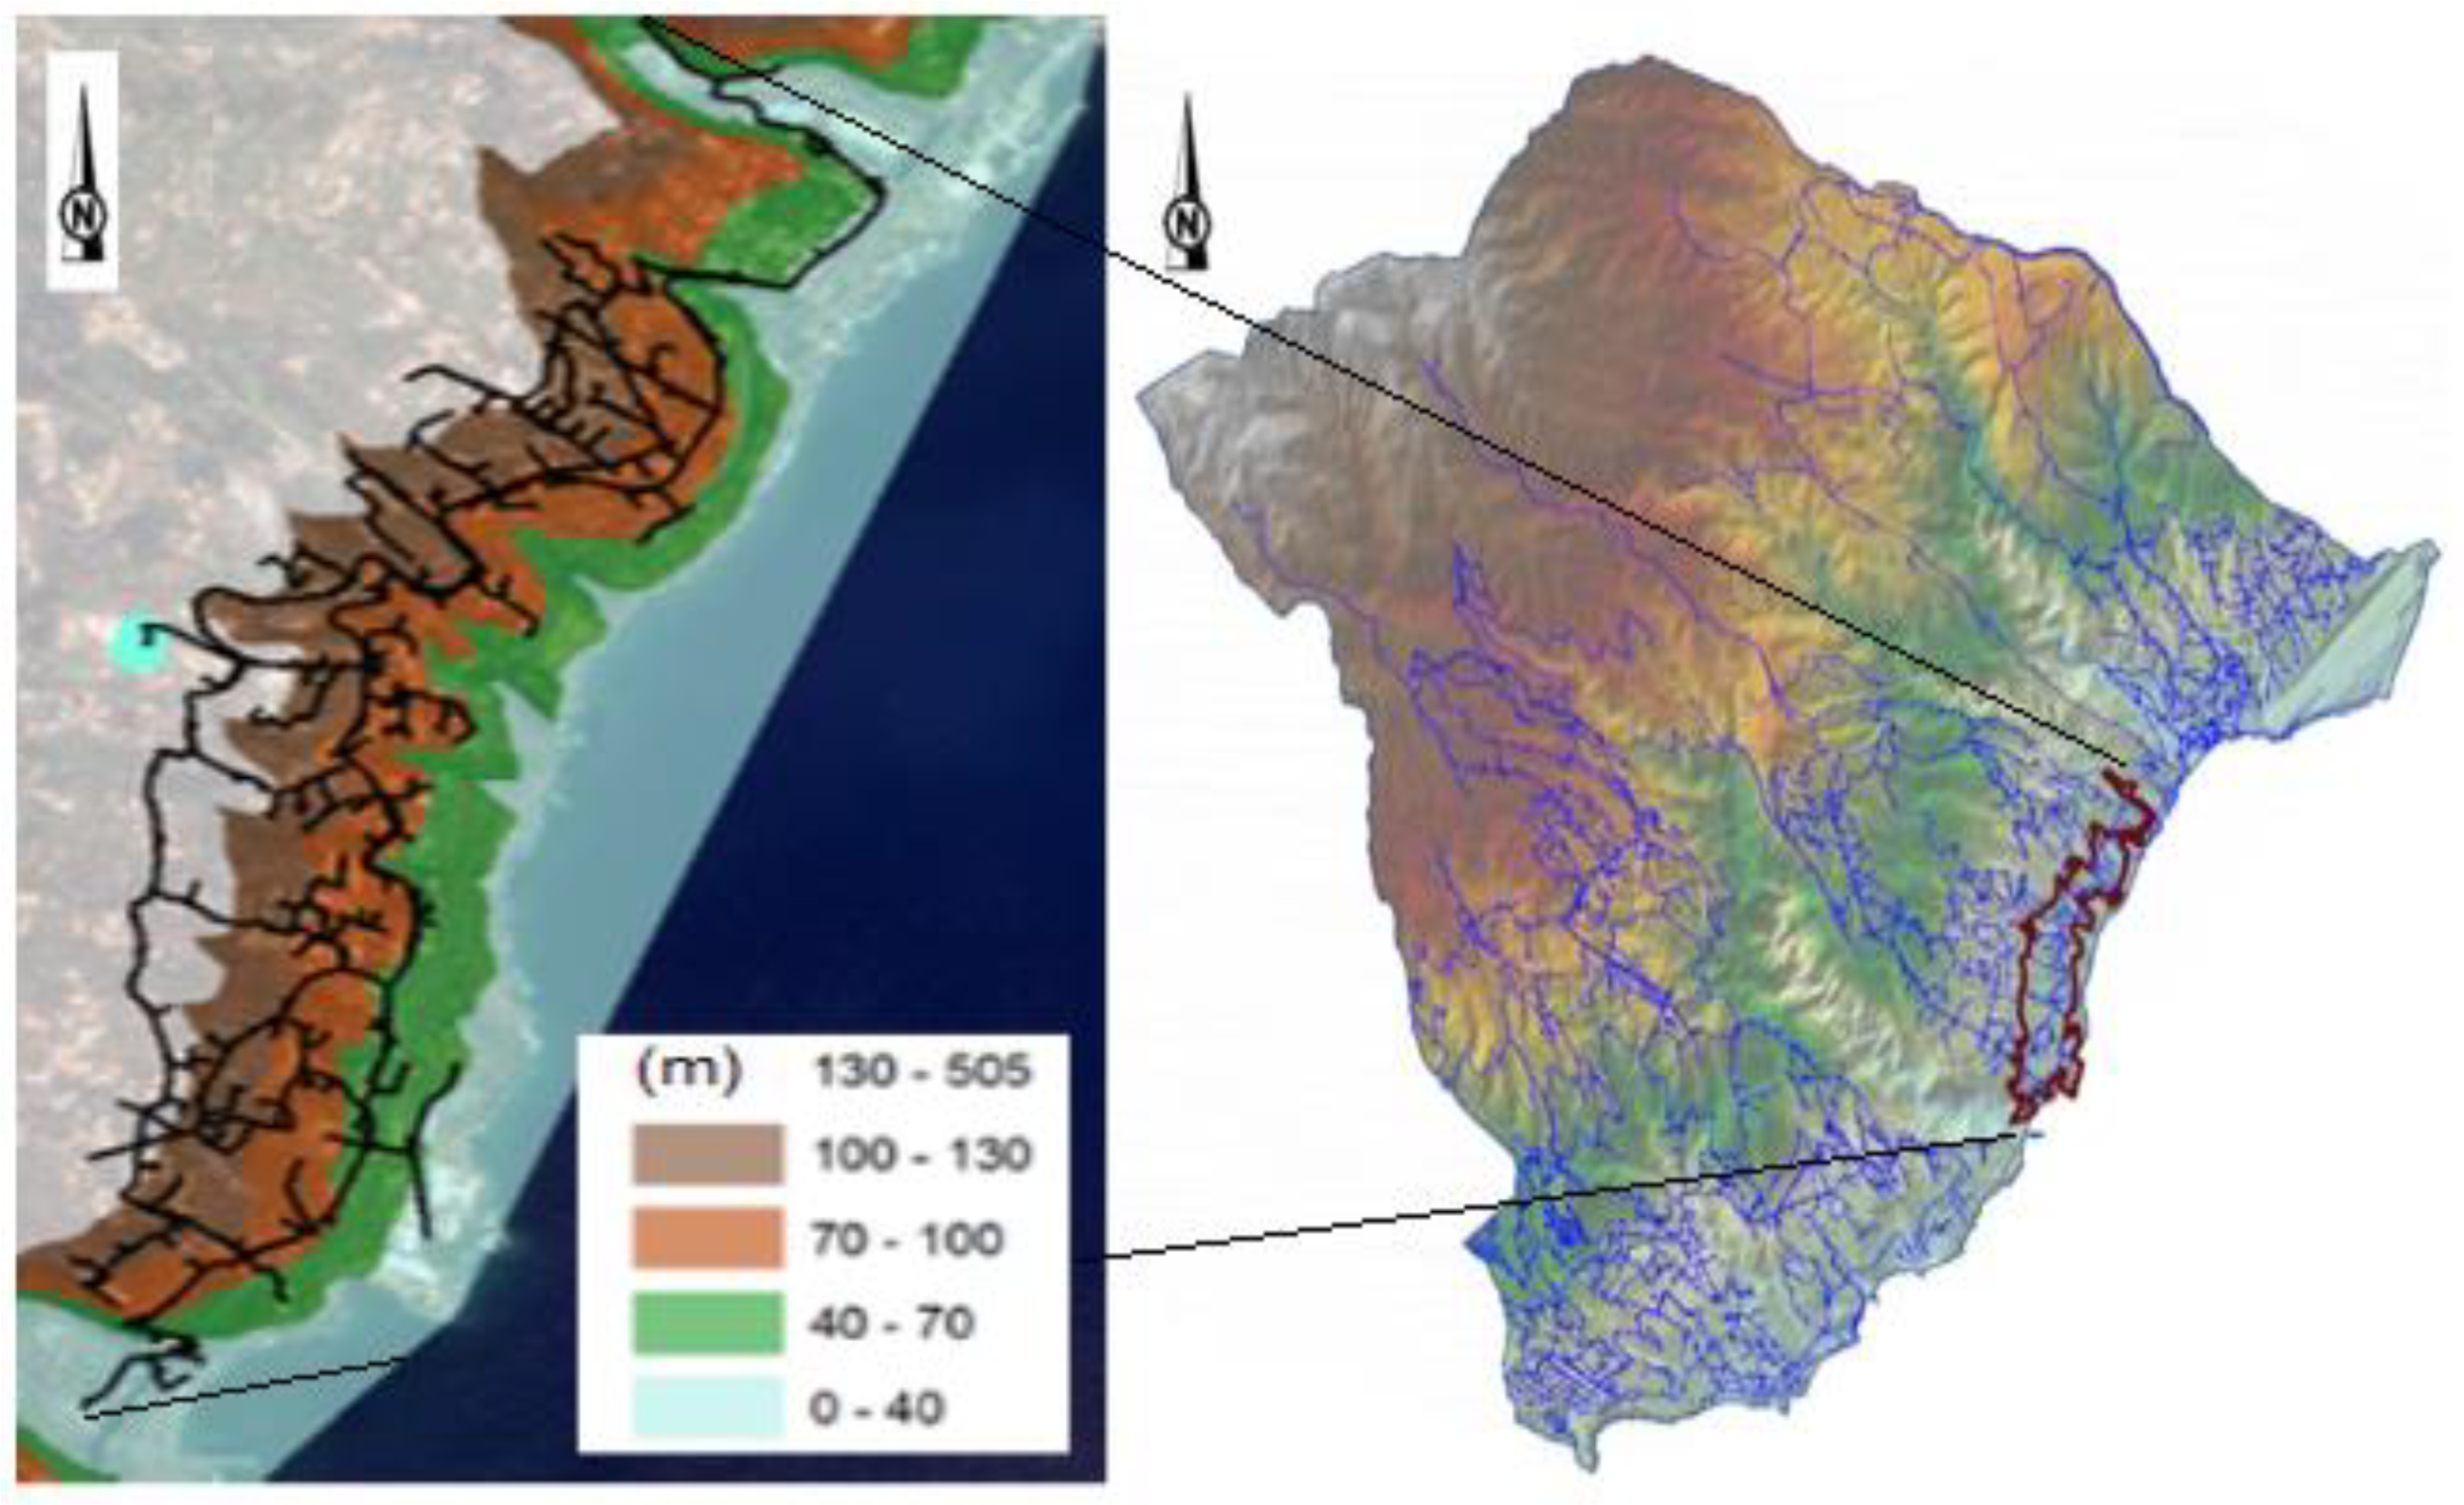
The developed DT is applied to all subsystems using the EPANET hydraulic simulator. It is calibrated, compiled in a single model, and then applied to a water distribution network supplied by the Gaula’s tank. All the location information and characteristics of physical elements used in elaborating the hydraulic model, such as the pipes’ site and geometry, valves, and tanks, as well as the information related to existing altimetry and cartography, were used in GIS format. The Gaula WDN, located in the southeast area of the Madeira municipality, contains 19 km of pipes. The Gaula tank is gravitationally fed by the “Funchal–Machico” pipeline.
Figure 4 shows the morphology of the region where the highest elevation values in the northwest region can be observed.
The Gaula WDN, according to municipal water data, is an aged system mostly composed of HDPE (53%) and galvanized iron (35%) pipe materials. For hydraulic simulation purposes, the Hazen–Williams formula was adopted to calculate head losses, with a roughness coefficient of 140 for new pipes in HDPE or FF, 130 for existing HDPE or FF, and 100 for fiber cement and galvanized iron ducts.
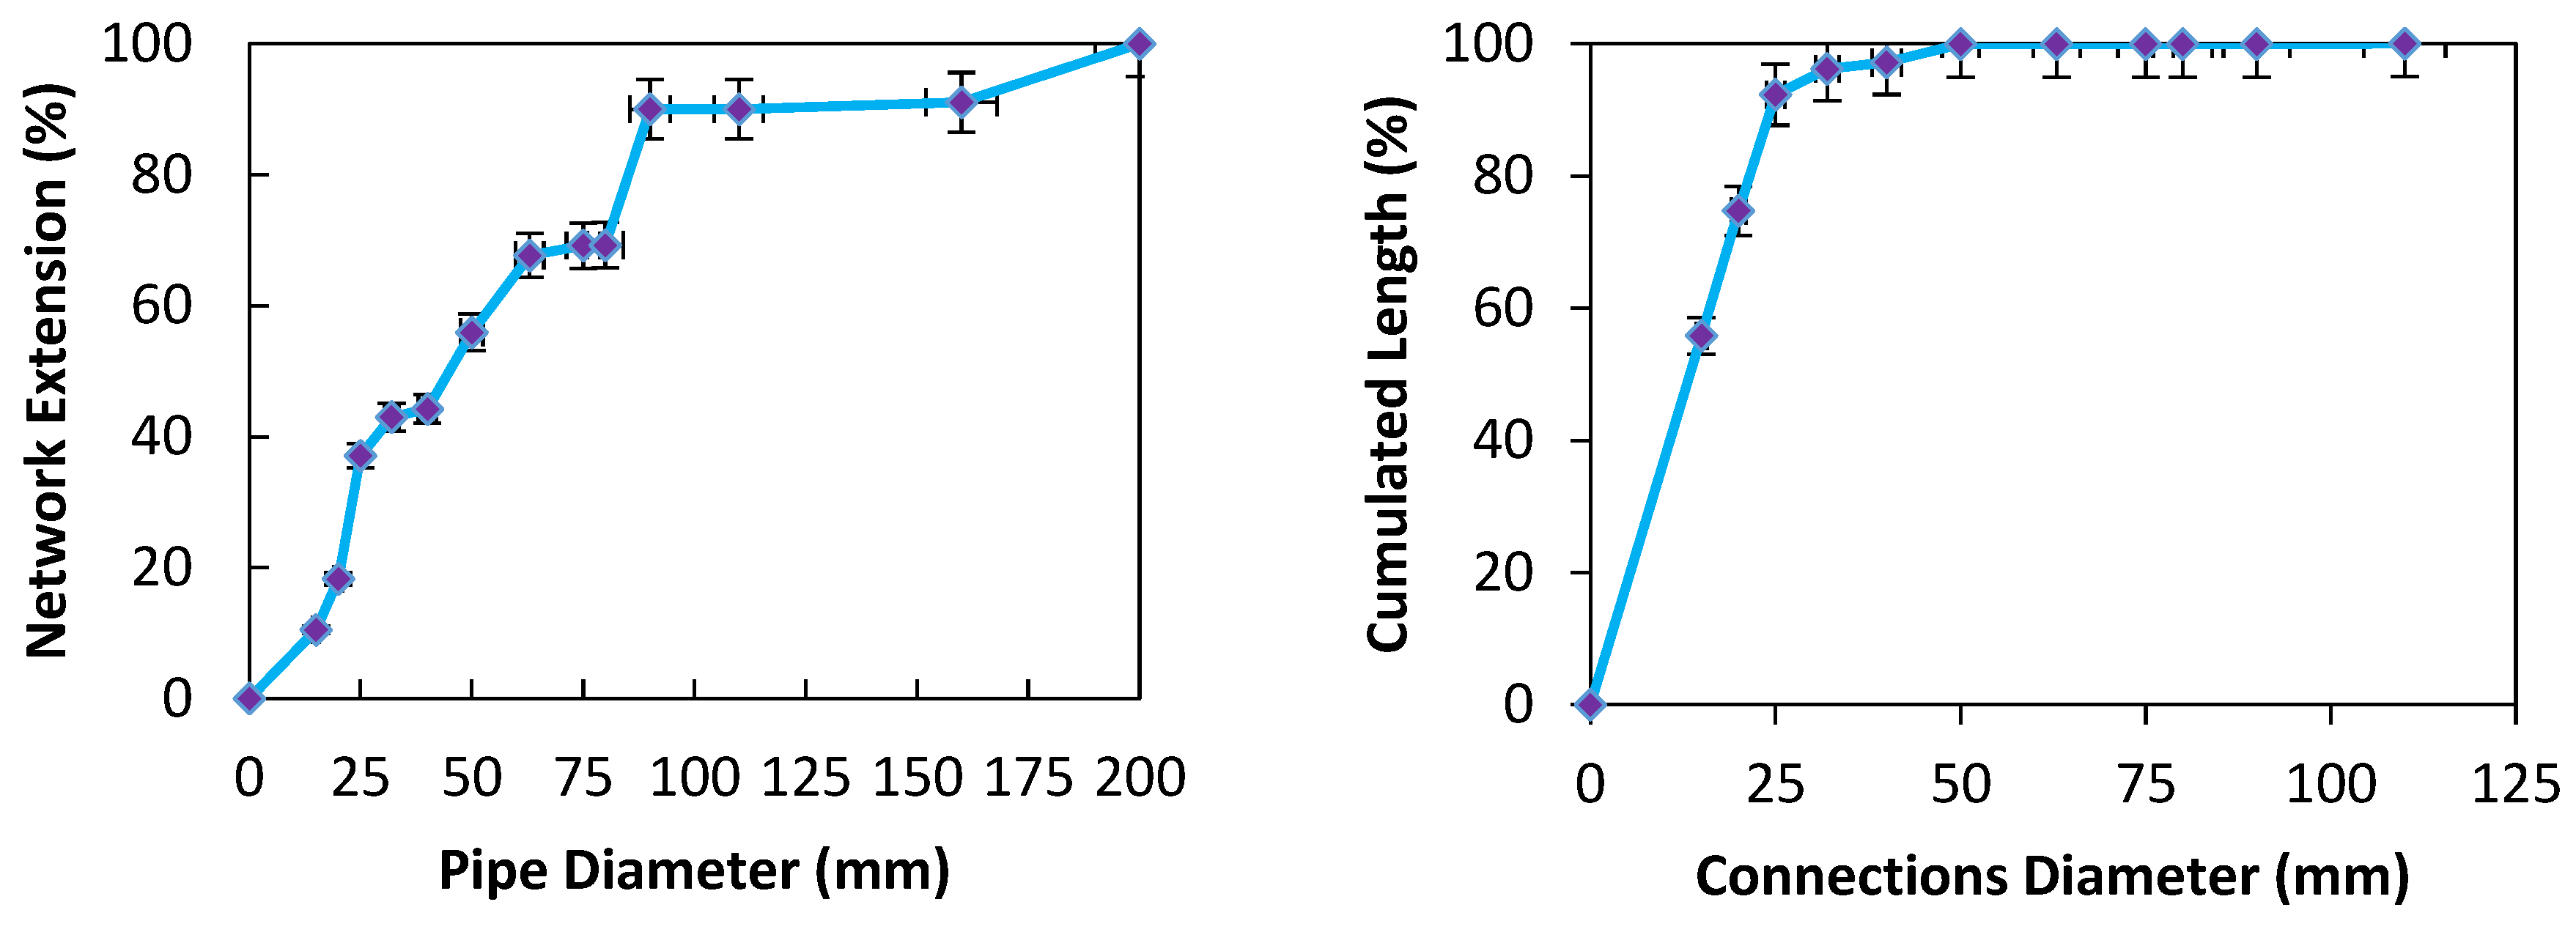
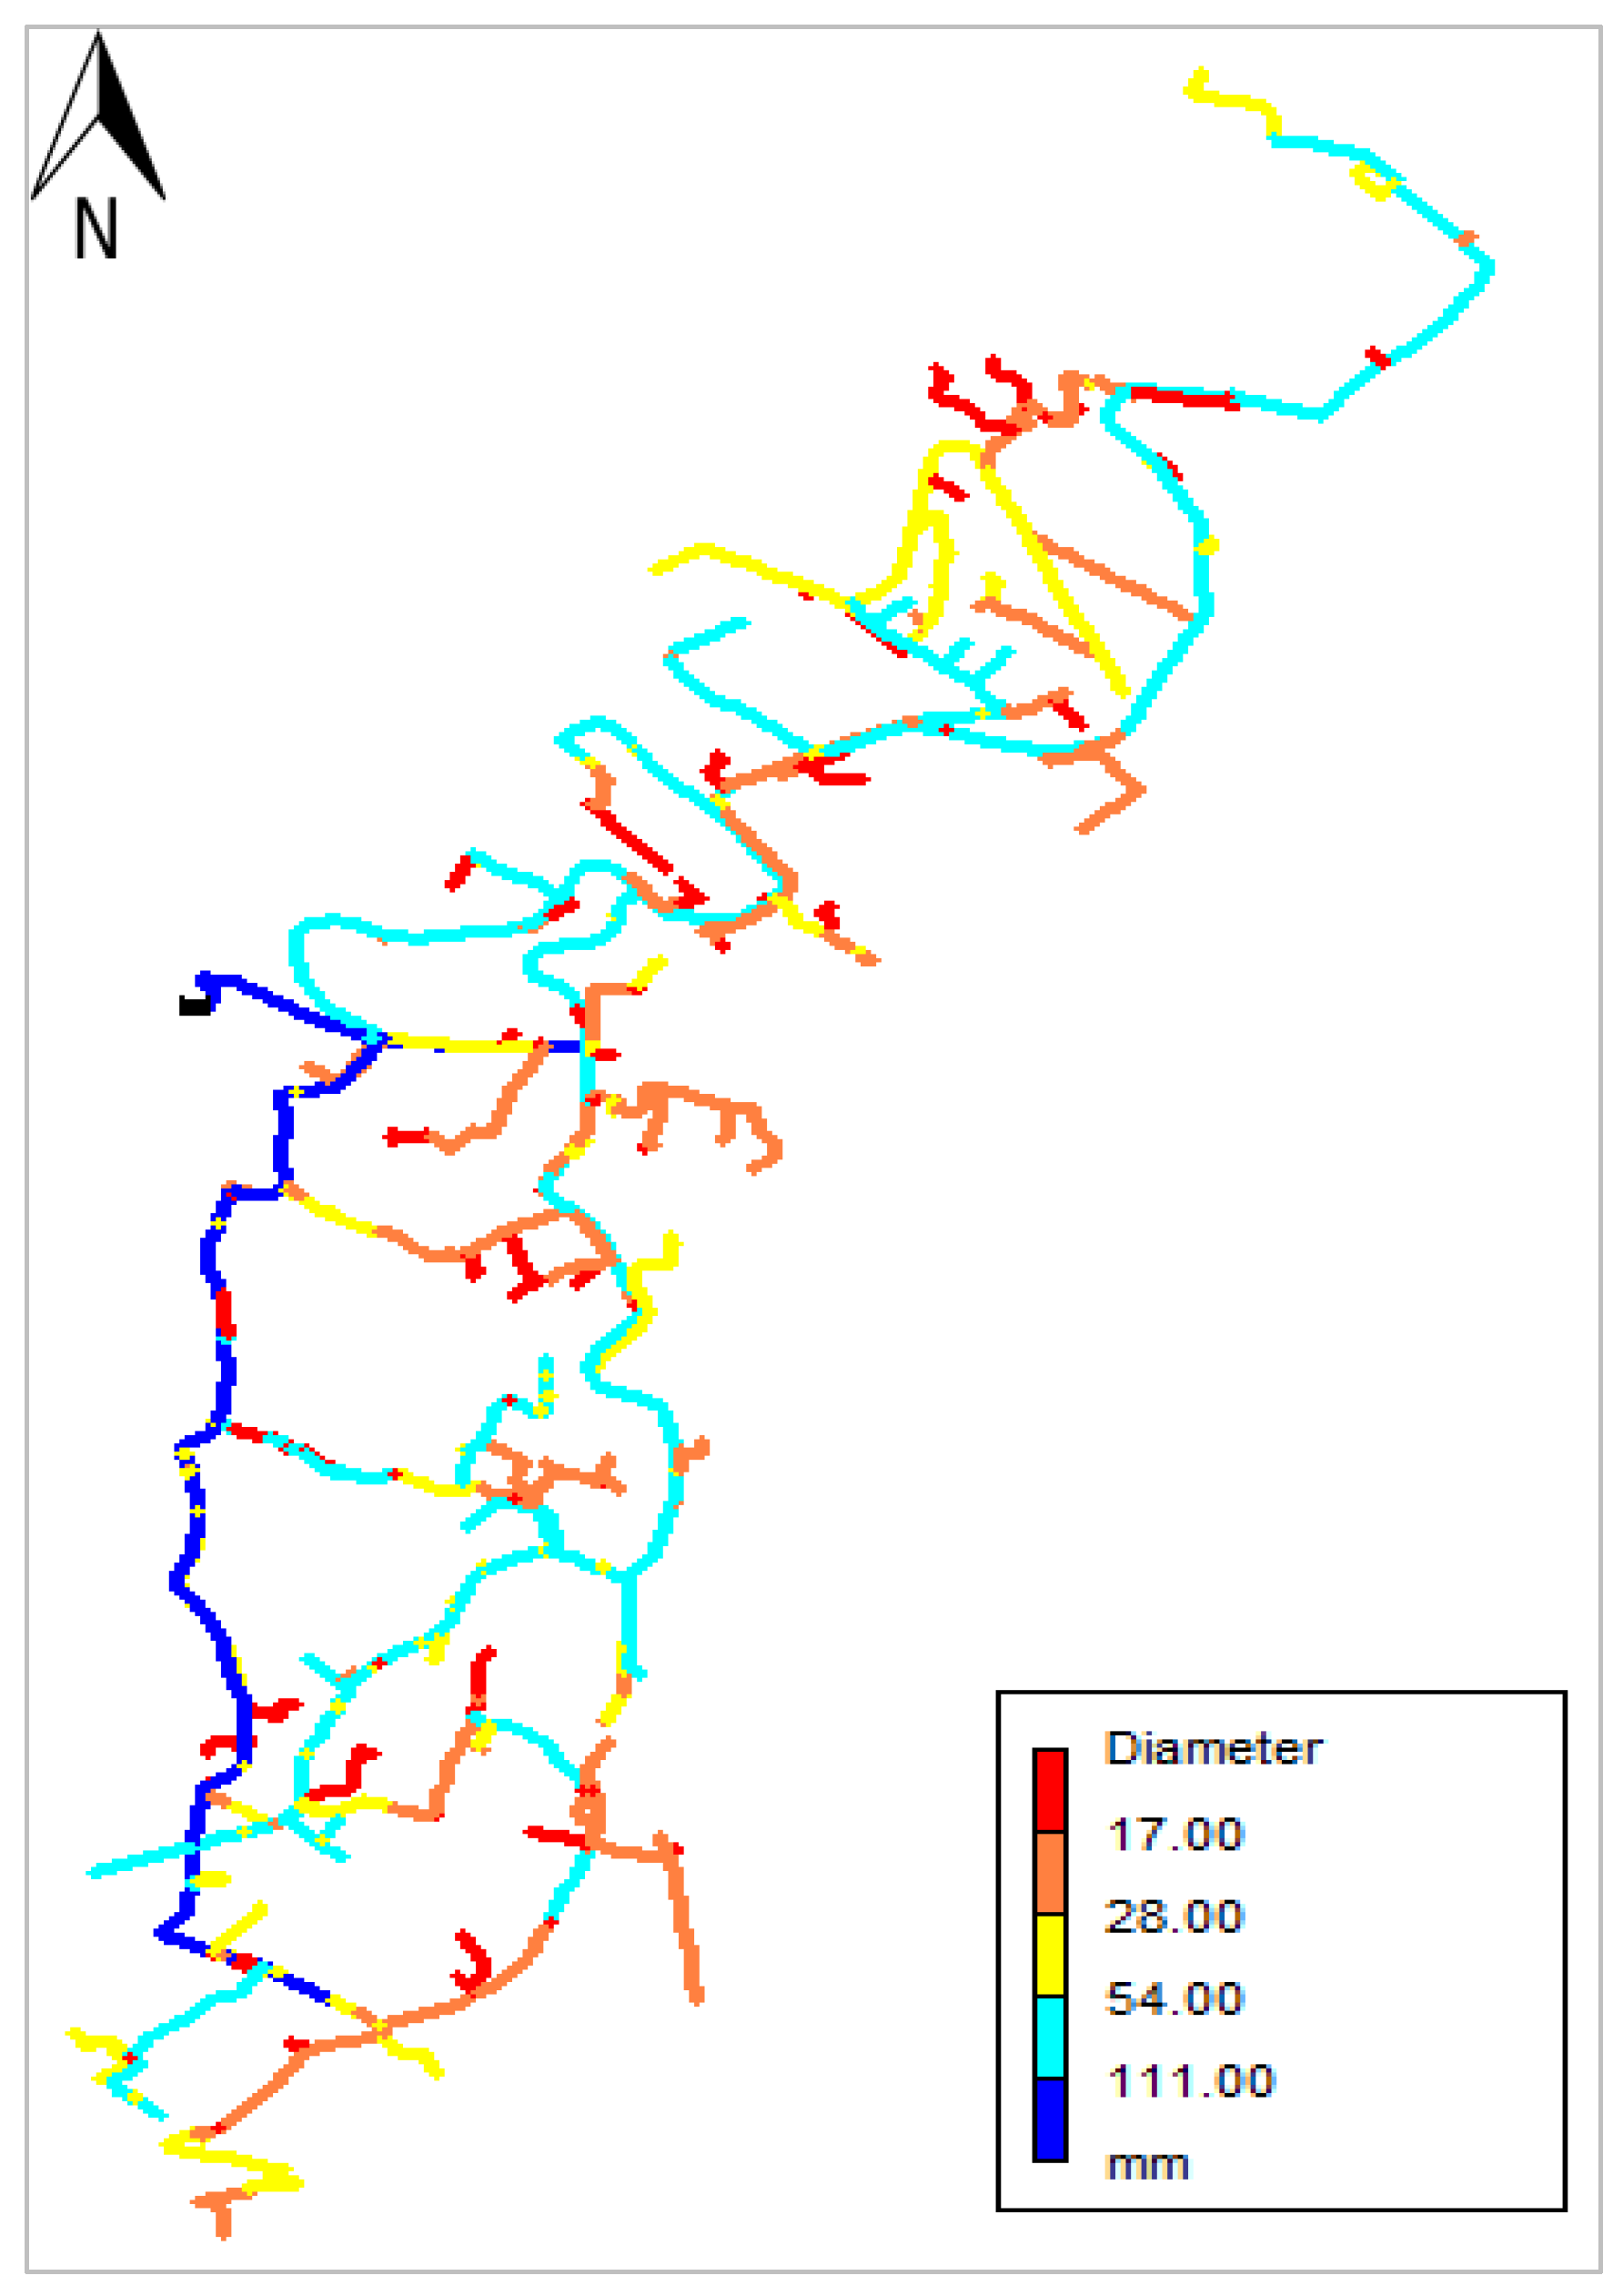
Figure 5 and
Figure 6 present the pipe diameters in this WDN and the diameter distribution through the network. Often, the diameter values are smaller than the minimum regulated values (i.e., DN60 for populations below 20,000 inhabitants).
Figure 5 and
Figure 6 show that the connections often have diameter values smaller than the minimum regulated values (DN 20), with 96% having a diameter below DN40. For modeling purposes, the internal diameters were used according to the material of each pipe.
2.2.2. Gaula Demand and Losses
Over the last few years, the consumption evolution had no significant variation and remained almost constant. Therefore, available values from 2019 were used in the DT model. Although apparent losses typically account for about 5 to 10% of the billed consumption, they are supposed to represent twice as much as real losses and still have a very high value. Thus, the base scenario (also called the status quo or existing situation) considered in the analysis is presented in
Table 1.
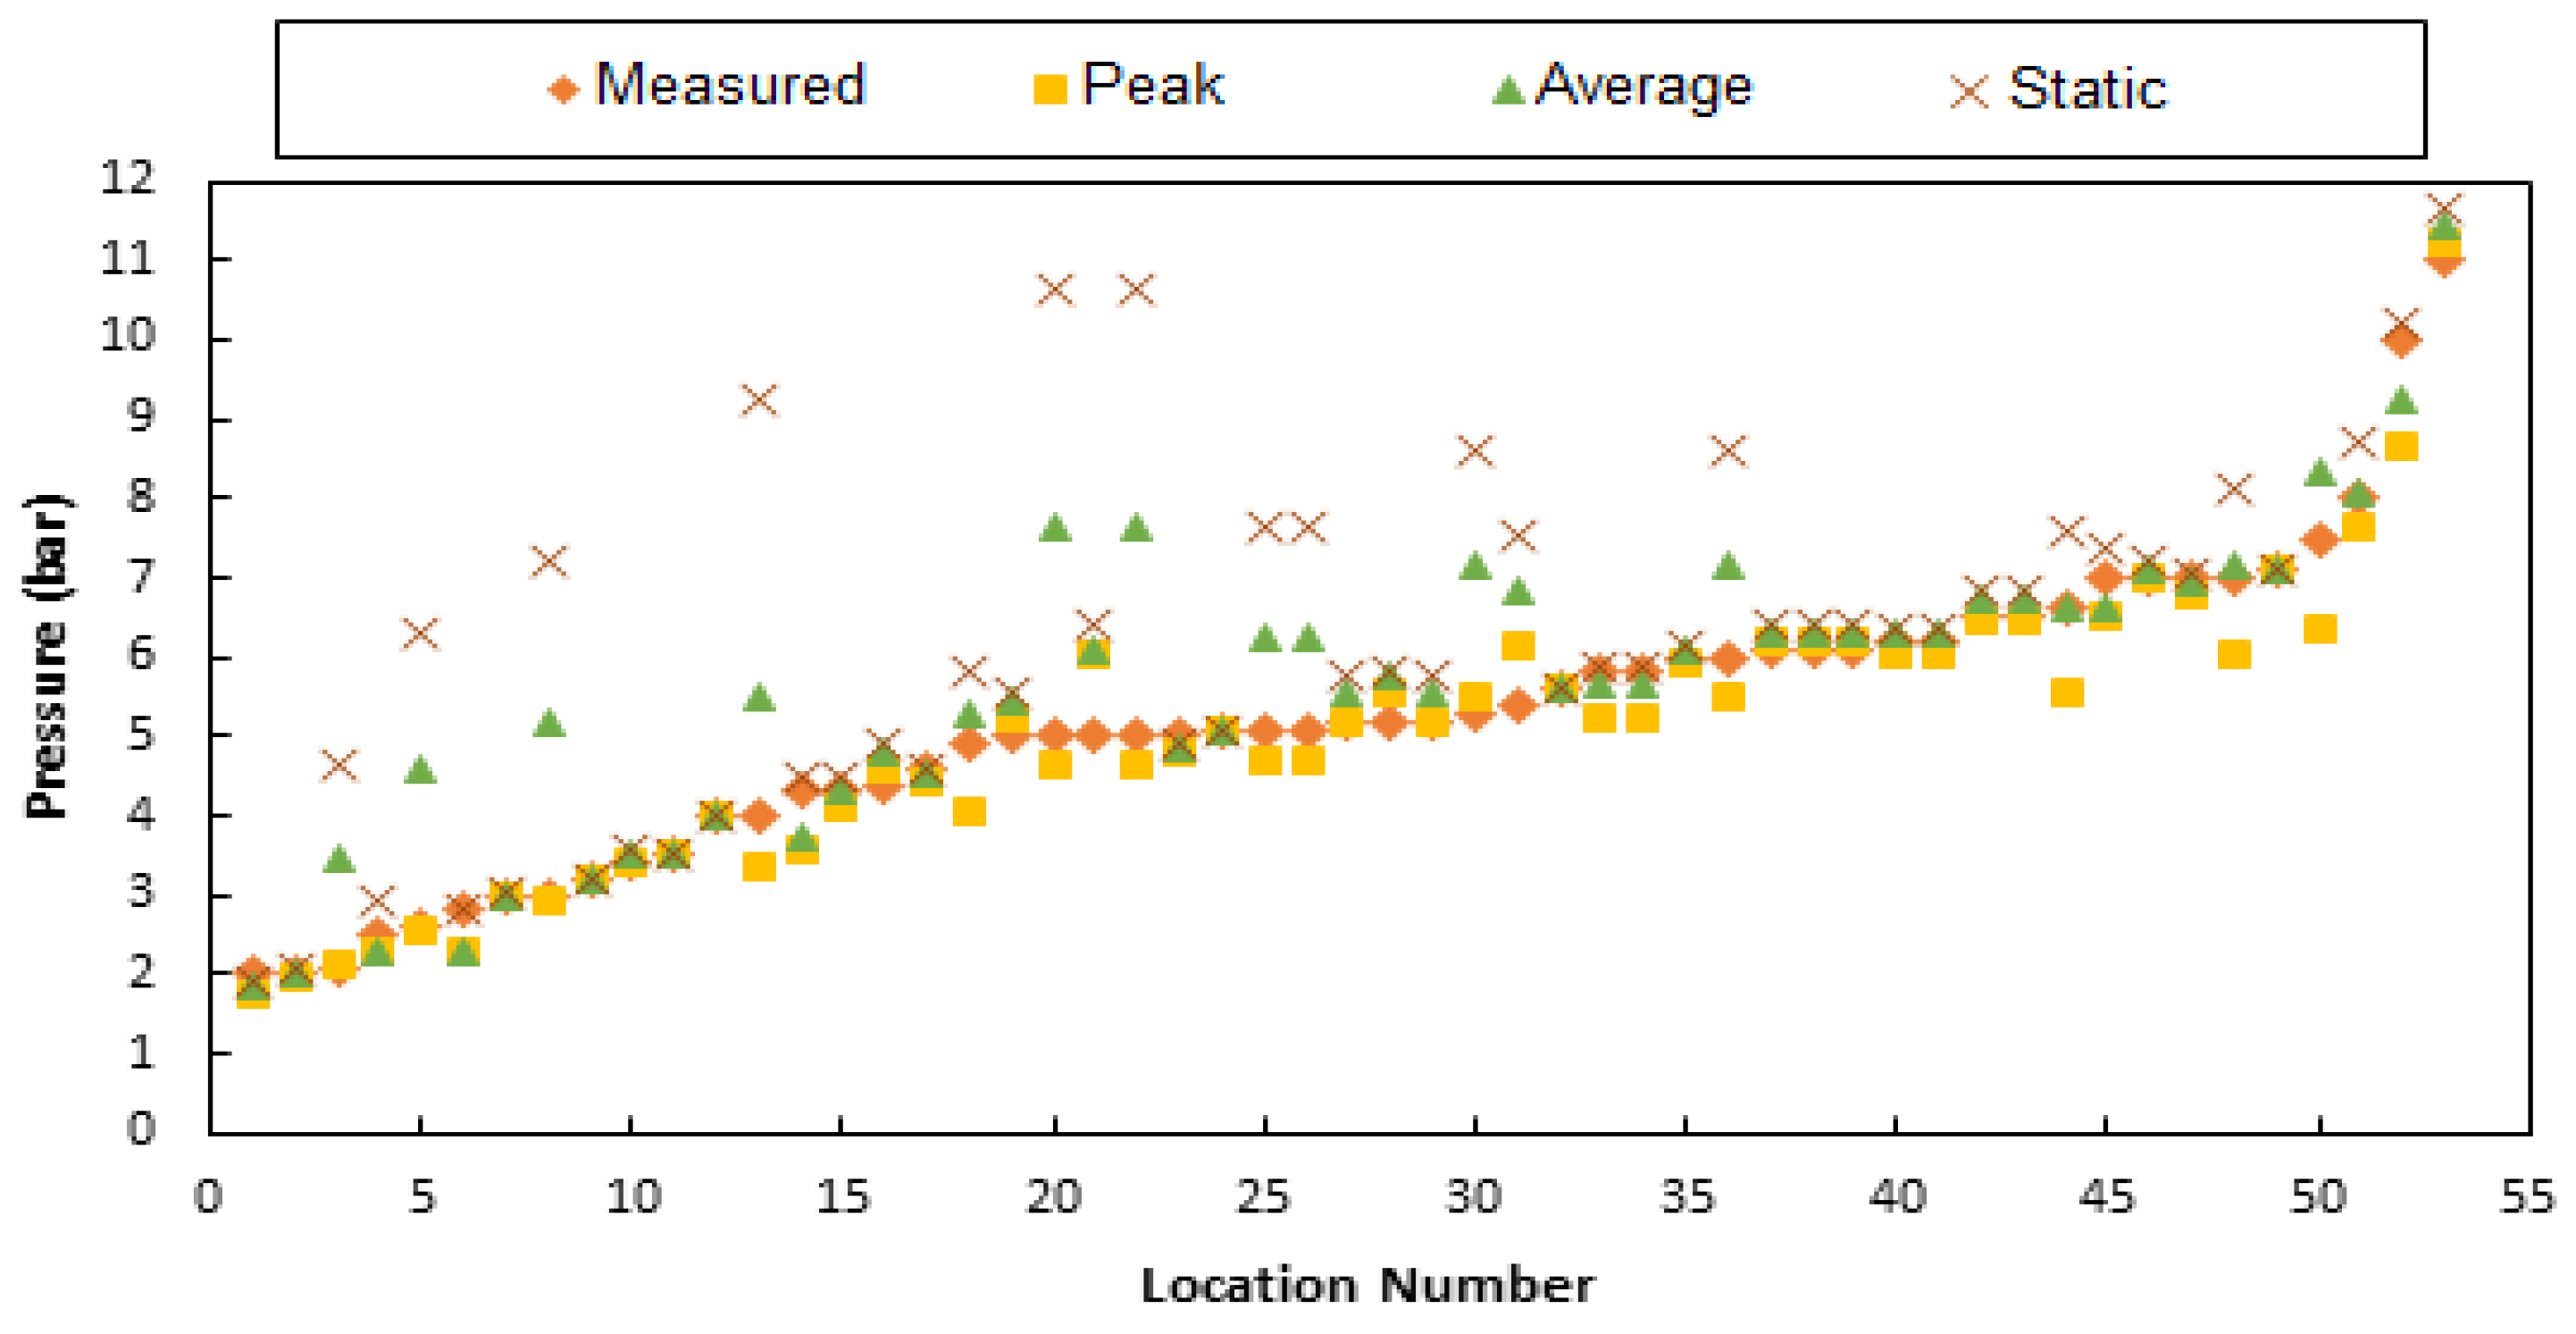
According to the National Statistics Institute (INE) data, the studied population corresponds to 1396 inhabitants. Three scenarios were considered in this study regarding the type of consumption: (i) an average situation (i.e., the occurrence of average consumption); (ii) a peak situation (i.e., the occurrence of consumption in a high-demand situation, calculated through the application of the regulatory instantaneous multiplying factor); and (iii) a static situation that considers a hypothetic limit scenario in which there are no domestic flow rates or water losses, meaning that the system is under the highest possible pressure values.
The consumption flow rates and apparent losses were distributed over the nodes of the hydraulic model. These values were used while considering the model’s population distribution per node, which were later converted to demands by applying a multiplying load factor.
To calculate the population of each node, Thiessen polygons were created based on the nodes of the model, which were overlapped with BGRI Polygons (i.e., national geographic base geo-referencing) to reach a population value to be linked to each node. The multiplier to be applied to all junctions was then determined to convert inhabitants into consumption, both for the medium and peak scenarios. This multiplier was calculated by dividing the average consumption flow of each scenario by the population to be supplied, as indicated in
Table 2.
The Portuguese regulatory [
23] instantaneous multiplying load factor (
f) is given by
where
P represents the number of inhabitants in the system, when applied to the present case study, the
f value corresponds to 3.874 for “domestic” consumption.
2.2.3. Real Losses
The DT-based model considers the volume of real losses separately from apparent losses and demands through emitter coefficients. With this approach, the DT has different variables associated with each node. The real losses are simulated with a flow rate independent of consumption. The flow associated with each node is calculated according to the following expressions:
where
represents the flow rate;
is the discharge coefficient;
is the pressure;
is the pressure exponent that depends on the type of material of the network;
is the discharge coefficient;
is the length of the pipe between junctions
and
; and
is the number of pipes connected to node
.
The first step of the process is to convert the annual consumption and loss volumes into average flow rates (L/s). Considering Equations (2) and (3), the flow rates corresponding to real losses are distributed into each node through an iterative process until the municipality-provided values have been reached (
Table 3).
The learning process starts with an initial value of 1 × 10⁻⁵ assigned to the discharge coefficient and then applied to each node with the sum of half of the length of each connected pipe. This process results in the first group of values being applied to the emitter coefficients of the hydraulic model, and those values generate an output flow from the reservoir. Since domestic consumption and apparent losses are considered constant values and have already been determined, obtaining the real loss flow is possible. The value readjusts the emitter coefficients until the results reach the municipally provided values. The learning process is completed when the difference between the municipal RLs and the DT model reaches 0.01 L/s.
2.2.4. Pressure Reducing Valves
In a water network, the pressure can be reduced and controlled by installing pressure-reducing valves (PRVs) and flow control valves (FCVs) in strategic locations. Installing such devices and replacing critical pipes promote adequate behavior and management of a hydraulic system [
14,
15].
PRVs are usually installed in systems to control the pressure or head, causing flow energy dissipation. These devices can operate in three ways: by locking when the downstream pressure is higher than the value configured in the valve, thereby increasing the head loss until it reaches the established value; by opening, if the downstream pressure is lower than the established value, thereby reducing the head loss; and by acting as a check valve in the case when the downstream pressure higher than the upstream pressure [
1,
7].
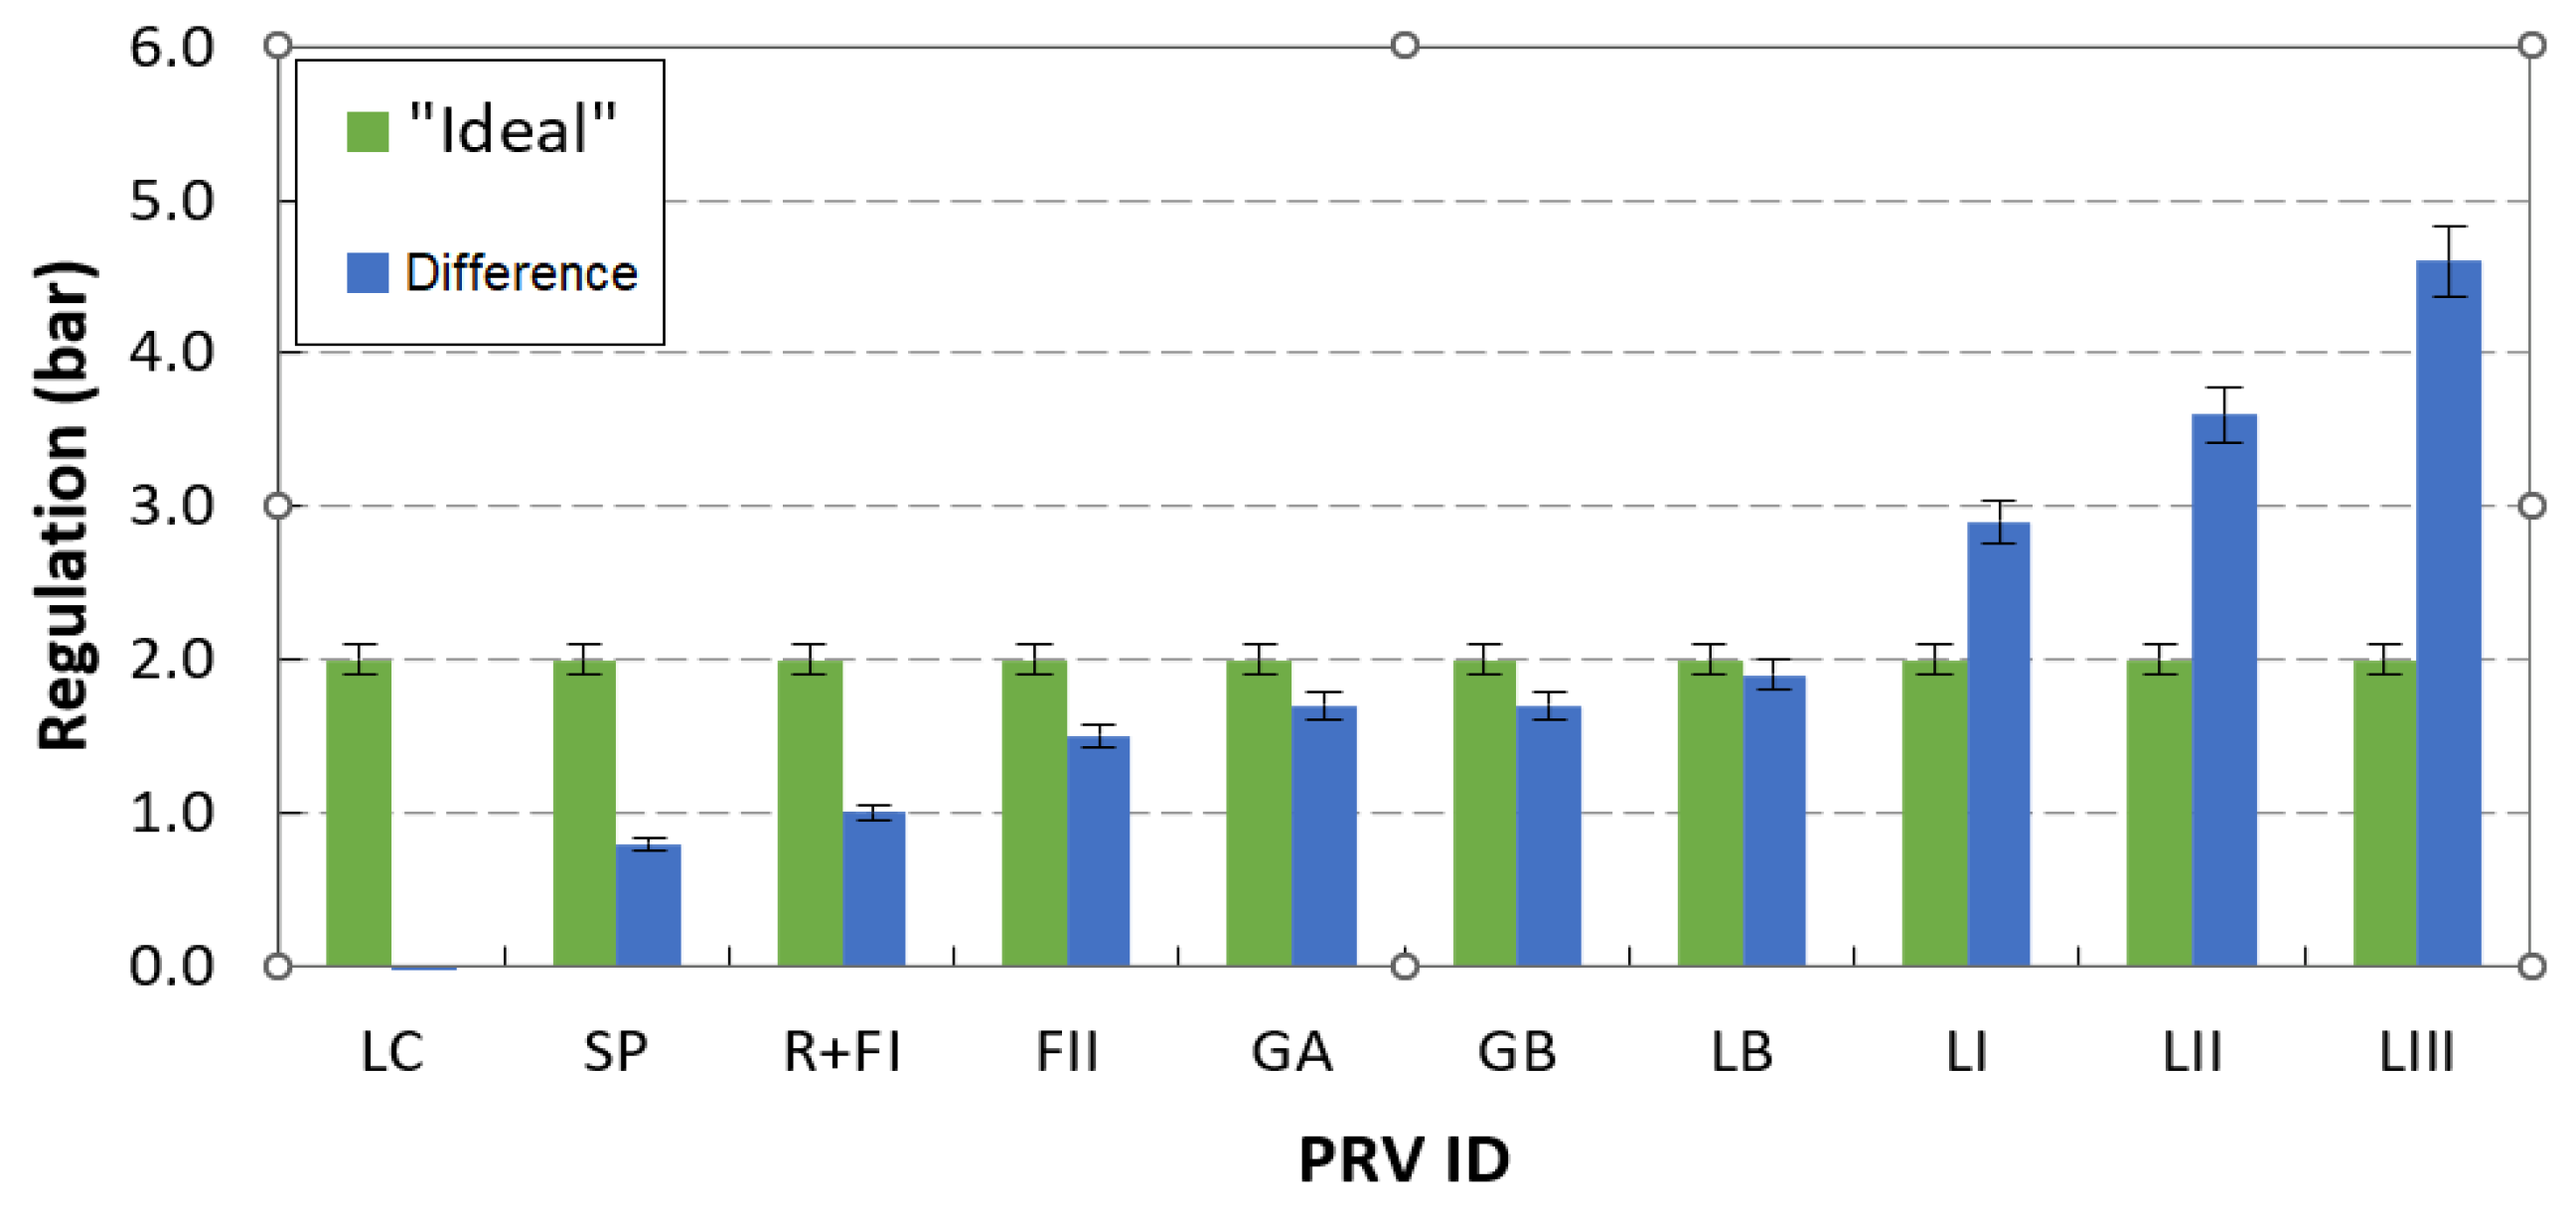
The Gaula water distribution system has ten PRVs and one pressure drop chamber. Most existing PRVs are regulated by pressure values much higher than the “ideal regulation” (it should be equal to 2 bar), as illustrated in
Table 4 and
Figure 7.
Only one PRV (i.e., LC PRV designation) among the ten existing PRVs, has an “ideal” regulation. This is because, among other possibilities, some areas may have low pressures and a consequent deficient supply due to insufficient diameters. These are necessary to establish high-pressure regulations to solve this problem, creating an additional excess of pressure in the rest of the network.
4. Discussion
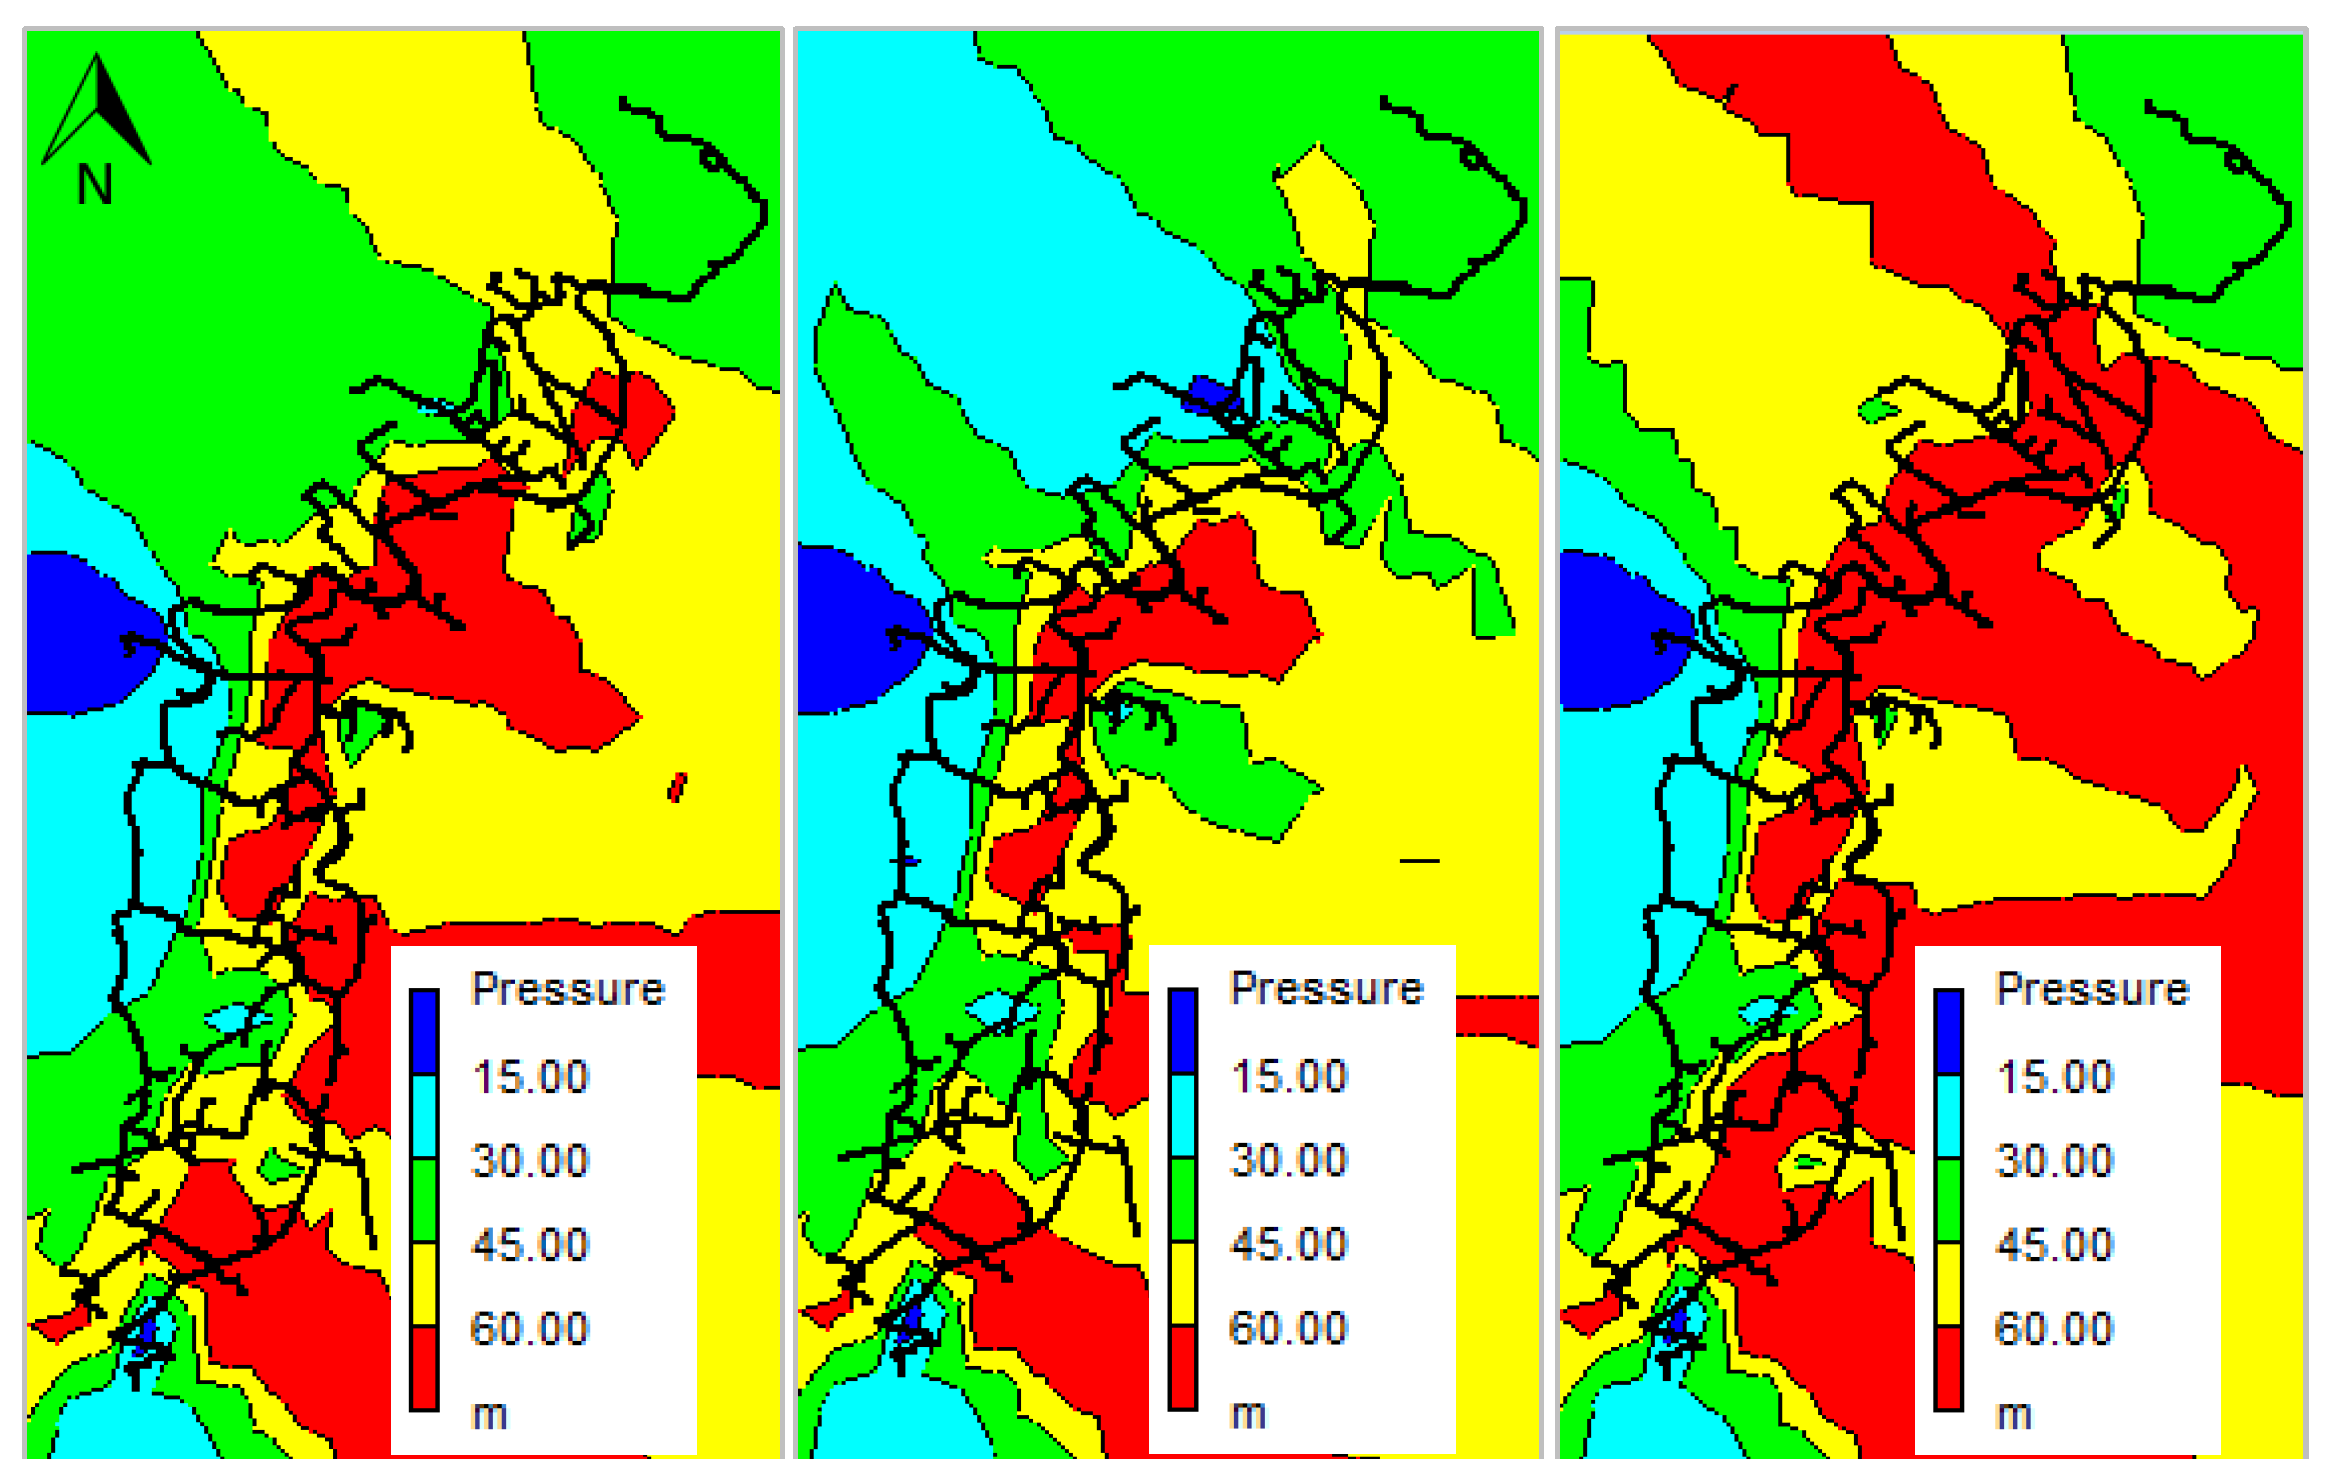
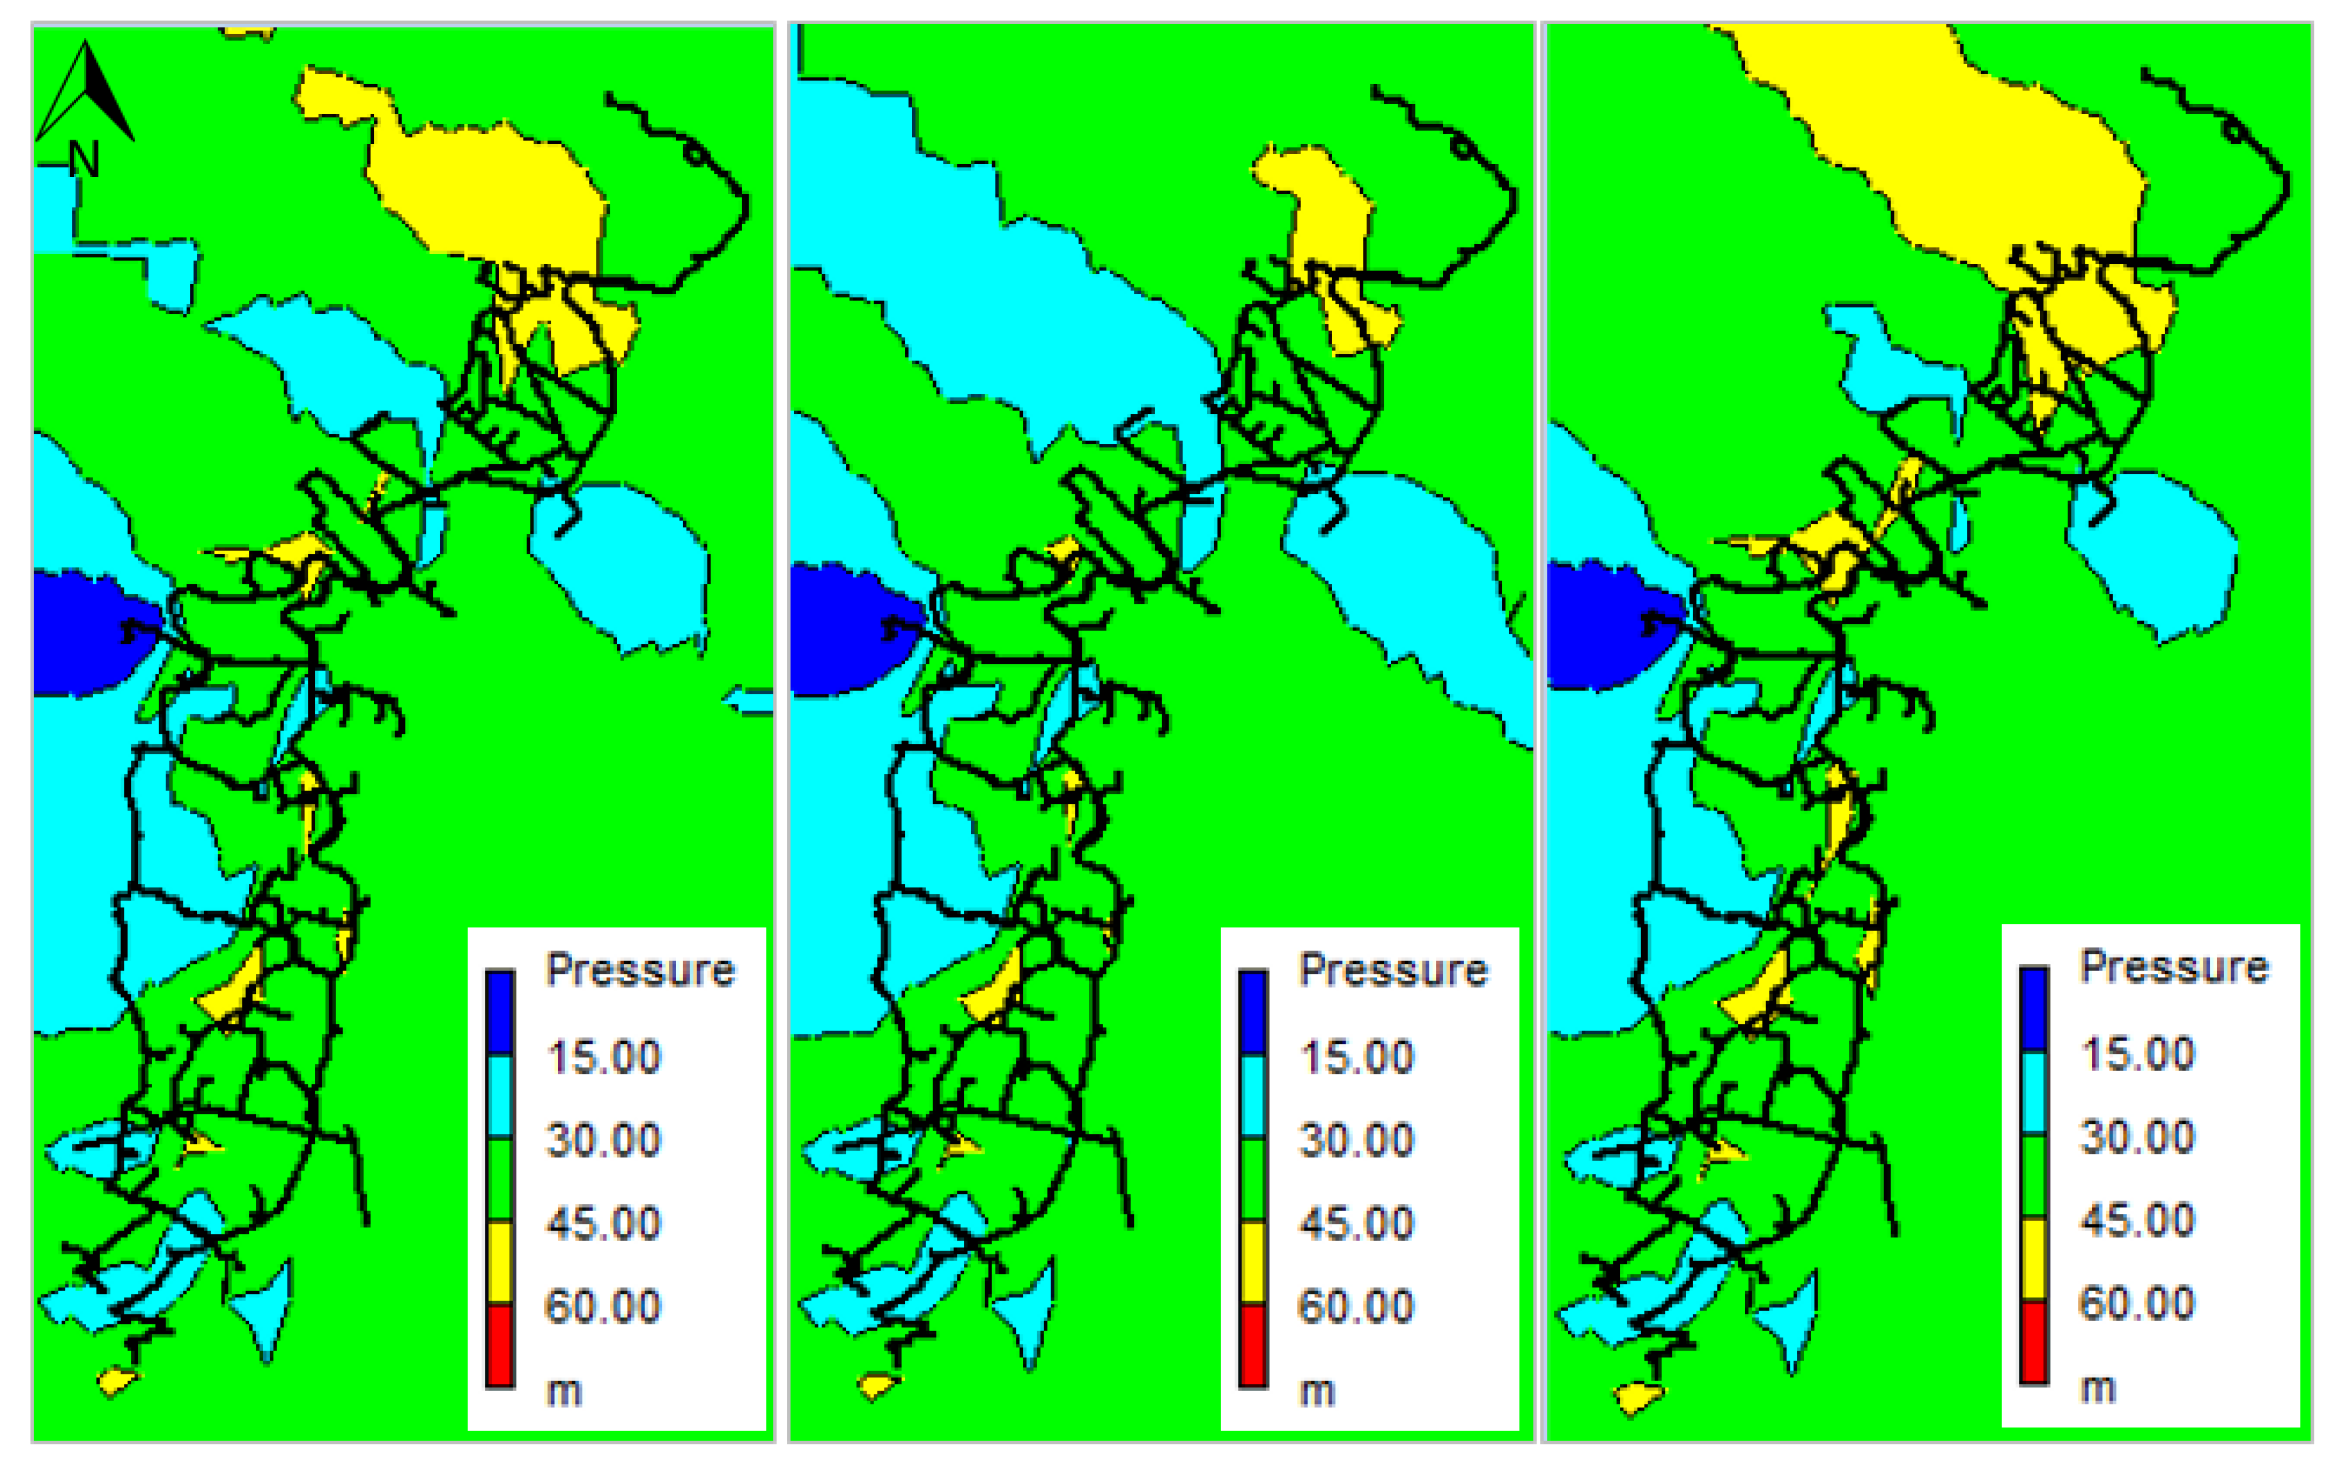
Several analyses were conducted using the developed DT model to identify pressure level improvements.
Figure 12 and
Figure 13 present the pressure values occurring in the Gaula WDN before and after implementing the proposed solution.
Table 6 and
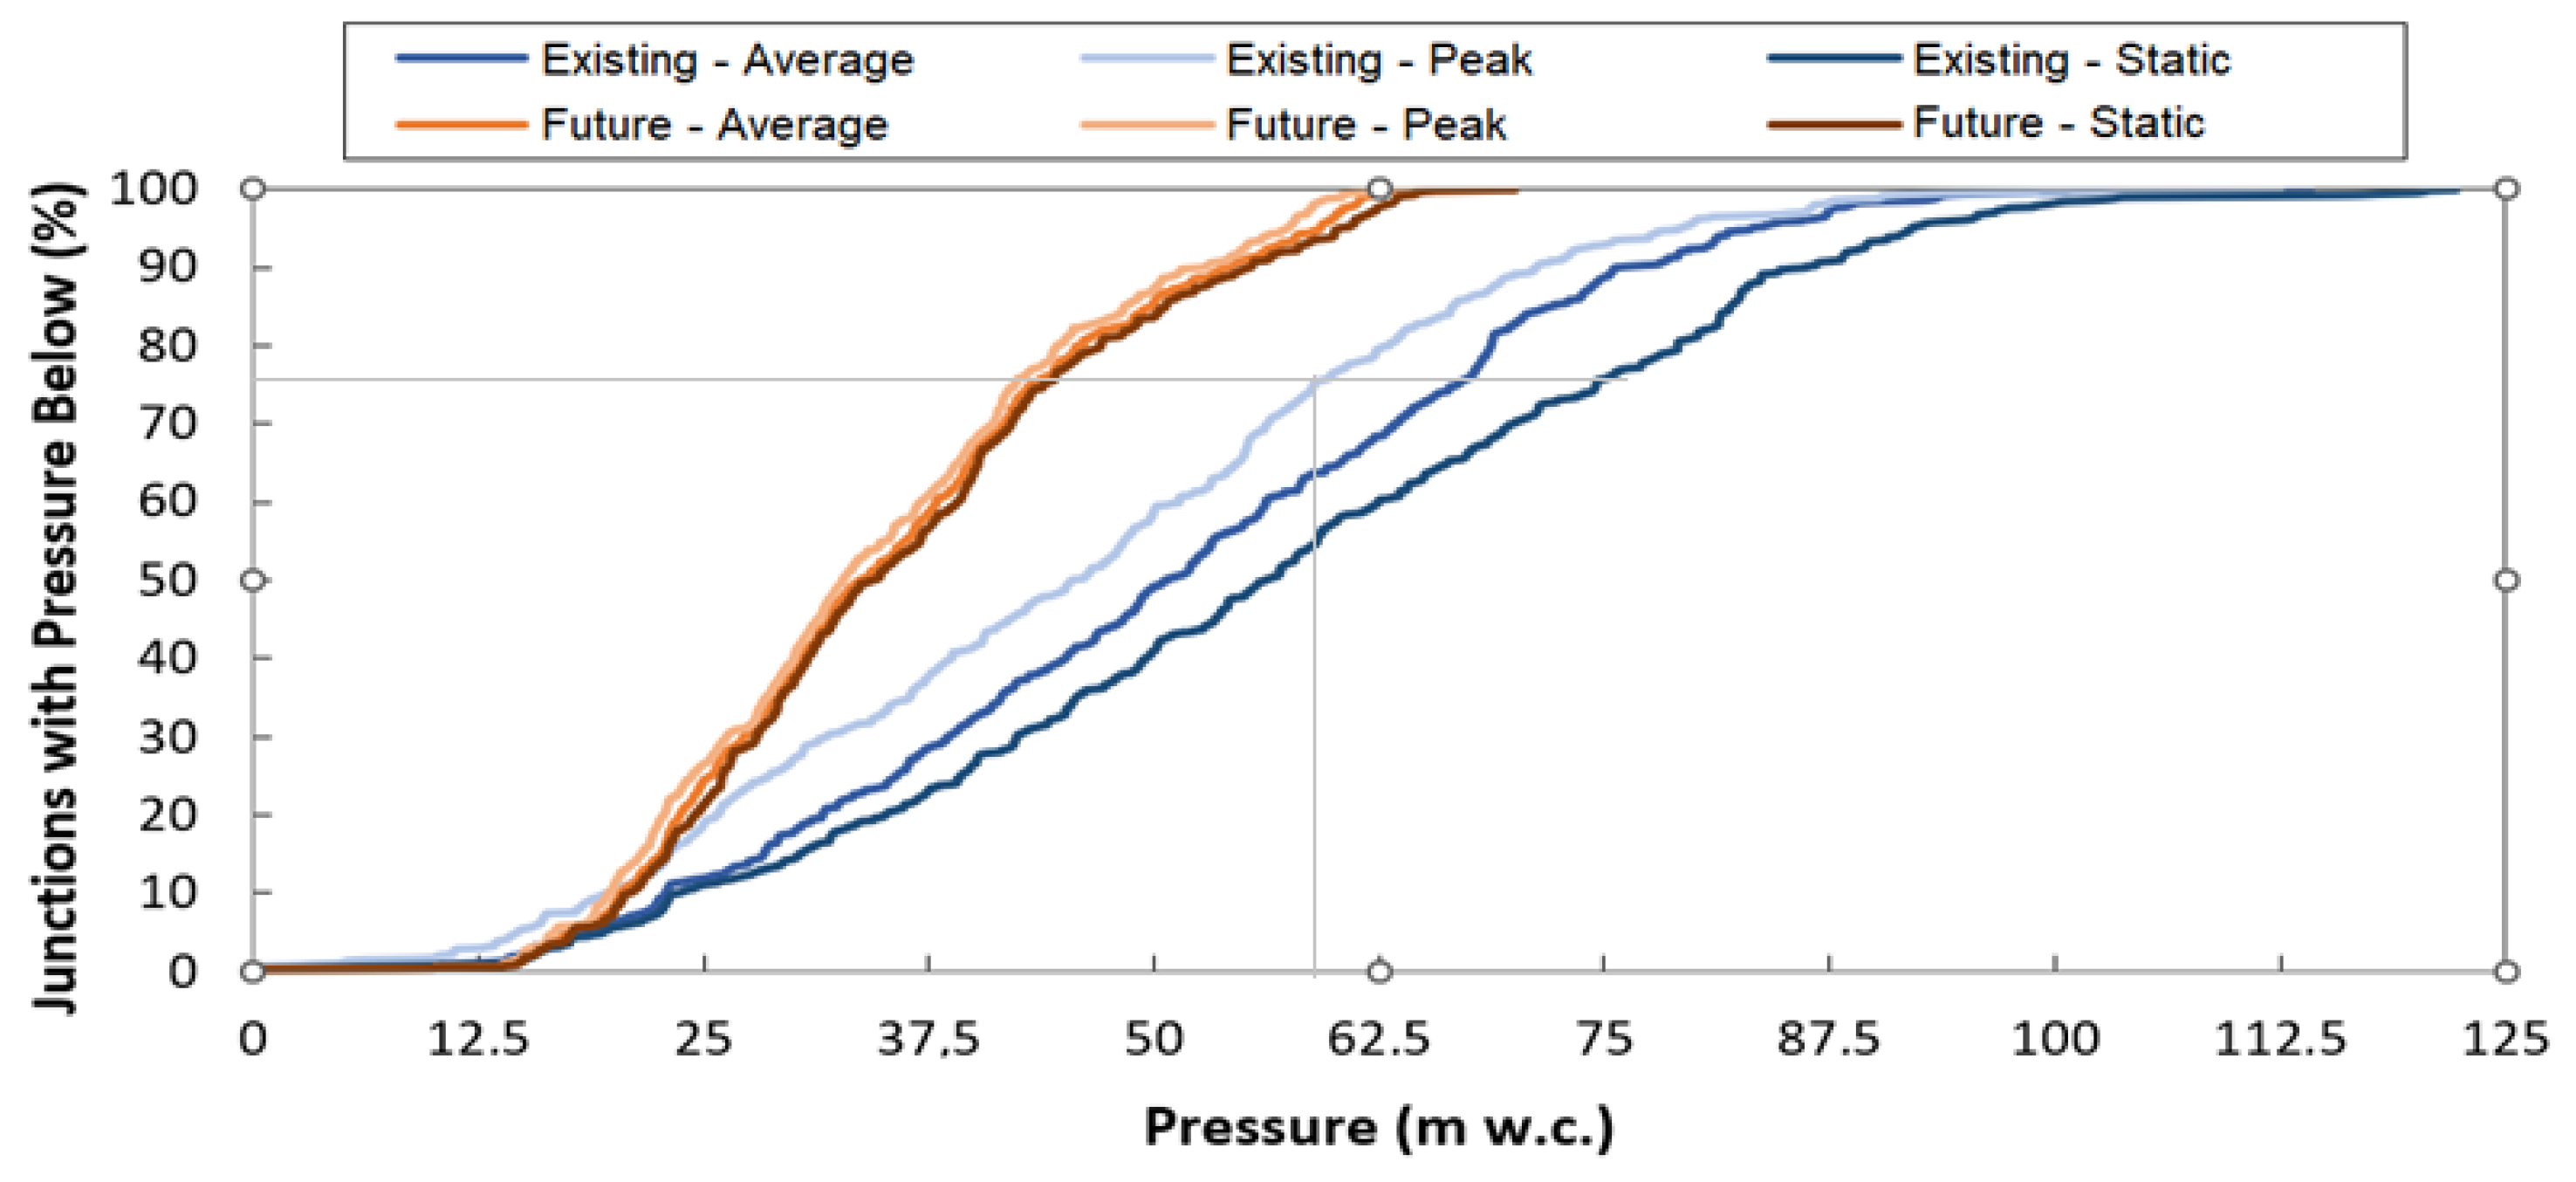
Figure 14 present pressure values in the network junctions (nodes) obtained from the DT model, allowing some conclusions to be drawn regarding the improved pressure levels.
Comparing the pressure observed in the status quo scenario and the scenario with improvements, there is a reduction of 1.7 bar compared to the 5.1 bar verified in the existing situation for 50% of the pressures below, where about 25% of the network’s junctions have pressure values above 60 m w.c. (i.e., maximum regulatory value) in all the scenarios analyzed (i.e., average, peak, and static).
By simulating the extreme pressure situation (static), where consumption and head losses are considered non-existent, the reduction in the mean pressure value obtained is from 56 m w. c. to 34 m w.c., a reduction of around 2 bar for 50% of the pressures below.
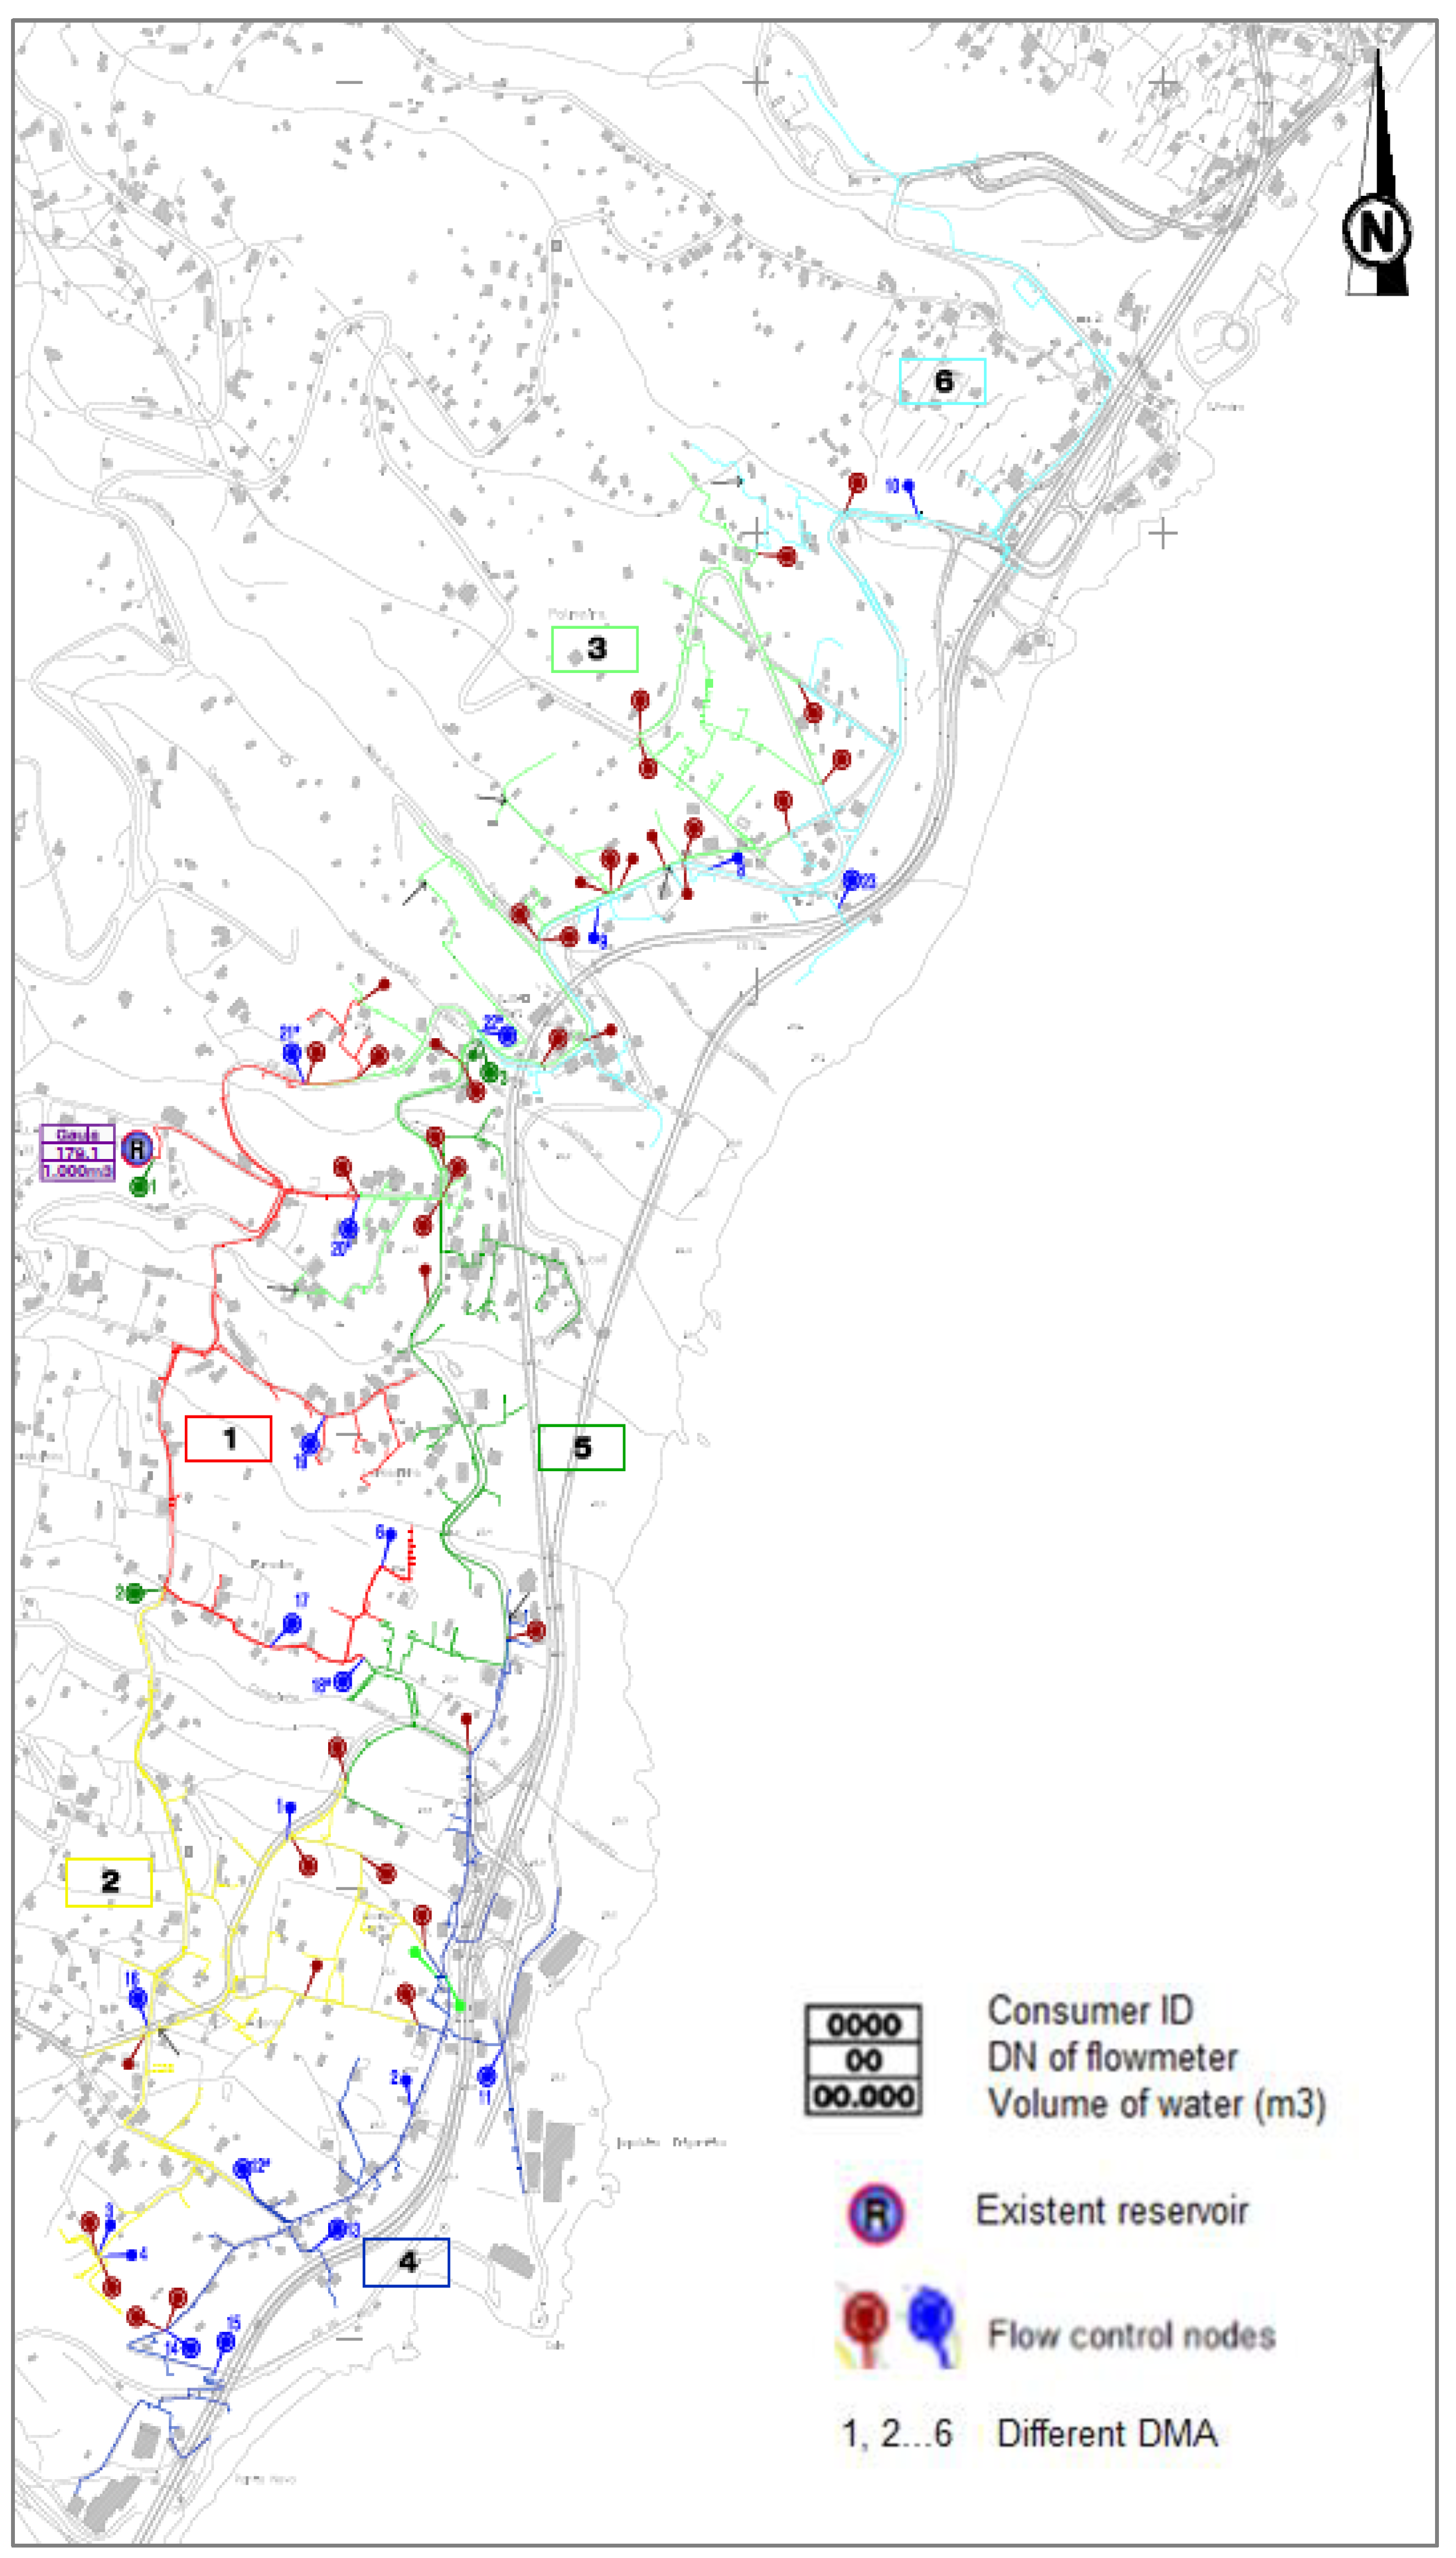
Regarding the node junctions of the proposed network with pressures above the maximum regulatory of 60 m w.c., less than 4% are in the average scenario. In the maximum limit scenario of static pressure, only 6% reach those pressure values, meaning that with the DMA’s sectorization and the network pipes’ requalification, the excess pressure problems are substantially mitigated, as shown in
Figure 9 and
Figure 11. It is worth mentioning that the pressure values have negligible variation with time (
Figure 14), as identified in the status quo situation.
This study also allows us to analyze the relationship between ruptures in the Gaula WDN and the observed pressures (
Figure 15), according to the information provided by the municipal water entity, which shows a strong dependence between these two variables. Excessive pressures are related to problems with high volumes of water losses, which is an issue to consider when rehabilitating the WDN using DT support.
Among the different components of water losses, real losses have the greatest weight, which, in the current case, is about 95% of the total volume of losses. Thus, in the analysis, it was considered that the consumption and apparent losses remained constant.
Table 7 compares the volumes verified in the status quo, the hypothetical target to be achieved according to the Portuguese Supply and Residual Water Strategic Plan (PENSAAR 2020 [
23]), and the suggestions of the proposed methodology.
By implementing the proposed methodology, only 40% of the system’s annual volume would be necessary to supply the Gaula WDN. In a scenario where the proposed PENSAAR 2020 goal is to be achieved (~15% of water losses), acquiring only 1/3 of the water volume entering the existing situation would be necessary. The proposed scenario allows a reduction of 42% of unbilled volume compared to the total volume of the existing situation.
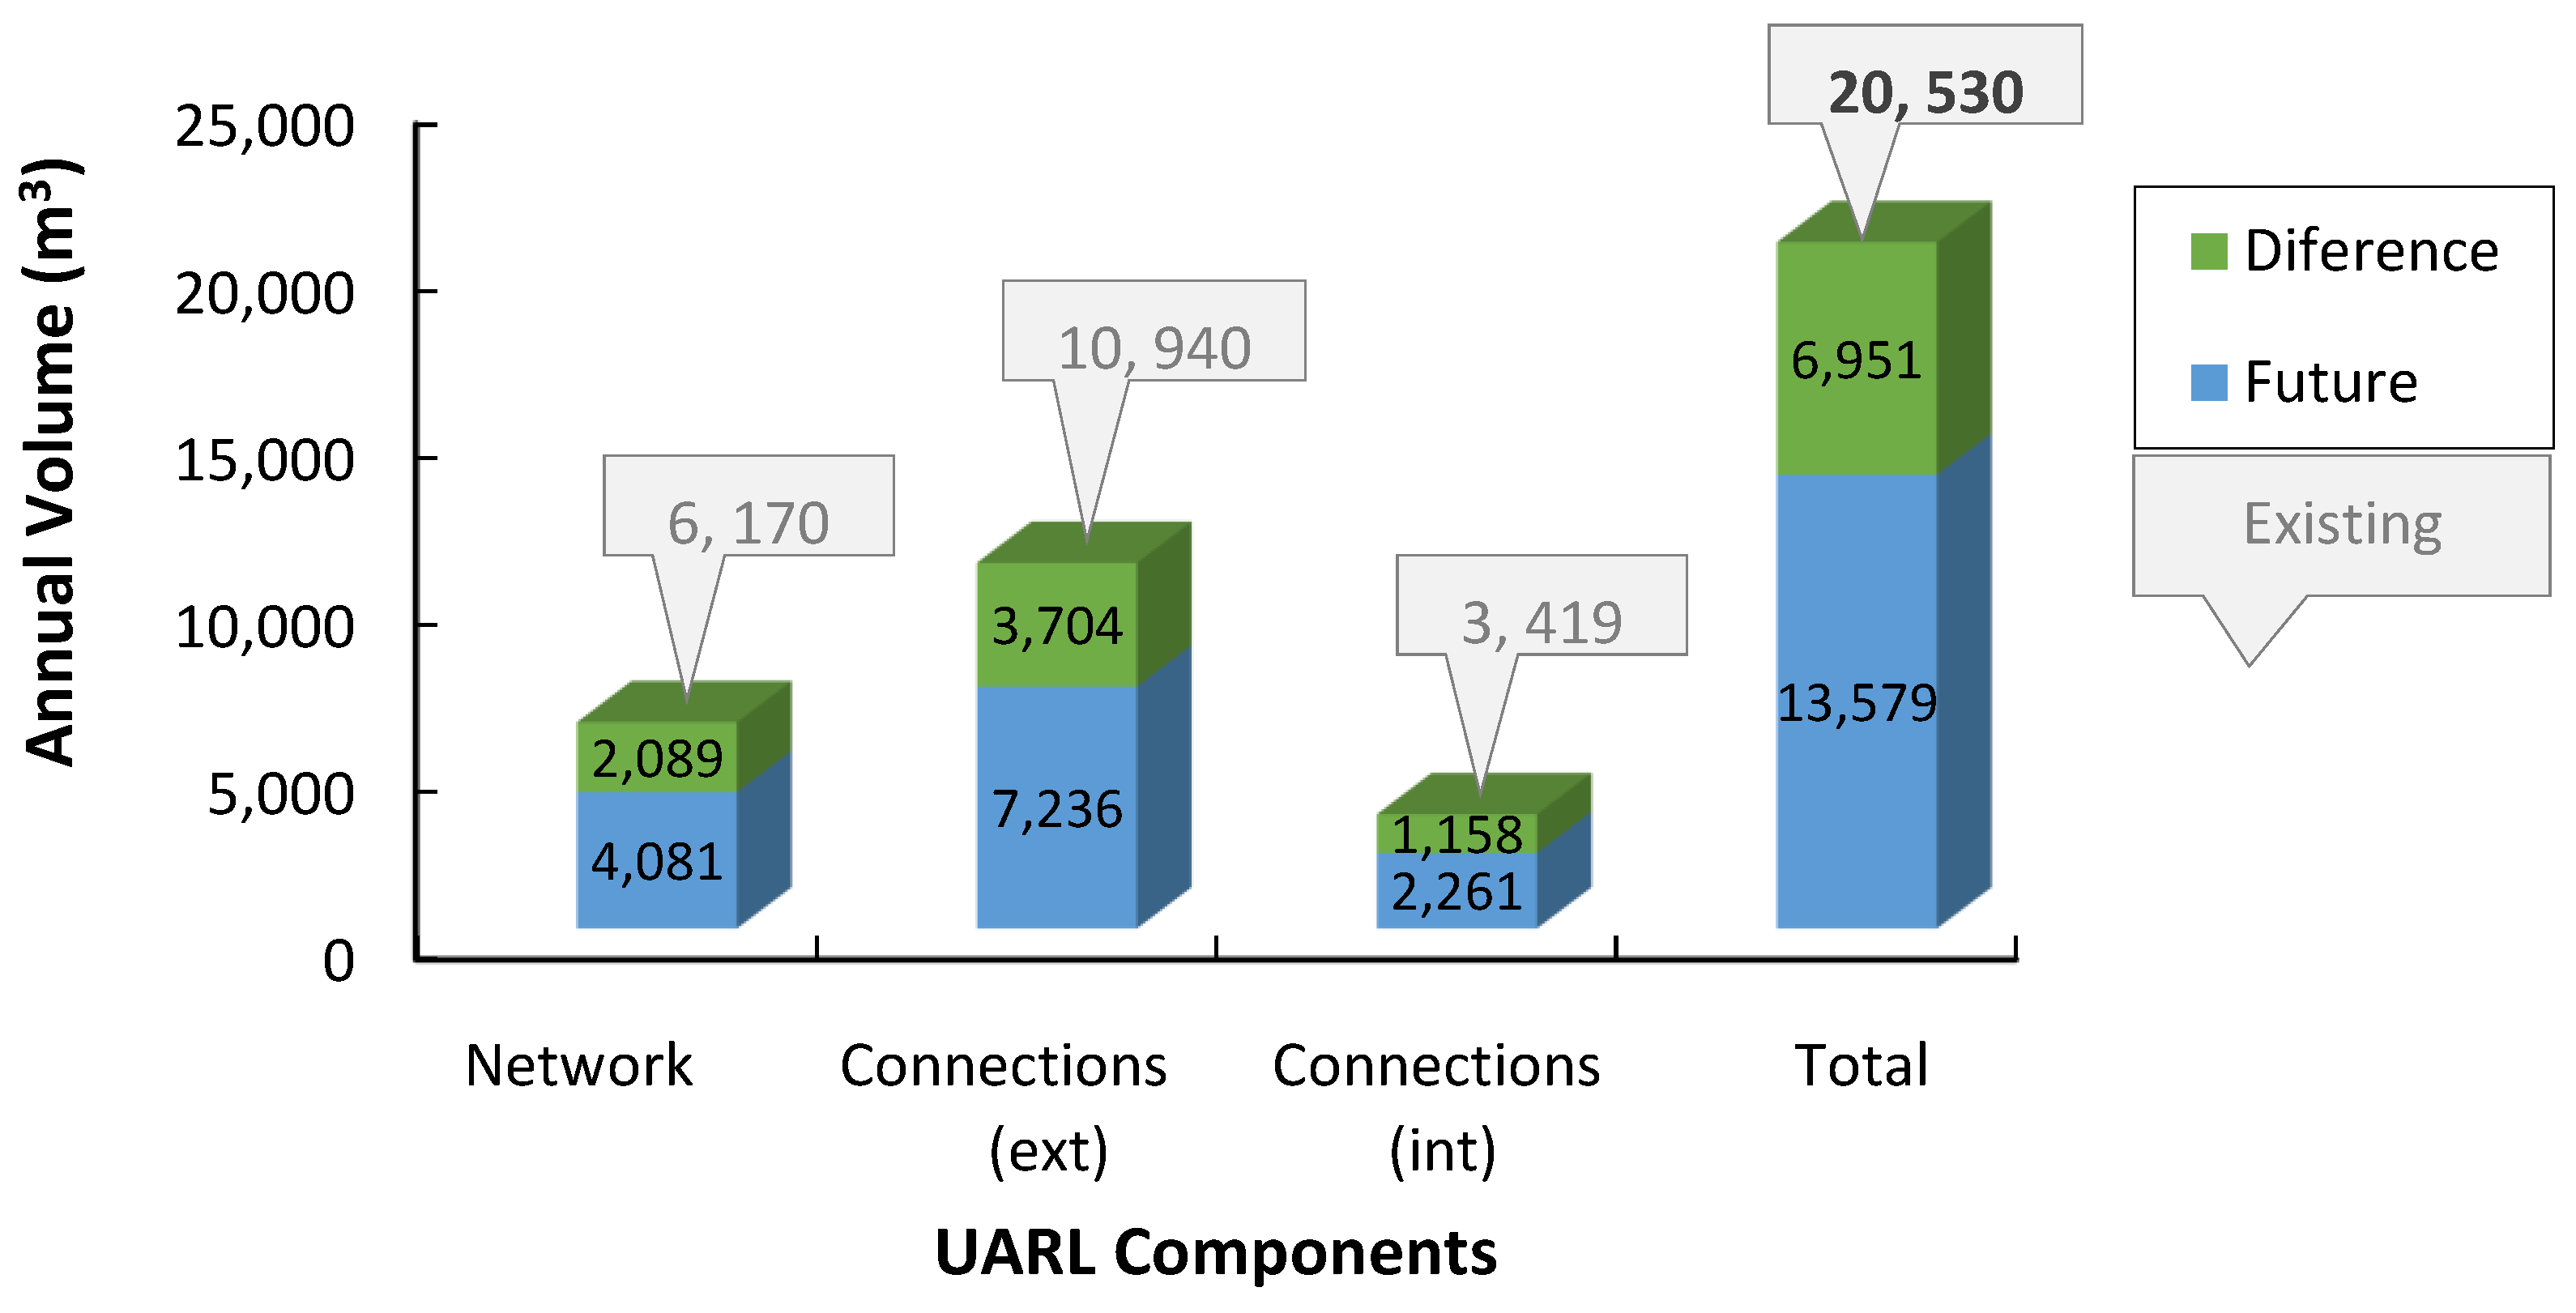
An indicator that compares real losses and reduction potential is the infrastructure leakage index, which consists of the ratio between actual real losses and the “minimum” value of real losses (UARL). In the existing scenario, the average pressure of 5.1 bar was verified. The results for the unavoidable annual real losses (UARL) are illustrated in
Figure 16, where the total UARL potential reduction is from 20,530 m
3/year to 13,579 m
3/year, with the main component responsible for this reduction in losses being the connections and not in the pipe network itself.
As verified in
Table 1, the real losses in the Gaula WDN in the existing situation represent 79% of the total water entering the system, corresponding to 434,273 m
3. Considering the value of unavoidable annual real losses (UARL) obtained in the existing situation (
Figure 16), which is 20,530 m
3, the infrastructure leakage index is 21.15 (434,273/20,530), which is much higher than the recommended value of 4, revealing that the network has a huge potential for real loss reduction. The apparent loss volume is significantly lower than the real one. Nonetheless, this volume must not be ignored. Most apparent loss values result from measuring device errors, suggesting that, to control such losses better, unreliable measuring devices should be substituted or renewed to improve the measuring quality [
13].
The current WDN study identified an apparent loss of 20% of the consumption. This value is higher than the commonly verified value, but, in this case, it has no relevance in the overall volume since real losses present a significant value [
11]. In conclusion, old measurement devices and/or those controlling significant consumption must be analyzed and replaced when necessary.
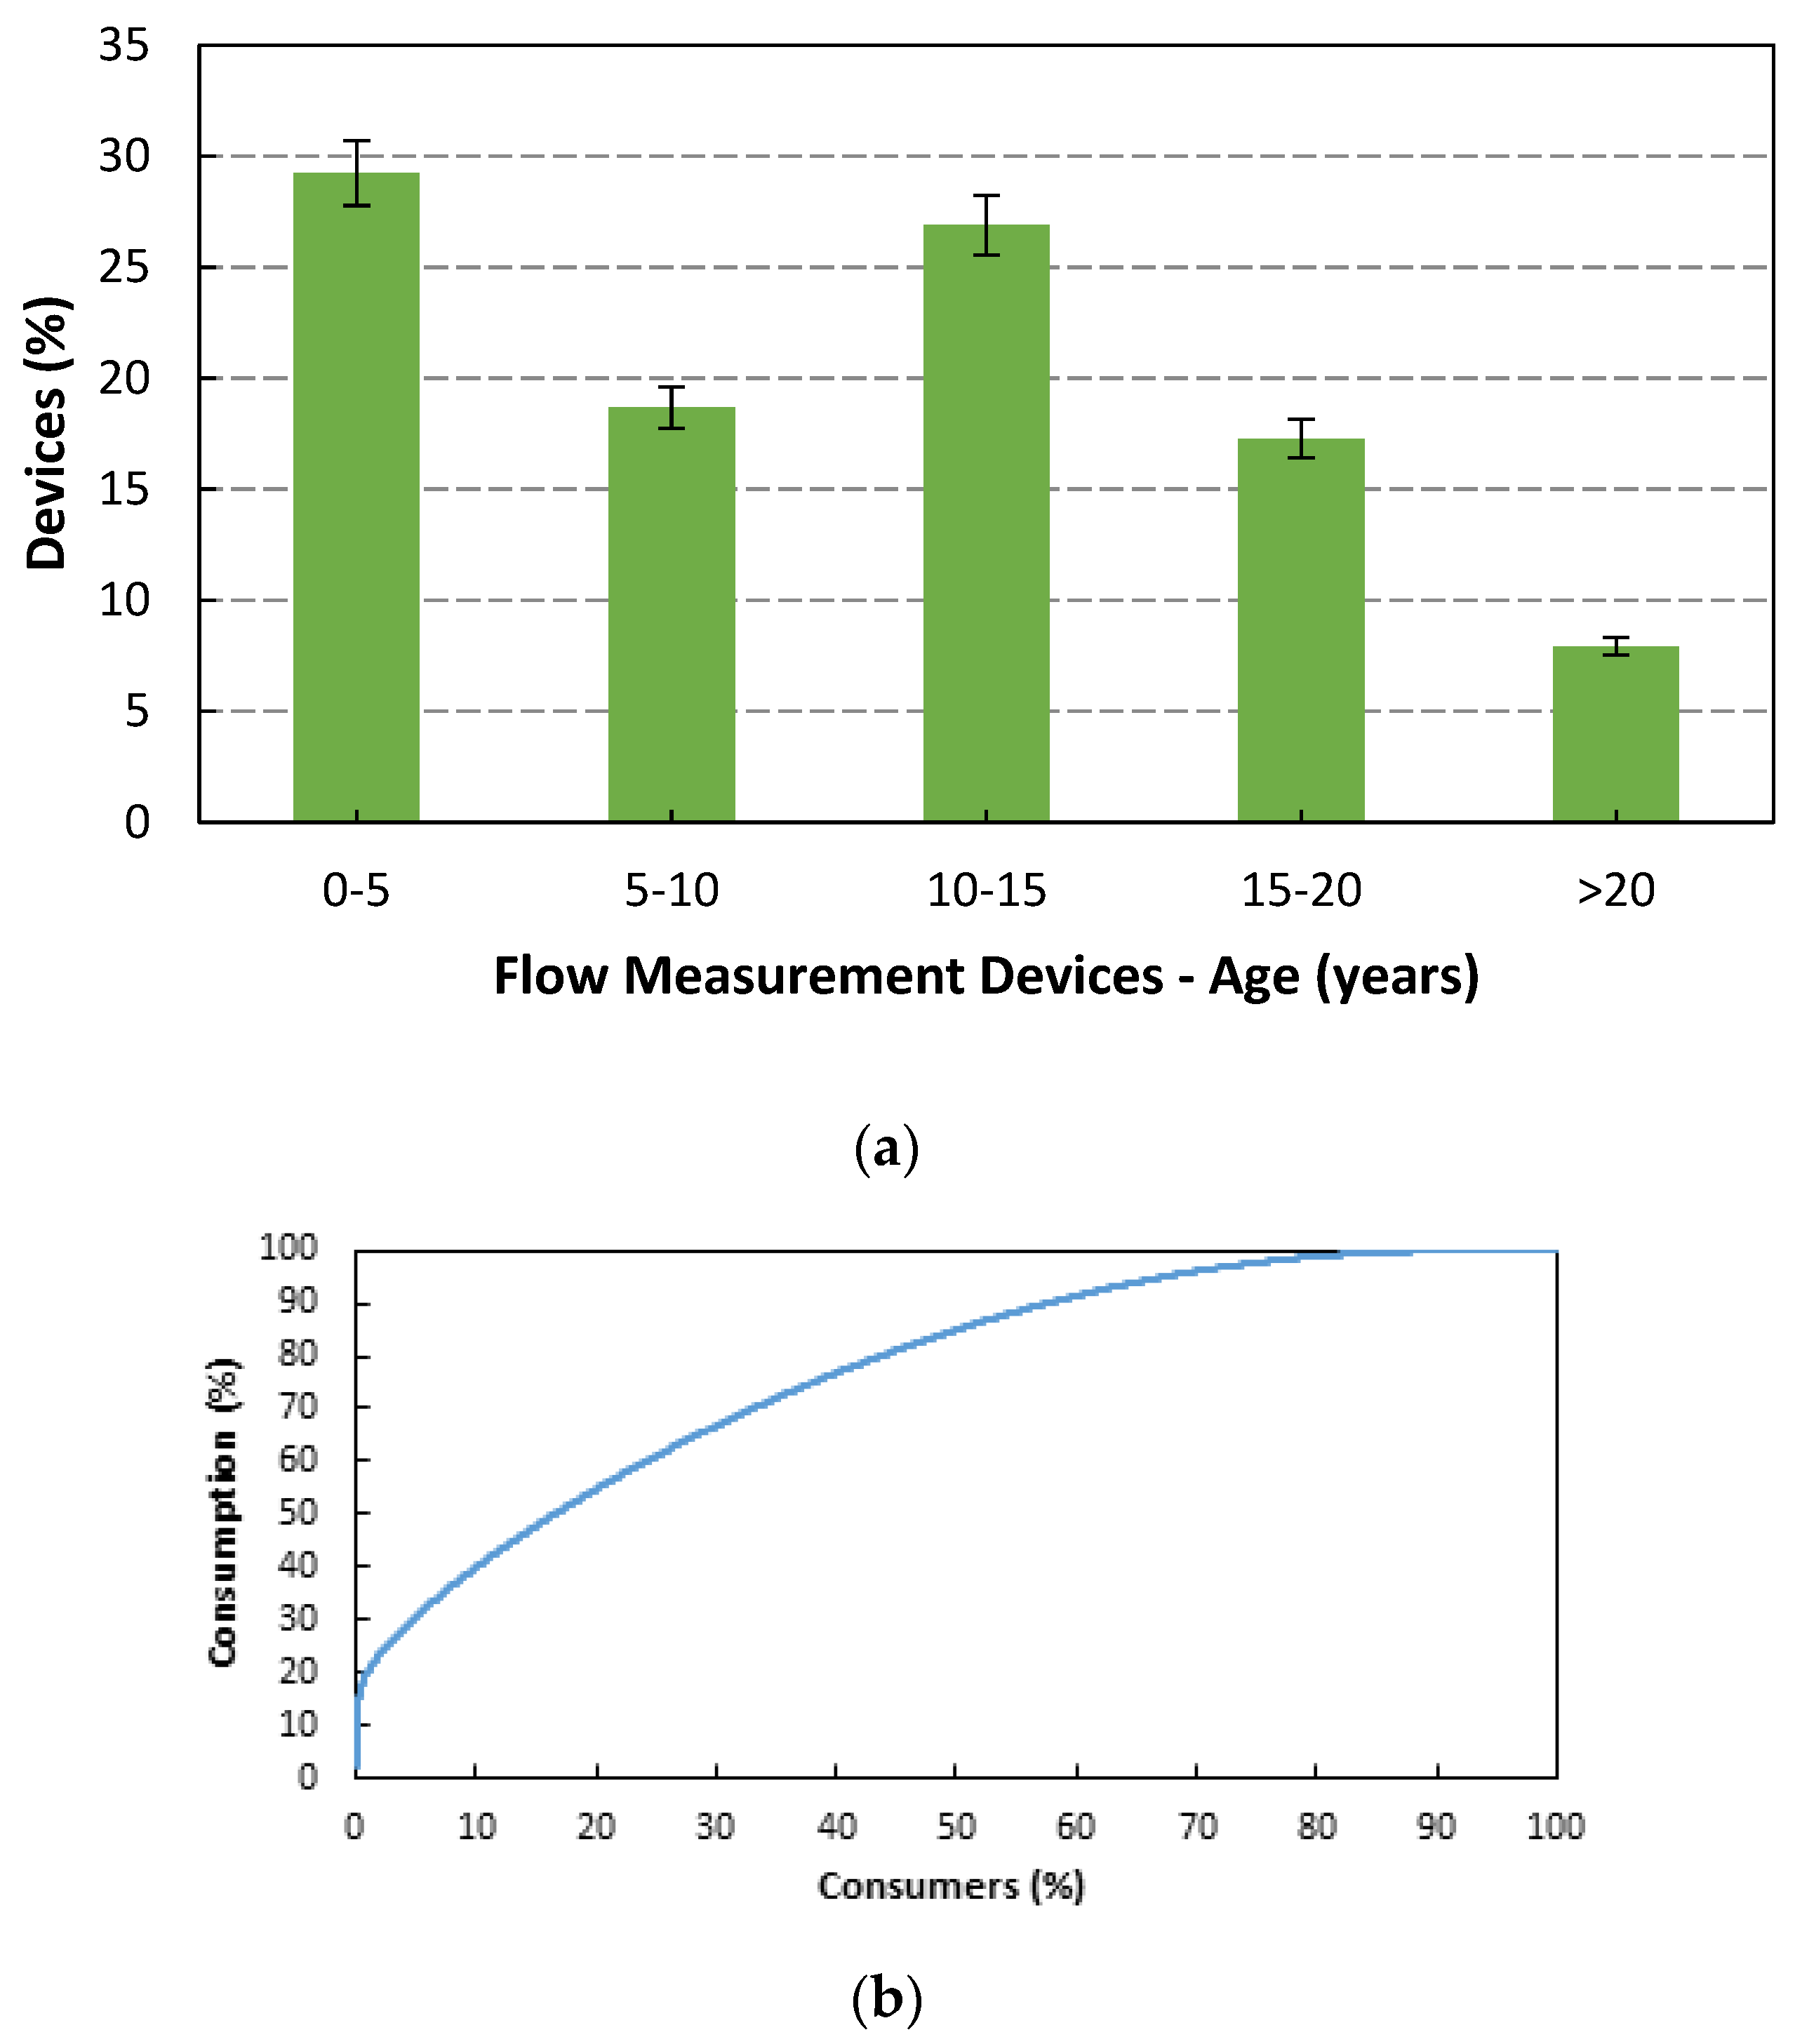
The results of a brief analysis of municipal water flow meters are presented in
Table 8 and
Figure 17a, where it can be concluded that the devices’ average age is 11 years, and 25% of the devices are older than 15 years. In addition, according to the municipal water data, most of the significant consumers have old measuring devices, resulting in measured values that are different from the real ones, as presented in
Table 8.
According to the provided data, these significant consumers correspond to 10% of the municipality’s total water consumption, representing twice the billed consumption.
Table 8 also shows that the average age of the indicated measuring devices is 17 years. Considering a 20% error in their measurements, 60,000 m
3 of apparent annual losses might be associated with these consumers. The percentage relationship between the municipality’s water consumers and consumption is again reinforced—a few consumers are responsible for higher consumption values, and the errors related to their measuring devices can be the source of considerable apparent losses.
Figure 17b shows that only 1% of the municipality’s consumers are responsible for 20% of the consumed water volume.
Unbilled authorized consumption, corresponding to the volumes used by the municipality itself, could not be analyzed since no data were provided. However, it was included in the total demand in this study.
This study contributes to a topic of recognized scientific relevance, given the complexity of water networks and their close relationship with future climate change, digital transition, and water scarcity challenges [
7,
8,
22]. Water network losses are a common and severe worldwide difficult management problem since they involve intensive water–energy processes.
Losses identified in the case study represent an unsatisfactory freshwater supply and waste energy [
20]. SWGs, as an integrated element of smart cities, is highlighted as a new generation of digital water management through the integration of information and communications technologies (ICTs) to automate the monitoring and control of water networks. The benefits of SWGs as a management strategy that requires an efficient and complex implementation process are highlighted herein [
12].
DTs provide useful data on a WDN’s lifecycle, reproducing disruption scenarios for resilience assessment purposes and analyzing asset prognosis and system efficiency to determine proactive maintenance/management models. To offer an effective solution regarding water losses, the proposed DT model requires continuous adjustments and learning process techniques supported by a large amount of field data stored in big-data platforms.
5. Conclusions
An integrated and complex methodology for evaluating WDN efficiency is presented. A real case study (Gaula WDN) is discussed and analyzed, identifying weak points in the system and potential improvements through a proposed DT model optimization. The steps of the proposed methodology are described and justified to create a benchmark for future sustainable developments related to water scarcity, climate change, water system performance efficiency, water–energy nexus control and improvements, and digital water transition.
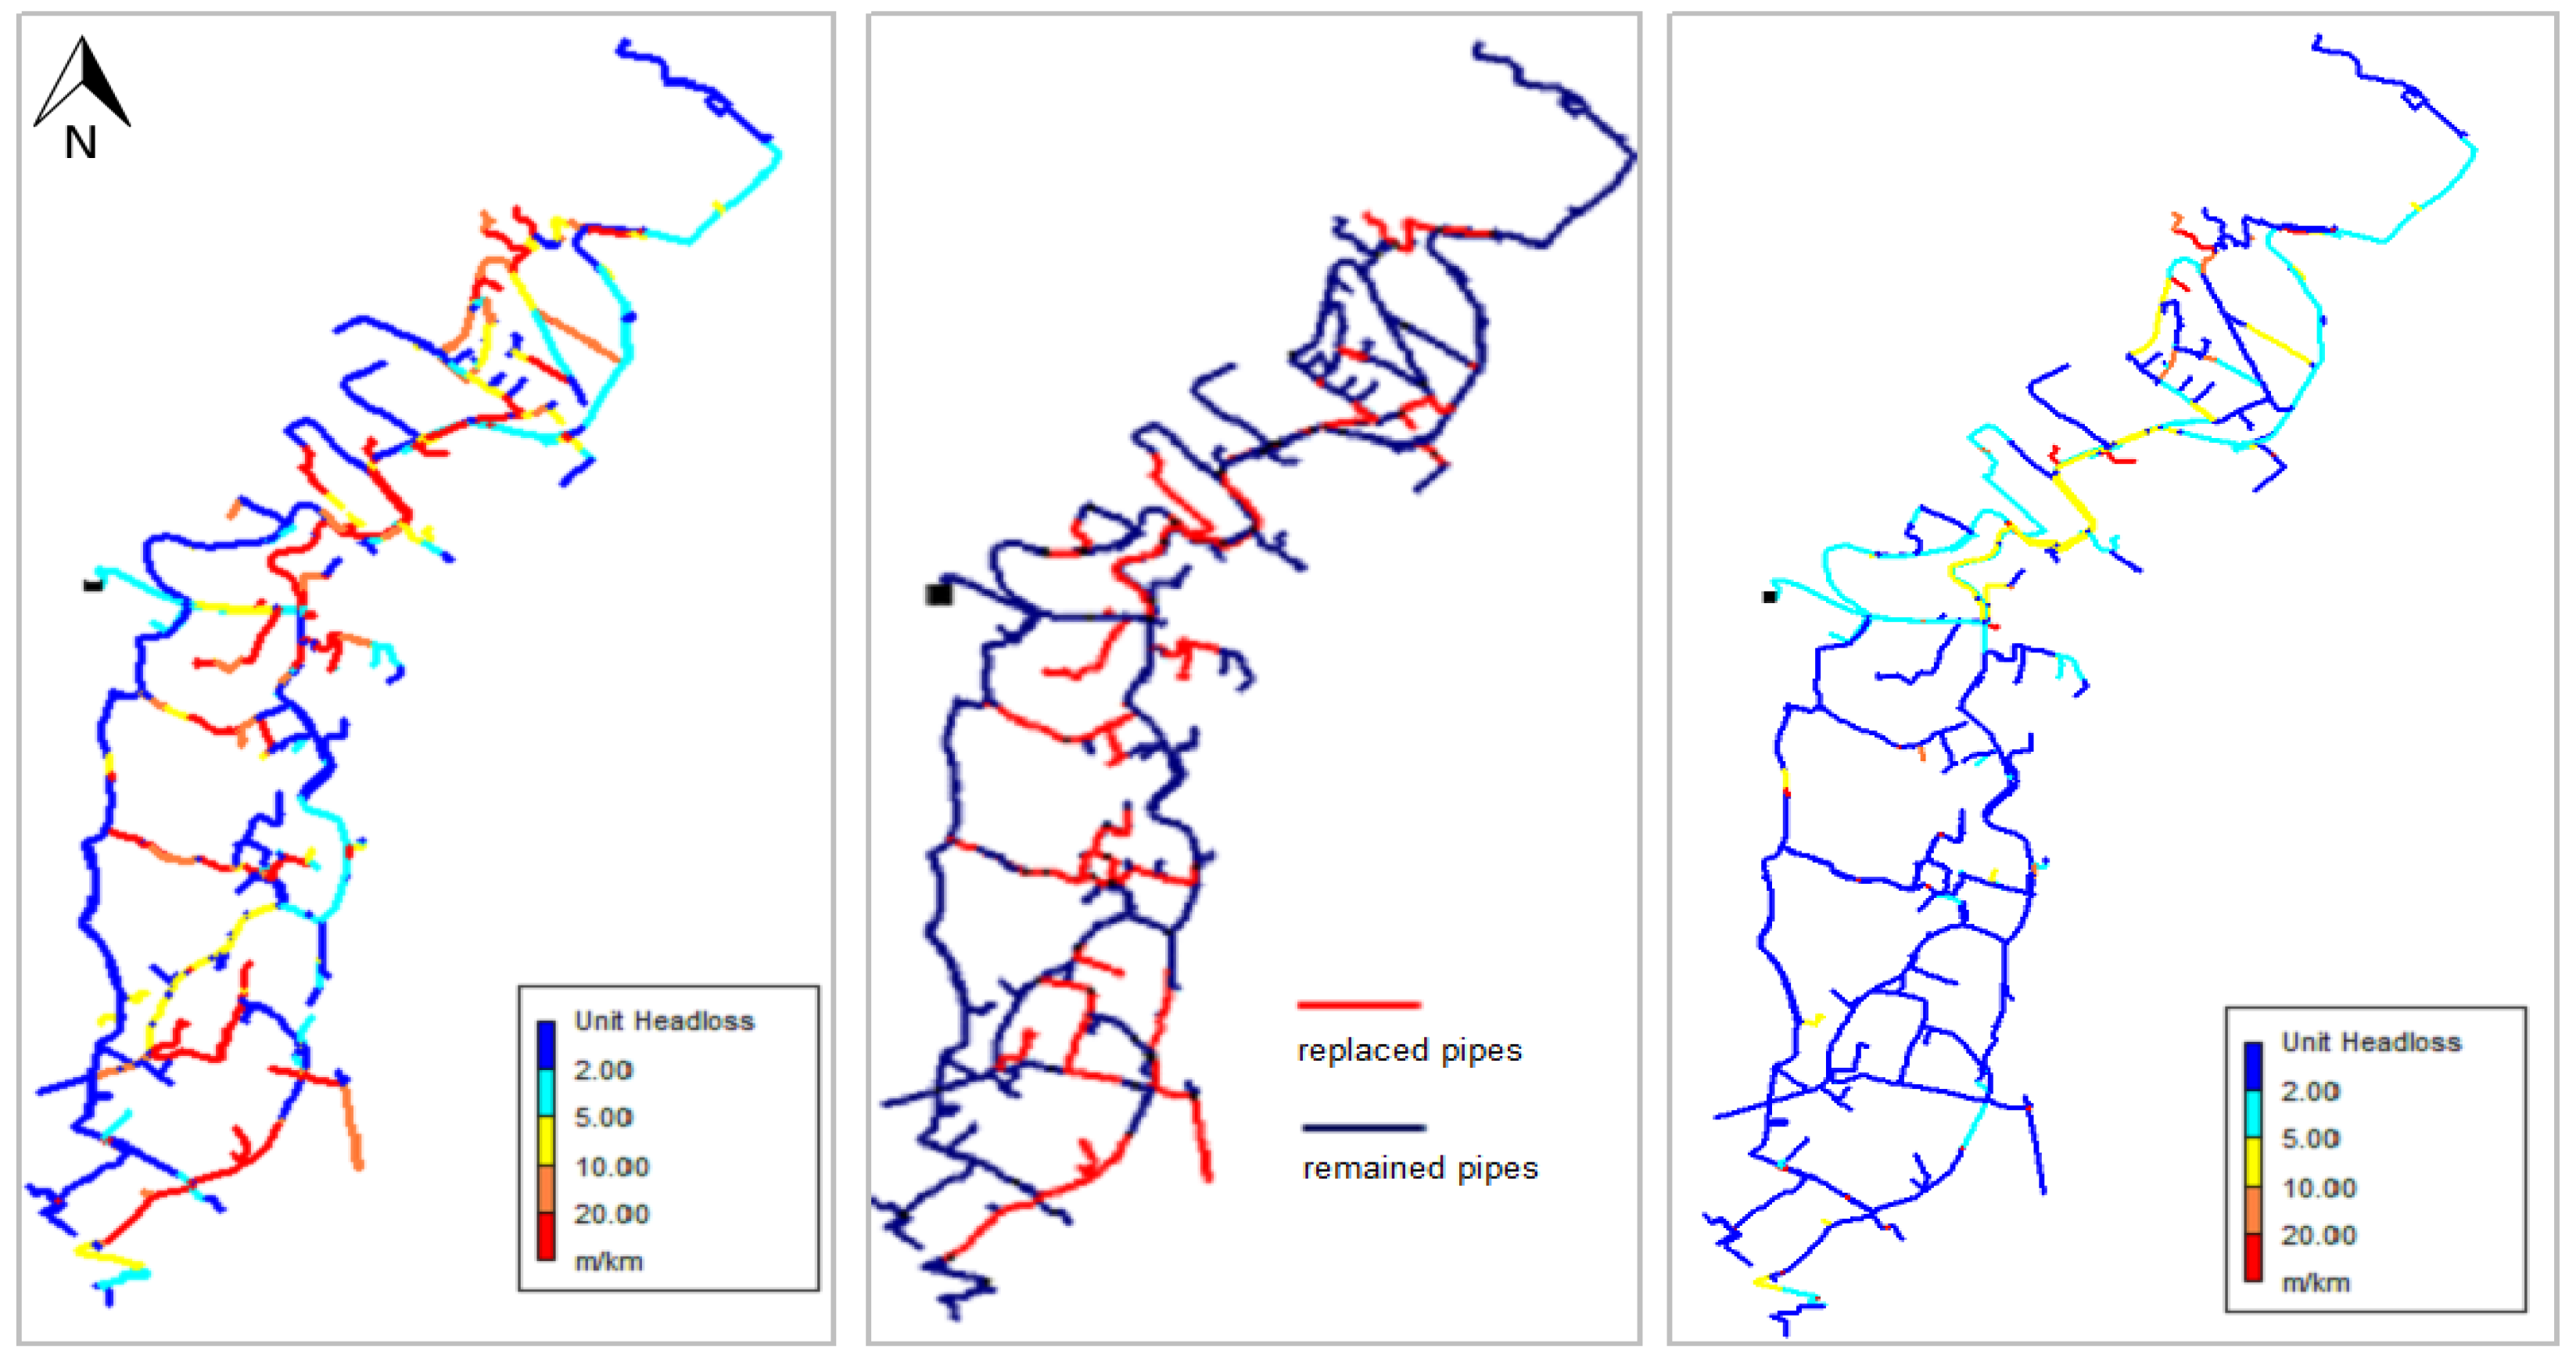
Pipe ruptures and high pressures are usually associated with high volumes of water losses, which is an important issue to consider when retrofitting water networks using DT support. The Gaula WDN, according to municipal data, is an aged system with a large value of real losses, at around 79% of the system’s total water volume. For this investigation, the system’s characterization was identified in terms of configuration; a number of pipe branches, reservoirs, and PRVs; location and regulation of pressure reduction valves; inner diameters of the pipes; age of the system components; and the morphology and topography of the system. The types of losses were identified. Due to the large values of the unit head losses, replacing some pipes or complementing them with parallel pipes is suggested, showing the deleterious influence of low-diameter pipes. In addition, the network was divided into DMAs to control for anomalous consumption.
Based on the developed DT model, several analyses were performed to identify opportunities for improving the pressure values of the WDN. Some relevant conclusions that can be drawn from the analyses undertaken in the current study are as follows:
Comparing the mean pressure observed in the average scenario of the status quo to the scenario with improvements (for the 50% of pressures below case), there is a reduction of 1.7 bar, where about 25% of the network’s junctions have pressure values above 60 m w.c. (i.e., the maximum regulatory value) in all analyzed scenarios (i.e., average, peak, and static).
By simulating the extreme pressure situation (static), when consumption and head-losses are considered non-existent, the obtained reduction in the mean pressure value is around 2 bar (for the 50% of pressures below case).
As for the junctions of the proposed network with pressures above the regulatory maximum of 60 m w.c., less than 4% are in this situation, and with the DMA sectorization and the requalification of the network, the excess pressure problems are substantially mitigated.
With the implementation of the proposed methodology, only 40% of the total annual volume, concerning the status quo situation, would be necessary to supply the demand.
An indicator associated with real losses and potential reduction is the infrastructure leakage index (ILI), i.e., the ratio between the value of actual real losses and the “minimum” value of real losses (UARL). The infrastructure leakage index reaches a value higher than four (434,273/20,530 = 21.15), confirming that the network has great potential for real loss reduction.
Old measuring devices and/or those controlling significant consumption must be the first ones analyzed or replaced when necessary.
The relation between customers and consumption reinforces that only a few customers are responsible for large consumption. Only 1% of the municipality’s consumers are responsible for 20% of the consumed water volume.
The methodology developed and applied in this study leads to a significant potential reduction in water leakage in the Gaula WDN, improving overall system efficiency. This can result in a meaningful economic benefit by saving about EUR 165k regarding water loss volume. The limitations for the practical implementation of this methodology are identified as follows: (i) reliability on data related to the system configuration, including the number of pipe branches, existent reservoirs/tanks, pump stations, existent pressure reduction valves (PRVs), location of them, type of regulation and sizes, inner diameters of the pipes, age of the system components, and morphology and topography of the system, which requires a close interaction between researchers, designers, and municipal management. On the other hand, all DT models and machine learning processes are essential for model calibration and application. However, a monetary figure does not quantify the important social and environmental benefits of a more efficient system, including avoiding supply interruption through the loss of valuable potable water.


 ,
, 


