
Development of Aquatic Index of Biotic Integrity and Its Driving Factors in the Diannong River, China
by
 , , ,
, , ,
Lin Lee
1,†,
Shuangyu Liu
1,†,
Xiaocong Qiu
2,*,
Ruizhi Zhao
1,
Zengfeng Zhao
1,
Yongpeng Wan
1 and
Zhanqi Cao
1 1
School of Civil and Hydraulic Engineering, Ningxia University, Yinchuan 750021, China
2
School of Life Science, Ningxia University, Yinchuan 750021, China
*
Author to whom correspondence should be addressed.
†
These authors contributed equally to this work.
Water 2023, 15(6), 1130; https://doi.org/10.3390/w15061130
Submission received: 16 February 2023
/
Revised: 6 March 2023
/
Accepted: 13 March 2023
/
Published: 15 March 2023
(This article belongs to the Special Issue Water Quality Assessment and Ecological Monitoring in Aquatic System)
Abstract
:To investigate the health of the Diannong River water ecosystem, we collected and analyzed phytoplankton, zooplankton, and microorganisms from the Diannong River in April, July, and October 2021. We also analyzed the physical and chemical factors of the water environment and analyzed the habitat quality. The reference points were determined by the habitat composite index and water quality score. Phytoplankton index of biotic integrity (P-IBI), Zooplankton index of biotic integrity (Z-IBI), and microbial index of biotic integrity (M-IBI) which evaluated the health status of Diannong River were constructed by distribution range analysis, discriminatory ability analysis and correlation analysis of candidate biological indicators. Stepwise regression analysis and path coefficient analysis were conducted to determine the environmental factors driving the changes in aquatic IBI. The results showed that the indicators of P-IBI were the number of Cyanobacteria taxonomic units %, the number of Green Algae taxonomic units%, the relative abundance of Euglena, the relative abundance of Green Algae, and the relative abundance of toxic-producing algae. The indicators of Z-IBI were the total number of zooplankton taxonomic units, the relative abundance of Copepods, the relative abundance of the top 3 dominant species, and the Simpson index; the indicators of M-IBI were the Observed species, the relative abundance of Chloroflexi, the relative abundance of Proteobacteria, the relative abundance of the highest dominant taxonomic unit, the relative abundance of the top 5 dominant taxonomic units, the relative abundance of pollution intermediate genus, and the Ace index. The results of the IBI evaluation for three aquatic organisms showed that most of the sites in the upper reaches of the Diannnong River were at healthy or healthier levels; most of the sites in the middle reaches of the Diannnong River and the Yuehai Lake area were at mediocre or poor levels; and most of the sites in the downstream reaches of the Diannong River were average or mediocre levels. the main water environment factors driving the changes in P-IBI were water temperature (WT) and pH. The main water environment factors driving the changes in Z-IBI were total dissolved solids (TDS), WT and total nitrogen (TN); the main water environment factors driving the changes of M-IBI were fluoride ion (F−) and electrical conductivity (EC). This study provides the scientific reference for the application of the index of biotic integrity (IBI) for a variety of aquatic organisms in the river and lake waters and a basis for the management and optimization of the Diannong River aquatic ecosystem.
1. Introduction
Index of Biotic Integrity (IBI) was first proposed by Karr in 1981 to evaluate the health of rivers using the fish biotic integrity index [1]. Its findings have been highly recognized in the academic field and extended to plankton, benthos, aquatic microorganisms, and other biological groups. Physical and chemical indicators, which often do not fully reflect the status and trends of river ecosystems, are mostly used in Chinese water resources and water environment management, making it difficult to provide a scientific basis for the transformation of water ecosystems from water quality standard management to water ecological health management [2]. Since various indicators of aquatic communities such as abundance, diversity, density, and tolerance can visually reflect the response of aquatic organisms to habitat changes, the aquatic ecological health of rivers can be more accurately reflected from the perspective of aquatic communities. The development of IBI encompasses the physiological characteristics of aquatic community diversity, species richness, and pollution tolerance, which can effectively assess the ecological health of the water.
Phytoplankton are primary producers of water ecosystems, and their communities directly affect the structure of the upper food chain and the stability of the whole ecosystem [3]. KRUK et al. [4] first proposed the concept of phytoplankton morpho-functional groups and classified phytoplankton into seven taxa to elucidate their response to habitat changes through the linkage of morphological and functional characteristics. Zhang et al. [5] first used a phytoplankton-based river health assessment method to evaluate the water pollution status of the Tumen River in 1983. Since eutrophication in China’s lakes, reservoirs and other water bodies leading to phytoplankton overgrowth and water blooms has been one of the biggest problems facing the water environment in China [6]. It is highly relevant to apply phytoplankton community structure characteristics to reflect the water ecological health of rivers and lakes. The development of the phytoplankton index of biotic integrity (P-IBI) has also become a hot topic of research in this field Zooplankton, which is a fundamental link in the food chain and biological productivity of lake ecosystems, plays an important role in the elemental cycle of lake ecosystems, and its important role in aquatic ecology, water quality monitoring and water pollution control is increasingly appreciated [7]. Sun et al. [8] applied the zooplankton index of biotic integrity (Z-IBI) to evaluate the ecological and environmental quality of Jiaozhou Bay waters regarding the method and experience of establishing the Z-IBI in the Chesapeake Bay and established the Z-IBI evaluation system separately for different seasons, and the evaluation results were consistent with the real water quality conditions. Aquatic microorganisms, which are more sensitive to changes in the aquatic environment than other communities in aquatic ecosystems as microorganisms are at the basic trophic level of the food web, are the most abundant as well as the most functional group in aquatic ecosystems [9], and their structure and function can fully reflect the resilience of aquatic ecosystems to pollutant inputs [10]. On the other hand, in more polluted water bodies, the producers and consumers of water ecosystems tend to be drastically reduced, but the decomposers, represented by aquatic microorganisms, generally do not show a similar phenomenon but are more active [11]. Compared to other aquatic organisms, research work on the development of a microbial index of biotic integrity (M-IBI) is relatively less. However, uncultured microorganisms that occupy more than 99% of natural water bodies have been discovered and relative works about constructing M-IBI have been carried out in-depth with the development of modern molecular techniques in biology [9]. Meanwhile, compared with natural water bodies, urban rivers are more artificially disturbed. Although the physical and chemical indicators of water bodies may be similar, the community structure characteristics of aquatic organisms such as benthic animals, phytoplankton, and zooplankton have changed significantly, while the microbial composition is richer in the water ecosystem, which can rapidly indicate the changing characteristics of physical and chemical indicators of water bodies. Therefore, the use of M-IBI for water ecological health evaluation has been widely carried out, and Zhang et al. [12], Zhu et al. [13], and An et al. [14] used Illumina high-throughput sequencing technology to obtain microbial information of water bodies and construct M-IBI for water ecological health evaluation of Qinhuai River, Suzhou wetlands, and mining groundwater.
With the maturation of the aquatic IBI system, the number of studies on river and lake ecosystems based on various aquatic IBI is increasing. However, most studies only focus on the development of a single aquatic IBI, and few studies have been reported on the evaluation of river and lake water ecological health based on multiple aquatic IBI in the river and lake habitats. This research subjects to (1) analyze the development elements of P-IBI, Z-IBI and M-IBI in the Diannong River, (2) apply P-IBI, Z-IBI and M-IBI to evaluate the ecological health of the Diannong River respectively and analyze the reasons of large differences in some of the evaluation results and (3) analyze the main water environmental factors driving changes of P-IBI, Z-IBI and M-IBI respectively. The results of this study will provide some references for the application of different aquatic IBI to river and lake waters, as well as the scientific foundation for the management and conservation of the Diannong River aquatic ecosystem.
2. Materials and Methods
2.1. Overview of the Study Area and Sampling Site Placement
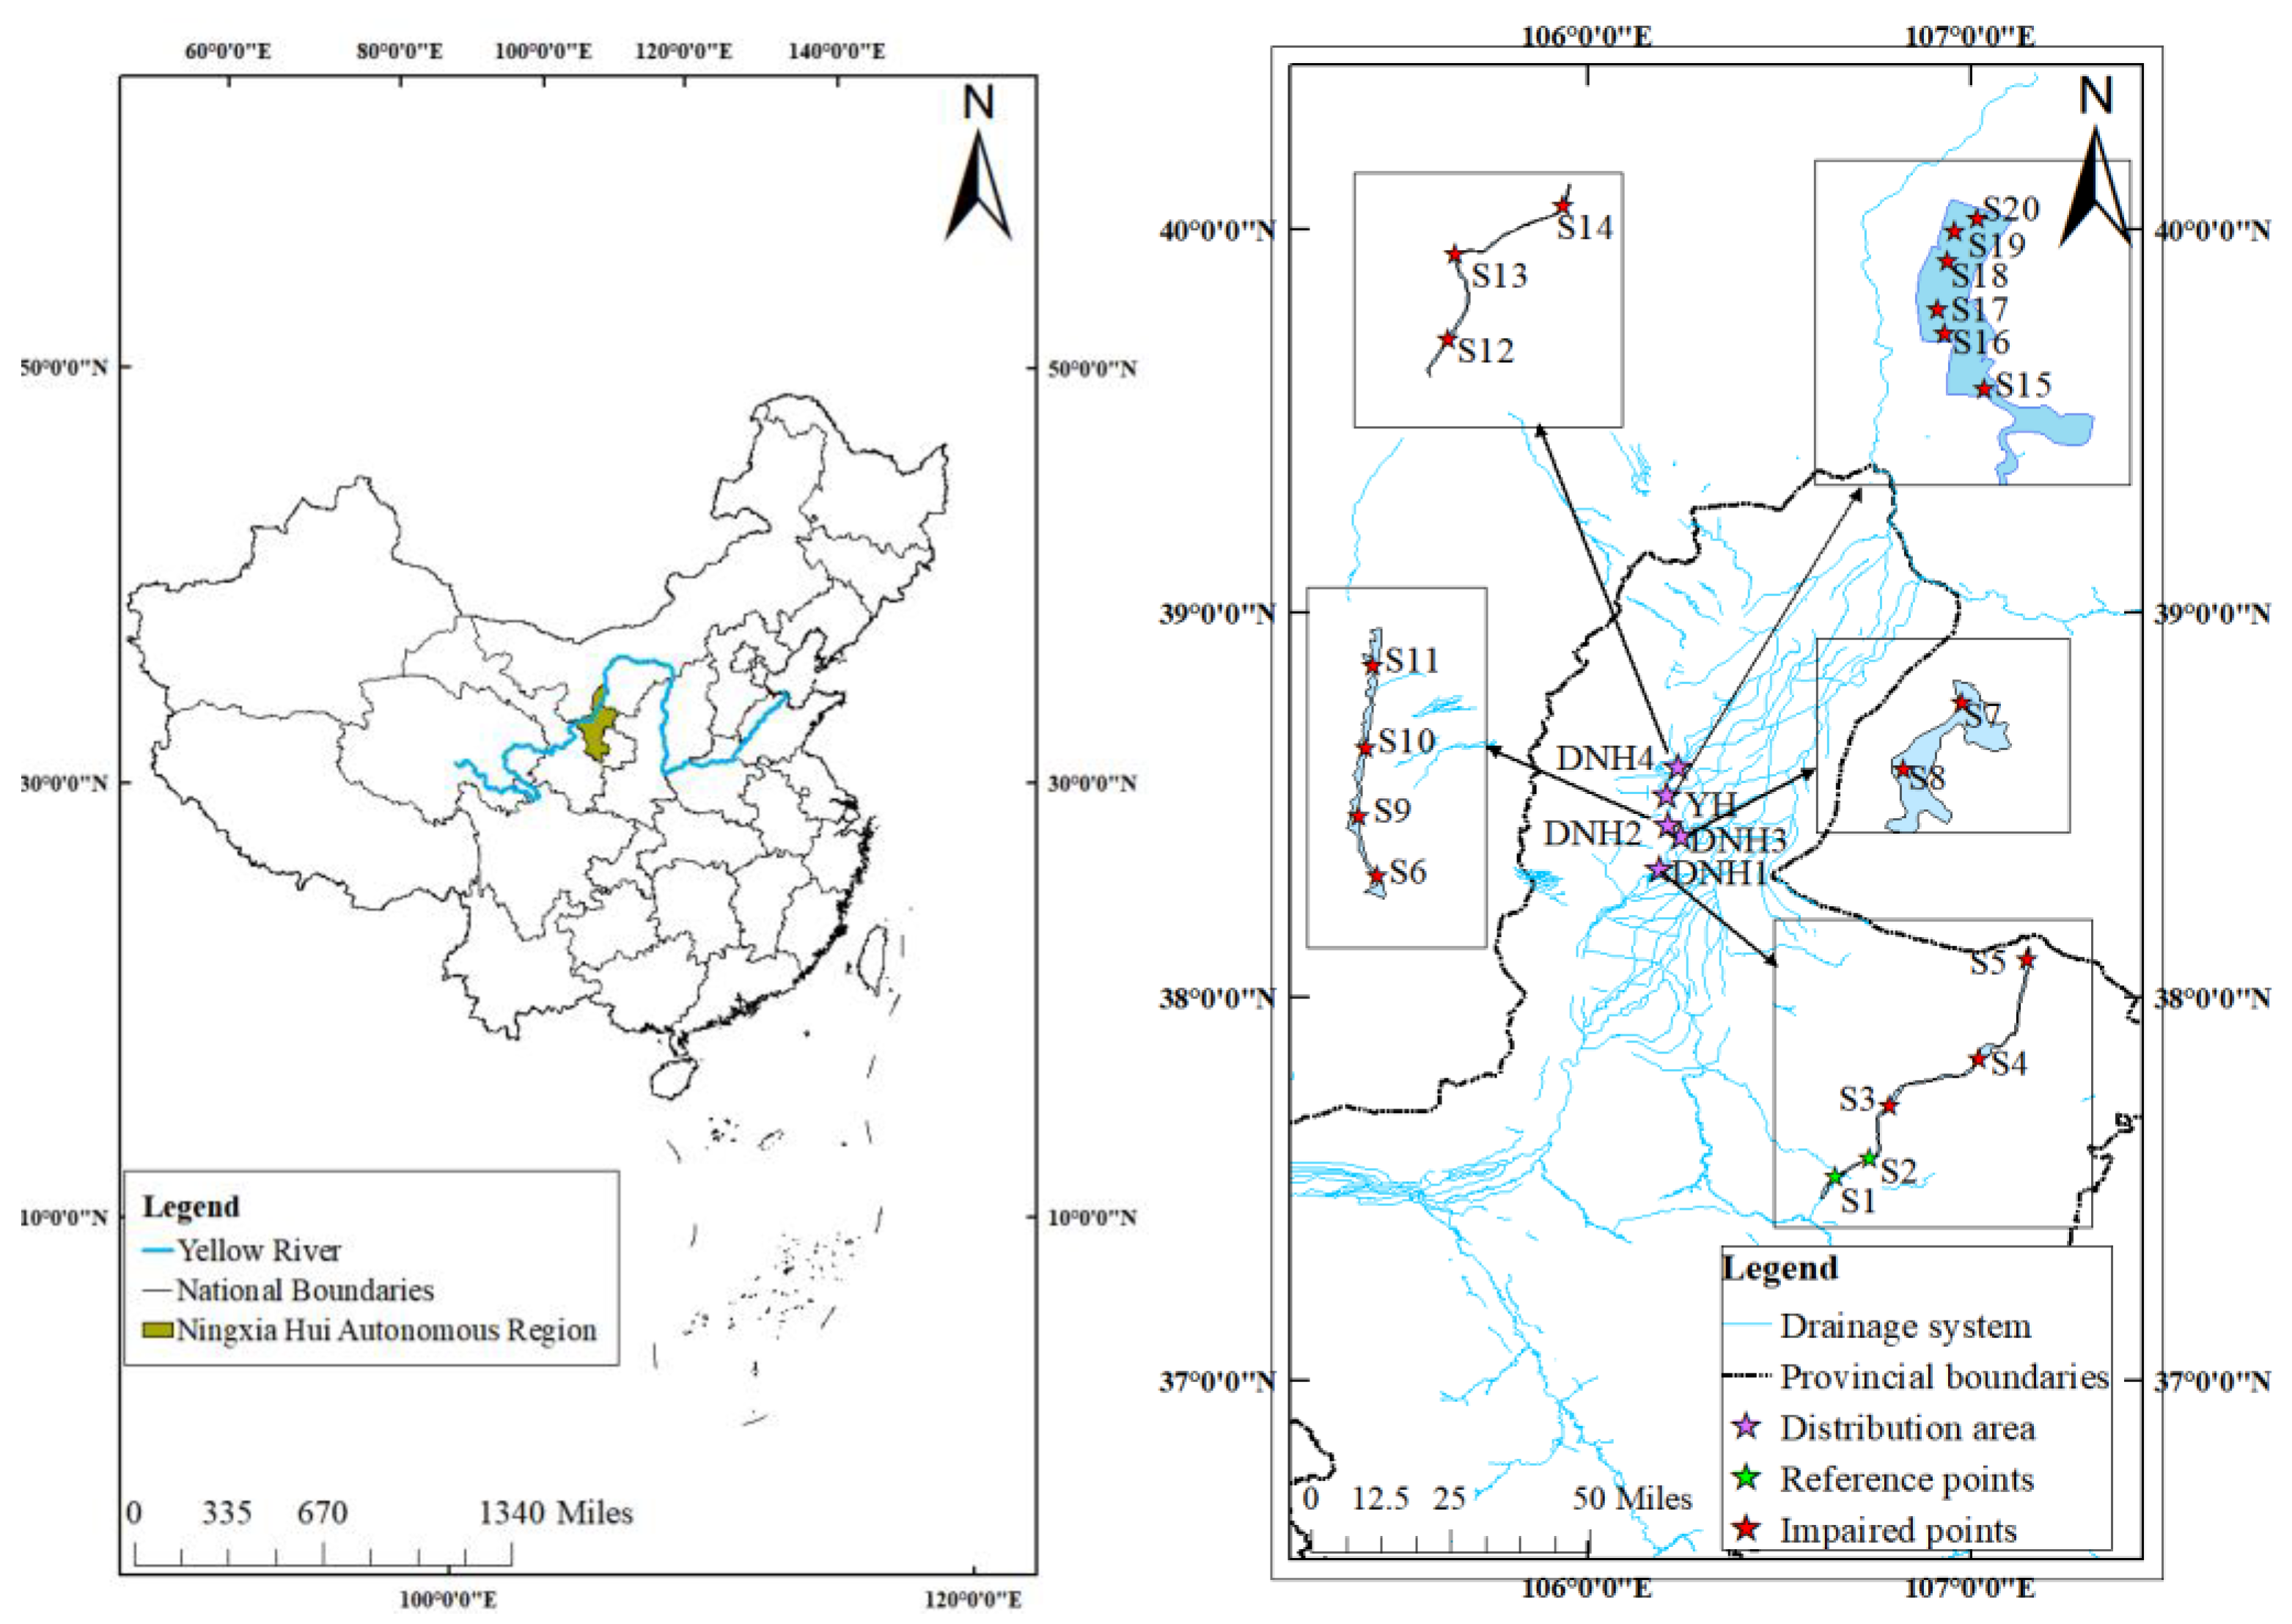
The Diannong River (106°11′35″~106°47′13″ E, 38°18′12″~39°7′11″ N) is located in northern Ningxia, China, its source is located in Xishao Village, Lijun Town, Yongning County, across 6 districts and counties including Yongning County and Xixia District, Yinchuan City, with a total length of 180.5 km and a watershed area of 4391 km2. The Diannong River is a transitional zone of arid and semi-arid climates with distinct seasonal characteristics. Precipitation seasons change significantly, with heavy rainfall in summer and autumn, including frequent rainfall in autumn and little rainfall in spring and winter. The recharge sources of the Diannong River are mainly the Yellow River recharge and receding farmland water. In this study, a total of 20 sampling points were deployed in the Diannnong River (Figure 1), of which 7 sampling points (S1–S5, S7–S8) were deployed in the upper reaches of the Diannong River, i.e., DNH1 and DNH3 areas, 10 sampling points (S6, S9–S11, S15–S20) were deployed in the middle reaches of the Diannong River, i.e., DNH2 and YH areas, and 3 sampling points (S12–S14) were deployed in the lower reaches of the Diannong River, i.e., DNH4 area.
2.2. Sample Collection and Measurement
2.2.1. Water Sample Collection and Measurement
Water samples were collected in the Diannong River in April, July, and October 2021. Water temperature(WT), dissolved oxygen (DO), pH, electrical conductivity (EC), salinity (Sal), and dissolved solids (TDS) were all measured by a YSI Pro-plus portable water quality analyzer on-site, ammonia nitrogen (NH3-N) was measured by the Nascent reagent spectrophotometric method, total nitrogen (TN) was measured by the basic potassium persulfate ablation UV spectrophotometric method, total phosphorus (TP) and effective phosphorus (A-P) were measured by the ammonium molybdate spectrophotometric method, permanganate index (CODMn) was measured by the acidic potassium permanganate method, Fluoride ion (F−) was measured by a HACH HQ40d portable water quality analyzer, nitroso-nitrogen (NO2−) was measured by the gas phase molecular absorption spectrometric method, dichromate index (CODCr) was measured by the bichromate method, chlorophyll a (Chl a) was measured by a HACH Hydrolab DS5X, sulfate ion (SO42−) was measured by the sulphate-weight method. Water sample collection, storage, and monitoring of physical and chemical indicators followed the “Water Quality Sampling Technical Guidance (HJ494-2009)” [15], “Water Quality Sample Preservation and Management Technical Provisions (HJ493-2009)” [16] and “Water Quality Sampling Program Design Technical Provisions (HJ495-2009)” [17].
2.2.2. Plankton Sample Collection and Identification
Phytoplankton samples were collected in a dosage cup at a water depth of 0.5 m for 1 L with 15 mL of Lugo’s reagent fixed in the field and concentrated to 50 mL for microscopic examination after settling for 24 h in the laboratory. Specimens collected were identified to genus or species, counted and biomass was calculated, as described in “Specifications for Lake Eutrophication Survey (Second Edition)” [18], “Specifications for Reservoir Fisheries Resources Survey (SL167-2014)” [19] and “Technical Specifications for Aquatic Life Survey (DB11/T 1721-2020)” [20].
Qualitative zooplankton samples were collected using a zooplankton bio-net at a water depth of 0.5 m by towing 25 mL, and quantitative zooplankton samples were collected by weighing 20 L in a 5 L measuring cup and concentrated to 20 mL using a zooplankton bio-net. The qualitative and quantitative zooplankton samples were fixed on-site by adding 1.5 mL of 5% formaldehyde solution and stored at low temperatures in the laboratory for microscopic examination. As described in “Atlas of Freshwater Organisms in China” [21] and “Journal of Freshwater Rotifers in China” [22].
2.2.3. Microorganism Collection and Identification
Each water sample mixed surface water (at a depth of 0.5 m) and deep water (at a depth of 2.0 m) in equal amounts were collected in a polyethylene sampling bottle of 4 L and brought back to the laboratory after water samples were stored in an incubator below 4 °C. The water samples for DNA analysis were filtered through 0.22 μm microporous membrane within 24 h under sterile conditions and stored at −80 °C until DNA extraction. NucleoSpin 96 soi ((MACHEREYNAGEL, Dueren, Germany) was used to extract DNA from all filters following the manufacturer’s protocol, and the purity and concentration of DNA were checked by agarose gel electrophoresis. PCR amplification of the V3–V4 variable region of microbial 16sRNA gene was performed using barcode primers515F and 806R, and the purified PCR amplification products were sequenced by Monarch DNA gel extraction kit (New England Biolabs, Ipswich, MA, USA). Sequencing was performed by Biomarker Co., Ltd. (Beijing, China) using the Illumina MiSeq 2500 platform with the PE250 strategy. the remaining sequences were clustered into OTUs (>97% sequence similarity) using USEARCH (version 10.0). The taxonomic identity of representative sequences for each OTU was determined using the Silva reference database (Release 132, http://www.arb-silva.de, (accessed on 20 March 2021)). The α-diversity indices including Chao1, Shannon-winner, Simpson, Ace, PD-whole-tree, and Goods-coverage were calculated using Mothur (version 1.3.0), as described in relative literature [4].
2.3. Selection of Reference Points
In this study, reference sites in the Diannong River were selected based on the water quality and habitat quality of the study area.
2.3.1. Water Quality Scoring
Water quality score regarding the “Surface Water Environmental Quality Standards (GB 3838-2002)” [23], the water quality evaluation level Ⅰ, Ⅱ, Ⅲ, Ⅳ, V were assigned 5, 4, 3, 2, 1 points, water which did not reach the V level assigned 0 points (Table S1). The alternative points of reference points were selected if the score was greater or equal to the 95% quartile after the water quality score of each point was aggregated to take the first 95% quartile as the standard. Reference and impaired sites were selected based on water quality scores and the subsequently established habitat composite index.
2.3.2. Habitat Composite Index
In this study, the habitat index was constructed based on the method proposed by Zheng [24], taking into account the natural condition of river habitats in northern China. A total of nine indicators were used to construct the habitat composite index for the Diannong River, including the substrate, habitat complexity, bank stability, river channel change, river water status, vegetation diversity, water quality, human activity intensity, and riparian land type after taking observations in the field (Table S2) and subjective assignment of scores to each of the indicators (Table S3). The scores of each factor of each monitoring site were summed up and the habitat quality was classified into 5 grades of good, better, average, mediocre, and poor according to the interval quantile of 25%, 25~40%, 40~55%, 55~70%, and 70% of the total score. The points with good or better evaluation results were used as alternative points of reference points.
2.4. IBI Development and Water Ecological Health Evaluation
Biological indicators with characteristics such as strong discriminatory ability, accurate access, and ability to quickly reflect changes in the surrounding environment were selected as candidate biological indicators [25]. Among them, the P-IBI, the Z-IBI and the M-IBI index system were constructed regarding the literatures [3,10,26,27], literatures [25,28,29] and literatures [12,14,30,31] respectively. The distribution range analysis, discriminatory ability analysis, and correlation analysis were performed on the candidate biological indicators [2,3] to finally determine the indicators for constructing IBI. The constructed IBI was applied to evaluate the health of water ecology, and the 95% quantile of the IBI was used as the cut-off point to evaluate whether the water ecosystem was healthy or not, and the sequences with values less than it was averaged into four parts, corresponding to healthier, average, mediocre, and poor levels [26].
2.5. Statistical Analysis
In this study, physical and chemical parameters of the water environment and indices of aquatic IBI were taken through correlation analysis to explore the correlation relationship between water quality parameters and screen indices of aquatic IBI. Kolmogorov-Smirnov normal distribution test was used to determine whether water quality parameters and indices of aquatic IBI conformed to normal distribution. Since the results showed most factors of water quality parameters and indices of aquatic IBI conformed to a normal distribution, Pearson correlation analysis was taken for water quality parameters and indices of aquatic IBI respectively.
Since it was difficult for a large number of microorganisms that screen one by one to construct M-IBI, de-trend correspondence analysis (DCA) was used to screen the microorganisms which correlated with water quality parameters significantly. Since the Axis lengths of the first axis of DCA were 0.02, redundancy analysis (RDA) was used for further analysis.
To investigate the main water environmental factors driving the changes in P-IBI, Z-IBI, and M-IBI and the extent to which they explain the changes in aquatic IBI. P-IBI, Z-IBI, and M-IBI were used as dependent variables, and WT, DO, pH, EC, NH3-N, TN, TP, BOD5, CODMn, CODCr, F−, Chl-a, SO42−, A-P, NO2-N and TDS were used as independent variables to establish stepwise regression equations, and the independent variables with significant retention effects were gradually screened. A comparison of the direct and indirect effects of water environmental factors on IBI was conducted by passageway analysis. The above indicators were logarithmized before calculation.
3. Results
3.1. Characteristics of Aquatic Species
A total of 103 species of phytoplankton from 8 phyla were collected and identified in Diannong River, including 18 species of Diatoms, 2 species of Cryptophytes, 3 species of Methanogens, 2 species of Golden Algae, 2 species of Yellow Algae, 26 species of Cyanobacteria, 11 species of Euglena, and 31 species of Green Algae. A total of 52 species of zooplankton in 4 phyla, including 7 families and 8 genera and 8 species of protozoa, 11 families and 14 genera and 27 species of rotifers, 5 families and 7 genera and 9 species of branchiopods, and 4 families and 4 genera and 8 species of copepods. A total of 15,819 sequences were obtained by high-throughput sequencing analysis of microbial information at each sample site.
3.2. Results of Water Quality Parameters Values and Correlation Analysis
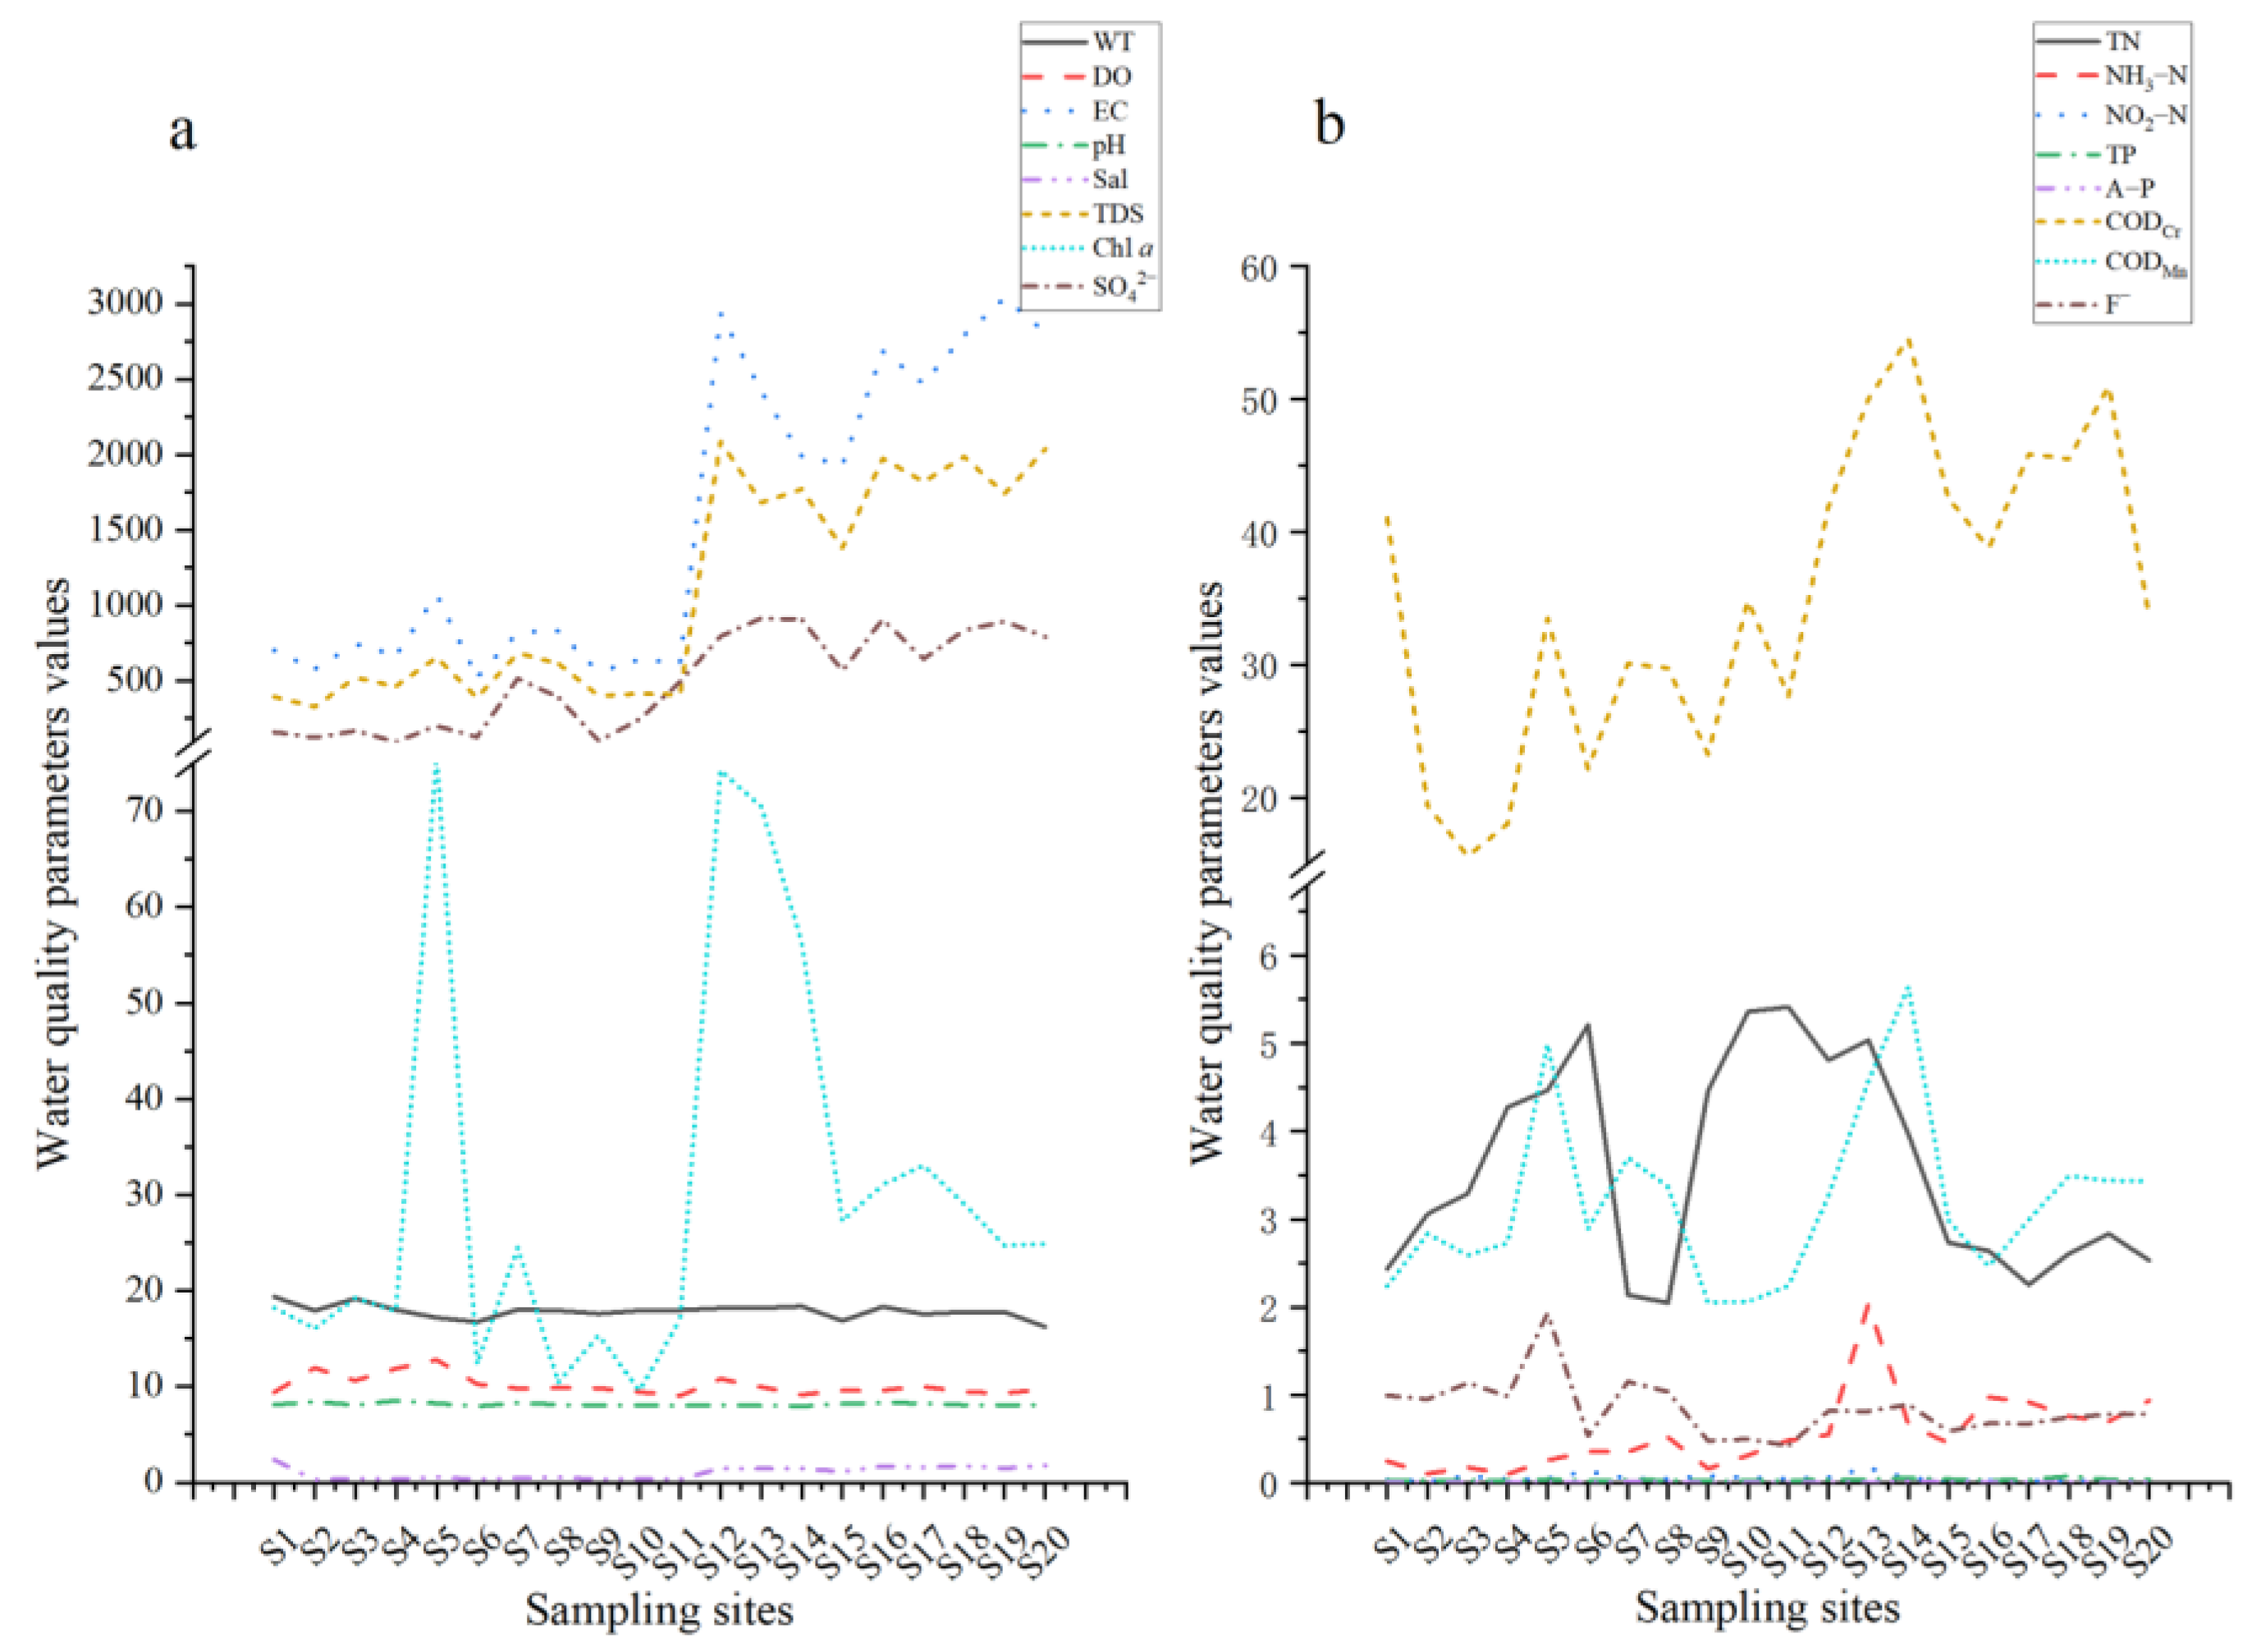
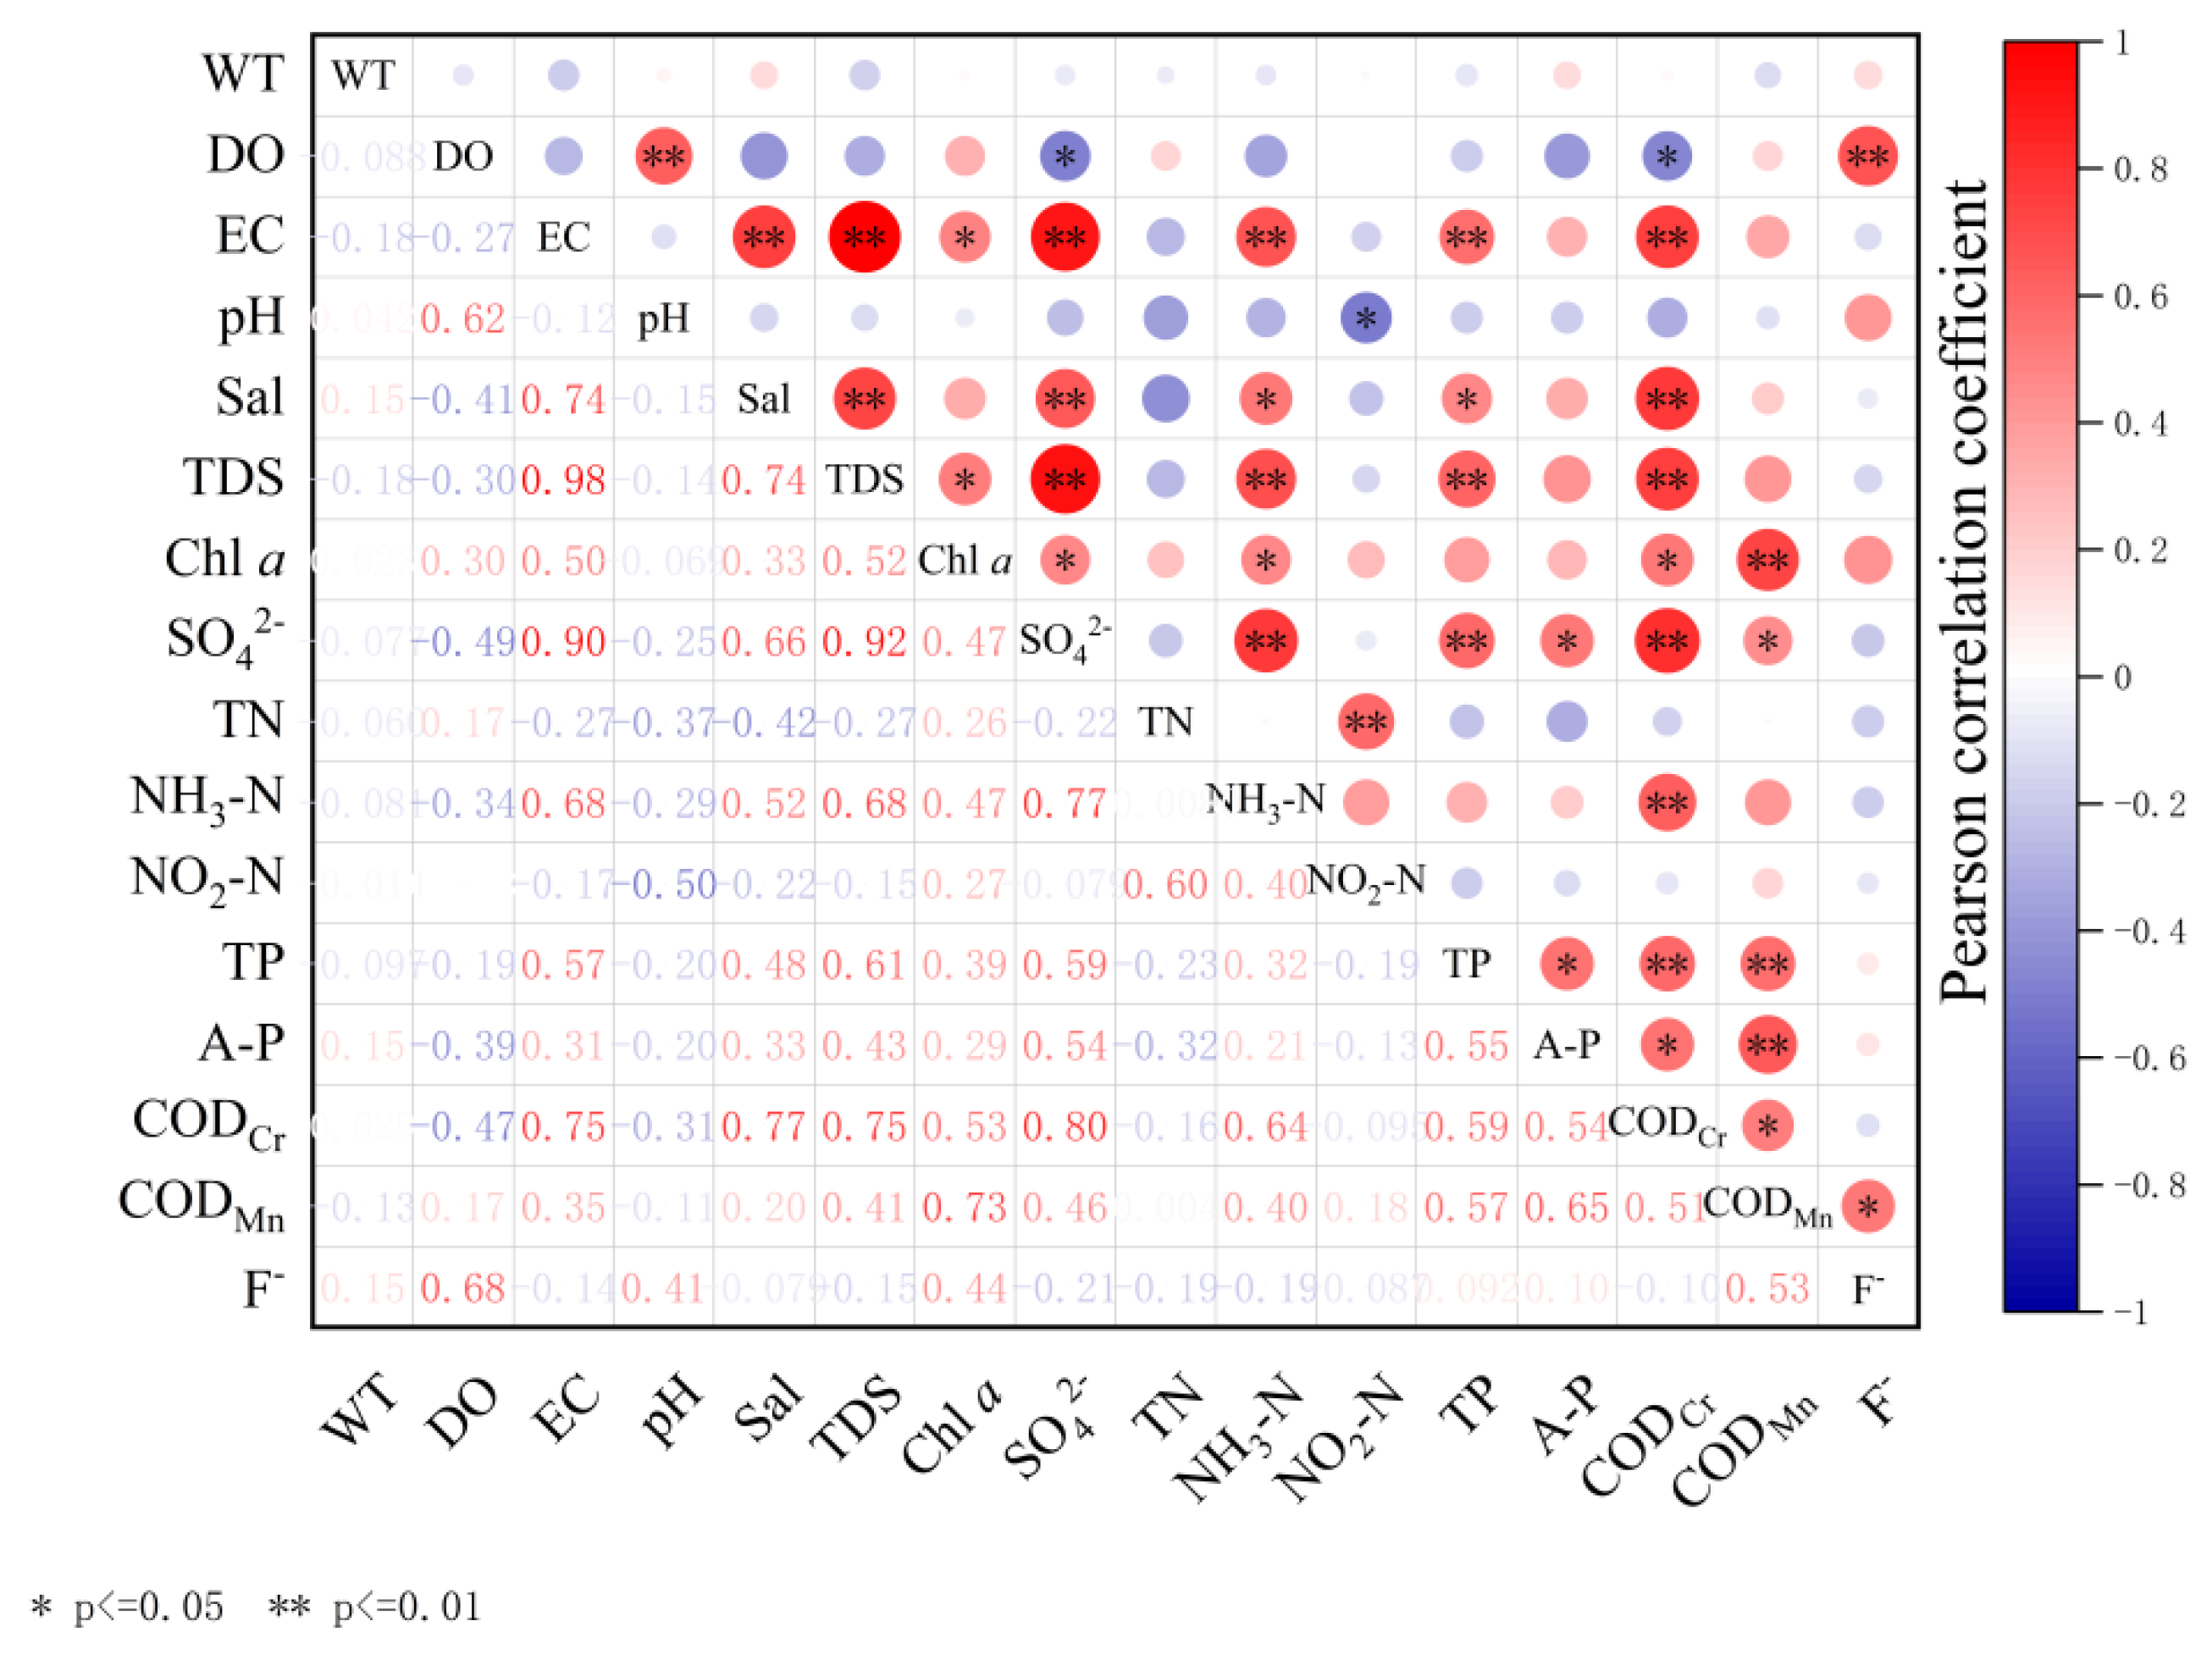
Water quality parameter values in each sampling site are shown in Figure 2. Results showed that WT, DO, pH, NO2-N, A-P, and TP did not change significantly along sampling sites, EC, TDS, SO42−, Chl a, CODCr, CODMn, and TN changed significantly along sampling sites. NH3-N and NO2-N changed abruptly at individual sites with no significant overall change. The values of more variable water quality parameters generally showed a trend of higher values at the Yuehai Lake sites (S15–S20) than at the Diannong River sites (S1–S14). Correlation analysis (Figure 3) showed that EC, Sal, TDS, CODCr and SO42− were positively correlated with many water quality parameters. The rest of the water quality parameters were just correlated or not correlated with a small number of factors.
3.3. Results of Reference Point Selection
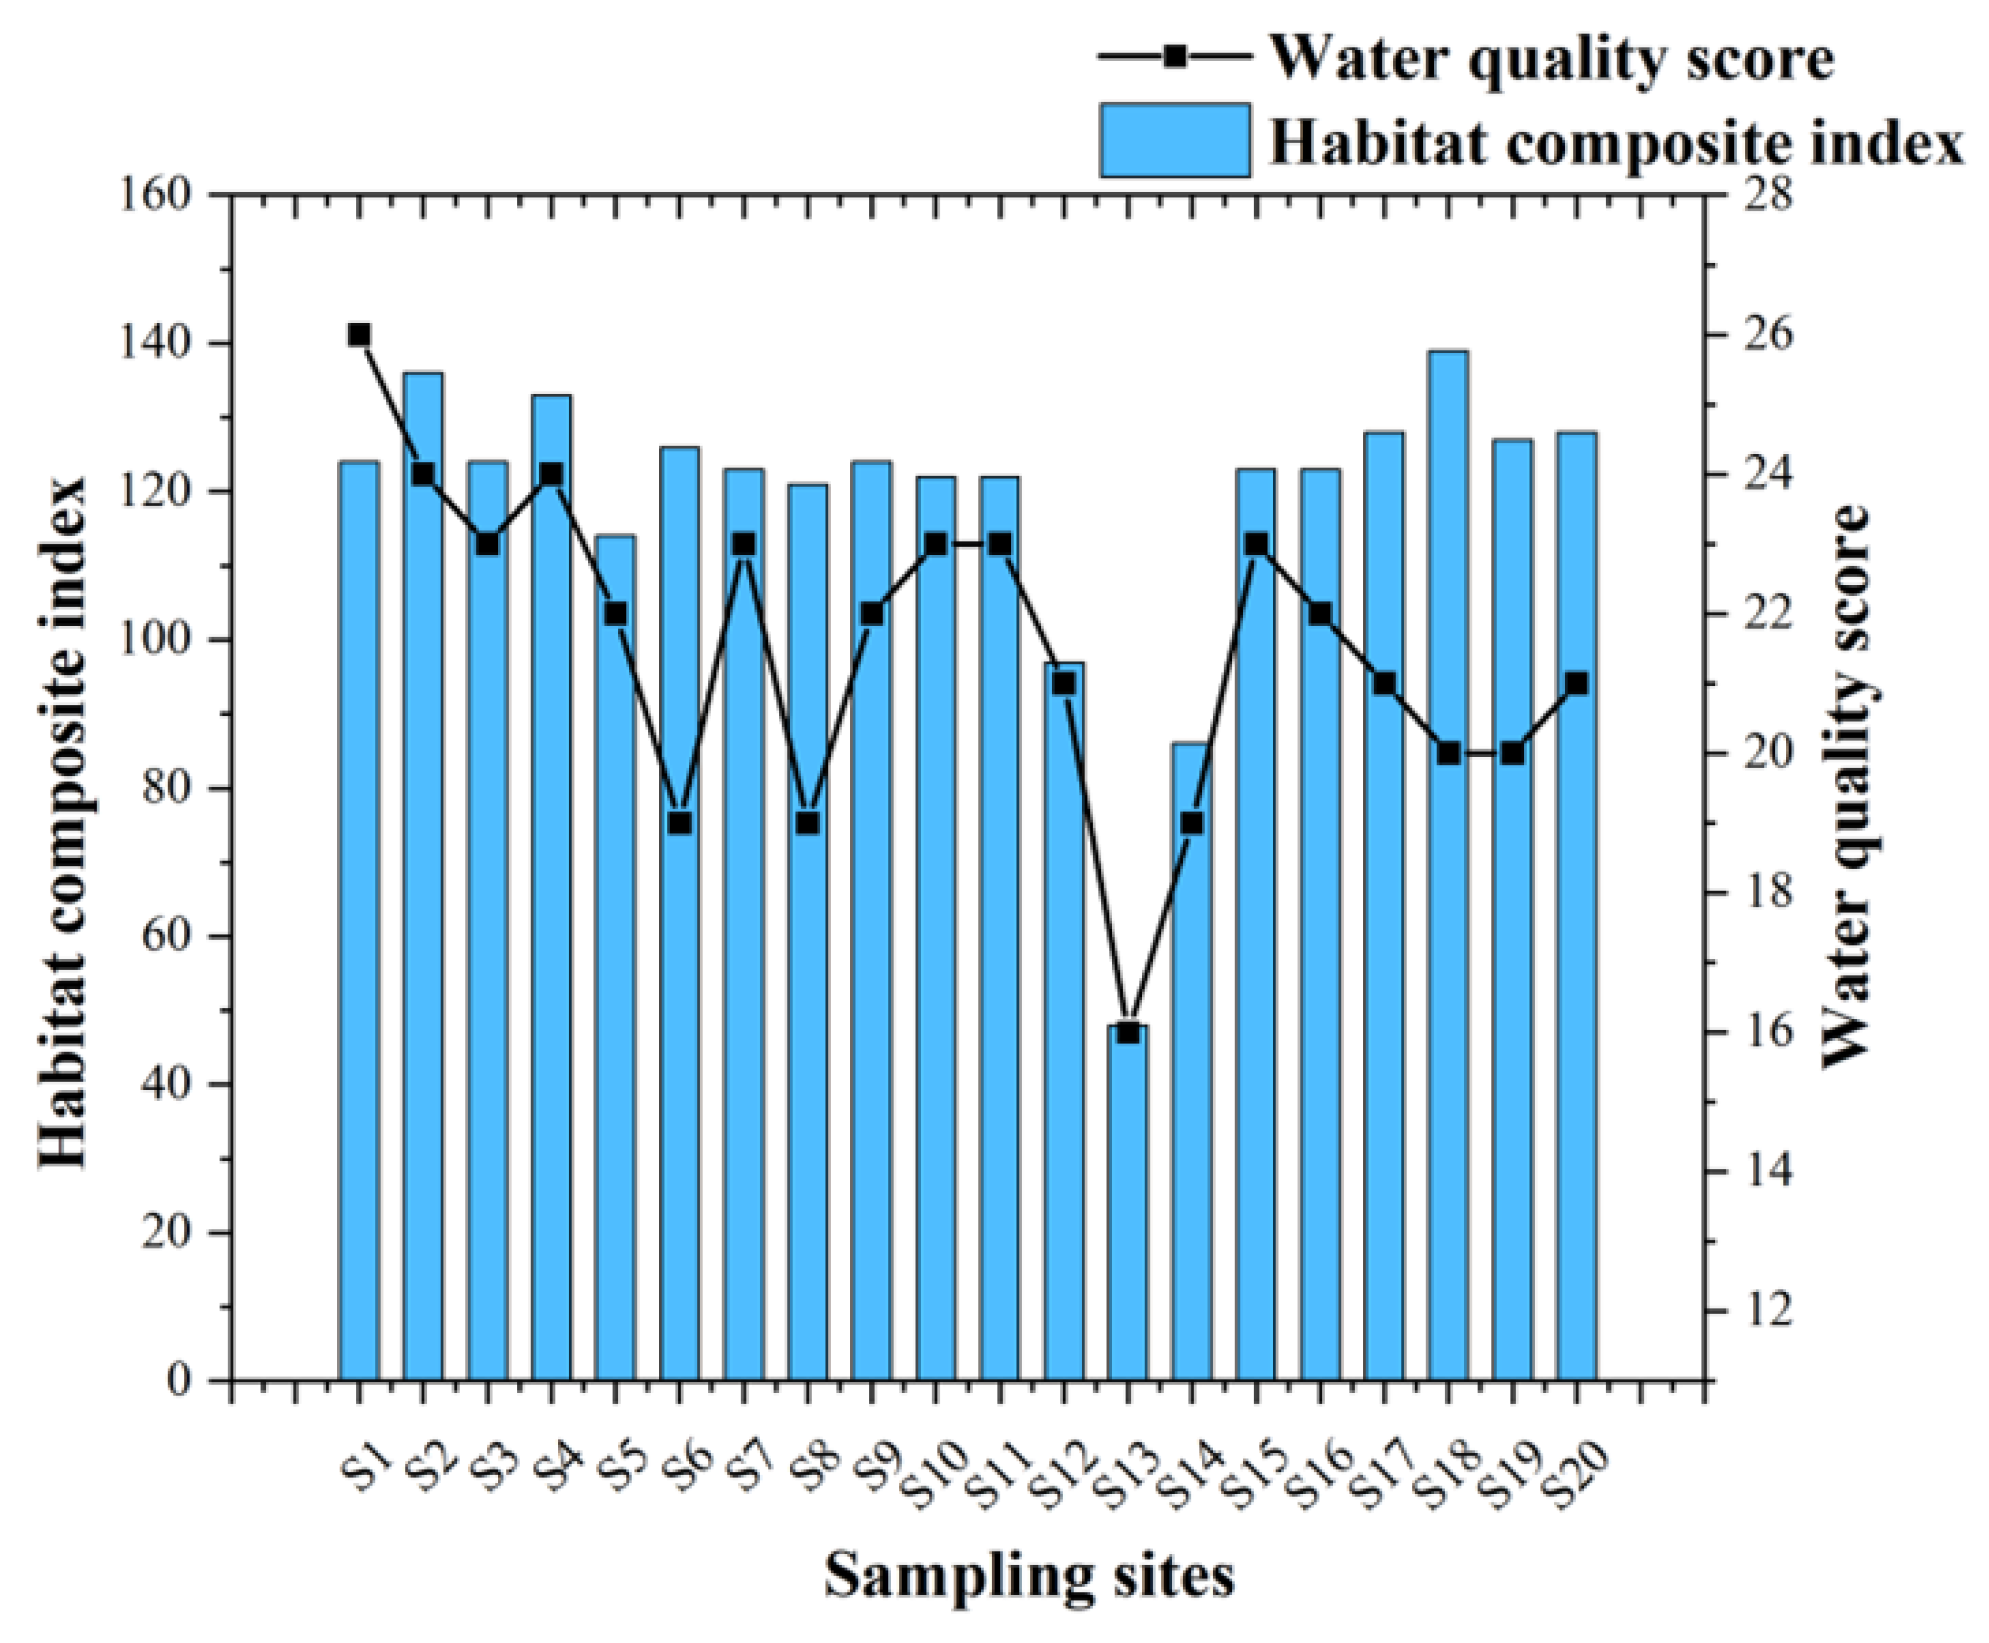
The results of the water quality score and habitat composite index evaluation were shown in Figure 4. The water quality scores of the sampling points of the Diannong River exceeded the 95% quartile for S1–S2, S4 and the only points with good habitat index evaluation results were S2 and S18, but the water quality score of S1 was the highest among all sampling points and its habitat index evaluation results were better, so S1 and S2 were selected as reference points, and the rest of the points were impaired sites, as shown in Figure 1.
3.4. Development of Aquatic IBI
3.4.1. P-IBI
36 indicators were selected as candidate indicators (Table 1), including those characterizing the community structure, those characterizing the community quantity, those characterizing the community function, those characterizing tolerant taxa, and the diversity index.
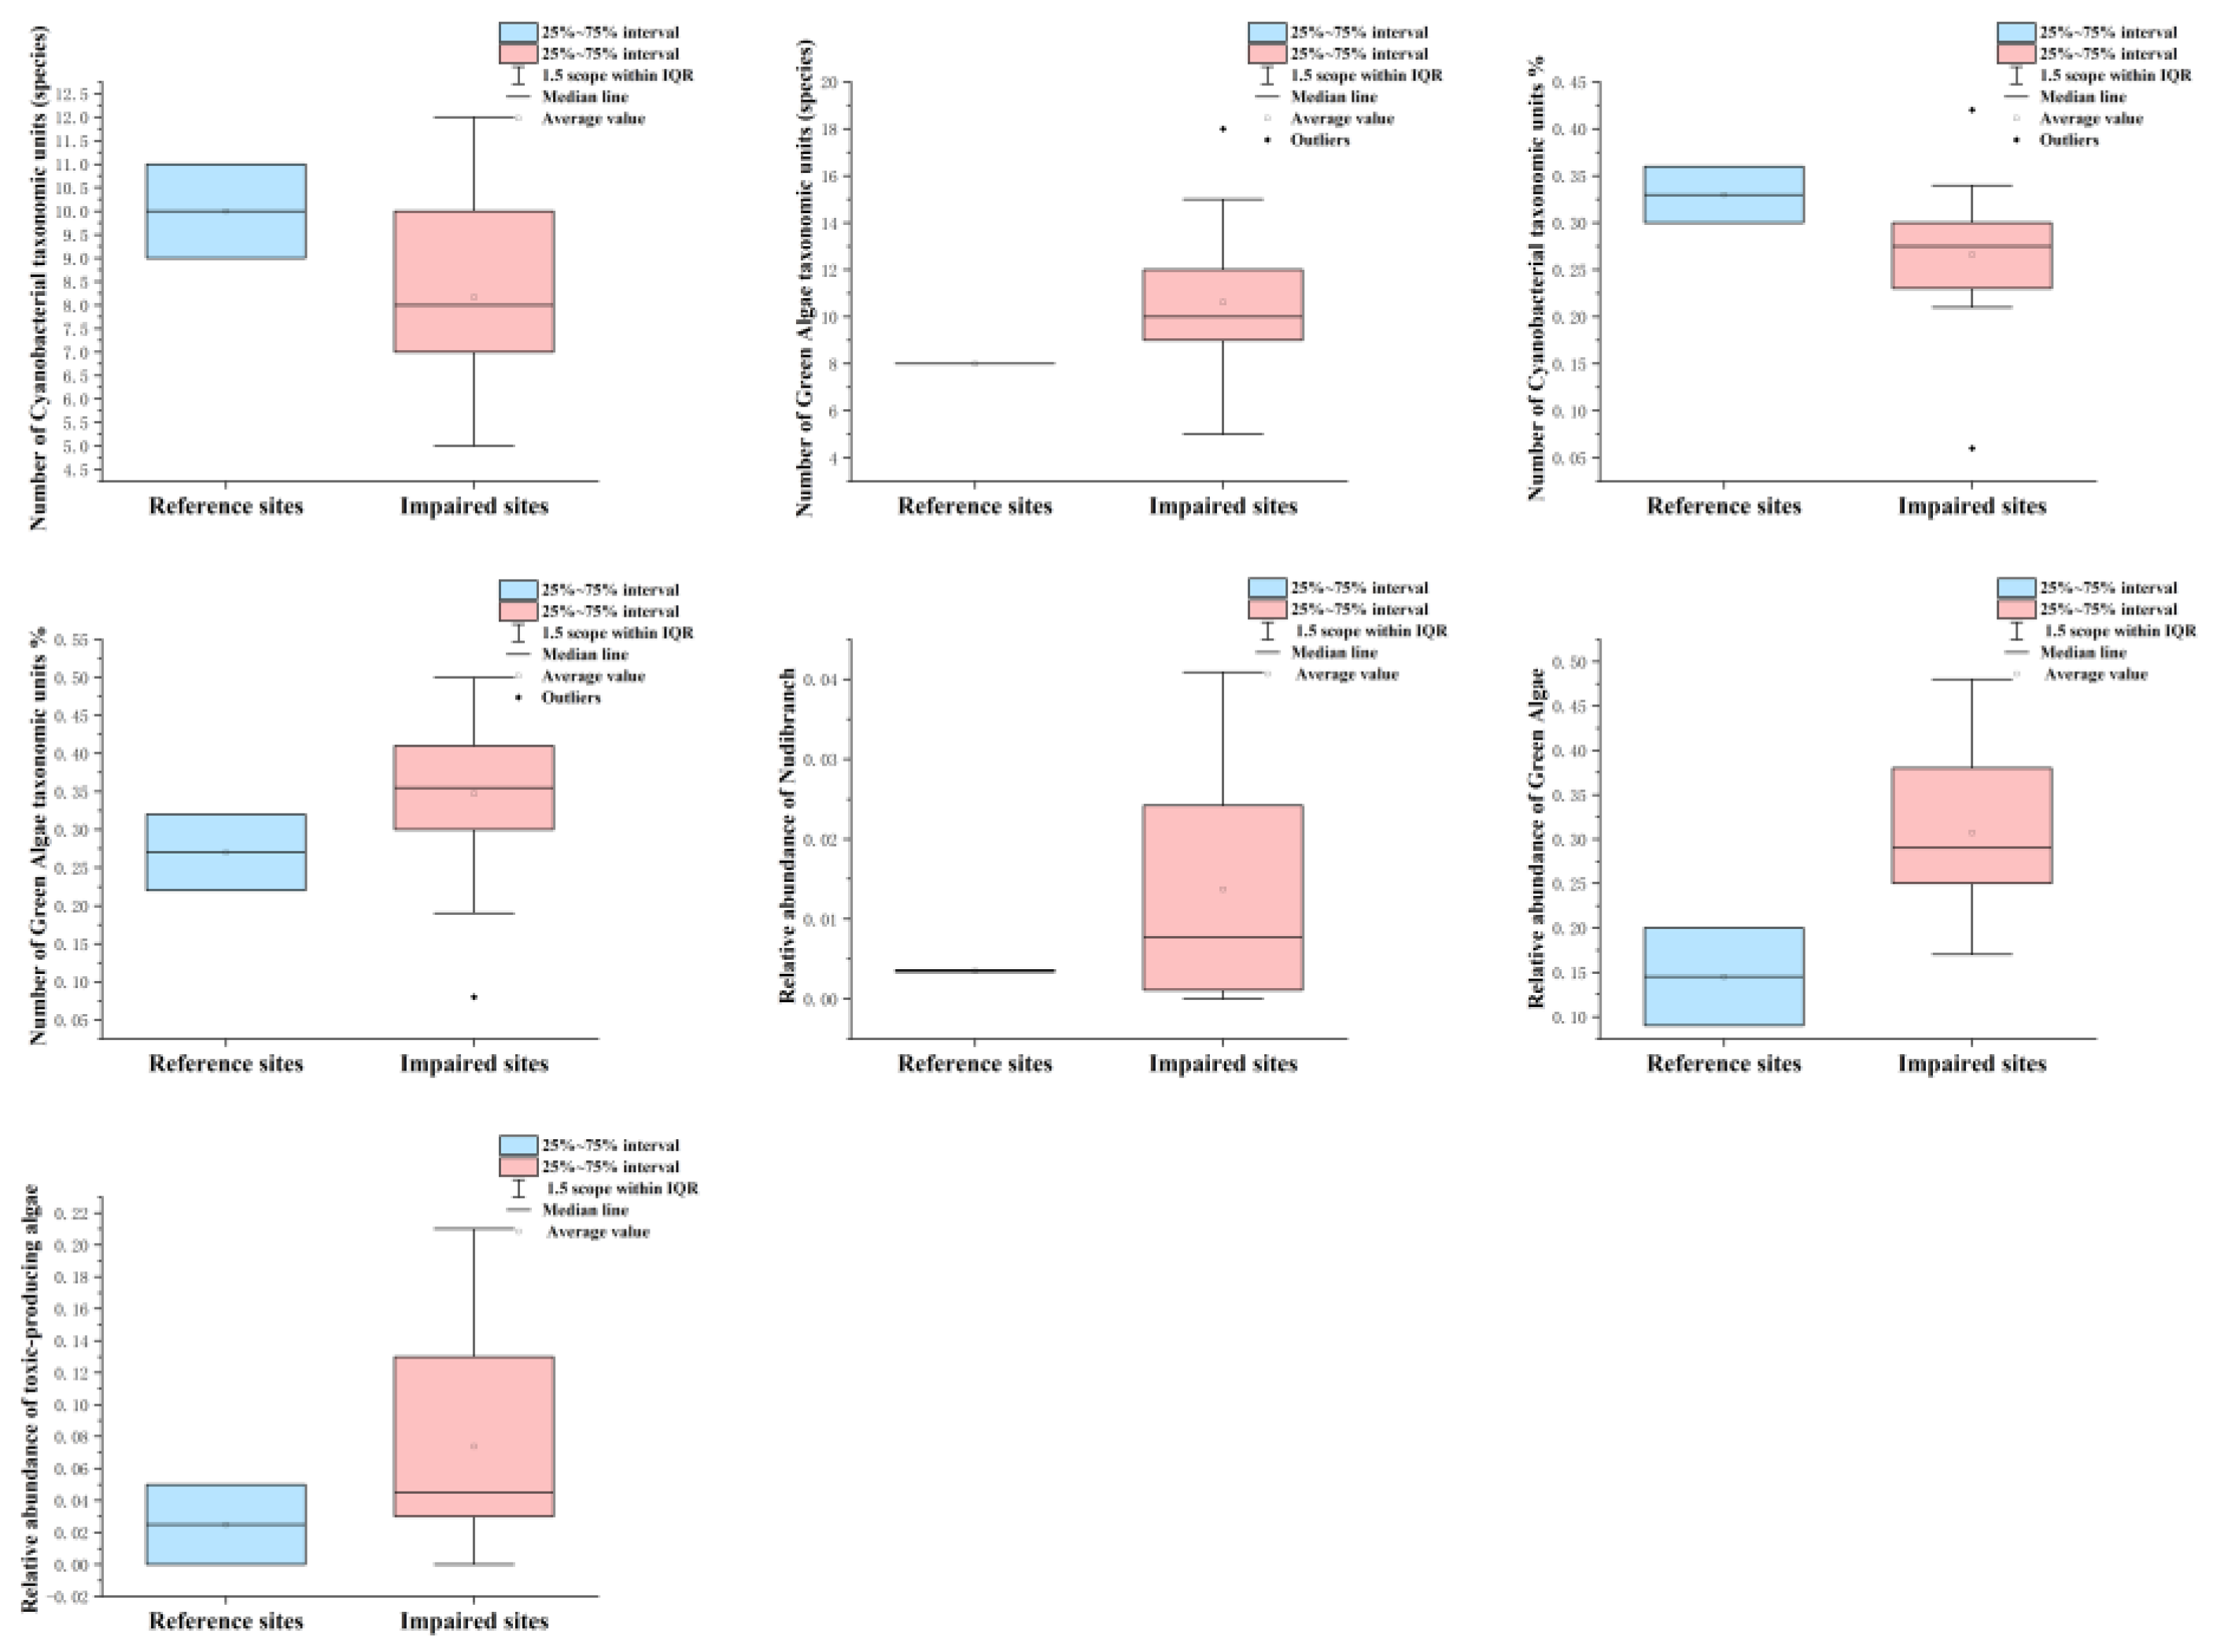
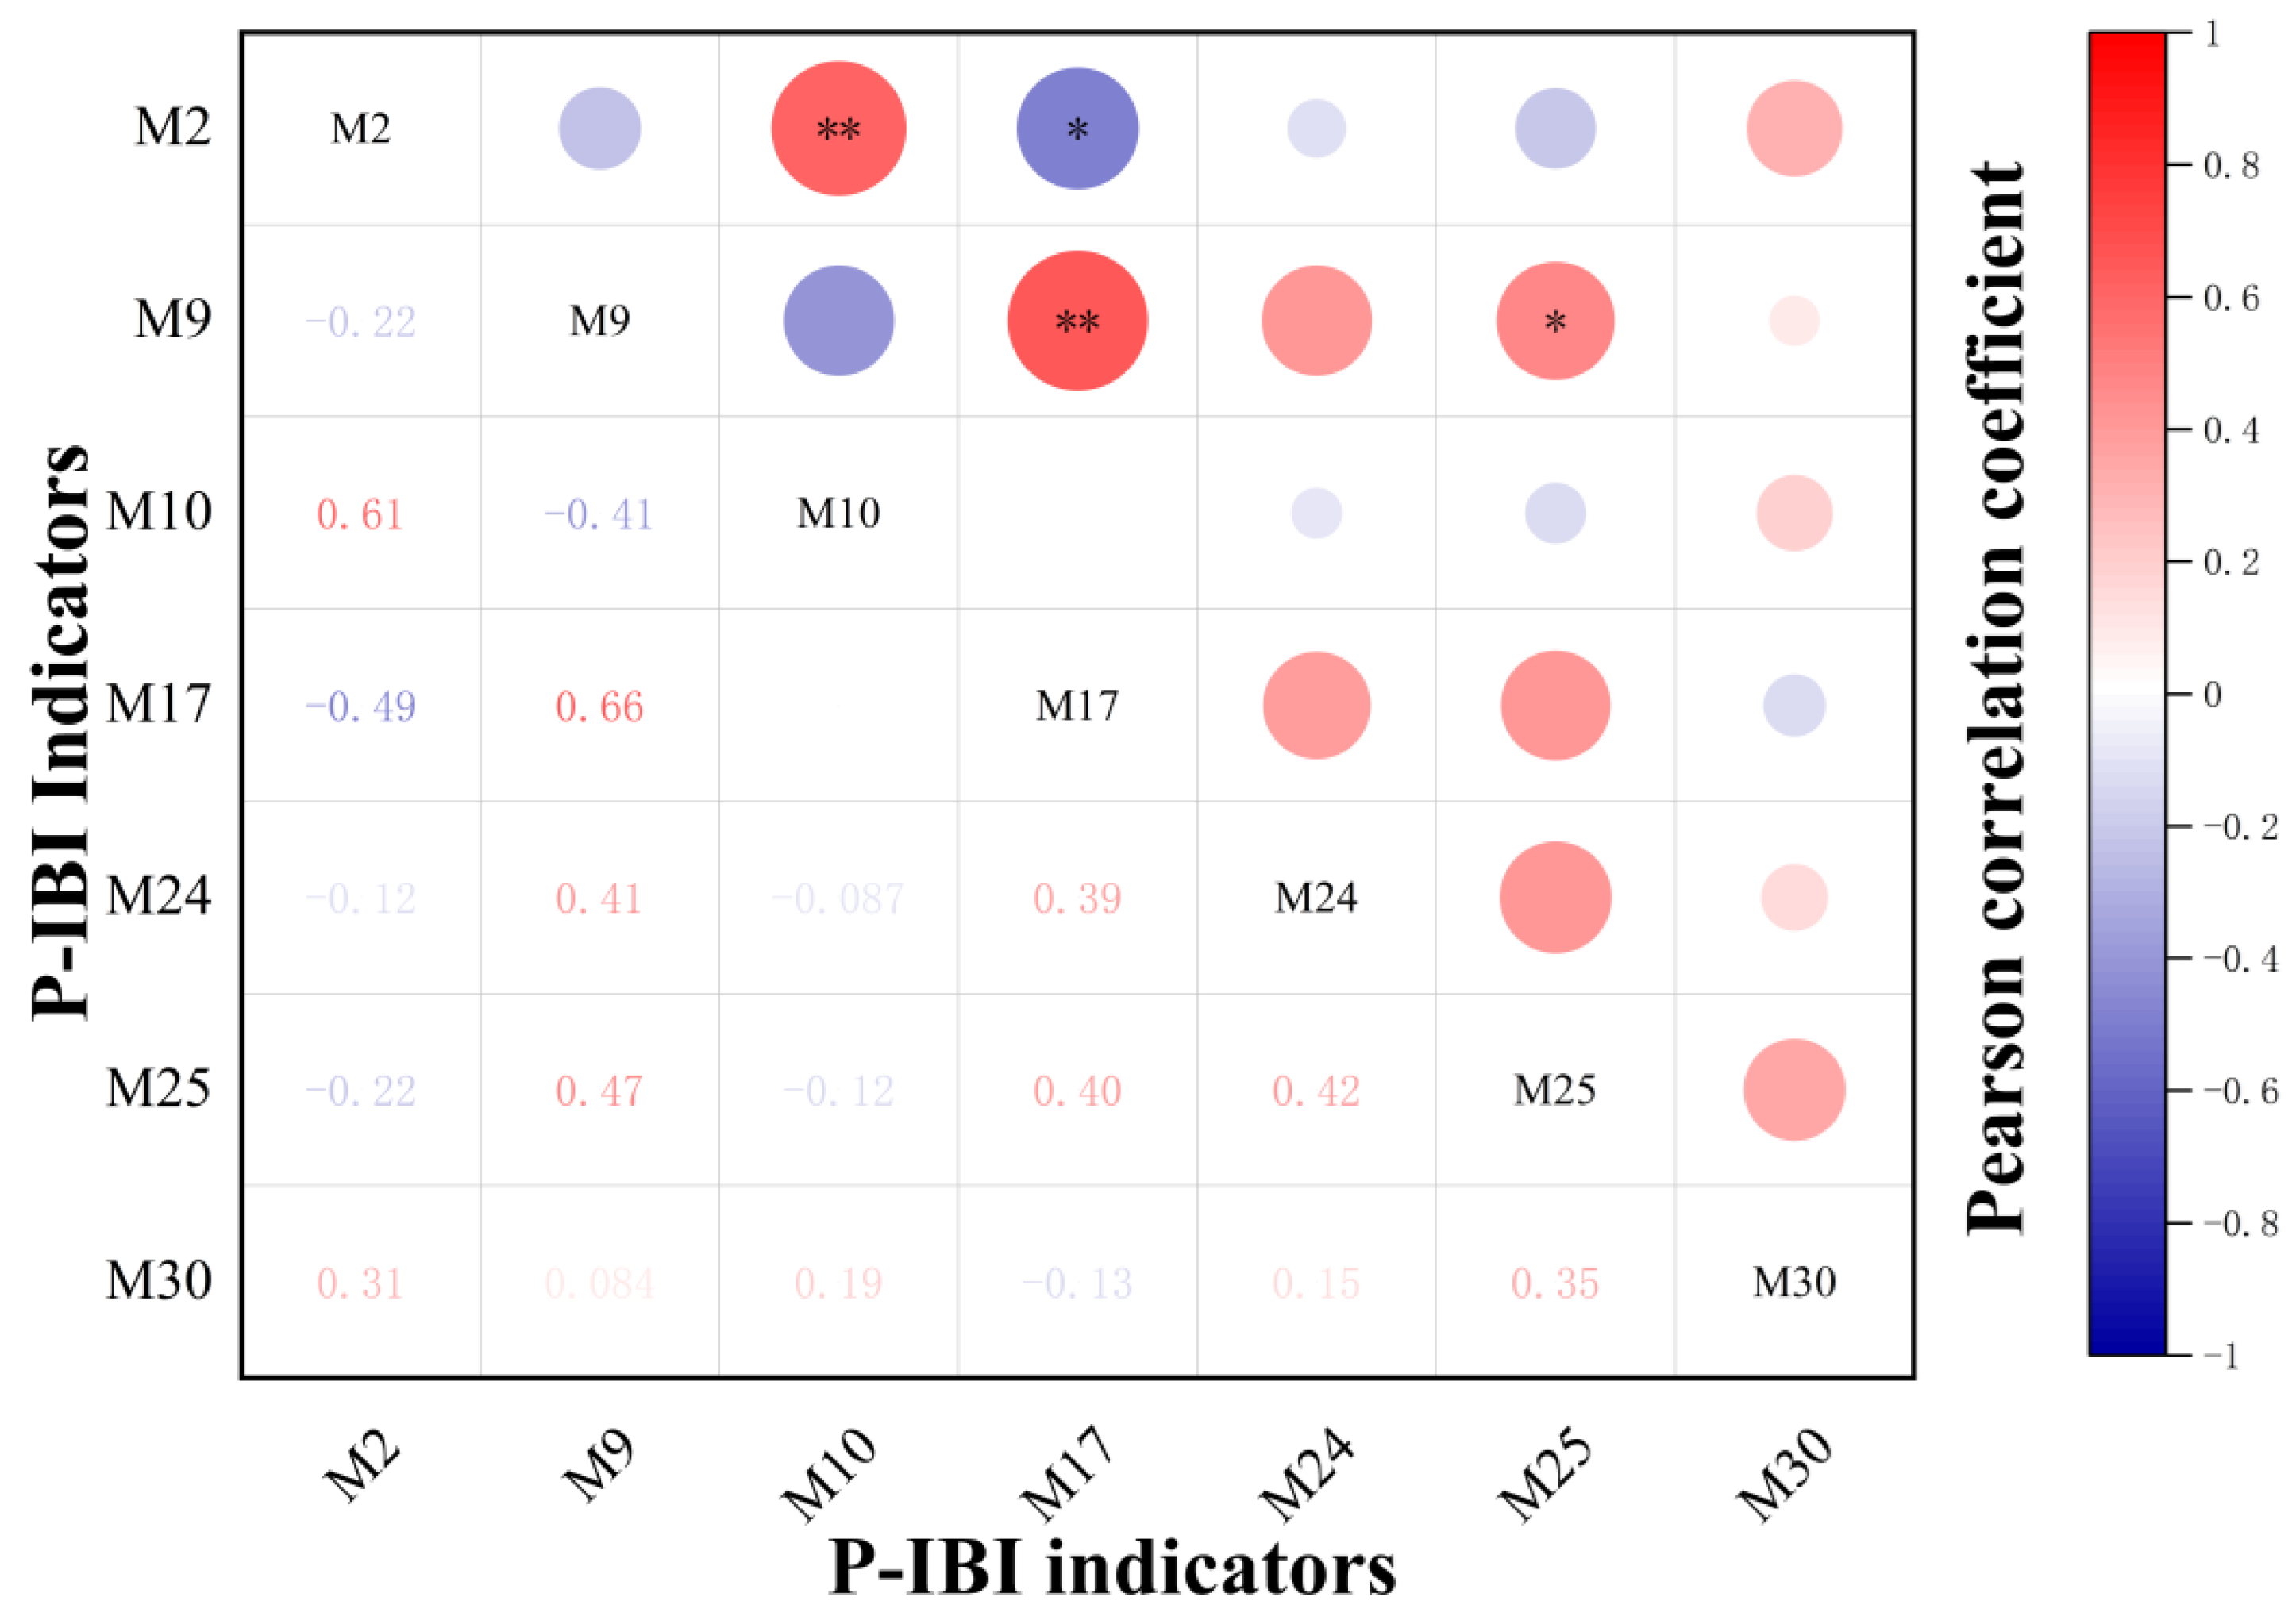
After taking distribution range analysis, discriminatory ability analysis (Figure 5), and correlation analysis (Figure 6), the number of cyanobacterial Phylum taxonomic units % M10, the number of Green Algae taxonomic units % M17, the relative abundance of Nudibranch M24, the relative abundance of Green Algae M25 and relative abundance of toxic-producing algae M30 were finally determined as the indicators for constructing P-IBI.
3.4.2. Z-IBI
20 indicators were selected as candidate indicators (Table 2), including those characterizing the community structure, those characterizing the community quantity, and diversity index, and those characterizing the nutritional structure.
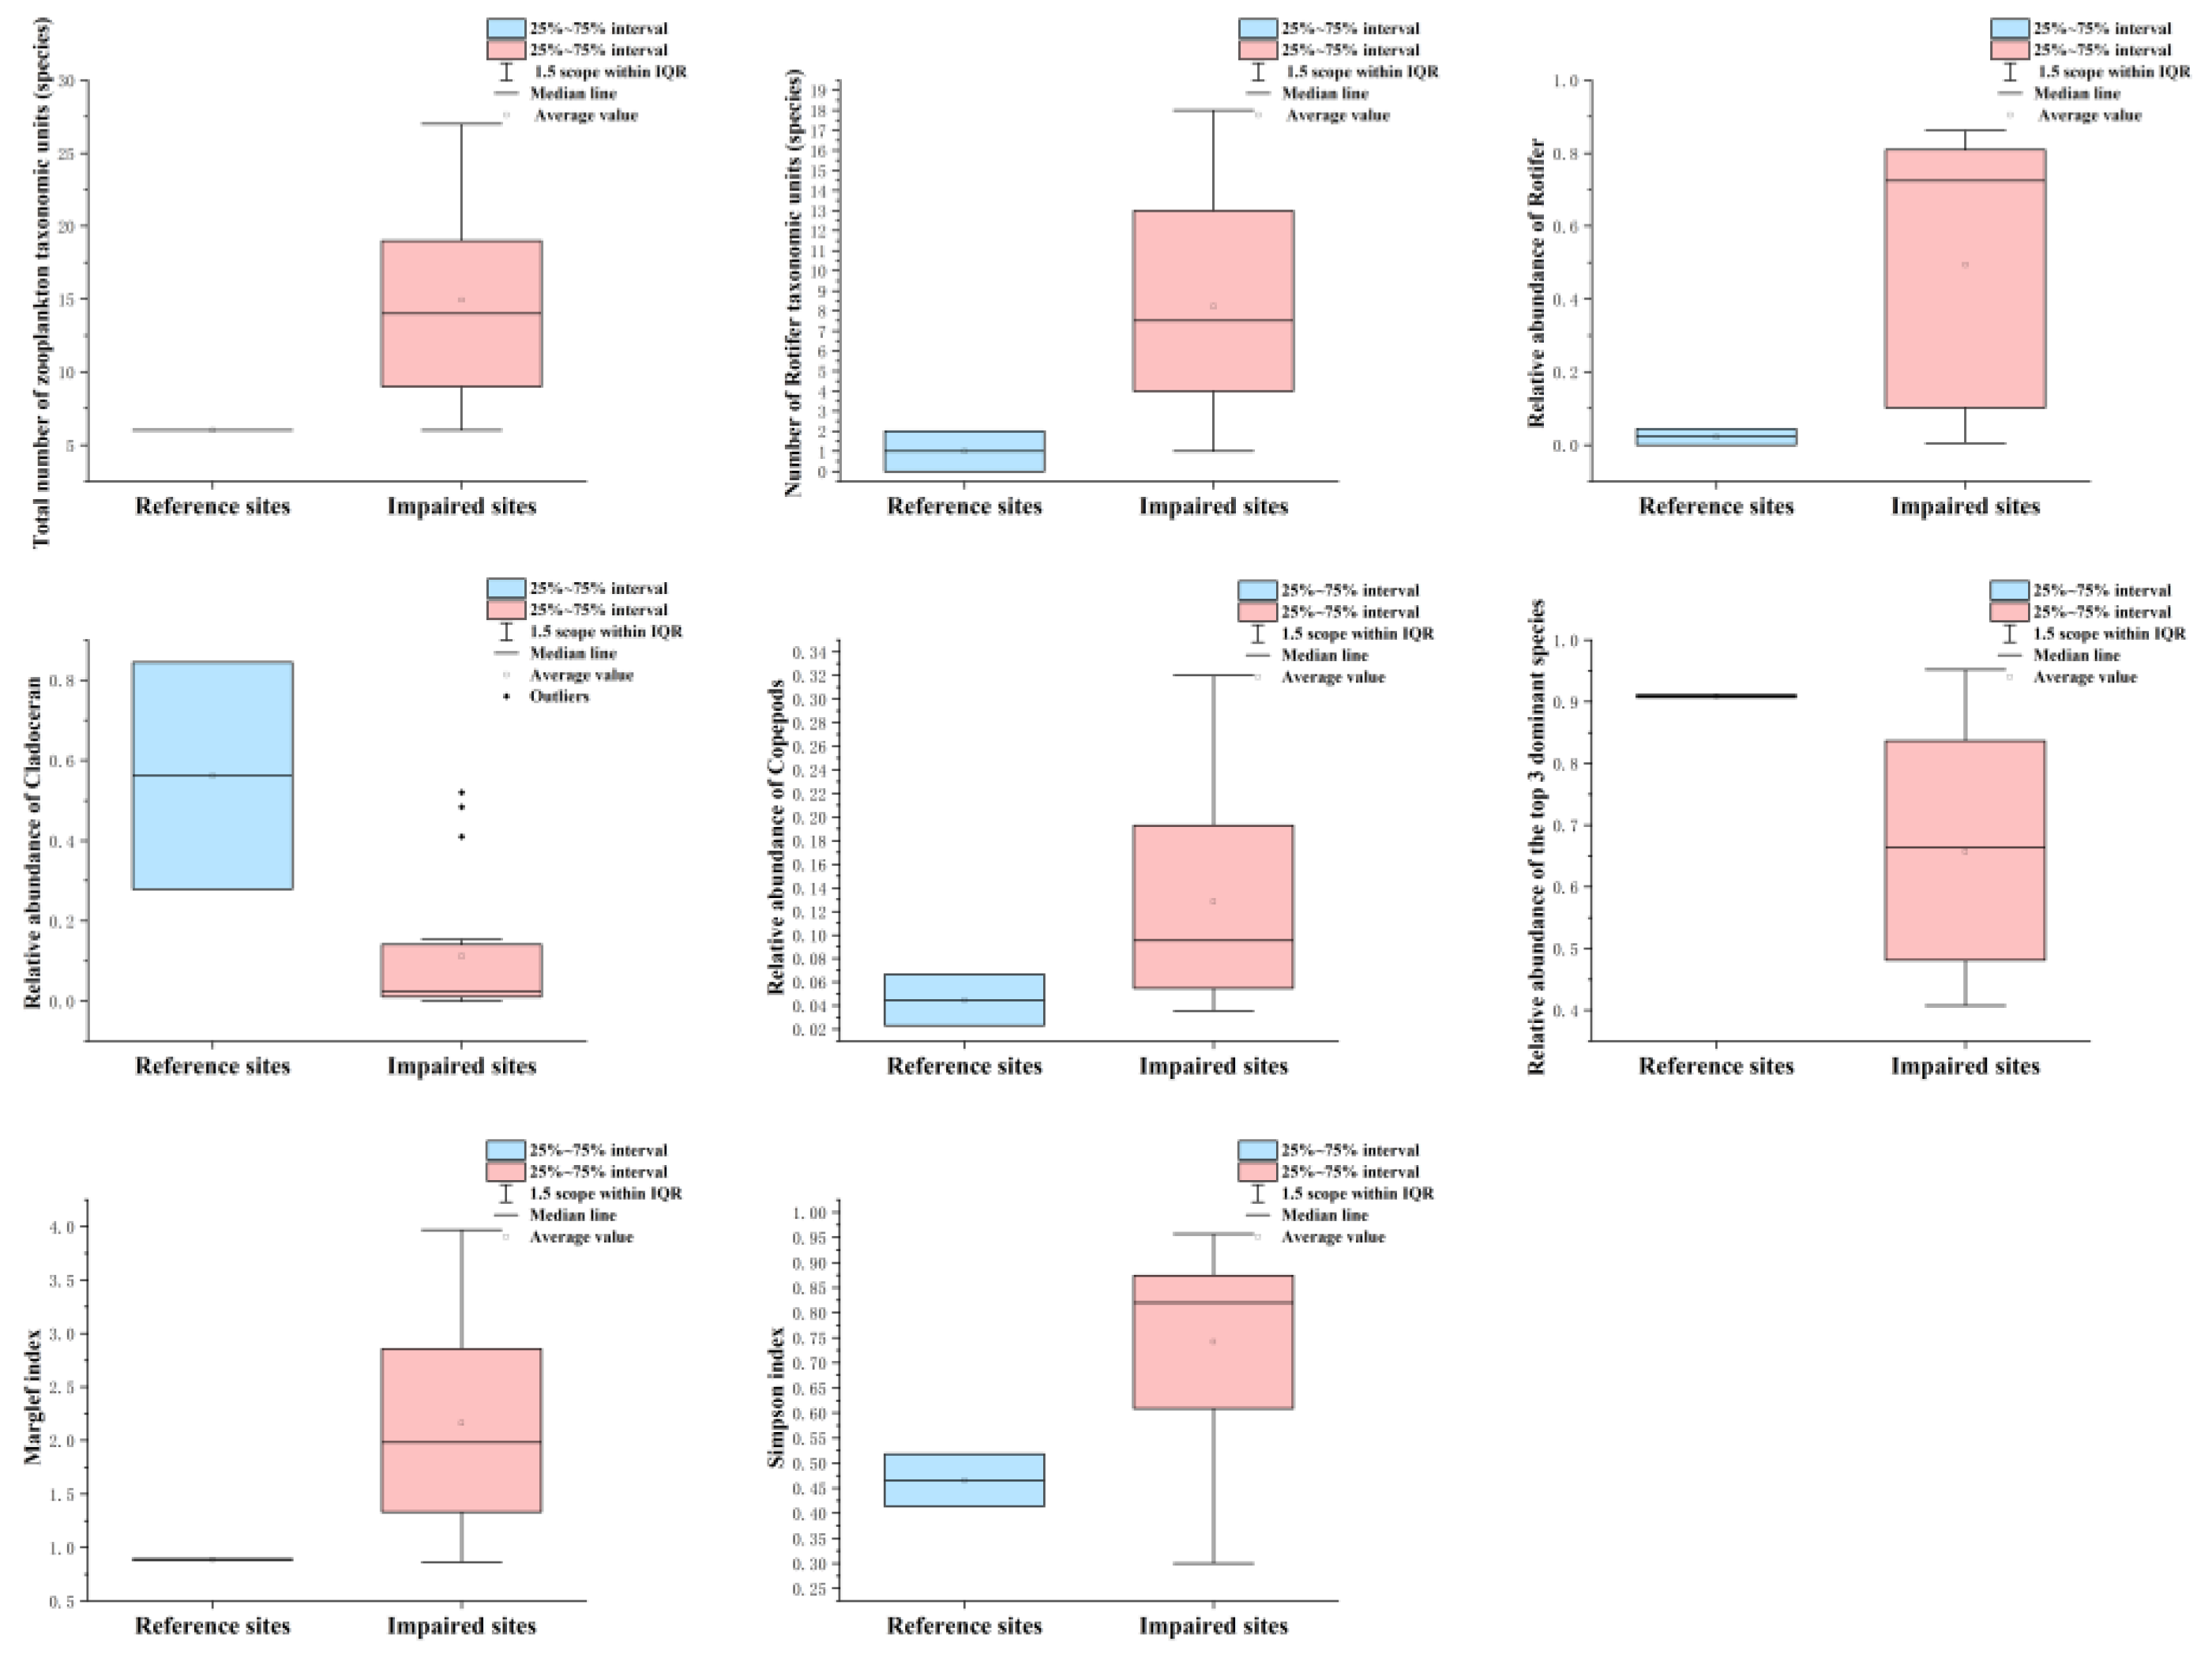
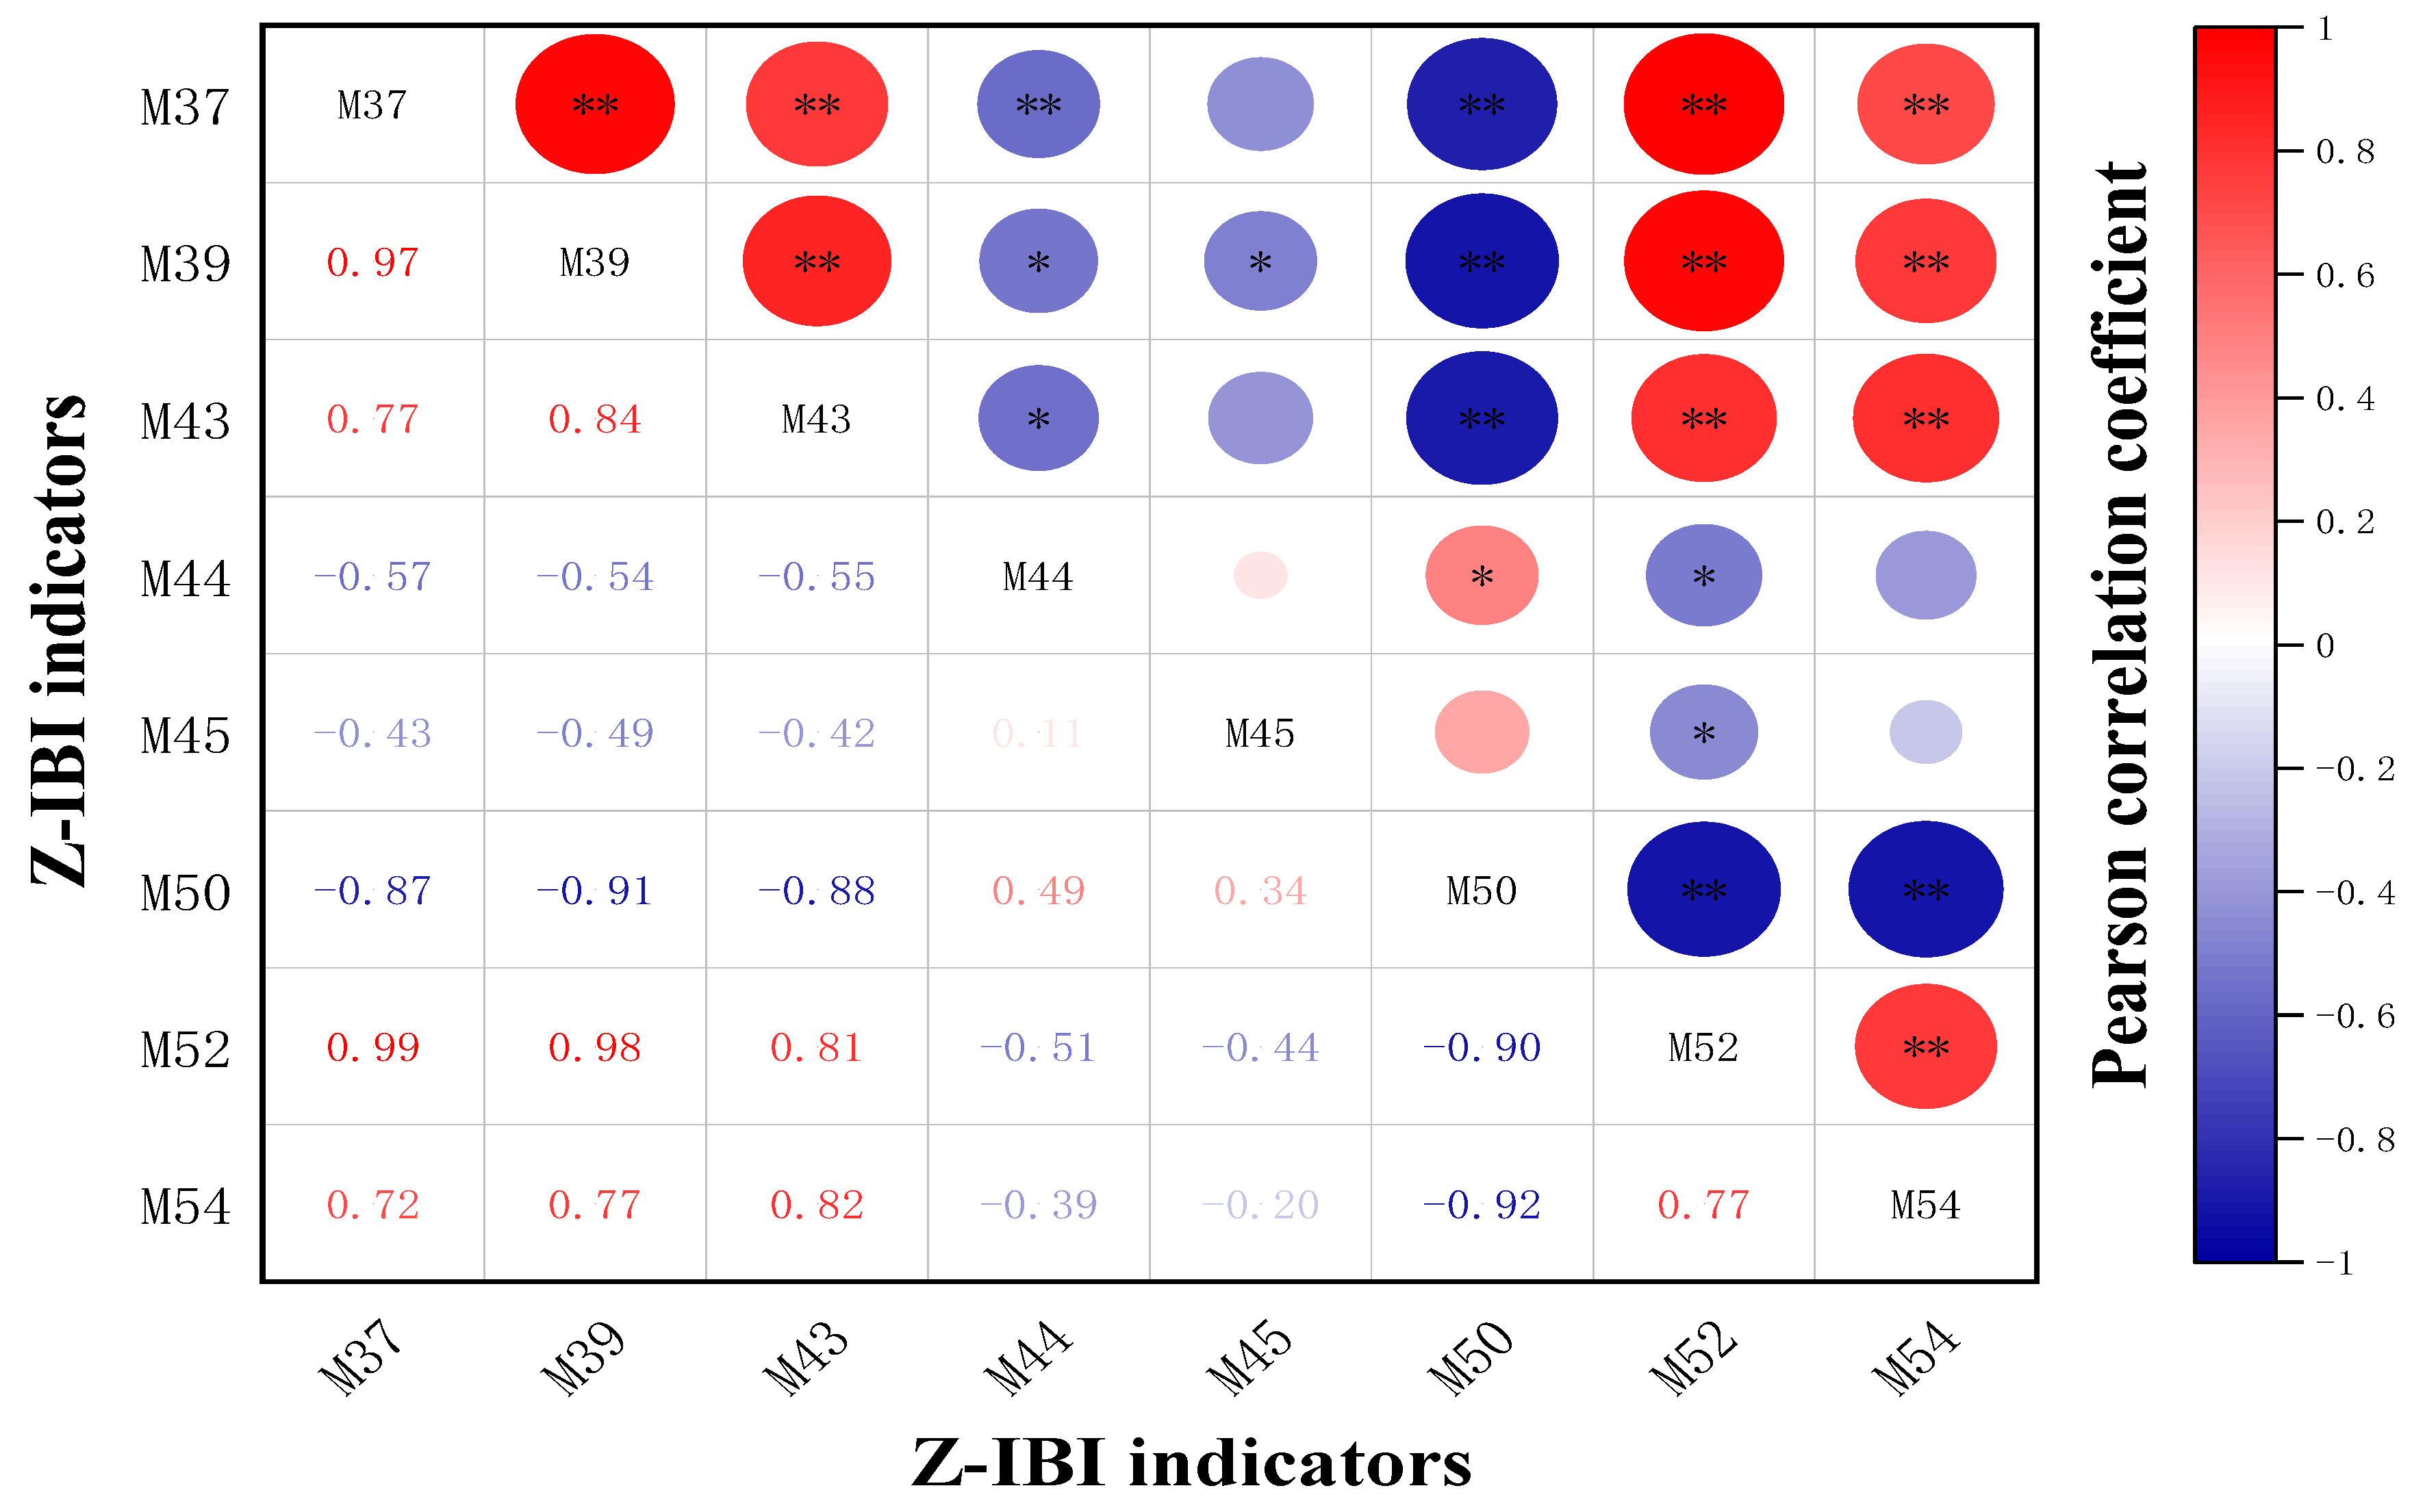
After taking distribution range analysis, discriminatory ability analysis (Figure 7), and correlation analysis (Figure 8), the total number of zooplankton taxonomic units M37, the relative abundance of Copepods M45, the relative abundance of the top three dominant species M50 and Simpson index M54 were finally determined as the indicators for constructing Z-IBI.
3.4.3. M-IBI
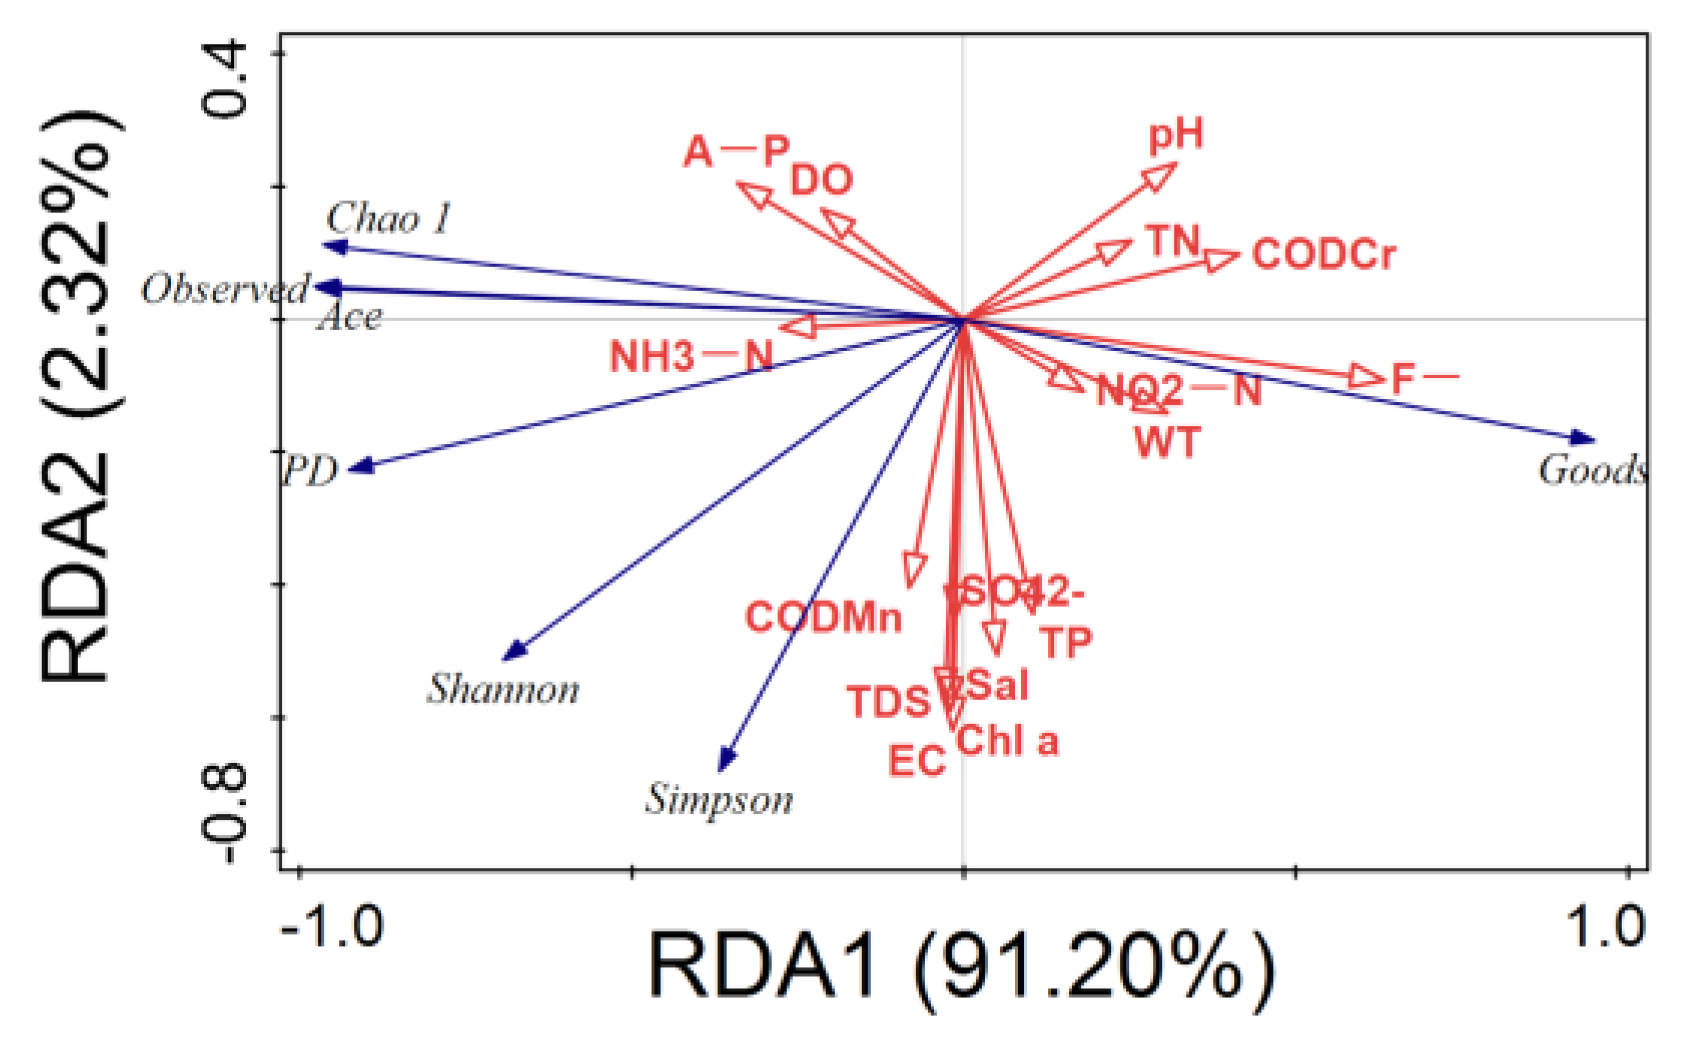
RDA was used to screen the water environment factors that significantly affected microbial diversity. The results showed (Figure 9) that the water environment factors that significantly affected the microbial community diversity were F−, CODCr, TN, NH3-N, and WT (p < 0.05).
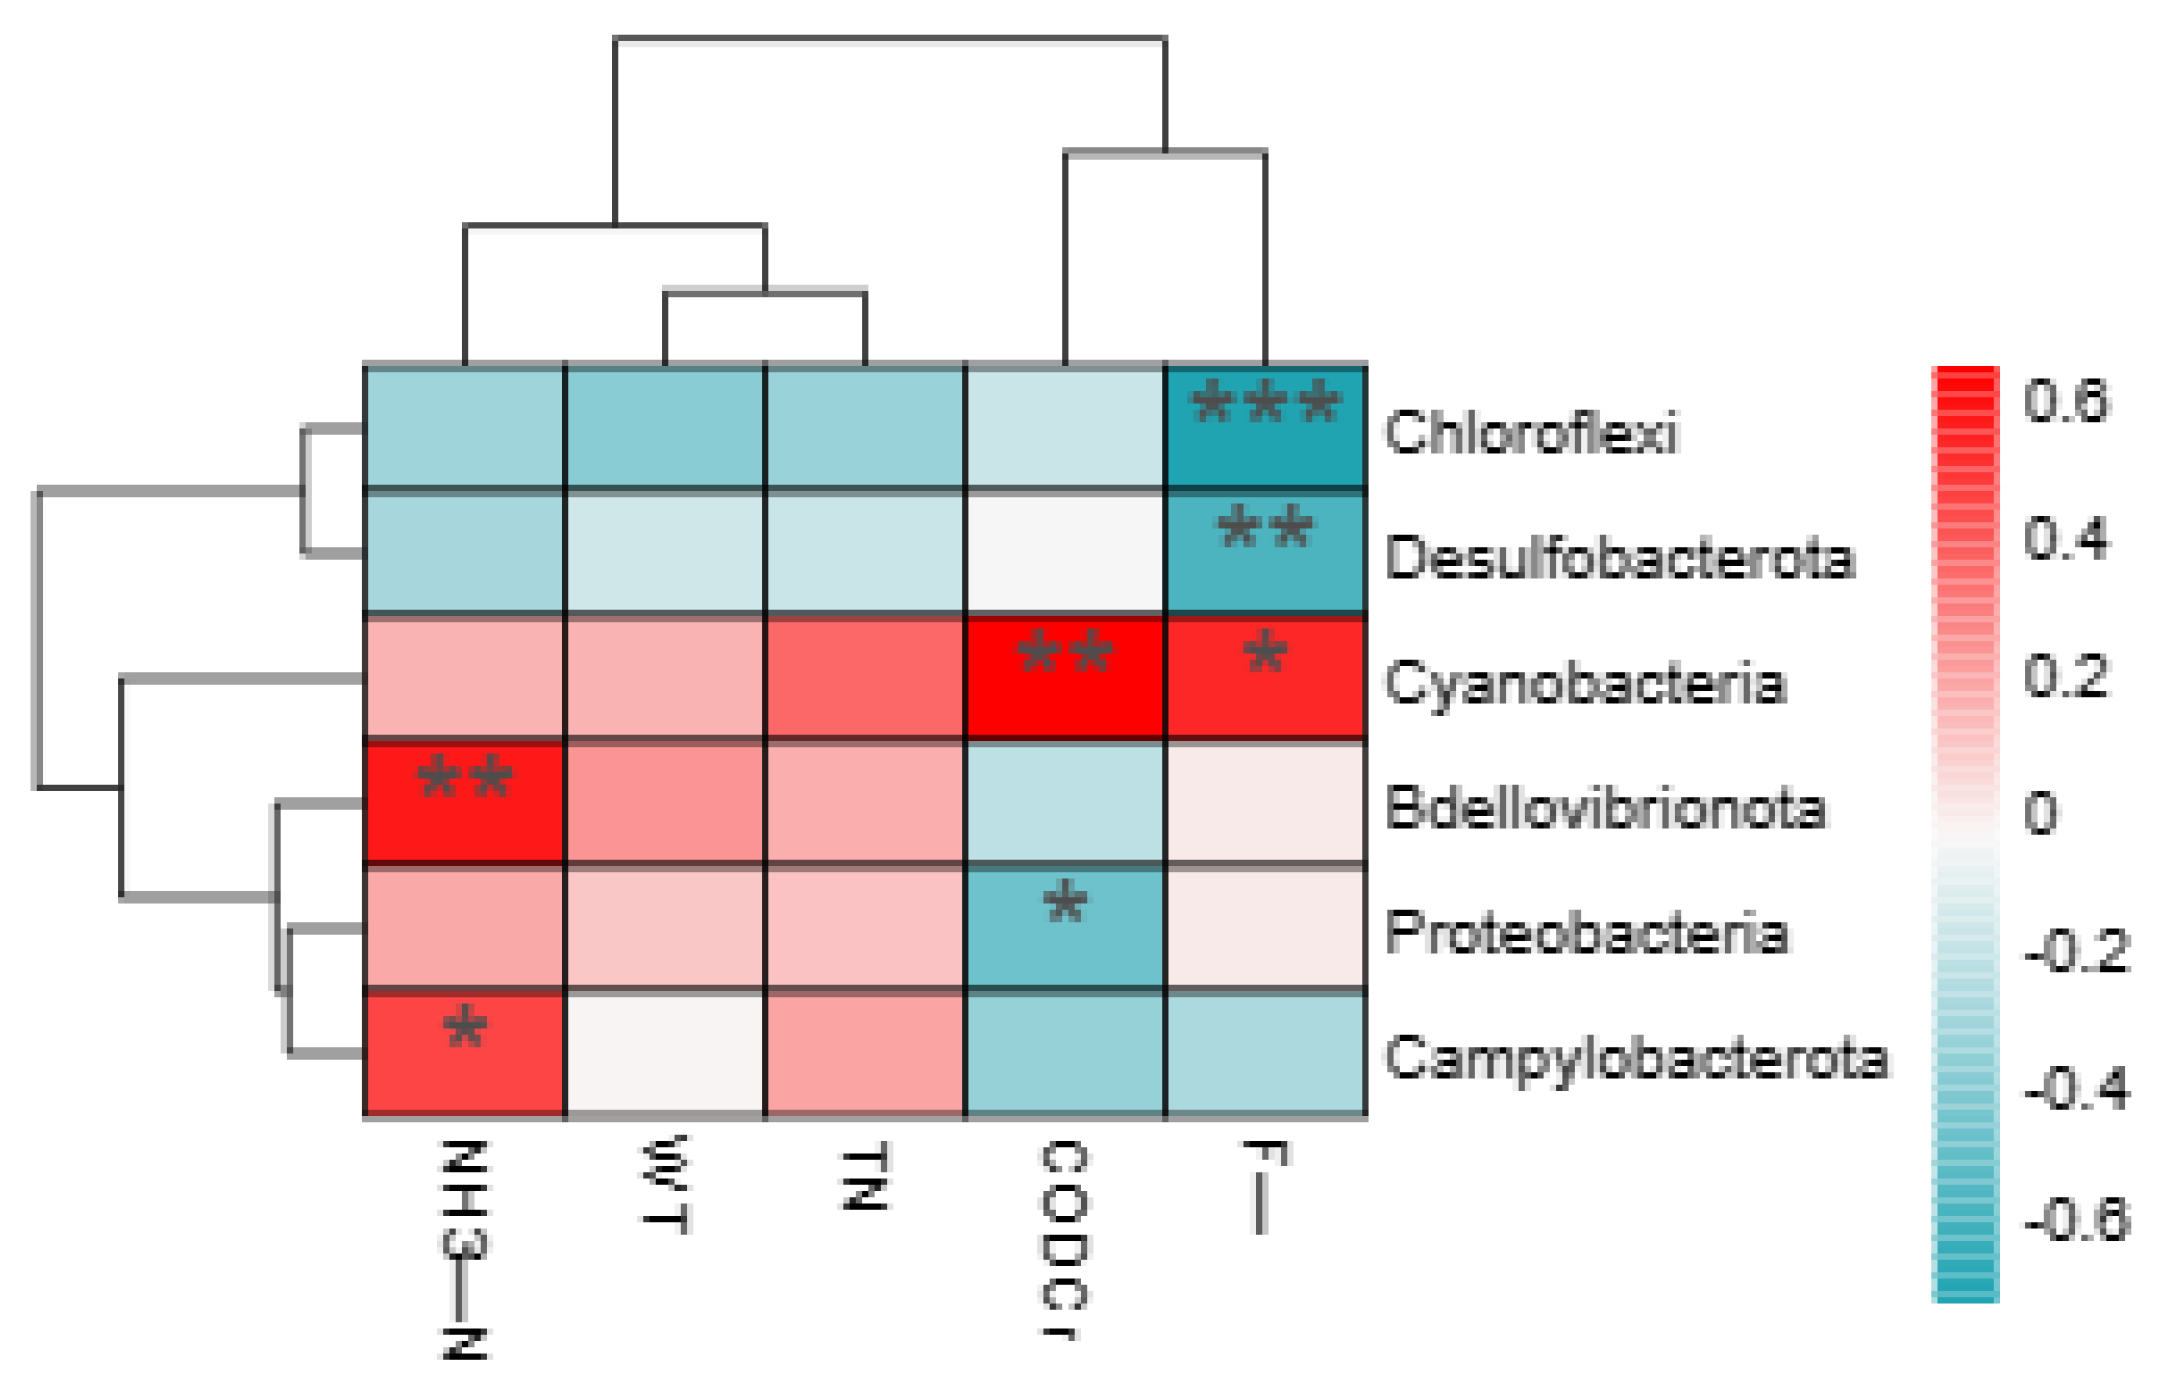
We conducted a Pearson correlation analysis of the relative abundance of major microbial phyla and water environment factors. The results (Figure 10) showed that the relative abundance of Chloroflexi and Desulfobacterota were significantly and negatively correlated with F−; Cyanobacteria were significantly and positively correlated with F− and CODCr; Bdellovibrionota and Campylobacterota were significantly and positively correlated with NH3-N; Proteobacteria were significantly and negatively correlated with CODCr.
32 indicators were selected as candidate indicators (Table 3), including those characterizing the community structure, those characterizing the community quantity, those characterizing tolerant taxa, and the diversity index.
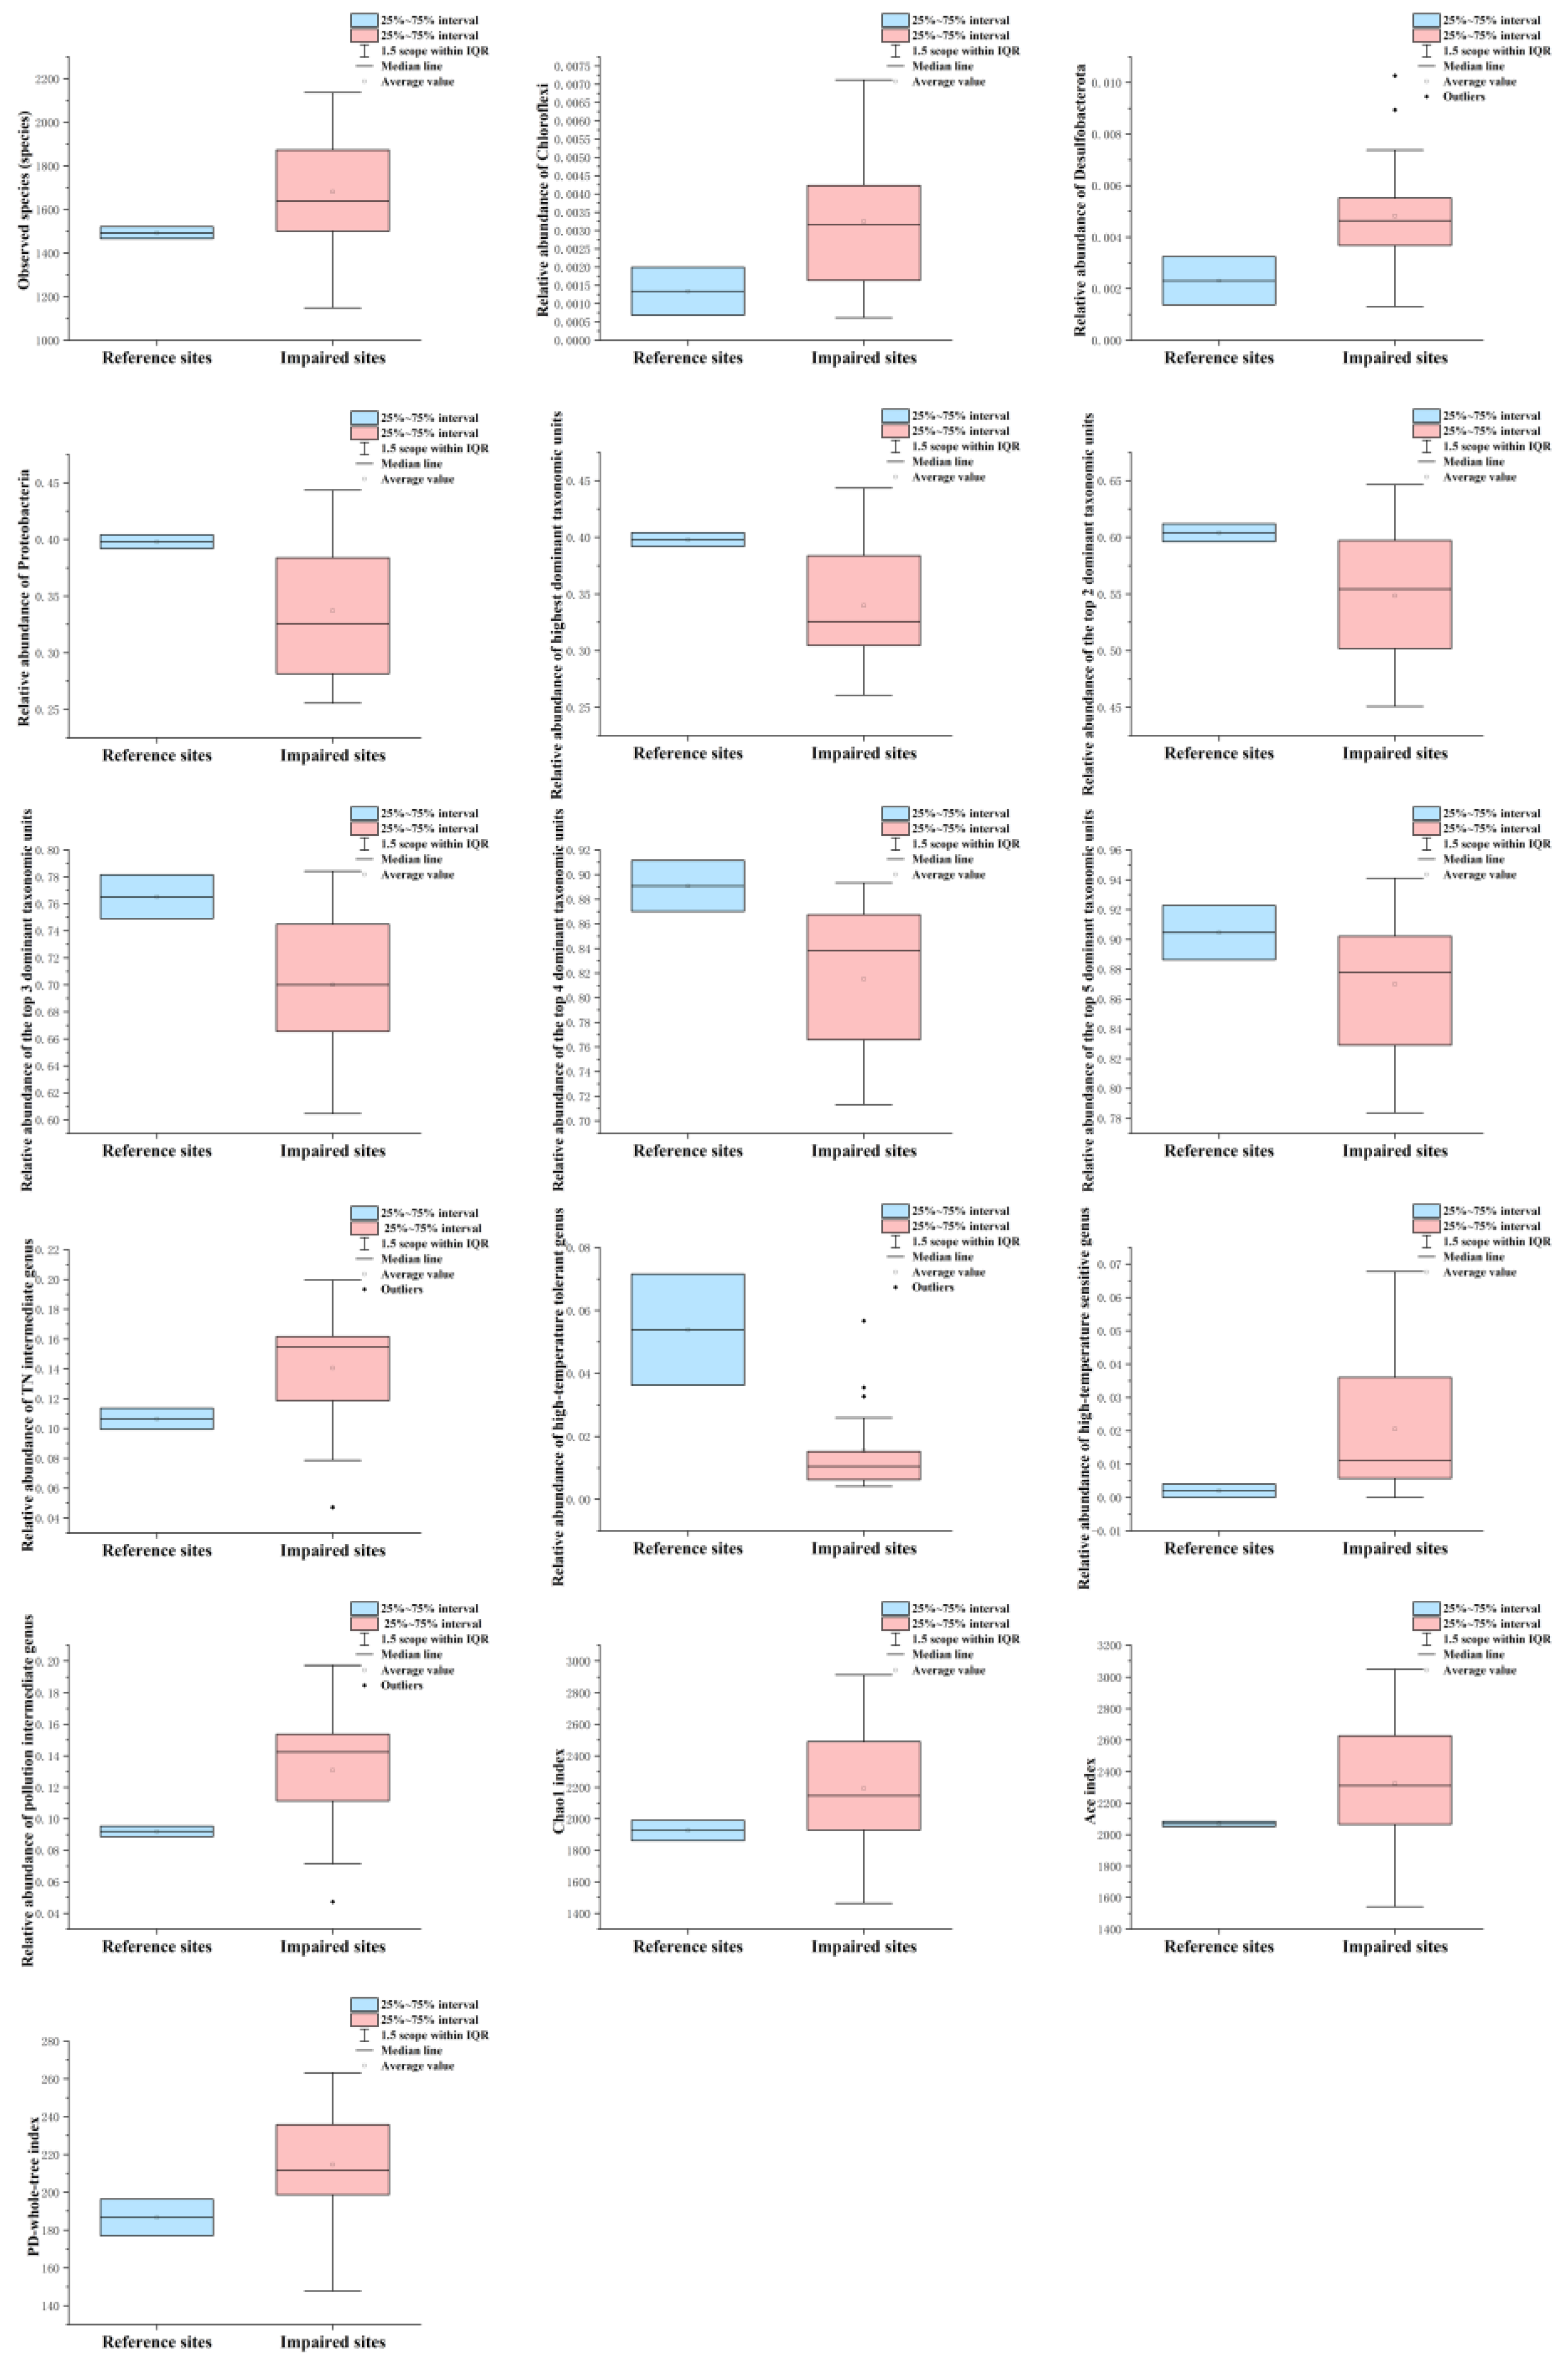
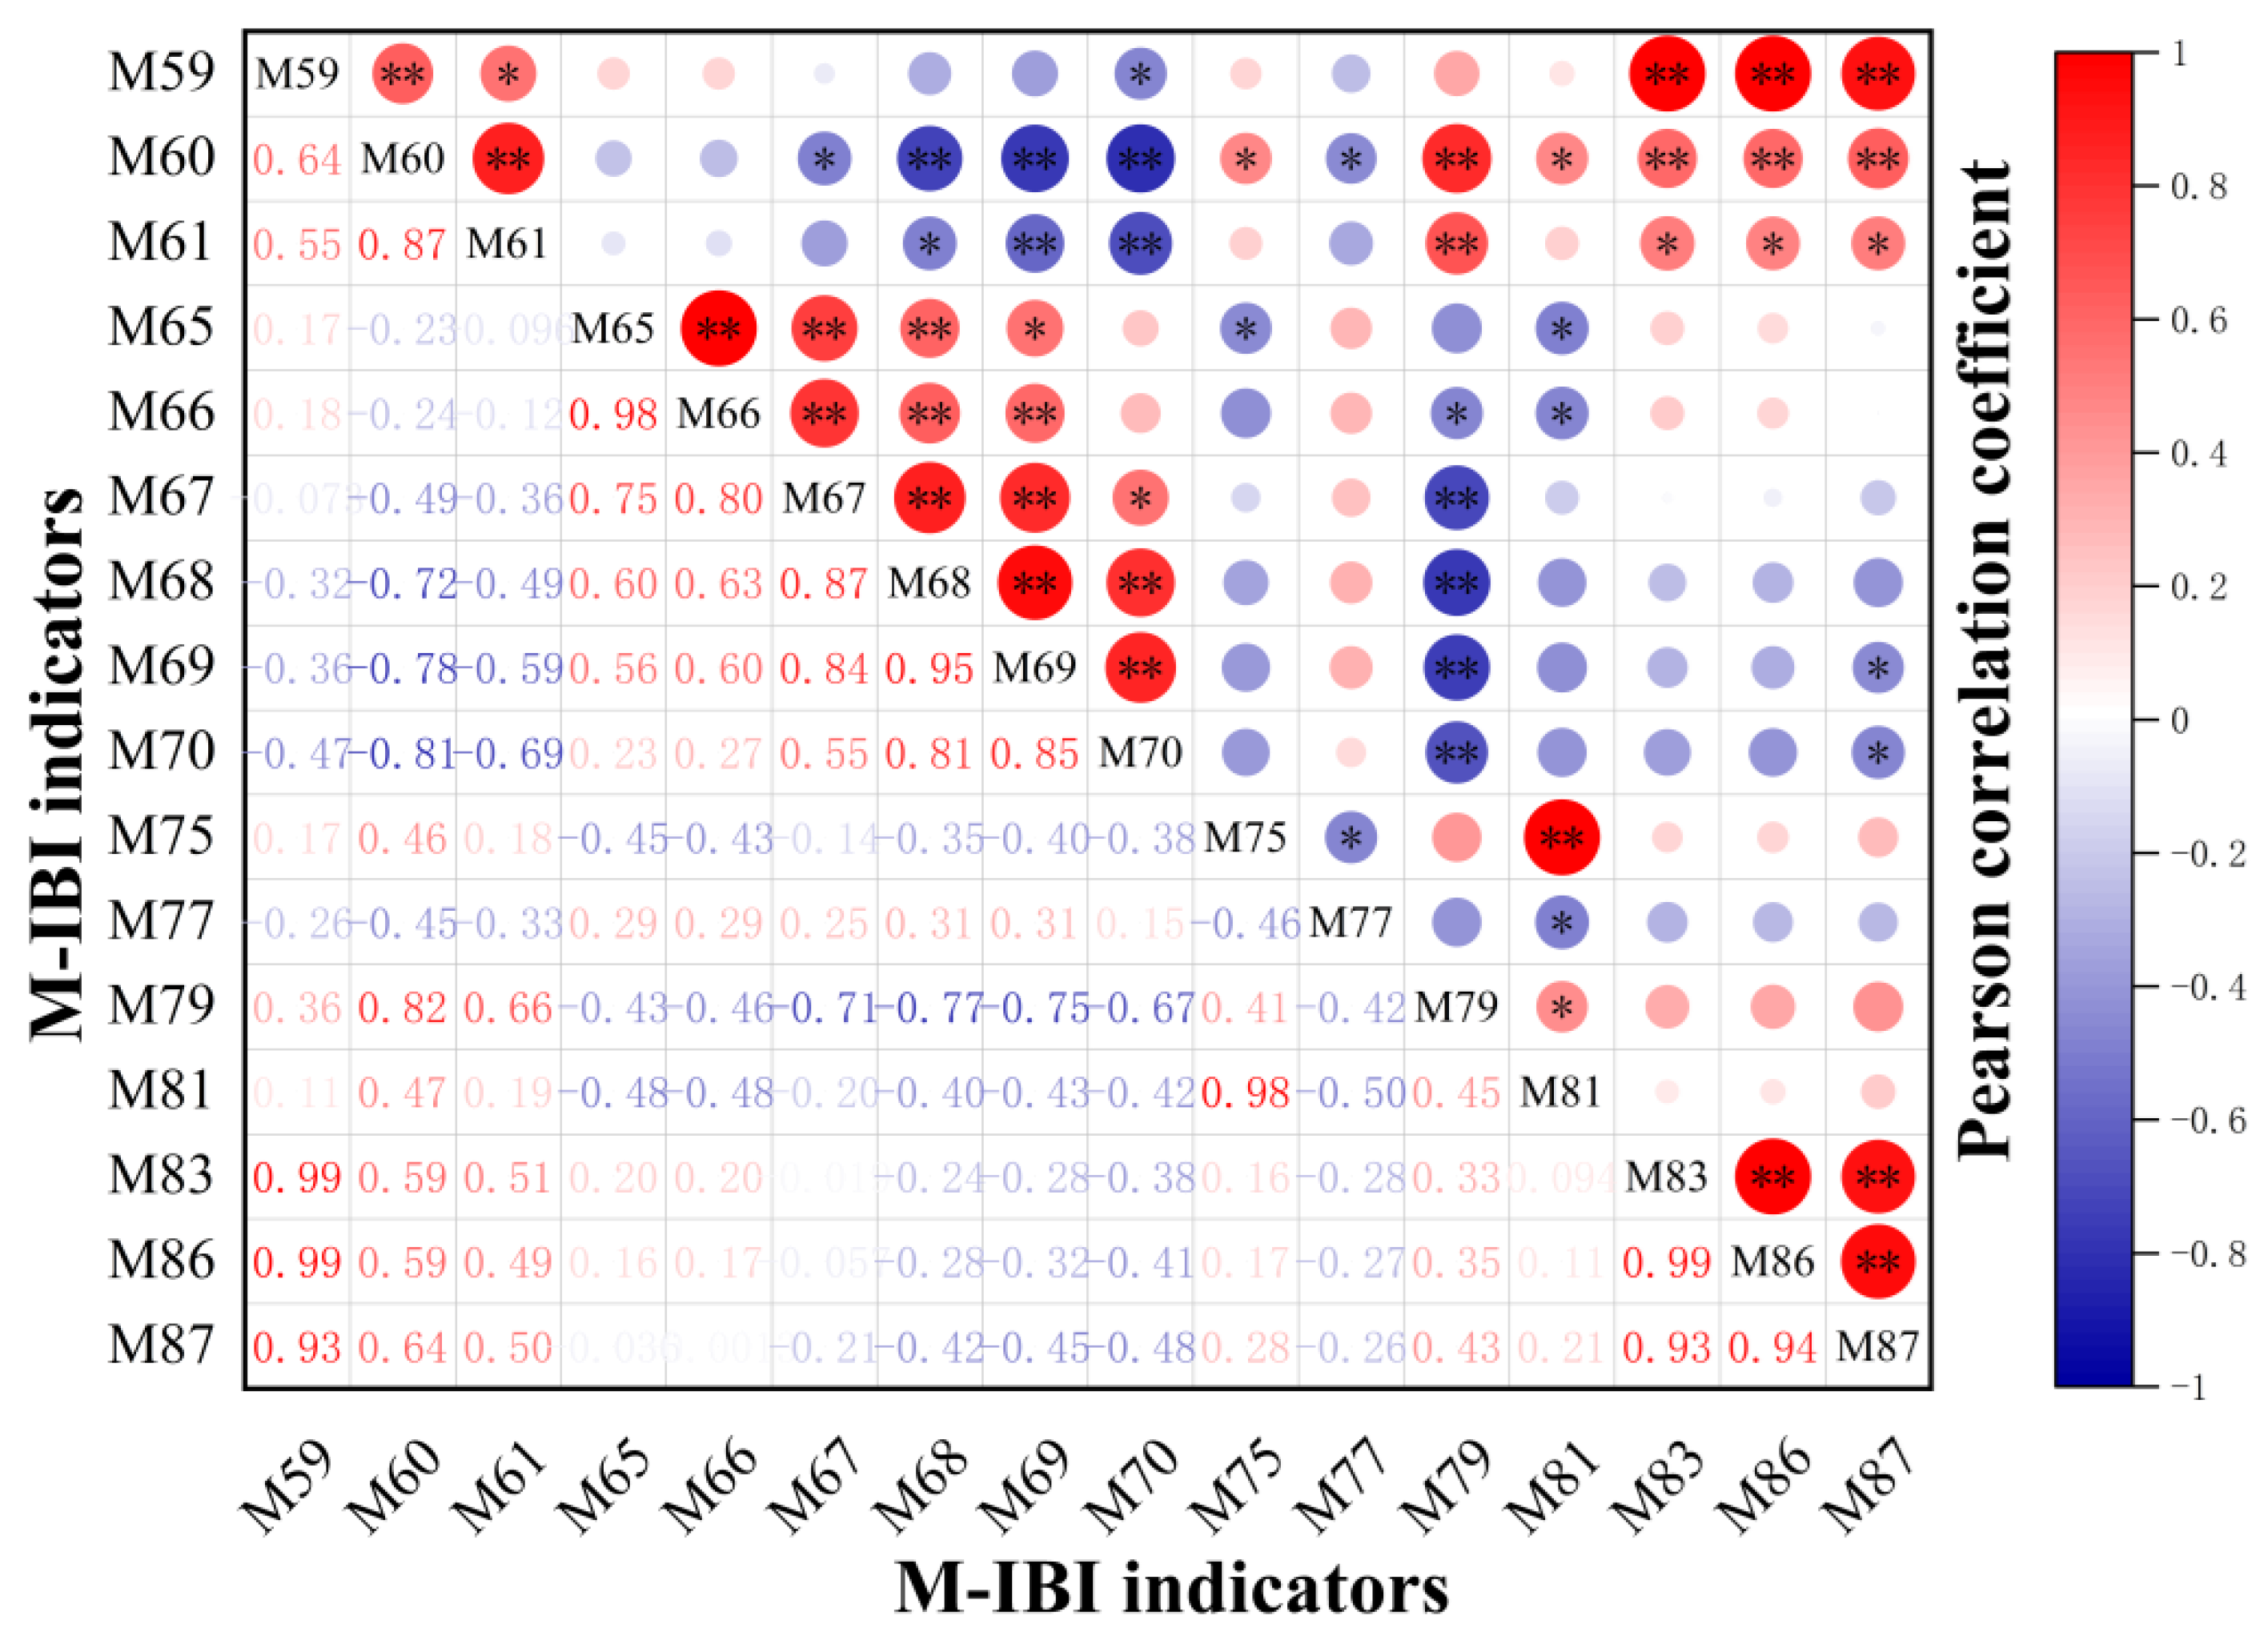
After taking distribution range analysis, discriminatory ability analysis (Figure 11), and correlation analysis (Figure 12), the observed species M59, the relative abundance of Chloroflexi M60, the relative abundance of Proteobacteria M65, the relative abundance of highest dominant taxonomic units M66, the relative abundance of the top 5 dominant taxonomic units M70, the relative abundance of pollution intermediate genus M81, Ace index M86 were finally determined as the indicators for constructing M-IBI.
3.5. Evaluation of Water Ecology Health Based on IBI
3.5.1. P-IBI Evaluation
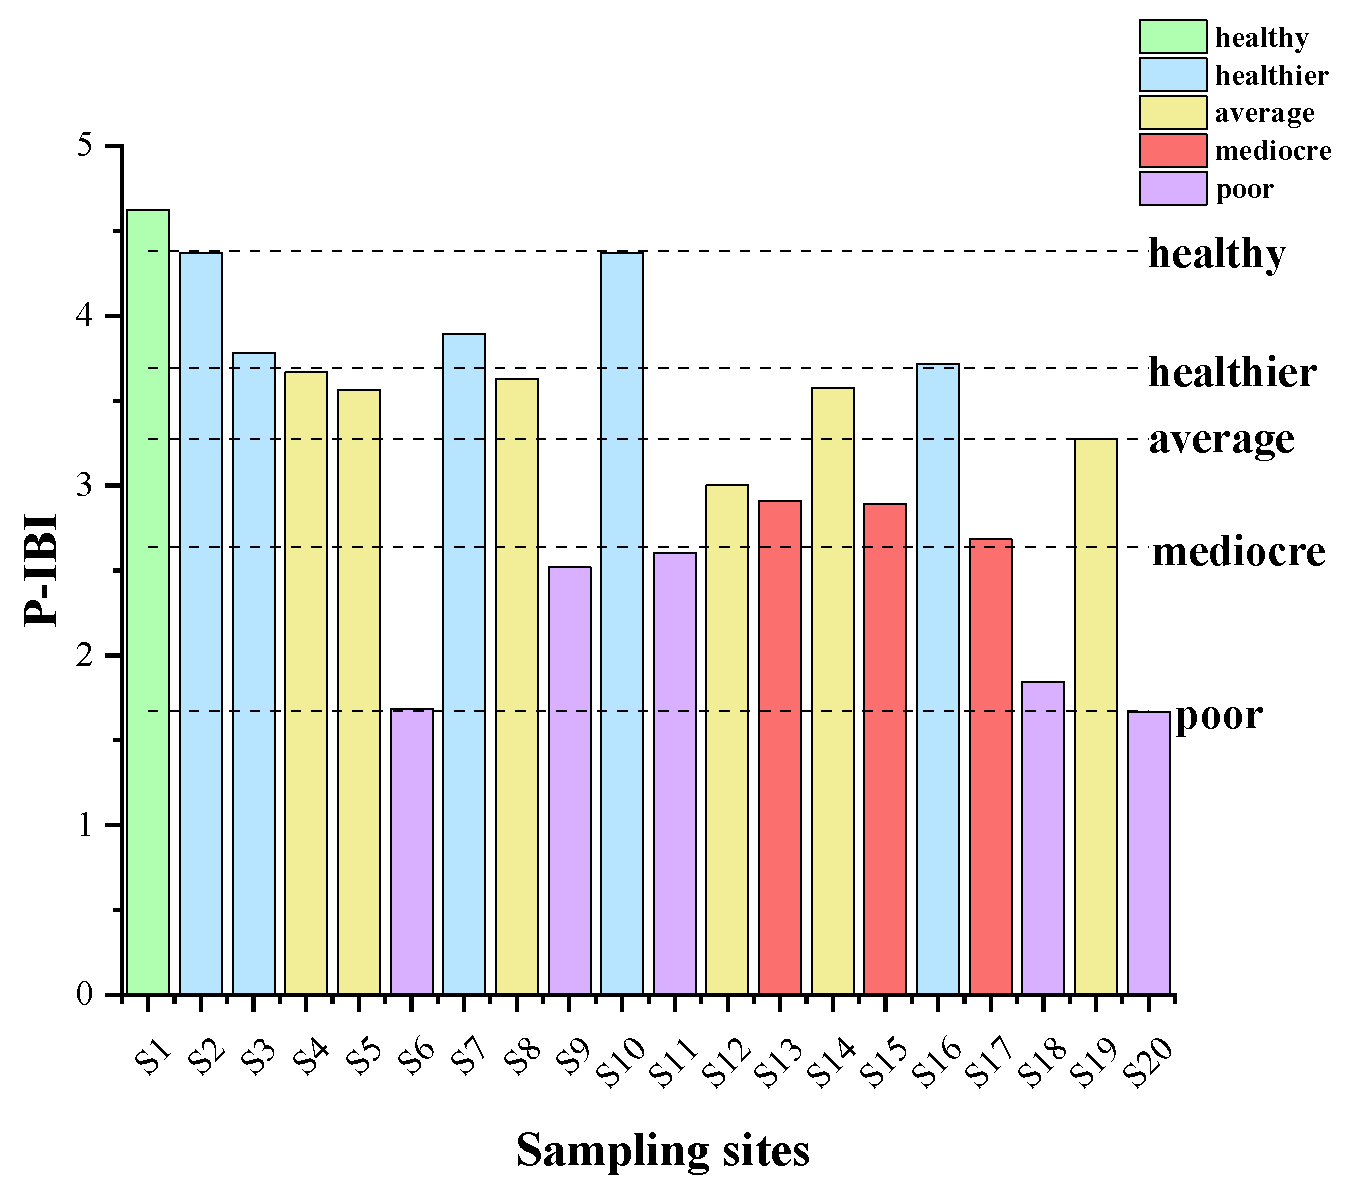
P-IBI was used to evaluate the water ecological health of each sampling site in the Diannong River, and the results (Figure 13) showed that S1 was at a healthy level; S2, S3, S7, S10, and S16 were at a healthier level. The sites with mediocre and poor level were S6, S9, S11, S13, S15, S17, S18, and S20; and the rest of sites were at an average level.
3.5.2. Z-IBI Evaluation
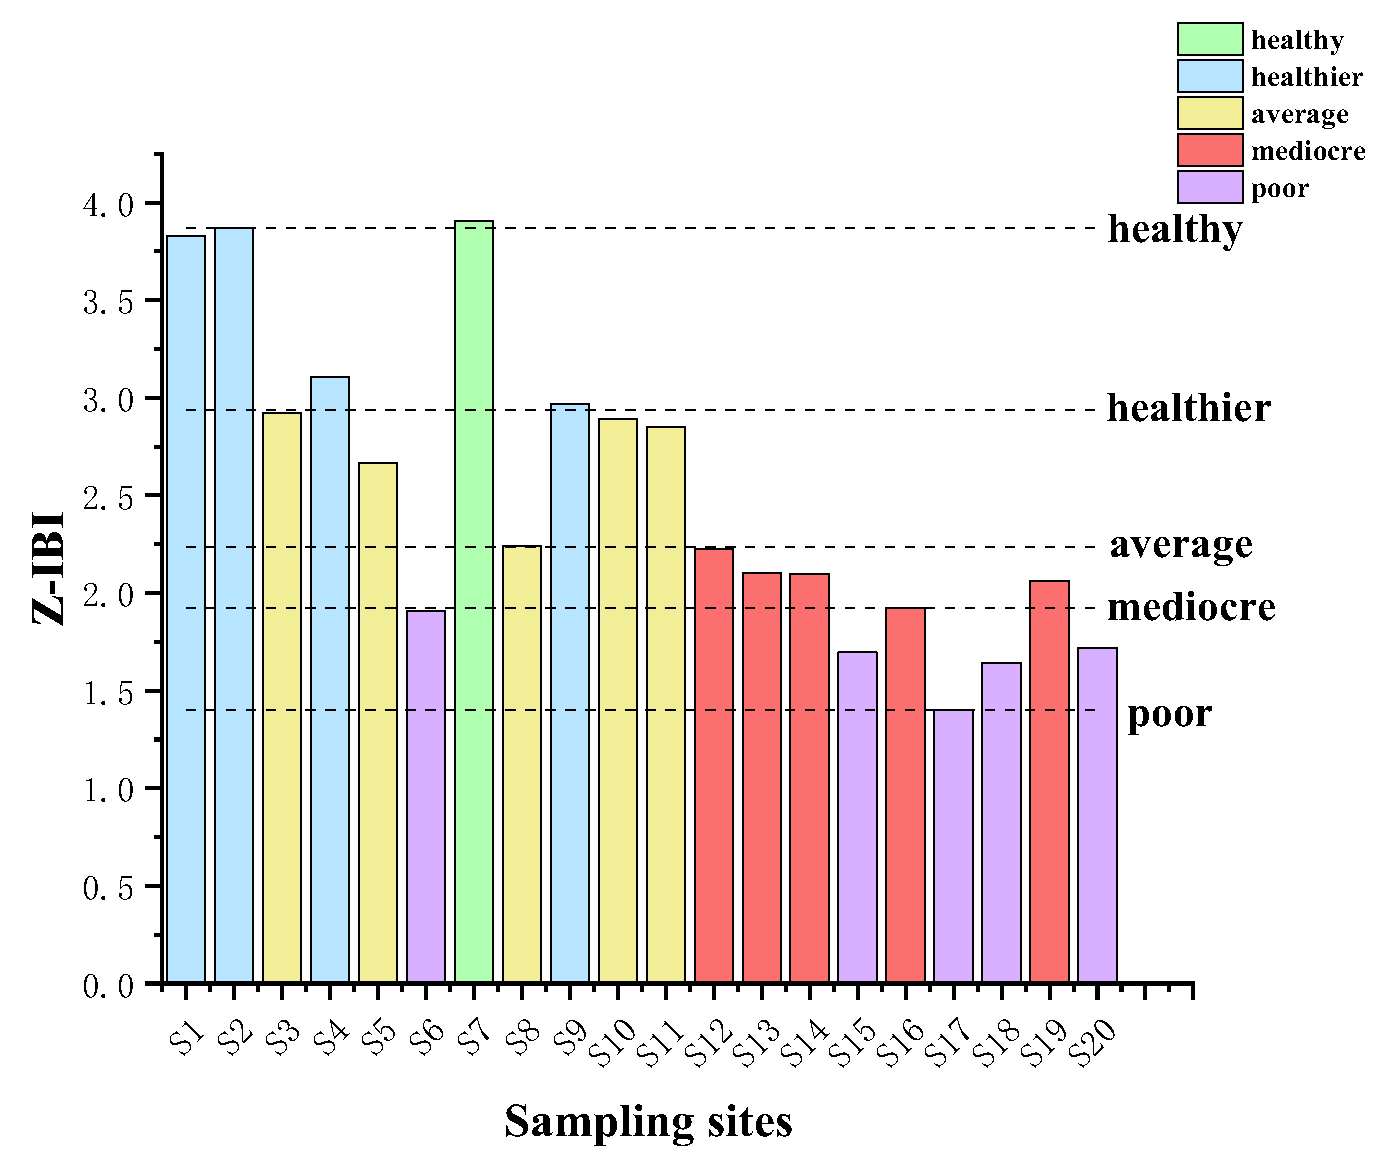
Z-IBI was used to evaluate the water ecological health of each sampling site, and the evaluation results (Figure 14) showed that only S7 was at a healthy level; S1, S2, and S9 were at a healthier level; S6 and S12—S20 were at a mediocre or poor level, and the rest of the sampling sites were at an average level.
3.5.3. M-IBI Evaluation
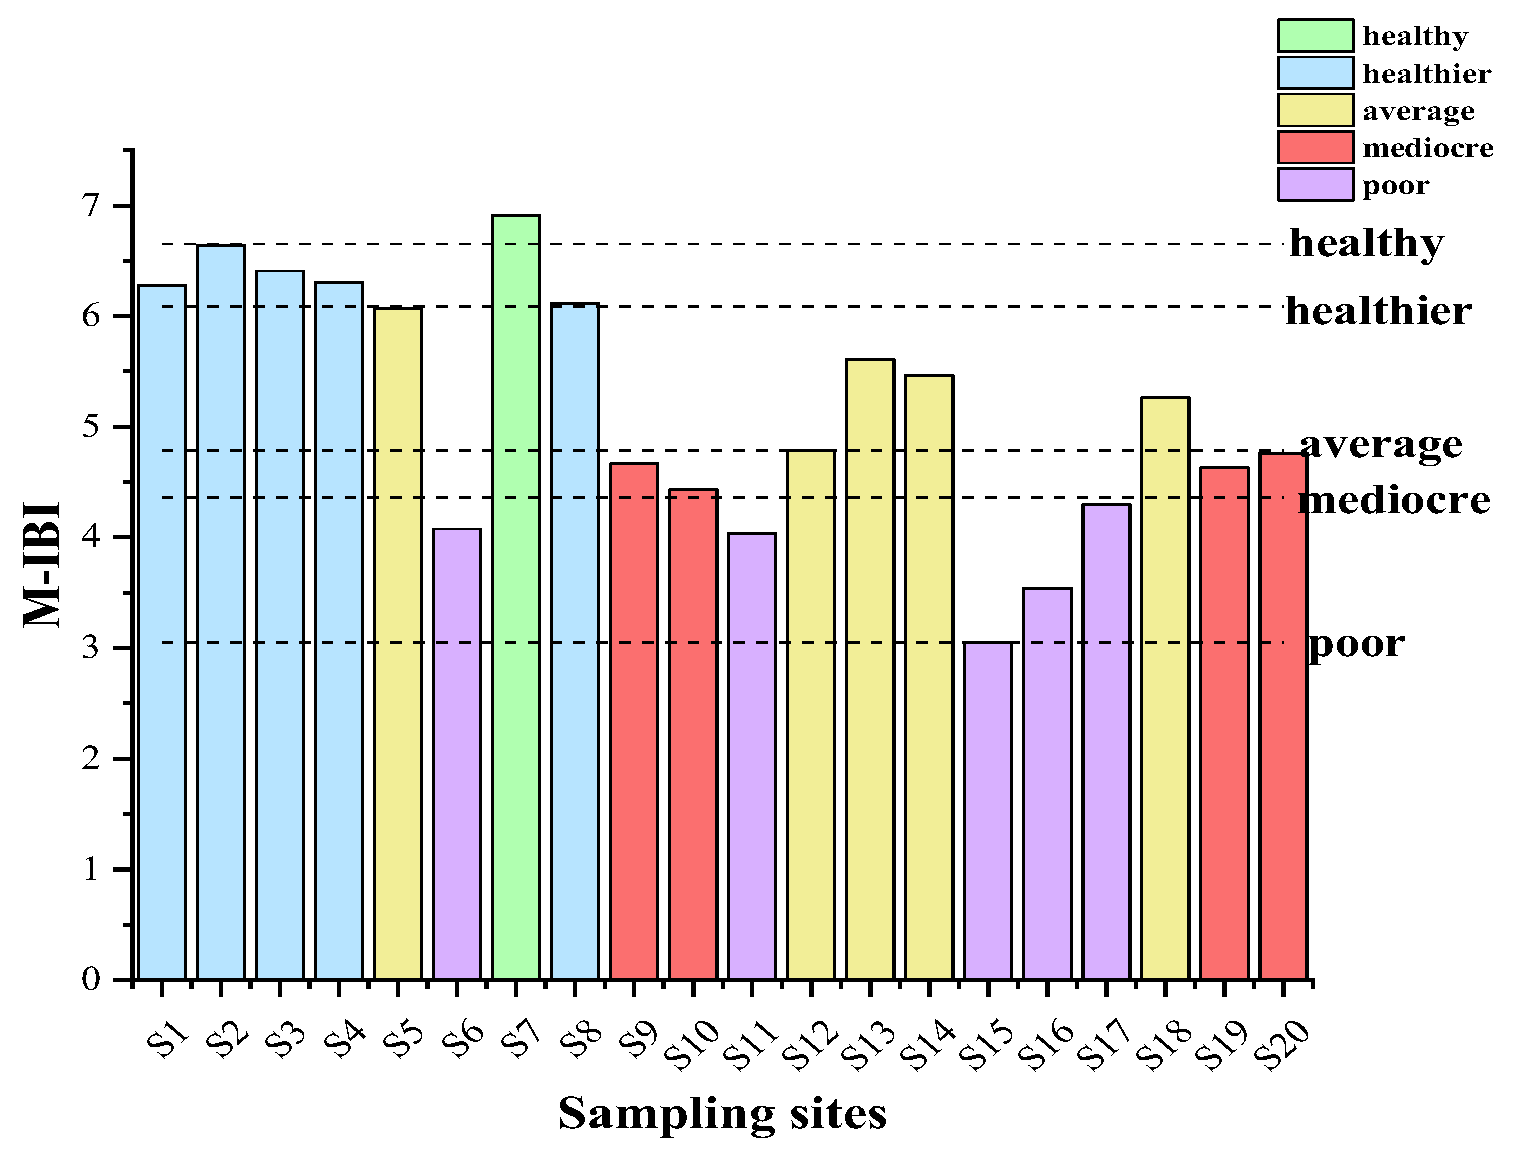
M-IBI was used to evaluate the water ecological health of each sampling site, and the results (Figure 15) showed that S1–S4, S7–S8 were at healthy and healthier levels; sites with mediocre and poor levels S6, S9, S10, S11, and S15, S16–S17, S19–S20; the rest of the sites were at an average level.
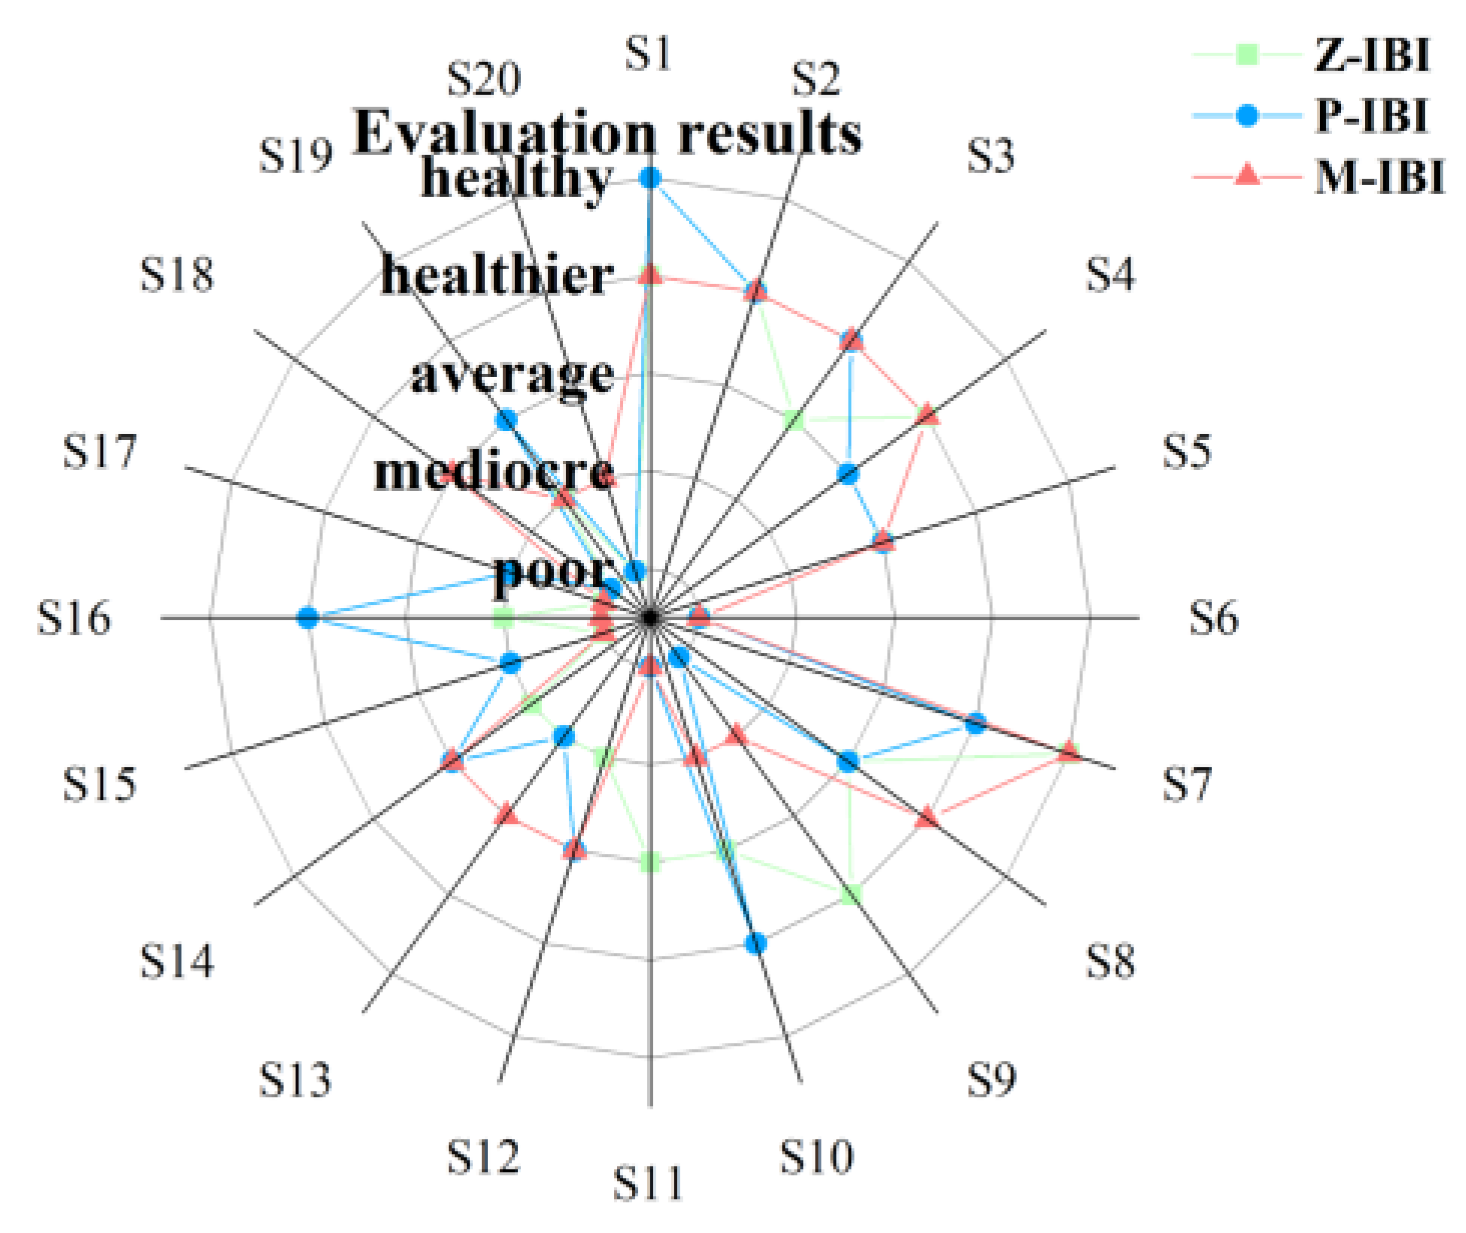
The comparison results of P-IBI, Z-IBI, and M-IBI evaluations (Figure 16) showed that among 20 sampling points of the Diannong River, the evaluation results of the upper reaches of the Diannong River, i.e., DNH1 and DNH3 areas (S1–S5, S7–S8), were same, and the evaluation results of all sample points in this area were basically at a healthy or healthier level. The evaluation results of the middle reach of the Diannong River, i.e., DNH2 and YH regions (S6, S9–S11, S15–S20), were quite different, with Z-IBI evaluating S9 as healthier, P-IBI and M-IBI evaluating poor and mediocre, respectively; Z-IBI evaluated S10 as average, P-IBI evaluated S10 as healthier, and M-IBI evaluated S10 as poor; P-IBI evaluated S16 as healthier, Z-IBI and M-IBI evaluated S16 as mediocre and poor, respectively; M-IBI evaluated S18 as average, Z-IBI and M-IBI evaluated S18 as poor; the rest of the points were basically at a mediocre and poor level. The evaluation results of the lower reaches of the Diannong River, i.e., the DNH4 area (S12–S14), were the same, being at an average or mediocre level.
3.6. Relationship between Aquatic IBI and Water Body Physicochemical Factors
3.6.1. Stepwise Regression Analysis of Aquatic IBI and Water Environment Factors
The stepwise regression equations of aquatic IBI and water environment factors were established, and the correlation coefficients of the three equations (Table 4) were all greater than 0.7, and the D-W statistics tended to be close to 2 and the residuals satisfied the normal distribution, so the regression equations were valid [32]. The water environment factors selected in the P-IBI stepwise regression equation were WT and pH; the water environment factors selected in the Z-IBI stepwise regression equation were TDS, WT, and TN; the water environment factors selected in the M-IBI stepwise regression equation were F− and EC.
3.6.2. Path Coefficient Analysis of Aquatic IBI and Water Environment Factors
The path coefficient analysis results (Table 5, Table 6 and Table 7) showed that Z-IBI was directly influenced by TDS, followed by TN and WT, in which TDS showed a negative effect; P-IBI was directly influenced by WT, followed by pH; M-IBI was influenced by F−, followed by EC, in which EC showed a negative effect.
4. Discussion
4.1. Development of Aquatic IBI in the Diannong River
Many countries and regions have used IBI to evaluate the health of impaired or degraded water ecosystems [33,34,35]. The advantage of IBI is that IBI consists of multiple indicators and can avoid the occurrence of extreme biases that may be caused by a single indicator compared to the evaluation of water ecological health by a single biological indicator [36]. At the same time, the IBI, which consists of multiple indicators, complements the habitat conditions indicated by a single indicator and indicates multiple sources of aquatic ecological stress in the study area [37].
The selection of reference sites, which directly affects the selection of IBI indicators and the final evaluation results [3], is the basis for the development of aquatic IBI. There is no unified standard for the selection of reference points. Experts generally believe that it is reasonable to combine the physical and chemical indicators of water bodies with the characteristics of human interference such as regular fishing, transportation, farming, and industrial discharge with water bodies [38,39,40,41]. In this study, the quantitative water quality evaluation results, and habitat composite index, which were constructed by using the intensity of human activities, substrate type, vegetation cover, river flow, the degree of interference from hydraulic structures et al. as indicators, were used as the criteria for selecting reference sites, and the sites with higher habitat composite index and higher comprehensive water quality score were selected as reference sites. The accuracy of this selection criterion was also verified by the fact that the IBI evaluation results at the reference sites were often higher than those at the impaired sites.
Compared with the literature on fishery and macroinvertebrate IBI [42], there is less literature on P-IBI and Z-IBI. The main reason for this is that phytoplankton is susceptible to environmental changes in aquatic ecosystems and the dominant species are not fixed throughout the year in all seasons, so the studied indicators of phytoplankton can only reflect the health of the water ecosystem for a short period time, and phytoplankton are the main food source for zooplankton [43], fluctuations in the structural characteristics of phytoplankton inevitably affect the ecological structural characteristics of zooplankton. However, phytoplankton is almost the only indicator species of eutrophication in water bodies such as water blooms [3], and the development of P-IBI for ecological health assessment of water bodies is an important method to determine whether eutrophication is occurring in water bodies. In this study, among the 36 candidate indicators for constructing P-IBI, 5 indicators were selected in terms of community structural characteristics, community species composition, and functional type to construct P-IBI, and most of them were community structural characteristics of indicator species such as Cyanobacteria, Green Algae, and toxin-producing algae, mainly because they could better reflect the difference in ecological health level between the reference sites and the impaired sites, and most of the other candidate indicators were less different in these sites. Different water environmental factors can affect the growth, structure, and abundance of zooplankton, so some zooplankton can be effective as index species for water pollutants. In this study, among the 20 pre-selected indicators for constructing Z-IBI, 4 indicators were finally selected from the community structural characteristics, community species composition, biomass, and diversity index to construct Z-IBI, and the copepod community structural characteristics were dominant among the 4 indicators. The main reason is that Rotifers have a small size, fast development, and strong reproductive ability compared with large zooplankton such as Cladoceran and Copepods, and filter-feeding fish such as silver carp and bighead carp preferentially select large zooplankton for feeding, making Rotifers easily become the dominant species at each sampling site [44], so the structural characteristics of Rotifer communities do not change significantly among sampling sites. On the other hand, Copepods and Cladoceran are more sensitive to changes in the physical and chemical characteristics of water bodies such as WT, pH, and nutrients than rotifers, and can more accurately reflect the environmental quality of the study area as indicator species [45].
Chloroflexi and Proteobacteria among the candidate phylum screened for the development of M-IBI are susceptible to human activities [46]. In this study, 7 indicators were selected from 32 candidate indicators for constructing M-IBI in terms of community structural characteristics, community species composition, tolerant taxa, and diversity index to finally construct M-IBI. Compared to the indicators of P-IBI and Z-IBI, the number and variety of indicators constituting M-IBI are higher, indicating that aquatic microorganisms are more indicative and representative of the water ecology than phytoplankton and zooplankton.
For the calculation of IBI, the more mature methods are the 3-point method, the 4-point method, the ratio method, etc. Many experts and scholars have concluded that the use of the ratio method and the 95% quantile as the health score can more accurately reflect the actual situation of the study area [9,14,47], this method was also used to obtain the IBI in this study, and the results of IBI evaluation at each point were consistent with the results of the analysis of the reference and impaired points. At present, the P-IBI, Z-IBI, and M-IBI are less applied and there is no uniform standard for the selected indicators, especially for aquatic microorganisms, because the current technology does not fully grasp all species of aquatic microorganisms and the function of species composition is still unclear, so the constructed IBI cannot truly represent the biological integrity of the study area. Although this study initially constructed P-IBI, Z-IBI, and M-IBI for the actual situation of Diannong River, Ningxia, it still needs to be improved with the refinement of the study.
4.2. Water Ecological Health Evaluation Based on IBI of Different Aquatic Organisms
The results of all three aquatic IBI evaluations showed that the water ecological health of the upper reaches of the Diannong River, i.e., DNH1 and DNH3, was better, especially the evaluation results of S1, S2 as reference points and S7 had higher scores among the three evaluation methods, mainly because on the one hand there were no drainage ditches around S1 and S2, which had higher water quality scores and higher plankton and microbial diversity. On the other hand, S1 and S2 are reference points, and the scores of each index are larger in the IBI calculation process. S7 is a part of 72 Company Lake, Ningxia, which has a strong self-purification capacity of the water body and no drainage ditch confluence, so the confluence of nitrogen (N) and phosphorus (P) nutrients is inhibited, and the growth of nutrient indicator species such as green algae and Cyanobacteria is inhibited, so the P-IBI and M-IBI evaluation results of S7 are healthy.
There were more points with different results performed by 3 evaluation methods for the middle reaches of the Diannong River, i.e., DNH2 and YH regions. Since the Yonger Main Ditch ran between S9 and S10, the high concentration of N and P nutrients in S9 and S10 caused by irrigation water and domestic sewage promotes the growth of nutrient indicator species such as Cyanobacteria and Green Algae and the biomass of macrozooplankton such as Cladoceran and copepods, which use Cyanobacteria and Green Algae as their main food source in S9, so the Z-IBI evaluation result for S9 was healthier. The structural characteristics of the phytoplankton community varied more significantly with the season, while the sensitivity of the microbial community structure to changes in environmental factors was lower [48]. The reason for the healthier evaluation of S10 by P-IBI may be that the dominant species of S10 in April and October are Diatoms and Euglena, and this phenomenon affects the overall evaluation results throughout the year. The water resources function of the YH area, which is Yuehai Wetland Park, Yinchuan mainly meets the requirements of recreational water and landscape water with large human interference activities which harm the water ecological health of this area, so the evaluation results of this area are mostly mediocre or poor. The reason for the large difference between the P-IBI evaluation results of S16 and the other evaluation results is that seasonal factors lead to a certain lag in the evaluation results which may be similar to that of S10; The result of M-IBI for S18 which differs significantly from other evaluation results is average. Notably, the habitat composite index of S18 was the maximum among all sampling sites in the Diannong River, especially in which the riparian vegetation diversity index scored higher. Since the root exudates of the emergent aquatic plant, especially newborn plants, are the main source of energy and carbon for rhizosphere microorganisms [49], the higher number of water-bearing plants may be the main reason for the higher Z-IBI of S18.
Since the DNH4 area, which is close to the Nuanquan Industrial Park, Shizuishan Eco-Economic Development Zone, Hongguozi Industrial Park, and Huinong Agricultural Products Processing Park [50] downstream of Diannong river is seriously polluted by industrial water, the evaluation results of all 3 indices are average or mediocre.
4.3. Relationship between Aquatic IBI and Water Environmental Factors
Changes in WT have a significant effect on phytoplankton density and dominance and are important factors influencing seasonal changes in phytoplankton [51]. As the main food source for zooplankton, changes in the community structure of phytoplankton are closely related to the growth and reproduction of zooplankton. WT was included in the stepwise regression equation for both P-IBI and Z-IBI, and both had a direct positive effect on P-IBI and Z-IBI, with the positive direct effect of WT on P-IBI being stronger than that of Z-IBI, which is consistent with the findings of existing studies [52,53]. The direct positive effect of WT on P-IBI and Z-IBI is obvious, which is the main reason why P-IBI and Z-IBI do not match the actual situation for some sample points.
TDS indicates the number of dissolved substances dissolved in water. Since changes in land use type affect the changes in organic matter of pollutants discharged into water bodies, there is a significant correlation between land use type and TDS [54]. The Diannong River runs through Yinchuan City and Shizuishan City, passing through many different land use types such as urban land, agricultural land, and forest land during the period, with large variations in TDS. The results of this study showed that TDS showed a large negative direct effect on Z-IBI, which is inconsistent with the results of H.F. Bai et al. [55], probably because the Z-IBI in this study was mainly composed of Copepod and Cladoceran community structural features, while Rotifers were studied as the main dominant species in the existing studies.
The increase of TN, as a part of N and P nutrients within a certain range, will promote the growth of phytoplankton in the water body and thus the growth and reproduction of zooplankton, so TN had a direct positive effect on Z-IBI. However, exceeding a certain range will promote the growth of biomass of Cyanobacteria and Green Algae that are inedible algae for zooplankton [56] in the water column and inhibit zooplankton biomass, thus TN had an indirect negative effect on Z-IBI through WT.
pH has an important influence on the structural composition and distribution of phytoplankton communities, with high pH (pH > 8.0) favoring the growth of Cyanobacteria and Green Algae [57]. The main components of the P-IBI constructed in this study were the community structure characteristics of Cyanobacteria and Green Algae, so pH played a large direct positive role in the P-IBI.
It has been shown that overlying and interstitial water F− concentrations significantly affect the dominant species of microorganisms in water sediments [58]. In this study, we used the computational method proposed by M.J. Lv [59] for screening microbial fouling-resistant species to analyze microbial community susceptibility to F− and found that among the indicators constituting Z-IBI, Chloroflexi and Proteobacteria were F−intermediate phylum, and the top 5 dominant taxa in each sampling site such as Bacteroidota, Actinobacteria, Cyanobacteria, Verrucomicrobiota, Desulfobacterota, and other phyla were F−intermediate phylum, so F− showed a direct positive effect on Z-IBI.
The relationship between zo−oplankton and microorganisms in aquatic ecosystems is parasitic, and Cladoceran and copepods are the main hosts of Chloroflexi and Proteobacteria [60], which were the main components of Z-IBI and M-IBI, respectively, so there was some similarity in the interpretation of environmental factors for Z-IBI and M-IBI. At the same time, changes in EC, which is positively correlated with TDS among the water environmental factors, better reflect the ion content in the water column [61]. Therefore, similar to the direct negative effect of TDS on Z-IBI, EC exhibits the same direct negative effect on P-IBI.
The results of stepwise regression analysis and path coefficient analysis of aquatic IBI with environmental factors showed that compared with the correlation analysis between the structural characteristics of individual aquatic species communities and aquatic environmental factors, there were fewer indicators of significant effects of aquatic environmental factors on aquatic IBI and the indirect effects were generally insignificant. The main reason may be that the IBI of aquatic organisms is a parameter that integrates community structure, community species composition, community diversity, and functional type, so water environmental factors explain it to a lesser extent.
4.4. Application and Impact of This Study
In this study, the P-IBI, Z-IBI, and M-IBI were developed and evaluated for aquatic ecological health using the Diannong River in Ningxia Hui Autonomous Region, China as the study area. Meanwhile, the main environmental factors driving changes in the aquatic biotic integrity index were analyzed. In recent years, Shi, et al. [62], Wang, et al. [63], and Li, et al. [64] used F-IBI to take an evaluation for Chongming island, the Juma River and the North Canal respectively. Huang, et al. [65] used B-IBI to take an evaluation for the Ganjiang River. Liu et al. [66] used P-IBI to take an evaluation for the Jiangling River and Wujiang River. The above studies, on the one hand, mostly used a single aquatic organism as the research subject. On the other hand, these mainly used indices of fish, benthic animals and phytoplankton communities to develop IBI. The results of this study, on the one hand, developed the corresponding IBI with zooplankton and microorganisms, which have been less studied in recent years, and could provide references for constructing similar indicator systems in other regions of China. On the other hand, this study used several IBI for water ecological health evaluation and compared and analyzed that the variation of environmental factors represented by seasons and the variation of biological factors represented by aquatic plants were the main reasons for the differences in the evaluation results of the three indices. This conclusion could provide a basis for selecting a certain aquatic IBI for water ecological health evaluation in other regions based on actual biological and environmental factors.
In recent years, there were few studies on the application of IBI for water ecological health evaluation in the inland region of northwestern China which was a typical arid and semi-arid region, and the application of IBI for water ecological health evaluation in this region was somewhat representative. In recent years, most of the studies on the development of IBI for water ecological health evaluation in this region have focused on P-IBI and B-IBI [67,68,69]. Meanwhile, the findings of the IBI study on rivers in the Ningxia region had some similarities with those of this study, such as the finding that F− is the main environmental parameter driving changes in aquatic IBI [67].
China attached great importance to the development of ecological civilization and proposed that promotion of the ecological protection and high-quality development of the Yellow River Basin was related to the great rejuvenation of the Chinese nation for a thousand years for the Yellow River Basin [69]; The Law of the People’s Republic of China on the Protection of Yangtze River, which was introduced for the development of ecological civilization in the Yangtze River basin [62], proposed to establish an evaluation system for the IBI in the Yangtze River basin, further highlighting the importance of IBI in the evaluation of the health of aquatic ecosystems in China. The results of this article contained 3 aquatic IBI systems, the main aquatic environmental factors driving their changes, and the evaluation exploring the main measures to manage the ecological pollution in the area of the aquatic ecological health of the study area. The results could complement related studies in arid and semi-arid regions of China and provide a reference for the efficient application of IBI.
5. Conclusions
In this study, P-IBI, Z-IBI, and M-IBI were constructed based on the habitat quality and water quality of the Diannong River as the study area, and the aquatic ecological health assessment of the Diannong River was conducted and the results were compared to analyze the main water environmental factors driving the changes of aquatic IBI. The main reason for the large differences in the evaluation results of the three indices was that on the one hand, phytoplankton varied obviously with changes in season; on the other hand, the emergent aquatic plant influenced the growth of microorganisms. Overall, the M-IBI evaluation results were more consistent with the actual characteristics of the water ecological health situation and the water environment factors explained a low degree of aquatic IBI. This study initially constructed P-IBI, Z-IBI, and M-IBI for the natural conditions of Diannong River, Ningxia, it still needs to be improved in the following aspects with the improvement of the study: (1) Reference sites should be selected organically based on the habits of the particular study species, rather than simply by uniform indicators. (2) Further clarify the ecological functions of each species and improve the classification of species community structure indicators. (3) IBI scoring criteria should tend to be uniform to ensure the reference value of the scoring results. In analyzing the environmental factors driving the changes in aquatic IBI, this study only analyzed the aquatic IBI as a whole and the degree of explanation of aquatic IBI by water environmental factors was poor. Therefore, exploring the relationship between water environmental factors and the components of aquatic IBI and the internal mechanism of aquatic IBI is the focus of future research.
Supplementary Materials
The following supporting information can be downloaded at: https://www.mdpi.com/article/10.3390/w15061130/s1, Table S1: Water quality parameters and evaluation scores; Table S2: Habitat composite evaluation indicators and their criteria for the Diannong River; Table S3: Habitat composite index scoring results.
Author Contributions
Conceptualization, L.L., S.L. and X.Q.; methodology, L.L. and S.L.; translation, L.L. and S.L.; software, L.L. and S.L.; validation, X.Q., R.Z. and Z.Z.; formal analysis, L.L., S.L., R.Z. and Z.Z.; investigation, L.L., Y.W. and Z.C.; data curation, L.L., S.L., R.Z. and Z.Z.; visualization, L.L. and S.L.; supervision, X.Q.; project administration, L.L. and X.Q. funding acquisition, X.Q. All authors have read and agreed to the published version of the manuscript.
Funding
This work was financially supported by the Ningxia University first-class discipline (water conservancy engineering) construction subsidy project under award number NXYLXK2021A03 and research project of the Department of Ecology and Environment of Ningxia Hui Autonomous Region, China under award number 2022015.
Institutional Review Board Statement
Not applicable.
Informed Consent Statement
Not applicable.
Data Availability Statement
The data are not publicly available due to privacy.
Acknowledgments
This material is based on work supported by the Ningxia University first-class discipline (water conservancy engineering) construction subsidy project under award number NXYLXK2021A03 and research project of the Department of Ecology and Environment of Ningxia Hui Autonomous Region, China under award number 2022015.
Conflicts of Interest
The authors declare that there was no conflict of interest or any potential financial or other interests that could be perceived to influence the outcomes of this research.
References
- Karr, J.R. Assessment of biotic integrity using fish communities. J. Fish. 1981, 6, 21–27. [Google Scholar] [CrossRef]
- Zhang, Y.H.; Qv, X.D.; Wang, S.M.; Zhu, Y.; Liu, H.B.; Zhang, H.P.; Zhang, M.; Sun, S.J. River health assessment of Hun River Basin based on a benthic index of biological integrity. J. Resour. Environ. Yangtze Basin 2020, 29, 1374–1386. [Google Scholar]
- Cai, K.; Qin, C.Y.; Lee, J.Y.; Zhang, Y.; Niu, Z.C.; Lee, X.W. Preliminary study on the phytoplanktonic index of biotic integrity (P-IBI) assessment for lake ecosystem health: A case of Taihu Lake in Winter, 2012. J. Acta Ecol. Sin. 2016, 36, 1431–1441. [Google Scholar]
- Kruk, C.; Huszar, V.L.; Peeters, E.T.; Bonilla, S.; Costa, L.; Lürling, M.; Reynolds, C.S.; Scheffer, M. A Morpho-logical Classification Capturing Functional Variation in Phytoplankton. J. Freshw. Biol. 2010, 55, 614–627. [Google Scholar] [CrossRef]
- Zhang, Z.S.; Mo, Z.C.; Huang, H.M. Monitoring and evaluation of water pollution in the Tumen River using algae. J. Acta Hydrobiol. Sin. 1983, 97–104. [Google Scholar]
- Huang, W.Y.; Wu, T.G.; Shu, J.H. Water Environment Problems of Major Lakes and Reservoirs in China and Suggestions for Prevention and Control. J. Lake Sci. 1998, 83–90. [Google Scholar]
- Sun, G.; Lang, Y.; Fang, Y. Characteristics of zooplankton community in the aquatic ecosystem of Nanhu Lake of Changchun. J. Jilin Univ. Sci. Ed. 2006, 44, 663–667. [Google Scholar]
- Sun, Y.K.; Yang, G.; Lee, C.L.; Wang, N. Establishment of zooplankton biotic integrity index in Jiaozhou Bay. J. Mar. Sci. 2015, 39, 1–7. [Google Scholar]
- Su, Y.; Xu, Y.X.; An, W.H.; Wang, Y.L.; He, Z.C.; Lou, Y.W.; Shen, A.L. Assessment of Ecosystem Health of an Urban River Based on the Microbe Index of Biotic Integrity (M-IBI). J. Environ. Sci. 2019, 40, 1270–1279. [Google Scholar] [CrossRef]
- Liao, J.Q.; Huang, Y. Research progress on using the index of biological integrity to assess aquatic ecosystem health. J. Chin. J. Appl. Ecol. 2013, 24, 295–302. [Google Scholar]
- Dong, J.; Lu, S.Q.; Wu, L.J.; Wang, Z.K.; Wang, H.J.; Xu, F. Evaluation of urban river ecosystem health in Beijing based on the microbial index of biotic integrity. J. Environ. Eng. 2022, 12, 1411–1419. [Google Scholar]
- Zhang, W.L.; Yang, G.; Wang, H.L.; Li, Y.; Niu, L.H.; Zhang, H.J.; Wang, L.F. Predicting bend-induced heterogeneity in sediment microbial communities by integrating bacteria-based index of biotic integrity and supervised learning algorithms. J. Environ. Manag. 2022, 304, 114267. [Google Scholar] [CrossRef] [PubMed]
- Zhu, W.T.; Liu, Y.Y.; Wang, S.T.; Yu, M.; Qian, W. Development of the microbial community-based index of biotic integrity to evaluate the wetland ecosystem health in Suzhou, China. J. Environ. Monit. Assess. 2019, 191, 377. [Google Scholar] [CrossRef] [PubMed]
- An, X.L.; Chen, T.T.; Zhao, H.; Zhang, Y.C.; Hou, Y.W.; Cai, C. Assessment of Ecosystem Health of Baogang Tailings Groundwater Based on Microbiome Index of Biotic Integrity (M-IBI). J. Environ. Sci. 2016, 37, 3413–3422. [Google Scholar]
- HJ 494-2009; Water Quality Sampling Technical Guidance. Industry Standards-Environmental Protection: Beijing, China, 2009.
- HJ 493-2009; Water Quality Sample Preservation and Management Technical Provisions. Industry Standards-Environmental Protection: Beijing, China, 2009.
- HJ 495-2009; Water Quality Sampling Program Design Technical Provisions. Industry Standards-Environmental Protection: Beijing, China, 2009.
- Tu, Q.Y. Specifications for Lake Eutrophication Survey, 2nd ed.; China Environmental Science Press: Beijing, China, 1990. [Google Scholar]
- SL 167-2014; Specifications for Reservoir Fisheries Resources Survey. Industry Standards-Water: Beijing, China, 2014.
- DB11/T 1721-2020; Technical Specifications for Aquatic Life Survey. Recommended Local Standards: Beijing, China, 2020.
- Han, M.S.; Shu, Y.F. Atlas of Freshwater Organisms in China; Ocean Press: Melbourne, Australia, 1995. [Google Scholar]
- Wang, J.J. Journal of Freshwater Rotifers in China; Science Press: Beijing, China, 1961. [Google Scholar]
- GB 3838-2002; Surface Water Environmental Quality Standards. National Standards: Beijing, China, 2002.
- Zheng, B.H.; Zhang, Y.; Lee, Y.B. Study of indicators and methods for river habitat assessment of Liao River Basin. J. Acta Sci. Circumstantiae 2007, 27, 928–936. [Google Scholar] [CrossRef]
- Zheng, Y.W.; Yang, T.; Wang, N.; Wan, X.H.; Hu, C.T.; Sun, L.K.; Yan, X.R. Quantifying hydrological-ecological response relationships based on zooplankton index of biotic integrity and comprehensive habitat quality index—A case study of typical rivers in Xi’an, China. Sci. Total Environ. 2022, 858, 159925. [Google Scholar] [CrossRef]
- Lee, B.T.; Liu, L.; Zhu, Y.; Chen, X. Assessment of river health by using the phytoplanktonic index of biotic integrity. J. Yellow River 2020, 42, 73–78. [Google Scholar]
- Ma, T.T.; Fan, Y.M.; Lee, K.Y.; Hu, Z.J.; Wu, Z.S. Ecological health assessment of main estuaries of lake Taihu based on phytoplankton index of biotic integrity. J. Ecol. Rural Environ. 2021, 37, 501–508. [Google Scholar] [CrossRef]
- Chen, Q.; Chai, Y.H.; Wang, T.E.; Sun, X.; Yu, H.X.; Chai, F.Y.; Lin, H. Evaluation of water ecological status of Zhalong Wetland based on zooplankton integrity. J. Environ. Monit. China 2022, 38, 87–95. [Google Scholar] [CrossRef]
- Chen, Y.F.; Yan, H.; Xia, T.; Yao, C.Y.; Wang, H.; Qiu, Y.; Liu, L. Ecosystem assessment of Taihu Lake Basin based on zooplankton index of biological integrity. J. Nanjing Tech. Univ. Nat. Sci. Ed. 2022, 44, 335–343+356. [Google Scholar]
- Zhu, W.T.; Qian, W.; Yu, M.; Xuan, X.Z. Health evaluation of wetlands in Suzhou City based on microbiome index of biotic integrity. J. Res. Environ. Sci. 2019, 32, 423–430. [Google Scholar] [CrossRef]
- Huang, Y.; Shu, Z.Y. Bacterioplankton index of biotic integrity (BP-IBI): An approach for assessing river ecosystem health in Dianchi Watershed. J. Environ. Sci. 2013, 34, 3010–3018. [Google Scholar] [CrossRef]
- Deng, J.M.; Cai, Y.J.; Chen, Y.W.; Zhang, L. Structure of phytoplankton community and its relationship with environmental factors in Lake Honghu. J. Lake Sci. 2010, 22, 70–78. [Google Scholar]
- Li, Z.X.; Ma, C.; Sun, Y.N.; Lu, X.X.; Fan, Y.W. Ecological health evaluation of rivers based on phytoplankton biological integrity index and water quality index on the impact of anthropogenic pollution: A case of Ashi River Basin. Front. Microbiol. 2022, 13. [Google Scholar] [CrossRef] [PubMed]
- Buhungu, S.; Sibomana, C.; Adjahouinou, D.C.; Ntakimazi, G.; Bonou, C.A.; Montchowui, E. Assessment of the ecological status of the Kinyankonge River (Burundi), using a Biotic Integrity Index of zooplankton (BII-zooplankton). Afr. J. Aquat. Sci. 2020, 45, 442–451. [Google Scholar] [CrossRef]
- Houssou, A.M.; Adjahouinou, D.C.; Bonou, C.A.; Montchowui, E. Plankton index of biotic integrity (P-IBI) for assessing ecosystem health within the Ouémé River basin, Republic of Benin. Afr. J. Aquat. Sci. 2020, 45, 452–465. [Google Scholar] [CrossRef]
- Zhu, H.; Hu, X.D.; Wu, P.P.; Chen, W.M.; Wu, S.S.; Li, Z.Q.; Zhu, L.; Xi, Y.L.; Huang, R. Development and testing of the phytoplankton biological integrity index (P-IBI) in dry and wet seasons for Lake Gehu. J. Ecol. Indic. 2021, 129, 107882. [Google Scholar] [CrossRef]
- Li, F.Q.; Cai, Q.H.; Ye, L. Developing a benthic Index of biological integrity and some relationships to environmental factors in the Subtropical Xiangxi River, China. Int. Rev. Hydrobiol. 2010, 95, 171–189. [Google Scholar] [CrossRef]
- Casatti, L.; Ferreira, C.P.; Langeani, F. A fish-based biotic integrity index for assessment of lowland streams in southeastern Brazil. Hydrobiologia 2009, 623, 173–189. [Google Scholar] [CrossRef]
- Detenbeck, N.E.; Cincotta, D.A. Comparability of a regional and state survey: Effects on fish IBI assessment for West Virginia, U.S.A. Hydrobiologia 2008, 603, 279–300. [Google Scholar] [CrossRef]
- Blocksom, K.A.; Kurtenbach, J.P.; Klemm, D.J.; Fulk, F.A.; Cormier, S.M. Development and evaluation of the Lake Macroinvertebrate Integrity Index (LMII) for New Jersey lakes and reservoirs. J. Environ. Monit. Assess. 2002, 77, 311–333. [Google Scholar] [CrossRef] [PubMed]
- Maxted, J.R.; Barbour, M.T.; Gerritsen, J.; Poretti, V.; Primrose, N.; Silvia, A.; Penrose, D.; Renfrow, R. Assessment framework formid—Atlantic coastal plain streams using benthic macroinvertebrates. J. North Am. Benthol. Soc. 2000, 19, 128–144. [Google Scholar] [CrossRef]
- Ruaro, R.; Gubiani, D.A. A scientometric assessment of 30 years of the Index of Biotic Integrity in aquatic ecosystems: Applications and main flaws. Ecol. Indic. 2013, 29, 105–110. [Google Scholar] [CrossRef]
- Zhao, R.Z.; Zhao, H.X.; Qiu, X.C. Multivariate analysis of the relationship between zooplankton and water environment factors in the mainstream of the Heihe River. J. Hydroecology 2020, 41, 81–88. [Google Scholar] [CrossRef]
- He, S.J.; Gou, J.M.; Yin, J.; Qiu, X.C.; Zhao, R.Z. Structure of zooplankton community in Ningxia section of the Yellow River main stream and its relationship with water environment factors. J. Water Resour. Power 2022, 40, 66–69+18. [Google Scholar] [CrossRef]
- O’Connor Reilly, F.; McMeans Bailey, C.; Rooney Neil Guzzo Matthew, M.; Young Joelle, D.; McCann Kevin, S. Species portfolio effects dominate seasonal zooplankton stabilization within a large temperate lake. Ecology 2023, 104, e3889. [Google Scholar]
- Niu, L.; Li, Y.; Wang, P.F.; Zhang, W.; Li, J.; Wu, H. Development of a microbial community-based index of biotic integrity (MC-IBI) for the assessment of the ecological status of rivers in the Taihu Basin, China. Ecol. Indicat. 2018, 85, 204–213. [Google Scholar] [CrossRef]
- Devarajan, N. Occurrence of antibiotic resistance genes and bacterial markers in a tropical river receiving hospital and urban wastewaters. PLoS ONE 2016, 11, e0149211. [Google Scholar] [CrossRef]
- He, C.F. Study on the Health and Biological Integrity Mechanism of Lake Ecosystem Based on M-IBI and P-IBI; North China Electric Power University: Beijing, China, 2018. [Google Scholar]
- Fang, J.H.; Dong, J.Y.; Li, C.C.; Chen, H.; Wang, L.F.; Lv, T.S.; He, H.; Liu, J. Response of microbial community composition and function to emergent plant rhizosphere of a constructed wetland in northern China. Appl. Soil Ecol. 2021, 168, 104141. [Google Scholar] [CrossRef]
- Zhang, L.; Xu, H. Evaluation of the health status of the Diannong River, an artificial river in Ningxia. J. Hydroecol. 2020, 41, 16–22. [Google Scholar]
- Brettum, P. Changes in the volume and composition of phytoplankton after acidification of a humic lake. J. Environ. Int. 1996, 22, 619–628. [Google Scholar] [CrossRef]
- Yang, S.Q.; Zu, T.X.; Wang, H.B.; Wang, L.J.; Chen, T.R. Relationship between the structure of phytoplankton community and environmental factors in the Zhangye section of Heihe River. J. Lake Sci. 2019, 31, 159–170. [Google Scholar]
- Lin, Q.; You, W.H.; Xu, F.J.; Yu, Q.J.; Yu, H.G. Zooplankton community structure and its relationship with environmental factors in Dishui Lake. J. Acta Ecol. Sin. 2014, 34, 6918–6929. [Google Scholar]
- Zhang, Y.; Bi, Z.L.; Zhang, X.; Song, J.X.; Lee, N. Effects of land-use types on nitrate pollution of surface water in Guanzhong area in the Weihe River basin. J. Acta Ecol. Sin. 2019, 39, 4319–4327. [Google Scholar]
- Bai, H.F.; Wang, Y.R.; Song, J.X.; Xu, W.J.; Wu, Q.; Zhang, Y. Spatio-temporal characteristics and driving factors of zooplankton community structure in the Shaanxi section of Weihe River, China. J. Chin. J. Ecol. 2022, 41, 1602–1610. [Google Scholar] [CrossRef]
- Nilssen, J.P. Tropical lake-functional ecology and future development: The need for a process-orientated approach. Hydrobiologia 1984, 113, 231–242. [Google Scholar] [CrossRef]
- Chai, Y.; Peng, T.; Guo, K.; Lee, X.S.; He, Y.F. Correlation analysis between phytoplankton community structure and environmental factors in Haizi Lake in spring. J. Hydroecol. 2014, 35, 56–62. [Google Scholar]
- Zhu, X.; Xu, Z.P.; Luo, Y.D.; Peng, F.Q.; Pang, Q.Q.; Xie, L.; Ma, Y.K.; Wang, L.M. effect of different concentrations of the overlying water on the release of fluoride and microbial communities of lake sediments. J. Lake Sci. 2022, 34, 843–854. [Google Scholar]
- Lv, M.J. Response of Planktonic Bacterial Community Structure to Different Water Environments in Dianchi Basin; Peking University: Beijing, China, 2003. [Google Scholar]
- Wang, Q.H.; Hao, Z.; Ding, R.R.; Li, H.B.; Tang, X.M.; Chen, F.Z. Host Dependence of Zooplankton-Associated Microbes and Their Ecological Implications in Freshwater Lakes. Water 2021, 13, 2949. [Google Scholar] [CrossRef]
- Ren, W.; Zhong, Y.; Meligrana, J.; Anderson, B.; Watt, W.E.; Chen, J.; Leung, H.L. Urbanization, land use, and water quality in Shanghai. J. Environ. Int. 2003, 29, 649–659. [Google Scholar] [CrossRef]
- Shi, Z.Y.; Han, D.Y.; Gao, C.Y.; Chen, J.H.; Wu, J.H.; Wang, X.F. Effects of Survey Data Uncertainty on the Results of Fish-Index of Biological Integrityin Waters near Chongming Island. J. Shanghai Ocean. Univ. 2022, pp. 1–12. Available online: http://kns.cnki.net/kcms/detail/31.2024.S.20221020.1011.002.html (accessed on 4 March 2023).
- Wang, L.L.; Wang, X.M.; Yang, W.B.; Chen, Y.X.; Ding, F.; Li, D.H.; Wang, Y.X. River Ecosystem Health Evaluation of Juma River in Beijing Based on Fish-Index of Biotic Integrity. Asian J. Ecotoxicol. 2021, 16, 160–169. [Google Scholar]
- Li, H.Q.; Luo, Z.L.; Sun, G.; Shi, N.N.; Xiao, N.W. Application of F-IBI to evaluate the river health of the North Canal. J. Hydroecol. 2023, 44, 34–40. [Google Scholar] [CrossRef]
- Huang, B.B.; Li, G.J.; Feng, M.C.; Chen, Y.W.; Xu, J. Health assessment of Ganjiang River mainstream based on B-IBI. J. Water Resour. Water Eng. 2020, 31, 30–36+41. [Google Scholar]
- Liu, Y.Y.; Ayi, Q.L.; Zhang, S.R.; Wu, X.R.; Wan, B.N.; Zhang, X.P.; Zeng, B. Comparative study on the suitability of periphytic algae and phytoplankton in river health assessment. J. Acta Ecol. Sin. 2020, 40, 3833–3843. [Google Scholar]
- Liu, H.Y.; Song, G.F.; Wang, H.R.; Li, M.Y.; Li, D.; Lv, B.B. River health assessment of Qingshui River in Ningxia city based on the Benthic Index of Biological Integrity. J. Environ. Prot. Sci. 2023, 10, 1–10. [Google Scholar] [CrossRef]
- Wang, S.; Lu, X.B.; Jiao, L. Health evaluation of the main stream of Lazigou in Gansu based on macrobenthic IBI. J. Gansu Water Resour. Hydropower Technol. 2022, 58, 11–15. [Google Scholar] [CrossRef]
- Xu, Z.X.; Liu, L.F. Assessment on the Aquatic Ecosystem Health of the Weihe River Basin Based on Periphyton. J. Yellow River. 2020, 42, 123–129. [Google Scholar]
Figure 1.
Sampling sites of Diannong River.

Figure 2.
Water quality parameters values at each sampling site (a) WT, DO, EC, pH, Sal, TDS, Chl a and SO42−, (b) TN, NH3-N, NO2-N, TP, A-P, CODCr, CODMn, F−). The unit of WT is °C; the unit of EC is us/cm; the unit of DO, Sal, TDS, Chl a and SO42− is mg/L.
Figure 2.
Water quality parameters values at each sampling site (a) WT, DO, EC, pH, Sal, TDS, Chl a and SO42−, (b) TN, NH3-N, NO2-N, TP, A-P, CODCr, CODMn, F−). The unit of WT is °C; the unit of EC is us/cm; the unit of DO, Sal, TDS, Chl a and SO42− is mg/L.

Figure 3.
Correlation analysis for water quality parameters, Note: *, p ≤ 0.05; **, p ≤ 0.01.

Figure 4.
Results of the comprehensive evaluation of habitat quality and water quality at each site.
Figure 4.
Results of the comprehensive evaluation of habitat quality and water quality at each site.

Figure 5.
Discrimination analysis for indicators of P-IBI.

Figure 6.
Correlation analysis for indicators of P-IBI. Note: * indicates p ≤ 0.05; ** indicates p ≤ 0.01.
Figure 6.
Correlation analysis for indicators of P-IBI. Note: * indicates p ≤ 0.05; ** indicates p ≤ 0.01.

Figure 7.
Discrimination analysis for indicators of Z-IBI.

Figure 8.
Correlation analysis for indicators of Z-IBI. Note: * indicates p ≤ 0.05; ** indicates p ≤ 0.01.
Figure 8.
Correlation analysis for indicators of Z-IBI. Note: * indicates p ≤ 0.05; ** indicates p ≤ 0.01.

Figure 9.
RDA between water environmental factors and microbial diversity in sampling sites.

Figure 10.
Pearson correlation analysis between water environmental factors and relative abundance of microbial division. Note: * indicates p ≤ 0.05; ** indicates p ≤ 0.01; *** indicates p ≤ 0.001.
Figure 10.
Pearson correlation analysis between water environmental factors and relative abundance of microbial division. Note: * indicates p ≤ 0.05; ** indicates p ≤ 0.01; *** indicates p ≤ 0.001.

Figure 11.
Discrimination analysis for indicators of M-IBI.

Figure 12.
Correlation analysis for indicators of M-IBI. Note: * indicates p ≤ 0.05; ** indicates p ≤ 0.01.
Figure 12.
Correlation analysis for indicators of M-IBI. Note: * indicates p ≤ 0.05; ** indicates p ≤ 0.01.

Figure 13.
Evaluation results of P-IBI.

Figure 14.
Evaluation results of Z-IBI.

Figure 15.
Evaluation results of M-IBI.

Figure 16.
Comparison for Evaluation Results of IBI.


Table 1.
Index system of P-IBI in the Diannong River.
| Parameter Types | Number | Biological Parameters | Response to Interference |
|---|---|---|---|
| Community structure | M1 | Total number of phytoplankton taxonomic units | − |
| M2 | Number of Cyanobacterial taxonomic units | − | |
| M3 | Number of Dinoflagellate taxonomic units | − | |
| M4 | Number of Cryptophyte taxonomic units | + | |
| M5 | Number of Golden Algae taxonomic units | − | |
| M6 | Number of Yellow Algae taxonomic units | − | |
| M7 | Number of Diatom algae taxonomic units | − | |
| M8 | Number of Nudibranch taxonomic units | + | |
| M9 | Number of Green Algae taxonomic units | + | |
| M10 | Number of Cyanobacterial taxonomic units % | − | |
| M11 | Number of Dinoflagellate taxonomic units % | − | |
| M12 | Number of Cryptophyte taxonomic units % | + | |
| M13 | Number of Golden Algae taxonomic units % | − | |
| M14 | Number of Yellow Algae taxonomic units % | − | |
| M15 | Number of Diatom algae taxonomic units % | − | |
| M16 | Number of Nudibranch taxonomic units % | + | |
| M17 | Number of Green Algae taxonomic units % | + | |
| Community quantity | M18 | Relative abundance of Cyanobacterial | − |
| M19 | Relative abundance of Dinoflagellate | − | |
| M20 | Relative abundance of Cryptophyte | + | |
| M21 | Relative abundance of Golden Algae | − | |
| M22 | Relative abundance of Yellow Algae | − | |
| M23 | Relative abundance of Diatom | − | |
| M24 | Relative abundance of Nudibranch | + | |
| M25 | Relative abundance of Green Algae | + | |
| M26 | Relative abundance of the top 3 dominant species | − | |
| Community function | M27 | Relative abundance of edible algae | − |
| M28 | Relative abundance of inedible algae | + | |
| M29 | Relative abundance of algal blooms | + | |
| M30 | Relative abundance of toxic-producing algae | + | |
| Tolerant taxa | M31 | Relative abundance of stain-resistant species | − |
| M32 | Relative abundance of sensitive species | − | |
| Diversity index | M33 | Shannon-winner index | + |
| M34 | Marglef index | + | |
| M35 | Pielou index | + | |
| M36 | Simpson index | + |
Table 2.
Index system of Z-IBI of the Diannong River.
| Parameter Types | Number | Biological Parameters | Response to Interference |
|---|---|---|---|
| Community structure | M37 | Total number of zooplankton taxonomic units | + |
| M38 | Number of Protozoan taxonomic units | + | |
| M39 | Number of Rotifer taxonomic units | + | |
| M40 | Number of Cladoceran taxonomic units | − | |
| M41 | Number of Copepods taxonomic units | + | |
| Community quantity | M42 | Relative abundance of Protozoan | + |
| M43 | Relative abundance of Rotifer | + | |
| M44 | Relative abundance of Cladoceran | − | |
| M45 | Relative abundance of Copepods | + | |
| M46 | Protozoan biomass % | − | |
| M47 | Rotifer biomass % | + | |
| M48 | Cladoceran biomass % | − | |
| M49 | Copepods biomass % | − | |
| M50 | Relative abundance of the top 3 dominant species | − | |
| Diversity index | M51 | Shannon-winner index | − |
| M52 | Marglef index | + | |
| M53 | Pielou index | − | |
| M54 | Simpson index | + | |
| Nutritional structure | M55 | Relative abundance of predators | − |
| M56 | Relative abundance of filter-feeders | − |
Table 3.
Index system of M-IBI of the Diannong River.
| Parameter Types | Number | Biological Parameters | Responses to Interference |
|---|---|---|---|
| Community structure | M57 | Number of microbial taxonomic units | + |
| M58 | OTUs | + | |
| M59 | Observed species | + | |
| Community quantity | M60 | Relative abundance of Chloroflexi | + |
| M61 | Relative abundance of Desulfobacterota | + | |
| M62 | Relative abundance of Cyanobacteria | + | |
| M63 | Relative abundance of Bdellovibrionota | + | |
| M64 | Relative abundance of Campylobacterota | + | |
| M65 | Relative abundance of Proteobacteria | − | |
| M66 | Relative abundance of highest dominant taxonomic units | − | |
| M67 | Relative abundance of the top 2 dominant taxonomic units | − | |
| M68 | Relative abundance of the top 3 dominant taxonomic units | − | |
| M69 | Relative abundance of the top 4 dominant taxonomic units | − | |
| M70 | Relative abundance of the top 5 dominant taxonomic units | − | |
| Tolerant taxa | M71 | relative abundance of NH3-N tolerant genus | + |
| M72 | Relative abundance of NH3-N intermediate genus | − | |
| M73 | Relative abundance of NH3-N sensitive genus | − | |
| M74 | Relative abundance of TN-tolerant genus | − | |
| M75 | Relative abundance of TN intermediate genus | + | |
| M76 | Relative abundance of TN-sensitive genus | + | |
| M77 | Relative abundance of high-temperature tolerant genus | − | |
| M78 | Relative abundance of high-temperature intermediate genus | − | |
| M79 | Relative abundance of high-temperature sensitive genus | + | |
| M80 | Relative abundance of pollution-tolerant genus | + | |
| M81 | Relative abundance of pollution intermediate genus | + | |
| M82 | Relative abundance of pollution-sensitive genus | − | |
| Diversity index | M83 | Chao1 index | + |
| M84 | Shannon-winner index | + | |
| M85 | Simpson index | + | |
| M86 | Ace index | + | |
| M87 | PD-whole-tree index | + | |
| M88 | Goods-coverage index | + |
Table 4.
Stepwise multiple regression between IBI of aquatic organisms and water environmental factors.
Table 4.
Stepwise multiple regression between IBI of aquatic organisms and water environmental factors.
| Stepwise Regression Equation | R | p |
|---|---|---|
| lnP-IBI = −26.242 + 4.869 lnWT + 6.362 lnpH | 0.789 | 0.0001 |
| lnZ-IBI = −5.783 − 0.278 lnTDS + 2.871 lnWT + 0.149 lnTN | 0.894 | 0.0001 |
| lnM-IBI = 2.588 + 0.471 lnF − 0.121 lnEC | 0.828 | 0.0001 |
Table 5.
Path coefficient analysis between P-IBI and water environmental factors.
| Dependent Variable | Independent Variable | Direct Effect | Indirect Effect rijPj | |
|---|---|---|---|---|
| Pi | By lnWT | By lnpH | ||
| lnP-IBI | lnWT | 0.667 | - | 0.01911 |
| lnpH | 0.39 | 0.032683 | - | |
Table 6.
Path coefficient analysis between Z-IBI and water environmental factors.
| Dependent Variable | Independent Variable | Direct Effect | Indirect Effect rijPj | ||
|---|---|---|---|---|---|
| Pi | By lnTDS | By lnWT | By lnTN | ||
| lnZ-IBI | lnTDS | −0.665 | - | −0.071314 | −0.024108 |
| lnWT | 0.394 | 0.120365 | - | −0.014112 | |
| lnTN | 0.294 | 0.05453 | −0.018912 | - | |
Table 7.
Path coefficient analysis between M-IBI and water environmental factors.
| Dependent Variable | Independent Variable | Direct Effect | Indirect Effect rijPj | |
|---|---|---|---|---|
| Pi | By lnF− | By lnEC | ||
| lnM-IBI | lnF− | 0.752 | - | −0.009936 |
| lnEC | −0.368 | 0.020304 | - | |
Disclaimer/Publisher’s Note: The statements, opinions and data contained in all publications are solely those of the individual author(s) and contributor(s) and not of MDPI and/or the editor(s). MDPI and/or the editor(s) disclaim responsibility for any injury to people or property resulting from any ideas, methods, instructions or products referred to in the content. |
© 2023 by the authors. Licensee MDPI, Basel, Switzerland. This article is an open access article distributed under the terms and conditions of the Creative Commons Attribution (CC BY) license (https://creativecommons.org/licenses/by/4.0/).
Share and Cite
MDPI and ACS Style
Lee, L.; Liu, S.; Qiu, X.; Zhao, R.; Zhao, Z.; Wan, Y.; Cao, Z. Development of Aquatic Index of Biotic Integrity and Its Driving Factors in the Diannong River, China. Water 2023, 15, 1130. https://doi.org/10.3390/w15061130
AMA Style
Lee L, Liu S, Qiu X, Zhao R, Zhao Z, Wan Y, Cao Z. Development of Aquatic Index of Biotic Integrity and Its Driving Factors in the Diannong River, China. Water. 2023; 15(6):1130. https://doi.org/10.3390/w15061130
Chicago/Turabian StyleLee, Lin, Shuangyu Liu, Xiaocong Qiu, Ruizhi Zhao, Zengfeng Zhao, Yongpeng Wan, and Zhanqi Cao. 2023. "Development of Aquatic Index of Biotic Integrity and Its Driving Factors in the Diannong River, China" Water 15, no. 6: 1130. https://doi.org/10.3390/w15061130
Note that from the first issue of 2016, this journal uses article numbers instead of page numbers. See further details here.