
Water Footprint Assessment of Major Crops in Henan Province and Reduction Suggestions
1
School of Water Conservancy, North China University of Water Resources and Electric Power, Zhengzhou 450046, China
2
Yellow River Institute of Hydraulic Research, Yellow River Conservancy Commission, Zhengzhou 450003, China
3
Henan Key Laboratory of Ecological Environment Protection and Restoration of Yellow River Basin, Zhengzhou 450003, China
*
Author to whom correspondence should be addressed.
Water 2023, 15(6), 1135; https://doi.org/10.3390/w15061135
Submission received: 13 February 2023
/
Revised: 8 March 2023
/
Accepted: 14 March 2023
/
Published: 15 March 2023
(This article belongs to the Section Water Use and Scarcity)
Abstract
:Henan Province, located in the North China Plain, as one of the most important grain production bases in China, is facing severe challenges of water pressure and sustainable development caused by agricultural production. In this study, water footprint (WF) estimation and sustainability assessment of crop production were carried out for wheat and maize, two major crops in the Henan Province. Based on a set of global WF benchmark values for various crops which were established by previous studies, we calculated a set of benchmark values of blue water footprint (BWF, surface water, and groundwater) for major crops in Henan Province. Four benchmark values were calculated for each crop, and we selected two of them as the optimal and sub-optimal benchmark levels. Additionally, potential blue water savings were estimated by reducing the crop-specific BWF to different benchmark levels. According to our simulations with CROPWAT 8.0, the average annual blue water footprint of wheat production in Henan Province from 2006 to 2016 was 7914 Million m3, of which about 77% is unsustainable, and that of maize production is 703 Million m3, of which about 70% is unsustainable. When reducing the water footprint of wheat production to optimal or sub-optimal benchmark levels, approximately 2742 Million m3 or 375 Million m3 blue water can be saved, and reducing that of maize production to optimal or sub-optimal benchmark levels could save approximately 214 Million m3 or 44 Million m3 blue water.
1. Introduction
As a populous country, China has a huge demand for grain, and Henan Province is known as “the granary of China from ancient times”. In 2019, Henan Province produced nearly 67 million tons of grain, ranking second in China, wheat output (37.4 million tons) ranked first in China, and maize output (22.5 million tons) ranked fifth in China [1]. Behind this huge crop output is the huge consumption of fresh water. In 2020, the total water consumption of Henan Province was 22.292 billion m3, among which agricultural water consumption was 11.499 billion m3, accounting for 51.6% of the total water consumption. Irrigation can make up for the lack of soil moisture and improve agricultural productivity, so agriculture is the largest water user globally, and Henan Province is surely no exception [2]. In this context, studies have shown that Henan Province is facing severe water stress and widespread groundwater depletion for most of the year [3,4]. Although the use of blue water for crop production in Henan Province has become one of the major factors leading to severe water stress in the region, the province will continue to maintain or even increase its current grain production for a long time. The reason is, in consideration of national food security, the Chinese government does not allow the area of cultivated land in Henan Province to be less than 1.2 million km2. Therefore, Henan Province is faced with severe challenges of sustainable blue water utilization and sustainable agricultural development, and reducing the blue water use for crop production would be a major problem in this region.
The “water footprint” proposed by Hoekstra [5] has been adopted by many researchers as a non-traditional method for quantitative assessment of water resources, which can identify the time and place of water consumption. The water footprint (WF) consists of the blue water footprint (BWF), green water footprint (GWF), and gray water footprint, which correspond to the time and place of their respective water consumption. BWF refers to the consumption of blue water (surface water and groundwater resources) by a product in its supply chain or the process of production, and consumption refers to the loss of available surface water and groundwater within the catchment. Water loss occurs when water evaporates, flows back out of the river basin, joins the sea, or is incorporated into products. GWF refers to the consumption of green water (rainwater that does not become runoff) resources. Grey water footprint is a pollution-related index defined as the volume of fresh water required to absorb and assimilate a given pollutant load based on natural background concentration and existing environmental water quality standards [6].
There are various studies on the estimation of crop production water footprint (CWF) in recent years. Mekonnen and Hoekstra [7] estimated the CWFs of 126 crops worldwide and assessed the sustainability of the BWF of crop production. Siebert and Doll [8] developed a model called GCWM to compute consumptive blue and green water use and virtual water content of crops, they computed the corresponding yields of 26 crops under irrigation (blue and green water consumed) and rain-fed conditions (only green water consumed). Pfister and Bayer [9] studied the CWF from the perspective of temporal resolution, and calculated the CWF by multiplying the water stress index they developed for 11,000 watersheds worldwide by the monthly crop irrigation water consumption. Sun et al. [10] evaluated the green and blue virtual water content of wheat, maize, and rice in China, and assessed the blue and green virtual water that generated from transporting these crops among areas. Sun et al. [11] estimated the WF of main crops in the Hetao irrigation district of China based on a calculation method modified by themselves.
The number of studies on the water footprint of specific crop production has been increasing in recent years, but beyond quantitative assessment of the CWF, quite few studies have looked at providing information for formulating the regional crop-specific BWF reduction targets. Setting reasonable reduction targets for the BWFs of specific crops will help water conservation work be carried out more purposefully, and ultimately help relieve the pressure on local freshwater resources and achieve sustainable use of water resources.
Herein we estimated the BWF and GWF of wheat/maize production of the 18 cities in Henan Province, and the CROPWAT 8.0 model was used in this process. There are two options in this model, we chose the “irrigation schedule option” instead of the “crop water requirement (CWR) option” because the former is more accurate than the latter, and it was recommended by the Water Footprint Evaluation Manual [12]. Based on that, this study assessed the sustainability of the BWF of wheat/maize production in Henan Province. Furthermore, we calculated a set of benchmark values of crop production BWFs based on previous research results [13]. A benchmark value of the BWF is a target to which we could aim to reduce the current BWF of crop production. We selected two benchmark values of BWF from the four we calculated as the optimal and sub-optimal benchmark levels for the 18 cities in the province. The sub-optimal benchmark level as an initial reduction target is easier to achieve for the cities with difficulty in achieving the optimal benchmark level. This paper calculated the potential blue water savings corresponding to the different reduction targets. The period of this study is from 2006 to 2016.
2. Materials and Methods
2.1. Study Area
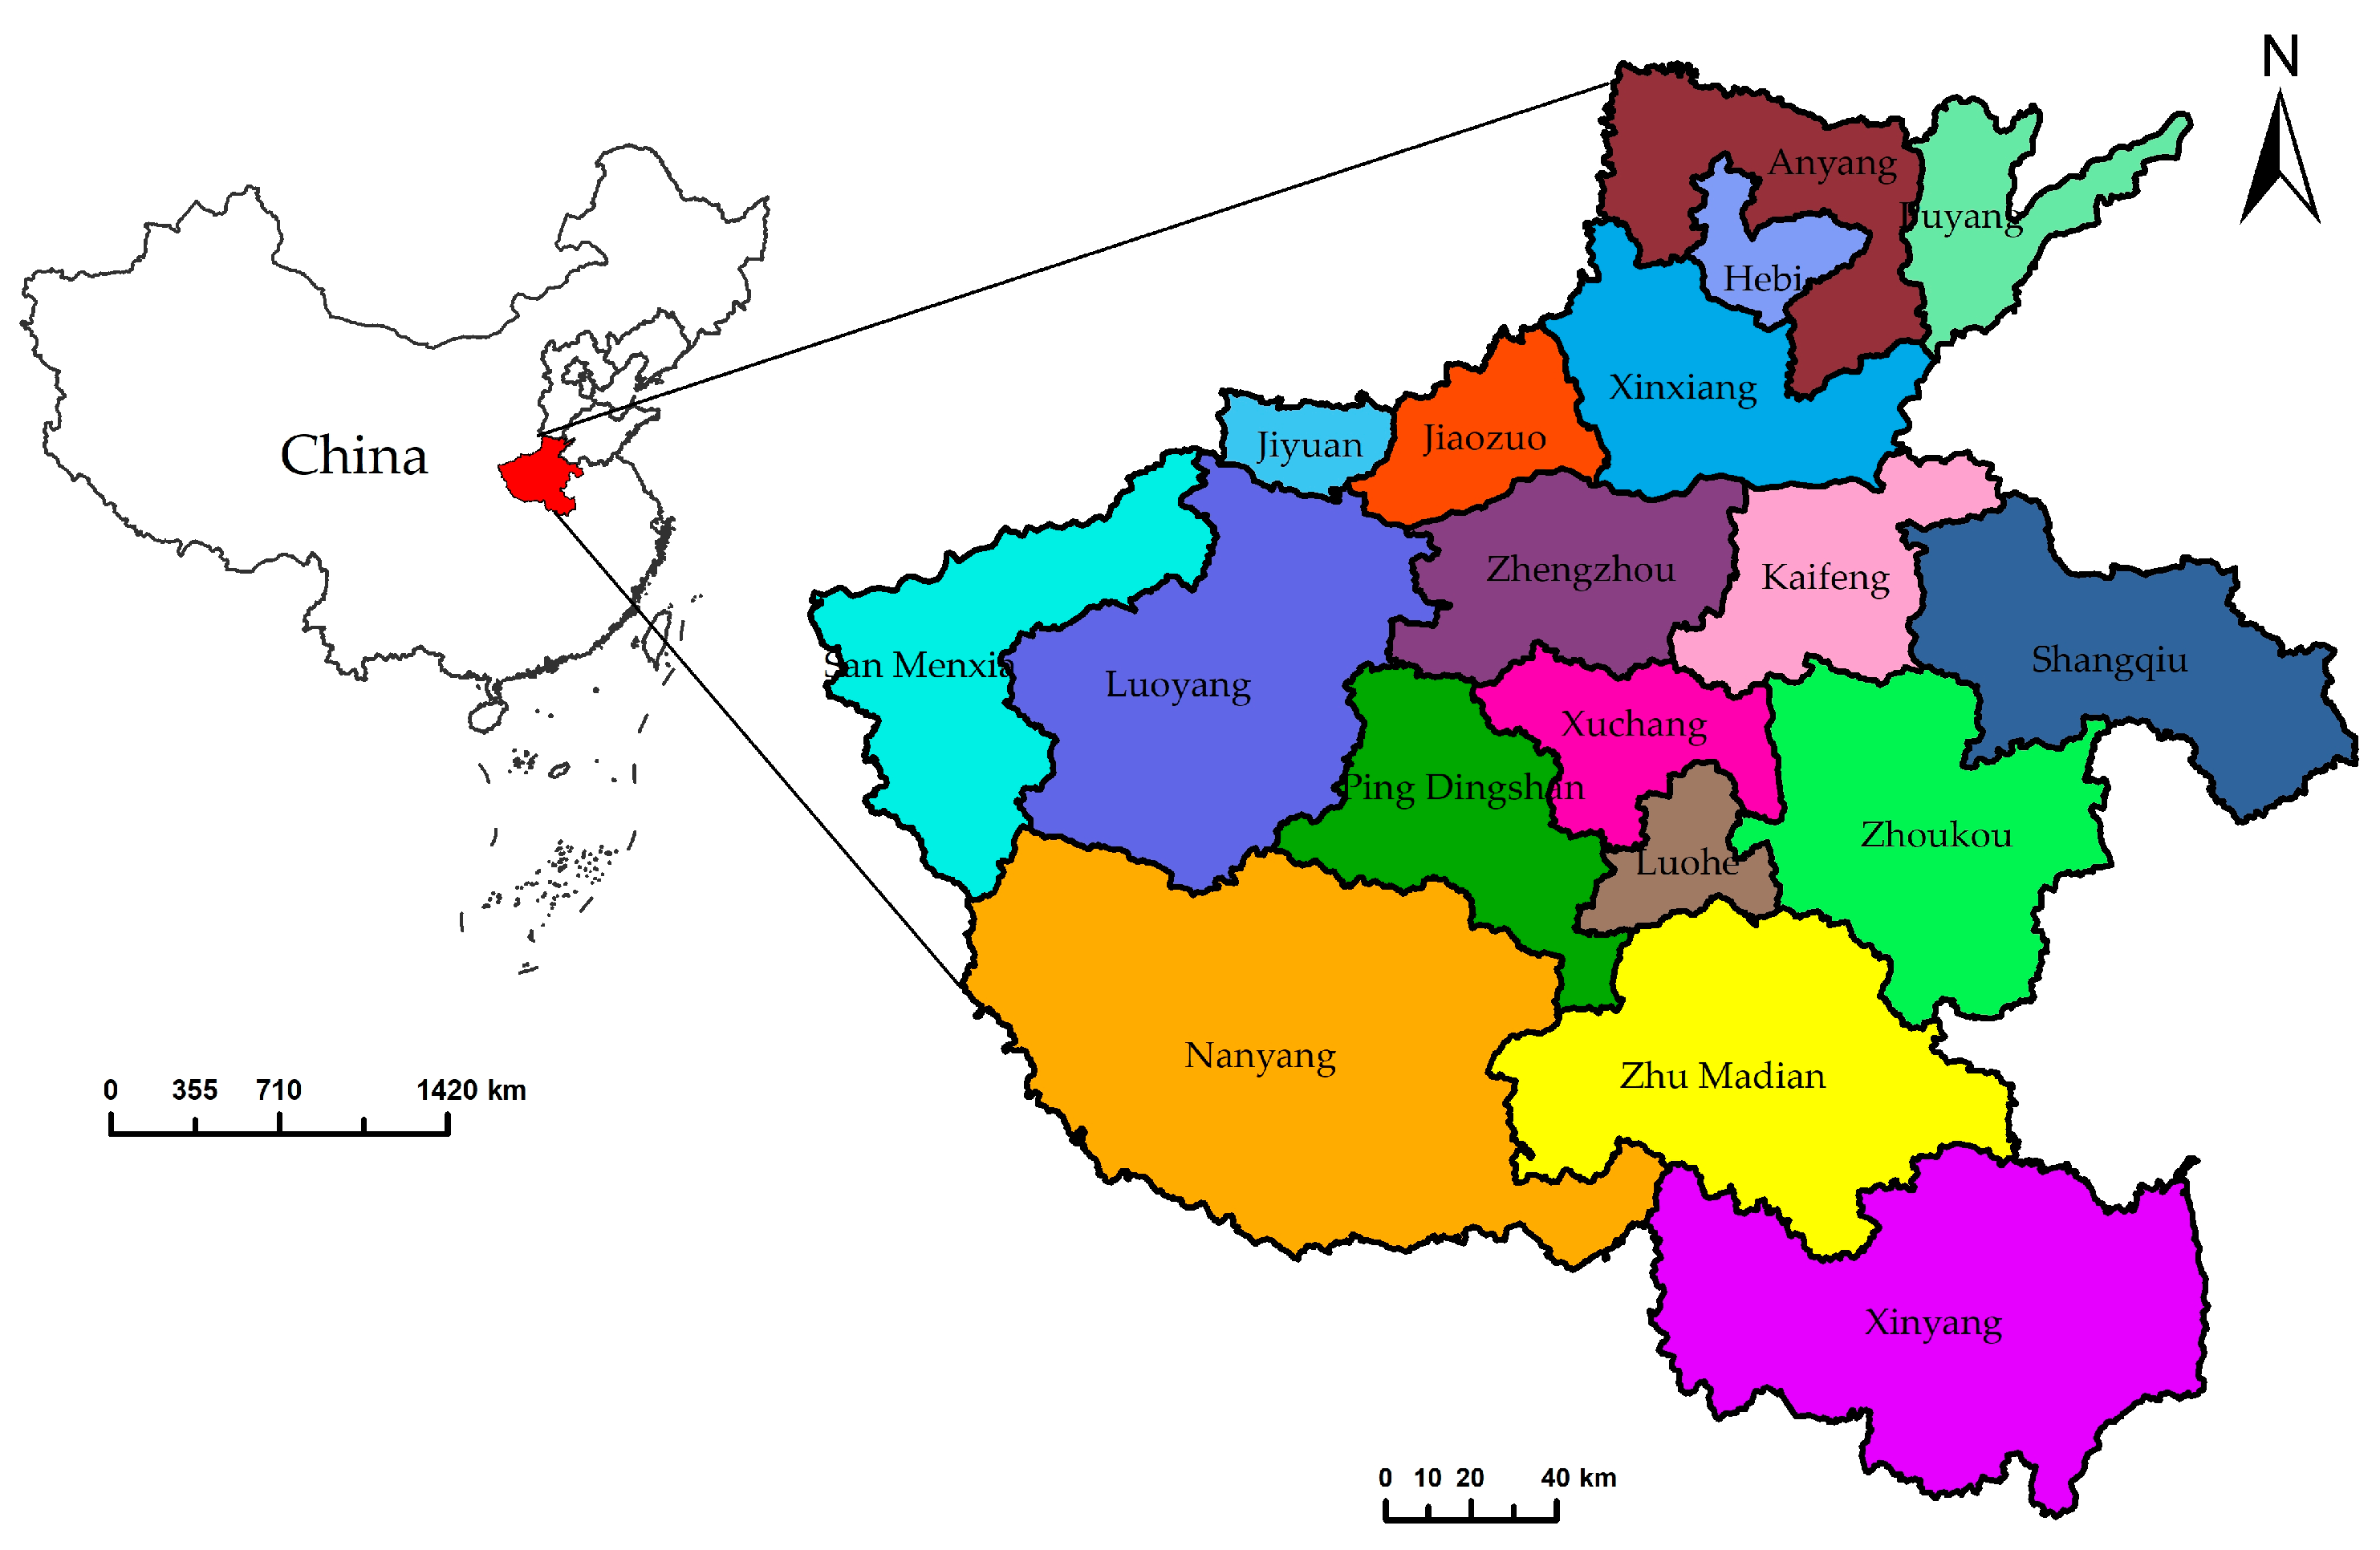
Henan Province is located in the middle of China (31°23′–36°22′ N, 110°21′–116°39′ E), and in the south of the North China Plain, which is known for agriculture from ancient China. The climate here is a continental monsoon climate that transitions from the northern subtropical zone to the warm temperate zone. Most of Henan Province is located in the warm temperate zone while the southern part of it is located in the subtropical zone. Henan Province covers an area of 167,000 km2 and has 18 cities. Figure 1 shows the names and locations of the 18 cities in Henan Province and the location of Henan Province in China.
2.2. Water Footprint Estimation
Since accurate data required for gray water footprint calculation is difficult to obtain, only blue and green water footprints are estimated. In this paper, the water footprint refers to the sum of the blue water footprint and green water footprint. This paper estimated the WF per ton of wheat/maize production (m3/t) in 18 cities from 2006 to 2016, and the total water footprint of wheat/maize production in million m3 per year (Mm3/yyear) in the whole province from 2006 to 2016.
2.2.1. CROPWAT 8.0 Model
To estimate the green and blue WF of crop production, green and blue water evapotranspiration during crop growth needed to be estimated first. We achieved that with a model called CROPWAT 8.0, which was developed by the FAO [14].
There are two alternative options provided in the model: the “CWR option” (assumed optimum condition) or the “irrigation schedule option” (included the possibility of specifying actual irrigation supplies in a timely manner) [12]. The total ET and the resultant total WF calculated by these two options are similar, but the blue-green WF ratio is quite different. Given the irrigation schedule option has higher accuracy than the CWR option [12], we chose the irrigation schedule option for estimations. Refer to the Water Footprint Evaluation Manual [12] for more specific operation methods.
2.2.2. WF of Wheat/Maize Production
The water footprint is the sum of the blue, green and grey water footprints. As it is difficult to obtain data to estimate gray water footprint, only blue water footprint and green water footprint are estimated in this paper.
where the WF, BWF and GWF are in m3/t.
where CWUblue is the blue component in crop water use (m3/ha), CWUgreen is the green component in crop water use (m3/ha), and Y is the crop yield Y (ton/ha).
where the factor 10 converts water depth in millimeters into water volume per land surface (m3/ha), and ETgreen and ETblue are green and blue water evapotranspiration (mm), respectively.
where net irrigation (mm) and actual irrigation (mm) are calculated by CROPWAT 8.0.
where ETa (mm) is the adjusted crop evapotranspiration calculated by the irrigation schedule option.
where Ks is the stress coefficient and ETc is the crop evapotranspiration (mm).
where Kc is the crop coefficient and ET0 is the reference crop evapotranspiration which was estimated by CROPWAT 8.0 in mm.
where WFprov (Million m3/year) is the sum of water footprint of 18 cities per year, WFi is the WF (m3/t) of the ith city per year, and Pi is the crop yield of the ith city per year.
2.3. Sustainability of Blue Water Footprint
Mekonnen and Hoekstra [7] estimated the around the world. Basing on that, we estimated the sustainability of the BWF consumed in the major crops production in the Henan Province.
where BWFuns is the unsustainable blue water footprint (m3/year), BWF is the blue water footprint (m3/year), and is the fraction of the unsustainable blue water footprint.
where BWFtot(y) is the total blue water footprint for year y, and BWA(y) is the total available blue water for year y.
2.4. Blue Water Footprint Reduction
2.4.1. Blue Water Footprint Benchmark Level (BWF Benchmark Level)
Mekonnen and Hoekstra [13] ranked the CWF of the major crops worldwide, providing the CWF of the major crops in the 10th (CWF 10th), 20th (CWF 20th), 25th (CWF 25th), and 50th (CWF 50th) percentiles, respectively. Those results provided a benchmark for CWFs across the globe. This paper assumes that the ratio of BWF to GWF in the CWF of the specific crop in this paper is the same as that of BWF to GWF in the CWF benchmark value of the specific crop provided by Mekonnen and Hoekstra [13].
where BWFbenchmark is the benchmark level of wheat or maize production blue water footprint (m3/t), the WFbenchmark is the CWF 10th, CWF 20th, CWF 25th, and CWF 50th, respectively, provided by Mekonnen and Hoekstra [13] (m3/t), and the BWF and GWF are, respectively, the blue and green WF of wheat or maize production in Henan Province estimated earlier in this paper (m3/t). The BWF benchmark level calculated with CWF 10th, CWF 20th, CWF 25th, and CWF 50th are hereinafter referred to as the first, second, third, and fourth BWF benchmarks, respectively.
In this paper, four different BWF benchmarks of wheat/maize production for each city in Henan Province are calculated, corresponding to the CWF at the four different production percentiles mentioned above. We compared the blue water savings generated by each city when four different BWF benchmark level values were targeted for the BWF decrement. We selected two benchmark values for wheat and maize production BWF in Henan Province after taking various factors into consideration, which were called the optimal and the sub-optimal benchmark levels of BWF.
2.4.2. Blue Water Footprint Reduction
The BWF that could be reduced was estimated by reducing the current BWF to the benchmark level of BWF.
where BWFreduction is the part of the blue water footprint of crop production that could theoretically be reduced (m3/t), that is, saved.
where BWsave is the potential consumptive blue water savings yearly (m3/year), P is the crop production yearly (ton/year).
3. Results
3.1. The WF of Wheat/Maize Production
We estimated the blue-green water footprint of wheat and maize production in 18 cities from 2006 to 2016, and summed up the data for the whole province over the years as shown in Table 1. The blue water footprint of wheat production in Henan Province was the highest (11,356 million m3) in 2013, and the lowest (3667 million m3) in 2015. From 2006 to 2016, the average annual blue water footprint consumption was 7914 million m3, accounting for 28% of the total water footprint. The blue water footprint of maize production is far lower than that of wheat. The blue water footprint of maize production in the whole province in 2014 was the highest (2525 million m3), and the lowest was 0 in the year 2007. The blue water footprint of maize in most other years was below 500 million m3, with an average of 703 million m3. The average ratio of the blue production water footprint of maize to the total water footprint is 6%.
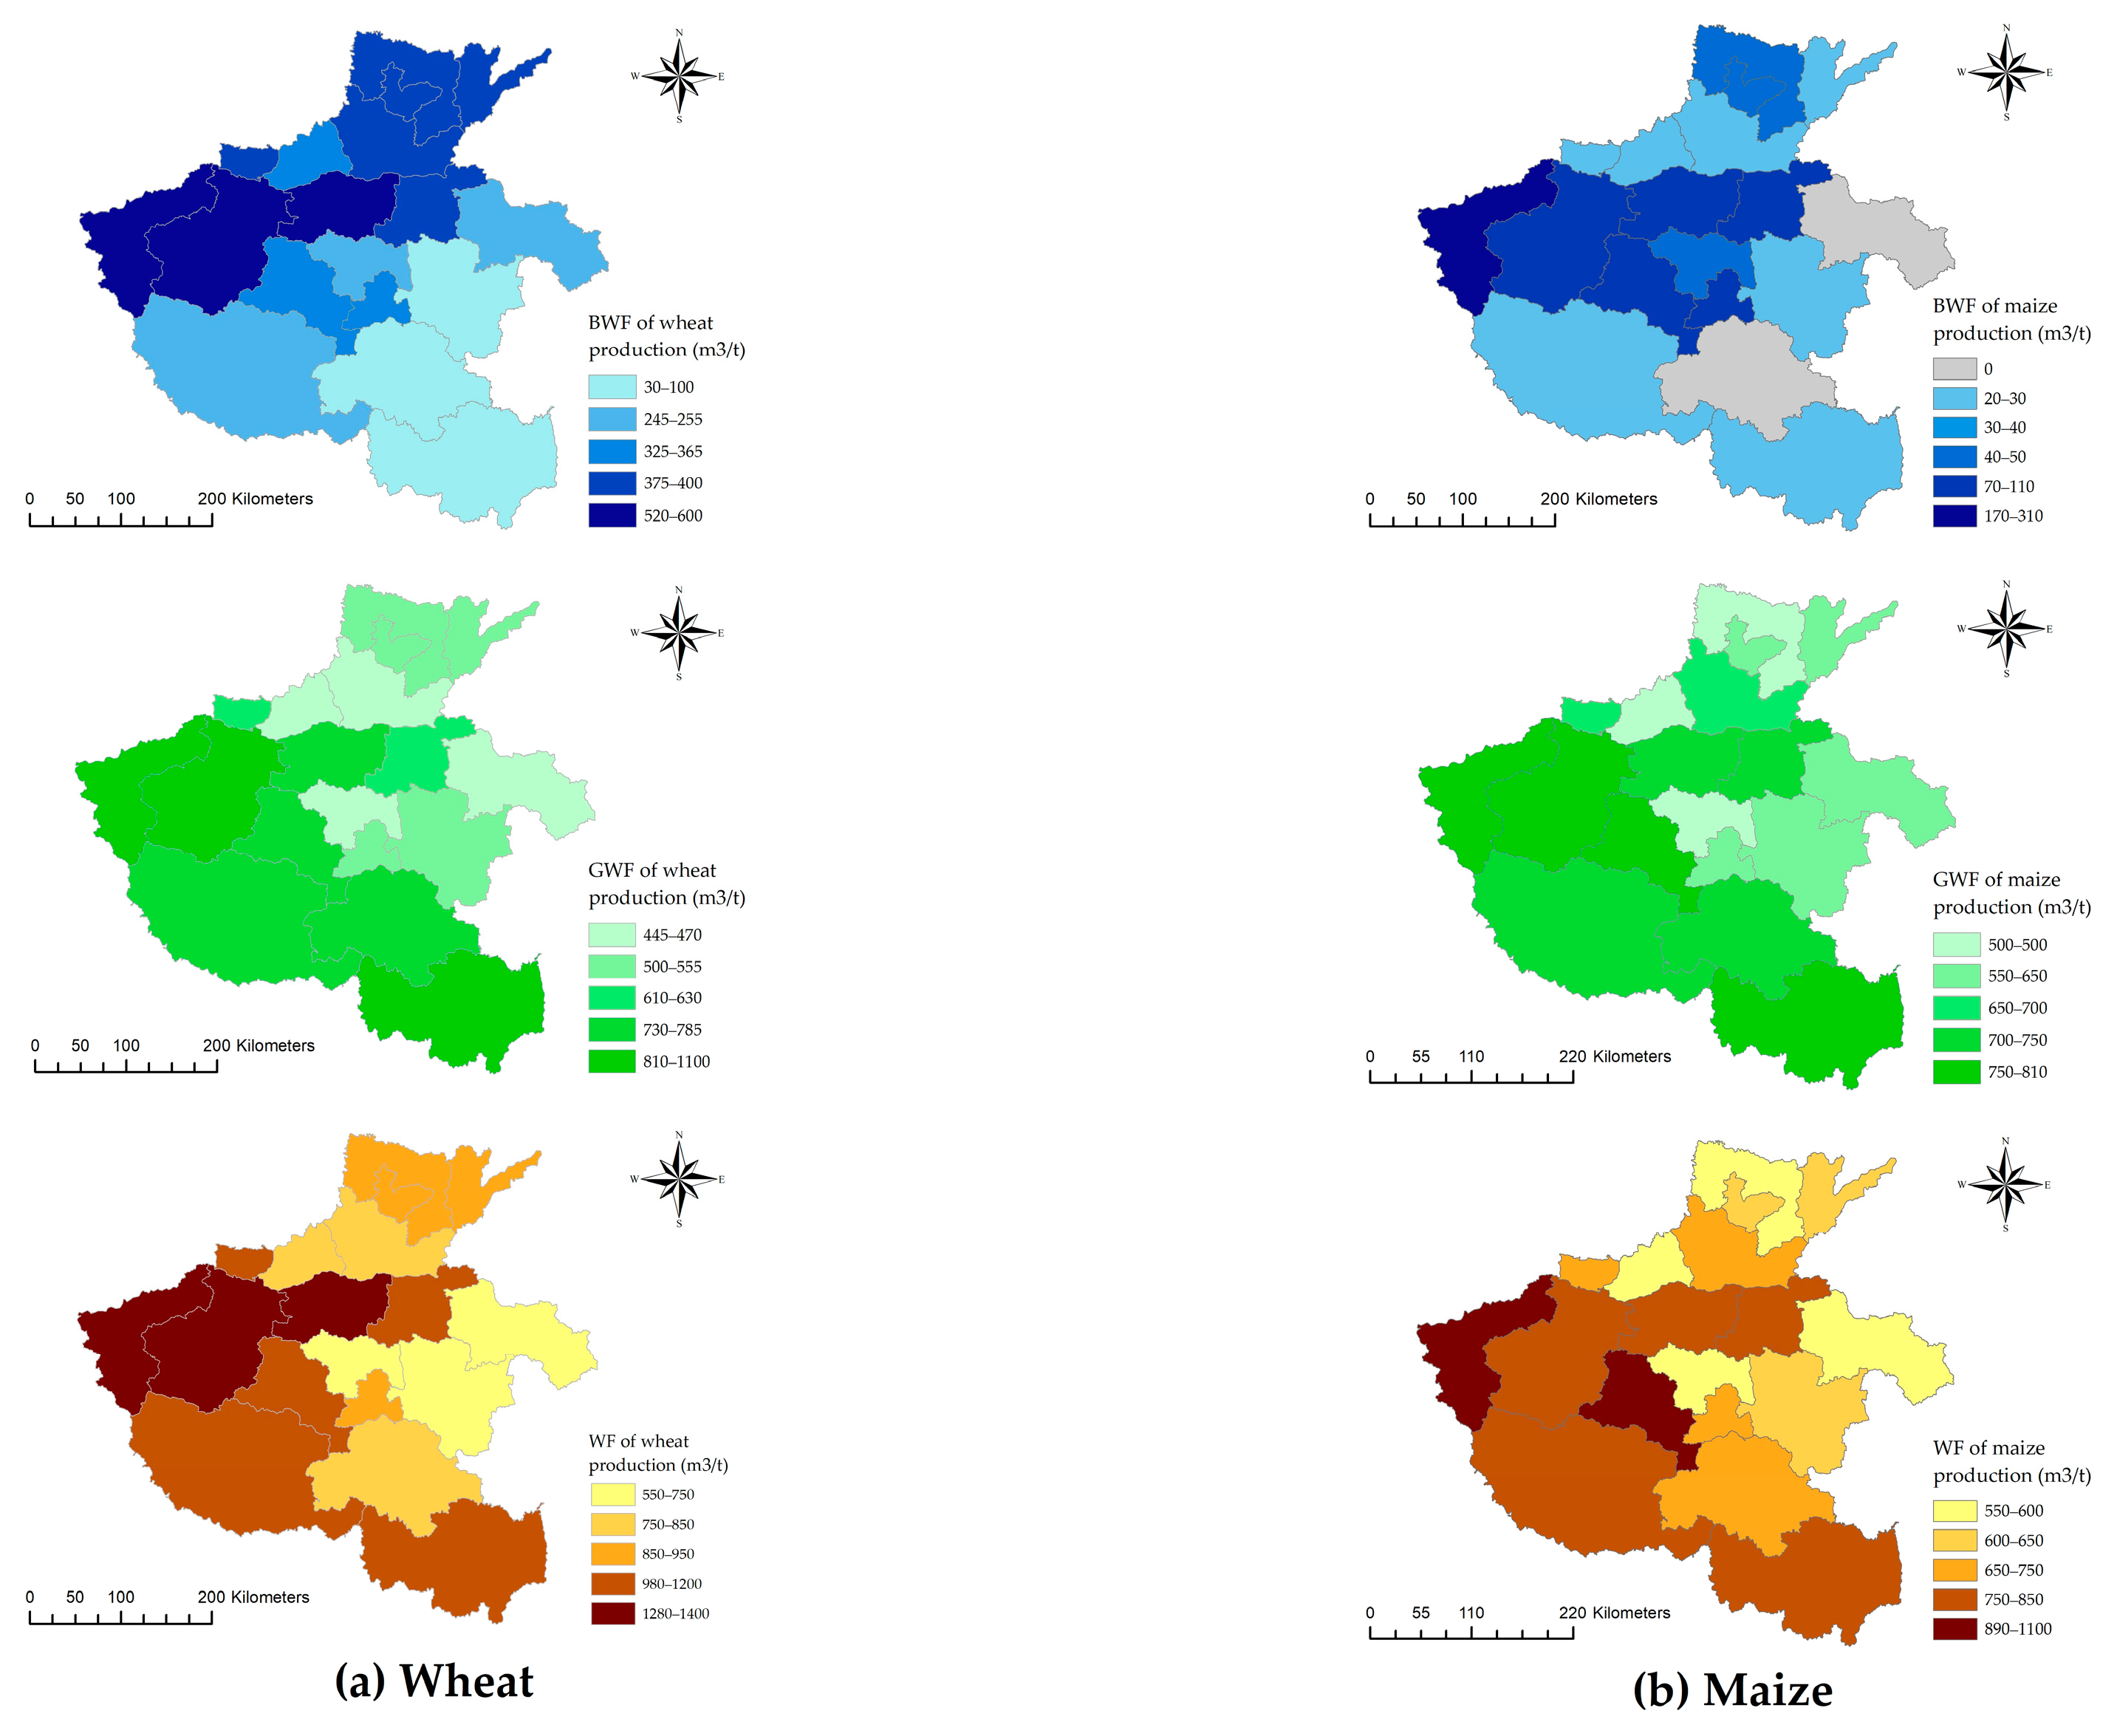
We averaged the WF (m3/t) of wheat/maize production for each city in Henan Province from 2006 to 2016, and showed their spatial distribution in Figure 2. The BWF (m3/t) of wheat was higher in western and northern Henan, but lower in southern Henan. The highest was found in San Menxia (583 m3/t), followed by Zhengzhou (544 m3/t) and Luoyang (524 m3/t), and the lowest was found in Zhoukou (33 m3/t), Zhu Madian (34 m3/t), and Xinyang (94 m3/t). The WF (m3/t) of wheat was higher in central Henan, western Henan, and southern Henan, but lower in eastern Henan. The highest values were found in San Menxia (1400 m3/t), Luoyang (1349 m3/t), and Zhengzhou (1280 m3/t), while the lowest values were found in Zhoukou (586 m3/t) and Shangqiu (724 m3/t).
The blue WF of maize was higher In western and central Henan, but lower in eastern and southern Henan. The BWF of maize in Zhengzhou (109 m3/t), San Menxia (174 m3/t), Ping Dingshan (105 m3/t), Shangqiu, and Zhu Madian was 0. In the central, western, and southern Henan, the WF of maize production was higher and in northern Henan it was lower. Zhengzhou (1034 m3/t), Sanmenxia (966 m3/t), Ping Dingshan (893 m3/t), Shangqiu (559 m3/t), and Jiaozuo (552 m3/t) were the lowest in the province.
3.2. Sustainability of Blue Water Footprints of Wheat and Maize Production
Mekonnen and Hoekstra [7] calculated the fraction of unsustainable global blue water footprint according to the environmental flow standard and available renewable water resources. We assessed the sustainability of local wheat and maize production through the annual fraction of the unsustainable blue water footprint of Henan obtained from them. According to our estimation, the blue water footprint of major crops production in Henan is unsustainable.
3.2.1. Wheat
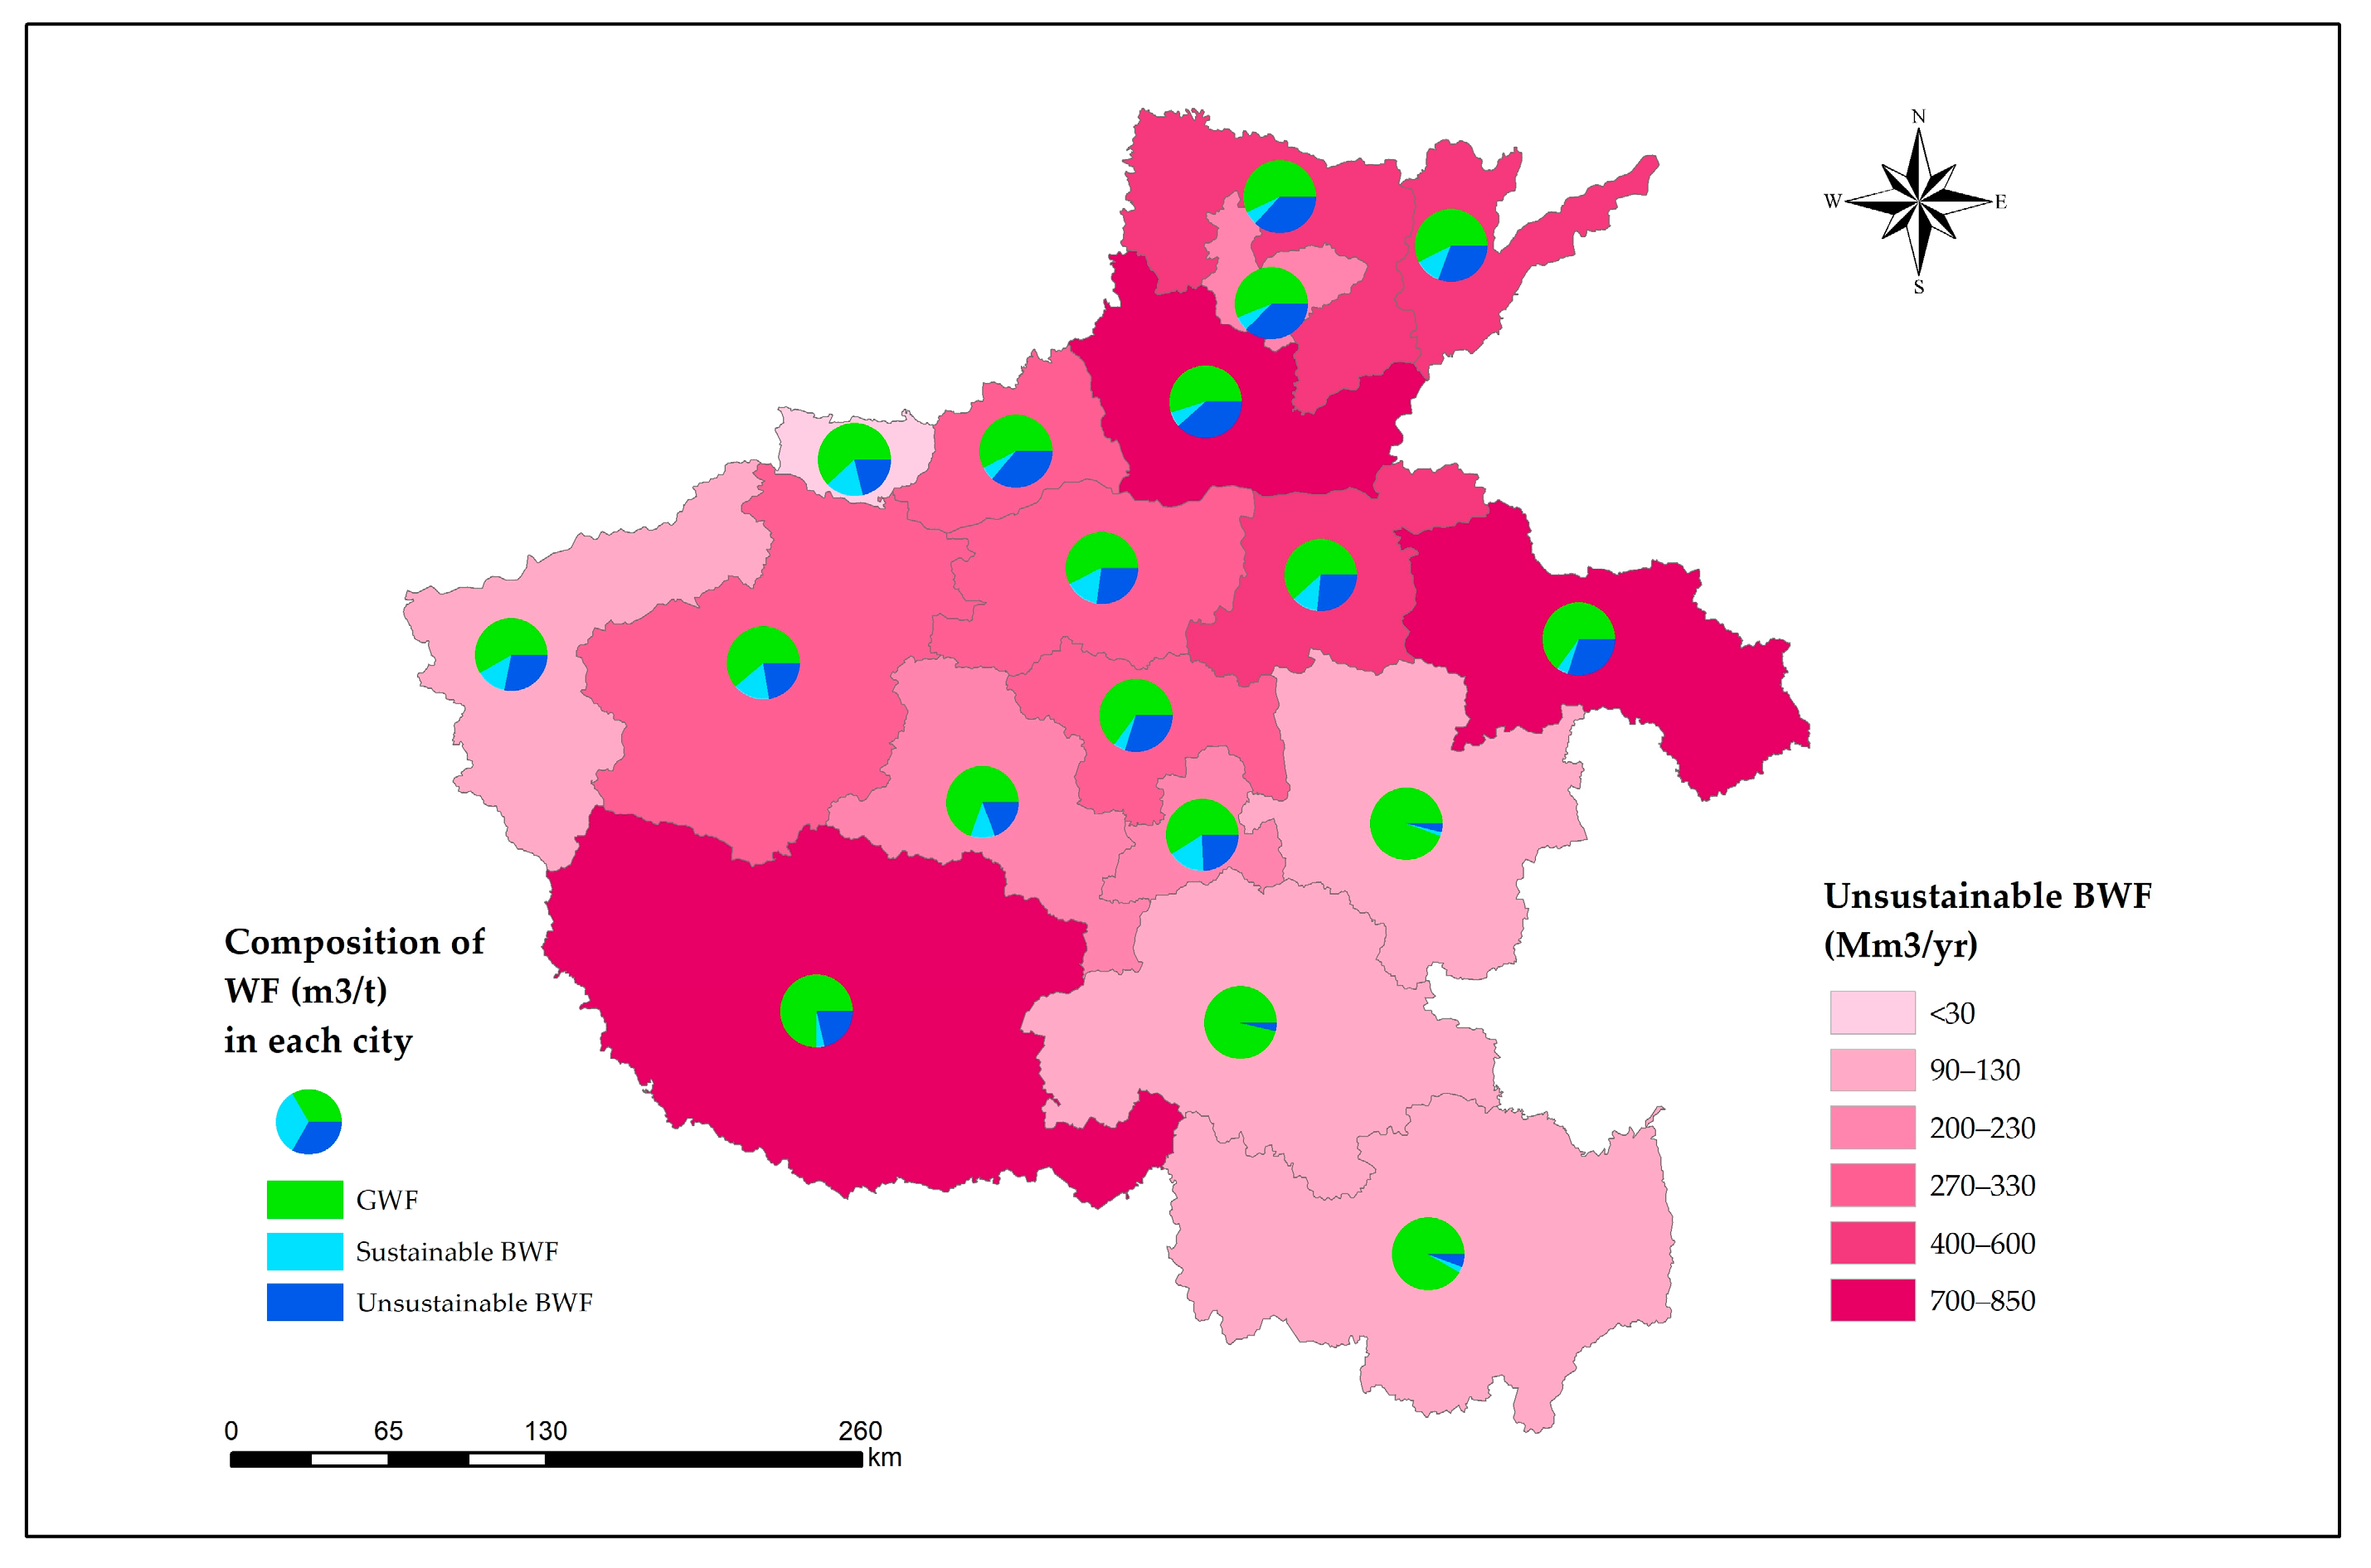
According to calculation, the wheat production in the province consumes an average of 7914 million m3 (Mm3) of blue water every year, of which about 77% is unsustainable. In Figure 3, we show the spatial distribution of unsustainable blue water consumed by wheat production in Henan Province, and the proportion of green water, sustainable blue water, and unsustainable blue water in the water footprint per ton of wheat production in each city.
From the perspective of water footprint components per ton of wheat production, the proportion of blue water (sustainable and unsustainable) footprint per ton of wheat production in the five northern cities and the eastern and western cities was about 40%, but there is a big difference between the proportion of sustainable and unsustainable blue water among these cities. The proportion of unsustainable blue water in five cities in northern Henan was the highest: Xinxiang (38%), Anyan (37%), Hebi (37%), Jiaozuo (36%), and Puyang (31%). The proportion of sustainable blue WF was only about 5%. The proportion of unsustainable blue WF in central, western, and eastern Henan was about 20–30%, and the proportion of sustainable blue water was about 15%, except in Xuchang (5%), Shangqiu (5%), and Nanyang (4%). In addition, the proportion of unsustainable blue WF in the three cities in the southeast was relatively low: Zhoukou (4%), Zhu Madian (4%), and Xinyang (6%). The proportion of sustainable blue water was about 2%, and the total proportion of blue water footprints does not exceed 10%. Since the three cities are located in a humid zone, this may have something to do with the climate. However, Nanyang is also in the humid zone, with the proportion of unsustainable blue water being 21%, and the proportion of sustainable blue water being 4%. It can be seen that the climate humidity is not completely positively related to the proportion of blue water consumed by crop production.
From the perspective of the annual total unsustainable blue WF, Xinxiang (715.3 Mm3/year), Shangqiu (838.5 Mm3/year), and Nanyang (741.5 Mm3/year) have the highest consumption, accounting for 38% of the total. The consumption of central and northern cities closely followed, at about 270 Mm3/year–600 Mm3/year, while that of western and southeast cities was less than 230 Mm3/year. In the cities with a high total unsustainable blue WF, the unsustainable blue WF per ton of wheat production was more than 20%, and the wheat planting area and yield were also high. Taking Xinxiang as an example, the average wheat planting area from 2006 to 2016 was 332,000 hectares, and the average annual yield was 2,230,312 tons.
3.2.2. Maize
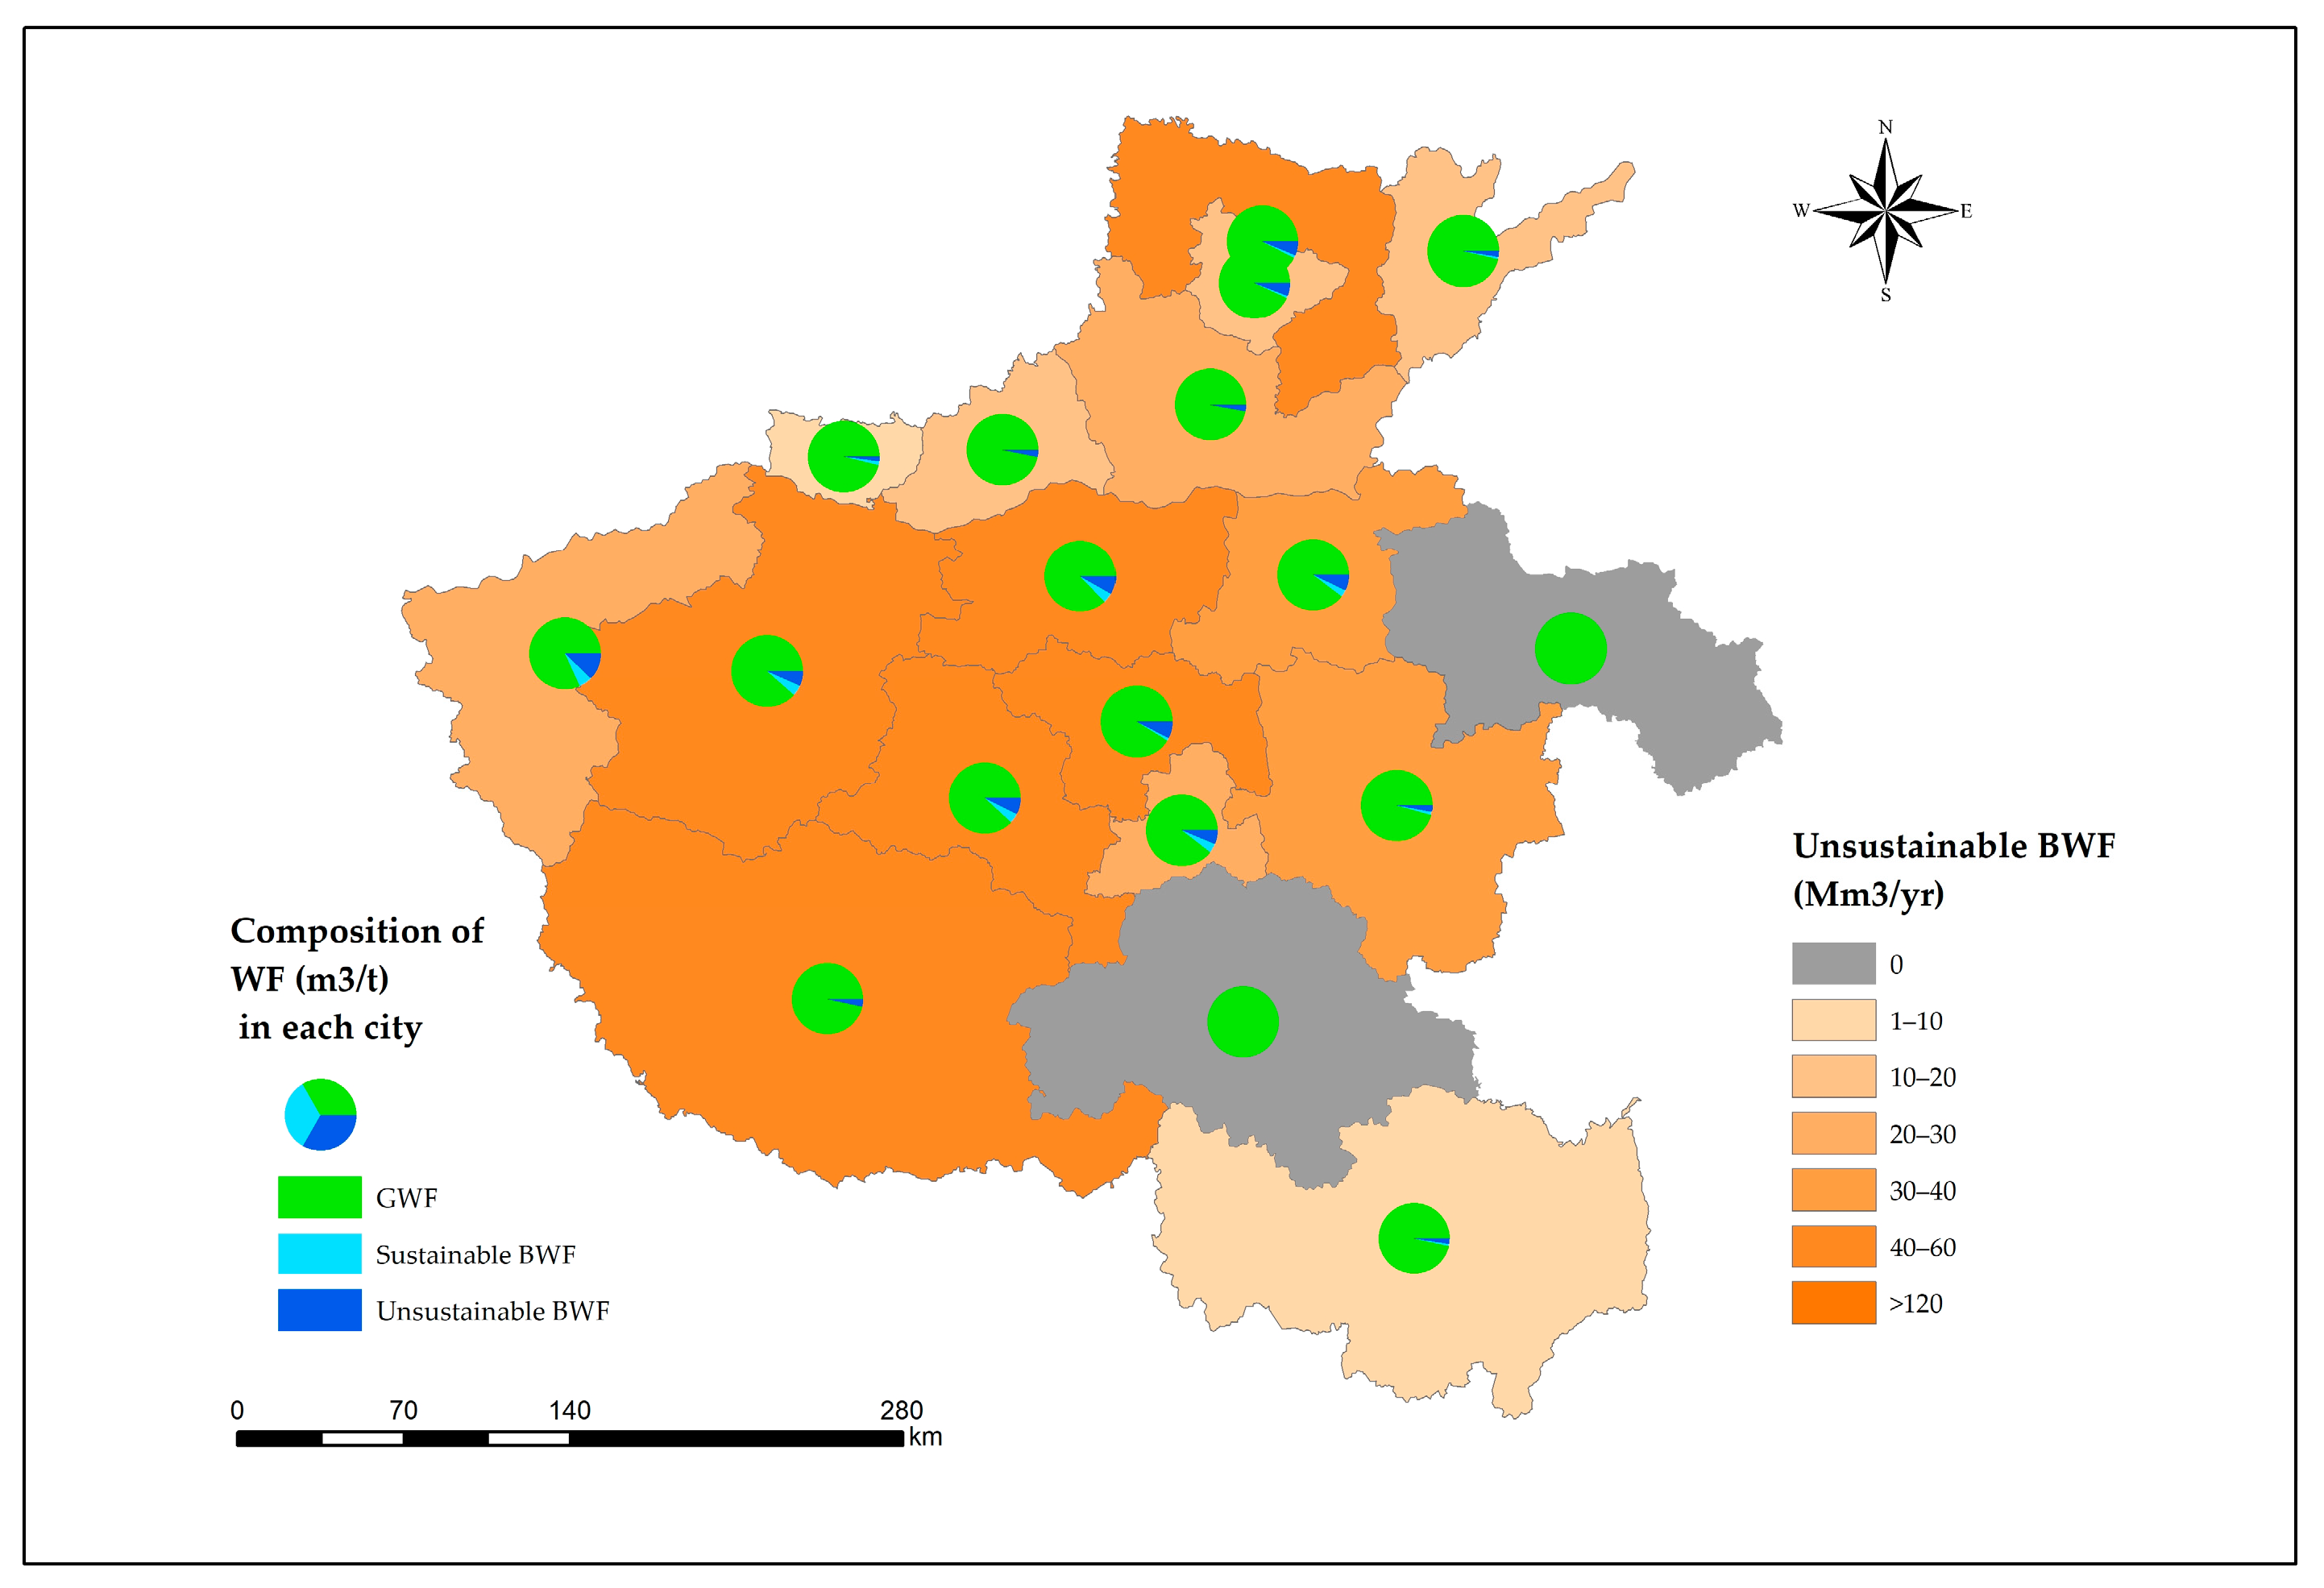
The maize production in 18 cities consumed 703 million m3 of blue water. Although this is only about 9% that of wheat production, about 70% of it was unsustainable. As we did in Figure 3, Figure 4 shows the spatial distribution of unsustainable blue water consumed by maize production, and the proportion of green WF, sustainable blue WF, and unsustainable blue WF in the water footprint per ton of maize production in each city.
Although maize production has a smaller dependence on blue water compared to wheat, the proportion of blue water (m3/t) of maize production of the total WF (m3/t) of maize production in 18 cities was mostly around 10%. Additionally, there were 12 cities where the unsustainable blue WF (Mm3/year) of the total blue WF (Mm3/year) were above 50%.
In terms of consumption of unsustainable blue WF (Mm3/year), Anyang (52.6 Mm3/year), Zhengzhou (51 Mm3/year), Ping Dingshan (50.7 Mm3/year), Luoyang (50.3 Mm3/year), Xuchang (43 Mm3/year), and Nanyang (40.3 Mm3/year) were the six top cities. The results showed that the maize production in Shangqiu and Zhu Madian completely consumed green water, so the consumption of blue water was 0.
Zhengzhou’s maize production averages 732,719 tons per year, less than 60% of Xinxiang, its neighbor to the north. However, the proportion of unsustainable blue WF (m3/t) in Zhengzhou (70 m3/t) was nearly three times that of Xinxiang (20 m3/t), resulting in the average annual unsustainable blue WF (Mm3/year) consumed by Zhengzhou’s maize production (51 Mm3/year) being two times that of Xinxiang (25 Mm3/year). Regions with a very high proportion of unsustainable blue water per unit yield, even under the condition of low yield, will consume more unsustainable blue water than regions with a low proportion and high crop yield. The total amount of unsustainable blue WF consumed by maize production in the whole province was 493 Mm3/year, and that of wheat was 6065.4 Mm3/year, which was above 10 times that of maize.
3.3. Blue Water Footprint Reduction
The Optimal/Sub-Optimal BWF Benchmark Level
In this paper, four different levels of BWF benchmarks were calculated for wheat and maize production in Henan Province. The results are shown in Table 2. These benchmark values provide a comparative basis for the blue water footprint of wheat and maize production consumption in each city. If the wheat production of all cities in the province were to reduce their BWF using the first or second BWF benchmarks as the target, the crop production in Henan Province would achieve a blue water savings of 2742 million m3/year or 375 million m3/year, accounting for about 36% and 5% of the province’s average annual BWF of wheat production, respectively. In the province, only one of the 18 cities currently has a wheat BWF below the first BWF benchmark, 11 cities have it below the second benchmark, and 13 cities have it below the third benchmark.
For maize production, if the BWF of maize production in each city was reduced to the first or fourth BWF benchmark levels, there would be a corresponding blue water savings of 214 million m3/year or 44 million m3/year, representing about 6% and 1.2% of the BWF of maize production, respectively. Compared with their four benchmark values, only two cities in the province have values lower than the first and second benchmarks of maize production BWFs, and four and eleven cities have values lower than the third and fourth benchmarks of maize BWFs, respectively.
We selected two benchmark values for wheat and maize production BWFs in Henan Province as the optimal and the sub-optimal benchmark levels of the BWF. We choose the first of the four calculated benchmark values, the lowest, as the optimal benchmark level for both wheat and maize production because this level will lead to the greatest blue water savings, and in theory, it can be achieved [13]. Then we compared the blue water savings generated by each city when reducing their current BWF down to four different BWF benchmark values. We found that about half of the cities in the province were unable to meet the second benchmark value of BWF for wheat production and the fourth benchmark value of BWF for maize production. Therefore, we selected them as the sub-optimal benchmark for wheat and maize production BWFs. We believe that it would be more practical for these cities to use the sub-optimal benchmark level as an initial BWF reduction target.
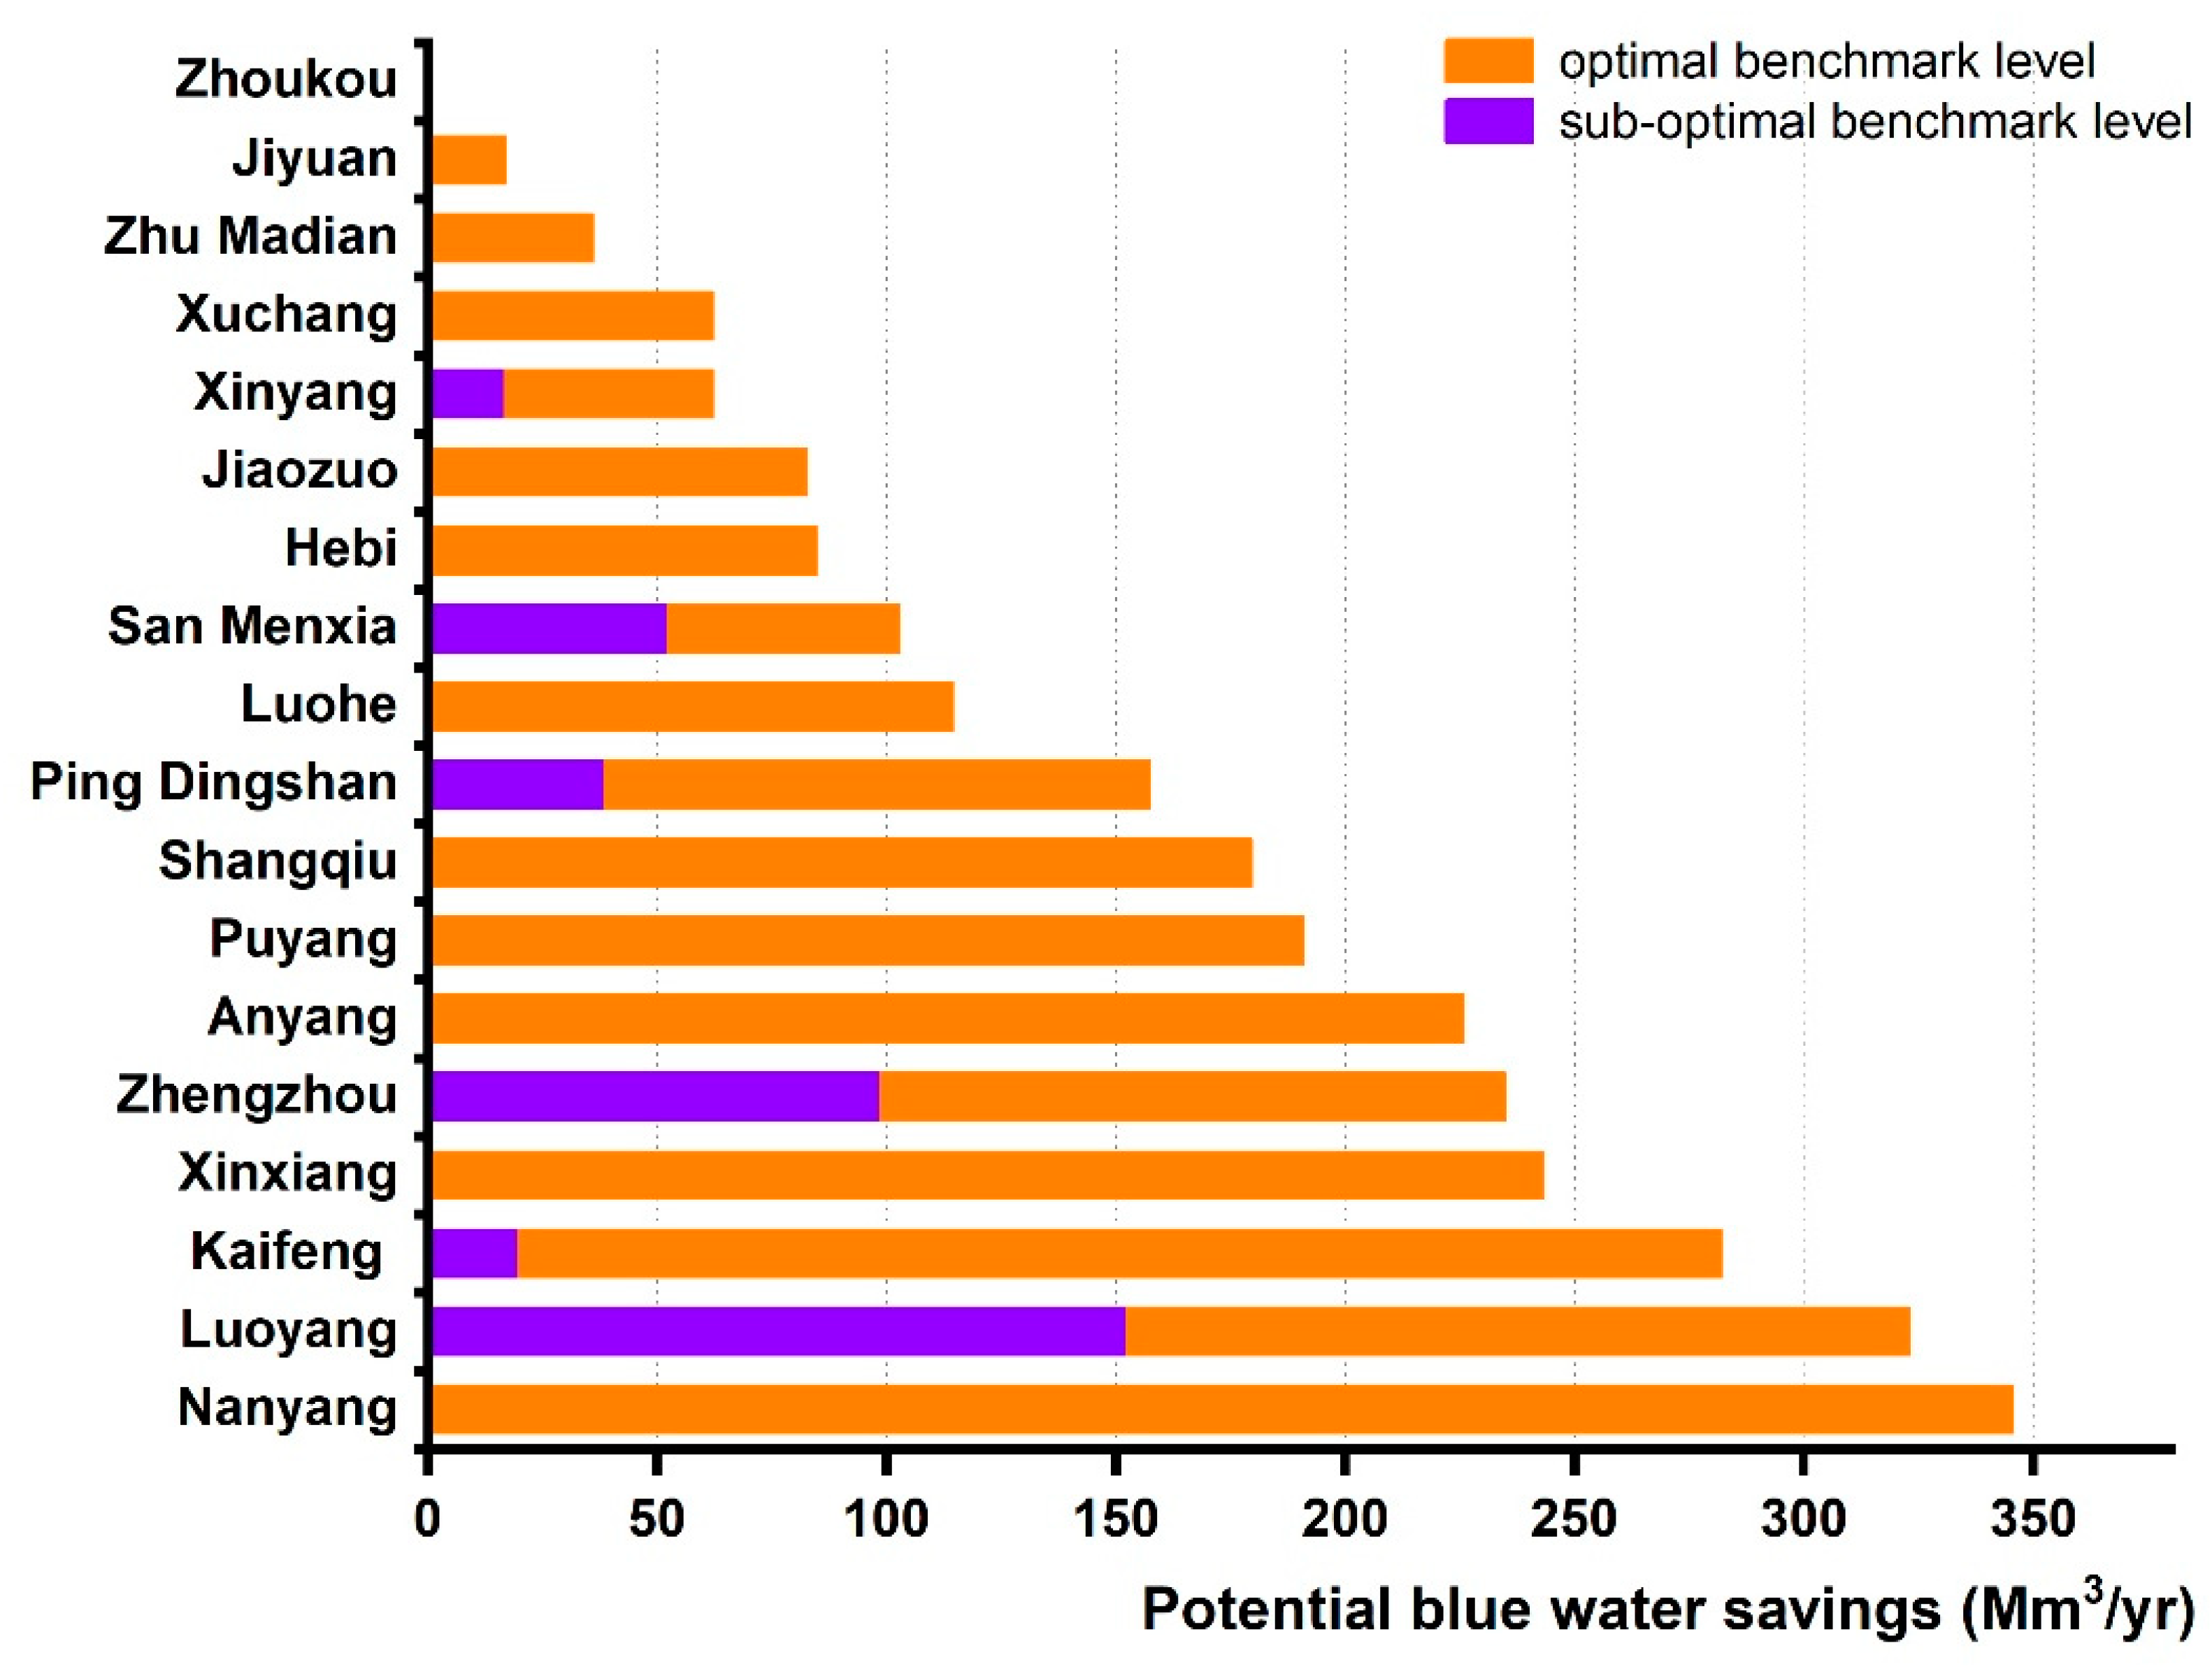
Taking the optimal and the sub-optimal BWF benchmark levels of wheat production as the reduction target of the current BWF, the corresponding blue water savings in 18 cities had different performances, as shown in Figure 5.
It can be seen that the current wheat production BWF in Zhoukou has been lower than the optimal benchmark value, so the potential blue water savings under the standard of this study is 0. Nanyang has the highest potential blue water savings under the optimal benchmark value (345 Mm3), while the blue water savings under the sub-optimal benchmark value is 0. This is because although the BWF per unit yield of wheat in Nanyang is no higher than the sub-optimal benchmark value, its wheat yield is very high. Therefore, the reduction of wheat BWF targeted at the optimal benchmark in Nanyang can bring much higher blue water savings than those cities with very low yield and BWF per unit yield above the sub-optimal benchmark. In Xinyang, Sanmenxia, Pingdingshan, Luoyang, Kaifeng, and Zhengzhou, 375 Mm3 of blue water can be saved if the current BWF is reduced to the sub-optimal benchmark, while 1161 Mm3 of blue water can be saved achieving the optimal benchmark. However, these are the six cities with the highest BWF per unit yield of wheat in the province. It would be more practical to set the sub-optimal benchmark as a BWF reduction target, since it is likely to be very difficult to use the optimal benchmark as an initial reduction target.
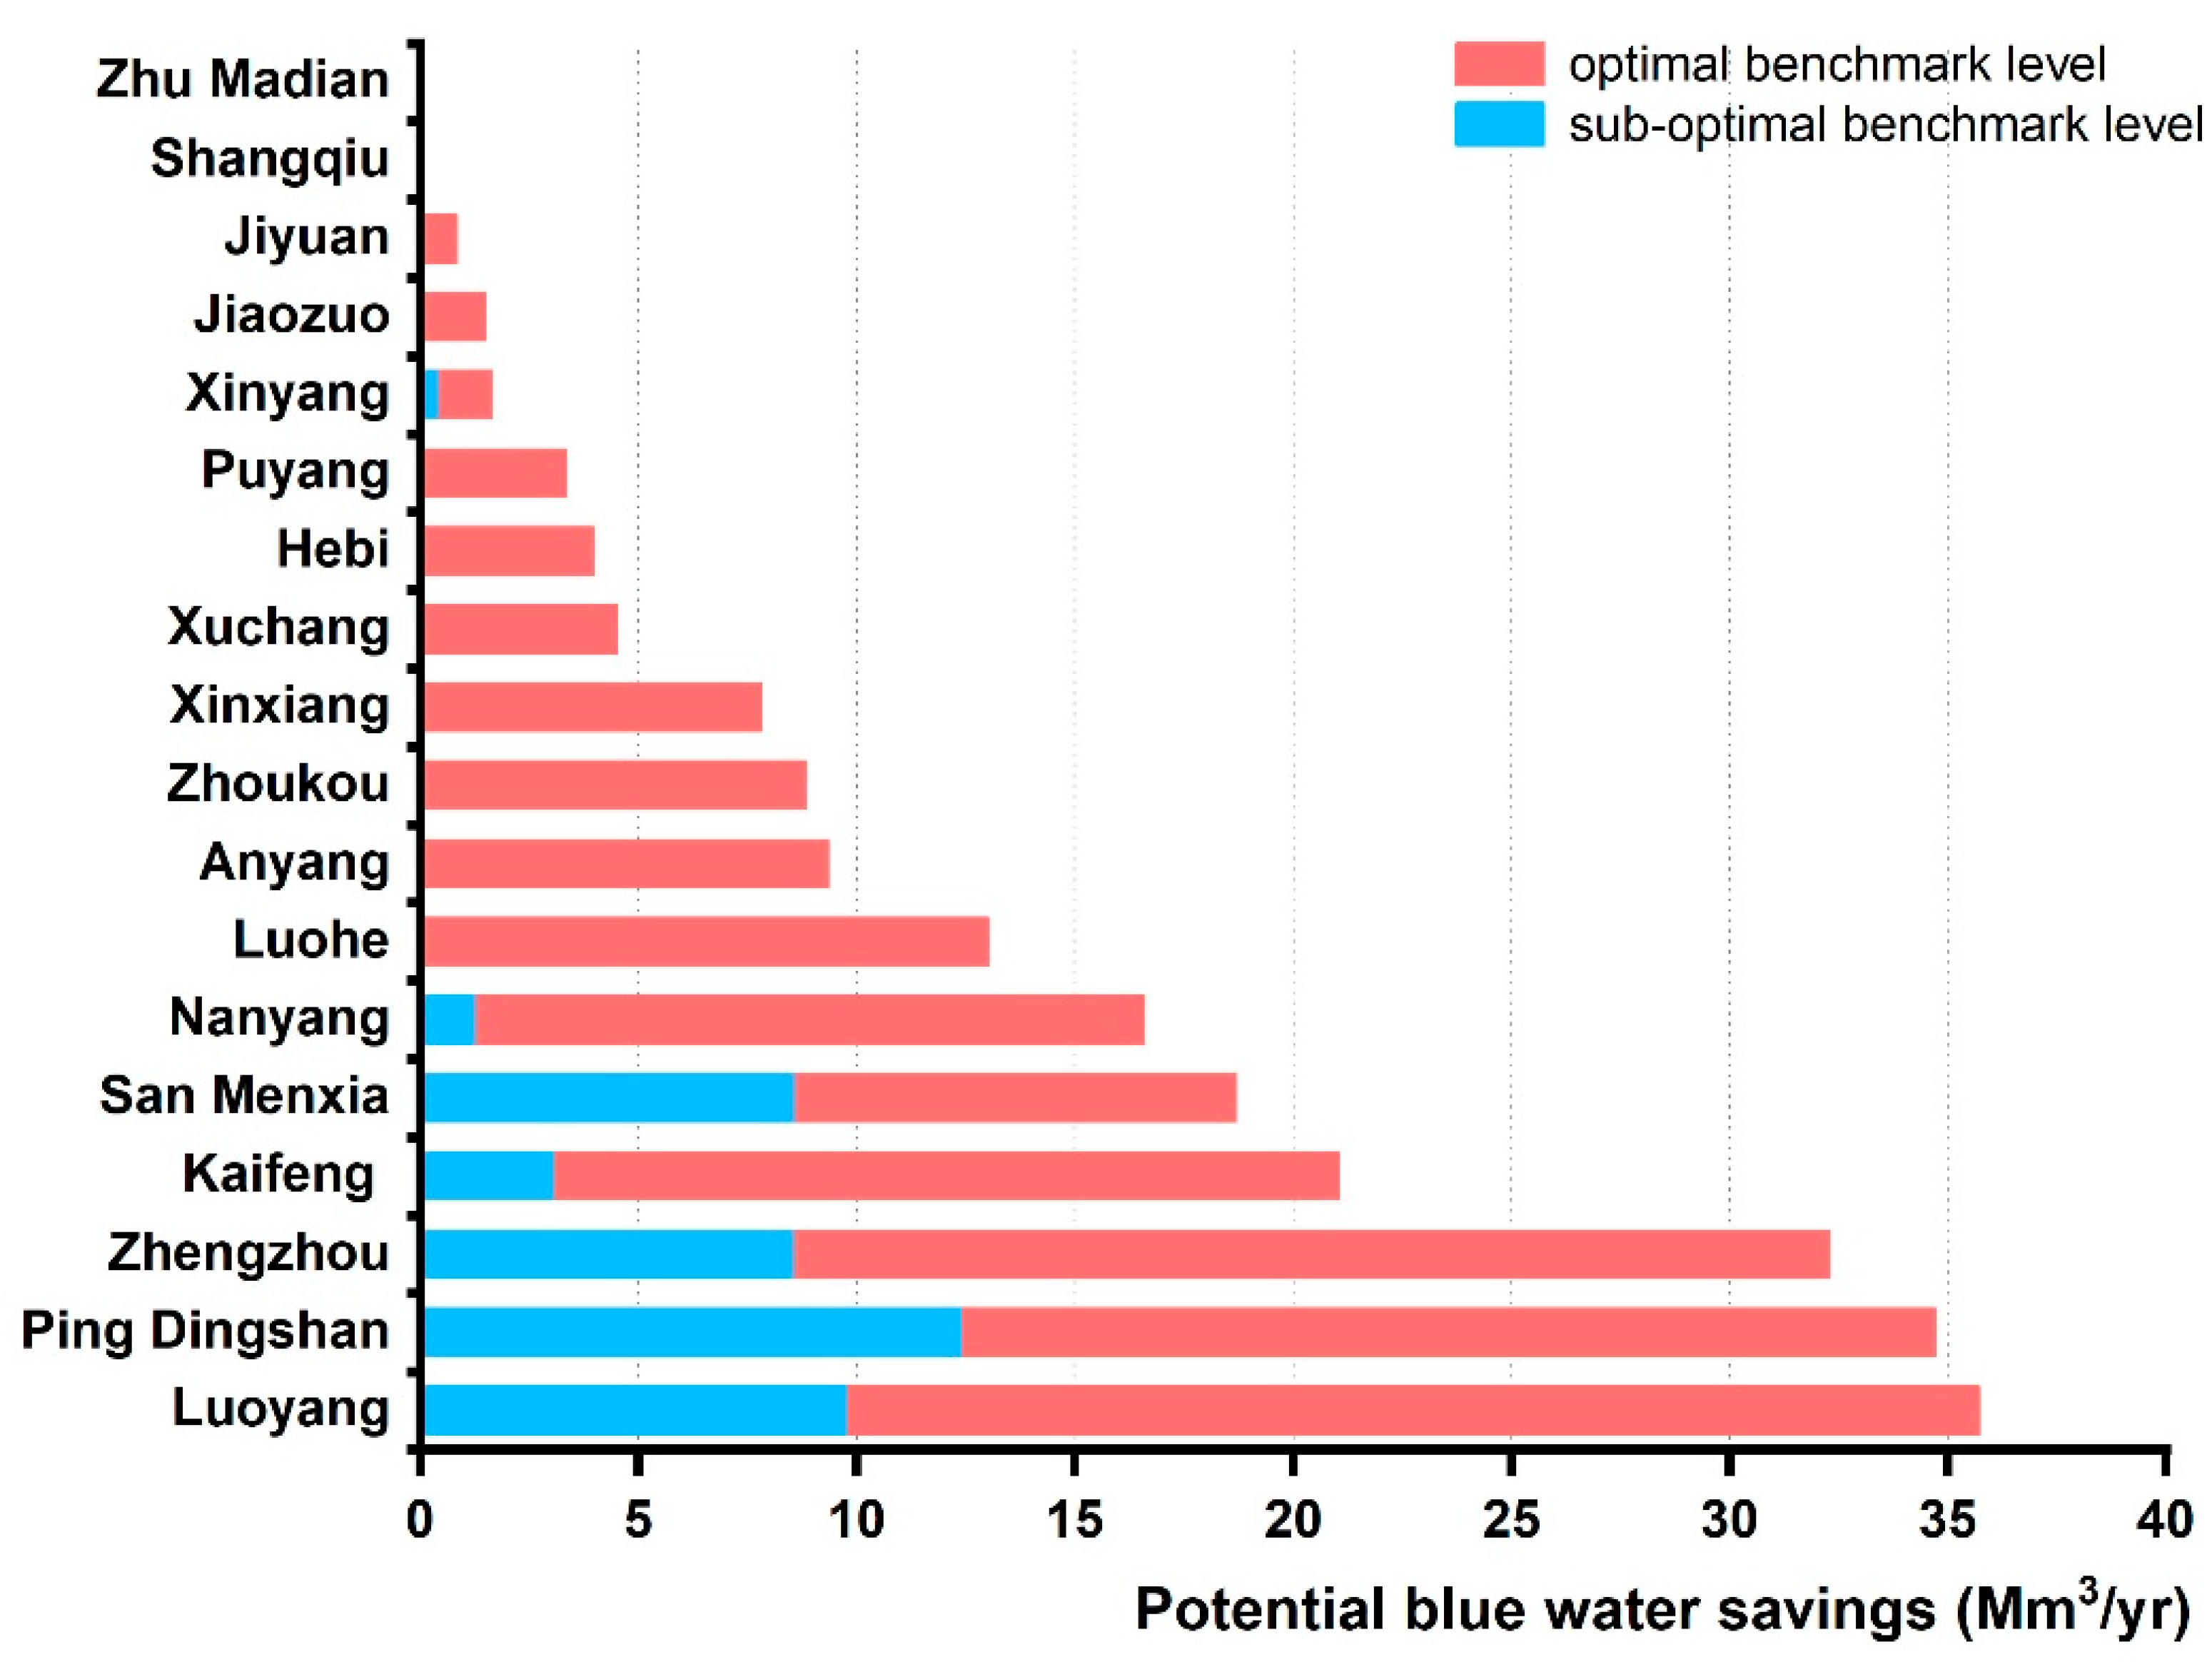
For maize production, Figure 6 shows the potential blue water savings of maize production in 18 cities with the reduction to the optimal and sub-optimal WF benchmark levels correspondingly.
With a reduction to the optimal benchmark level, the potential blue water savings of maize production in Shangqiu and Zhu Madian were 0. Potential blue water savings of maize production in the other 16 cities was about 214 Million m3 in total, accounting for about 30% of the blue WF of maize production. When reducing the WF of maize production to the sub-optimal benchmark level, there are 11 cities with a potential blue water savings of 0, while about 44 Million m3 of potential blue water savings could be attained in the other 7 cities, representing about 6% of the blue water footprint of maize production.
4. Discussion
This study first estimated the BWF and GWF of the major crops wheat and maize in Henan Province, then evaluated the sustainability of the BWF of major crops’ production, and finally calculated the potential BWF reduction and blue water savings. Part of this work was accomplished by combining the data extracted from two previous studies of Mekonnen and Hoekstra [7,13]. Comparing to Cao [15], the BWF of wheat and maize production in Henan Province we estimated is slightly lower and the GWF is slightly higher. Both studies simulated evaporation using the CROPWAT 8.0 model, but we chose the irrigation schedule option in the model while Cao chose the CWR crop water requirement option in the model. The differences in these two options can partly explain the differences in results. In the assessment of unsustainable BWFs and potential BWF reductions, the results are subject to a number of limitations and uncertainties inherent to the data used in the current study. For example, one of the two studies by Mekonnen and Hoekstra [7] did not consider the effect of artificial reservoirs on runoff, while the other [13] did not take climate and soil factors into consideration.
The figures we reported regarding water use in this paper should be considered as an indicator that shows the efficiency and sustainability of water use in crop production in Henan Province instead of absolute values.
This study only focuses on the sustainability of blue water, but as a resource that consumes a higher proportion of crop production per unit of output, green water should also be considered [16,17]. In addition, the impact of water quality on the sustainability and effectiveness of blue water, as a factor that has been neglected all along, should be taken into consideration in future studies [7].
The estimates of unsustainable blue water and BWF reduction are rough. In estimating the BWF reductions, we assume that the blue-green ratio in the current CWF is the same as in the WF benchmark. This means that the blue-green ratio remains the same when reducing the CWF to the WF benchmark level. If the reduction of CWF is achieved by reducing evaporation, this assumption will be questioned. However, it has been pointed out that CWF reduction is mainly achieved by increasing yield and less by reducing evapotranspiration around the world [6,18,19,20], which supports the hypothesis that when the WF is reduced to the baseline level, the blue-green ratio will remain unchanged [6,7].
Some views hold that it is not necessary to determine different regional benchmark values according to the crop growth conditions or regional economic development degree of each region. First of all, as far as crop growth conditions are concerned, climate and soil are non-negligible factors when considering evapotranspiration and yield of farmland; however, the major factor in the BWF and GWF (m3/t) is agricultural management, not the crop growing environment [6,21]. Through proper nutrition, water, and soil management, most crops in different climatic regions of the world can significantly increase their yields without increasing, or even reducing, field evapotranspiration [22]. Secondly, in terms of regional economic development, it has been proven that the water productivity associated with the best 10% of global crop yield can be found in both low-income and high-income countries [13]. However, as proposed by [23,24], it would be beneficial to develop a WF benchmark based on the achievable goals of the best available technologies and practices. After synthesizing the two perspectives, instead of taking the WF of the 10th percentile of global crop production as a default benchmark level like other researchers do, we provide two criteria, the optimal benchmark level and the sub-optimal benchmark level, with the latter one selected from a provincial perspective based on the number of cities with estimated blue water savings of 0.
Henan Province is a major agricultural and grain-producing province in China. Food production in this place plays an important role in the country and has made important contributions to national food security. However, long-term and large-scale grain production has caused serious pressure on its water resources. The research results show that blue water consumption caused by main crop production in Henan Province is highly unsustainable. With 1.41 billion people in China, Henan Province, as “the granary of China”, meets the food needs of 18% of the world’s population. Sustainable food production and water use in this region should be considered significant issues on a global scale. Additionally, because of the limited water resources in the global cycle and their importance for survival and development, the water problem in a region should not be regarded as a problem only in that region or within the region’s country, but should be given due consideration to the responsibility of the regional water problem in terms of global water security.
This study will be helpful for the government and enterprises to formulate appropriate strategies to assess the sustainability of water for crop production and estimate potential blue water conservation in Henan Province. Previous studies on reducing water pressure have shown that water productivity of irrigation and rain-fed crops needs to be improved by increasing yields and reducing unwanted evaporation [18,20]. Secondly, it can be coordinated with other policy instruments such as distributing water from low-value crops to high-value crops, controlling the expansion of irrigation area [25,26], and setting WF caps for each watershed [25,27]. Finally, Henan Province, as one of the top three agricultural provinces in grain dispatch, can take the value of virtual water into consideration and make additional compensation in food price setting.
5. Conclusions
As an important grain base, the sustainability of agricultural development and water resource utilization in Henan Province has not been paid enough attention. The major findings of this study are as follows: (i) The WF of wheat production is higher in the central, the western, and the northern parts of Henan. The WF of maize production is higher in the central and the western parts of Henan. (ii) The proportion of unsustainable BWF consumption in wheat production in most areas of Henan Province is about 30%, except the southeastern part of Henan Province. (iii) Reducing the BWF of current wheat production in Henan Province to the optimal and sub-optimal benchmark levels, respectively, could bring blue water savings of 2741 Mm3/year and 375 Mm3/year. Reducing the BWF of current maize production in Henan Province to the optimal and sub-optimal benchmark levels, respectively, could bring blue water savings of 214 Mm3/year and 44 Mm3/year.
Author Contributions
All three authors have participated in the design of this study, methodology, software, validation, and formal analysis, Y.L.; data curation, visualization and the original draft written, Y.Y.; investigation, editing, and writing the final draft, W.Z. All authors have read and agreed to the published version of the manuscript.
Funding
This research was funded by the National Natural Science Foundation of China (No. 51979119); the National Key Research and Development Program of China: Study on simultaneous wet or dry years in the Yangtze River and the Yellow River under changing environment and water allocation in extreme dry years (No.2022YFC3202300); the Innovative Education Program for Graduate Students at North China University of Water Resources and Electric Power, China (No. YK-2021-64).
Data Availability Statement
Publicly available datasets were analyzed in this study. The climate data can be found here: CMDC (cma.cn) (accessed on 10 January 2017). The parameters of crops can be found here: Crop evapotranspiration. Guidelines for computing crop water requirements (fao.org) (accessed on 12 June 2022). The sowing and harvesting date of crops can be found here: Henan Meteorological Bureau (cma.gov.cn) (accessed on 2 August 2022). The yearly of Henan was obtained from professor Mesfin M. Mekonnen and are available from him with his permission (obtained on 29 July 2022). The WF benchmarks are openly available in Web of Science at https://doi.org/10.1016/j.ecolind.2014.06.013, reference number [13] (accessed on 6 July 2022).
Conflicts of Interest
The authors declare no conflict of interest.
References
- Liu, J.Y.; Hu, L.M. China Agriculture Yearbook 2020, 1st ed.; China Agriculture Press: Beijing, China, 2021. [Google Scholar]
- Ren, Q. The Water Resources Bulletin of Henan Province 2021, 1st ed.; Department of Water Resources of Henan Province Publications: Zhengzhou, China, 2022. [Google Scholar]
- UN. World Population Prospects: The 2015 Revision, Key Findings and Advance Tables; UN, Department of Economic and Social Affairs, Population Division: New York, NY, USA, 2015. [Google Scholar]
- Tilman, D.; Balzer, C.; Hill, J.; Befort, B.L. Global food demand and the sustainable intensification of agriculture. Proc. Natl. Acad. Sci. USA 2011, 108, 20260–20264. [Google Scholar] [CrossRef] [Green Version]
- Hoekstra, A.Y. Virtual Water Trade: Proceedings of the International Expert Meeting on Virtual Water Trade; IHE: Delft, The Netherlands, 2003. [Google Scholar]
- Mekonnen, M.M.; Hoekstra, A.Y. The green, blue and grey water footprint of crops and derived crop products. Hydrol. Earth Syst. Sci. 2011, 15, 1577–1600. [Google Scholar] [CrossRef] [Green Version]
- Mekonnen, M.M.; Hoekstra, A.Y. Sustainability of the blue water footprint of crops. Adv. Water Resour. 2020, 143, 103679. [Google Scholar] [CrossRef]
- Siebert, S.; Doll, P. Quantifying blue and green virtual water contents in global crop production as well as potential production losses without irrigation. J. Hydrol. 2010, 384, 198–217. [Google Scholar] [CrossRef]
- Pfister, S.; Bayer, P. Monthly water stress: Spatially and temporally explicit consumptive water footprint of global crop production. J. Clean. Prod. 2014, 73, 52–62. [Google Scholar] [CrossRef]
- Sun, S.K.; Wu, P.T.; Wang, Y.B.; Zhao, X.N. The virtual water content of major grain crops and virtual water flows between regions in China. J. Sci. Food Agric. 2013, 93, 1427–1437. [Google Scholar] [CrossRef] [PubMed]
- Sun, S.K.; Wu, P.T.; Wang, Y.B.; Zhao, X.N.; Liu, J.; Zhang, X.H. The impacts of interannual climate variability and agricultural inputs on water footprint of crop production in an irrigation district of China. Sci. Total Environ. 2013, 444, 498–507. [Google Scholar] [CrossRef] [PubMed]
- Hoekstra, A.Y.; Chapagain, A.K.; Aldaya, M.M.; Mekonnen, M.M. The Water Footprint Assessment Manual: Setting the Global Standard, 1st ed.; Earthscan: London, UK, 2011; pp. 123–234. [Google Scholar]
- Mekonnen, M.M.; Hoekstra, A.Y. Water footprint benchmarks for crop production: A first global assessment. Ecol. Indic. 2014, 46, 214–223. [Google Scholar] [CrossRef] [Green Version]
- Martin, S. CROPWAT, 8.0; FAO Land and Water Development Division: Rome, Italy, 2009. [Google Scholar]
- Cao, X.C.; Wu, P.T.; Wang, Y.B.; Zhao, X.N. Assessing blue and green water utilisation in wheat production of China from the perspectives of water footprint and total water use. Hydrol. Earth Syst. Sci. 2014, 18, 3165–3178. [Google Scholar] [CrossRef] [Green Version]
- Schyns, J.F.; Hoekstra, A.Y.; Booij, M.J. Review and classification of indicators of green water availability and scarcity. Hydrol. Earth Syst. Sci. 2015, 19, 4581–4608. [Google Scholar] [CrossRef] [Green Version]
- Schyns, J.F.; Hoekstra, A.Y.; Booij, M.J.; Hogeboom, R.J.; Mekonnen, M.M. Limits to the world’s green water resources for food, feed, fiber, timber, and bioenergy. Proc. Natl. Acad. Sci. USA 2019, 116, 4893–4898. [Google Scholar] [CrossRef] [PubMed] [Green Version]
- Foley, J.A.; Ramankutty, N.; Brauman, K.A.; Cassidy, E.S.; Gerber, J.S.; Johnston, M.; Mueller, N.D.; O’Connell, C.; Ray, D.K.; West, P.C.; et al. Solutions for a cultivated planet. Nature 2011, 478, 337–342. [Google Scholar] [CrossRef] [PubMed] [Green Version]
- Chukalla, A.D.; Krol, M.S.; Hoekstra, A.Y. Green and blue water footprint reduction in irrigated agriculture: Effect of irrigation techniques, irrigation strategies and mulching. Hydrol. Earth Syst. Sci. 2015, 19, 4877–4891. [Google Scholar] [CrossRef] [Green Version]
- Brauman, K.A.; Siebert, S.; Foley, J.A. Improvements in crop water productivity increase water sustainability and food security-a global analysis. Environ. Res. Lett. 2013, 8, 7. [Google Scholar] [CrossRef]
- Rockström, J.; Lannerstad, M.; Falkenmark, M. Assessing the water challenge of a new green revolution in developing countries. Proc. Natl. Acad. Sci. USA 2007, 104, 6253–6260. [Google Scholar] [CrossRef] [PubMed] [Green Version]
- Mueller, N.D.; Gerber, J.S.; Johnston, M.; Ray, D.K.; Ramankutty, N.; Foley, J.A. Closing yield gaps through nutrient and water management. Nature 2012, 490, 254–257. [Google Scholar] [CrossRef] [PubMed]
- Hoekstra, A.Y. The Water Footprint of Modern Consumer Society; Routledge: London, UK, 2013; p. 224. [Google Scholar]
- Hoekstra, A.Y. Wise Freshwater Allocation: Water Footprint Caps by River Basin, Benchmarks by Product and Fair Water Footprint Shares by Community; Value of Water Research Report Series No. 63; UNESCO-IHE: Delft, The Netherlands, 2013. [Google Scholar]
- Wada, Y.; van Beek, L.P.H.; van Kempen, C.M.; Reckman, J.; Vasak, S.; Bierkens, M.F.P. Global depletion of groundwater resources. Geophys. Res. Lett. 2010, 37, L20402. [Google Scholar] [CrossRef] [Green Version]
- Grafton, R.Q.; Williams, J.; Perry, C.J.; Molle, F.; Ringler, C.; Steduto, P.; Udall, B.; Wheeler, S.A.; Wang, Y.; Garrick, D.; et al. The paradox of irrigation efficiency. Science 2018, 361, 748–750. [Google Scholar] [CrossRef] [PubMed] [Green Version]
- Hogeboom, R.J.; de Bruin, D.; Schyns, J.F.; Krol, M.S.; Hoekstra, A.Y. Capping Human Water Footprints in the World’s River Basins. Earth Future 2020, 8, 14. [Google Scholar] [CrossRef] [PubMed]
Figure 1.
The 18 cities in Henan Province and the location of Henan Province in China.

Figure 2.
The spatial distribution of the blue, green, and total WF (m3/t) of wheat and maize production in Henan Province.
Figure 2.
The spatial distribution of the blue, green, and total WF (m3/t) of wheat and maize production in Henan Province.

Figure 3.
The distribution of unsustainable blue WF (Mm3/year) of wheat and the composition of WF (m3/t) in each city.
Figure 3.
The distribution of unsustainable blue WF (Mm3/year) of wheat and the composition of WF (m3/t) in each city.

Figure 4.
The distribution of unsustainable blue WF (Mm3/year) of maize and the composition of WF (m3/t) in each city.
Figure 4.
The distribution of unsustainable blue WF (Mm3/year) of maize and the composition of WF (m3/t) in each city.

Figure 5.
Potential blue water savings of wheat production at optimal or sub-optimal benchmark level in 18 cities.
Figure 5.
Potential blue water savings of wheat production at optimal or sub-optimal benchmark level in 18 cities.

Figure 6.
Potential blue water savings of maize production at optimal or sub-optimal benchmark levels in 18 cities.
Figure 6.
Potential blue water savings of maize production at optimal or sub-optimal benchmark levels in 18 cities.


Table 1.
Water footprint of wheat and maize production during 2006–2016 in Henan Province.
| Year | Wheat | Maize | ||||||
|---|---|---|---|---|---|---|---|---|
| Blue WF | Green WF | WF | Proportion of BWF in WF (%) | Blue WF | Green WF | WF | Proportion of BWF (%) | |
| (Million m3/year) | (Million m3/year) | |||||||
| 2006 | 7984 | 19,962 | 27,946 | 29% | 80 | 9634 | 9714 | 1% |
| 2007 | 8199 | 20,453 | 28,651 | 29% | 0 | 10,067 | 10,067 | 2% |
| 2008 | 7239 | 21,721 | 28,960 | 25% | 76 | 10,430 | 10,505 | 3% |
| 2009 | 5438 | 20,965 | 26,403 | 21% | 413 | 10,568 | 10,981 | 4% |
| 2010 | 12,093 | 15,791 | 27,884 | 43% | 201 | 10,829 | 11,029 | 4% |
| 2011 | 9839 | 16,709 | 26,548 | 37% | 228 | 10,803 | 11,030 | 5% |
| 2012 | 7237 | 19,872 | 27,109 | 27% | 201 | 12,466 | 12,667 | 4% |
| 2013 | 11,356 | 17,592 | 28,948 | 39% | 2419 | 12,549 | 14,968 | 18% |
| 2014 | 4884 | 20,618 | 25,502 | 19% | 2525 | 9866 | 12,392 | 20% |
| 2015 | 3667 | 24,569 | 28,236 | 13% | 1248 | 13,065 | 14,312 | 9% |
| 2016 | 9116 | 20,145 | 29,260 | 31% | 344 | 14,077 | 14,421 | 2% |
| Average | 7914 | 19,854 | 27,768 | 28% | 703 | 11,305 | 12,008 | 7% |
Table 2.
The BWF benchmark levels in 18 cities of Henan Province.
| City Name | Blue Water Footprint Benchmark Levels (m3/t) | |||||||
|---|---|---|---|---|---|---|---|---|
| Wheat | Maize | |||||||
| First | Second | Third | Fourth | First | Second | Third | Fourth | |
| Zhengzhou | 251 | 422 | 454 | 591 | 65 | 70 | 73 | 97 |
| Kaifeng | 227 | 382 | 411 | 535 | 52 | 56 | 58 | 78 |
| Luoyang | 230 | 386 | 415 | 540 | 58 | 62 | 65 | 87 |
| Ping Dingshan | 179 | 300 | 323 | 420 | 59 | 64 | 66 | 89 |
| Anyang | 255 | 428 | 461 | 600 | 38 | 41 | 43 | 57 |
| Hebi | 259 | 434 | 467 | 608 | 34 | 37 | 39 | 52 |
| Xinxiang | 267 | 449 | 483 | 629 | 17 | 19 | 19 | 26 |
| Jiaozuo | 251 | 420 | 453 | 589 | 18 | 20 | 20 | 27 |
| Puyang | 251 | 421 | 454 | 590 | 19 | 20 | 21 | 28 |
| Xuchang | 208 | 349 | 376 | 489 | 44 | 48 | 50 | 67 |
| Luohe | 243 | 408 | 439 | 571 | 52 | 57 | 59 | 79 |
| San Menxia | 247 | 414 | 445 | 579 | 90 | 97 | 101 | 136 |
| Nanyang | 149 | 250 | 269 | 350 | 20 | 22 | 22 | 30 |
| Shangqiu | 208 | 349 | 376 | 489 | 0 | 0 | 0 | 0 |
| Xinyang | 49 | 82 | 89 | 115 | 17 | 18 | 19 | 25 |
| Zhoukou | 33 | 55 | 60 | 78 | 22 | 24 | 24 | 33 |
| Zhu Madian | 26 | 43 | 46 | 60 | 0 | 0 | 0 | 0 |
| Jiyuan | 226 | 379 | 408 | 531 | 19 | 21 | 21 | 29 |
Disclaimer/Publisher’s Note: The statements, opinions and data contained in all publications are solely those of the individual author(s) and contributor(s) and not of MDPI and/or the editor(s). MDPI and/or the editor(s) disclaim responsibility for any injury to people or property resulting from any ideas, methods, instructions or products referred to in the content. |
© 2023 by the authors. Licensee MDPI, Basel, Switzerland. This article is an open access article distributed under the terms and conditions of the Creative Commons Attribution (CC BY) license (https://creativecommons.org/licenses/by/4.0/).
Share and Cite
MDPI and ACS Style
Li, Y.; Yin, Y.; Zhang, W. Water Footprint Assessment of Major Crops in Henan Province and Reduction Suggestions. Water 2023, 15, 1135. https://doi.org/10.3390/w15061135
AMA Style
Li Y, Yin Y, Zhang W. Water Footprint Assessment of Major Crops in Henan Province and Reduction Suggestions. Water. 2023; 15(6):1135. https://doi.org/10.3390/w15061135
Chicago/Turabian StyleLi, Yanbin, Yuyi Yin, and Wenge Zhang. 2023. "Water Footprint Assessment of Major Crops in Henan Province and Reduction Suggestions" Water 15, no. 6: 1135. https://doi.org/10.3390/w15061135
Note that from the first issue of 2016, this journal uses article numbers instead of page numbers. See further details here.