Article

Assessment of the Current Trophic Status of the Southern Baikal Littoral Zone

Limnological Institute SB RAS, 664033 Irkutsk, Russia
*
Author to whom correspondence should be addressed.
Water 2023, 15(6), 1139; https://doi.org/10.3390/w15061139
Submission received: 8 February 2023 / Revised: 9 March 2023 / Accepted: 14 March 2023 / Published: 15 March 2023

Abstract

:
Eutrophication is a major ecological problem and affects and endangers freshwater bodies, making assessment of the trophic status of water bodies crucial for their restoration and sustainable use. Lake Baikal is affected by a number of environmental stressors, including coastal eutrophication. Daily measurements of concentrations of nutrients, dissolved oxygen (DO), chlorophyll-a (Chl-a), weekly measurements of algae abundance and biomass in the open water season in June-December 2020, and measurements of concentrations of nutrients at 2–7-day intervals in June-October 2021 were made in the littoral of the South Baikal for the first time. It was shown that nitrate and phosphate concentrations decreased by July-August, their minimum content was maintained until September, concentrations began to increase in October and reached a maximum in December. The maximum abundance and biomass of algae and chlorophyll concentrations were only observed in early July. Storm situations increased the content of nitrogen, phosphorus and DO in water, the duration of their influence was not more than 2 days. A correlation matrix revealed significant positive correlations of NO3-DO, phosphate (SPR)-NO3, SRP-DO and biomass-Chl-a and strong negative correlations between water temperature (Tw)-DO, Tw-NO3, Tw-total nitrogen (TN) and Tw-SRP. Based on SRP and NO3 concentrations and TN:TP ratios, it was concluded that algal development was limited to nitrogen and phosphorus in summer. The trophic status of the Southern Baikal littoral zone was assessed using classifications based on TN, TP, NO3, SRP, Chl-a content and algal biomass, as well as the Carlson index (TSI) and probabilistic assessment. The results of assessments using different methods of trophic status determination showed that the Baikal littoral zone in the study area belongs to the oligotrophic type with minor elements of mesotrophy. According to the saprobity index, water purity of littoral waters varies within the oligosaprobic and β-mesosaprobic zones and corresponded to quality classes II and III (clean and moderate purity); the system demonstrates a high capacity for self-purification.

1. Introduction

Eutrophication is becoming a major threat to natural water quality [1,2,3]. Although this problem is a natural process in natural water bodies occurring over time, today the processes of development and transformation of aquatic ecosystems are proceeding much faster than before, as they are caused not only by natural factors acting on the scale of geological processes, but also by anthropogenic factors [4]. Eutrophication can be assessed by determining the trophic status of water bodies, which includes determining the concentration of nutrients and classifying the trophic level based on their concentration [5,6].
Today, there are many classifications for assessing the trophic state of aquatic ecosystems, which focus on a large number of indicators both biotic and abiotic, as well as their sets—numerical indices of trophic state [7,8]. The concentration ranges of each particular indicator in different classifications are quite ambiguous. In the classifications created by different authors, the concentration ranges of each particular indicator for a specified type of trophicity are quite ambiguous. Thus, according to the content of Chl, there are 20 classifications for the recognition of the trophic type of a water body [9]; for example, at a concentration of chlorophyll (Chl) 3 μg L−1, according to eleven classifications, the water body will belong to the oligotrophic type, but, according to nine classifications, to the mesotrophic type. According to four qualifications based on the value of phytoplankton biomass, the type of water body can be both oligotrophic and mesotrophic at a biomass value of 1.4 mg L−1 [9]. A similar situation is observed when defining trophic types of water bodies according to abiotic indicators—different classifications for each of the indicators differ from each other by ranges of the same type of trophicity.
Increasing concentrations of nutrients leads to the eutrophication of water bodies, and reducing their content below certain limits suspends the possibility of their development. SRP limit phytoplankton growth when the concentration in the water is less than 3 µg P L−1, NO3—when the concentration is less than 15–30 µg N L−1, the development of diatom phytoplankton is limited when the concentration of silicon is less than 0.1 mg L−1 [10].
According to a number of authors, it is the ratio of concentrations of nutrients proposed by Redfield that is the main factor for the development of algae. It has been shown that the molar ratio N:P < 10 indicates that nitrogen is the limiting biogenic element, while at N:P > 17 or N:P > 20—phosphorus [11,12]. TN and TP concentrations were used to estimate nitrogen and phosphorus deficits. However, the ratio of nitrogen and phosphorus in algae cells varies within a quite wide range depending on the physiological conditions of phytoplankton development and its species composition, but in general, the ratio of these elements in water can serve as a good indicator of limiting by one of them.
Lake Baikal, the world’s largest freshwater lake (23,000 km3), has unique flora and fauna, 60% of which is endemic. The Baikal littoral zone occupies about 7% of the water area [13], where a peculiar hydrological regime is formed. Here, the wave and level fluctuations have a much stronger effect than in the pelagic zone, and daily and seasonal changes in water temperature are more contrasting [14,15]. The littoral zone is essentially an ecological barrier between the watershed and the main lake water area [16,17,18], and has a transforming function that significantly affects the functioning of the entire lake ecosystem.
The littoral zone receives a sufficient amount of radiant energy, which is necessary for the development of aquatic plants, respectively, biological and chemical processes are more intense, and therefore, this zone is characterized by significant biodiversity. Despite its smaller area, the primary production of the littoral zone makes a tangible contribution to the total production of the lake [19,20]. The negative impact of anthropogenic factors, in the form of biogenic and organic matter input, negatively affects not only the water quality of the Baikal littoral zone [21,22,23], but also leads to local changes in biotopes [24,25,26,27].
Hydrochemical studies of the Baikal littoral zone in the first half of the 20th Century [28,29] mainly concerned the daily variations of dissolved oxygen (DO), pH and bicarbonates. Later, based on observations in 1949–1955, it was shown that in the littoral zone, the concentrations of DO have diurnal and seasonal changes, while the seasonal changes in phosphate (SPR) are more complex and unstable [30]. Studies of the Baikal littoral zone in 2000–2007 [31] showed that intra-annual changes in phosphates (SRP) had two maxima (October–March and June–July) and two minima in April-May and August-September. At the same time, the variation in nitrate (NO3) concentrations was unstable during the open-water season. In studies during 2004–2018, the maximum of nutrients in June–July was not found; the active development of benthic and planktonic algae caused their intensive consumption during this period [32,33]. The latest data (2010–2015) [31,32] and the data from 1950–1980 [30] showed that concentrations of nutrients of Lake Baikal did not change.
Note that the aforementioned studies of the dynamics of nutrients and DO in the Baikal littoral were obtained, as a rule, in one-time (one-day) fieldwork [31] or in separate cycles of 10–15 days [32,33].
Our work aimed to assess the trophic status of the littoral zone of South Baikal by abiotic and biotic indicators based on a study of the dynamics of the content of nutrients, DO, chlorophyll-a (Chl-a) and phytoplankton during the open-water season and an analysis of the influence of storm situations on the concentration of the studied components.

2. Materials and Methods

Measurements were taken on the western shore of the southern basin of Lake Baikal near the area of Bolshiye Koty settlement (Scientific Station of Limnological Institute, coordinates 51°54′ N, 105°05′ E) (Figure 1). The sampling site was 40 m from the stationary pier, and 60 m from the water’s edge. The total depth was about 5 m at the sampling site, and the water intake depth was 0.5 m from the bottom of the lake. Water samples were taken with a hose with a diameter of 2 cm using a surface pump located on the pier. The time of water sampling was 11:00 a.m. In 2020, water sampling for the determination of nutrients and DO was taken daily from 3 June to 26 October, phytoplankton samples were taken weekly. In November and December, the measurement of nutrients was continued at 2–7-day intervals. In the cycle of 2021, from 27 May to 30 October, sampling for biogenic elements content was carried out at 2–3-day intervals.
Additionally, from June to October 2020, samples were taken every 3 days from the surface of the lake at 50–60 m from the shore at a distance of 1.5 km west of the pier.
DO was determined by the Winkler method. Mineral forms of nutrients were determined in filtered water using cellulose acetate membrane filters with a 0.45 µm pore size. Measurement of total phosphorus (TP) and total nitrogen (TN) was performed in unfiltered water. Nitrate was measured with sodium salicylate and nitrite (NO2) was determined with Griss reagent [34]. Ammonium ions (NH4+) were detected using the indophenol method, and dissolved silica was determined from a yellow silicomolybdate complex. SRP was measured using the Denigès-Atkins method in modification with tin chloride. TP was determined by the same method after oxidation with potassium persulfate [35]. TN was measured after oxidation with potassium persulfate when heated in an alkaline medium to nitrates followed by spectrophotometric determination of their own absorption in the ultraviolet region of the spectrum [36].
For determinations of chlorophyll-a (Chl-a), water was filtered through a 0.45 μm membrane filter and algal pigments were extracted with acetone (90%). Spectrophotometric measurement of the acetone extract was performed before and after acidification with hydrochloric acid. Chl-a concentration calculations were based on known specific spectral indices of light absorption by Chl-a [37].
Determination of species composition and abundance of algae enabled the identification of changes in the structure and level of development of phytoplankton. Phytoplankton were fixed by Lugol’s solution and then concentrated by sedimentation [38]. Biomass was determined taking into account individual cell volumes [39,40]. Saprobity indexes were calculated based on the Pantle-Buck method with the modification of Sladecek, [41,42,43]; this method provides information on the assessment of organic pollution of water bodies in a spatial and temporal form. The classification of the purity of natural waters according to the saprobity index has five classes. Water quality class I (very clean) corresponds to waters with a saprobity index up to 0.50; class II (clean)—with an index of 0.51–1.50; class III (moderate)—with an index of 1.51–2.50; class IV (polluted)—with an index of 2.51–3.50; class V (very polluted)—with an index of more than 3.50 [43,44].
We also assessed trophic status using the Carlson index (TSI) [45], which is calculated from the value of transparency, the concentration of total phosphorus and chlorophyll. The trophic status was also assessed using the Carlson index (TSI), which is calculated from the transparency value, the concentration of total phosphorus and chlorophyll. The water body is oligotrophic at TSI < 40, it is mesotrophic at values from 40 to 60, and it is eutrophic over 60.
Another approach for defining triplicity is a probabilistic assessment of the trophic state of a water body [46]. It is calculated by the value of transparency, the average concentration of TP and Chl-a for five gradations: μuo—the probability of ultra-oligotrophic states, μo, μm, μe, μgt, respectively, the probability of oligotrophic, mesotrophic, eutrophic, hyper-eutrophic states of the aquatic ecosystem, with the condition that the sum of the values should be equal to 1 or 100%.
All statistical analyses were performed using Microsoft Excel.
The value of Secchi disk transparency was taken as 5 m to calculate TSI (in situ transparency was not measured due to the difficulty of daily access to the sampling site). This value is caused by the following. Firstly, it corresponds to the data of the research [47], which shows that the transparency was not less than 6 m in August and September in the littoral and pelagic zones of southern Baikal. Secondly, an empirical relationship between chlorophyll and transparency by Secchi disk in the Baikal water is given in the paper [48]. The application of this dependence equation to the obtained data on the content of Chl-a shows that the value of transparency during the period of our research could not be less than 5 m.

3. Results and Discussion

Statistical processing of the obtained data on daily water temperature, concentrations of nutrients, oxygen and chlorophyll-a was performed. Mean monthly values of the studied parameters were calculated (Table 1).
Correlation analysis shows significant correlations between selected measured values (Table 2).
The mutual correlation between the measured variables was high. Oxygen saturation -Tw, NO3-DO, SRP-NO3, SRP–DO and biomass-Chl-a showed significant positive correlations. There was a strong and negative correlation between Tw-DO, Tw-NO3, Tw-TN-and Tw-SRP.

3.1. Dissolved Oxygen, Chlorophyll-a and Phytoplankton

The dynamics of DO are as follows: in June, at a water temperature 5–7 °C, DO content was 9.5–10.4 mg O2 L−1 (Table 1) and oxygen saturation was 82–94%. Phytoplankton abundance varied between 177,000–713,000 cells L−1; biomass between 247–876 mg m−3; Chl-a concentration between 0.09–2.28 µg L−1 (Figure 2). The plankton was dominated by diatom algae (86–93%), mostly Sinedra acus subp. radians (Fragilaria radians).
As it warmed up and, consequently, as the solubility of oxygen decreased, DO concentration began to decrease from the end of June. The increase in water temperature was accompanied by a change in the dominant algae complex, with dinophyta, goldenseal, cryptophyta and green algae as dominants. Biomass and abundance of phytoplankton in July increased by two to three times, Chl-a—by two times (Figure 2b). This led to an increase in water oxygen saturation at the end of July up to the maximum values for the study period—126% in calm conditions.
The coastal zone of Lake Baikal, like other large lakes, is very dynamic [49,50] and frequent surges of water from the pelagic zone to the littoral zone of the lake during the waves in July 2020 reduced the gradual temperature rise, water oxygen saturation and biological indicators. Thus, during the storm on 16 July, the water temperature dropped from 17.1 to 4.2 °C, water oxygen saturation decreased from 102 to 77% (DO increased by 2 mg O2 L−1) and Chl-a decreased from 2.6 to 0.5 µg L−1. During the next three days, the water temperature increased to 10.6 °C and oxygen saturation increased to 93%, but a storm on 20 July resulted in lower temperatures and oxygen saturation (6 °C and 85%). In August and in the first half of September, the water temperature varied within 11–16 °C, water oxygen saturation decreased to 85–95% and Chl-a—to 1.4–2.1 µg L−1. Phytoplankton abundance was 1,009,000–2,458,000 cells L−1 and biomass was 102–475 mg m−3.
At the end of September, the water temperature began to seasonally decrease and it had dropped to 5.3 °C by the end of October. As a result of increased solubility, DO increased to 9.6 mg L−1, in turn, due to the decomposition of summer-autumn algae complex, oxygen saturation decreased to 75–80% and Chl-a—to 0.6–0.8 µg L−1. Algae abundance decreased to 75,000–876,000 cells L−1 and biomass to 55–286 mg m−3 (Figure 2b). As in July, the inflow of water from the pelagic zone led to a sharp drop in temperature, Chl-a content, oxygen saturation, and an increase in DO concentration during strong surges of the lake.

3.2. Dynamics of Nutrients

Concentrations of NO3 and SRP synchronously changed (Table 2). Their content decreased by mid-July and remained low until the end of September, except for the stormy situations. The average concentration of nitrates during this period was 11 μg N L−1, the range of changes was 5–27 μg N L−1, the average concentration of SRP was 1.3 μg P L−1, the maximum was 3.3 μg P L−1; sometimes their complete consumption was noted (Figure 3).
During storms, the inflow of water from the pelagial caused a sharp increase in the concentrations of NO3 and SRP within 1–2 days. The amplitude of SRP fluctuations was much wider than the changes in NO3 (Figure 3).
The increase in concentrations from 27 September to 4 October with a slight change in water temperature (2 °C) was apparently due to the washout of biogenic elements from the coast. During this period, the rise in the water level in Lake Baikal reached its maximum, the water edge moved up to the shoreline slope and the waves eroded the soil; the turbid water spread 70–80 m from the lake shoreline, which led to an increase not only in NO3 and SRP, but also in organic matter.
From the second decade of October, with the end of vegetation of the summer-autumn algae complex, a gradual increase in NO3 and SRP concentration began and, in mid-December, their quantity reached the maximum value for the observation period of 2020.
During almost all of the measurements, the concentration of nitrite was mostly below the detection limit of the technique, and only after the storm in the first decade of August was it possible to reliably register the concentration, which was 6 μg N L−1. Ammonium ions at 10 μg N L−1 were also detected in some storm situations.
From June to mid-July, there was a decrease in TN and TP concentrations. Nitrogen and phosphorus were mostly represented by mineral form in June: 60–80% mineral nitrogen (NO3, NO2, NH4+) and 60–75% mineral phosphorus (Figure 4). In July-September, the share of mineral forms decreased to 7–40% and 0–30%, respectively. The influx of water from the pelagial during storms led to a noticeable increase in TN and TP, mainly due to their mineral forms. In September, during the period of the maximum lake water level, storm situations caused an increase in TP up to 32 μg L−1 and in TN up to 170 μg L−1, not only due to water inflow from the deep-water part of the lake, but also as a result of their influx following the washout of the shore.
Silicon content varied within the range of 0.47–0.57 mg L−1 in the first two decades of June, and in late June to the first decade of July its content sharply decreased by four times, and it was within the range of 0.19–0.31 mg L−1 until the end of August. In September-November, the amount of silicon began to grow and increased to 0.64 mg L−1 in December. The influence of storm situations did not affect the silicon concentration.
The content of biogenic elements, Chl-a and their temporal dynamics at the permanent and additional sampling sites were similar. However, the DO was 8.1–11.9 mg O2 L−1 at the additional site, and the saturation was 94–137% (values below 100% were only observed in October). The difference in the value of DO at the two sites apparently relates to the depth of sampling. Perhaps the proximity of the bottom at the permanent site and, consequently, the consumption of oxygen for oxidation of organic matter from the bottom sediments caused its lower concentrations.
Obviously, the results of observations in different years have their own specific features due to the differences in weather conditions, temperature and hydrodynamic regimes, and the data obtained at the same time can greatly vary. If from the beginning of June to the middle of August 2020 and 2021, the content of TP and TN varied within the same ranges, then from the second half of August 2021, the values of their concentrations were higher. Differences in the intra-annual dynamics of NO3, SRP and Si were also observed (Figure 5). The decrease in their concentrations in 2021, as it was in the previous year, began at the end of the first decade of June, but was longer until mid-August. The minimum content was also maintained until the end of September as it was in 2020. However, the values of NO3 concentration had close values during the summer minimum in both years, and the values of SRP and Si concentration were markedly higher in this period of 2021.
The main reasons for higher concentrations of nutrients in 2021 were, firstly, high water levels, and secondly, weather conditions. During the study period in 2021, according to the data of the gauging station in Baikal settlement, the fastest water rise in Lake Baikal was in June and July. The water level increased from the zero mark of the water gauge (the Baltic system of heights is 453.27 m) to 191 cm on 27 May, to 265 cm on 29 July and the water level reached 294 cm on 13 September and fluctuated between 283–290 cm until the third decade of October [51]. Wash out of the flooded area led to an increase in biogenic elements and organic matter in the littoral zone, especially on stormy days. Thus, on 6 October, the NO3 content increased to 140 µg N L−1, SRP—to 9.8 µg P L−1 and total phosphorus—to 45 µg P L−1. Nitrites and ammonium ions were reliably determined in the amount, respectively, 4 µg N L−1 and 13 µg N L−1 only in late September to early October, in the period characterized as the end of the vegetation of summer-autumn phytoplankton [19,26]. The cool and rainy summer of 2021 probably influenced the development of phytoplankton and, consequently, the decrease in consumption of biogenic elements.
Lake Baikal is the largest freshwater deep-water lake in the world. Unlike small lakes [6,52], its water contains small amounts of nutrients and chlorophyll. Of the mineral forms of nitrogen in Lake Baikal, nitrate predominates, not ammonium [53] Unfortunately, in recent decades, Lake Baikal has been subjected to a significant anthropogenic load. Human activities have brought with them a number of stressors to the Great Lakes, including changes in nutrient loading. The concentration of TR in Lakes Erie and Ontario has increased by four to five times compared to natural levels; in Lake Michigan it has increased by three times [54,55]. At present, despite the active development of tourist activities on the Baikal coast, the concentration of nutrients, oxygen and chlorophyll remains approximately at their values at the end of the last century [30,31].

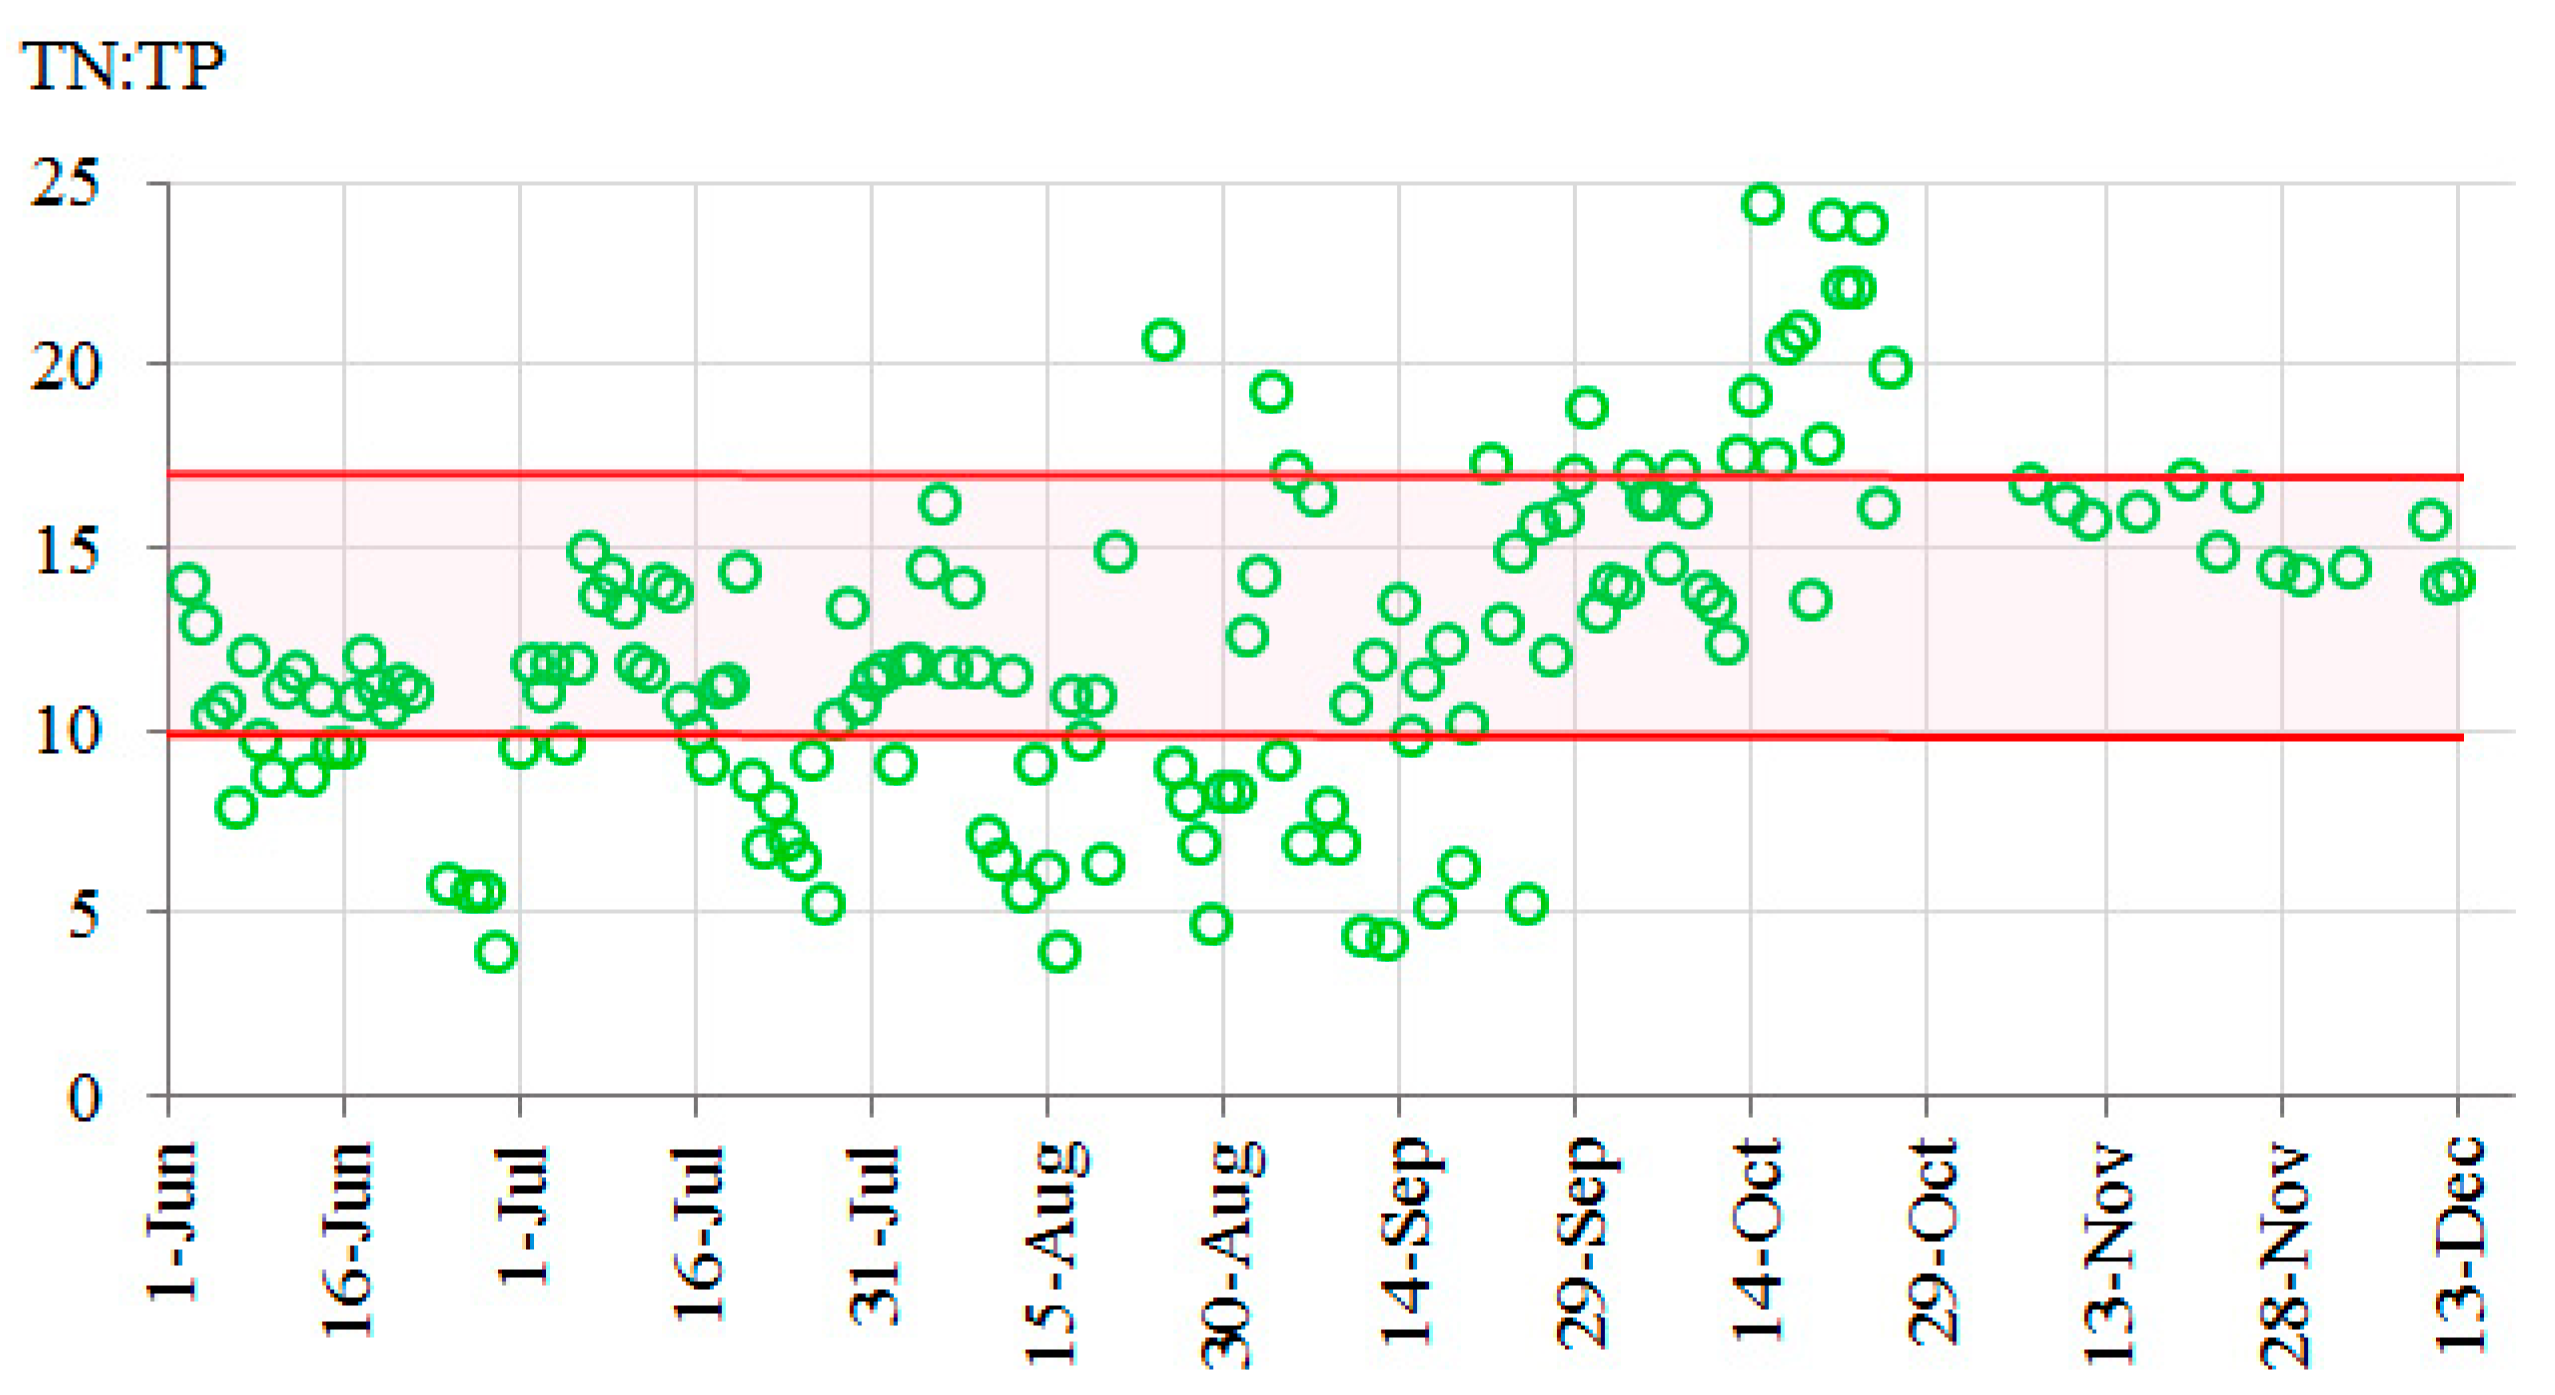
3.3. Limiting of Phytoplankton Development by Nutrients

The data obtained on the content of NO3 and SRP in the littoral zone showed that the deficiency of phosphorus and nitrogen was observed from the beginning of July 2020 to the end of September, which significantly affected the quantitative indicators of phytoplankton (Figure 2b). In 2021, phosphorus and nitrogen deficits were observed from the end of the first decade of August to the first days of October. In earlier experimental works [56,57], it was shown that algae are limited in nutrition in terms of both nitrogen and phosphorus in the littoral zone of Lake Baikal. The enrichment of water by nitrogen and phosphorus during waves in the littoral zone was short term and their content decreased to previous concentrations in 1–2 days. According to the ratio of TN:TP from June to the end of September 2020, nitrogen was periodically in deficit (TN:TP < 10); phosphorus was in deficit (TN:TP > 17) since October (Figure 6). The values of SRP and NO3 concentrations, and the TN:TP ratio, showed that from July to the end of September 2020, both nitrogen and phosphorus limited the development of algae. Furthermore, the low silicon concentrations that could affect diatom algae development were only recorded for a few days in early July 2020.

3.4. Assessment of Trophic Status

Based on our observations for the content of TN, TP and mineral nitrogen and phosphorus in 2020–2021 and of Chl in 2020, and using different classifications of the trophic status [7,9], it was found that the Baikal littoral zone near the area of Bolshiye Koty settlement can be classified as being of both oligotrophic and mesotrophic type (Figure 7).
According to the classification of trophicity by biomass [58,59], the study area corresponds to the oligotrophic type with features of mesotrophy. In June-October 2020, 56 species of algae were found, of which 36 are indicators of the state of the aquatic environment. Algae serve as indicators of the state of the aquatic environment, determining the water quality [43,44]. Bioindexing methods based on the species composition and abundance of algae provide an integral assessment of the results of all natural and anthropogenic processes occurring in the water body. The saprobity index reflects the course of biological purification processes, and it varies at different time intervals (Figure 7).
According to the saprobity index, the purity of littoral waters varies within the oligosaprobic and β-mesosaprobic zones; i.e., water quality of II and III classes (clean and of satisfactory purity) [43,44]. The state of the ecosystem in the study area can be characterized as self-purification. Similar indices of saprobity and ecosystem conditions are inherent to the Baikal littoral zone in the tourist center of Listvyanka village [25].
The values of the Carlson indices calculated from our data in 2020 varied from 32 to 42, with only three times exceeding the value of 40. This means that, according to the TSI, the Baikal littoral zone belongs to the oligotrophic type with elements of mesotrophy. It was found that the relationship between water temperature and TSI was almost not traceable (correlation coefficient 0.3). This indicates that the seasonal factor does not introduce a significant error in estimating the trophic type of the littoral zone of the lake by TSI.
To determine the trophic status of the lake’s littoral zone, a probabilistic assessment was used. It was found that, according to the Chl-a and TP content, the Baikal littoral zone is classified as oligotrophic type, and, according to the transparency—as mesotrophic type (Table 3).

4. Conclusions

The results of the measurements showed that the time of the summer minimum of nitrate and phosphate concentrations can be both in July and August, depending on the hydrological and meteorological conditions of each year, and last until the end of September. The value of oxygen saturation increases with the growth of Chl-a, biomass and phytoplankton abundance by July, but further during three months, when low concentrations of nutrients limit the development of algae, the supply of dissolved oxygen by photosynthesis decreases. Moreover, its consumption for the oxidation of organic matter increases, and from mid-August the oxygen saturation gradually decreases to 75%. In summer, the lack of both nitrogen and phosphorus limits the development of phytoplankton. It is shown that the inflow of water from the pelagial of the lake into the littoral zone during strong waves has a short-term effect (no more than 1–2 days) on the content of oxygen and nutrients.
The results of assessments using various methods for determining the trophic status, both by individual abiotic and biotic traits, and by combinations of indicators, as well as using a probabilistic approach, showed that the littoral zone of Baikal in the study area belongs to the oligotrophic type, with insignificant elements of mesotrophy. According to the saprobity index, the purity of water corresponds to II and III quality classes, and the state of the ecosystem is self-purification.

Author Contributions

Conceptualization—A.F. and V.D.; methodology—V.D.; fieldwork, sampling, chemical analysis—V.D., O.N., N.O., M.S., L.G. and O.K.; algal investigation—S.V.; writing–original draft preparation, V.D. and S.V.; project administration, A.F. All authors have read and agreed to the published version of the manuscript.

Funding

This research was carried out within the framework of the LIN SB RAS State Task No 0279–2021–0005 (121032300224-8) “Investigation of the transformations of the state of reservoirs and streams of Eastern Siberia in seasonal and long-term aspects in the context of climate change, geological environment and anthropogenic loads”.

Institutional Review Board Statement

Not applicable.

Informed Consent Statement

Not applicable.

Data Availability Statement

The data presented in this study are available on request from the corresponding author Domysheva V. [email protected].

Acknowledgments

We are grateful to the staff of the Scientific Station of Limnological Institute for their help in sampling.

Conflicts of Interest

The authors declare no conflict of interest.

References

  1. Smith, V.H. Eutrophication of freshwater and coastal marine ecosystems a global problem. Environ. Sci. Pollut. Res. 2003, 10, 10126–10139. [Google Scholar] [CrossRef] [PubMed]
  2. Schindler, D.W. The dilemma of controlling cultural eutrophication of lakes. Proc. R. Soc. B 2012, 279, 4322–4333. [Google Scholar] [CrossRef] [Green Version]
  3. Carpenter, S.R. Eutrophication of aquatic ecosystems: Bistability and soil phosphorus. Proc. Natl. Acad. Sci. USA 2005, 105, 10002–10005. [Google Scholar] [CrossRef] [PubMed] [Green Version]
  4. Selman, M.; Greenh, S. Eutrophication: Sources and drivers of nutrient pollution. Renew. Resour. J. 2010, 26, 19–26. [Google Scholar]
  5. Karmakar, S.; Musthafa, O.M. Lakes and Reservoirs: Pollution. In Encyclopedia of Environmental Management; Taylor and Francis: New York, NY, USA, 2013; pp. 1576–1587. [Google Scholar]
  6. Bekteshi, A.; Cupi, A. Reserved area protection use of trophic State index (Carlson, 1977) for assessment of trophic status of the Shkodra Lake. J. Environ. Prot. Ecol. 2015, 15, 359–365. [Google Scholar]
  7. Neverova-Dziopak, E.; Tsvetkova, L. Assessment of the Trophic State of Surface Waters; Basova, S.L., Alekseev, M.I., Eds.; SPbSUACE: St. Peterburg, Russia, 2020; pp. 17–47. (In Russian) [Google Scholar]
  8. Zhang, Y.; Li, M.; Dong, J.; Yang, H.; Van Zwieten, L.; Lu, H.; Alshameri, A.; Zhan, Z.; Chen, X.; Jiang, X.; et al. A critical review of methods for analyzing freshwater eutrophication. Water 2021, 13, 225. [Google Scholar] [CrossRef]
  9. Datsenko, Y. Eutrophication of reservoirs. In Hydrological and Hydrochemical Aspects; Poddubniyi, S.L., Ershova, M.G., Eds.; GEOS: Moscow, Russia, 2007; 251p. (In Russian) [Google Scholar]
  10. Reynolds, C.S. The Ecology of Phytoplankton; Usher, M., Saunders, D., Peet, R., Dobson, A., Eds.; Cambridge University Press: Cambridge, UK, 2006; pp. 145–177. [Google Scholar]
  11. Smith, V.H. The nitrogen and phosphorus dependence of algal biomass in lakes: An empirical and theoretical analysis. Limnol. Ocearnogr. 1982, 23, 1248–1255. [Google Scholar] [CrossRef]
  12. Maberly, S.C.; Pitt, J.-A. Nitrogen and phosphorus limitation and the management of small productive lakes. Inland Waters 2020, 10, 159–172. [Google Scholar] [CrossRef] [Green Version]
  13. Fialkov, V.V. Pecularities of the currents in the shallow water zone of the area. In Currents in Lake Baikal; Galaziy, G.I., Ed.; Nauka. Siberian Branch: Novosibirsk, Russia, 1977; pp. 108–116. (In Russian) [Google Scholar]
  14. Fialkov, V.V. Level fluctuations and hydrological regime of shallow water areas. In Limnology of the Coastal-Sor Zone; Florensov, N.A., Ed.; Nauka Siberian branch: Novosibirsk, Russia, 1977; pp. 66–82. (In Russian) [Google Scholar]
  15. Shimaraev, M.A.; Kuimova, L.N. Peculiarities of the temperature regime of bays and sors. In Limnology of the Coastal-Sor Zone; Florensov, N.A., Ed.; Nauka. Siberian Branch: Novosibirsk, Russia, 1977; pp. 82–90. (In Russian) [Google Scholar]
  16. Kurashov, E.A.; Raspopov, I.M.; Andronnikova, I.N.; Naumenko, M.A.; Ignat’eva, N.V.; Susareva, O.M. The Littoral Zone of Lake Ladoga; Kurashov, E.A., Ed.; Nestor-Istoria: St. Petersburg, Russia, 2011; pp. 10–51. (In Russian) [Google Scholar]
  17. Pirozhkova, G.P. Hydrochemical regime of the lake and its change under the influence of anthropogenic impact. In The Ecosystem of Lake Onega and Trends of its Changes; Kaufman, Z.S., Ed.; Nauka: Leningrad, Russia, 1990; pp. 95–146. (In Russian) [Google Scholar]
  18. Raspopov, I.M. Higher Aquatic Vegetation of Large Lakes in the Northwest of the USSR; Nauka: Leningrad, Russia, 1985; pp. 4–15. (In Russian) [Google Scholar]
  19. Bondarenko, N.A.; Belykh, O.I.; Logacheva, N.F.; Tikhonova, I.V.; Volkova, E.A. Microalgae in the coastal zone of Lake Baikal. Izv. ISU Ser. Biology. Ecol. 2012, 5, 88–102. (In Russian) [Google Scholar]
  20. Pomazkina, G.V.; Belykh, O.I.; Domysheva, V.M.; Sakirko, M.V.; Gnatovskiy, R.Y. Structure and dynamics of phytoplankton in Southern Baikal (Russia). Algology 2010, 20, 56–72. (In Russian) [Google Scholar] [CrossRef]
  21. Tomberg, I.V.; Sakirko, M.V.; Domysheva, V.M.; Sezko, N.P.; Lopatina, I.N.; Bashenkhaeva, N.V.; Filevich, E.A.; Kulikova, N.N.; Popova, O.V.; Malnik, V.V.; et al. First information about the chemical composition of interstitial waters in the splash zone of Lake Baikal. Izv. ISU Ser. Biol. Ecol. 2012, 5, 64–74. (In Russian) [Google Scholar]
  22. Eletskaya, E.V.; Tomberg, I.V. The concentration of mineral and total phosphorus in the coastal water of southeast coast of Lake Baikal. Limnol. Freshw. Biol. 2020, 4, 896–898. [Google Scholar] [CrossRef]
  23. Bondarenko, N.A.; Tomberg, I.V.; Shirokaya, A.A.; Belykh, O.I.; Tikhonova, I.V.; Fedorova, G.A.; Netsvetaeva, O.G.; Eletskaya, E.V.; Timoshkin, O.A. Dolichospermum lemmermannii (Nostocales) bloom in world’s deepest Lake Baikal (East Siberia): Abundance, toxicity and factors influencing growth. Limnol. Freshw. Biol. 2021, 1, 1101–1110. [Google Scholar] [CrossRef]
  24. Kravtsova, L.S.; Izhboldina, L.A.; Khanaev, I.V.; Pomazkina, G.V.; Rodionova, E.V.; Domysheva, V.M.; Sakirko, M.V.; Tomberg, I.V.; Kostornova, T.Y.; Kravchenko, O.S.; et al. Nearshore benthic blooms of filamentous green algae in Lake Baikal. J. Great Lakes Res. 2014, 40, 441–448. [Google Scholar] [CrossRef]
  25. Kravtsova, L.S.; Vorobyeva, S.S.; Naumova, E.A.; Izhboldina, L.A.; Mincheva, E.V.; Pomazkina, G.V.; Rodionova, E.V.; Onicshuk, N.A.; Sakirko, M.V. Response of Aquatic Organisms Communities to Global Climate Changes and Anthropogenic Impact: Evidenct from Listvennichny Bay of Lake Baikal. Biology 2021, 10, 904. [Google Scholar] [CrossRef]
  26. Bondarenko, N.A.; Logacheva, N.F. Structural changes in phytoplankton of the coastal zone of Lake Baikal. Hydrobiol. J. 2016, 52, 17–26. [Google Scholar] [CrossRef]
  27. Timoshkin, O.A.; Samsonov, D.P.; Yamamuro, M.; Moore, M.V.; Belykh, O.I.; Malnik, V.V.; Sakirko, M.V.; Shirokaya, A.A.; Bondarenko, N.A.; Domysheva, V.M.; et al. Rapid ecological change in the coastal zone of Lake Baikal (East Siberia): Is the site of the world’s greatest freshwater biodiversity in danger? J. Great Lakes Res. 2016, 42, 487–4974. [Google Scholar] [CrossRef] [Green Version]
  28. Vereshchagin, G.Y. Daily course of some hydrological elements in Baikal and its limnological significance. In Proceedings of the Baikal Limnological Station; Publishing House of the Academy of Sciences of the USSR: Moscow, Russia, 1932; USSR, (II); pp. 107–201. (In Russian) [Google Scholar]
  29. Bochkarev, P.F.; Vlasov, N.A. Observations on the daily course of some hydrochemical factors in the water of Lake Baikal. In Proceedings of Irkutsk State University; Ser. Him.; Publishing House of ISU: Irkutsk, Russia, 1947; Volume 3, pp. 1–27. (In Russian) [Google Scholar]
  30. Votintsev, K.K. Hydrochemistry of Lake Baikal; Galaziy, G.I., Ed.; Publishing House of the Academy of Sciences of the USSR: Moscow, Russia, 1961; 311p. (In Russian) [Google Scholar]
  31. Golobokova, L.P.; Sakirko, M.V.; Onischuk, N.A.; Pogodaeva, T.V.; Sez’ko, N.P.; Dolya, I.N. Hydrochemical characteristics of littoral waters of north-western coast of southern Baikal. In Annotated List of the Lake Baikal Fauna and its Watershed: In 2 Volumes; Volume II, Book 1: Water Bodies and Streams of the South of Eastern Siberia and Northern Mongolia; Timoshkin, O.A., Proviz, V.I., Sitnikova, T.Y., Eds.; Nauka: Novosibirsk, Russia, 2009; pp. 760–784. (In Russian) [Google Scholar]
  32. Sakirko, M.V.; Domysheva, V.M.; Pestunov, D.A.; Netsvetaeva, O.G.; Panchenko, M.V. Concentration of nutrients in the water of Southern Baikal in summer. Proc. SPIE 2015, 9680, 1–7. [Google Scholar] [CrossRef]
  33. Panchenko, M.V.; Domysheva, V.M.; Pestunov, D.A.; Sakirko, M.V.; Shamrin, A.M.; Shmargunov, V.P. Carbon dioxide in the atmosphere-water system and biogenic elements in the littoral zone of Lake Baikal during period 2004–2018. J. Great Lakes Res. 2020, 46, 85–94. [Google Scholar] [CrossRef]
  34. National Standard GOST 33045-2014; Water. Methods for the Determination of Nitrogen-Containing Substances. Standartinform: Moscow, Russia, 2019; 23p. (In Russian)
  35. Wetzel, R.; Likens, G. Limnological Analysis, 3rd ed.; Springer: New York, NY, USA, 2000; pp. 57–112. [Google Scholar]
  36. Regulatory Guide RD 52.24.532-2016; Mass Concentration of Total Nitrogen in the Waters. Measurement Technique by Spectrophotometric Method with Sample Mineralization in a Thermoreactor. Rosgydromet: Rostov-on-Don, Russia, 2017; 38p. (In Russian)
  37. National Standard GOST 17.1.4.02-90; Water. Method of Spectrophotometric Determination of Chlorophyll a. Standartinform: Moscow, Russia, 2010; 15p. (In Russian)
  38. Bondarenko, N.A.; Ozersky, T.; Obolkina, L.A.; Tikhonova, I.V.; Sorokovikova, E.G.; Sakirko, M.V.; Potapov, S.A.; Blinov, V.V.; Zhdanov, A.A.; Belykh, O.I. Recent changes in the spring microplankton of Lake Baikal, Russia. Limnologica 2019, 75, 19–29. [Google Scholar] [CrossRef]
  39. Kozhova, O.V.; Melnik, N.G. Instruction for Processing Phytoplankton Samples by Counting Method; ISU n. A. Zhdanov: Irkutsk, Russia, 1978. (In Russian) [Google Scholar]
  40. Belykh, O.I.; Bessudova, A.Y. Guidelines for Determining the Biomass of Phytoplankton in the Pelagic Zone of Lake Baikal; Publishing House of ISU: Irkutsk, Russia, 2011. (In Russian) [Google Scholar]
  41. Sladecek, V. System of water quality from biological point of view. Achieves Hydrobiol. Beih. Ergeb. Limnol. 1973, 7, 1–218. [Google Scholar]
  42. Unified Methods of Water Quality Research; Nauka: Moscow, Russia, 1977; 227p.
  43. Barinova, S.S.; Medvedeva, L.A.; Anisimova, O.V. Biodiversity of Algae-Environmental Indicators; PILIES STUDIO: Tel Aviv, Israel, 2006; pp. 8–85. (In Russian) [Google Scholar]
  44. Barinova, S. On the Classification of Water Quality from an Ecological Point of View. Int. J. Environ. Sci. Nat. Res. 2017, 2, 38–45. [Google Scholar] [CrossRef] [Green Version]
  45. Carlson, R.E. A trophic state index for Lakes. Limnol. Oceanogr. 1977, 22, 361–369. [Google Scholar] [CrossRef] [Green Version]
  46. Frumin, G.T.; Khuan, Z.Z. Probabilistic assessment of the trophic status of water bodies. In Methodological Manual; RGGMU: Sankt-Petersburg, Russia, 2012; 28p. [Google Scholar]
  47. Izmest’eva, L.R.; Moore, M.V.; Hampton, S.E.; Ferwerda, C.J.; Gray, D.K.; Woo, K.H.; Pislegina, H.V.; Krashchuk, L.S.; Shimaraeva, S.V.; Silow, E.A. Lake-wide physical and biological trends associated with warming in Lake Baikal. J. Great Lakes Res. 2016, 42, 6–17. [Google Scholar] [CrossRef] [Green Version]
  48. Mankovskiy, V.I.; Sherstyankin, P.P. The use of hydro-optical characteristics to monitor the state of the ecosystem of water bodies. Geogr. Nat. Resour. 2019, 3, 86–94. (In Russian) [Google Scholar] [CrossRef]
  49. Troitskaya, E.N.; Blinov, V.V. Cyclonic circulation and upwelling in Lake Baikal. Aquat. Sci. 2015, 77, 171–182. [Google Scholar] [CrossRef] [Green Version]
  50. Tanaka, Y.; Katano, T.; Sugiyama, M.; Watanabe, Y.; Timoshkin, O.A.; Troitskaya, E.S.; Shimaraev, M.N.; Drucker, V.V. Phenomena of sudden changes of water temperature in the coastal waters: Comparison of upwelling events of Lake Baikal and Japanese lakes and coastal oceans. Limnol. Freshw. Biol. 2020, 4, 632–633. [Google Scholar] [CrossRef]
  51. ALLrivers. Info Summary of Measurements at the Gauging Station in the Baikal Settlement on Lake Baikal. Available online: https://allrivers.info/gauge/baykal (accessed on 7 September 2022).
  52. Malik, M.; Balkhi, M.H.; Abubakr, A.; Bhat, F. Assessment of Trophic State of Nagin Lake Based on Limnological and Bacteriological Studies. Nat. Environ. Pollut. Technol. 2017, 16, 485–491. [Google Scholar]
  53. Jekatierynczuk-Rudczyk, E.; Zieliński, P.; Grabowska, M.; Ejsmont-Karabin, J.; Karpowicz, M.; Więcko, A. The trophic status of Suwaki Landscape Park lakes based on selected parameters (NE Poland). Environ. Monit. Assess. 2014, 186, 5101–5121. [Google Scholar] [CrossRef] [Green Version]
  54. Nornberg, J.K. Phosphorus from internal sources in the Laurentian Great Lakes, and the concept of threshold external load. J. Great Lakes Res. 1991, 17, 132–140. [Google Scholar] [CrossRef]
  55. Chapra, S.; Robertson, A. Great Lakes Eutrophication: The Effect of Point Source Control of Total Phosphorus. Science 1977, 196, 1448–1450. [Google Scholar] [CrossRef] [PubMed]
  56. Ozersky, T.; Volkova, E.A.; Bondarenko, N.A.; Timoshkin, O.A.; Malnik, V.V.; Domysheva, V.M.; Hampton, S.E. Nutrient limitation of benthic algae in Lake Baikal, Russia. Freshw. Sci. 2018, 37, 472–482. [Google Scholar] [CrossRef] [Green Version]
  57. O’Donnell, D.R.; Wilburn, P.; Silow, E.A.; Yampolsky, L.Y.; Litchman, E. Nitrogen and phosphorus colimitation of phytoplankton in Lake Baikal: Insights from a spatial survey and nutrient enrichment experiments. Limnol. Oceanogr. 2017, 62, 1383–1392. [Google Scholar] [CrossRef]
  58. Trifonova, I.S. Composition and Productivity of Phytoplankton in Lakes of Different Types on the Karelian Isthmus; Nauka: Leningrad, Russia, 1979; 168p. (In Russian) [Google Scholar]
  59. Kitaev, S.P. Basic General Limnology for Hydrobiologists and Ichthyologists; Kaufman, Z.S., Pervozvansky, V.Y., Eds.; Karelian Scientific Centre RAS: Petrozavodsk, Russia, 2007; pp. 132–157. (In Russian) [Google Scholar]
Figure 1. Map of sampling station at Lake Baikal.
Water 15 01139 g001
Figure 2. Water temperature (Tw), dissolved oxygen (DO), oxygen saturation (a), chlorophyll-a (Chl-a), phytoplankton biomass and abundance (b) in the littoral zone of Lake Baikal, 2020.
Water 15 01139 g002aWater 15 01139 g002b
Figure 3. Nitrate (NO3) and phosphate (SRP) concentrations in the littoral zone of Lake Baikal in 2020.
Water 15 01139 g003
Figure 4. Concentrations of mineral and organic forms of nitrogen and phosphorus in the littoral zone of Lake Baikal in 2020.
Water 15 01139 g004
Figure 5. NO3, SRP and Si concentrations in the littoral zone of Lake Baikal in 2020–2021.
Water 15 01139 g005
Figure 6. Ratio of TN:TP in the littoral zone of Lake Baikal in 2020. (green circles—values of TN:TP; the area between the red lines is the absence of nitrogen and phosphorus limitation).
Water 15 01139 g006
Figure 7. Changes in the saprobity index (mean value and range of values) in the littoral zone of Lake Baikal near the area of Bolshiye Koty settlement.
Water 15 01139 g007
Table 1. Mean concentration (±standard deviation) of hydrochemical parameters of water in littoral zone of South Baikal.
Water Quality
Parameters
JunJulAugSepOctNovDec
m±σm±σm±σm±σm±σm±σm±σ
Tw (°C)61.112.2312.23.712.22.36.715.50.54.40.5
O2 (mgL−1)10.00.29.10.88.20.87.90.38.80.3NANA
NO3 (μgN L−1)771625182323181643147271045
NO2 (μgN L−1)0.30.30.90.31.22.10.30.30.60.30.60.30.30.0
NH4+ (μgN L−1)4.71.63.92.33.92.33.12.33.91.64.70.82.30.8
TN (μgN L−1)120301003090409030130301601018020
PO43− (μgP L−1)7.21.62.02.02.62.61.31.63.31.65.20.78.81.0
TP (μg L−1)12.01.49.81.29.32.48.34.77.61.010.50.812.40.9
Si (mg L−1)0.420.130.220.080.250.050.340.030.350.030.390.020.590.04
Chl-a (μg L−1)0.90.71.81.01.30.61.30.40.90.3NANA
Notes: m, average value for the month; σ, standard deviation; NA, no available; Tw, water temperature; DO, dissolved oxygen; TN, total nitrogen; TP, total phosphorus; Chl-a, chlorophyll-a.
Table 2. Correlation analysis of temperature, hydrochemical characteristic value.
T wDOSaturationNO3NO2NH4+TNSRPTPSiChl-aBiomass
Tw 1
DO−0.711
Saturation 0.650.071
NO3−0.890.72−0.451
NO2−0.240.25−0.100.191
NH4+−0.180.18−0.120.21−0.091
TN−0.620.42−0.280.620.120.131
SRP−0.810.64−0.400.950.260.260.551
TP−0.280.360.070.420.140.110.330.431
Si−0.500.08−0.520.58−0.250.170.410.550.281
Chl-a0.47−0.120.53−0.50−0.09−0.29−0.15−0.50−0.05−0.61
Biomass 0.180.200.38−0.03−0.11−0.27−0.34−0.100.28−0.380.661
Notes: red indicates significant positive correlations, blue indicates significant negative correlations.
Table 3. Probabilities of the trophic status of the Lake Baikal littoral zone by mean values Chl-a, TP and transparency.
Parameterμuoμoμmμeμgt
Chl-a0.270.620.1100
TP0.110.640.240.010
Transparency0.010.220.550.210.01
Disclaimer/Publisher’s Note: The statements, opinions and data contained in all publications are solely those of the individual author(s) and contributor(s) and not of MDPI and/or the editor(s). MDPI and/or the editor(s) disclaim responsibility for any injury to people or property resulting from any ideas, methods, instructions or products referred to in the content.

