
Soil Nutrient Distribution and Preferential Flow Transport Patterns in Robinia Pseudoacacia Communities of Degraded Wetlands
1
College of Ecology and Nature Conservation, Beijing Forestry University, Beijing 100083, China
2
The Key Laboratory of Ecological Protection in the Yellow River Basin of National Forestry and Grassland Administration, Beijing 100083, China
*
Author to whom correspondence should be addressed.
Water 2023, 15(6), 1140; https://doi.org/10.3390/w15061140
Submission received: 21 February 2023
/
Revised: 11 March 2023
/
Accepted: 13 March 2023
/
Published: 15 March 2023
(This article belongs to the Special Issue Ecohydrological Processes, Environmental Effects, and Integrated Regulation of Wetland Ecosystems, Volume II)
Abstract
:The Yellow River Delta wetlands in the Yellow River Delta National Nature Reserve are facing serious degradation due to water scarcity and soil salinization. This study aims to investigate the mechanism of wetland degradation by analyzing the small-scale distribution of soil nutrients and preferential flow transport patterns in the Robinia Pseudoacacia community, which is a typical vegetation community in degraded wetlands. Soil physical and chemical properties based on field staining experiments were analyzed, and indoor solute penetration experiments were conducted to investigate the distribution of soil nutrients and hydrological characteristics. The results showed that the contents of soil organic carbon, organic matter, total nitrogen, and available phosphorus decreased with increasing soil depth, with higher contents in the preferential flow area than in the matrix flow area. Soil organic carbon, organic matter, total nitrogen, total phosphorus, and available phosphorus showed positive correlations with each other, while soil pH and conductivity exhibited negative correlations with the above nutrients. The efflux rate of the Acacia community exhibited a gradual decline as soil depth increased, and the relative concentration of the solution exhibited a non-monotonic pattern of decrease, increase, and subsequent decrease with increasing soil depth. The findings could provide valuable guidance for the restoration and management of degraded wetlands in the Yellow River Delta.
1. Introduction
The Yellow River Delta, situated in Dongying City, Shandong Province, is a unique wetland ecosystem characterized by the confluence of the Yellow River sediment and tidal water. It is also an important stopover for migratory birds. In recent years, human activities such as port construction, aquaculture development, salt manufacturing, farmland reclamation, and oil field construction have intensified in the coastal area of the Yellow River Delta [1], leading to a reduction in freshwater resources and degradation of the ecosystem. This has resulted in shoreline erosion, forest degradation, and other environmental and ecological problems, and has threatened the ecological security of the soil in the Yellow River Delta [2,3,4]. Based on the need for wetland restoration, many scholars have studied the hydrological connectivity characteristics of the Yellow River Delta from larger scales [5], but small-scale hydrological effects tend to constrain large-scale hydrological connectivity. Current studies of soil preferential flow in the Yellow River Delta region have paid little attention to soil nutrient transport and distribution.
The discovery of the preferential flow phenomenon represents a significant shift in the field of water and solute transport studies, moving away from a focus on homogeneous transport towards a recognition of the inhomogeneous nature of such processes [6,7]. Preferential flow represents an imbalanced movement of water through soil, influenced by a range of factors, including soil texture and structure, macroporosity, water repellency, bulk density, organic matter content, the presence of vegetation roots, gravel, the rate of solute application, irrigation practices, tillage regimes, and the impact of wet-dry and freeze-thaw cycles [8,9,10,11,12,13,14]. Three main types of preferential flow can be identified: macropore flow, funnel flow, and finger flow [15]. These different types of flow exhibit distinct characteristics, including encircling behavior, instability, imbalanced transport, rapid transport speeds, and trailing penetration curves [16,17].
In recent research, soil column penetration experiments have emerged as a prevalent approach for investigating small-scale preferential flow in soils [18]. Such experiments are typically performed on either in-situ columns taken from the study site or artificially constructed columns featuring large pores. Tracer substances are applied to the surface of the columns, either through the simulation of rainfall or through the manipulation of the water head in a marsupium, and the concentration and volume of the effluent are monitored at predetermined intervals. The resulting penetration curves and process lines are then analyzed to gain insight into the transport of solutes through the soil [19].
A number of studies have used this approach to compare the solute penetration characteristics of different soil types, through the use of artificial macroporous columns [20,21]. In other studies, the penetration curves of both in-situ and remodeled soil columns have been compared to provide evidence for the existence of preferential flow in soils [22]. These studies demonstrate the usefulness of soil column penetration experiments in furthering our understanding of the complex and inhomogeneous processes of water and solute transport in soils. Another study indicates that the degradation of wetlands leads to a gradual increase in soil temperature and bulk density, and a corresponding decrease in soil conductivity and moisture content. Furthermore, changes in soil physical properties were accompanied by differences in soil nutrient contents at various stages of wetland degradation [23].
Research on soil nutrients is particularly important in the restoration of degraded wetlands. An analysis of degraded wetlands in the Lake Taihu area using a spatiotemporal intergenerational approach revealed further insights into the impact of wetland restoration on soil properties [24,25,26]. As the restoration process progressed and vegetation was restored, an increase was observed in soil organic carbon, total nitrogen, alkaline decomposition nitrogen, and soil porosity, with the number of restoration years serving as a positive predictor of these changes. Conversely, soil dry capacity and pH were found to decrease over the course of the restoration process. These findings highlight the importance of considering multiple soil parameters in the evaluation of wetland restoration efforts and demonstrate the utility of the spatiotemporal intergenerational method in understanding the dynamics of soil properties in degraded wetlands.
The present study aims to understand the preferential flow transport pattern of degraded acacia communities and the distribution of nutrients in degraded soils in the Yellow River Delta. The goal of this research is to investigate the relationship between preferential flow and nutrient distribution, to provide theoretical guidance for the protection of the regional ecological environment. By offering theoretical guidance and technical support for the effective management of regional water resources and ecological protection, this study seeks to contribute to the preservation of the valuable wetland ecosystem of the Yellow River Delta.
2. Materials and Methods
2.1. Study Area
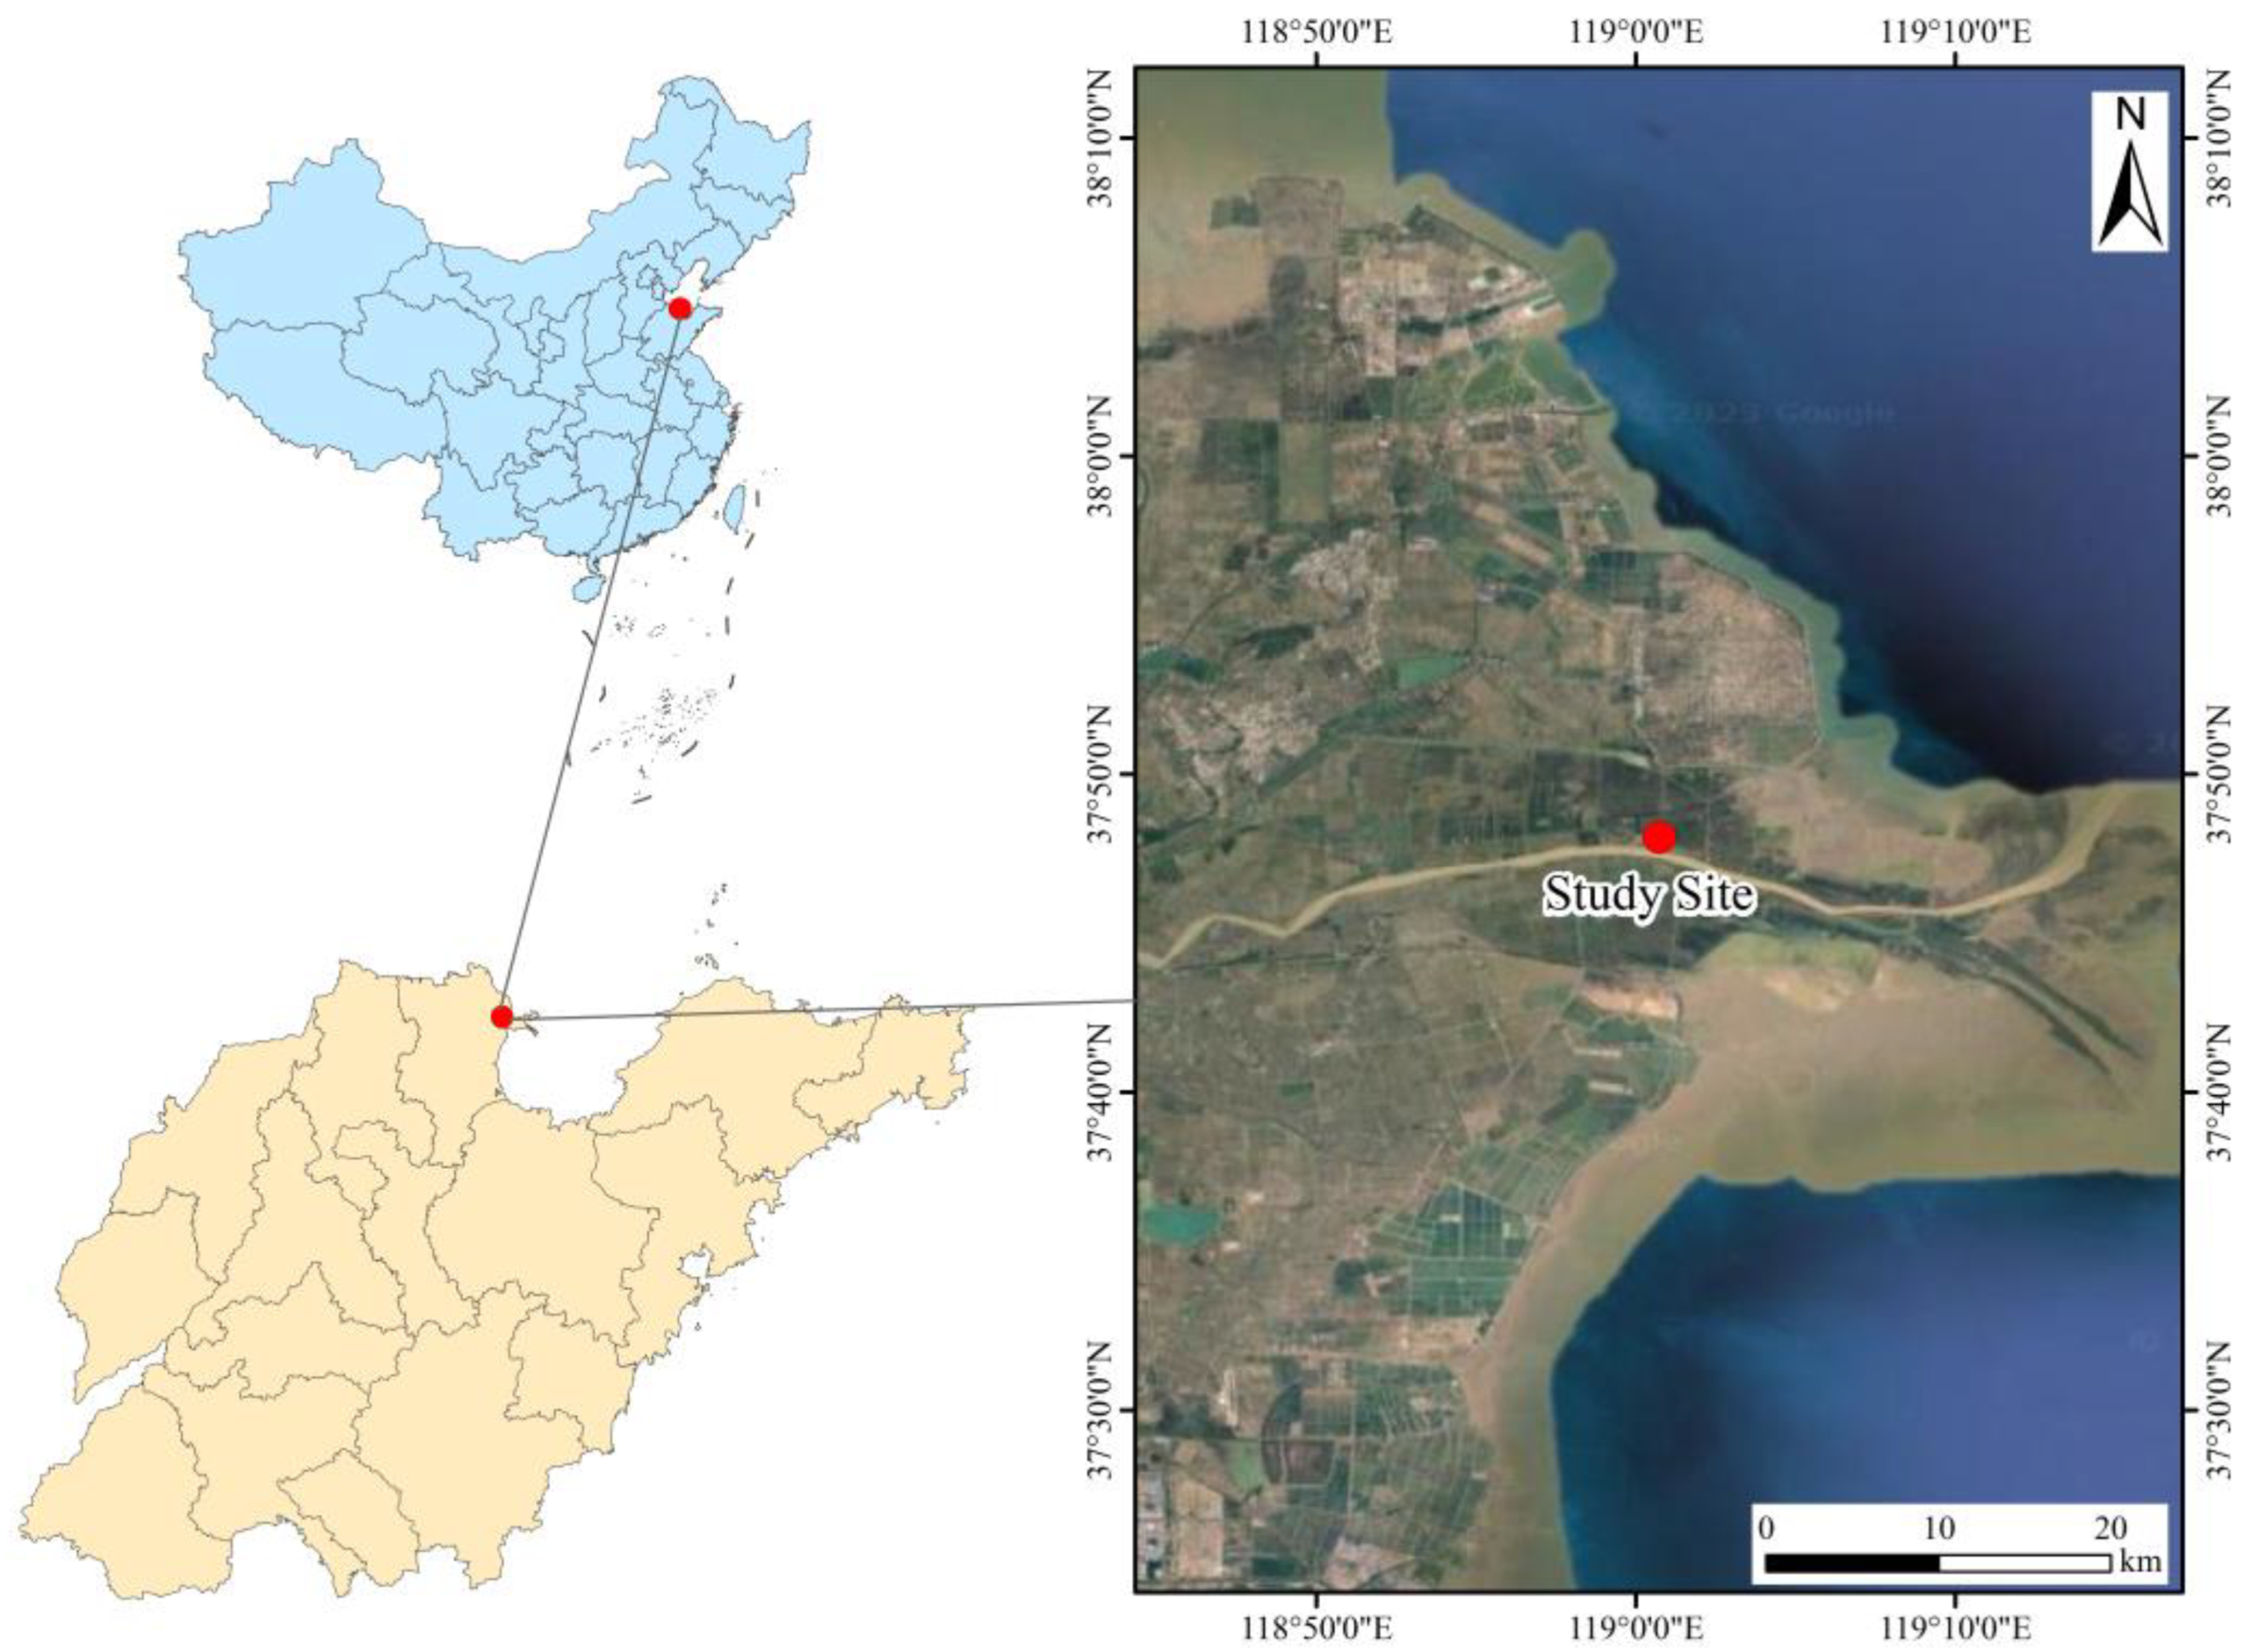
The present study is conducted in the Yellow River Delta National Nature Reserve situated in Dongying City, Shandong Province, China (Figure 1), with a geographical extent that spans between 37°35′ N to 38°12′ N and 118°33′ E to 119°20′ E. The National Nature Reserve is divided into three geomorphological zones, namely onshore, tidal, and subtidal. The soil types in the area are dominated by tidal soils and salt soils, which are primarily composed of alluvium derived from the Yellow River.
The climate in the study area is characterized by a warm-temperate continental monsoon pattern with pronounced seasonal variations and marked inter-annual variability in precipitation. The vegetation in the Reserve primarily comprises deciduous broad-leaved forests, marsh vegetation, and salt vegetation. Among these, the artificial acacia forest, located on the east side of the thousand two, Dawenliu Nature Reserve, and the old Yellow River Road, is the largest in China. The average age of the acacia forest in the Yellow River mouth management station is over 20 years, while that on the east side of the Yellow River Road is 20 years. These forests are primarily located in newly formed silt lands resulting from the Yellow River flooding diversions and are situated at an altitude of 2–3 m. The soil in these areas is fertile, with a salt content of less than 0.3%.
2.2. Field Experiment
The present study was conducted in the acacia community within the Yellow River Delta National Nature Reserve, located in Dongying City, Shandong Province, China (latitude and longitude: 37°48′00″ N, 119°00′45″ E, elevation 4.0 m). Three plots (CH1, CH2, and CH3) were randomly selected, spaced more than 3 km apart from each other, within the community. These plots were chosen based on the criteria of flat terrain and the presence of wetland patches without standing water throughout the year. In the process of weed removal, the soil surface was minimally disturbed, and a square quadrat with an area of 1.2 m × 1.2 m was set up with the sample tree as the center. Additionally, no precipitation was recorded in the week prior to the experimental study.
2.3. Soil Column Breakthrough Experiment
The present study aimed to examine the solute penetration characteristics in various vegetation communities within the Yellow River Delta National Nature Reserve in Dongying City, Shandong Province, China. To accomplish this objective, soil vertical profiles were excavated, and in situ soil columns were collected at four different depths (0–10, 10–20, 20–40, and 40–60 cm), repeated sampling per layer.
The solute penetration experiments were carried out using Brilliant Blue solution at a concentration of 1 g/L [27]. The experiments were performed under controlled conditions with a constant water head of 1 cm. The test was terminated and data were recorded and analyzed once the first drop of solution had exited the column. Subsequently, the concentration of the effluent was measured using a UV spectrophotometer at a wavelength of 627 nm.
2.4. Outflow Fluid-Related Parameters
The monitoring of the outflow index included various parameters such as the initial penetration time, the relative concentration of the outflow solution, the outflow rate, and the cumulative volume of the outflowing solution. The initial penetration time was defined as the elapsed time from the initiation of the titration experiment to the emergence of the first drop of effluent, expressed in minutes. The relative concentration of the outflowing solution, expressed as a dimensionless value, was calculated as the ratio of the effluent concentration to the initial concentration of the infiltrating solution. The initial concentration of the Brilliant Blue infiltrating solution was 1 g/L, and the relative concentration of the solution (C/C0) was calculated as the ratio of the effluent concentration (C) to the initial concentration (C0), so the outflow liquid concentration value is the relative outflow liquid concentration. The outflow rate was calculated as the volume of outflowing liquid per unit time, expressed in milliliters per minute, and was determined using the equation: V = Q/t, where Q represents the volume of outflow in time t, expressed in milliliters, and t represents the penetration time, expressed in minutes. The cumulative outflow volume was determined by summing the outflow volumes over the duration of the experiment.
2.5. Soil Physical and Chemical Determination
Soil samples were collected from various depths (0–10, 10–20, 20–40 cm, and 40–60 cm) around the quadrat and immediately sealed to preserve their characteristics. These samples were then transported to the laboratory for further analysis of their physical and chemical properties.
The bright blue solution was used as the staining tracer, with a concentration of 4 g/L and a volume of 50 L. The solution was applied evenly to the surface of the sample using a manual spray bottle. After the application of the Brilliant Blue staining tracer was completed, the sample was covered with plastic film to reduce rainfall washing or evaporation from the surface.
After 24 h of bright blue staining solution application, the middle part of the sample plot, 1.0 m × 1.0 m (length and width), was selected as the study sampling area to eliminate boundary effects. Sampling was carried out in the vertical profile, in the preferential flow zone and the matrix flow zone (the stained area was considered as the preferential flow area and the unstained area as the matrix flow area), respectively, using a standard ring knife (100 cm3) with a soil depth gradient of 10 cm, with three replicates of each soil layer in the stained and unstained zones, and the soil samples taken in both zones were placed in a refrigerator at 4 °C to await sample analysis. The measurement of relevant indicators was conducted in accordance with the methodology described by Vogt et al. [28] to guarantee accuracy in the results.
3. Results
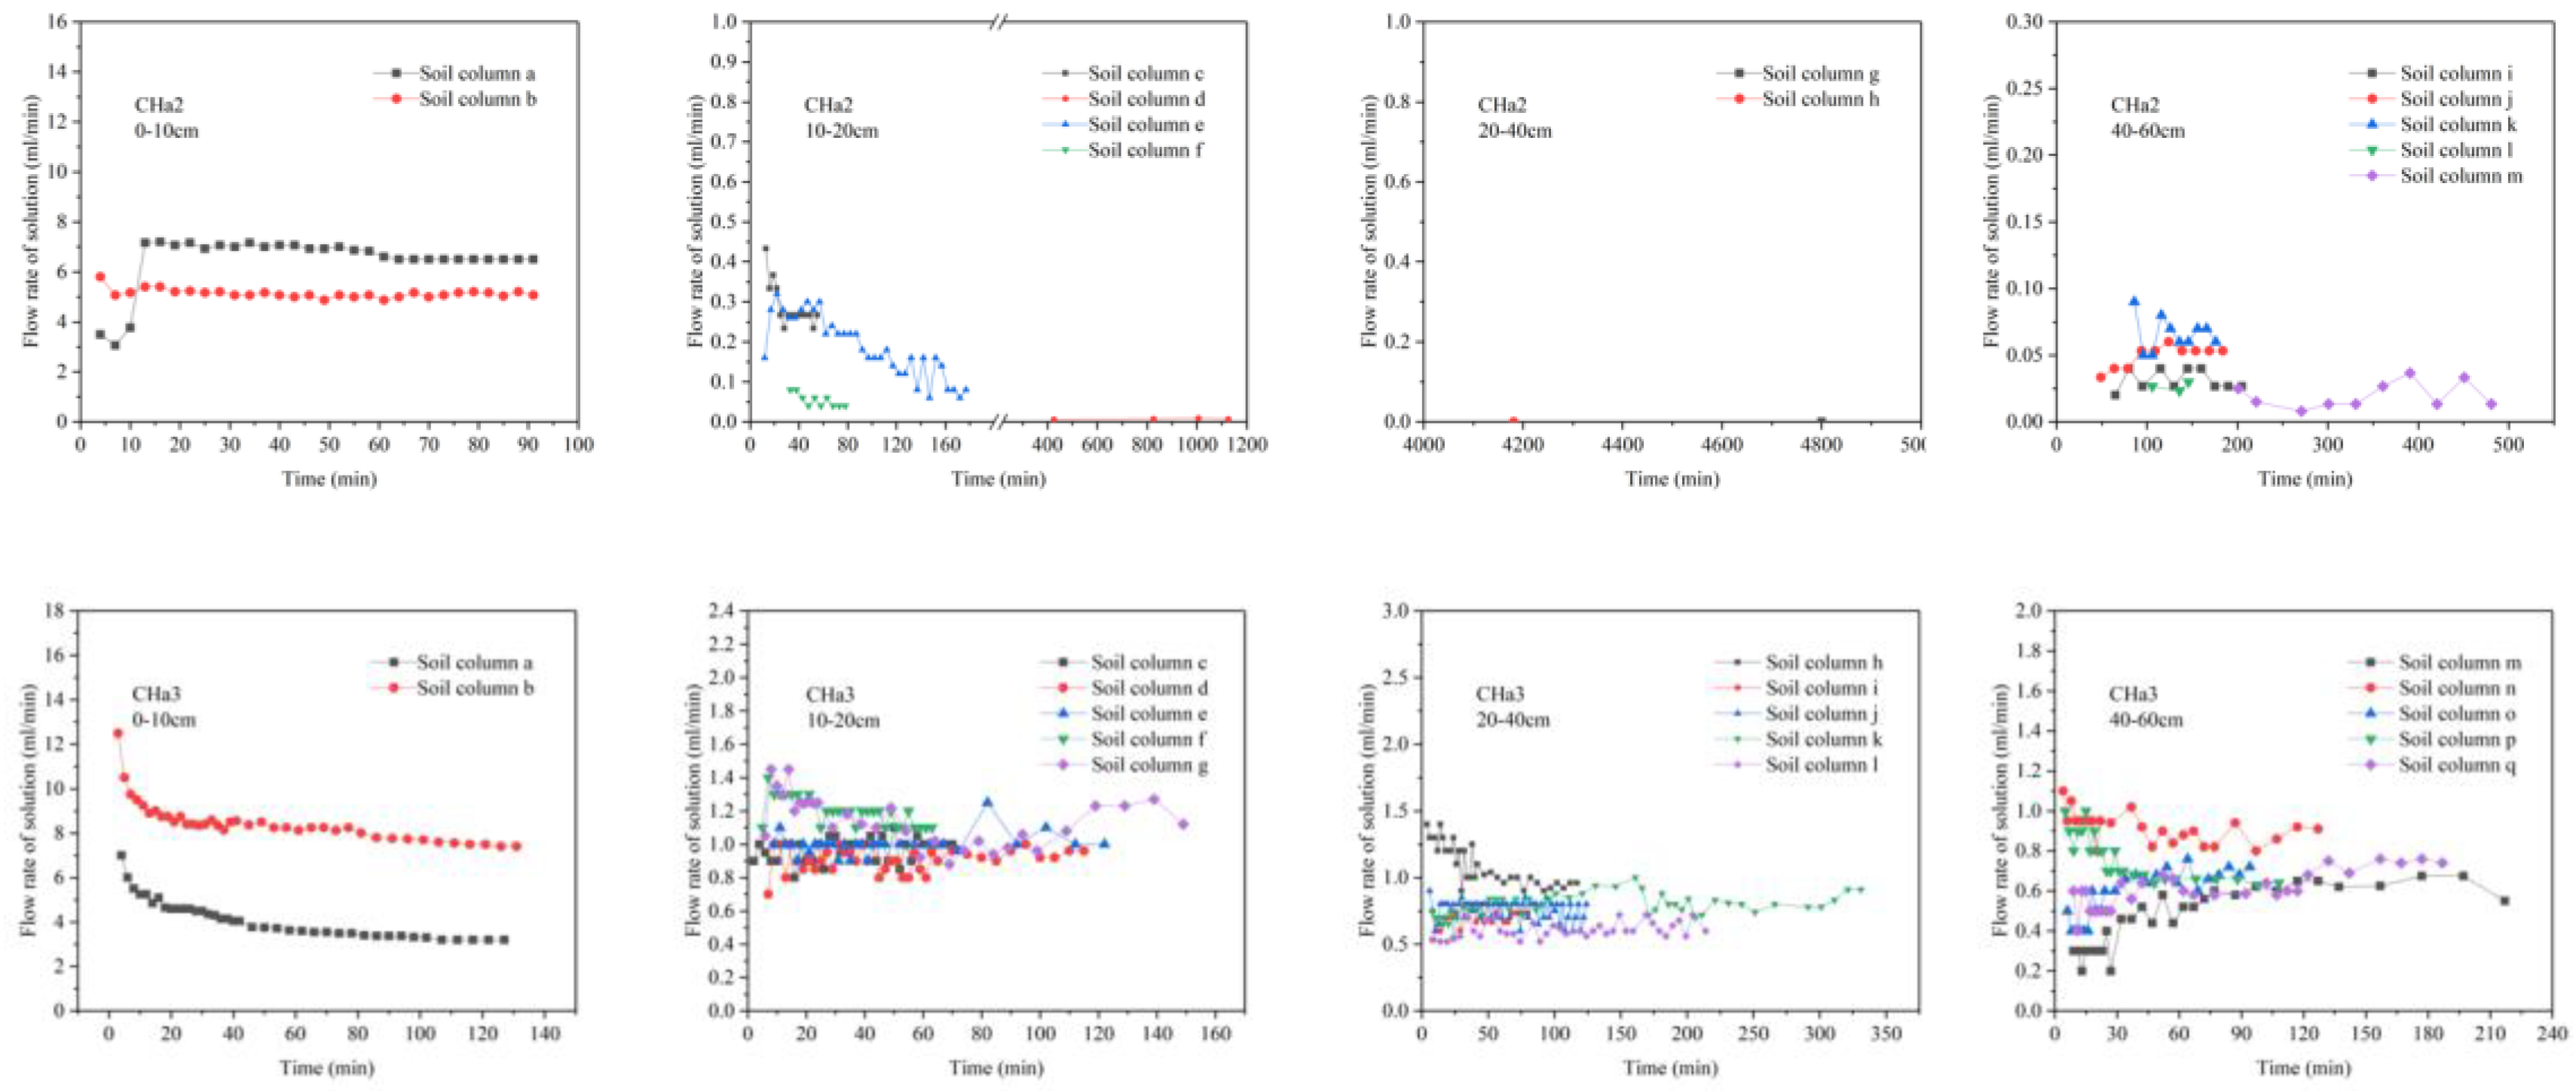
3.1. Outflow Rate and the First Penetration Time Variation
Figure 2 indicates the outflow rates of soil columns at different soil depths in acacia communities. (a) For soil depths 0–10 cm, the first penetration time (time from the start of the titration to the first drop of solution) of CHa1 was 1′10.9″ and 1′17.3″, the first penetration time of CHa2 was 1′23.8″ and 1′55.9″, and the first penetration time of CHa3 solution was 1′16.2″ and 2′6.1″. The average value of the first penetration time of CHa1, CHa2, and CHa3 solutions at 0–10 cm soil depth was 92″, which means the solution penetrates the soil column in a short time, and there was no significant difference (p > 0.05) in the first penetration times of the three groups. (b) Soil depth 10–20 cm, the penetration time of the three groups ranged from 3′54.4″ to 4 h 46″, The first penetration time of CHa1 solution was 11′54.5″12′58.9″, 13′21.1″, and 19′50.9″, the first penetration time of CHa2 solution was 7′2.9″10′22″, 28′7.9″, and 4 h 46″, the first penetration time of CHa3 solution was 3′54.4″, 4′36.1″, 5′39″, 7′43.9″ and 10′12″, the time was longer than that of 0–10 cm depth, and the penetration time of CHa3 solution was lower than that of CHa1 and CHa2. However, there were significant differences (p < 0.05) in solution penetration times for different in situ soil columns at the same soil depth, for example, CHa2 penetration time for one in situ soil column was much higher (4 h) than other soil columns. (c) At soil depths of 20–40 cm, penetration times for three groups ranged from 2′57.1″ to 37′33.5″, the first penetration times of CHa1 solution were 4′3.8″, 8′32.2″, 9′5.2″, 10′43.9″, 28′41.1″, and 37′33.5″, the first penetration times of CHa2 solution were 4181″ and 4800″, and the first penetration times of CHa3 solution were 2′57.1″, 4′27.2″, 5′36.7″, 6′16.1″, 6′16.1″ and 6′23″. There are differences in the penetration effect of different in situ soil column solutions at the same site and soil depth, for example, CHa1. The first penetration time of the CHa2 solution was significantly higher than that of CHa1 and CHa3, and the flow rate was zero for a long time in CHa2 soils at 20–40 cm depth, the solution was retained in the soil layer. (d) At soil depths of 40–60 cm, the penetration times of the three groups ranged from 2′24″ to 3 h 1′15.3″, CHa1 solution penetration times were 11′51.9″, 13′23.8″, 18′21.6″, 18′36.4″ and 26′52.6″, and CHa2 solution penetration times were 34′34.7″, 50′43.2″, 1 h 16′17.3″, 1 h 16′22.6″ and 3 h 1′15.3″, and CHa3 solution penetration times were 2′24″, 3′56.1″, 4′34.3″, 7′0.7″ and 7′23″. The first penetration times of CHa1, CHa2, and CHa3 solutions were significantly different (p < 0.05), and the penetration effect of different soil columns at the same soil depth in the same place was different, for example, CHa2.
The outflow rate of soil depth 0–10 cm gradually decreases with the extension of penetration time, and finally reaches the stable infiltration state with a larger stable outflow rate. The steady outflow rates were significantly lower at soil depths of 10–20, 20–40, and 40–60 cm than at soil depths of 0–10 cm. In summary, the steady outflow rates of CHa1, CHa2, and CHa3 were less than 1 mL/min at soil depths of 10–20, 20–40, and 40–60 cm. The flow rate fluctuated with penetration time at different soil depths and showed instability.
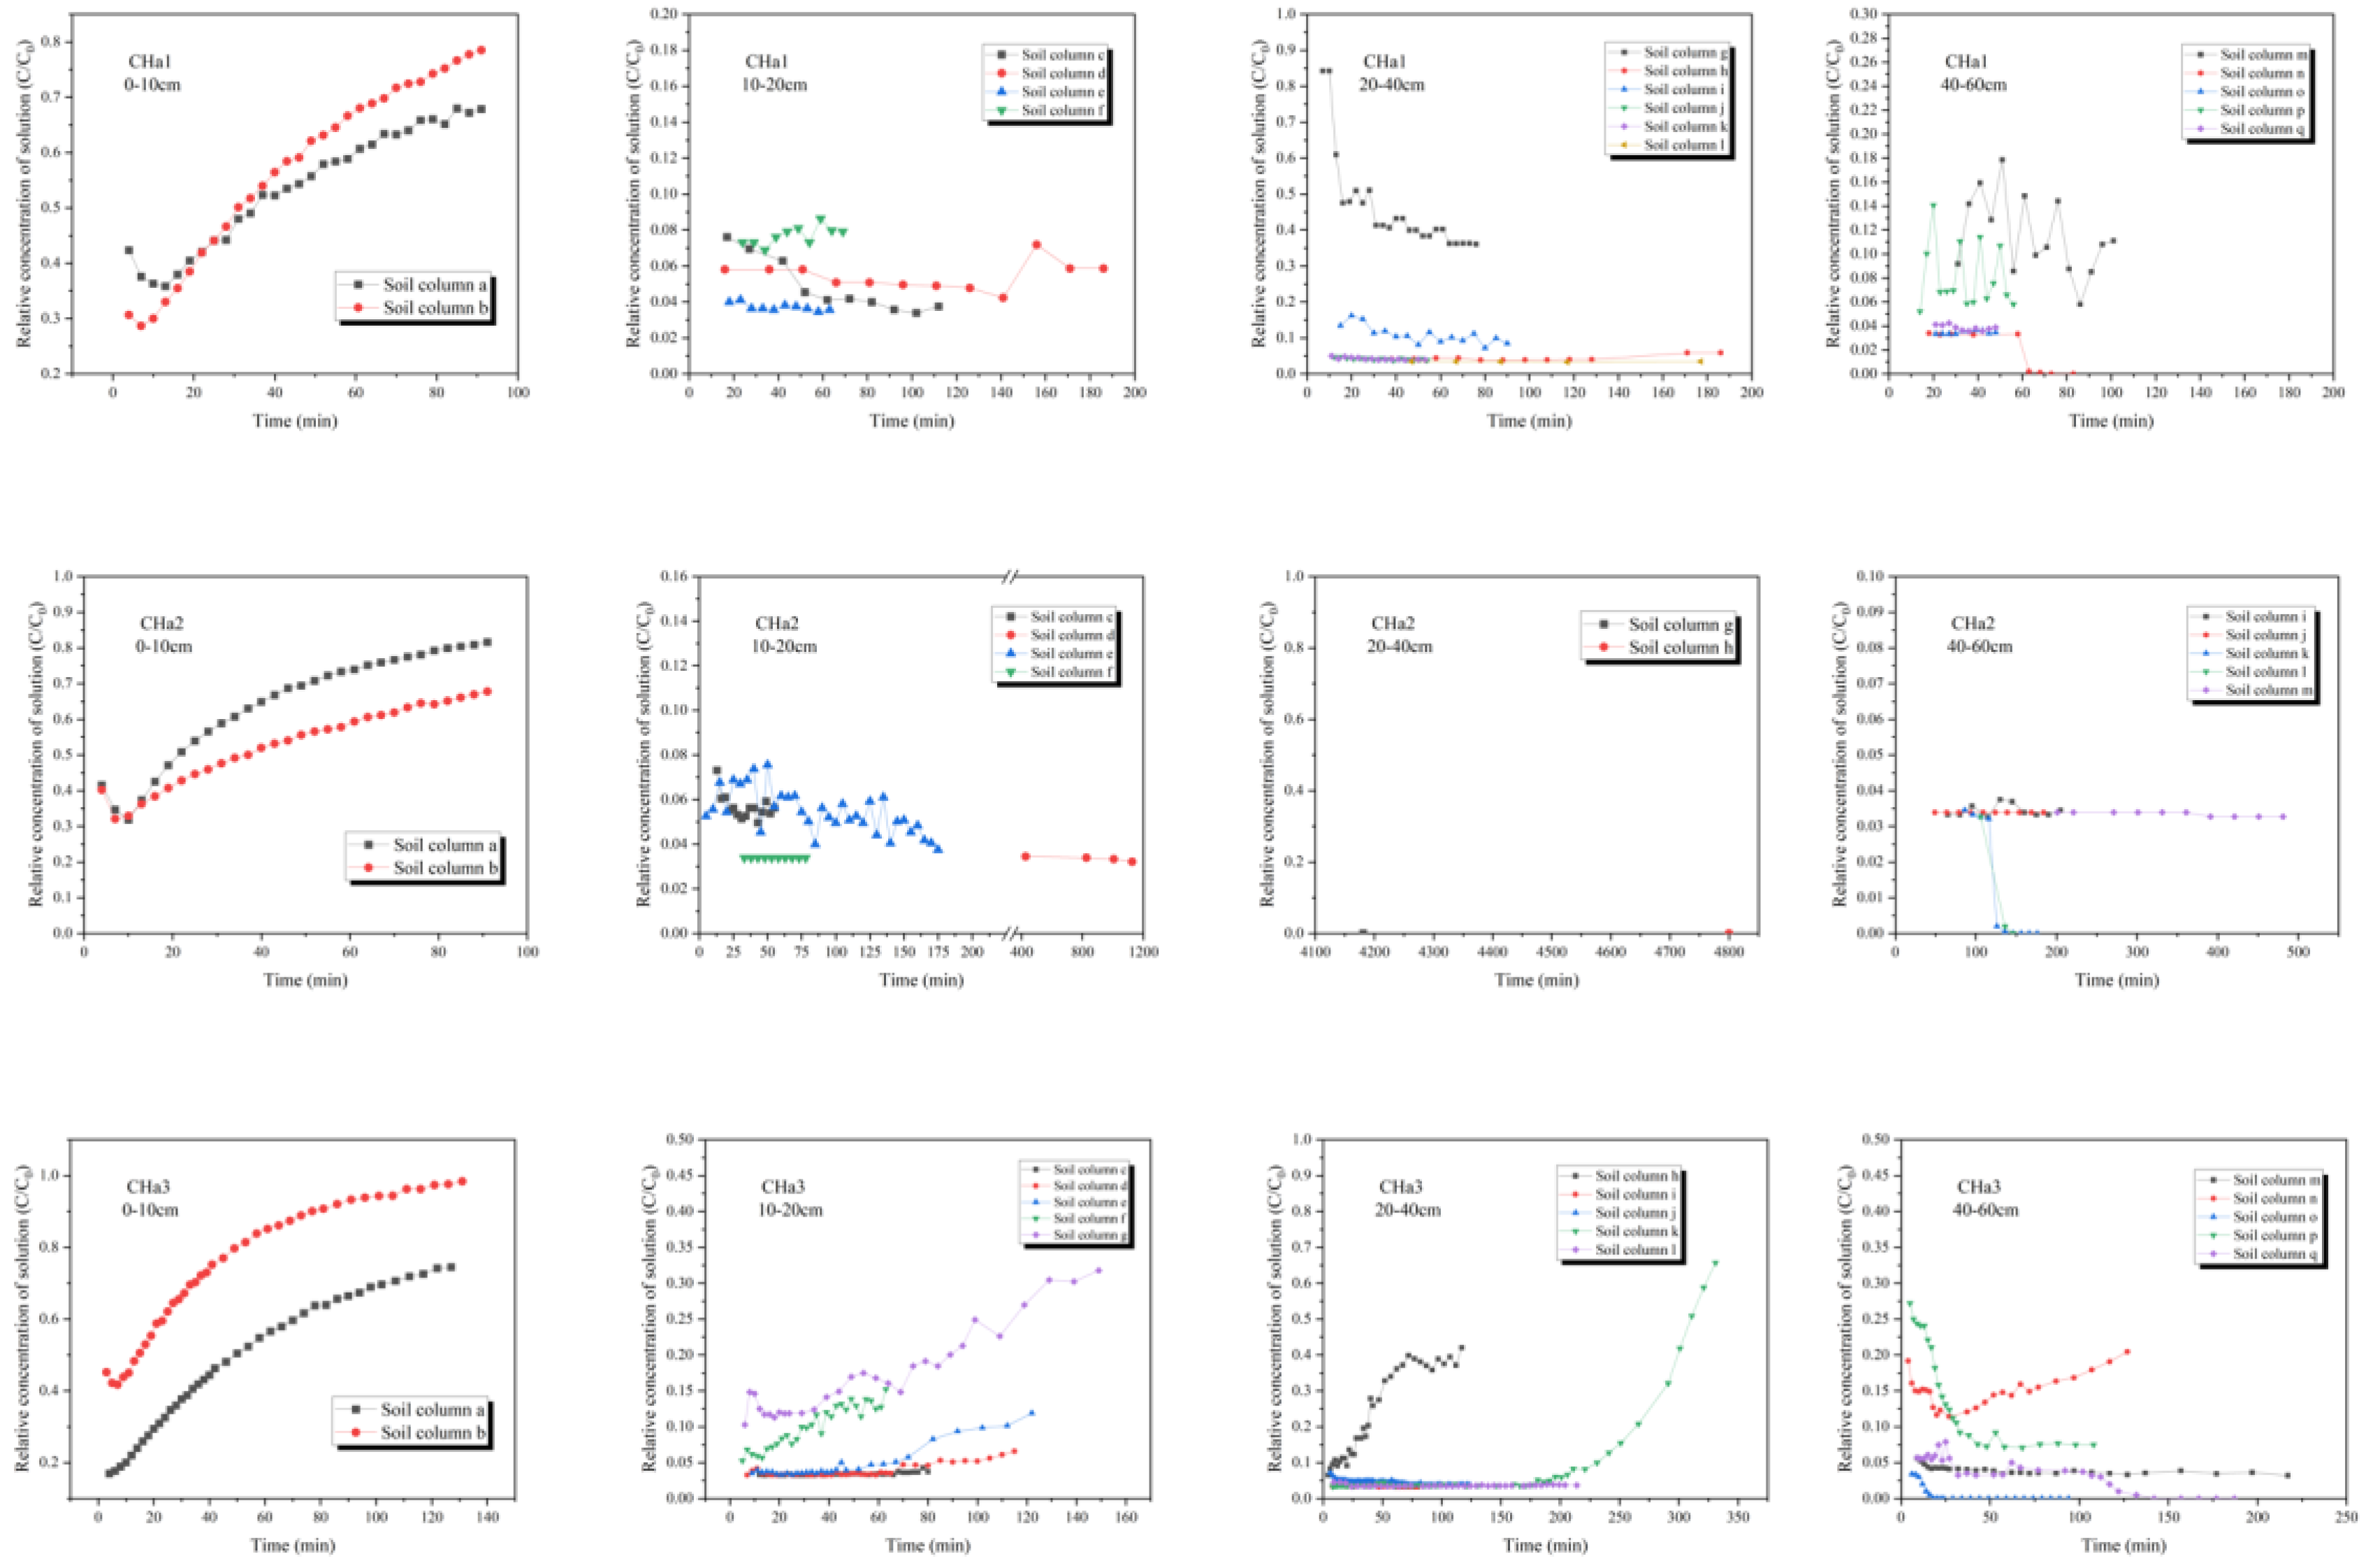
3.2. Characteristics of Outflow Fluid Concentration
Figure 3 represents the variation of effluent liquid phase pair concentration with penetration time in the indoor in situ soil columns of acacia communities at different soil depths. (a) At soil depths of 0–10 cm, the initial values of effluent phase pair concentrations ranged from 0.40 to 0.50, and the final values of effluent phase pair concentrations were as high as 0.90. The effluent phase pair concentrations of CHa1, CHa2, and CHa3 showed a trend of decreasing and then increasing (b) At soil depths of 10–20, 20–40, and 40–60 cm, the effluent phase pair concentrations of the three groups of samples varied significantly with penetration time. (c) At soil depths of 10, 20, 20–40, and 40–60 cm, there were significant differences in the effluent phase pair concentrations of the three groups of samples with the extension of penetration time. In summary, there was strong heterogeneity in the relative concentrations of solution from different soil columns at the same soil depth with penetration time in Robinia Pseudoacacacia communities.
3.3. Soil Nutrient Characteristics
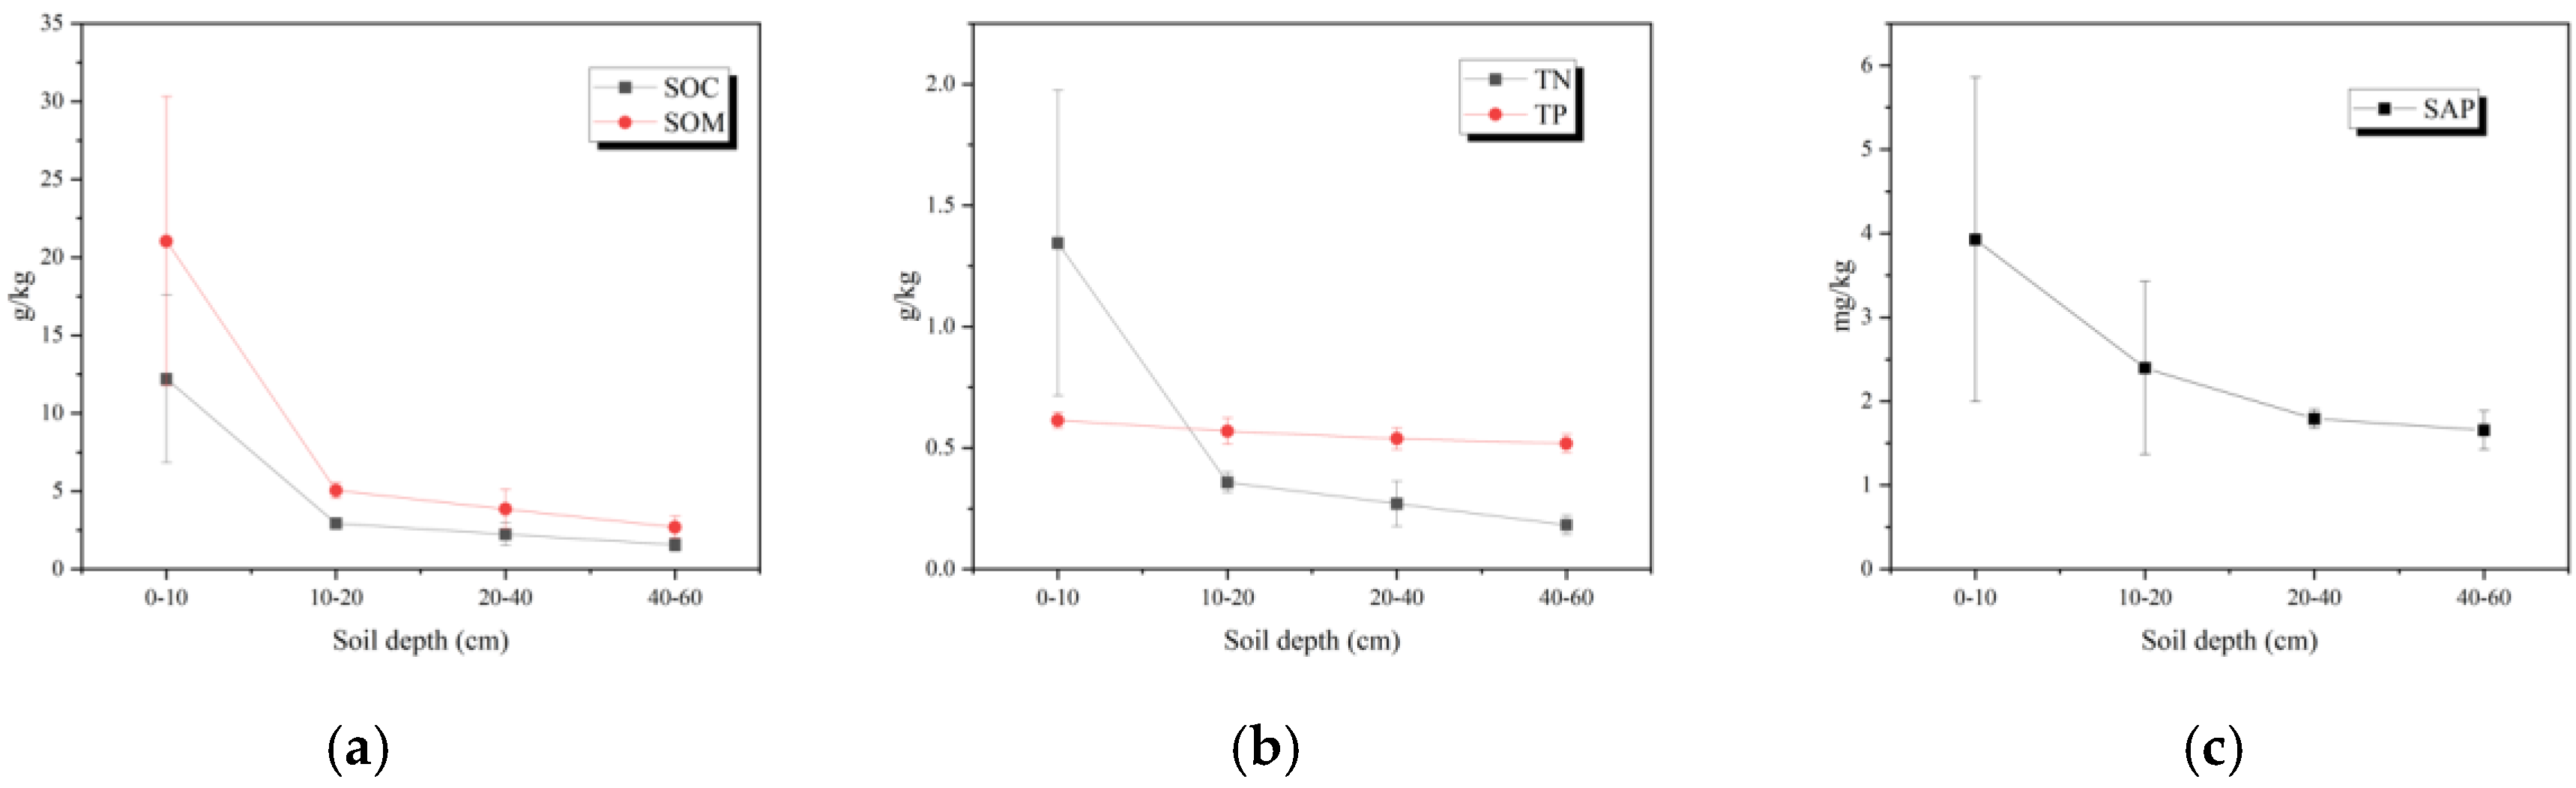
Figure 4 and Table 1 show the soil organic carbon, organic matter, total nitrogen, and available phosphorus content showed a decreasing trend with increasing soil depth, while total phosphorus content was less variable.
Figure 5 and Table 2 show the soil organic carbon content, organic matter content, total nitrogen, and available phosphorus content in the preferential flow zone of the acacia community at soil depth 0–40 cm were 6.958 ± 6.083, 11.995 ± 10.486, 0.710 ± 0.606 g/kg, 3.430 ± 1.037 mg/kg, respectively. The matrix flow areas were 4.280 ± 2.439, 7.378 ± 4.205, 0.453 ± 0.271 g/kg, and 2.600 ± 0.298 mg/kg, respectively. Soil depth 0–40 cm total phosphorus content was 0.530 ± 0.038 and 0.570 ± 0.030 g/kg in the preferential flow and matrix flow zones, respectively. Soil organic matter, organic carbon, total nitrogen, and available phosphorus gradually decreased with increasing soil depth in the preferential flow area and the substrate flow area, and the content of several components in the preferential flow area was higher than that in the matrix flow area. There was no significant pattern of soil total phosphorus content with increasing soil depth in the preferential flow and matrix flow zones. There was no significant difference (p = 0.38 > 0.05) between the total phosphorus content of soils in the preferential flow area and the matrix flow area, and they were uniformly distributed.
4. Discussion
4.1. Preferential Flow Types and Characteristics
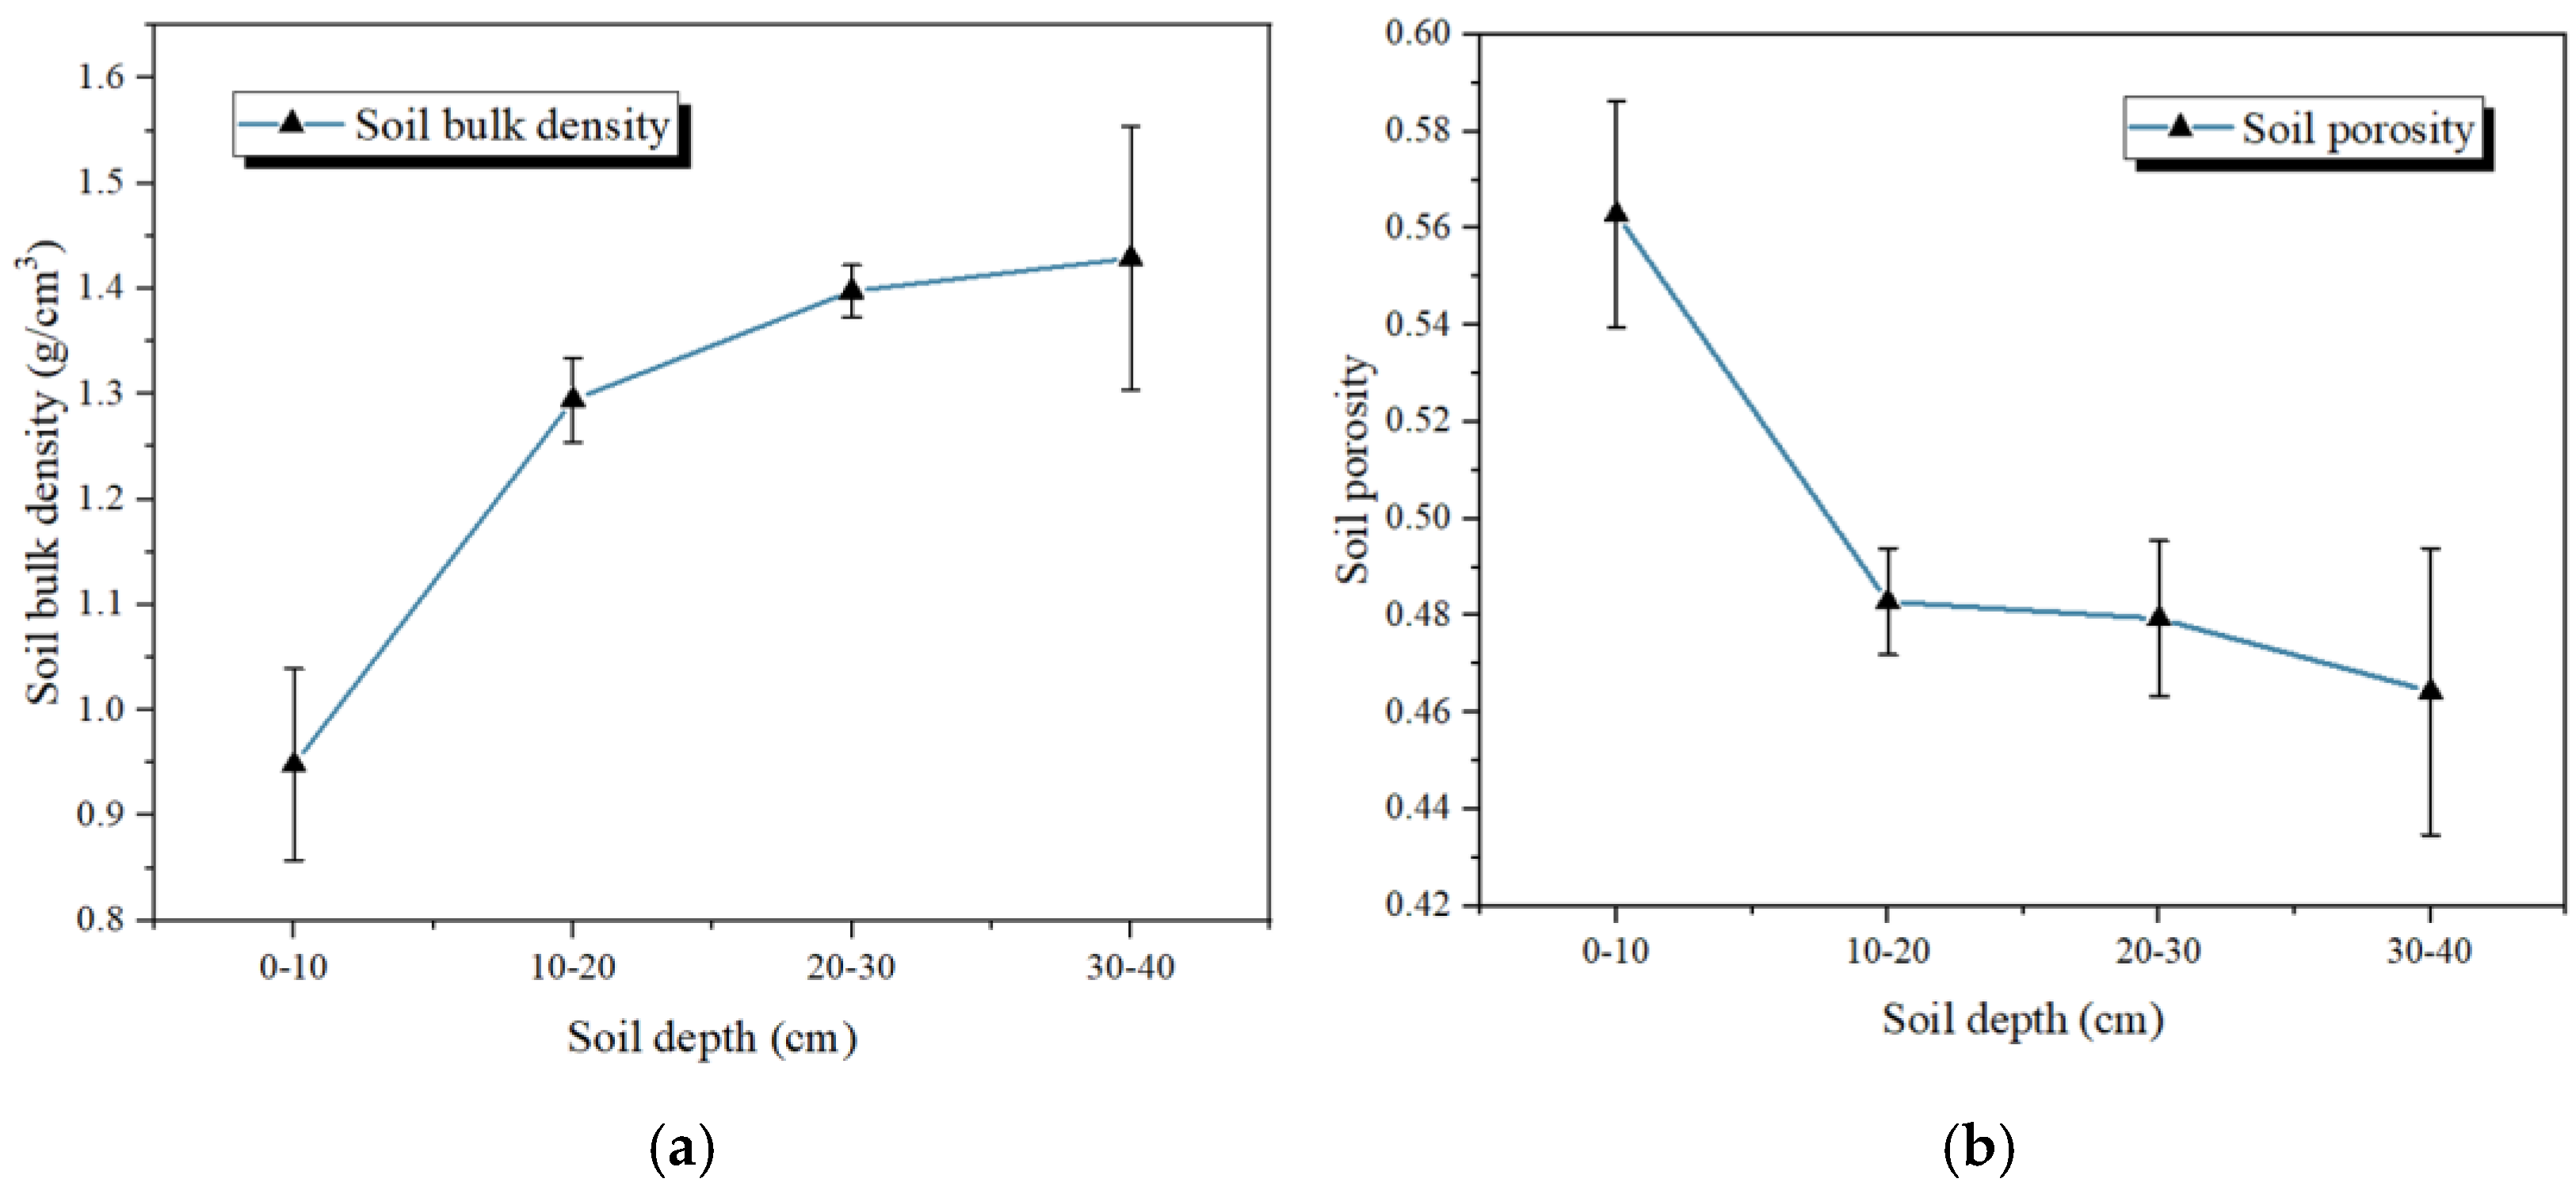
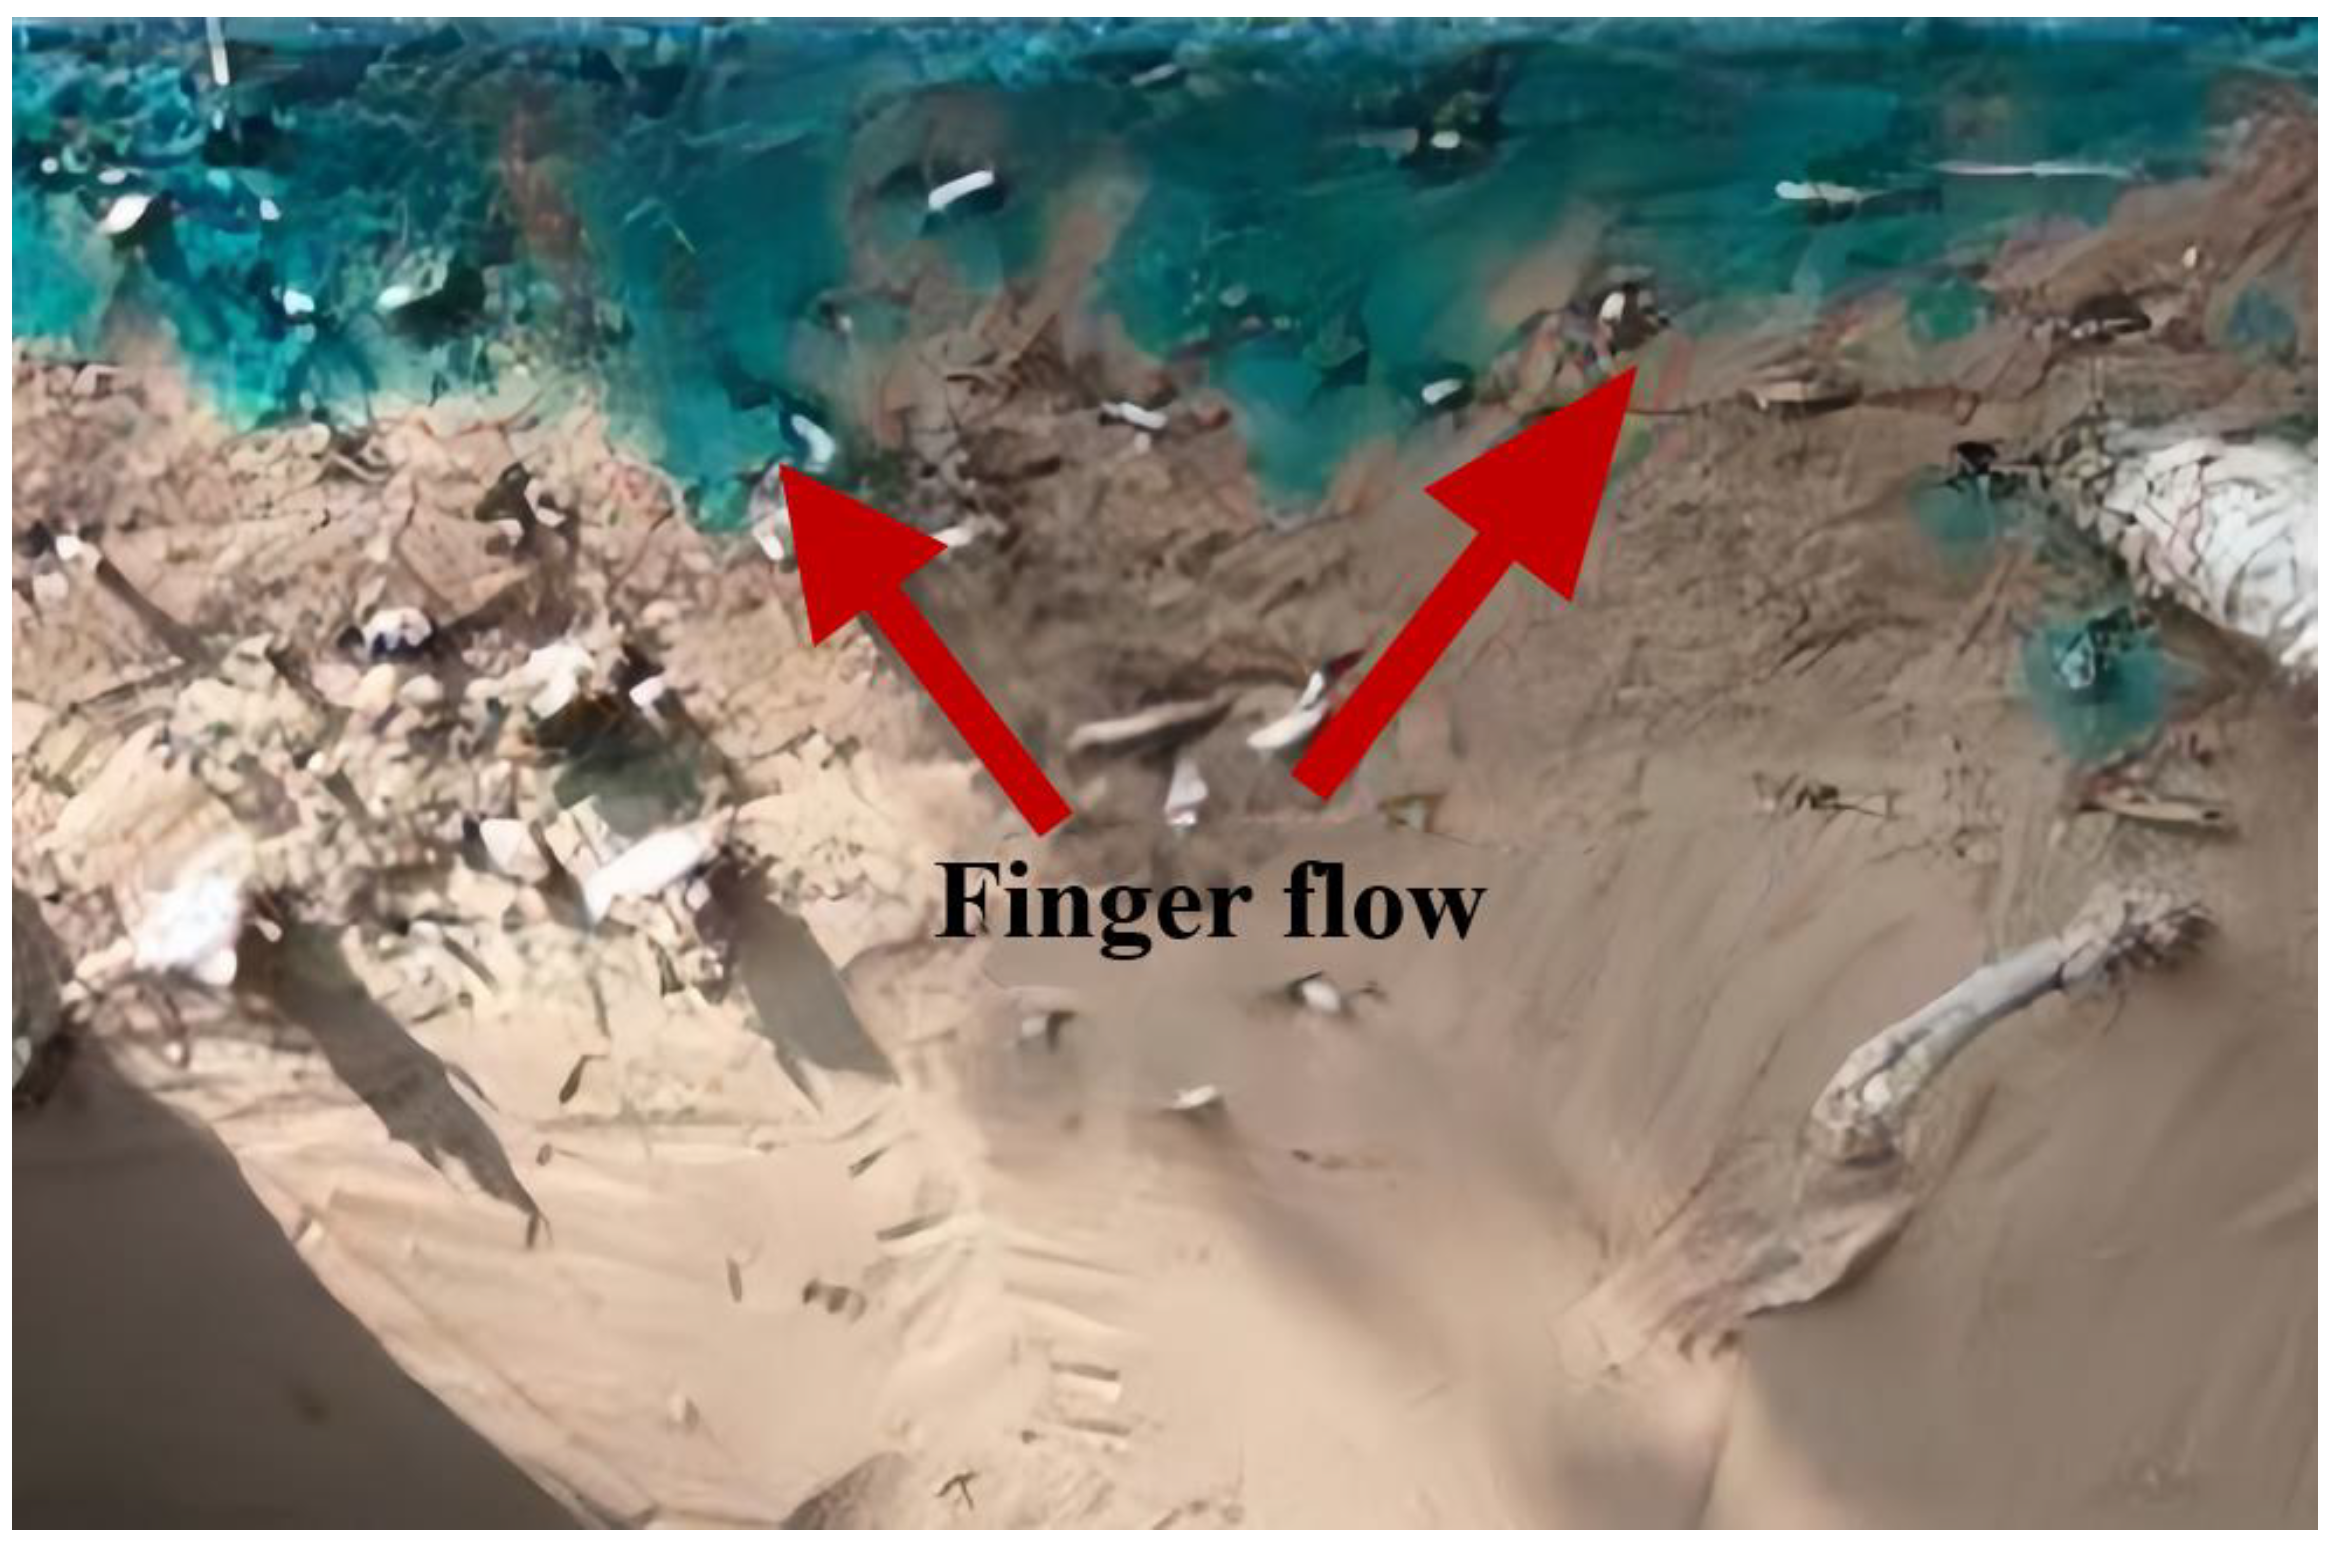
The morphology of preferential flow can be broadly classified into three categories: macropore flow, funnel flow, and finger flow [15]. Judging from the conditions of occurrence of preferential flow, there is a stratified difference in the structure of the soil where finger flow occurs, showing that the upper layer is loose and the lower layer is compact. The soil bulk density in acacia forests exhibits a positive correlation with increasing soil depth, whereas the porosity exhibits the opposite trend as shown in Figure 6. This suggests soil profiles show differences in layer differentiation with a relative homogeneity, which highlights finger flow as the dominant type of preferential flow triggered by unstable wetting fronts [29]. Judging from the staining shape, the finger flow usually appears as “tongue” and “finger” in the soil profile as shown in Figure 7. The uneven distribution of capillary force and surface tension leads to the instability of the wetting front, resulting in the rapid transport of water or solutes through a smaller pathway. This transport mechanism allows for a large volume of water flow and the quick dispersion of soluble substances to deeper soils and groundwater.
The occurrence of finger flow results in a portion of the finger flow pathway transporting a large volume of water flow in a non-uniform, downward direction. Instead, it presents a “tongue” or “finger” infiltration phenomenon around the majority of the soil matrix [30,31]. The fast infiltration rate associated with finger flow can pose a risk to water redistribution and groundwater pollution [32]. This is linked to the fact that the root system of the acacia community is primarily distributed at this depth, along with a thicker layer of dead sediment and humus on the surface, which forms pores in conjunction with the root pore channels created by the physical action of the root system. This forms a network of interconnected pores and increases the preferential flow pathway. Additionally, the litter layer serves to reduce raindrop erosion, preserve the soil surface structure, and enhance soil hydraulic conductivity, thereby facilitating the rapid transport of water and solutes.
We found in the soil column penetration experiment that the first penetration time of CHa3 solution in different soil depths did not differ significantly, all of them were below 10′, and the soil texture was more uniform; however, the penetration time of CHa2 solution in different soil depths differed significantly, and the penetration time fluctuated the most, and the penetration time of CHa2 solution in the same soil depth difference differed significantly, which was due to the soil texture caused by strong heterogeneity in the three sample sites CH1, CH2, and CH3. Compared with CHa2, the difference in infiltration time of CHa1 solution at different soil depths is smaller, but the difference in infiltration time of CHa1 solution at different soil depths is obvious, and the infiltration time at 10–20 and 40–60 cm soil depths is consistent, and the infiltration time at this depth is greater than that at 0–10 and 20–40 cm soil depths, indicating that the phenomenon of preferential flow at 0–10 cm soil depth. The stable outflow rate of acacia communities in the original soil column at soil depth 0–10 cm is significantly higher than other soil depths, which is because the soil depth 0–10 cm of acacia communities has the smallest soil bulk density and loose soil, while the total porosity, large porosity, water holding capacity, aeration, and drainage capacity are the highest. Meanwhile, 0–10 cm is the main distribution range of vegetation roots, and the root system and soil contact with soil to form pore space and enrich the preferential flow path, this depth has a better inflow effect.
The temporal pattern of declining and then increasing relative concentration of the solution in the 0–10 cm soil depth within acacia communities is a result of the interplay between preferential flow and soil matrix flow. At the early stage of solution application, the presence of preferential flow leads to a relatively low concentration of outflow solution. As time progresses, the preferential flow effect decreases and fine soil particles gradually fill the preferential flow paths, leading to the establishment of a more extensive lateral and vertical pore network. This increased permeability facilitates the transport of solution through the soil matrix, resulting in a gradual dominance of soil matrix flow and a corresponding increase in the relative concentration of solution over time.
Contrarily, the change in the relative concentration of solution over time at other soil depths within the acacia communities was not substantial. A portion of the in situ soil column outflow relative concentration was found to be zero, likely due to adsorption by soil particles. The remaining portion showed a slightly increasing trend over time, but the magnitude of this increase was modest.
4.2. Soil Nutrient Distribution in the Preferential Flow and Matrix Flow Zones
The vertical distribution of soil nutrients in acacia communities revealed a marked “surface enrichment” phenomenon [33,34], attributed to the decomposition of abundant surface litter, elevated soil microbial activity, and the robust degradation of vegetation litter, as well as to the inter-root symbiotic acquisition of nutrients by acacia.
The vertical distribution analysis of soil nutrients in acacia communities revealed that the values of soil organic carbon, organic matter, total nitrogen, total phosphorus, and other soil nutrient contents in the preferential flow areas were significantly higher than those in the substrate flow areas. Based on root observations in the preferential flow area and matrix flow area during our field sampling, this difference is most likely due to the higher root content observed in preferential flow areas compared to substrate flow areas. A higher root density leads to an increased release of organic compounds (root exudates) in the root zone, thereby affecting the availability of soil nutrients in the inter-root zone [34,35]. As a result, the preferential flow areas exhibit a higher concentration of soil nutrients compared to the matrix flow areas. Additionally, preferential water flow in the soil carries materials, including nutrients, along a well-defined path, leading to a buildup of nutrients in the preferential flow area, as the flow may become stagnant in some parts of the path.
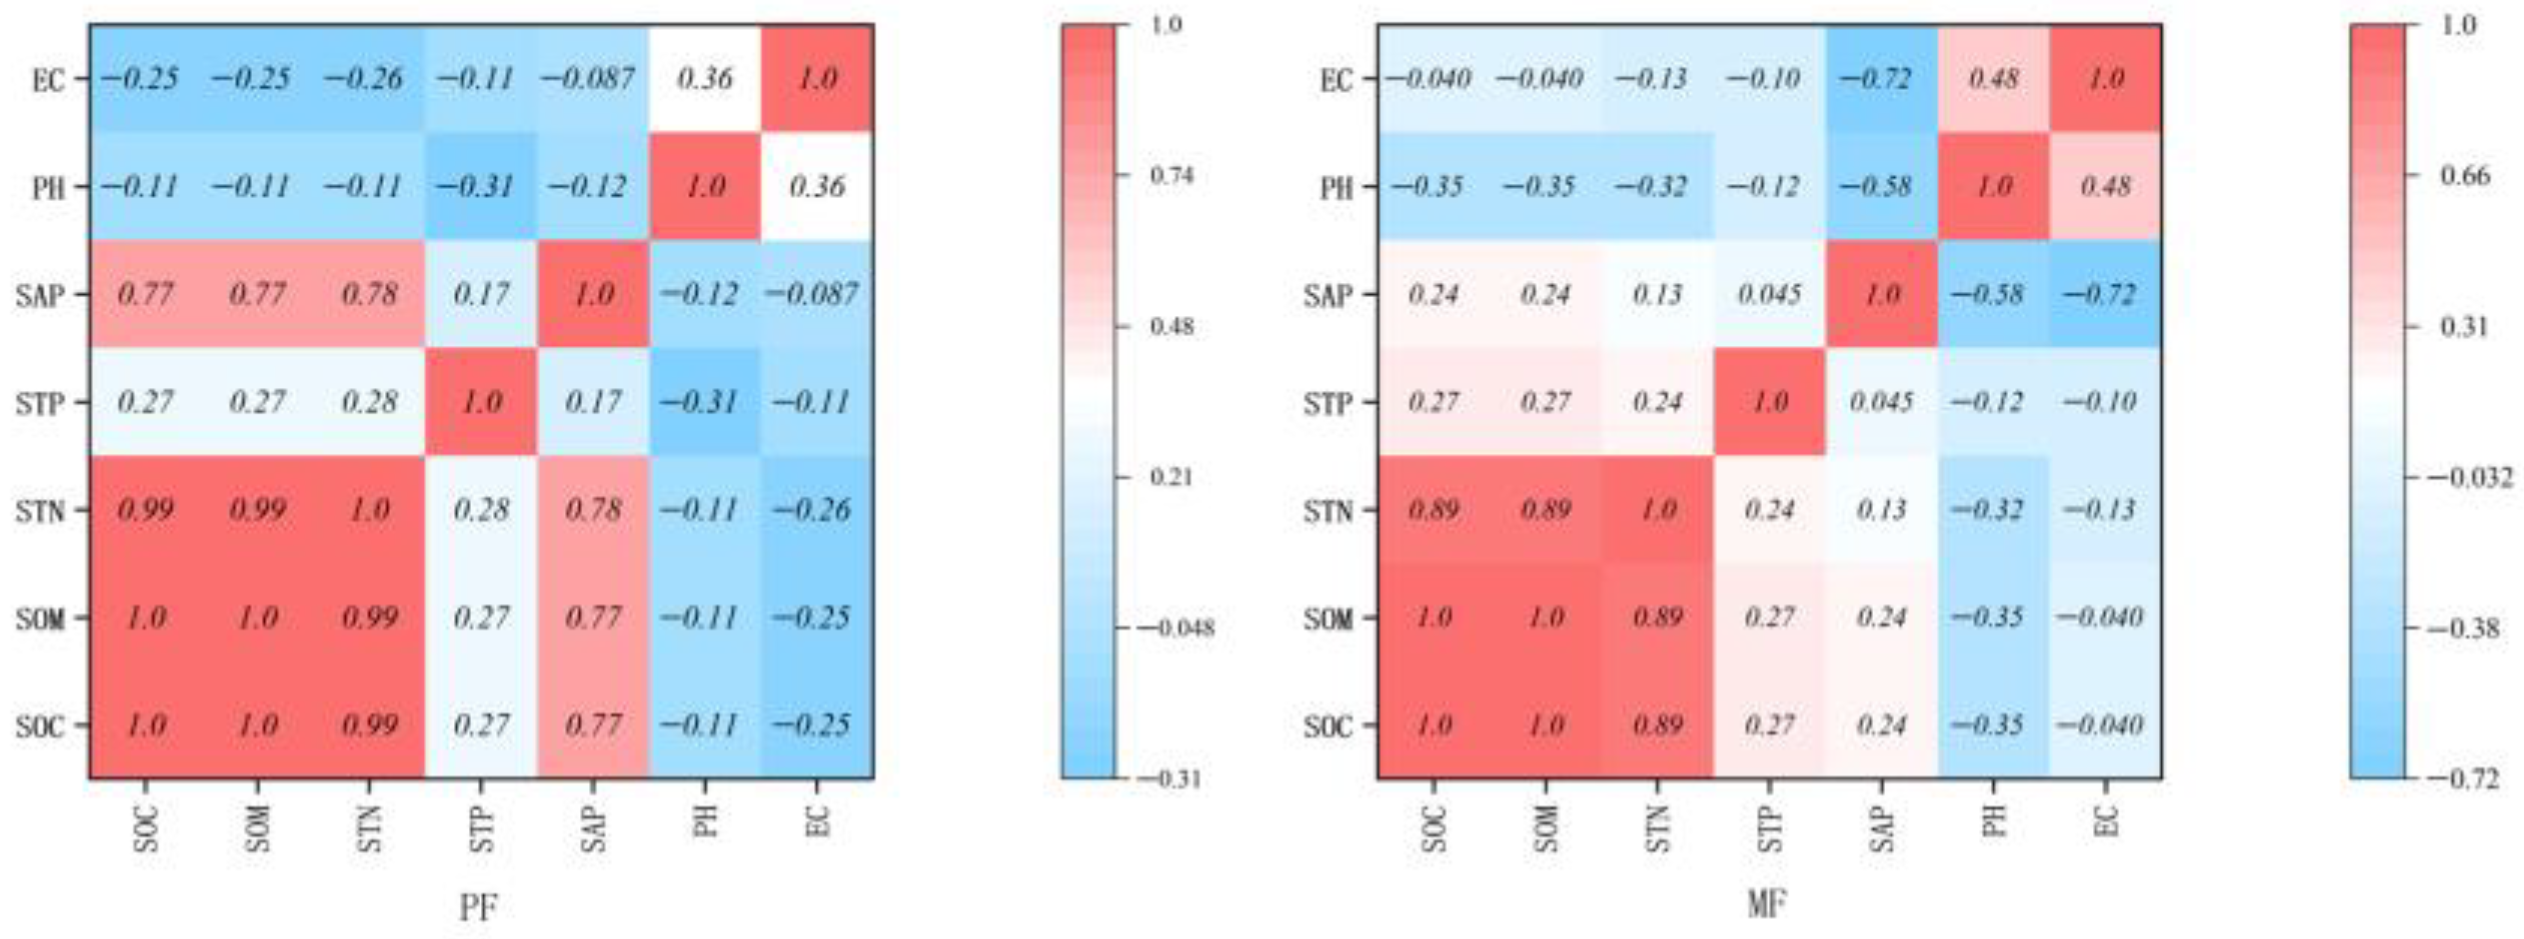
As shown in Figure 8, Soil organic carbon, organic matter, total nitrogen, total phosphorus, and available phosphorus were significantly positively correlated, and soil organic carbon and organic matter were extremely strongly correlated with soil total nitrogen, which indicates that the combined form of nitrogen and organic matter accounts for the vast majority of the soil. The correlation between soil pH, electrical conductivity and soil organic carbon, organic matter, total nitrogen, total phosphorus, and available phosphorus were negatively correlated. The correlations of soil organic carbon, organic matter, total nitrogen, total phosphorus, and available phosphorus were significantly higher in the preferential flow area than in the substrate flow area.
5. Conclusions
In the context of preferential flow transport of indoor solute penetration, the analysis of soil nutrient distribution and dynamic changes in acacia communities reveals significant heterogeneity. The highest stable outflow rate was observed in the soil layer at 0–10 cm depth, while the lowest was recorded in the soil layer at 40–60 cm depth. The relative concentration of the outflow from the soil at 0–10 cm depth displayed a fluctuating pattern, initially decreasing and then increasing over time.
In terms of soil nutrient content, higher concentrations of soil organic carbon, organic matter, total nitrogen, and available phosphorus were observed in the preferential flow area, compared to the matrix flow area. The variations in soil total phosphorus content were minimal with increasing soil depth, and no significant differences were observed between the preferential flow and substrate flow areas.
Additionally, positive correlations were observed between soil organic carbon, organic matter, total nitrogen, total phosphorus, and available phosphorus, while negative correlations were found between soil pH and conductivity with soil organic carbon, organic matter, total nitrogen, total phosphorus, and available phosphorus. A positive correlation was also noted between soil pH and conductivity, with a higher correlation in the preferential flow area than in the substrate flow area.
To address soil degradation in the Yellow River Delta, efforts can be made to improve soil nutrients through artificial supplementation with organic matter such as peat and biochar, optimization of irrigation methods, and promotion of preferential flow. This, in turn, will mitigate soil salinization and promote the restoration of wetlands, ultimately leading to the sustainable development of the wetland ecosystem.
Author Contributions
S.Z. analyzed the experimental data and write the manuscript, J.W. participated in this experiment and contributed to the paper outline, and M.Z. administrated the project. All authors have read and agreed to the published version of the manuscript.
Funding
This research was supported by the National Key R&D Program of China (2022YFF1301000).
Data Availability Statement
The data presented in this study are available on request from the corresponding author.
Conflicts of Interest
The authors have no conflict of interest.
References
- Yao, C.X.; Yuan, H.M.; Meng, X.J.; Li, S.Q. Natural factors for the loss and degradation of coastal wetlands in the Yellow River Delta. Marine Geol. Quat. Geol. 2011, 31, 43–50. [Google Scholar] [CrossRef]
- Cui, B.S.; Cai, Y.Z.; Xie, T.; Ning, Z.H.; Hua, Y.Y. Research progress and development trend of the ecological effect of wetland hydrological connectivity. J. Beijing Norm. Univ. 2016, 52, 738–746. [Google Scholar]
- Liu, L.; Wang, H.; Yang, Z.; Fan, Y.; Wu, X.; Hu, L.; Bi, N. Coarsening of sediments from the Huanghe (Yellow River) delta-coast and its environmental implications. Geomorphology 2022, 401, 108105. [Google Scholar] [CrossRef]
- Lu, C.; Zhao, C.; Liu, J.; Li, K.; Wang, B.; Chen, M. Increased salinity and groundwater levels lead to degradation of the Robinia Pseudoacacia forest in the Yellow River Delta. J. Forest. Res. 2022, 33, 1233–1245. [Google Scholar] [CrossRef]
- Yu, X.J.; Zhang, Z.S. Morphological characteristics and connectivity of tidal channels in the Yellow River Delta during seven periods since 1989. Wetl. Sci. 2018, 16, 517–523. [Google Scholar]
- Dekker, L.W.; Ritsema, C.J.; Wendroth, O.; Jarvis, N.; Oostindie, K.; Pohl, W.; Larsson, M.; Gaudet, J.P. Moisture distributions and wetting rates of soils at experimental fields in the Netherlands, France, Sweden and Germany. J. Hydrol. 1999, 215, 4–22. [Google Scholar] [CrossRef]
- Jarvis, N.J. A review of non-equilibrium water flow and solute transport in soil macropores: Principles, controlling factors and consequences for water quality. Eur. J. Soil Sci. 2007, 58, 523–546. [Google Scholar] [CrossRef]
- Hou, F.; Cheng, J.H.; Qi, S.L.; Yao, J.J.; Ruan, X.Z. Quantitative evaluation of priority flow characteristics and staining morphology of different woodland types in Chongqing. J. Southwest Forest Univ. 2021, 2, 107–117. [Google Scholar]
- Zhang, X.; Zhang, H.J.; Zhang, F.M.; Cheng, J.H.; Ruan, L.; Li, S.Y.; Tian, X.J.; Wei, H.W.; Xu, G.L. Influence of water content on priority flow in southwest China. J. Soil Water Conserv. 2014, 28, 1–7. [Google Scholar]
- Guo, L.L.; Zeng, Q.; Xu, Z.M.; Zhang, Y.W.; Yang, J.Q. Diversion characteristics of root soil in soil slopes of different vegetation communities in Makaka. Soil 2017, 49, 196–202. [Google Scholar]
- Qu, Z.Q.; Jia, L.Q.; Jin, H.Y.; Jiang, X.; Gao, J.H. Large pores and preferential water flow and their effects on the migration behavior of pollutants in the soil. Soil J. 1999, 3, 341–347. [Google Scholar]
- Cheng, J.X.; Cheng, J.H.; Zheng, X.; Zhang, Y.G. Characteristics of soil priority flow and influencing factors under different vegetation cover. J. Henan Agr. Univ. 2018, 52, 973–982. [Google Scholar]
- Yan, J.L.; Zhao, W.Z. Effect of long-term mechanical tillage compaction on preferential soil flow in oasis fields. J. Ecol. 2019, 38, 1376–1383. [Google Scholar]
- Chen, R.; Wang, Z.; Dhital, Y.P.; Zhang, X. A comparative evaluation of soil preferential flow of mulched drip irrigation cotton field in Xinjiang based on dyed image variability versus fractal characteristic parameter. Agr. Water Manag. 2022, 269, 107722. [Google Scholar] [CrossRef]
- Liu, Y.P.; Chen, C. Priority flow in soil unsaturated zones. Prog. Water Sci. 1996, 1, 85–89. [Google Scholar]
- Niu, J.Z. Priority Flow Study of Forest Ecosystems; Science Press: Beijing, China, 2013. [Google Scholar]
- Zhang, Y.H.; Niu, J.Z.; Du, X.Q.; Qiu, Y.C. Analysis of soil priority flow in peak National Forest Park. J. Soil Water Conserv. 2013, 27, 41–45. [Google Scholar]
- Grangeon, T.; Ceriani, V.; Evrard, O.; Grison, A.; Vandromme, R.; Gaillot, A.; Cerdan, O.; Salvador-Blanes, S. Quantifying hydro-sedimentary transfers in a lowland tile-drained agricultural catchment. Catena 2021, 198, 105033. [Google Scholar] [CrossRef]
- Xiao, P.W.; Xiao, B.H. Progress of soil column leaching experiment and its application in soil organic carbon migration. Earth Environ. 2021, 49, 106–114. [Google Scholar]
- Wang, Z.; Lei, G. Study on penetration effect of heavy metal migration in different soil types. Mater. Sci. Eng. 2018, 394, 052033. [Google Scholar] [CrossRef]
- Shangguan, Y.X.; Qin, X.P.; Zhao, D.; Zhao, L.; Wang, L.Q.; Hou, H.; Li, F.S. The migration and morphological transformation of soil. Environ. Sci. Res. 2015, 28, 1015–1024. [Google Scholar]
- Sun, L.; Zhang, H.J.; Cheng, J.H.; Wang, B.Y.; Wang, X. Preferential transport study of solutes in citrus soil. J. Soil Water Conserv. 2012, 26, 63–67. [Google Scholar]
- Wang, S.Y. Analysis of the change of soil physical characteristics in degraded wetlands in Sanjiang Plain. J. Soil Water Conserv. 2004, 18, 167–170. [Google Scholar]
- Mao, J.; Jing, L. Impact of Ecological Restoration of Taihu Lake Wetland on Eutrophic Factors in Soil. In Seminar on Soil and Groundwater Pollution and Remediation across the Taiwan Straits; Geological Society of China: Beijing, China, 2012. [Google Scholar]
- Jiao, H.J.; Lu, J.W. Study on soil structure and carbon and nitrogen characteristics in the natural restoration of degraded wetlands in Binhu area. Beijing Water Supply 2012, 4, 21–24. [Google Scholar]
- Huang, Y.J.; Zhang, Y.; Zhang, Y.L.; Jiang, B.; Yuan, W.A.; Zhu, J.R. Spatial variation of carbon and nitrogen in the sediment of Taihu Lake. Environ. Sci. Manag. 2015, 40, 140–145. [Google Scholar]
- Hua, R.; Xu, X.X. Research for suitable brilliant blue concentrations to trace soil water movement. Res. Soil Water Conserv. 2016, 23, 73–77. [Google Scholar]
- Vogt, D.J.; Tilley, J.P.; Edmonds, R.L. Soil and Plant Analysis for Forest Ecosystem Characterization; Walter de Gruyter GmbH & Co. KG: Berlin, Germany, 2015. [Google Scholar]
- Xiao, Z.X.; Zhu, W.L.; Niu, J.Z.; Shao, W.W.; Zhang, Y.S. Study on the preferential soil flow under different stands in peak National Forest Park. Hunan Agr. Sci. 2011, 17, 118–121. [Google Scholar]
- Gao, R.; Zhang, J.F.; Wu, J.Q. Research status and development trend of soil middle finger flow. J. Water Res. Water Eng. 2009, 20, 72–76. [Google Scholar]
- Li, H. Effects of medium characteristics on finger flow during soil water redistribution. Trans. Chin. Soc. Agr. Eng. 2010, 26, 65–70. [Google Scholar]
- Allaire, S.E.; Dadfar, H.; Denault, J.T.; van Bochove, E.; Charles, A.; Thériault, G. Development of a method for estimating the likelihood of finger flow and lateral flow in Canadian agricultural landscapes. J. Hydrol. 2011, 403, 261–277. [Google Scholar] [CrossRef]
- Yu, B.W.; Liu, G.H.; Liu, Q.S.; Feng, J.L.; Wang, X.P.; Han, H.Z.; Zhao, Z.H.; Yang, J. Soil nutrient effect of different reclaimed locust forests in loess hilly areas of western Shanxi. J. Soil Water Conserv. 2016, 30, 188–193. [Google Scholar]
- Wang, Y.H.; Peng, Z.D.; Li, Y. Soil nutrient and structure characteristics of different generations in shallow mountainous areas of western Henan. J. Beijing Forest. Univ. 2020, 3, 54–64. [Google Scholar]
- Li, J.M.; Zhu, Q.L.; Ma, J.; Gao, M.Y.; Wang, Y.P. Shallow fine root characteristics of the oak oak and locust mixed forest in the stony mountains of North China. J. Northwest Coll. Forest. 2018, 33, 37–42. [Google Scholar]
Figure 1.
Experiment area.

Figure 2.
Variation of outflow rate of Robinia Pseudoacacia communities with time.


Figure 3.
Changes in the relative concentration of a solution of different soil depths with time.

Figure 4.
Changes of soil nutrients properties ((a) means soil organic carbon, soil organic matter, (b) means total soil nitrogen, total soil phosphorus, (c) means soil available phosphorus) with soil depth.
Figure 4.
Changes of soil nutrients properties ((a) means soil organic carbon, soil organic matter, (b) means total soil nitrogen, total soil phosphorus, (c) means soil available phosphorus) with soil depth.

Figure 5.
Variation of soil nutrients with depth in preferential flow and matrix flow zones.

Figure 6.
Changes in soil bulk density (a) and soil porosity (b) with soil depth.

Figure 7.
Soil dye profile of Robinia Pseudoacacia community in the study site.

Figure 8.
Relation between soil properties in preferential flow area and matrix flow area.


Table 1.
Soil physical-chemical properties in Acacia Communities.
| Physicochemical Properties | Soil Depth | |||
|---|---|---|---|---|
| 0–10 cm | 10–20 cm | 20–40 cm | 40–60 cm | |
| Mass water content | 0.269 ± 0.046 | 0.226 ± 0.015 | 0.245 ± 0.007 | 0.215 ± 0.011 |
| Bulk density(g/cm3) | 0.912 ± 0.094 | 1.304 ± 0.052 | 1.384 ± 0.002 | 1.427 ± 0.177 |
| Total porosity/% | 0.568 ± 0.031 | 0.480 ± 0.014 | 0.489 ± 0.000 | 0.459 ± 0.040 |
| Capillary porosity/% | 0.508 ± 0.064 | 0.463 ± 0.004 | 0.478 ± 0.005 | 0.444 ± 0.021 |
| Maximum moisture capacity/% | 0.631 ± 0.097 | 0.369 ± 0.026 | 0.353 ± 0.000 | 0.326 ± 0.068 |
| Capillary moisture capacity/% | 0.492 ± 0.035 | 0.352 ± 0.026 | 0.344 ± 0.003 | 0.317 ± 0.067 |
| Minimum moisture capacity/% | 0.438 ± 0.037 | 0.335 ± 0.027 | 0.334 ± 0.002 | 0.311 ± 0.064 |
| Soil water storage/mm | 0.026 ± 0.002 | 0.031 ± 0.003 | 0.035 ± 0.001 | 0.032 ± 0.002 |
| Organic carbon/(g/kg) | 12.204 ± 5.374 | 2.929 ± 0.292 | 2.237 ± 0.729 | 1.561 ± 0.411 |
| Organic matter/(g/kg) | 21.039 ± 9.265 | 5.050 ± 0.503 | 3.857 ± 1.257 | 2.692 ± 0.709 |
| Total nitrogen/(g/kg) | 1.345 ± 0.631 | 0.358 ± 0.043 | 0.270 ± 0.094 | 0.183 ± 0.039 |
| Total phosphorus/(g/kg) | 0.614 ± 0.033 | 0.569 ± 0.055 | 0.538 ± 0.045 | 0.518 ± 0.038 |
| Available phosphorus/(mg/kg) | 3.927 ± 1.933 | 2.398 ± 1.031 | 1.792 ± 0.111 | 1.655 ± 0.231 |
| Conductivity/(μS/cm) | 114.2 ± 26.8 | 145.5 ± 111.3 | 209.1 ± 71.9 | 387.0 ± 125.4 |
| pH | 8.960 ± 0.053 | 9.063 ± 0.246 | 9.137 ± 0.170 | 8.983 ± 0.304 |
Table 2.
Content of soil nutrients in different areas.
| Soil Nutrient Indexes | Organic Carbon | Organic Matter | Total Nitrogen | Total Phosphorus | Available Phosphorus |
|---|---|---|---|---|---|
| Preferential flow area | 6.96 ± 6.08 * | 12.00 ± 10.49 * | 0.71 ± 0.61 * | 0.530 ± 0.038 | 3.430 ± 1.037 ** |
| Matrix flow area | 4.28 ± 2.44 * | 7.37 ± 4.2 * | 0.45 ± 0.27 * | 0.570 ± 0.030 | 2.60 ± 0.30 ** |
* Means p < 0.05, ** means p < 0.01.
Disclaimer/Publisher’s Note: The statements, opinions and data contained in all publications are solely those of the individual author(s) and contributor(s) and not of MDPI and/or the editor(s). MDPI and/or the editor(s) disclaim responsibility for any injury to people or property resulting from any ideas, methods, instructions or products referred to in the content. |
© 2023 by the authors. Licensee MDPI, Basel, Switzerland. This article is an open access article distributed under the terms and conditions of the Creative Commons Attribution (CC BY) license (https://creativecommons.org/licenses/by/4.0/).
Share and Cite
MDPI and ACS Style
Zhao, S.; Wang, J.; Zhang, M. Soil Nutrient Distribution and Preferential Flow Transport Patterns in Robinia Pseudoacacia Communities of Degraded Wetlands. Water 2023, 15, 1140. https://doi.org/10.3390/w15061140
AMA Style
Zhao S, Wang J, Zhang M. Soil Nutrient Distribution and Preferential Flow Transport Patterns in Robinia Pseudoacacia Communities of Degraded Wetlands. Water. 2023; 15(6):1140. https://doi.org/10.3390/w15061140
Chicago/Turabian StyleZhao, Shiqiang, Jingwen Wang, and Mingxiang Zhang. 2023. "Soil Nutrient Distribution and Preferential Flow Transport Patterns in Robinia Pseudoacacia Communities of Degraded Wetlands" Water 15, no. 6: 1140. https://doi.org/10.3390/w15061140
Note that from the first issue of 2016, this journal uses article numbers instead of page numbers. See further details here.