Article

Assessing Plastic Waste Discharges into the Sea in Indonesia: An Integrated High-Resolution Modeling Approach That Accounts for Hydrology and Local Waste Handling Practices

1
Deltares, Boussinesqweg 1, 2629 HV Delft, The Netherlands
2
Deltares Indonesia, Jl. Iskandarsyah Raya Kavling 12-14, Jakarta 12160, Indonesia
3
Royal HaskoningDHV, Jl. R.A. Kartini 26, Jakarta 12430, Indonesia
4
Environment, Natural Resources and Blue Economy, The World Bank, 1818 H Street, Washington, DC 20433, USA
*
Author to whom correspondence should be addressed.
Water 2023, 15(6), 1143; https://doi.org/10.3390/w15061143
Submission received: 13 January 2023 / Revised: 21 February 2023 / Accepted: 27 February 2023 / Published: 15 March 2023
(This article belongs to the Section Water Quality and Contamination)

Abstract

:
Plastic litter is increasingly accumulating in the marine environment, with rivers considered key pathways for entry. Current estimations of plastic input into the sea from land-based sources are limited in accounting for the mobilization and transport of plastic generated in the whole catchment area or in considering local variations in waste handling practices. Here, we show that, with an integrated discharge modeling approach (based on actual rainfall and local estimates for exposed mismanaged plastic waste), more realistic temporal estimates of plastic discharges into the sea can be constructed. Applying this approach to Indonesia enabled us to estimate the total national inputs of plastic waste into the sea from rivers and coasts and how these vary with rainfall, while providing insight into those catchments, local communities, and waste handling practices that most contribute to plastic waste leakages. We found that the plastic fluxes vary significantly in both the short and long term and that the total amount of plastic waste discharged during wet years may be twice as much as during dry years. Furthermore, river size, catchment population density, local waste management, and proximity of point sources influence river plastic waste loads. Such an integrated assessment can be very effective in helping to prioritize where interventions are most needed and, in combination with frequent monitoring, can provide evidence of the impact that upstream measures have on preventing plastic inputs into the sea.

1. Introduction

Marine plastic pollution is attracting broad societal concern and has been the subject of numerous publications, particularly over the last decade (e.g., [1,2]). As global political momentum to address this problem increases, attention has turned to where plastic is coming from, notably to quantifying mismanaged plastic waste (MPW) inputs from land-based sources [3] and rivers as major pathways of plastic inputs into the sea [4,5,6,7,8].
While it is acknowledged that hydrology can play an important role in mobilizing MPW on land and transporting mobilized MPW through waterways into the sea [9], few studies account for hydrological processes (e.g., [5]) or simply assume a maximum distance from the coast (e.g., [3]). Moreover, the studies that account for hydrological processes tend to have limited temporal variability of hydrological conditions and often only consider average climatological conditions. Therefore, understanding the hydrological variability of MPW discharges into the marine environment remains limited.
In addition, most studies that link MPW generation with MPW leakages into the marine environment are based on waste management data at the country level only. Waste management data are often only publicly available at the country level and, where data at the local level are available, they are often unreliable or incomplete. This may be particularly significant in communities with low (formal or informal) waste collection rates and poor waste disposal practices that include terrestrial dumping (fly-tipping), open burning, or direct disposal in waterways [10], such as in Indonesia. Furthermore, it is well-known that the generation of MPW varies significantly even within a country. By consistently relying on country-level waste management data, most existing studies do not capture local waste handling specificities (cultural preferences, e.g., disposal of waste directly into water) that are most likely to lead to spatially-variable plastic leakages. Therefore, these studies tend to exhibit significant uncertainty levels, making it impractical to inform sub-national policy interventions and priority measures to effectively address the urgent marine plastic pollution problem [11]. In order to improve the accuracy and to reduce the uncertainty of model estimations, it is vital to enhance the resolution of both the spatial distribution of waste generation and management and the temporal variations in hydrology [8,12,13].
Our study aimed at producing detailed temporal estimates of discharges of plastic waste into the sea from land-based sources; and enhancing the understanding of key leakage sources and pathways to inform policies at the national and local level in Indonesia. Our assessment is based on a realistic high-resolution representation of the hydrology-driven mobilization of land-generated MPW, its transport in waterways and discharge into the sea, by integrating demographic data, local waste handling practices, and modeled catchment hydrology. This approach combines anthropogenic and environmental processes, incorporating detailed solid waste estimates with temporally and spatially varying hydrological factors, including physical processes affecting plastic mobilization and transport. The results provide insights into local practices and communities within a river catchment contributing to plastic waste leakages into individual waterways and from individual rivers into the sea, as well as a country-wide estimation of total plastic waste discharges into the sea. The approach captures daily, seasonal, and interannual variability and pinpoints plastic waste leakage hotspots in the terrestrial, riverine, and marine environments. Our study can inform where and which interventions are most needed and provides a baseline against which the impact of future measures can be assessed.

2. Materials and Methods

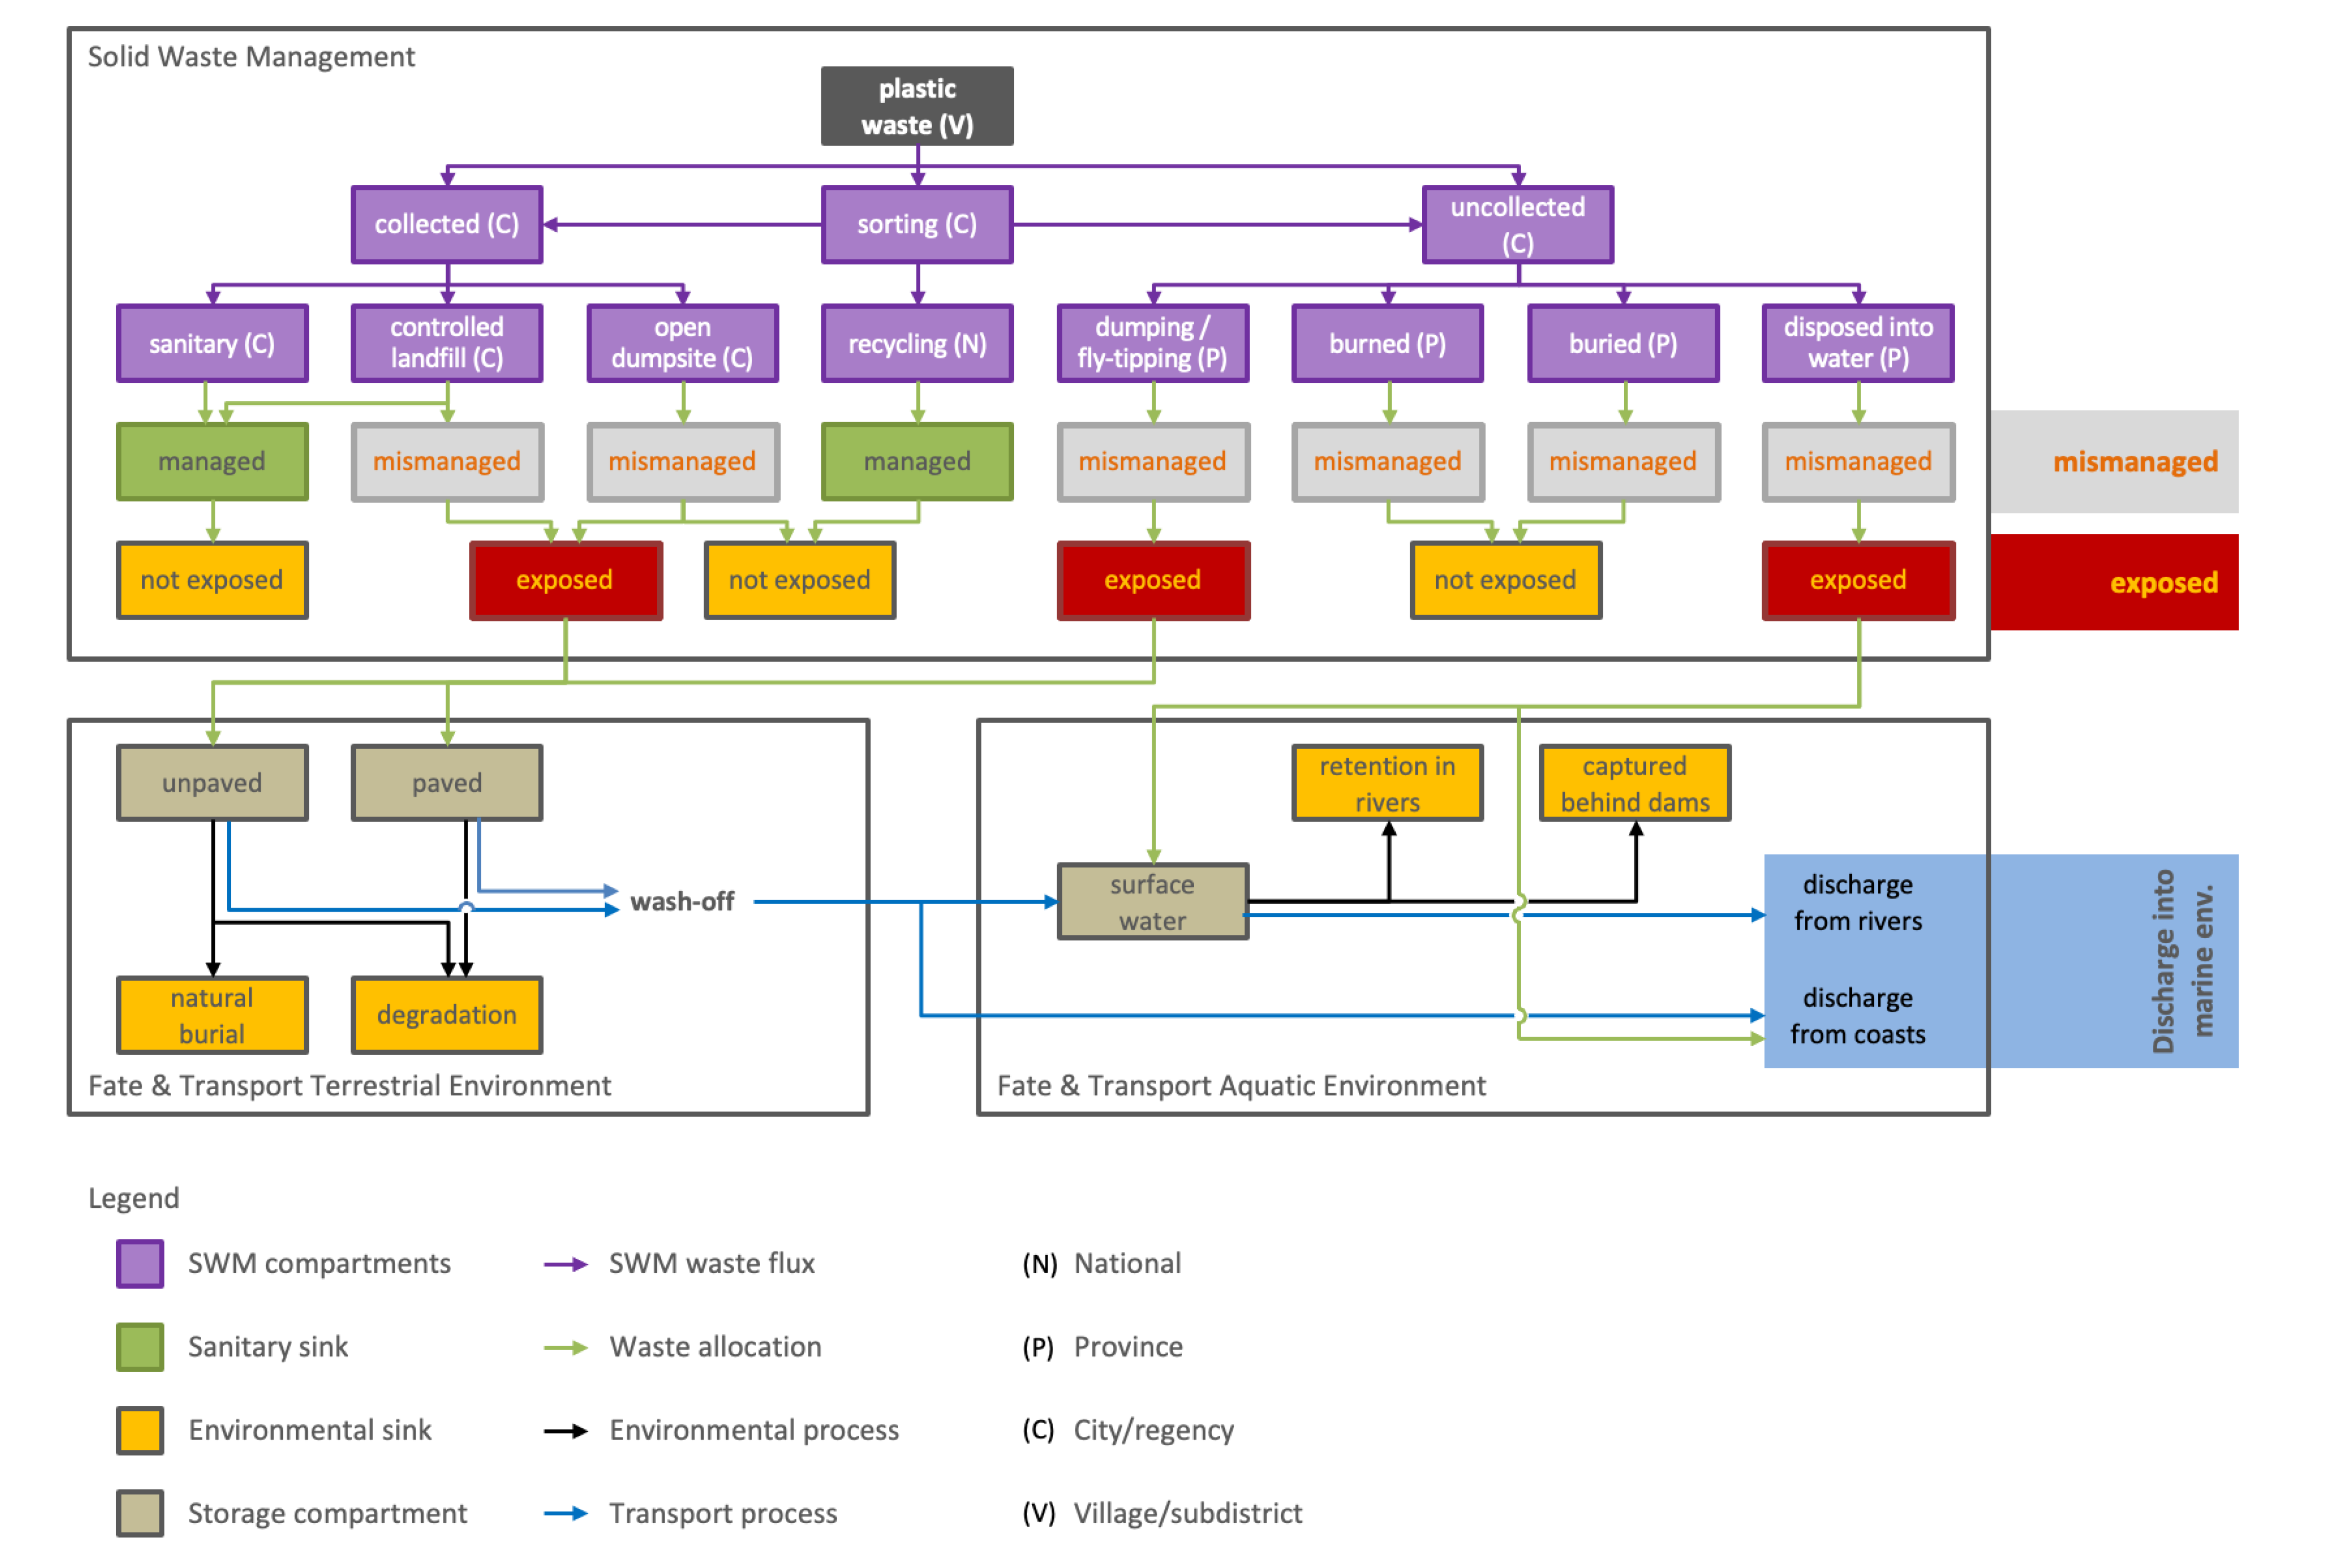
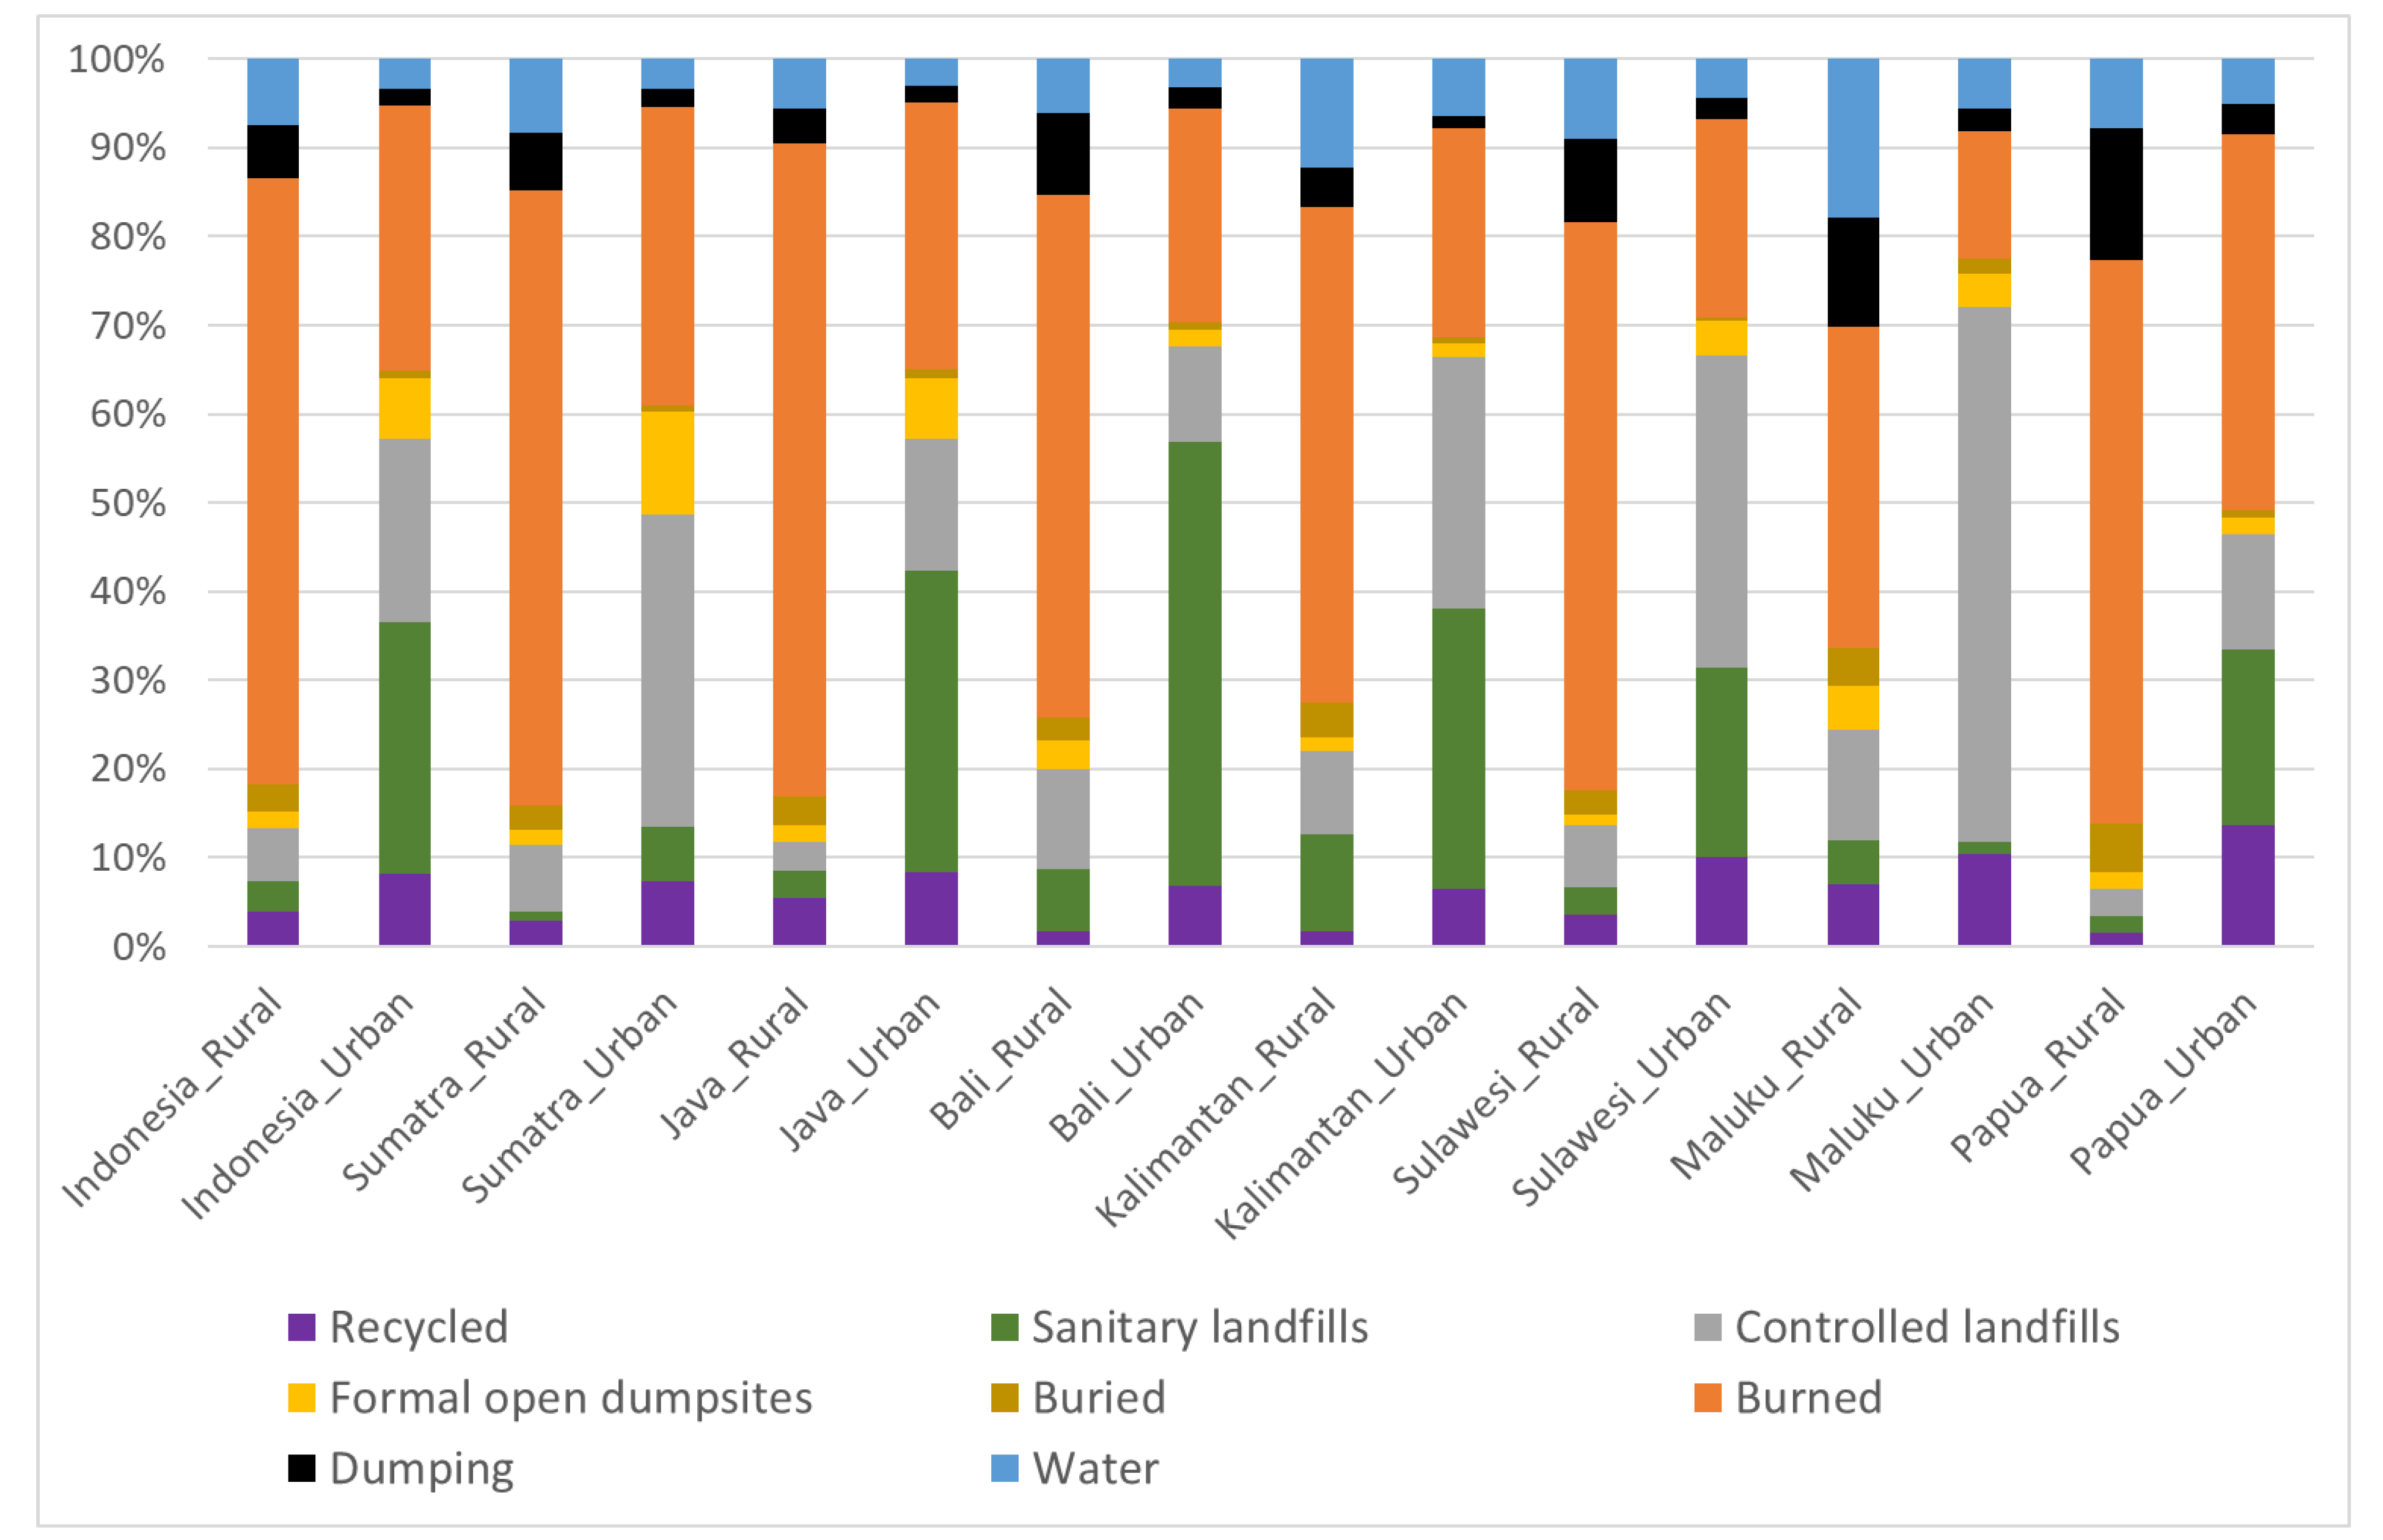
2.1. General Approach and Definitions

Our study focused on municipal solid waste (MSW) macroplastics (plastic items, e.g., plastic bottles, sachets, bags, containers, etc.). In Indonesia, MSW includes household and non-household waste, which can include some non-hazardous industrial waste collected as non-household waste. We have considered as “mismanaged” plastic waste (Figure 1.) the “exposed” fraction of plastic waste disposed of in controlled landfills (where there is some containment), the fraction of collected waste disposed of in formal open dumpsites, as well as all uncollected plastic waste. Only fractions recycled or disposed of in sanitary landfills are considered fully “managed” and the “not exposed” fraction at controlled landfills is considered partially “managed”.
We applied a set of analyses, beginning with a material flow analysis (MFA) to determine the amount of MPW that may or will end up in waterways; hydrological modeling to estimate the mobilization of the exposed MPW on land to surface waters, taking into account topography, soil-type, land use, and spatially and temporally variable meteorological data; modeling plastic waste transport and fate within waterways and eventual discharge from rivers into the sea (Figure 1).

2.2. Estimating Generated Plastic Waste That Is “Exposed” to Hydrology

Population and household survey (HANSOS 2017) data were obtained from the Indonesian Statistics Bureau (BPS); waste composition, solid waste management, and infrastructure data were obtained from solid waste master plans, the regional policy and strategy on waste management, the Ministry of Environment and Forestry, and the Ministry of Public Works and Housing (PUPR). Specifications are detailed in Supplementary Material, File S1. Local data were used whenever available, otherwise provincial, national, or, lastly, global data were used. MFA of plastic waste was performed for each of Indonesia’s 514 regencies/cities (kabupaten/kota). Estimates of solid waste generation (SWG) at village/subdistrict levels (desa/kelurahan) were used based on population data (using the 2010 BPS census and corrected for population growth (BPS, 2019) and village status (urban/rural (BPS, 2019)); SWG per capita, available for 257 regencies/cities (corresponding to 50% of the country); waste composition, available for 232 regencies/cities. A normal distribution (excluding 10% higher and lower outliers) was assumed for these last two parameters and average values used for regencies/cities without data. Formal collection rates were available for all regencies/cities in Indonesia, either through disposal site design capacities or volumes received at the facility gate; estimates were corrected if higher than reported from national household surveys. Within a regency/city, individual urban and rural villages/subdistrict collection rates were estimated, assuming that waste is more likely to be collected within an urban environment. Informal collection by waste pickers within residential areas was based on the assumptions made for four city archetypes defined in a previous study [14] and extrapolated to the regency/city level, using a recovery factor of 67%. Data on waste handling practices were available at the provincial level only (distinguishing urban/rural households) (derived from the HANSOS dataset, BPS, 2017) and were used to determine uncollected plastic waste destinations: (1) disposal in water; (2) dumping/fly-tipping; (3) burning; (4) burying. For each province, an estimate was made for a normal distribution (mean and standard deviation derived from the HANSOS dataset) for each of these four handling practices at households in both urban and rural settings. Formally collected solid waste comprises waste delivered to recycling facilities (TPS3R), waste banks, and final disposal sites (TPA). Indonesia classifies three final disposal types based on operational standards: sanitary landfill, controlled landfill, and formal open dumpsites. For each destination, we attributed an exposure rate (i.e., indicating the likelihood of MPW being subject to mobilization by rainfall run-off or wind-blown and consequently leaked from these point sources). Since no reliable leakage rates are available in the scientific literature, a range of exposure rates was defined based on expert opinion and reflected upon with Indonesian government officials. The combined effect of wind (e.g., on lighter plastics such as bags and sachets) and hydrological forces that may mobilize during a rainfall event part of, but not all, plastic waste disposed of in uncontained disposal sites (open dump sites and controlled landfills) are covered by these leakage rates. As a result, we adopted an overall exposure factor of 2–5% for controlled landfills (corresponding to approximately half of the lighter fraction of plastics) and 5–20% for plastic waste disposed of in formal open dumpsites. These factors are based on the following observations and assumptions: (i) the lighter fraction of plastics (e.g., bags and sachets) cover approximately 40–60% of the total plastic waste mass; (ii) 50–90% of waste is contained in garbage bags or covered by other waste; (iii) in controlled landfills, up to 90% of mobilized plastic waste may be prevented from leaving the site by installed containment measures (e.g., fences). We have assumed that all uncollected plastic waste dumped on land or directly discarded in water is exposed. In contrast, burial or burning of uncollected plastic waste makes it unavailable for mobilization by hydrology (summary in Supplementary Material, File S2). These were considered as diffuse sources assuming a uniform distribution within the administrative area while respecting the specific environment destination (land/waterways) resulting from the waste handling practices. A Monte Carlo analysis was performed to produce a range of SWM conditions: low (10%)–mid (50%)–high (90%) for all output parameters at the village level, including differentiating between urban/rural villages for diffuse and point sources.

2.3. Modeling the Fate of MPW in the Terrestrial and Aquatic Environments

The lower model boxes represent the exposed MPW environmental modeling in Figure 1. The modeling aimed to quantitatively assess the connectivity between the spatially variable generation of exposed MPW and the receiving marine environment. The study area was represented by a fine rectangular grid with a mesh size of 560 m. As relevant processes depend strongly on meteorology and hydrology [8], time-dependent modeling relies on hydrological models covering the study area [15]. At the catchment scale, the (macro)plastics’ fate in riverine environments remains poorly understood, while there are insufficient data to accurately parameterize and validate transport models [16]. A very basic parameterization was selected and overparameterization was avoided as much as possible. Local field data were used for validation.
MPW leakages, as discussed above, were assumed constant. Accumulating exposed MPW in the terrestrial environment is washed off by rain events. Wash-off is assumed to start at a lower threshold for simulated run-off intensity (tlo; mm d−1) and complete at a higher threshold (thi; mm d−1). As more run-off is generated on paved than on unpaved surfaces, wash-off is more frequent from paved surfaces. In between rain events, retention processes reduce the amount of accumulated MPW. Terrestrial retention was parameterized by a first-order process (rt; d−1). Retention includes “degradation” (processes that reduce MPW mass or cause fragmentation into microplastics). Retention also includes “burial”, soil storage, and vegetation trapping. Degradation by radiation and mechanical forces is assumed to be higher on paved surfaces than on unpaved surfaces. Burial is restricted to unpaved areas. Hence, rt is different on paved and unpaved surfaces, respectively.
In the riverine environment, MPW is transported downstream, while a fraction is retained due to weight loss and fragmentation, trapping in riparian vegetation and aquatic sediments of low-flow zones [17,18,19,20]. To adequately represent such retention processes without complete process understanding [16], lessons learned from nutrient pollution assessments were used [21,22,23]. Aquatic retention was parameterized by a first-order process assumed to take place with preference at the water-sediment interface (ra = ka/H, with aquatic retention parameter ka (m d−1) and water depth H (m)). Full retention of the local plastic flux was assumed at all larger dams [5]. Dam locations were obtained from PUPR.
The terrestrial retention rate rt (d−1) on paved and unpaved surfaces, respectively, and the aquatic retention parameter ka (m d−1) are listed in Supplementary Material, File S3. Despite the complexity in validating these parameters independently, they are required to represent the fate of MPW released in the terrestrial and aquatic environment, respectively, and to reflect significant differences in land use.
The modeling was performed using the D-Emissions software for terrestrial pathways and processes and D-Water Quality for riverine transport and processes.

2.4. Accounting for Variability in National Scale Estimates

To adequately capture the high variability in both SWM data and hydrological conditions, the estimated range of local MPW (10th percentile, 50th percentile, and 90th percentile following the uncertainties and ranges of SWM data) was combined with the hydrological variability in a four-year period time series (2013–2016) of rainfall conditions. As a result, a range of national plastic waste discharges was defined by the minimum 365-day discharge for the low SWM scenario; the median 365-day discharge for the mid-SWM scenario; the maximum 365-day discharge for the high-SWM scenario.

2.5. Field Data for Initial Validation of the Model

For model validation, sampling, and analysis of the composition of waste removed from several trash racks (i.e., structures to retain river-borne litter) in Jakarta were conducted during the dry (September 2019) and wet (March 2020) seasons. Other field datasets on volumes of waste removed from the Manggarai trash rack in the Ciliwung River (provided by the Municipal Environment Agency, DLH) and waste observed at the Bekasi River mouth [24] were used.

3. Results

The modeling results provide a detailed estimation of plastic waste generation, hydrology-driven mobilization, and discharge of plastic waste into the sea for the whole of Indonesia throughout a typical year.

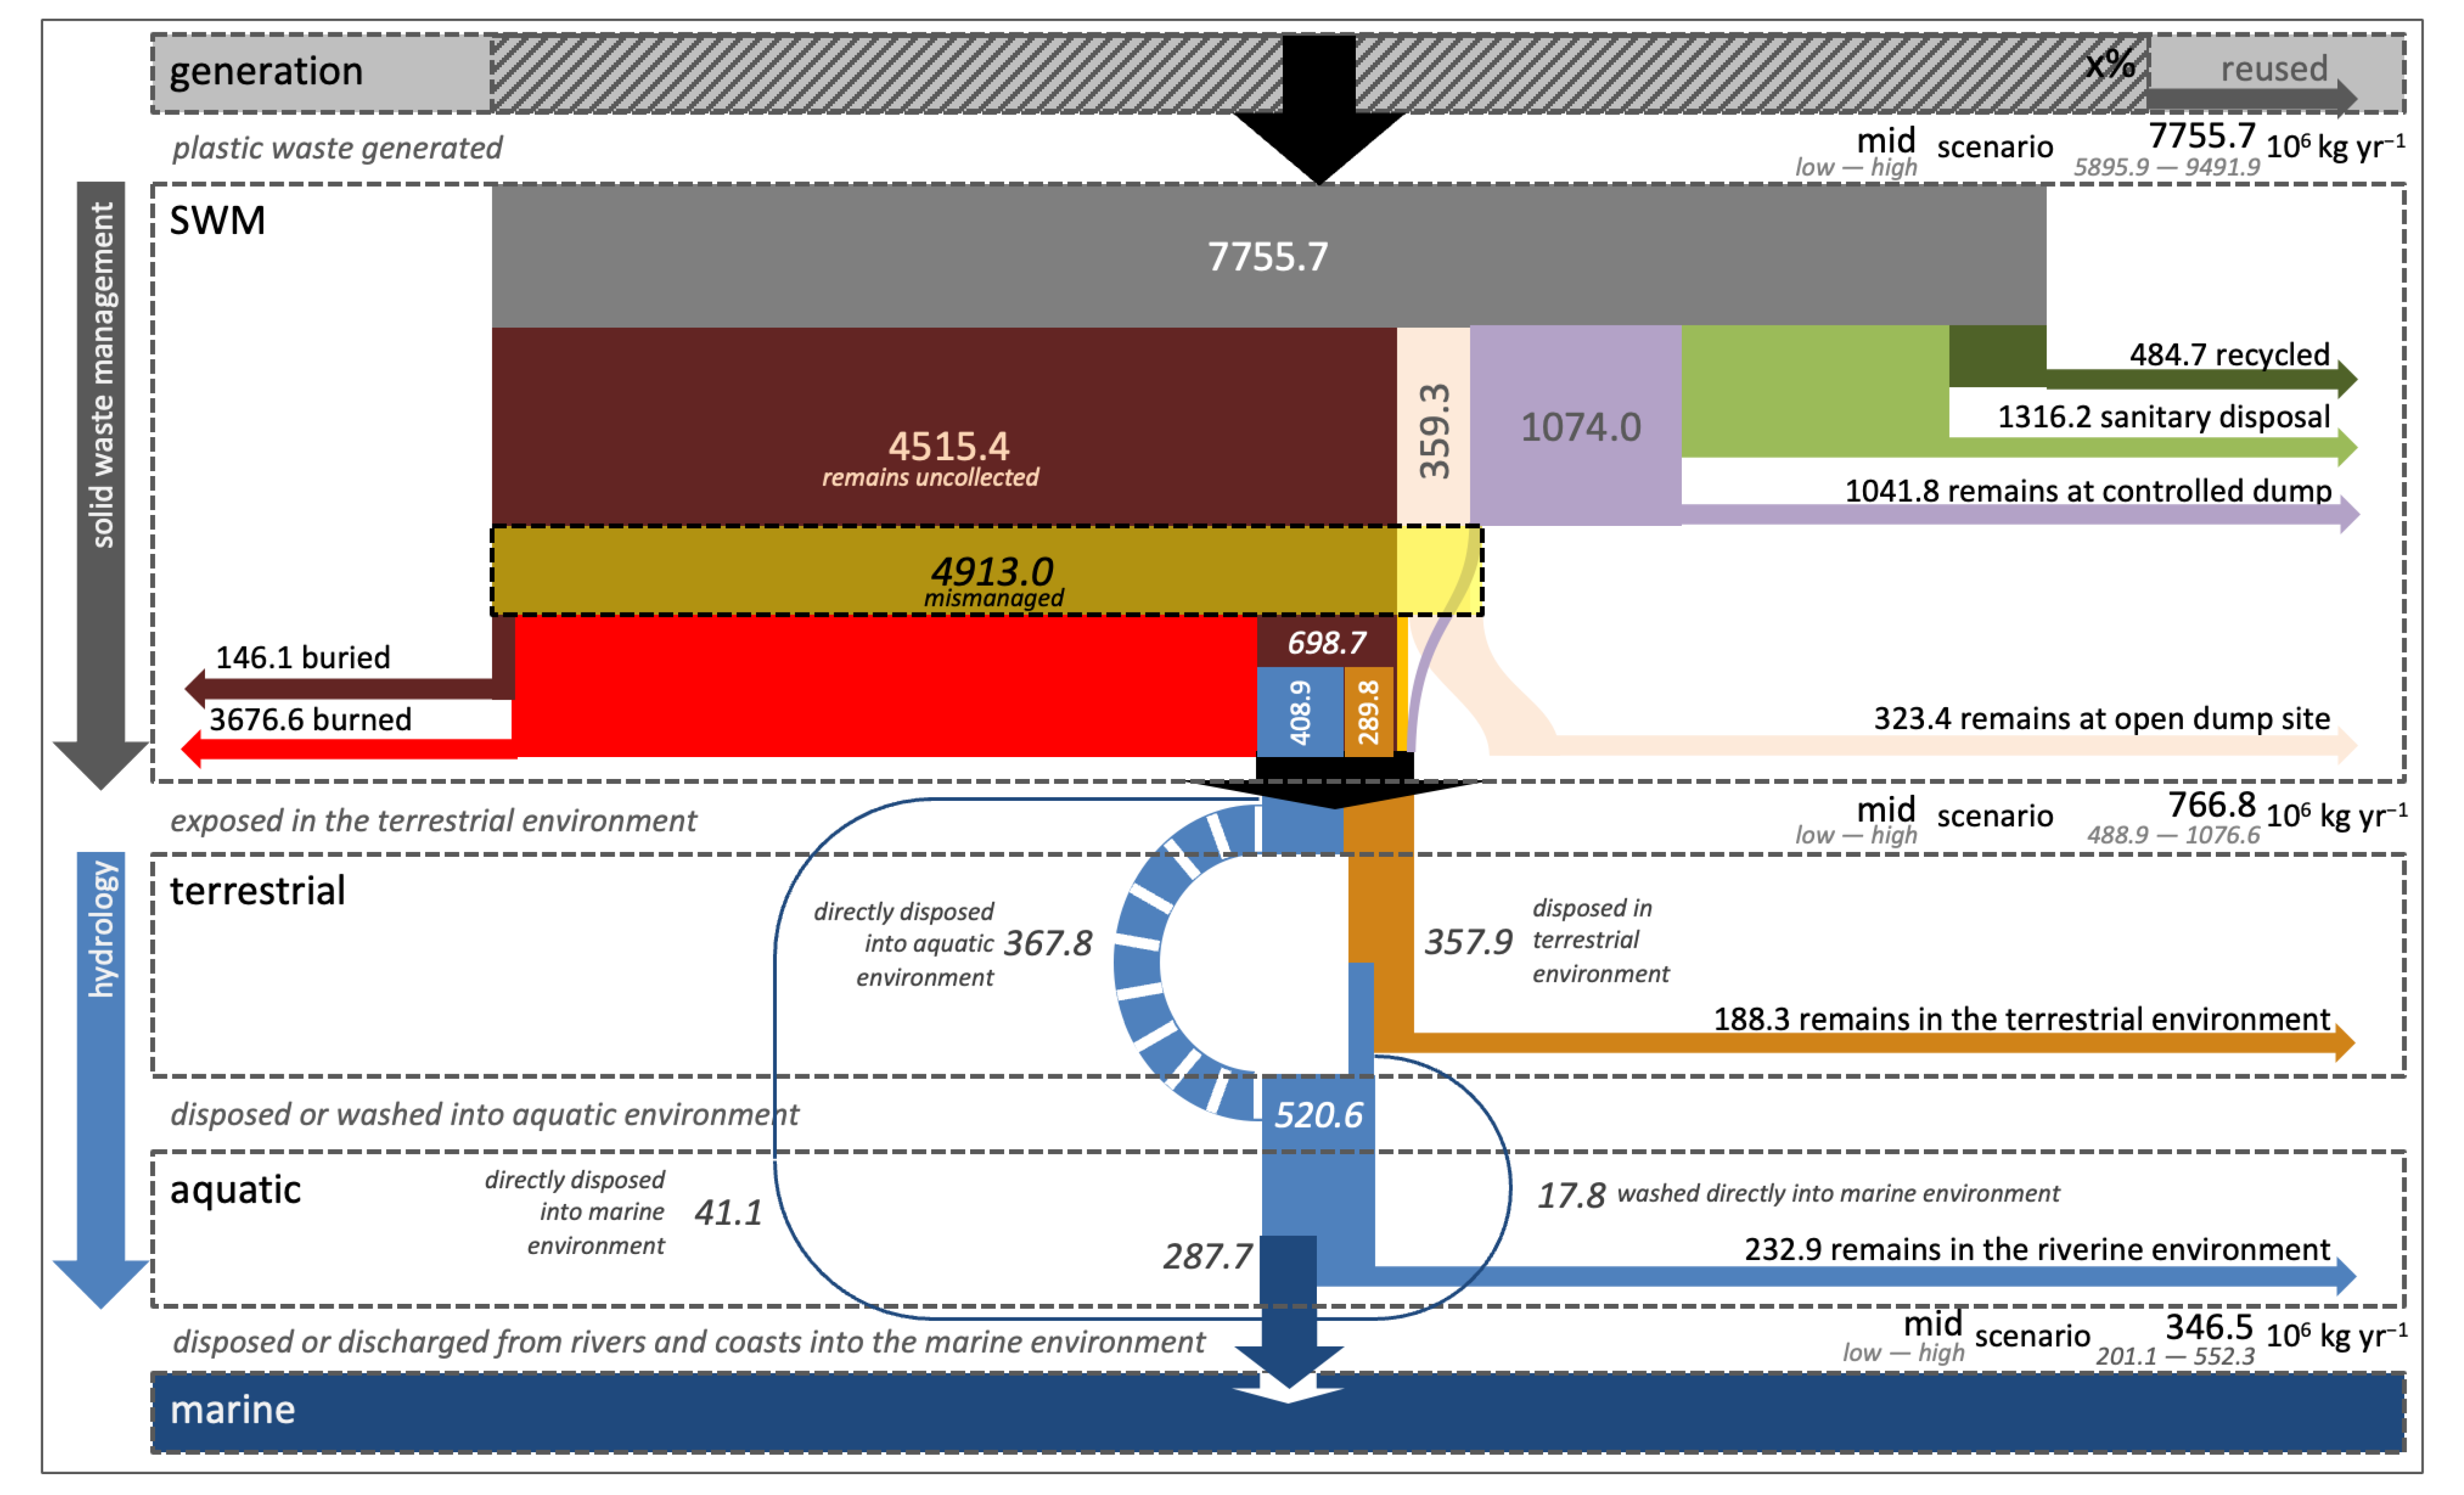
3.1. National Estimates of Plastic Waste Discharged from Land-Based Sources

The results at the national level are summarized in Figure 2. Our study indicates that Indonesia generates 7.76 × 10⁹ kg yr−1 (range 5.90–9.49) of plastic waste annually, with rural communities generating almost as much plastic waste as urban populations. Of the total plastic waste generated (PWG), 4.52 × 10⁹ kg yr−1 (range 3.02–5.91) remains uncollected and this largely contributes to the total generation of 4.91 × 10⁹ kg yr−1 (range 3.33–6.39) of MPW estimated for the whole country. Mismanagement of waste is particularly evident in rural areas, where 85% of the total PWG (mid-point estimate 3.01 × 10⁹ kg yr−1) is not collected (see Supplementary Material, File S4 for details on rural and urban areas). MPW can reach the aquatic environment through direct disposal into water (national midpoint of 408.9 × 10⁶ kg yr−1 directly discarded in waterways) or by leakages from waste disposed of in uncontained formal disposal sites (combined national midpoint of 68.1 × 10⁶ kg yr−1) or illegal dumping on land (national midpoint of 289.8 × 10⁶ kg yr−1).
In total, it has been estimated that 346.5 × 10⁶ kg yr−1 (range 201.1–552.3) of plastic waste is discharged into the sea from land-based sources in Indonesia. These are conservative estimations of the total plastic input as we did not consider microplastics or other plastic waste not accounted for under MSW data.
Despite the vast amounts of PWG in Indonesia, our simulations indicate that only 8–11% is exposed to hydrology, which is primarily attributed to the strong preference by households to eliminate uncollected waste by burning it. We estimate that 4.5% of the total PWG ends up in the marine environment and that a significant amount of the MPW that enters waterways is retained within the freshwater systems or by artificial structures, such as dams. In addition, in rivers where “trash racks” and clean-up operations are deployed (such as in DKI Jakarta), the amount of MPW discharged downstream could be lower than estimated since retention in such structures or urban drainage systems was not accounted for. Factoring this retention will require detailed long-term monitoring of the quantities of plastic waste removed from waterways.

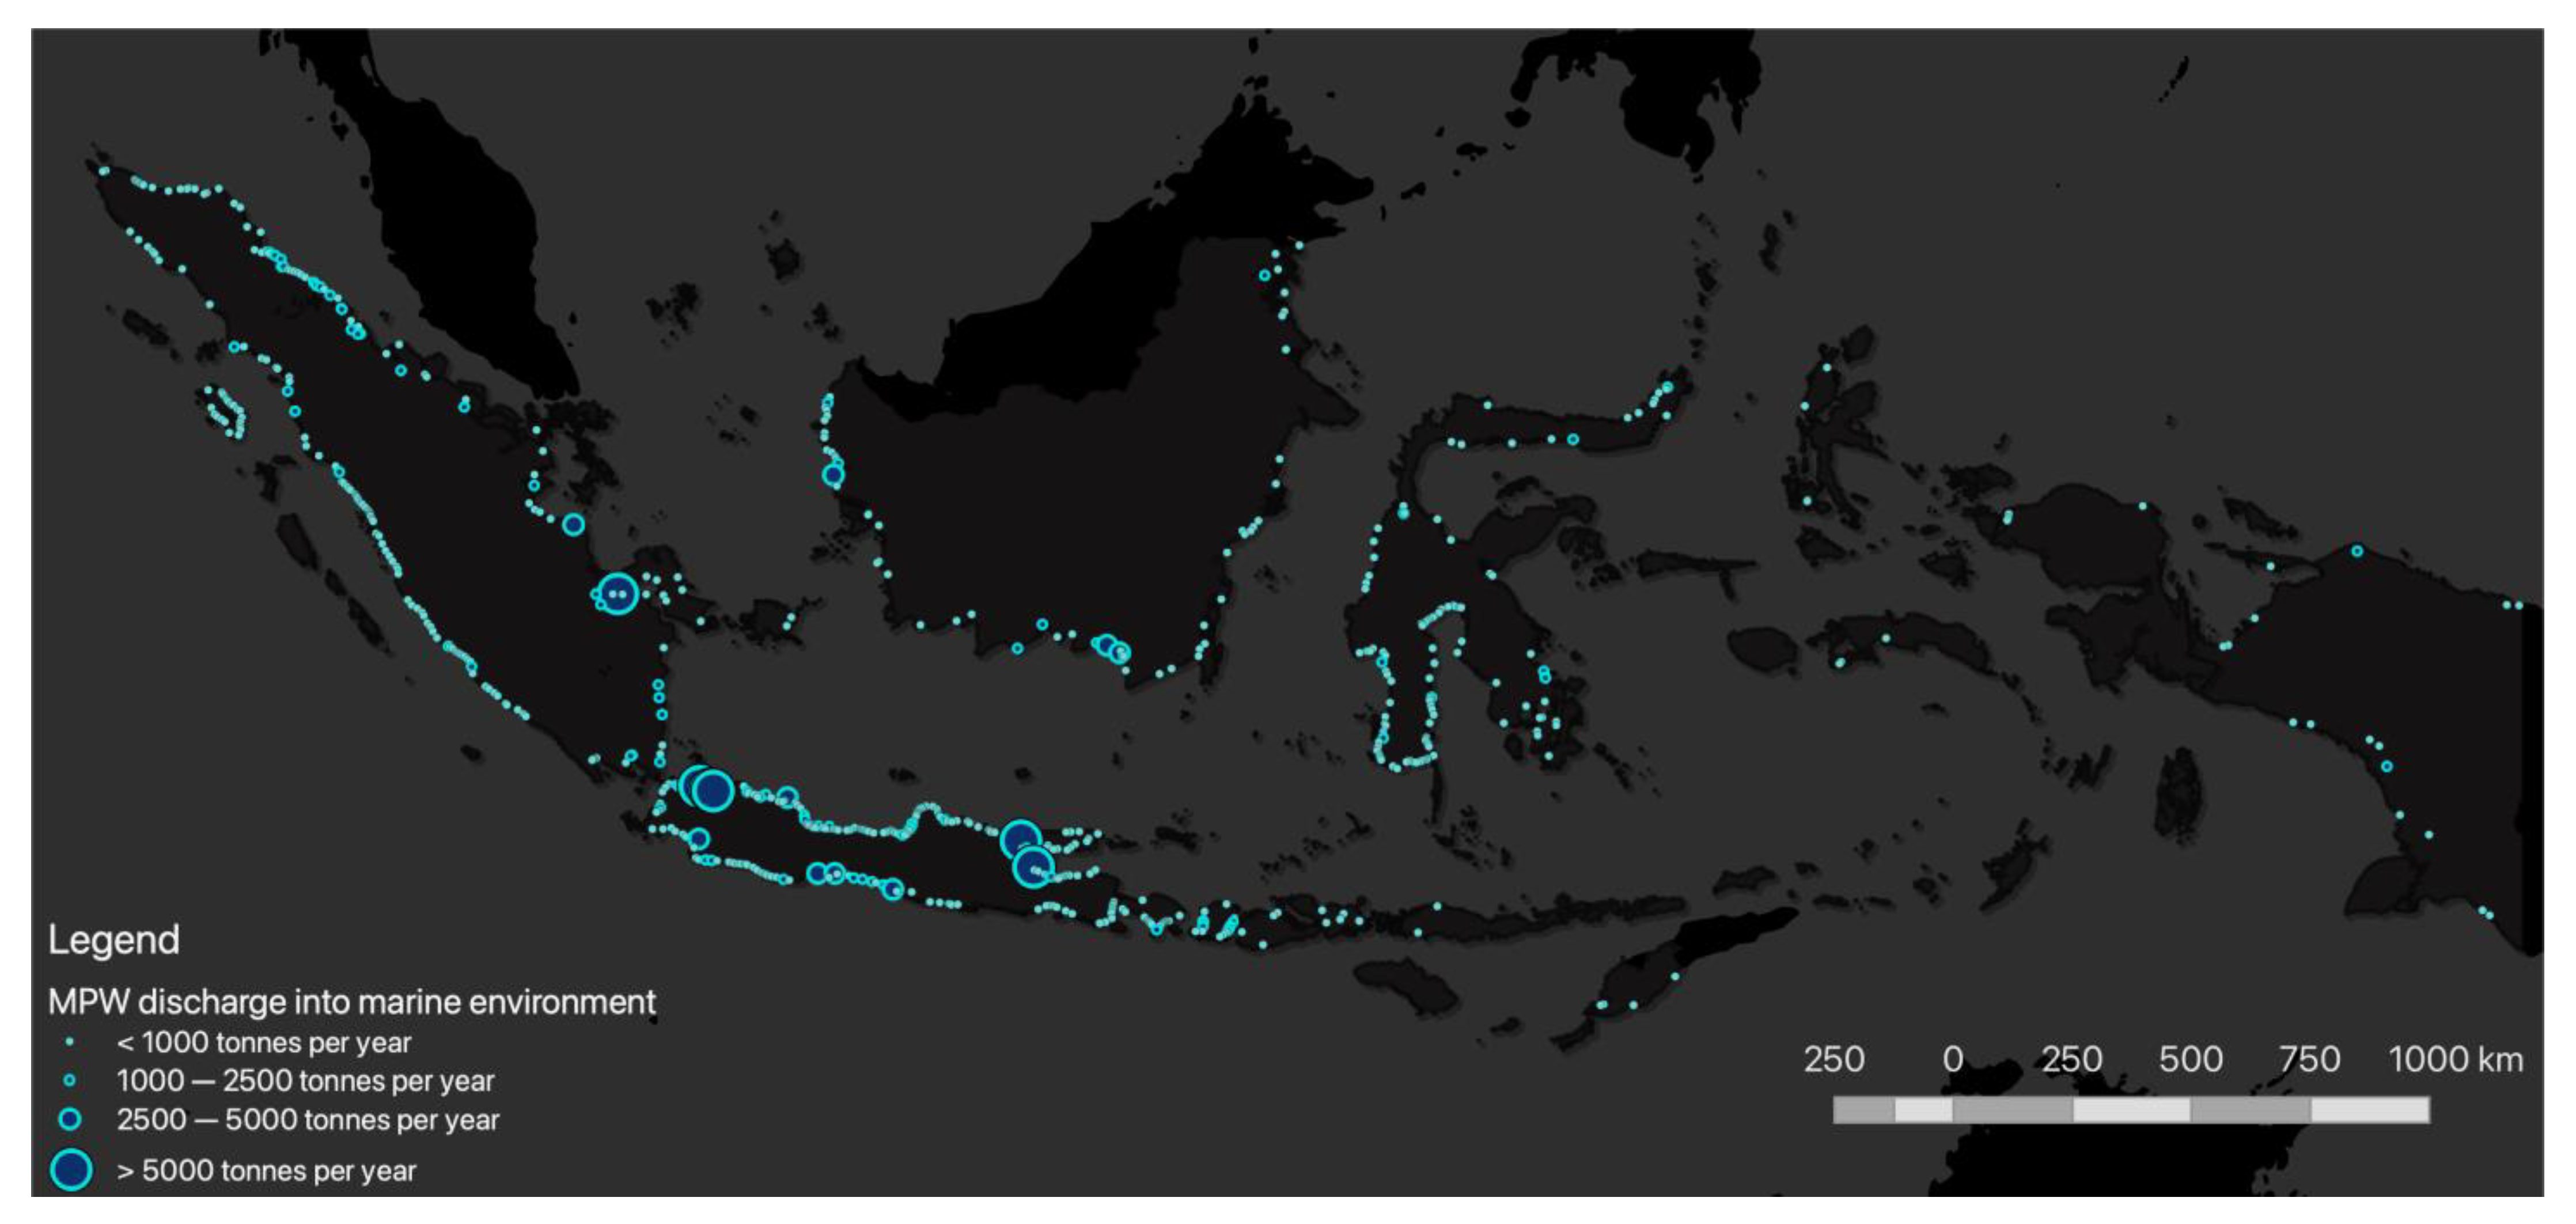
3.2. Spatially Explicit Estimate of Plastic Waste “Exposed” to Hydrology

By modeling the material flow at the village level and quantifying the main leakage pathways, we produced a spatial distribution of MSW plastics generated, mismanaged, and exposed to hydrological forces, which is more detailed and representative than previous studies. Differently from those, which use MPW as a function of the population only, we have accounted for distinct location-specific waste handling practices and levels of containment of formal disposal, all of which can lead to different rates of plastic leakage into the environment.
The modeling results reveal that the contribution of rivers as pathways of plastic waste into the sea is, at the national level, considerably more significant than the direct wash-off from coastal areas, with rivers contributing over 80% of the total annual discharges (Supplementary Material, File S5). As depicted in Figure 3, two-thirds of the total plastic discharges originate from the most populated islands of Java (129.3 × 10⁶ kg yr−1) and Sumatra (99.1 × 10⁶ kg yr−1). Approximately 45% of the discharges from Java, where most urban areas are located, originate from urban populations, whilst 55% have a rural origin. In Sumatra, Bali, and Kalimantan, 70–75% of the plastics discharges originate from rural sources and in East Indonesia (Sulawesi, Maluku, and Papua) these can be as high as 80–90%.
Significant differences exist between regions, as well as between rural and urban areas, in terms of the fate of plastic waste and the contribution of specific handling practices to deal with uncollected waste (Figure 4 and Supplementary Material, Files S6–S9). The most common practice, notably in rural villages, is open burning, used for 80% of the MPW generated (Figure 4and specifically File S6 in Supplementary Material), and which our model assumes results in the elimination of this waste. Disposal of uncollected plastic waste directly in waterways is more common in Maluku and Kalimantan, notably in rural communities, while fly-tipping is relatively more important in Papua. Nevertheless, in absolute terms, because of population distribution, most MPW that enters waterways through direct disposal in water originates in Java and Sumatra.

3.3. Riverine Plastic Waste Fluxes and Discharges

Our results show significant seasonal variations in plastic discharges, corresponding to seasonal rainfall fluctuations of a long dry season followed by a rainy season with intense rainfall (Supplementary Material, File S10). Nevertheless, the simulations also show that brief showers during the dry season can mobilize significant amounts of MPW, while in the rainy season peak, MPW discharges can be lower than during the dry season. Moreover, the results suggest that MPW river loads may fluctuate significantly over short timespans of days, possibly even hours, and, as discussed for the Saigon River [25], plastic transport is likely to be affected by a combination of factors (e.g., rainfall distribution, urban drainage conditions, preference for disposal directly into waterways during certain times of the day, etc.). While there are no long time series of continuous observations yet to validate the model at that level, field observations in and around Jakarta and elsewhere corroborate the erratic nature of riverine plastic loads.
During both wet and dry seasons, periods with relatively higher river discharge (compared with interannual averages) correspond with periods of relatively higher release of plastics into the marine environment (Supplementary Material, File S11). While the model has not been validated against multi-year observations (as these were not available), the good match with existing observations and agreement with experience in the field of short-term fluctuations gives confidence in the general model performance and therefore in its ability to represent long-term fluctuations due to rainfall pattern variations. We, therefore, expect that annual rainfall variation, which in Indonesia is strongly correlated with the ENSO cycle [26], will also be reflected in plastic discharges into the sea. Considering that we only accounted for a relatively short period (four years), which did not include a strong La Nina year (i.e., with wetter conditions than average), we may have underestimated the maximum annual plastic discharges. This finding further highlights the importance of hydrology when interpreting results from observations.
Temporal estimates of plastic discharges into the sea were generated for river outlets of over 4000 river catchments in Indonesia. Ranking these in terms of their share of total national discharges shows that the top contributing rivers are found in Java, Sumatra, and Kalimantan (Supplementary Material, File S12). Our assessment indicates that, generally, rivers carrying higher loads of plastic are large rivers, such as the Bengawan Solo and Brantas Rivers, that run through densely populated areas. However, there are exceptions, as smaller catchments (e.g., the Cirarab river) are also among the topmost polluted rivers. This suggests an influence of other factors, such as unsanitary disposal facilities that are located near waterways and function as MPW point sources.
Only 25% of the total amount of plastic waste discharged into the marine environment in Indonesia originates from the top ten contributing rivers combined. Such a finding highlights the need for broad measures across the country rather than measures focused on only the most polluted catchments. More specifically, the detailed river catchment analysis, combined with a good understanding of the local situation, supports formulating general and area-specific concrete management and investment options to reduce plastic inputs in the medium and long term.

4. Discussion

4.1. Data Limitations and Uncertainties

The overall uncertainty associated with the results (−42.0%–+59.4%) is dominated by the uncertainty in the estimates of MPW leaked to the terrestrial environment and waterways (−37.4%–+37.2%) (see a summary of uncertainties in Supplementary Material, File S14).
Even though the use of local SWM data generated a high degree of detail in this assessment, there are still considerable data gaps in this domain. While the BPS household surveys on waste handling practices were a critical source of data and enabled the differentiation of distinct pathways of how MPW enters the environment, they are statistically valid only at the provincial level. Plastic content data are limited in Indonesia; only 40 regencies/cities have reliable data on SWG and waste composition. Limited installation of weighbridge (landfill gate) facilities means that there are little available data on the volume or weight of solid waste transported into disposal sites, as is information on the composition of delivered waste. The TPS3R and waste banks’ data are based on design capacity, not the facility’s operational capacity, which would be preferable for this type of assessment.
Concerning the environmental modeling of plastics, the flux of leaked MPW towards the sea accounts for factors generally accepted as important, such as river network topography, meteorology, and hydrology, in connection with land-use types and dam locations (e.g., [7]). This creates a realistic spatially variable connectivity between the location of MPW generation and the marine environment, which is essential for developing control measures (e.g., trash racks). The approach is also expected to realistically reflect the temporal dynamics of the terrestrial and aquatic fate and transport of MPW. The amount of exposed MPW washed off during a rain event depends partly on the rainfall intensity but also on the length of the dry period preceding the event. This explains the relatively high plastic load peaks during dry season precipitation events. The robustness of the current environmental modeling is underlined by the consensus between our results and those by Meijer et al. [8] for the share of MPW that reaches the marine environment for the whole of Indonesia.
The main environmental modeling uncertainties are those related to the model parameters. These could not yet be independently calibrated because of the lack of representative measured plastic waste fluxes in Indonesian rivers. Not enough field data exist in the study area to make robust quantitative validation of the model parameters. Moreover, as also recognized by Vriend et al. [27], inconsistencies between methods used for quantification and classification of plastic waste and whether the composition of the material is considered (i.e., including vegetation and other non-plastic materials) make a direct comparison of field data, model results, and between different studies challenging. Another source of uncertainty is assuming plastic waste is a homogeneous “material”, neglecting its diverse nature with different composition, sizes, shapes, and densities of plastic items. This requires a more sophisticated modeling approach and detailed data regarding the specific composition of plastic waste. A final source of uncertainty is the representation of net riverine retention only, neglecting remobilization processes and the associated timescales [18].

4.2. Comparison with Previous Studies

The results obtained deviate from previous estimations for Indonesia by global studies [3,5,8] (see a detailed comparison in Supplementary Material, File S15). This may be explained mainly by methodological differences, such as the reliance of those studies on generic MPW figures at the country level only and the fact they did not account for high-resolution temporal variation in hydrological conditions. Our estimations of national MPW generated are roughly 1.5 times higher than [3] as we have considered the whole country’s population in 2016 (compared with a lower population in 2010 and restricted to 50 km inland). On the other hand, our estimates of inputs into the sea are comparatively lower since we accounted for the difference that distinct waste handling practices have in generating aquatic inputs of plastic.
Meijer et al. [8] attribute a total of 0.82 × 10⁹ kg yr−1 of MPW generated in 2015 in Indonesia and estimate that 56 × 106 kg yr−1 are discharged via rivers into the sea. Both these estimates are six times lower than our estimated ranges. However, the fraction of MPW reaching the marine environment is the same (7%) in both studies. This could be expected, as both studies use high-resolution spatially distributed modeling and have largely overlapping input (though there are minor differences, for instance, the incorporation of removal at dams in the present study and the somewhat more elaborate representation of terrestrial transport processes by Meijer et al. [8]). Meijer et al. [8] provide a factor 10 to estimate the likely range of individual emissions, but the source of the uncertainties is not provided, nor is the range validated against the data.

4.3. Validation of the Model Results

Our sampling and analysis of plastic content at trash racks in Jakarta showed a wide spatial and temporal variation in the different locations (47–97% in the dry season and 31–83% in the wet season). These percentages are considerably higher than the 11–43% plastic mass reported for the Saigon River in Vietnam, where vegetation comprised 67% of the debris [28]. The dominance of plastic bags and food/drink packaging (including bottles and sachets) in the composition of river-borne plastic waste is similar between the two countries. Due to the high variability in plastic composition, it was not possible to convert observed volumes of total debris to validate model outputs of discharged plastic waste. Nevertheless, at least for the dry season, the trend in the modeling results is in line with the trend of DLH-reported volumes of waste removed at the Manggarai trash rack in Jakarta (Supplementary Material, File S13), whereas for higher river discharges (wet season), data on waste volumes show minimum values, suggesting that gates are open to prevent flooding upstream.
Cordova and Nurhati [24] monitored the Bekasi River mouth (East Jakarta) between June 2015 and June 2016, with monthly surveys and composition analyses of waste discharged. Although these observations are insufficient to validate modeled daily fluxes, these data points show a good correlation with the computed plastic discharges obtained for this period (Supplementary Material, File S10). It should be noted that the Bekasi River has very few anthropogenic changes to the hydrological system. No other observation time series have been found when the present study was conducted.

5. Conclusions

We have highlighted the importance of local solid waste handling preferences when assessing MPW loads in rivers. Data to characterize and quantify local handling preferences and waste composition across households with different socio-economic statuses are still scarce. Improving the existing national reporting system for community-based recycling organizations and including a specific question on SWM in the annual BPS survey should be considered. A more systematic sampling of solid waste generation, composition and material recovery rates, and detailed mapping of illegal dumpsites at the regency/city levels would improve SWM data significantly. At final disposal sites, arriving waste data should be recorded in a standardized simple format across all regions.
In view of improved future assessments, our study demonstrates the importance of integrating good quality high-resolution datasets from different domains (e.g., SWM, socio-economic, environmental observations of plastic, hydrology) while highlighting the knowledge gaps that still exist in the environmental modeling of plastics. Research on plastic pollution in freshwater systems is generally limited compared with the marine system [29]. The same applies to Indonesia, while research on plastic pollution in the terrestrial environment is even less studied [27]. It is, therefore, critical to integrate these different domains (including harmonizing units of measurements) and to better understand the interfaces between terrestrial (sources), freshwater (pathways), and marine environment (final sink). Country-wide assessments that also account for direct releases of marine plastic litter from maritime activities (e.g., [30]), such as shipping, fisheries, and aquaculture, can provide an even more comprehensive baseline estimation of the total inputs of plastic waste into the sea.
More extensive field observations are needed to quantify leakage rates from point and diffuse sources (e.g., final disposal sites) and the mechanisms that affect plastic mobilization and transport as it crosses these different environmental compartments. Recognizing how location-specific these processes can be, future monitoring efforts should be adapted to capture riverine plastic fluxes’ variability in short intervals (e.g., hourly) and thus help further calibrate plastic discharge models. The regular clean-up operations implemented across the country should be coupled with monitoring the amounts and composition of plastic waste intercepted in the river. Data originating from emerging technologies such as remote sensing [31,32] and machine learning [33] are promising applications in this context.
Despite existing limitations and data gaps, this study made significant progress by applying a more realistic and detailed country-wide assessment approach for plastic discharges, capturing the specificities in waste handling practices and their contribution to aquatic leakages across a country as large and diverse as Indonesia. It shows that regional and cultural differences in handling practices and waste generation, combined with detailed hydrometeorology and hydrological infrastructure, are critical aspects to consider in local, regional, and national assessments of plastic inputs into the sea. By clearly pinpointing these sources and leakage pathways, targeted measures can be prioritized and the potential effects in reducing plastic releases can be assessed.

Supplementary Materials

The following supporting information can be downloaded at: https://www.mdpi.com/article/10.3390/w15061143/s1, Overview of data sources used in the SWM and environmental modeling (File S1); Rate of exposure of plastic waste for different disposal destinations (File S2); Environmental fate parameters used in the D-Emissions and D-Water Quality software (File S3); Mass flow diagrams with key study results for urban and rural areas (File S4); Summary of modeling results of MPW subject to environmental processes and discharged into the sea for the main Indonesian regions (File S5); Spatial distribution of estimated daily rates of plastic waste openly burned in Indonesia (File S6); Spatial distribution of estimated daily rates of disposal of plastic waste in water across Indonesia (File S7); Spatial distribution of estimated daily rates of disposal of plastic waste in water across Indonesia; Spatial distribution of estimated daily rates of illegal dumping of plastic waste across Indonesia (File S8); Summary of modeling results of plastic waste management for the main Indonesian regions (File S9); Modeled time series of plastic discharges and estimations from observations in Bekasi river mouth (File S10). Indexed monthly average MPW discharges and multi-year indexed average river discharges for Java (File S11); Top 10 Indonesian rivers discharging higher amounts of plastic waste (File S12); Time series of modeled daily plastic waste discharges and plastic waste removed from a trash rack in Java (File S13); Summary of uncertainty associated to SWM data and hydrology in the estimated leakages of MPW (File S14); Comparison of the results with previous studies (File S15).

Author Contributions

The manuscript was written with the contributions of all authors and all have approved the final version. J.M.V. and B.v.V. contributed equally to this paper. J.M.V.: project coordination, conceptualization, analysis, writing and editing. B.v.V.: conceptualization, GIS analysis, data curation, writing. L.B.: conceptualization, methodology, numerical modeling, writing. J.v.G.: conceptualization, methodology, numerical modeling, writing. C.v.d.S.: analysis, writing and editing. D.T.W.: data collection and curation, analysis, writing. K.P.: conceptualization, writing and editing. A.A.: conceptualization, editing. All authors have read and agreed to the published version of the manuscript.

Funding

This study was funded by the Indonesia Oceans Multi-Donor Trust Fund, established in 2017 at the request of the Government of Indonesia with the support of the Governments of Norway and Denmark.

Institutional Review Board Statement

Not applicable.

Informed Consent Statement

Not applicable.

Data Availability Statement

Restrictions apply to the availability of the data used for this article. Data were obtained from the Indonesian Coordinating Ministry for Maritime and Investments Affairs and are available on request from the corresponding author with the permission of the Indonesian Coordinating Ministry for Maritime and Investments Affairs.

Acknowledgments

This work was made possible by the Indonesian Coordinating Ministry for Maritime and Investments Affairs (Kemenko MarVes) and we make a special acknowledgement to Ibu Nani Hendiarti (Deputy for Environment and Forestry Management, Kemenko MarVes) for supporting the study. The authors are grateful for the valuable inputs and review from Frank van Woerden and Kian Siong (World Bank), and Muhammad Reza Cordova (Indonesian National Research and Innovation Agency). Finally, we acknowledge the support of the wider study team that included Ira Wardani, Rizka Akmalia, Hélène Boisgontier, and Arnejan van Loenen (Deltares); J. Sinarko Wibowo and Pranandya Wijayanti (Royal HaskoningDHV); Semeidi Husrin (Marine Research Centre, Ministry of Marine Affairs and Fisheries).

Conflicts of Interest

The findings, interpretations, and conclusions expressed in this work reflect the views of the authors and do not reflect the views of the World Bank, its Board of Executive Directors, or the governments they represent.

References

  1. Ryan, P.G. A Brief History of Marine Litter Research. In Marine Anthropogenic Litter; Bergmann, M., Gutow, L., Klages, M., Eds.; Springer International Publishing: Cham, Switzerland, 2015; pp. 1–25. [Google Scholar] [CrossRef] [Green Version]
  2. Angiolillo, M.; Fortibuoni, T. Impacts of Marine Litter on Mediterranean Reef Systems: From Shallow to Deep Waters. Front. Mar. Sci. 2020, 7, 581966. [Google Scholar] [CrossRef]
  3. Jambeck, J.R.; Geyer, R.; Wilcox, C.; Siegler, T.R.; Perryman, M.; Andrady, A.; Narayan, R.; Law, K.L. Plastic waste inputs from land into the ocean. Science 2015, 347, 768–771. [Google Scholar] [CrossRef]
  4. Lechner, A.; Keckeis, H.; Lumesberger-Loisl, F.; Zens, B.; Krusch, R.; Tritthart, M.; Glas, M.; Schludermann, E. The Danube so colourful: A potpourri of plastic litter outnumbers fish larvae in Europe’s second largest river. Environ. Pollut. 2014, 188, 177–181. [Google Scholar] [CrossRef] [PubMed] [Green Version]
  5. Lebreton, L.C.M.; van der Zwet, J.; Damsteeg, J.-W.; Slat, B.; Andrady, A.; Reisser, J. River plastic emissions to the world’s oceans. Nat. Commun. 2017, 8, 15611. [Google Scholar] [CrossRef] [PubMed] [Green Version]
  6. Schmidt, C.; Krauth, T.; Wagner, S. Export of Plastic Debris by Rivers into the Sea. Environ. Sci. Technol. 2017, 51, 12246–12253. [Google Scholar] [CrossRef]
  7. van Calcar, C.J.; van Emmerik, T.H.M. Abundance of plastic debris across European and Asian rivers. Environ. Res. Lett. 2019, 14, 124051. [Google Scholar] [CrossRef] [Green Version]
  8. Meijer, L.J.J.; van Emmerik, T.; van der Ent, R.; Schmidt, C.; Lebreton, L. More than 1000 rivers account for 80% of global riverine plastic emissions into the ocean. Sci. Adv. 2021, 7, eaaz5803. [Google Scholar] [CrossRef]
  9. Baldwin, A.K.; Corsi, S.R.; Mason, S.A. Plastic Debris in 29 Great Lakes Tributaries: Relations to Watershed Attributes and Hydrology. Environ. Sci. Technol. 2016, 50, 10377–10385. [Google Scholar] [CrossRef]
  10. Velis, C.A.; Cook, E. Mismanagement of Plastic Waste through Open Burning with Emphasis on the Global South: A Systematic Review of Risks to Occupational and Public Health. Environ. Sci. Technol. 2021, 55, 7186–7207. [Google Scholar] [CrossRef]
  11. Edelson, M.; Håbesland, D.; Traldi, R. Uncertainties in global estimates of plastic waste highlight the need for monitoring frameworks. Mar. Pollut. Bull. 2021, 171, 112720. [Google Scholar] [CrossRef]
  12. Lebreton, L.; Andrady, A. Future scenarios of global plastic waste generation and disposal. Palgrave Commun. 2019, 5, 6. [Google Scholar] [CrossRef] [Green Version]
  13. Haberstroh, C.J.; Arias, M.E.; Yin, Z.; Wang, M.C. Effects of Urban Hydrology on Plastic Transport in a Subtropical River. ACS ES&T Water 2021, 1, 1714–1727. [Google Scholar] [CrossRef]
  14. World Economic Forum. Radically Reducing Plastic Pollution in Indonesia: A Multistakeholder Action Plan. National Plastic Action Partnership; World Economic Forum: Cologny, Switzerland, 2020. [Google Scholar]
  15. Sudono, I.; Indriyani, M.; Radhika, R.; Seizarwati, W.; Goorden, N.; Tollenaar, D. Water resources modelling framework for Indonesia. In International Seminar on Water Resilience in a Changing World; Indonesian Association of Hydraulic Engineers (HATHI): Bali, Indonesia, 2016. [Google Scholar]
  16. Windsor, F.M.; Durance, I.; Horton, A.A.; Thompson, R.C.; Tyler, C.R.; Ormerod, S.J. A catchment-scale perspective of plastic pollution. Glob. Chang. Biol. 2019, 25, 1207–1221. [Google Scholar] [CrossRef] [Green Version]
  17. Liro, M.; Emmerik, T.; Wyżga, B.; Liro, J.; Mikuś, P. Macroplastic Storage and Remobilization in Rivers. Water 2020, 12, 2055. [Google Scholar] [CrossRef]
  18. van Emmerik, T.; Mellink, Y.; Hauk, R.; Waldschläger, K.; Schreyers, L. Rivers as Plastic Reservoirs. Front. Water 2022, 3, 786936. [Google Scholar] [CrossRef]
  19. Al-Zawaidah, H.; Ravazzolo, D.; Friedrich, H. Macroplastics in rivers: Present knowledge, issues and challenges. Environ. Sci. Process. Impacts 2021, 23, 535–552. [Google Scholar] [CrossRef]
  20. Cesarini, G.; Scalici, M. Riparian vegetation as a trap for plastic litter. Environ. Pollut. 2022, 292, 118410. [Google Scholar] [CrossRef]
  21. Seitzinger, S.P.; Styles, R.V.; Boyer, E.W.; Alexander, R.B.; Billen, G.; Howarth, R.W.; Mayer, B.; van Breemen, N. Nitrogen retention in rivers: Model development and application to watersheds in the northeastern U.S.A. Biochemistry 2002, 57, 199–237. [Google Scholar] [CrossRef]
  22. Behrendt, H.; Opitz, D. Retention of nutrients in river systems: Dependence on specific runoff and hydraulic load. Hydrobiologia 1999, 410, 111–122. [Google Scholar] [CrossRef]
  23. Garnier, J.; Billen, G.; Hannon, E.; Fonbonne, S.; Videnina, Y.; Soulie, M. Modelling the Transfer and Retention of Nutrients in the Drainage Network of the Danube River. Estuarine Coast. Shelf Sci. 2002, 54, 285–308. [Google Scholar] [CrossRef]
  24. Cordova, M.R.; Nurhati, I.S. Major sources and monthly variations in the release of land-derived marine debris from the Greater Jakarta area, Indonesia. Sci. Rep. 2019, 9, 18730. [Google Scholar] [CrossRef] [Green Version]
  25. van Emmerik, T.; Strady, E.; Kieu-Le, T.-C.; Nguyen, L.; Gratiot, N. Seasonality of riverine macroplastic transport. Sci. Rep. 2019, 9, 13549. [Google Scholar] [CrossRef] [PubMed] [Green Version]
  26. Nur’Utami, M.N.; Hidayat, R. Influences of IOD and ENSO to Indonesian Rainfall Variability: Role of Atmosphere-ocean Interaction in the Indo-pacific Sector. Procedia Environ. Sci. 2016, 33, 196–203. [Google Scholar] [CrossRef] [Green Version]
  27. Vriend, P.; Hidayat, H.; van Leeuwen, J.; Cordova, M.R.; Purba, N.P.; Löhr, A.J.; Faizal, I.; Ningsih, N.S.; Agustina, K.; Husrin, S.; et al. Plastic Pollution Research in Indonesia: State of Science and Future Research Directions to Reduce Impacts. Front. Environ. Sci. 2021, 9, 692907. [Google Scholar] [CrossRef]
  28. Lahens, L.; Strady, E.; Kieu-Le, T.-C.; Dris, R.; Boukerma, K.; Rinnert, E.; Gasperi, J.; Tassin, B. Macroplastic and microplastic contamination assessment of a tropical river (Saigon River, Vietnam) transversed by a developing megacity. Environ. Pollut. 2018, 236, 661–671. [Google Scholar] [CrossRef] [Green Version]
  29. Blettler, M.C.; Abrial, E.; Khan, F.R.; Sivri, N.; Espinola, L.A. Freshwater plastic pollution: Recognizing research biases and identifying knowledge gaps. Water Res. 2018, 143, 416–424. [Google Scholar] [CrossRef] [Green Version]
  30. Bai, M.; Zhu, L.; An, L.; Peng, G.; Li, D. Estimation and prediction of plastic waste annual input into the sea from China. Acta Oceanol. Sin. 2018, 37, 26–39. [Google Scholar] [CrossRef]
  31. Biermann, L.; Clewley, D.; Martinez-Vicente, V.; Topouzelis, K. Finding plastic patches in coastal waters using optical satellite data. Sci. Rep. 2020, 10, 5364. [Google Scholar] [CrossRef] [Green Version]
  32. Martínez-Vicente, V.; Clark, J.R.; Corradi, P.; Aliani, S.; Arias, M.; Bochow, M.; Bonnery, G.; Cole, M.; Cózar, A.; Donnelly, R.; et al. Measuring Marine Plastic Debris from Space: Initial Assessment of Observation Requirements. Remote Sens. 2019, 11, 2443. [Google Scholar] [CrossRef] [Green Version]
  33. Wolf, M.; Berg, K.V.D.; Garaba, S.P.; Gnann, N.; Sattler, K.; Stahl, F.; Zielinski, O. Machine learning for aquatic plastic litter detection, classification and quantification (APLASTIC-Q). Environ. Res. Lett. 2020, 15, 114042. [Google Scholar] [CrossRef]
Figure 1. Conceptual framework of the plastic fluxes and processes modeled in the study.
Water 15 01143 g001
Figure 2. Conceptual diagrams showing the estimated amounts of plastic waste across different waste handling and environmental processes, from its generation to discharge into the marine environment (values representative for mid-range estimates) for Indonesia.
Water 15 01143 g002
Figure 3. Estimated annual discharges of plastic waste from rivers and coastlines in Indonesia.
Water 15 01143 g003
Figure 4. Share (%) of the destination of plastic waste generated in urban and rural areas for the whole of Indonesia and in different regions reveals significant regional differences.
Water 15 01143 g004
Disclaimer/Publisher’s Note: The statements, opinions and data contained in all publications are solely those of the individual author(s) and contributor(s) and not of MDPI and/or the editor(s). MDPI and/or the editor(s) disclaim responsibility for any injury to people or property resulting from any ideas, methods, instructions or products referred to in the content.

