1. Introduction
More than two billion people worldwide suffer from limited access to fresh water, according to The United Nations World Water Development Report [
1]. By around 2050, over one-third of the global population would suffer a significant water crisis if the present level of water contamination and use are still not lowered [
1]. Surface water supply systems have been facing difficulties due to rapid urbanization, a growing population, ecological pollution, and factors such as climate change and water insufficiency [
2]. Such surface freshwater represents less than 1% of the world’s freshwater in lakes and rivers, while over 30% of it is preserved underground as aquifers [
3]. Freshwater supplies are under great stress everywhere in the globe, particularly in emerging nations [
4,
5].
In dry and semi-arid areas, groundwater represents the most valuable natural resource. The supply of groundwater contributes roughly 50% of the water used for potable use, 40% for industry, and 20% for agriculture [
6]. As compared to surface water, groundwater is less exposed to contamination and evapotranspiration. Groundwater can also be drawn during any part of the year, and unexpected droughts have a lower effect [
7,
8,
9]. Due to the over exploitation of groundwater, its levels are decreasing. Daily losses are being recorded in the underground water supply [
10]. For the best use and preservation of this priceless commodity, it is crucial to identify groundwater potential areas [
11]. Drilling and geoelectric monitoring are two conventional techniques for finding groundwater; they are exceedingly time-consuming and expensive. Recent techniques can estimate the groundwater potential depending on the watershed’s characteristics, and the data they produce are more reliable [
12,
13,
14].
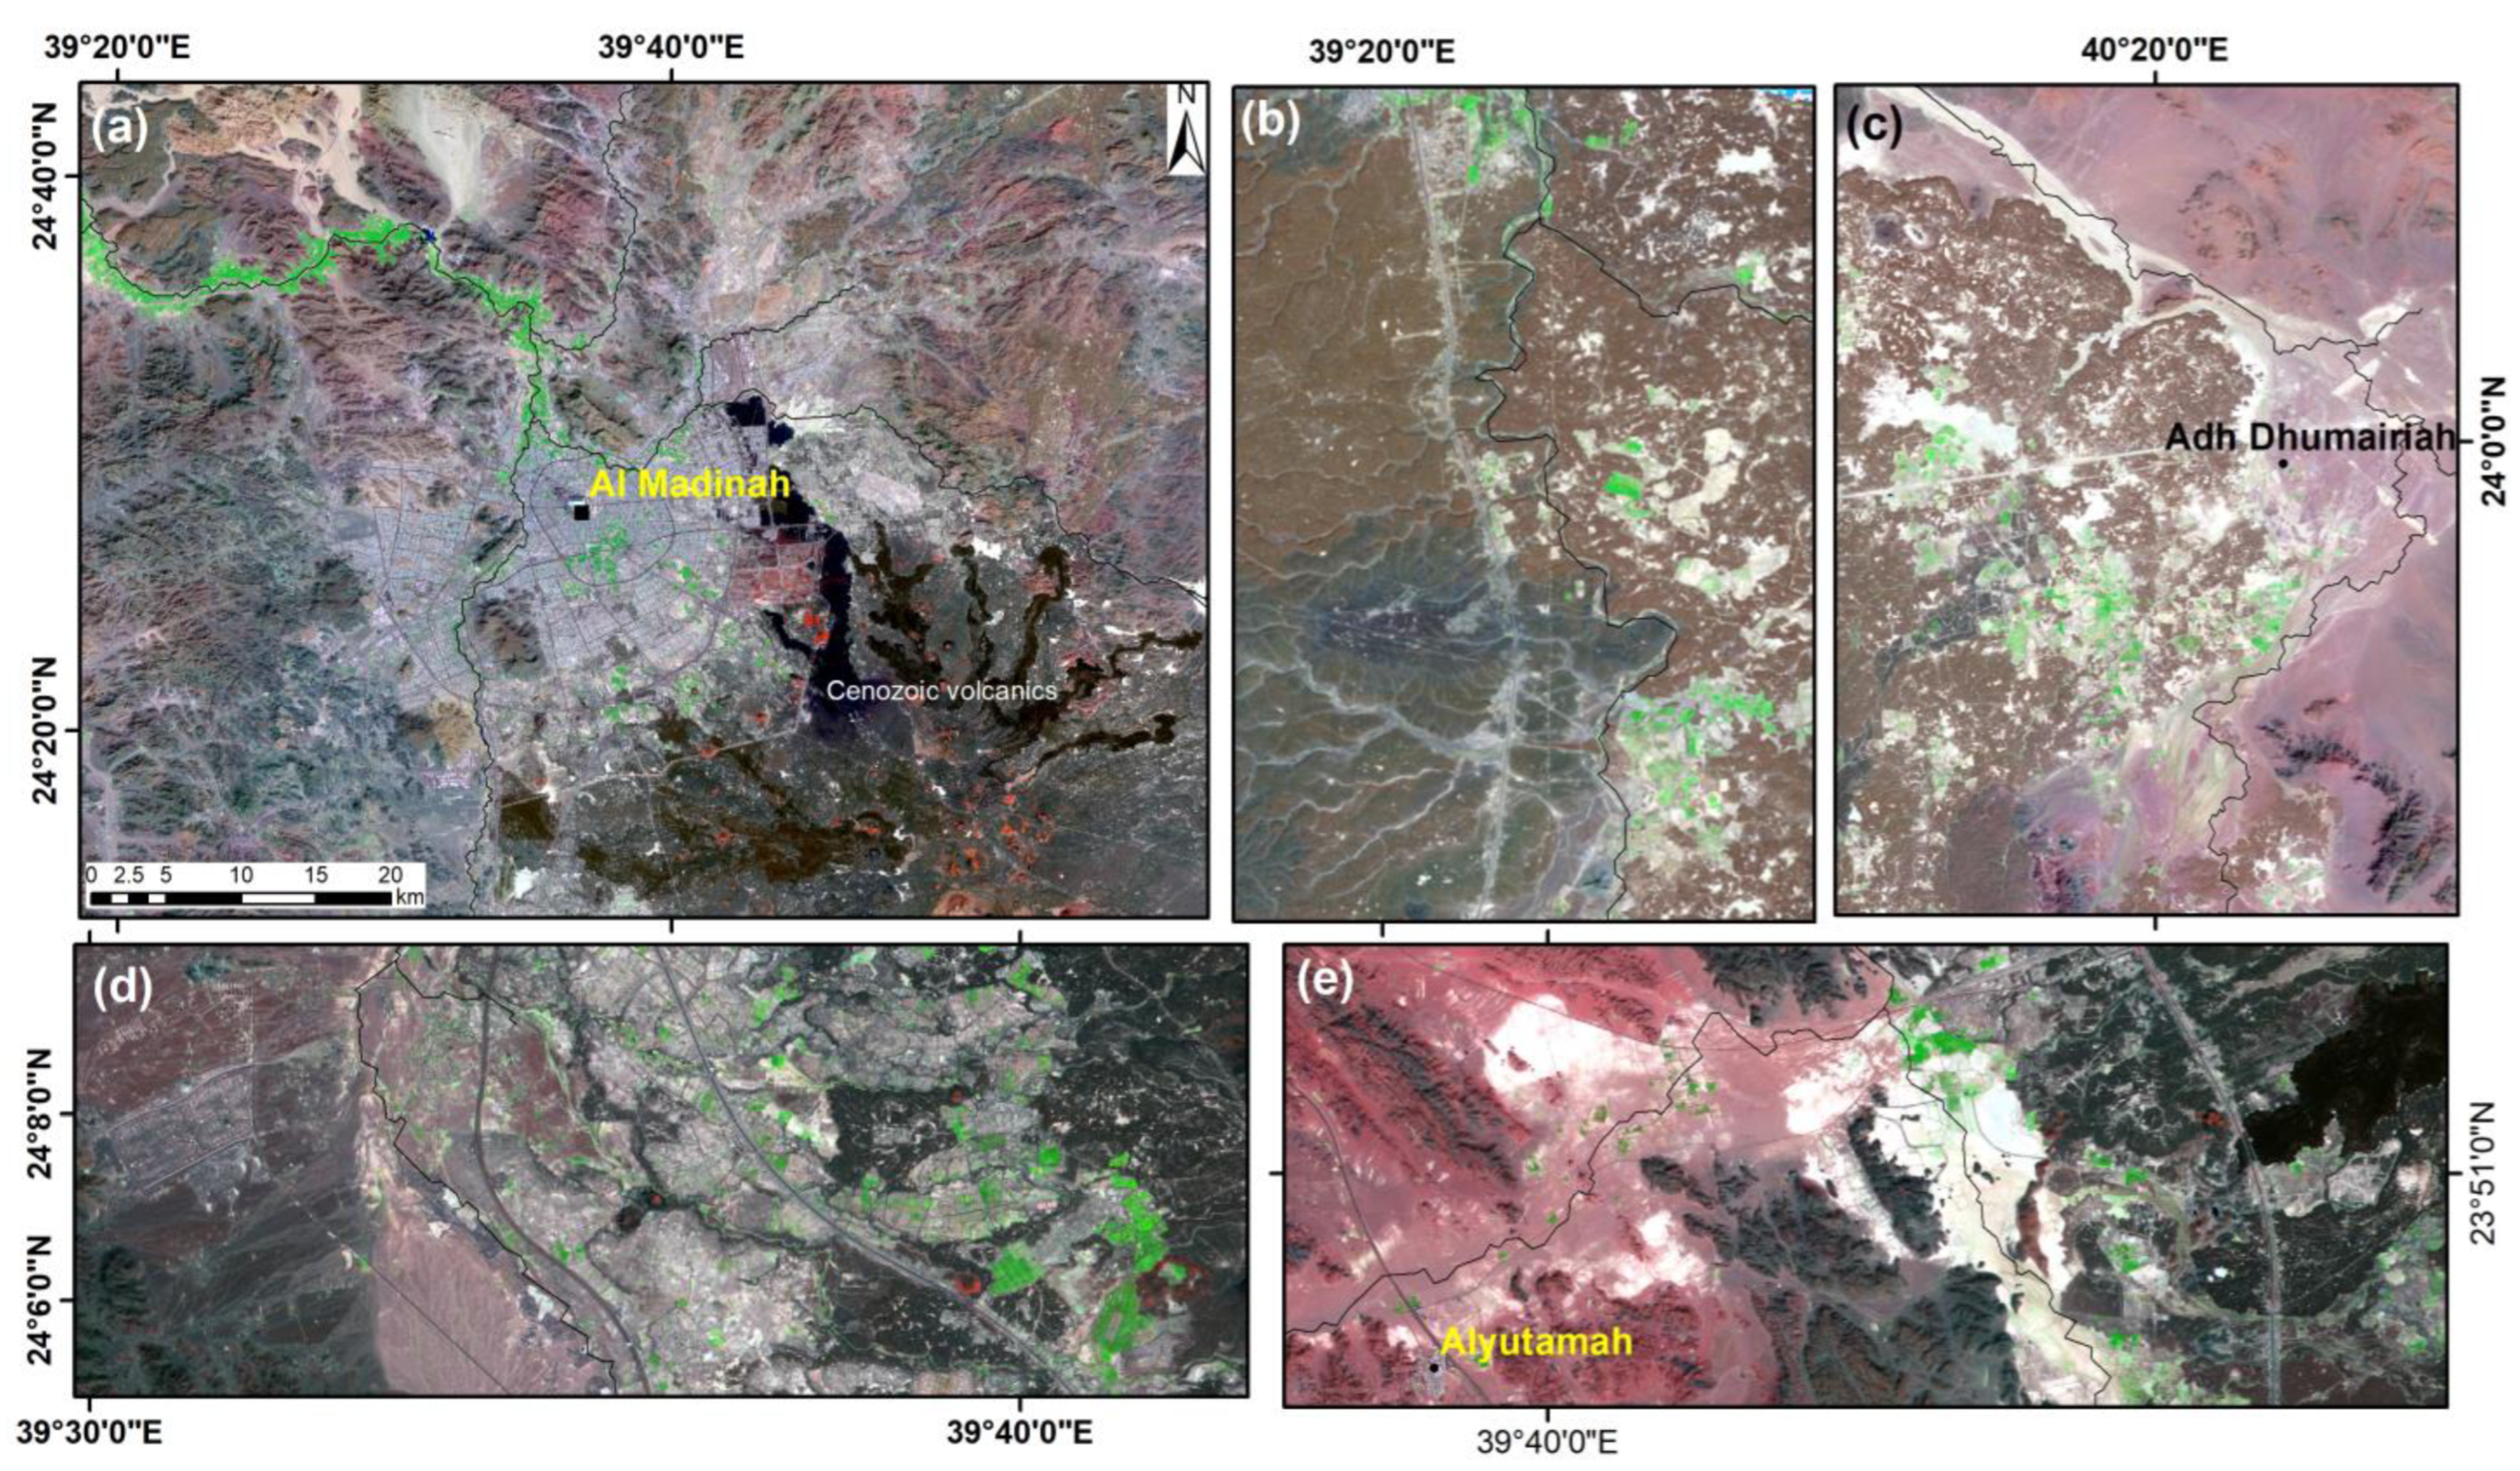
Wadi Al Hamdh, as a part of arid-semi arid regions in the west of the Arabian Peninsula, was chosen in the present study due to its significant area (108,457 sq km) that catches rainfall, location (east of the Red Sea), extension mainly through at five territories (e.g., Al Madinah, Makkah, Riyadh, Ha’il, and Tabuk), and prominent climatic and hydrologic conditions in Saudi Arabia (
Figure 1).
Mapping groundwater resources, using remote sensing (RS) and geographic information systems (GIS), has become an increasingly popular technique [
15,
16]. Numerous elements, including geology, topography, climatic conditions, soil, land use, land cover, slopes, distances from rivers, and precipitation levels, have an impact on groundwater dispersion [
7,
17]. During the past few years, numerous scientists have employed a variety of cutting-edge analysis techniques and simulation approaches to pinpoint places with groundwater potential [
7,
18,
19,
20].
Frequency ratio (FR), for example, is a data-driven model that is frequently used in groundwater prospection [
21]. This method improved the prediction output and was adopted for the groundwater potential zone, which helps decision-makers [
22,
23,
24,
25,
26]. In order to assign rating (r) values to each class, the FR technique establishes the geographical linkages between the dependent variable, existing wells (spring wells, observation wells), and the independent variables, classes of thematic layers [
27,
28,
29,
30]. The FR is frequently used to map groundwater potential in a wide range of different circumstances [
26,
31,
32,
33]. In this model, the value of FR is computed from the thematic layers of the utilized factors that identify groundwater availability [
34]. This method uses a variety of criteria, derived from remote sensing data for the purpose of predicting groundwater occurrences. The study area was not undergoing extensive exploration using recent techniques of remote sensing and GIS. Therefore, the present study employs remote sensing data, field data, a GIS-based frequency ratio, and overlay analysis techniques to identify and combine data (twelve factors) derived from hydrologic, geological, climatic, and topographic factors in the Wadi Al Hamdh watershed area of Saudi Arabia in order to estimate the groundwater-promising zones, and to identify appropriate locations for artificial groundwater recharge.
2. Geologic and Hydrogeological Setting of the Study Area
The Wadi Al Hamdh basin includes Al-Madinah Governorate, while a few tributaries extend to Ha’il, Tabuk, and Makkah regions (
Figure 1). Al-Madinah Al-Munawarah lies in the western part of the Arabian Peninsula that is considered a part of the Arabian Shield, comprising of Precambrian crystalline rocks, and underlying the alluvial sediments of the Quaternary age. Neoproterozoic basement rock units that comprise two groups of volcanic and sedimentary rocks [
35] extend in the northern part of the Hijaz terrane [
36] that comprises the Al Ays Group and Furayh Groups. The Saudi Arabian Paleozoic Sedimentary Strata (Paleozoic Sandstones) are known to crop out in a limited zone encompassing the Arabian Shield from the East and edge it to create the base of the Arabian Platform’s enormous sedimentary strata from the West. The most significant and prolific “tight gas” and “shale gas” unconventional reservoirs are represented by it [
37]. They have a thickness of roughly 500 m on the surface. Paleozoic sedimentary rocks are more than 4500 m thick in Saudi Arabia’s subsoil [
38].
Tertiary and Quaternary basalt are Neogene-Quaternary volcanics that make up the Cenozoic (Neogene-Quaternary) volcanics. The volcanic provinces of Neogene to Quaternary flood basalt known as the Harrat Rahat contain volcanic units. These Cenozoic basalts are unconformably deposited over both Precambrian rocks and wadi sediments close to Al-Madinah [
39]. The uppermost weathered basalt flows are hydrologically connected units where groundwater is plentiful in the study region. Unconfined to semi-confined conditions are present in the groundwater. The Quaternary deposits (clay sand and gravel) in the Harrat Rahat were produced by the weathering of Precambrian rocks with exposures of basalt from the late Tertiary and Quaternary. The water table is between 28 and 93 m below the surface, while the sub-basaltic alluvial aquifer’s groundwater level is from 535 to 594 m deep [
40,
41]. Instead of other sections in Al-Madinah, the direction of the water drain is from the west (Wadi Al Aqiq) towards the central and southern parts.
3. Data and Methods
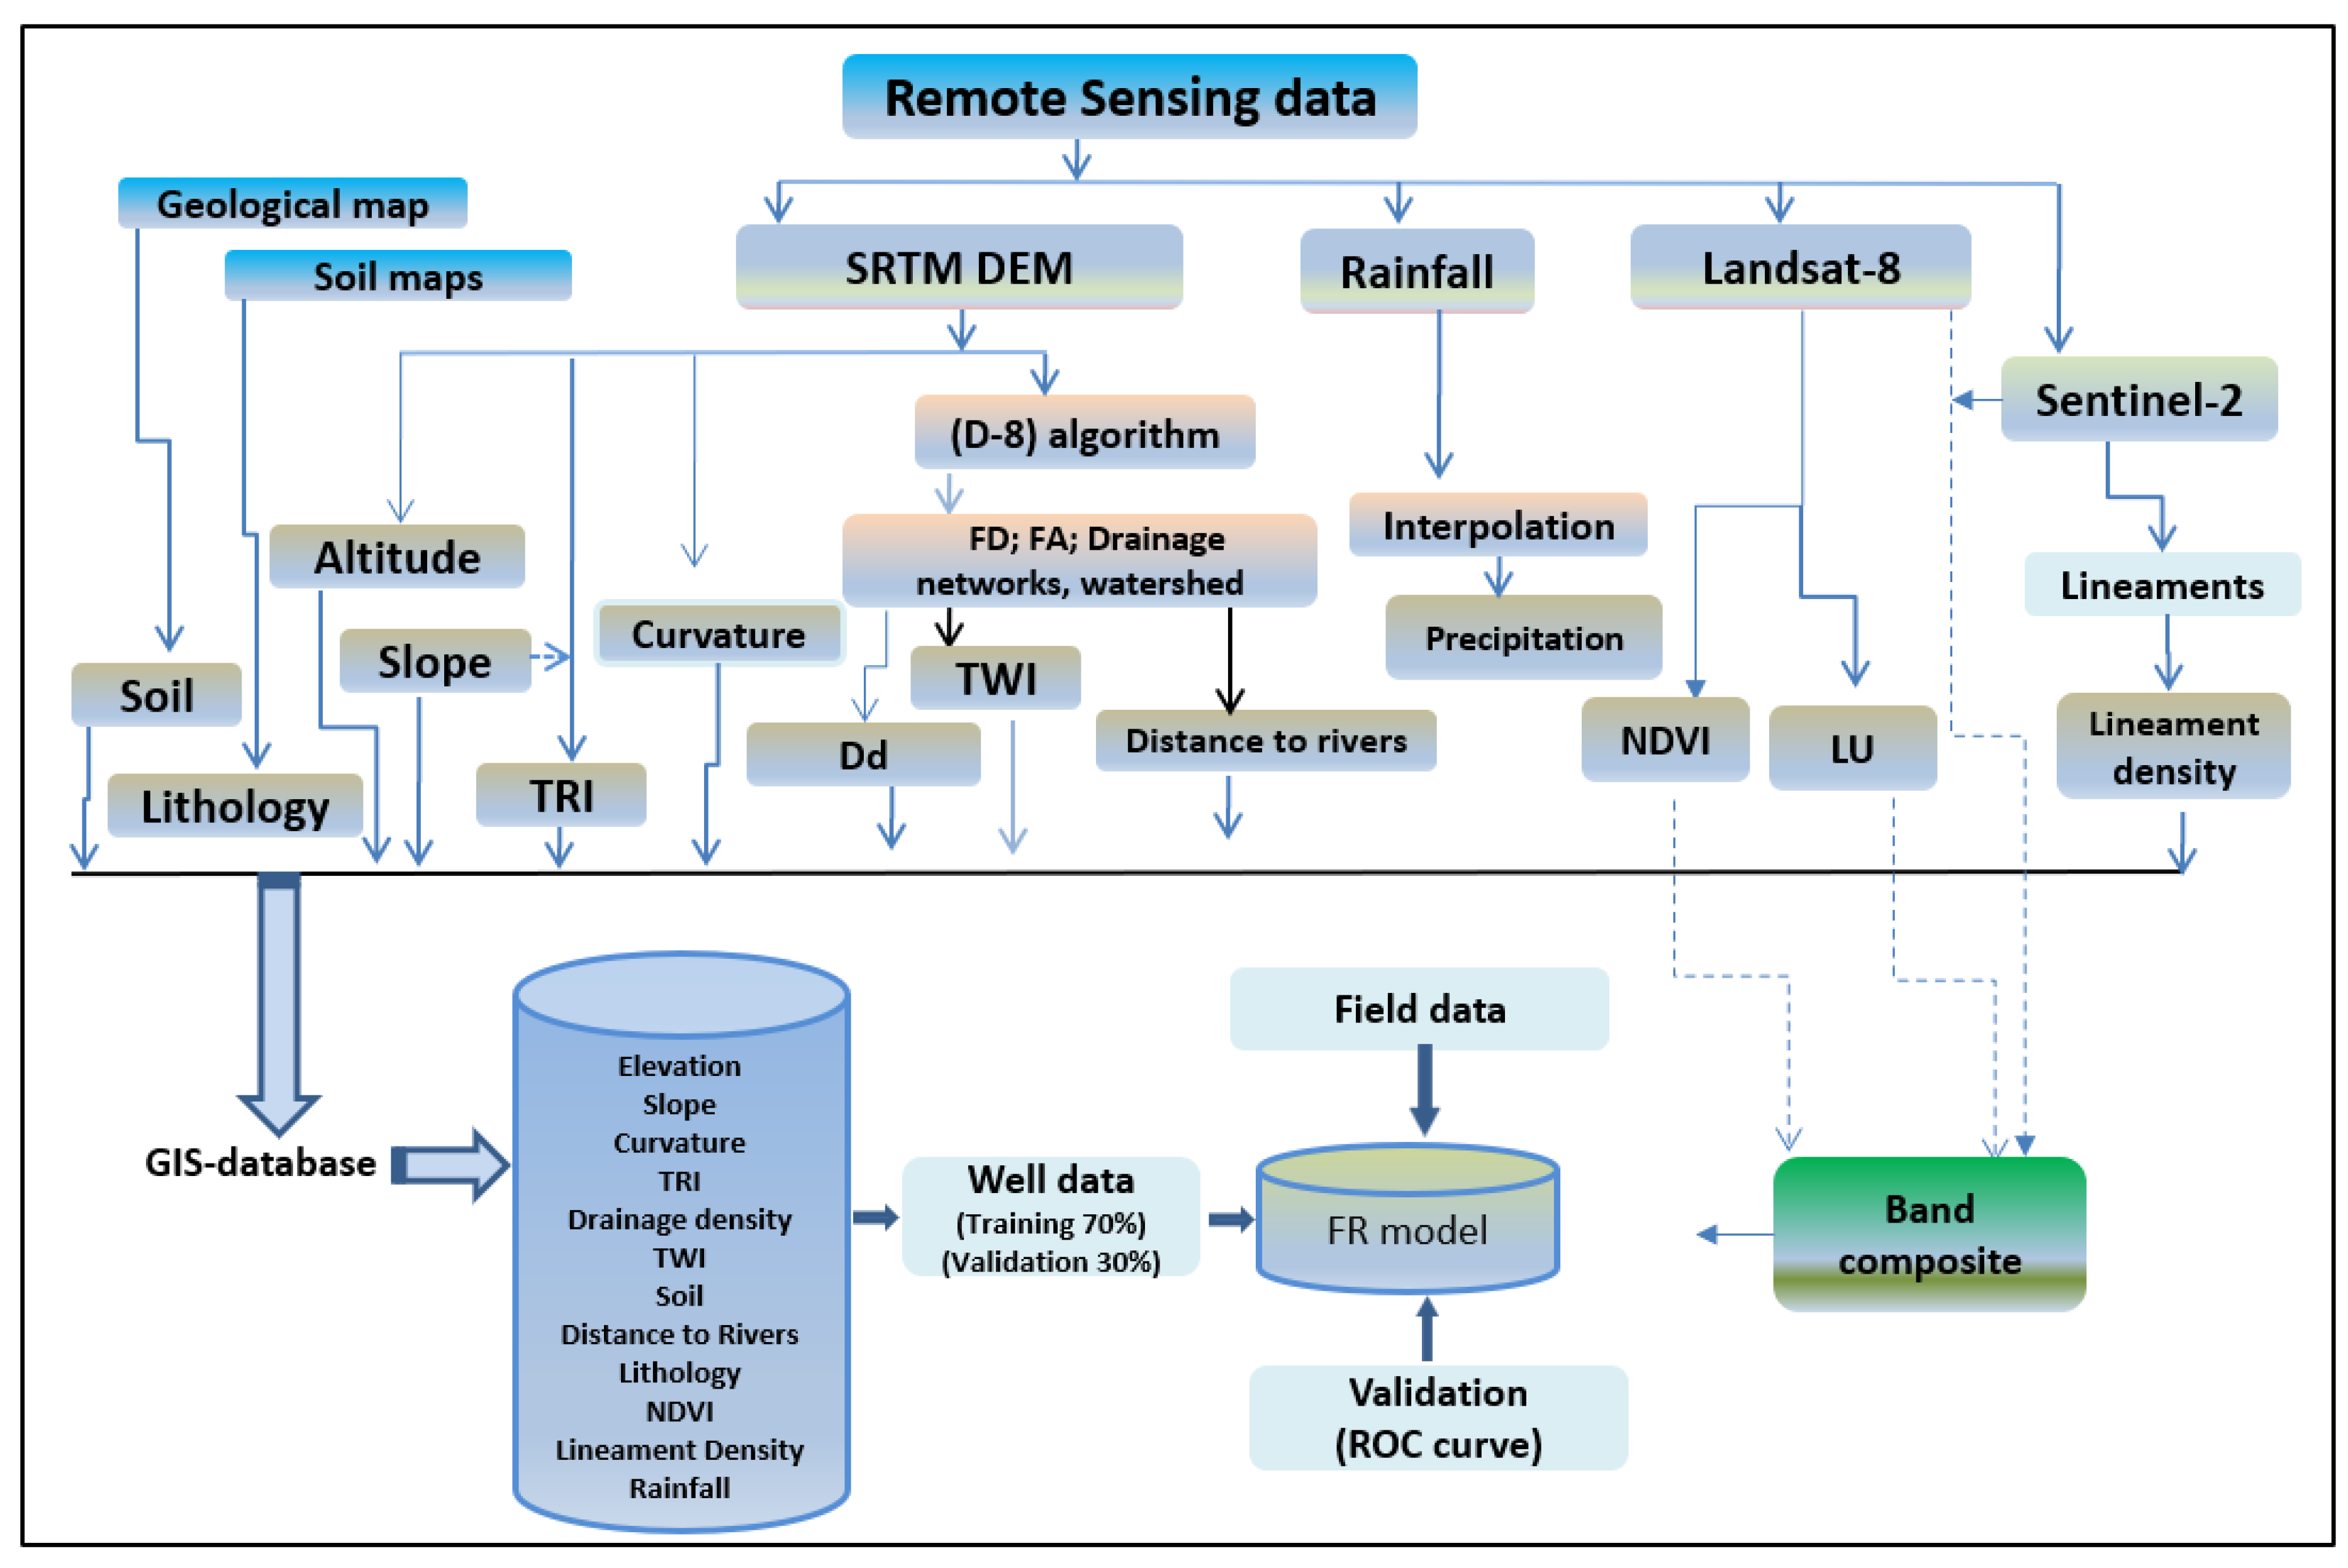
To reveal potential prospective areas of groundwater in the Al-Madinah area, west of Saudi Arabia, a variety of satellite radar and optical data were gathered. To map the topographic features and determine the catchment characteristics, the SRTM DEM data were applied. Additionally, optical data were used to characterize the study area’s land-use and cover (
Figure 2). During the field study, groundwater data were collected, including the locations of groundwater wells, the density and distribution of irrigated farms, and flow discharge.
The USGS data resource center offers downloads of the SRTM DEM data with a spatial resolution of about 90 m. The watershed, stream networks, altitudes, slope, surface curvature, topographic wetness index (TWI), terrain roughness index (TRI), drainage density, and distance to river factors are used to define them using ArcGIS. The automatic delineation of stream extractions was carried out using the D8 approach [
42]. For the purpose of determining other characteristics, the stream ordering was identified.
On 11 February 2013, Landsat 8 launched with the Landsat- OLI, an optical sensor with nine spectral bands. On 29 October 2022, two Level 1 scenes (path/row 170/043) of OLI data were obtained. The acquired images were masked and connected to the UTM Zone 37 N coordinate system. In this study, image enhancement and transformation methods were carried out using the OLI bands 2, 3, 4, 5, and 7.
Multiple advanced very high-resolution radiometer (AVHRR) daily observations are computed to generate a nearly cloud-free image that exhibits the maximum amount of greenness. This is how the NDVI composites are created. A derived NDVI band composite is created by combining the NDVI ratio from bands one and two of the AVHRR composite. The data were downloaded from USGS EROS Archive-AVHRR NDVI Composites.
TRMM satellite recordings were used to obtain information on average rainfall. The obtained average rainfall statistics spanned from 1 January 1998 to 30 November 2015. They were spatially distributed using kriging interpolating tool. All such data are accessible at this URL:
https://giovanni.gsfc.nasa.gov/giovanni/ (accessed on 30 November 2016).
The Sentinel-2A satellite was launched on 23 June 2015, and the first data was collected a few days later. Sensors on Sentinel-2 collect information in the VIS/NIR, SWIR, and TIR wavelength ranges. The spatial resolution of these bands is 10–60 m. In total, 13 bands in the VIS/NIR and SWIR spectrum are recorded by Sentinel-2. The coastal band B1 (443 nm) has a 60 m pixel geometry, while the VIS/NIR bands have pixel sizes of 10 m for the blue B2 (490 nm), green B3 (560 nm), red B4 (665 nm), and infrared B8 (842 nm). The SWIR bands (B11: 1610 nm, B12: 2190 nm) have 20 m-wide pixels. Sentinel-2 scenario is provided in Sentinel’s proprietary SAFE format as zip-compressed files. JPEG files are used to preserve the spectral bands. In this SAFE file, the spectral bands are saved as jpg images with three distinct geometric resolutions (10 m, 20 m, and 60 m). A single GeoTIFF file with a uniform pixel size of 10 m is created by stacking the jpg files of bands B2, B3, B4, and B8 with a spatial resolution of 10 m and B11 and B12 with a resolution of 20 m. To minimize time and data calculation, a portion of these data were processed using SNAP software during preprocessing.
The classes of each thematic layer were done using the “Natural breaks classifier,” designed to optimally group similar values together and maximize the contrasts between classes (Jenks). A data clustering technique known as the Jenks optimization model, often known as the Jenks natural breaks classification method, aims to find the optimal grouping of values into several groups. Every thematic layer’s pixel was compared with the same spot in the applied overlay analysis. This means that several elements of the input eleven layers should be combined to create a GWPZs map as the output. Noteworthy, each layer and subclass has a numerical rank assigned to it. This gives the user the ability to mathematically merge the layers and assign a new rank to each pixel in the final GWPZs map. The minimal input cell size (90 m) was integrated with the research area’s GWPZs map, which represents the weighted average of the combined data-based maps (multi-criteria), in this model utilizing a weighted overlay method based on GIS. The below formula was used to do this.
where F
i refers to the strength of the inter-map (sub-class) features and L
i denotes the normalized weight of an evidentiary layer of the
i parameter. This enables the eleven thematic maps to be blended according to the equation on a pixel basis.
4. Results
4.1. Elevation
Groundwater and surface runoff are influenced by altitude in terms of their direction and speed [
43]. Elevation has a significant effect in revealing GWPZs [
44]. As opposed to how it relates to the groundwater resource [
45]. The areas of high altitude cannot hold precipitation that accumulates in areas of low topography in the downstream [
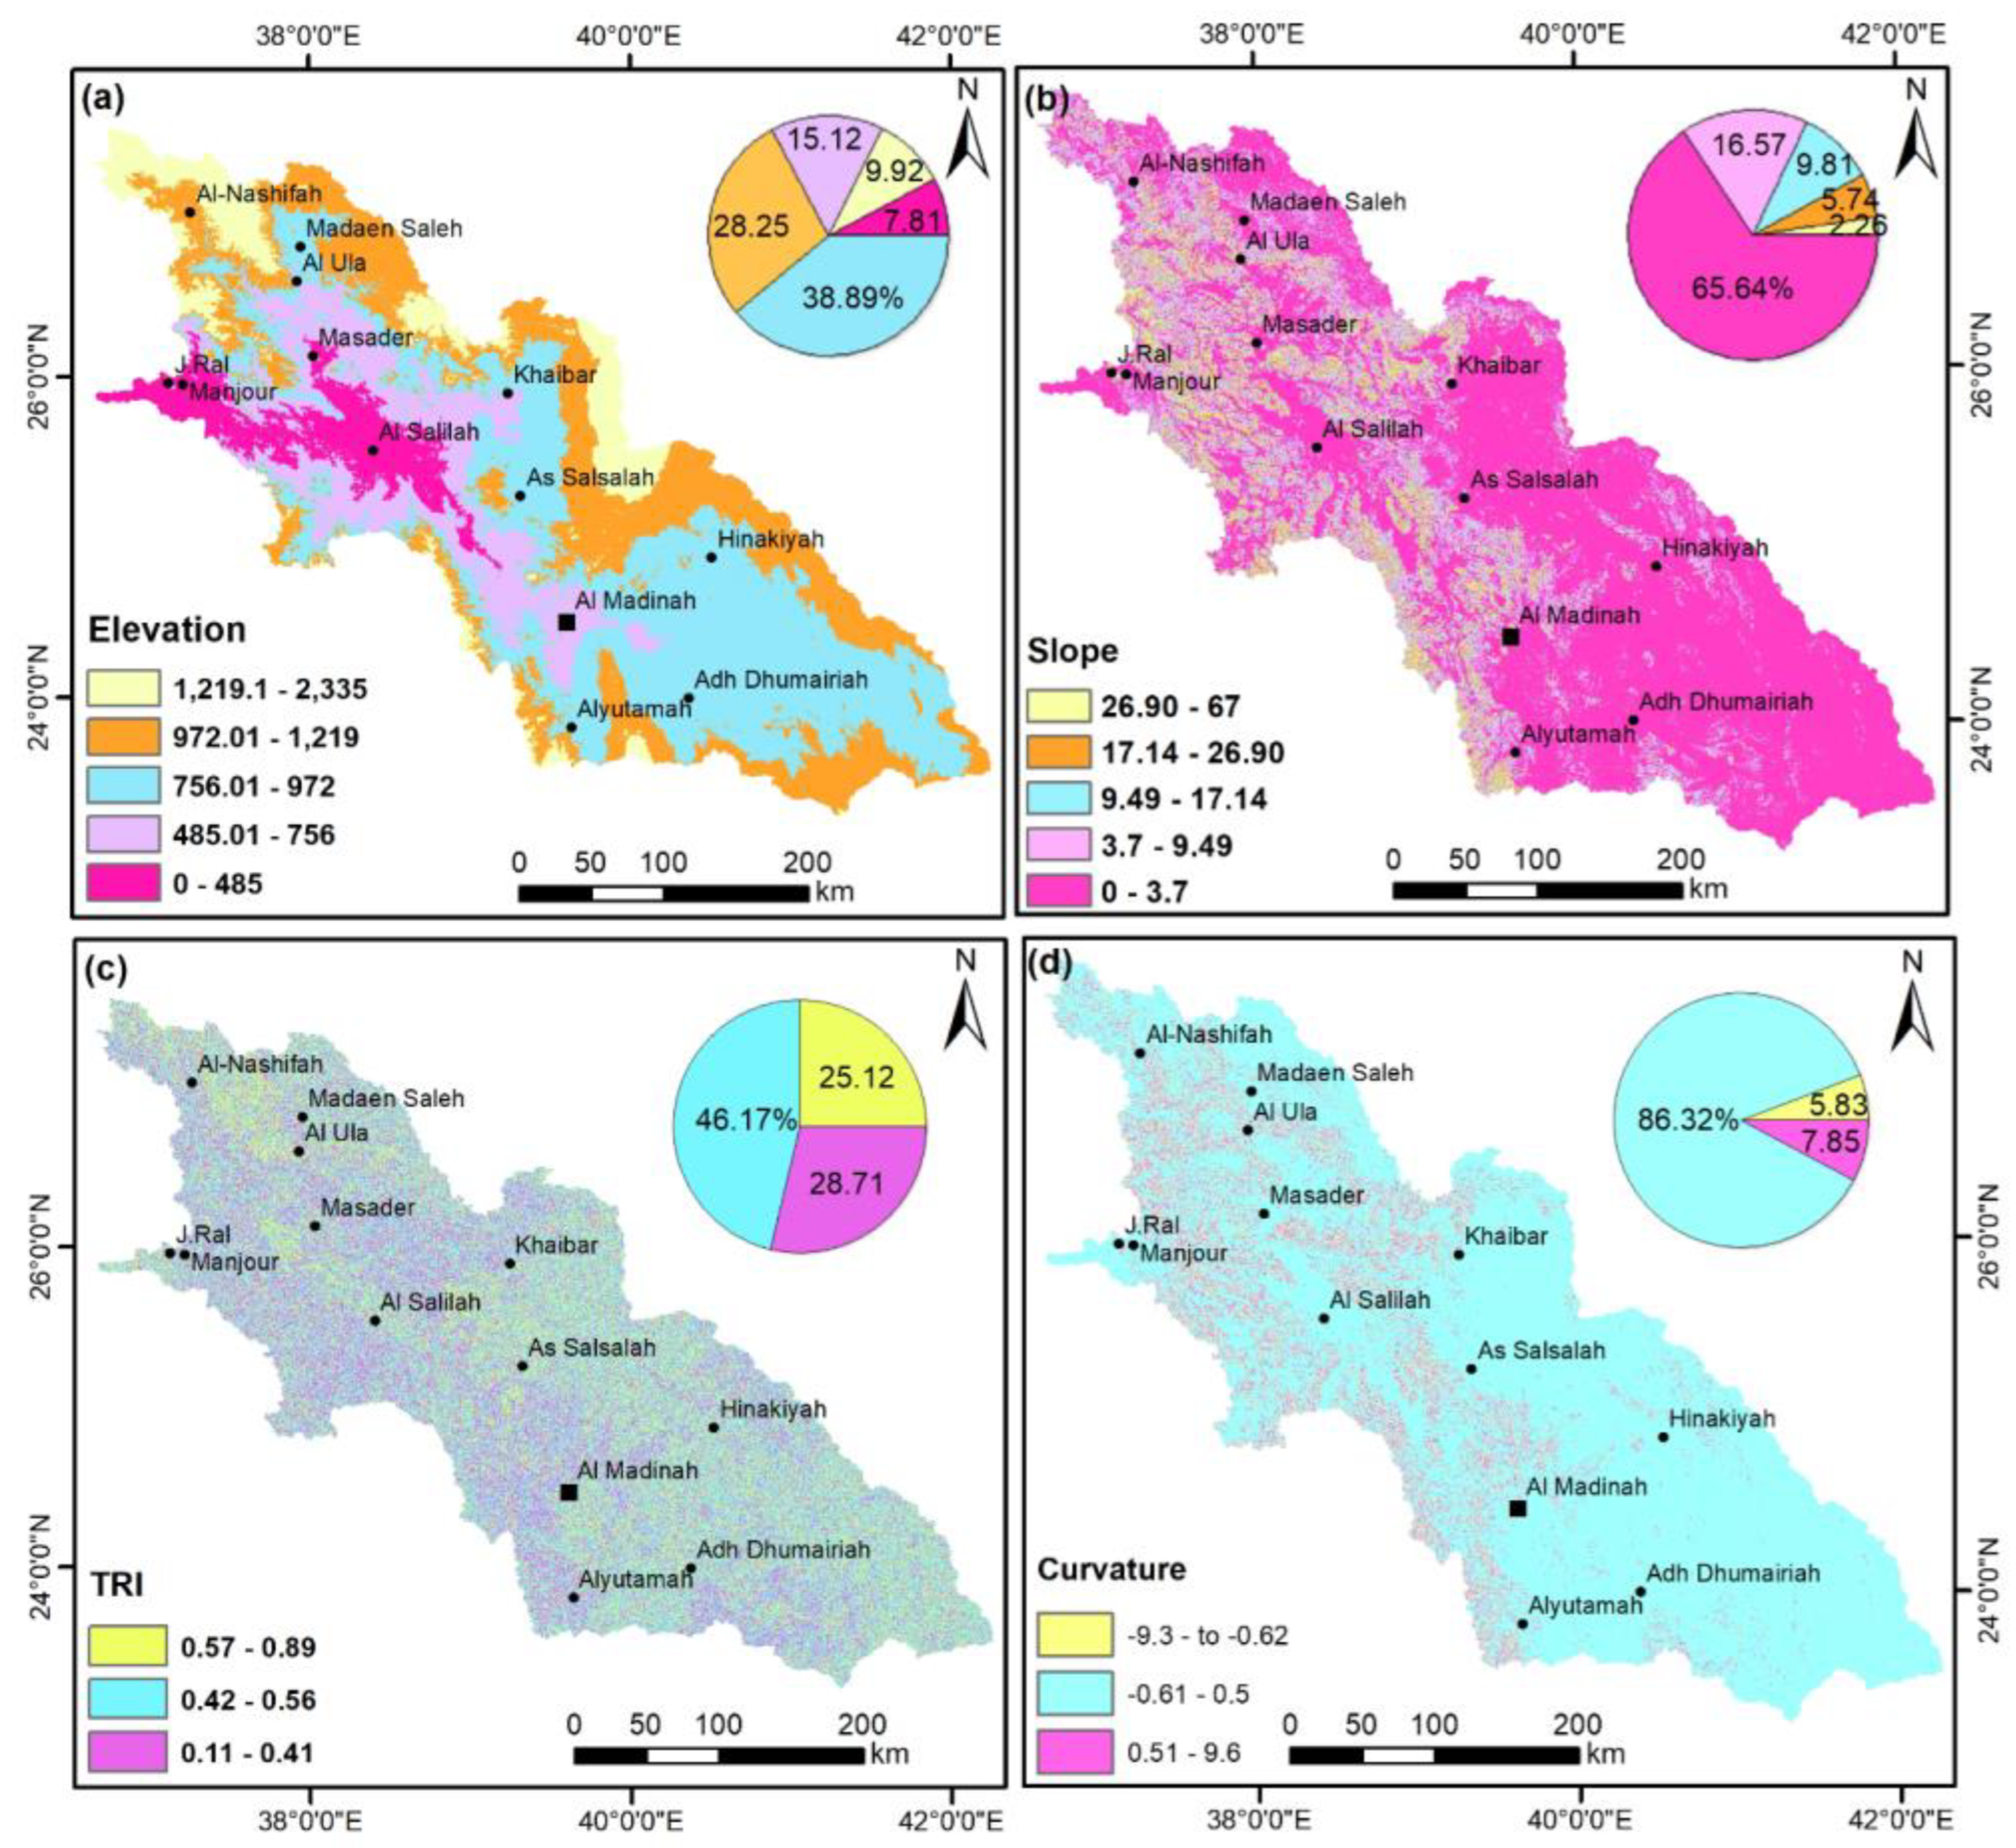
14]. The study area’s elevation map (
Figure 3a) has been divided into five zones: 0–485, 485–756, 756–972, 972–1219, and 1219–2335 m, which cover, respectively, 7.81, 15.12, 38.89, 28.25, and 9.92% of the basin.
4.2. Slope
Slope is a prominent factor that controls groundwater potentiality and has a direct effect on the passage of rainwater [
46]. Additionally, it can act as a broad guide to the direction of groundwater movement [
47]. The amount of groundwater recharge is less at higher, steeper slopes because the water does not have enough time to percolate into the water table, and instead quickly spills over the surface. Conversely, the gentle slope plain areas can discharge the runoff water and increase the groundwater accumulation [
48]. By affecting rates of surface infiltration and runoff as well as subsurface drainage, the slope angle regulates recharge [
49]. The elevation map of the study area (
Figure 3b) has been divided into five zones: 0–3.7, 3.7–9.49, 9.49–17.4, 17.14–26.90, and 26.90–67.25, which cover, respectively, 2.26, 5.74, 9.81, 16.57, and 65.64% of the basin.
4.3. Terrain Roughness Index (TRI)
The terrain roughness index (TRI) is one of the geomorphic features that is related to the occurrence of groundwater potentiality. It was designed to evaluate landscape variability and can be used to explore for groundwater [
50,
51]. This variable can be determined using the following equation:
According to the buildup and infiltration of groundwater, the resulting TRI map was classified into five zones: 0.11 to 0.41 (low), 0.41 to 0.56 (moderate), and 0.56 to 0.89 (high) and 28.71, 46.17, and 25.12% of the basin are taken up by these regions.
4.4. Curvature
The curvature of the land-surface is an important factor in water accumulation, percolation, and runoff [
52,
53]. It serves as a representation of the geometry of the land surface. The curvature layer, which is divided into three kinds: concave, convex, and flat, is produced using the DEM (
Figure 3d). The land surface curvature can be used to locate areas that will capture rainwater runoff. Convex surfaces are less effective in collecting water than curved and flat areas, which also have a higher infiltration rate. An area with a high value of curvature is considered of high-grade value because water prefers to occur on flat and concave land surfaces [
53]. The results were divided into three categories: low (−9.3 to −0.62), moderate (−0.61 to −0.5), and high (0.51–9.6).
4.5. Drainage Density (Dd)
The Dd is one of the key indications of both the incidence and replenishment of groundwater [
54]. It is the sum of all drainages in a basin divided by the sum of all its areas [
55]. The Dd shows how the formation of the surface to the subsurface is distinct and it alludes inadvertently to the soil properties that determine soil infiltration ability [
56]. Areas with low drainage density have higher levels of penetration and lower levels of runoff [
16]. This implies that areas with lower drainage density are favorable for groundwater infiltration and productivity [
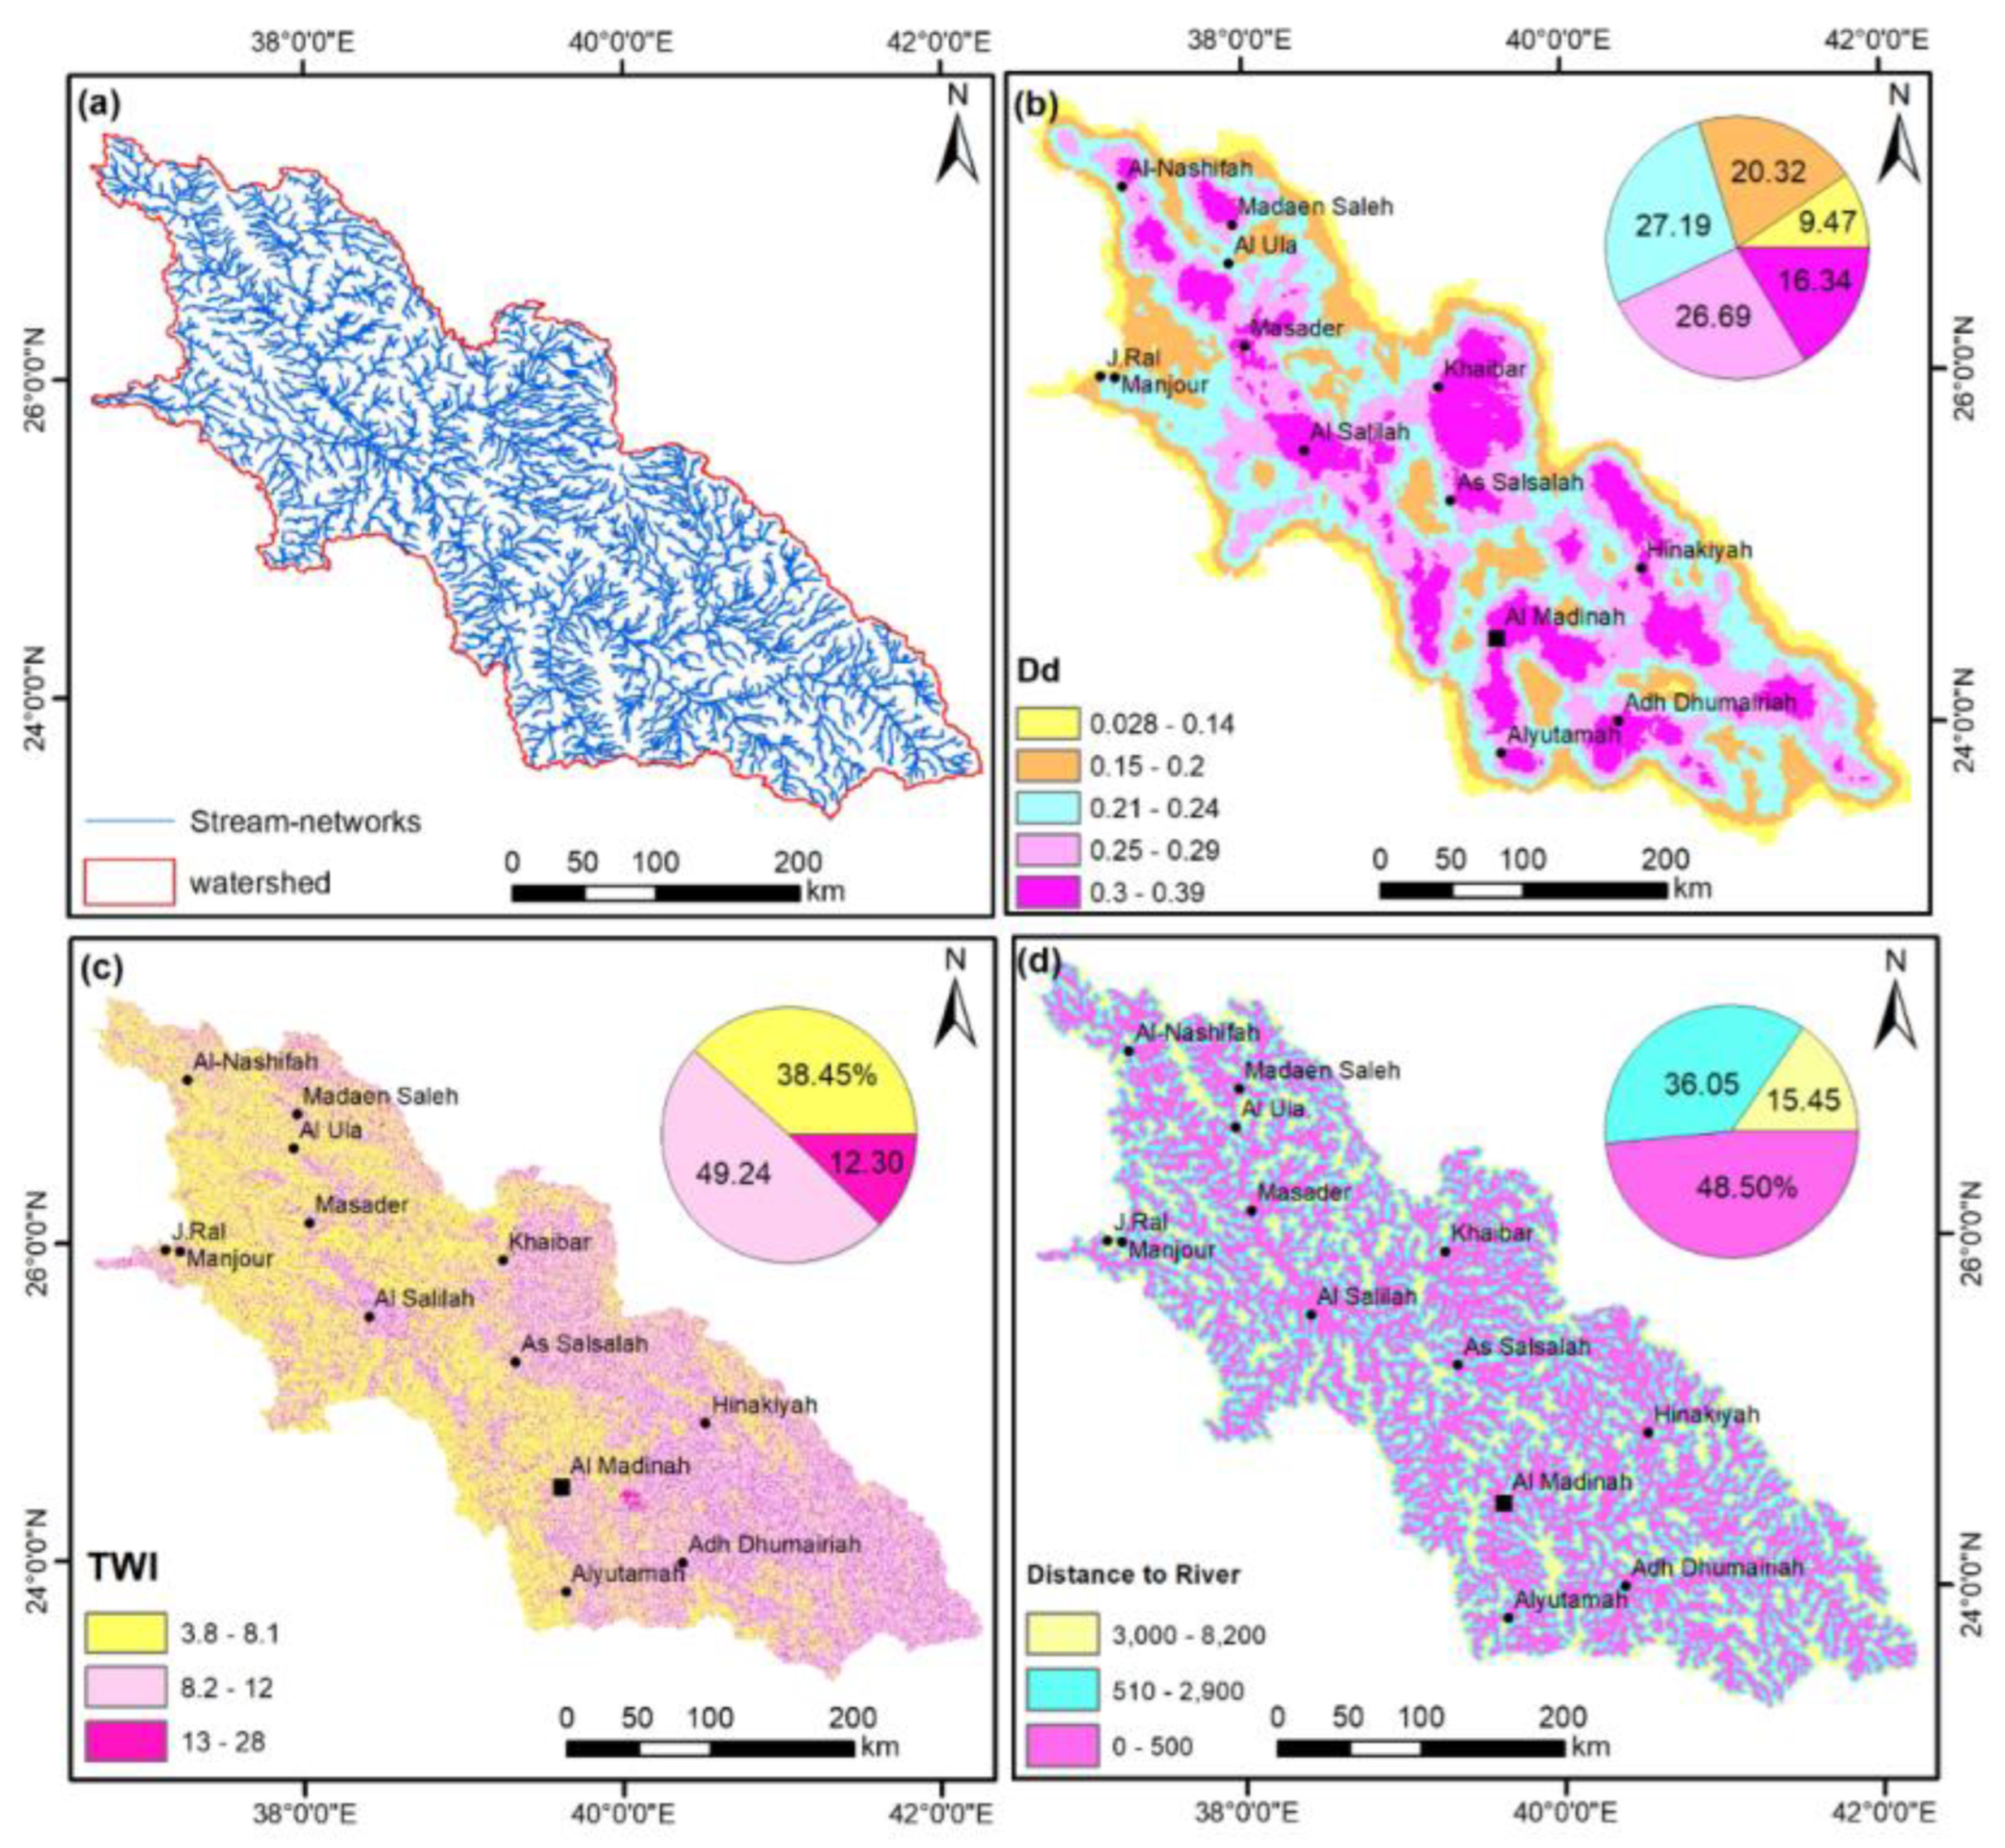
57]. Therefore, the automatically extracted stream-networks (
Figure 4a) in the study area are grouped into five classes: 0.028–0.14, 0.15–0.2, 0.21–0.24, 0.25–0.29, 0.30–0.39 that cover 9.47, 20.32, 27.19, 26.69, and 16.34, respectively (
Figure 4b).
4.6. Topographic Wetness Index (TWI)
The
TWI is one of the crucial secondary terrain parameters that determine the availability of groundwater [
58]. TWI identifies the connection-relationship between earth surface wetness and slope variation [
59]. This index depicts how geography affects the amount of water that accumulates in an area. Therefore, steep slopes and higher elevations have more runoff, which reduces their ability for water storage. In contrast, low-lying areas have more ability for topographical wetness or water storage in the studied region [
60]. The results of the TWI map were divided into three categories: low (3.8 to 8.1), moderate (8.1 to 12), and high (12 to 28), covering areas of 38.45, 49.24, and 12.30%, respectively (
Figure 4c).
4.7. Distance to River
Groundwater recharge in arid and mountainous terrain primarily results from infiltration from streams [
61] during rainstorms. The separations between sites and streams are crucial signs indicating the possibility of groundwater extraction [
62]. Groundwater recharge often declines the farther distance it is from streams. Therefore, the bedrock reservoirs in valleys contribute through stream leakage [
58]. We used the Euclidean distance tool from the spatial analyst tools in Arc GIS 10 to extract the distance to river categories [
21]. The resulted map (
Figure 4d) is classified into three classes are 0–500, 500–2900, 2900–8200, which cover 15.45, 36.05, and 48.50, respectively.
4.8. Lithology
Rock units have a direct correlation to recharge capability, where each type has a unique water body and rate of water recharge [
63]. Porosity, permeability, and groundwater flow within the surface material are all impacted by the many forms of lithology and their properties, including texture and pore spaces [
9,
24,
64]. Due to its recent deposition, higher permeability, and higher productivity, the Quaternary alluvial has good promise [
65,
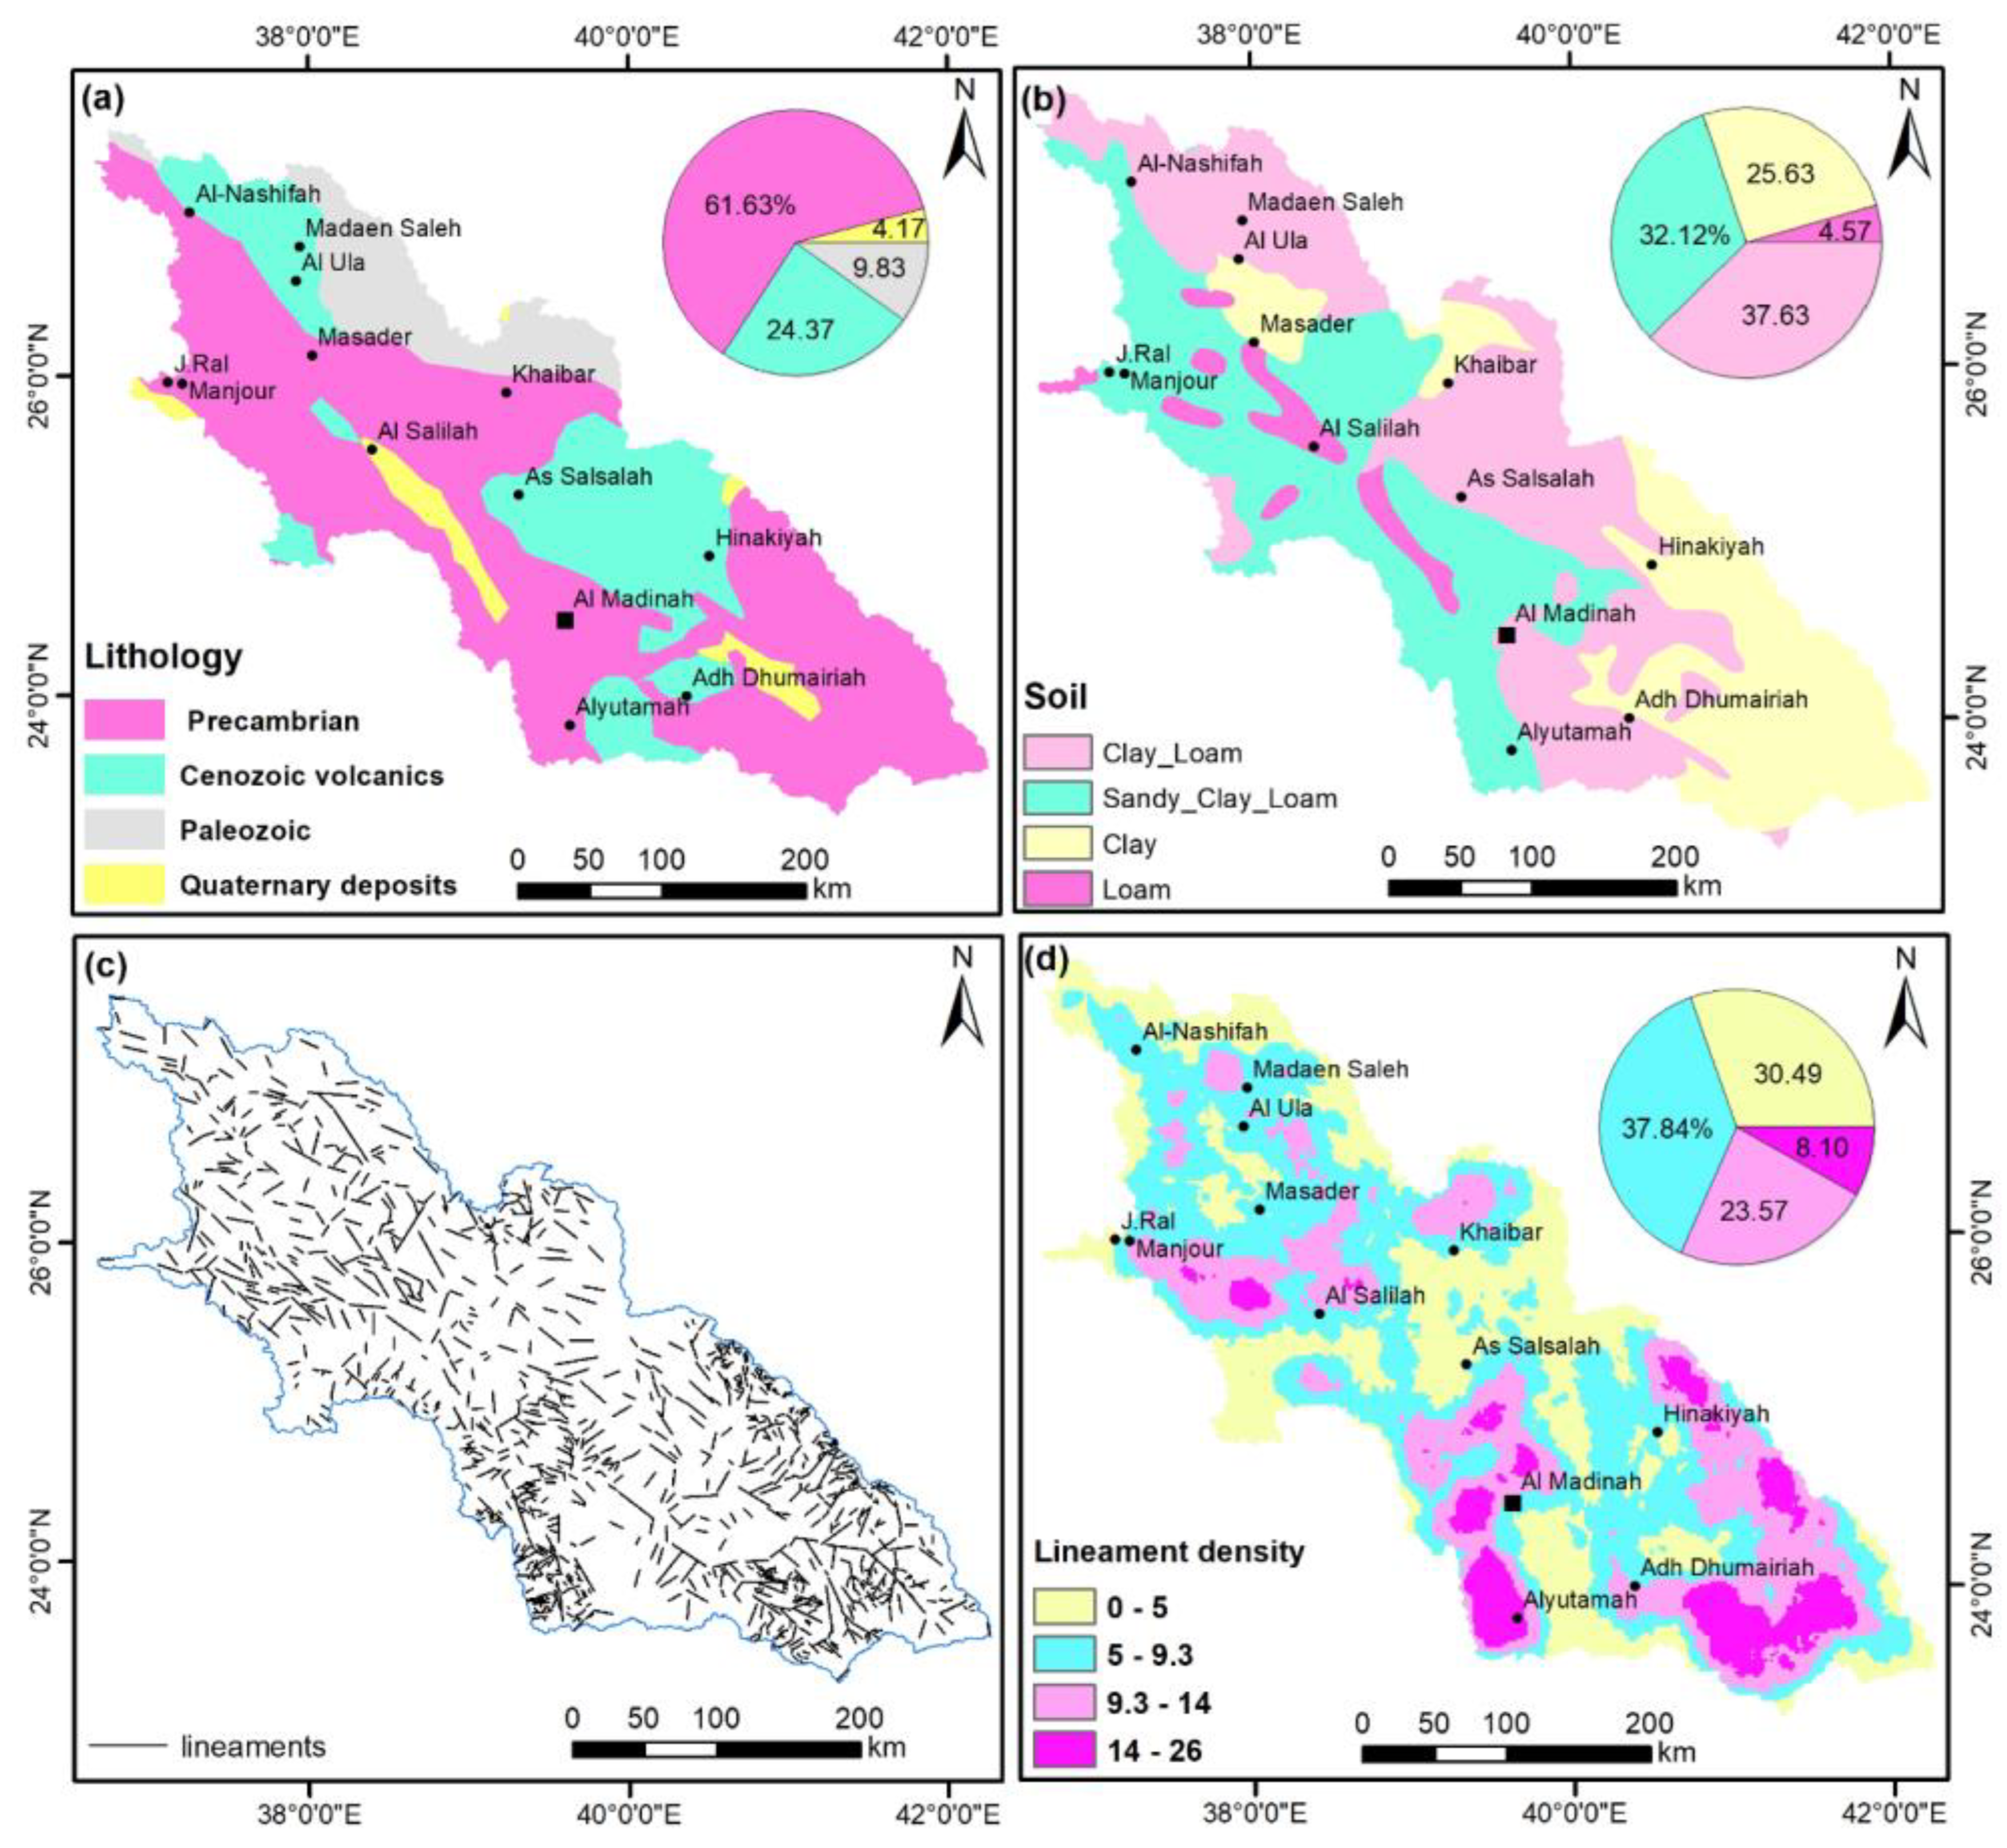
66]. Therefore, the studied basin is classified into Precambrian, Cenozoic volcanics, Paleozoic sediments, and Quaternary deposits, which cover 61.63, 24.37, 9.83, and 4.17, respectively. It is noteworthy that Precambrian and Cenozoic volcanics cover most of the study area (
Figure 5a).
4.9. Soil
Soil is a key geomorphological component of the porosity, permeability, and geometry of rocks. Hence, it represents an important factor in delineating the GPZs of a region. The amount of flow and infiltration is significantly influenced by the soil type [
57]. Water movement can be significantly impacted by the size, shape, and arrangement of soil grains as well as their associated pore-systems [
67]. Therefore, soil texture has a direct impact on porosity and permeability. Due to its permeability and porosity, fine-grained soil of a well sorted material such as sand has a lower rate of infiltration than coarse-grained soil [
68]. Considering that sandy soil has a high rate of penetration, coarser loamy soil with a high sand content has been given higher priority. In the meantime, fine soil with a lower infiltration rate due to a higher clay content has been given low priority [
69]. The studied basin is occupied by clay loam, sandy clay loam, clay, and loam. These cove 37.63, 32.12, 25.63, and 4.57% of the area, respectively (
Figure 5b).
4.10. Lineaments
Deeper geological structures, such as faults, fractures, and ruptures with no discernible fracture displacement can be observed as lineaments on the surface of the earth’s crust [
70,
71]. They serve as a conduit for the movement of groundwater, which results in an increase in secondary porosity and can therefore be used to identify potential groundwater zones [
72]. Significant groundwater prospects could exist in a high-lineament density location. Lineaments offer crucial knowledge about surface and subsurface fracture systems, which may regulate the circulation and collection of groundwater [
71,
73,
74]. This has been applied to identify possible locations for runoff water collection [
75,
76] and the distribution of groundwater resources. Higher lineament densities indicate permeability regions, which suggest promising regions for groundwater potential [
71,
77]. The lineaments (
Figure 5c) of the studied basin were digitized from the Landsat and SRTM data, then they were converted to a lineament density map using Spatial Analyst of ArcGIS. The lineament density map is classified into four classes which are 0–5, 5–9.3, 9.3–14, 14–26, which cover 30.49, 37.84, 23.57, and 8.10%, respectively (
Figure 5d).
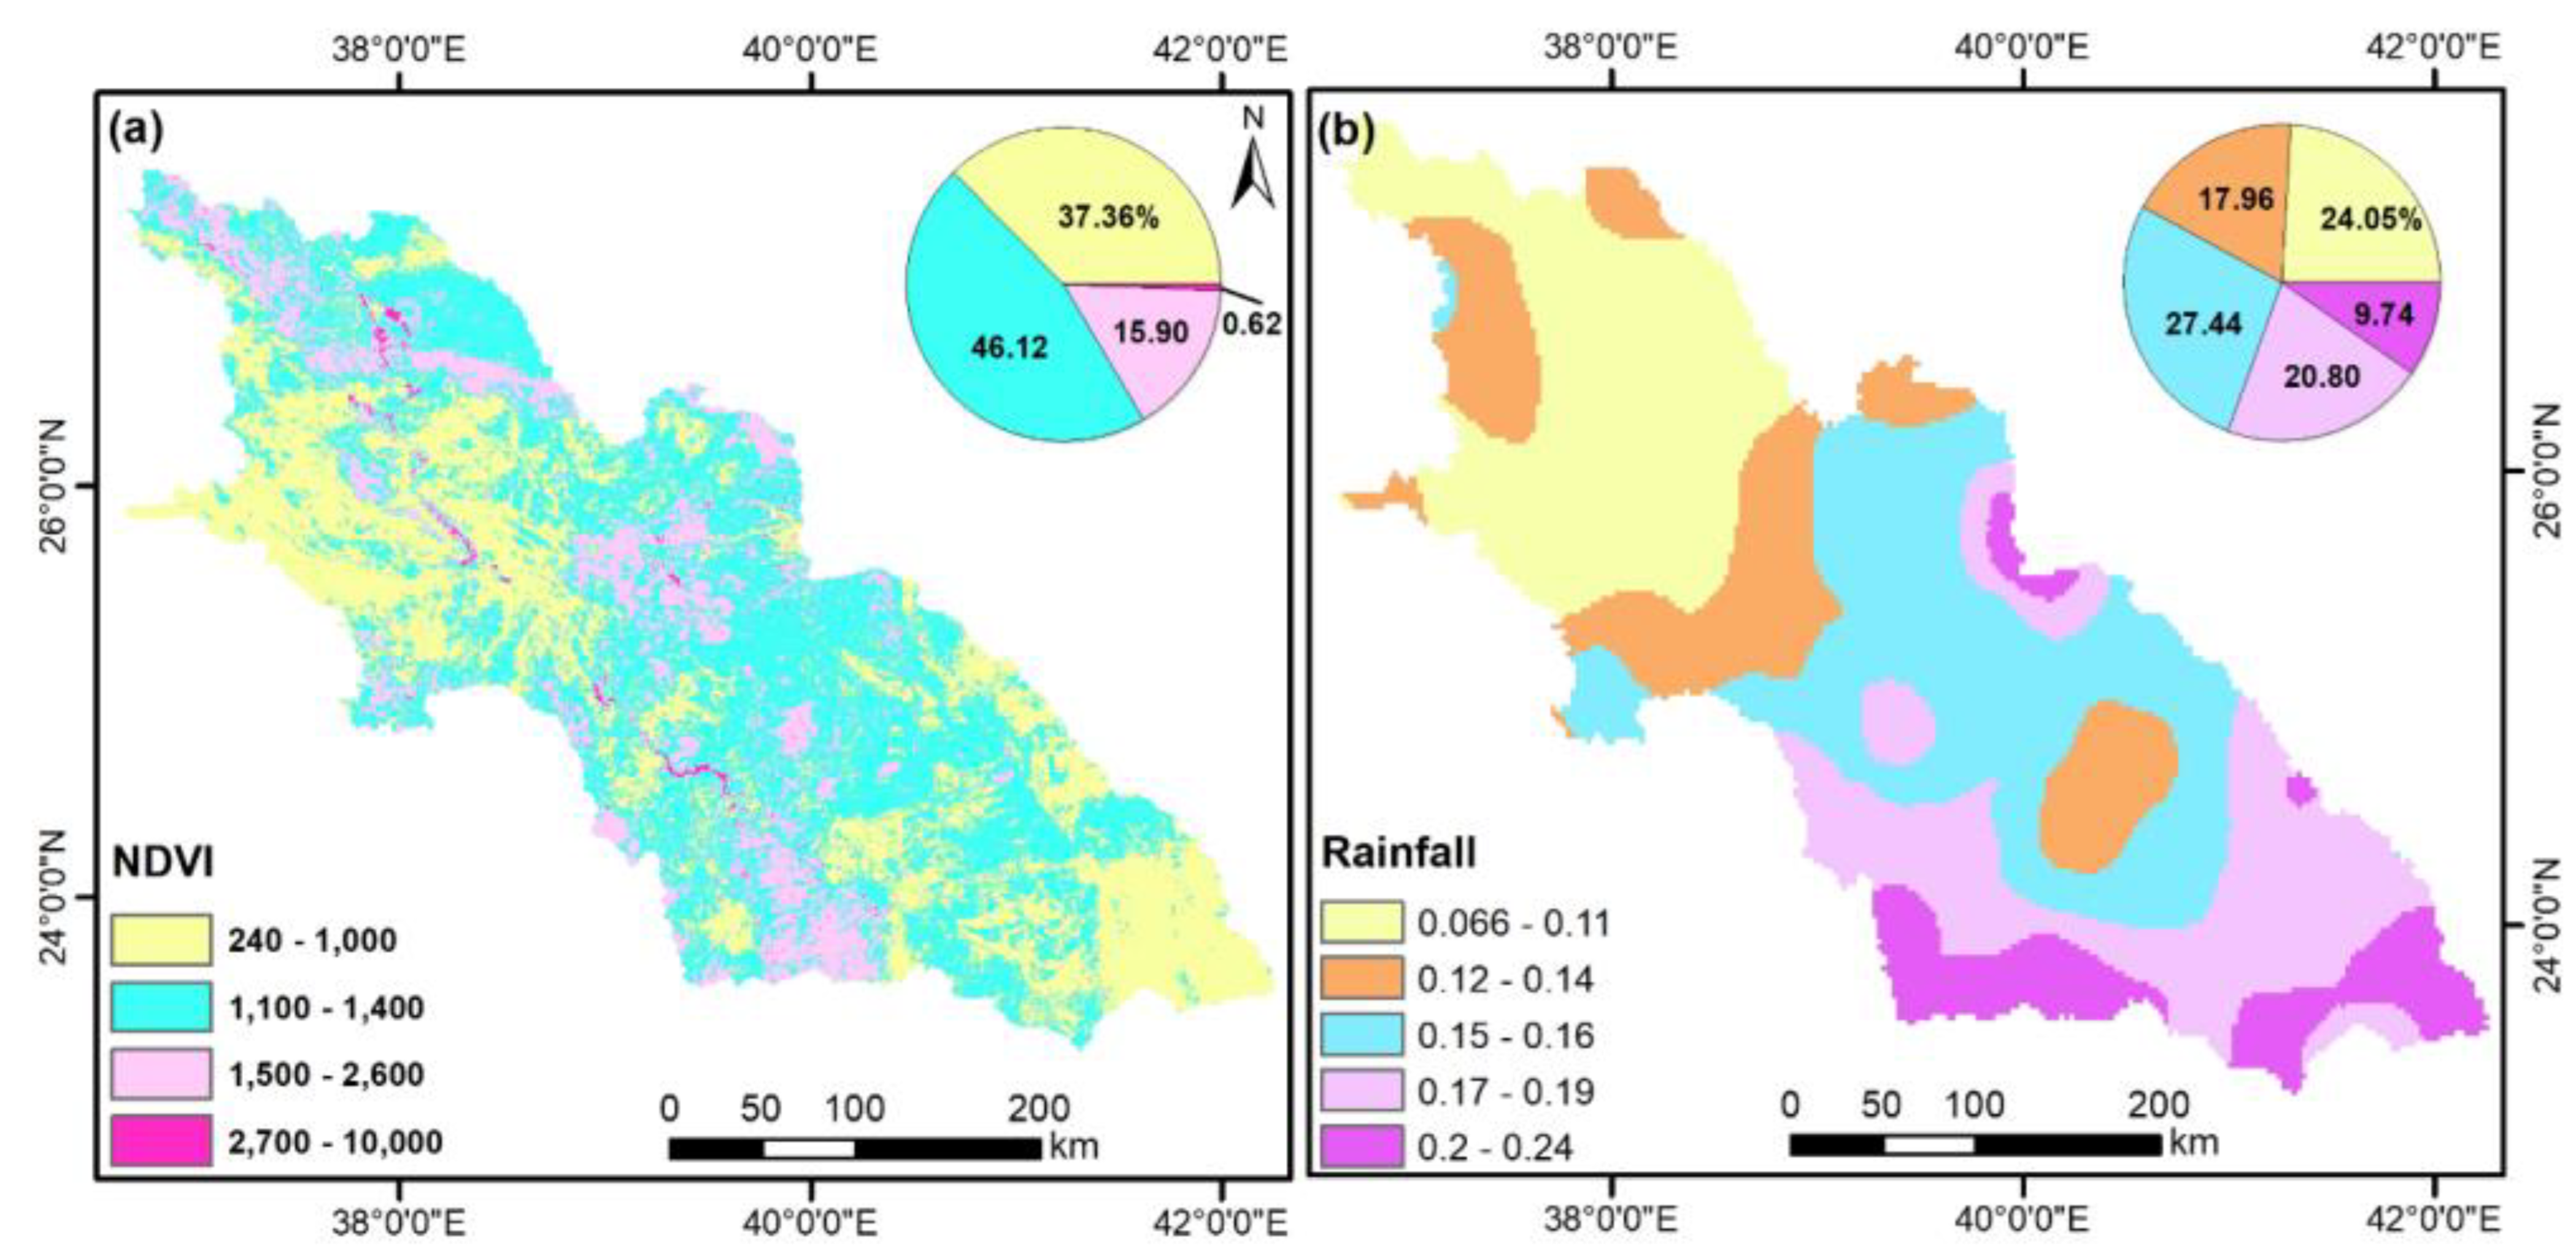
4.11. NDVI
The NDVI is a frequently used factor for groundwater potential zones [
56,
78]. The NDVI map was utilized to show the vegetation coverage and density. The NDVI layer was derived from data of the Advanced Very High-Resolution Radiometer (AVHRR). The NDVI ranges from −1 to 1, commonly referred to as 240 to 10,000; a higher NDVI value denotes dense vegetation. The NDVI result map of the study area ranges from 240 to 10,000 and is classified into four classes based on the natural break method which are 240–1000, 1000–1400, 1400–2600, and 2600–10,000, respectively (
Figure 6a), and these cover areas of 37.36, 46.12, 15.90, and 0.62% of the area, respectively (
Table 1).
4.12. Rainfall Data (TRMM)
Water availability in a network is defined by rainfall patterns. Thus, the amount of rainfall is one of the crucial factors in identifying groundwater potential zones and is the hydrologic method of recharging aquifers [
54]. Rainfall causes a particular land area’s likelihood of having groundwater to rise [
79]. Using rainfall information from the TRMM data, researchers may monitor, record, and measure the downpour rates within the examined watershed. The main sources of groundwater are infiltration and drainage from precipitation. It is the primary natural recharge source that initiates groundwater supplies [
19,
80]. The rainfall intensity map was classified into five classes which are 0.066–0.11, 0.11–0.14, 0.15–0.16, 0.16–0.19, and 0.20–0.24, which cover 24.05, 17.96, 27.44, 20.80, and 9.74, respectively (
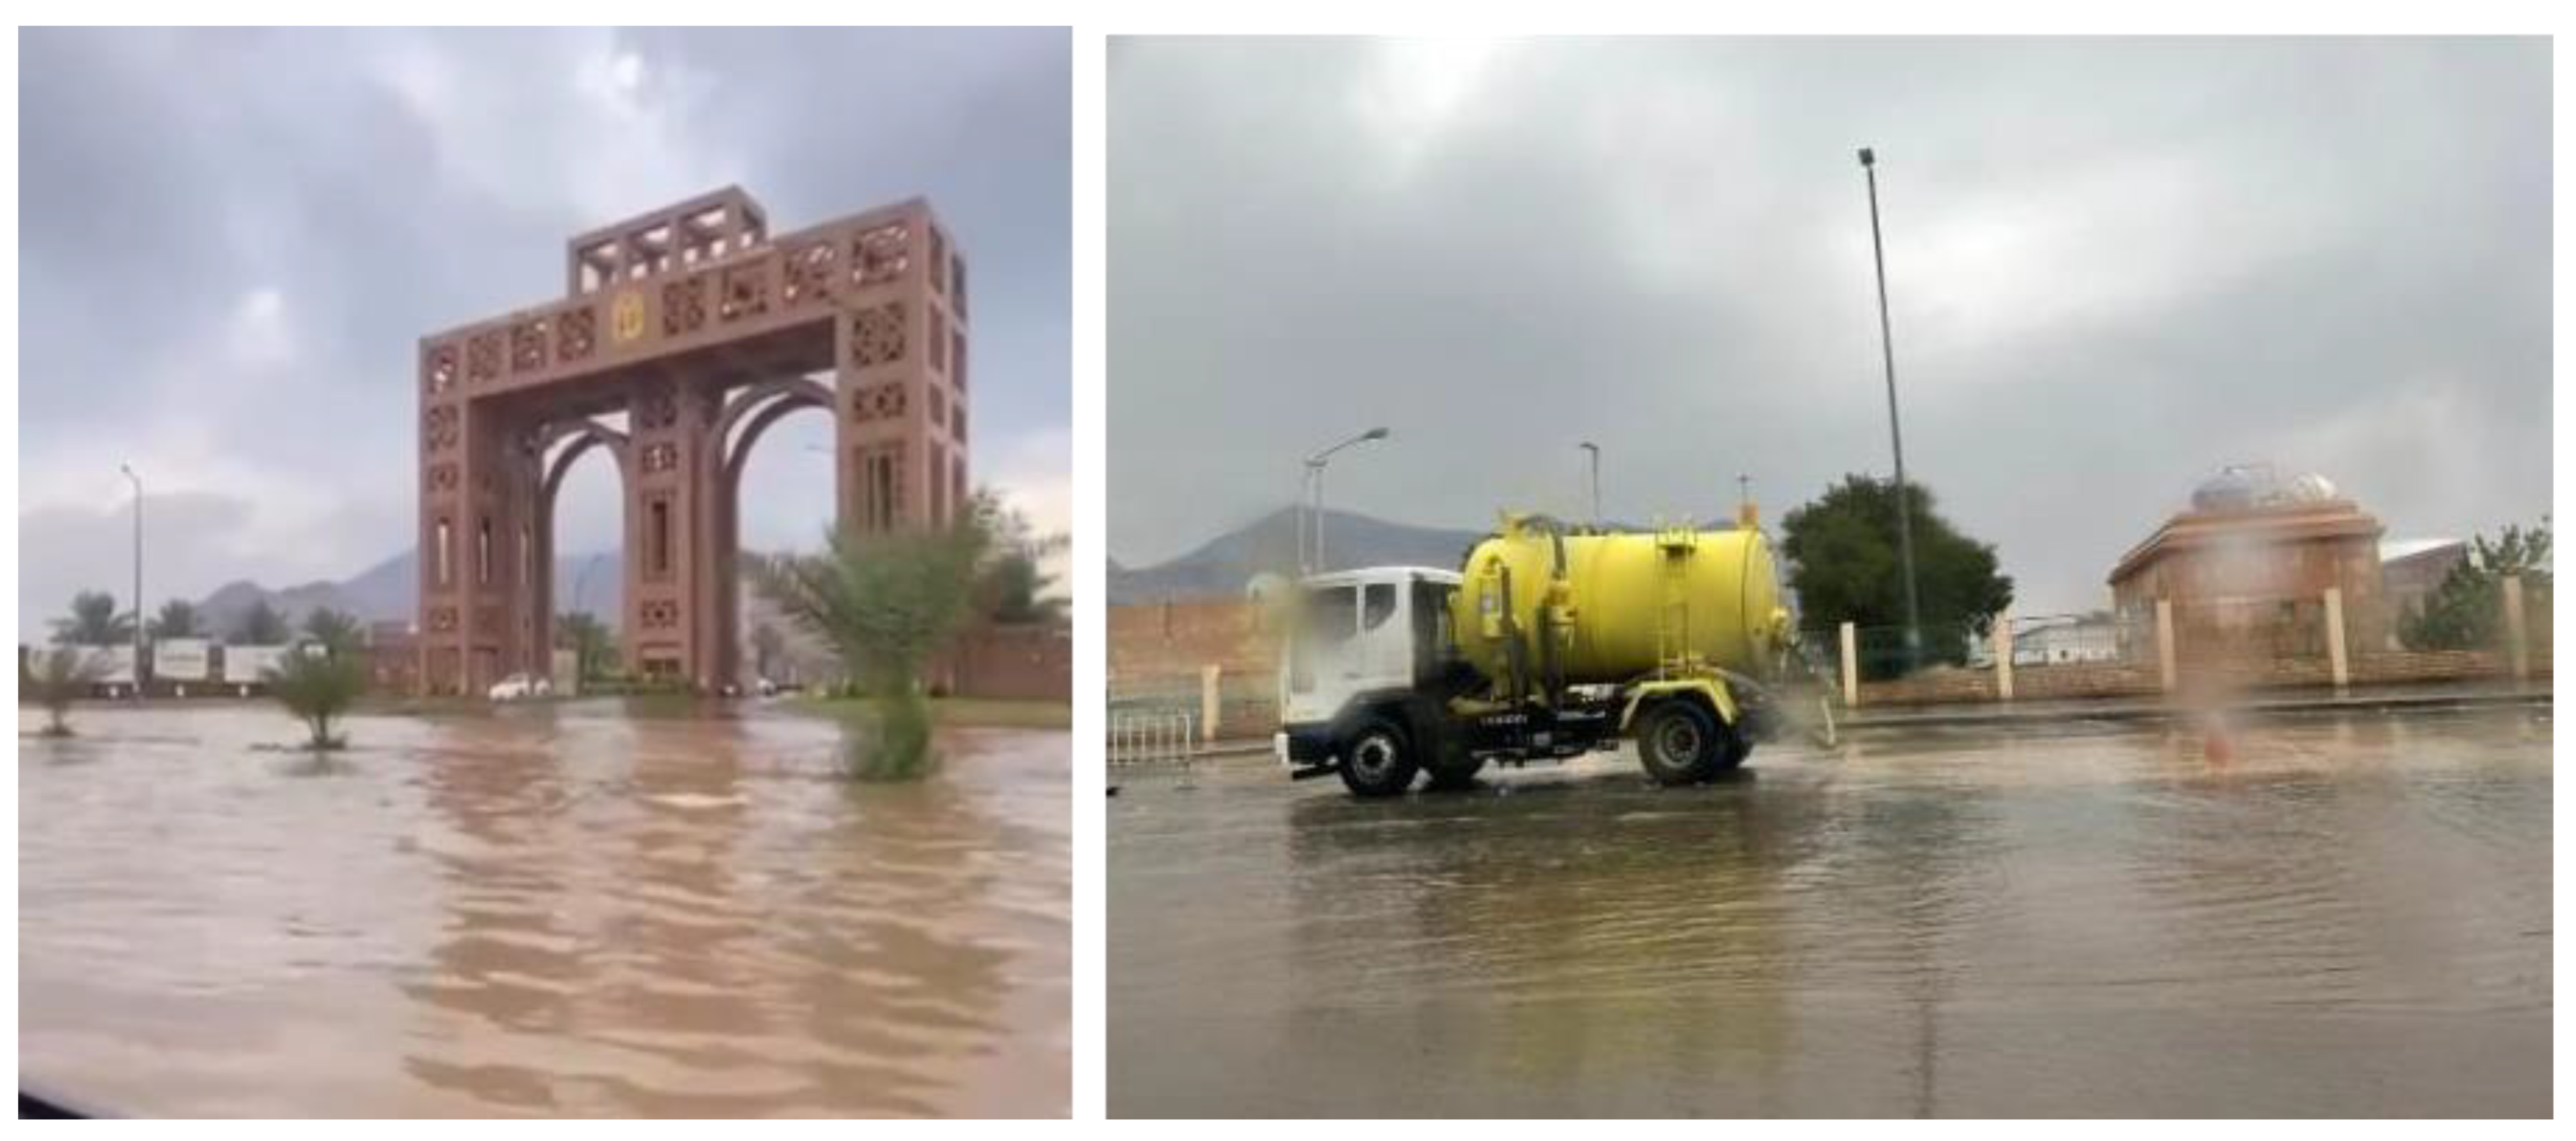
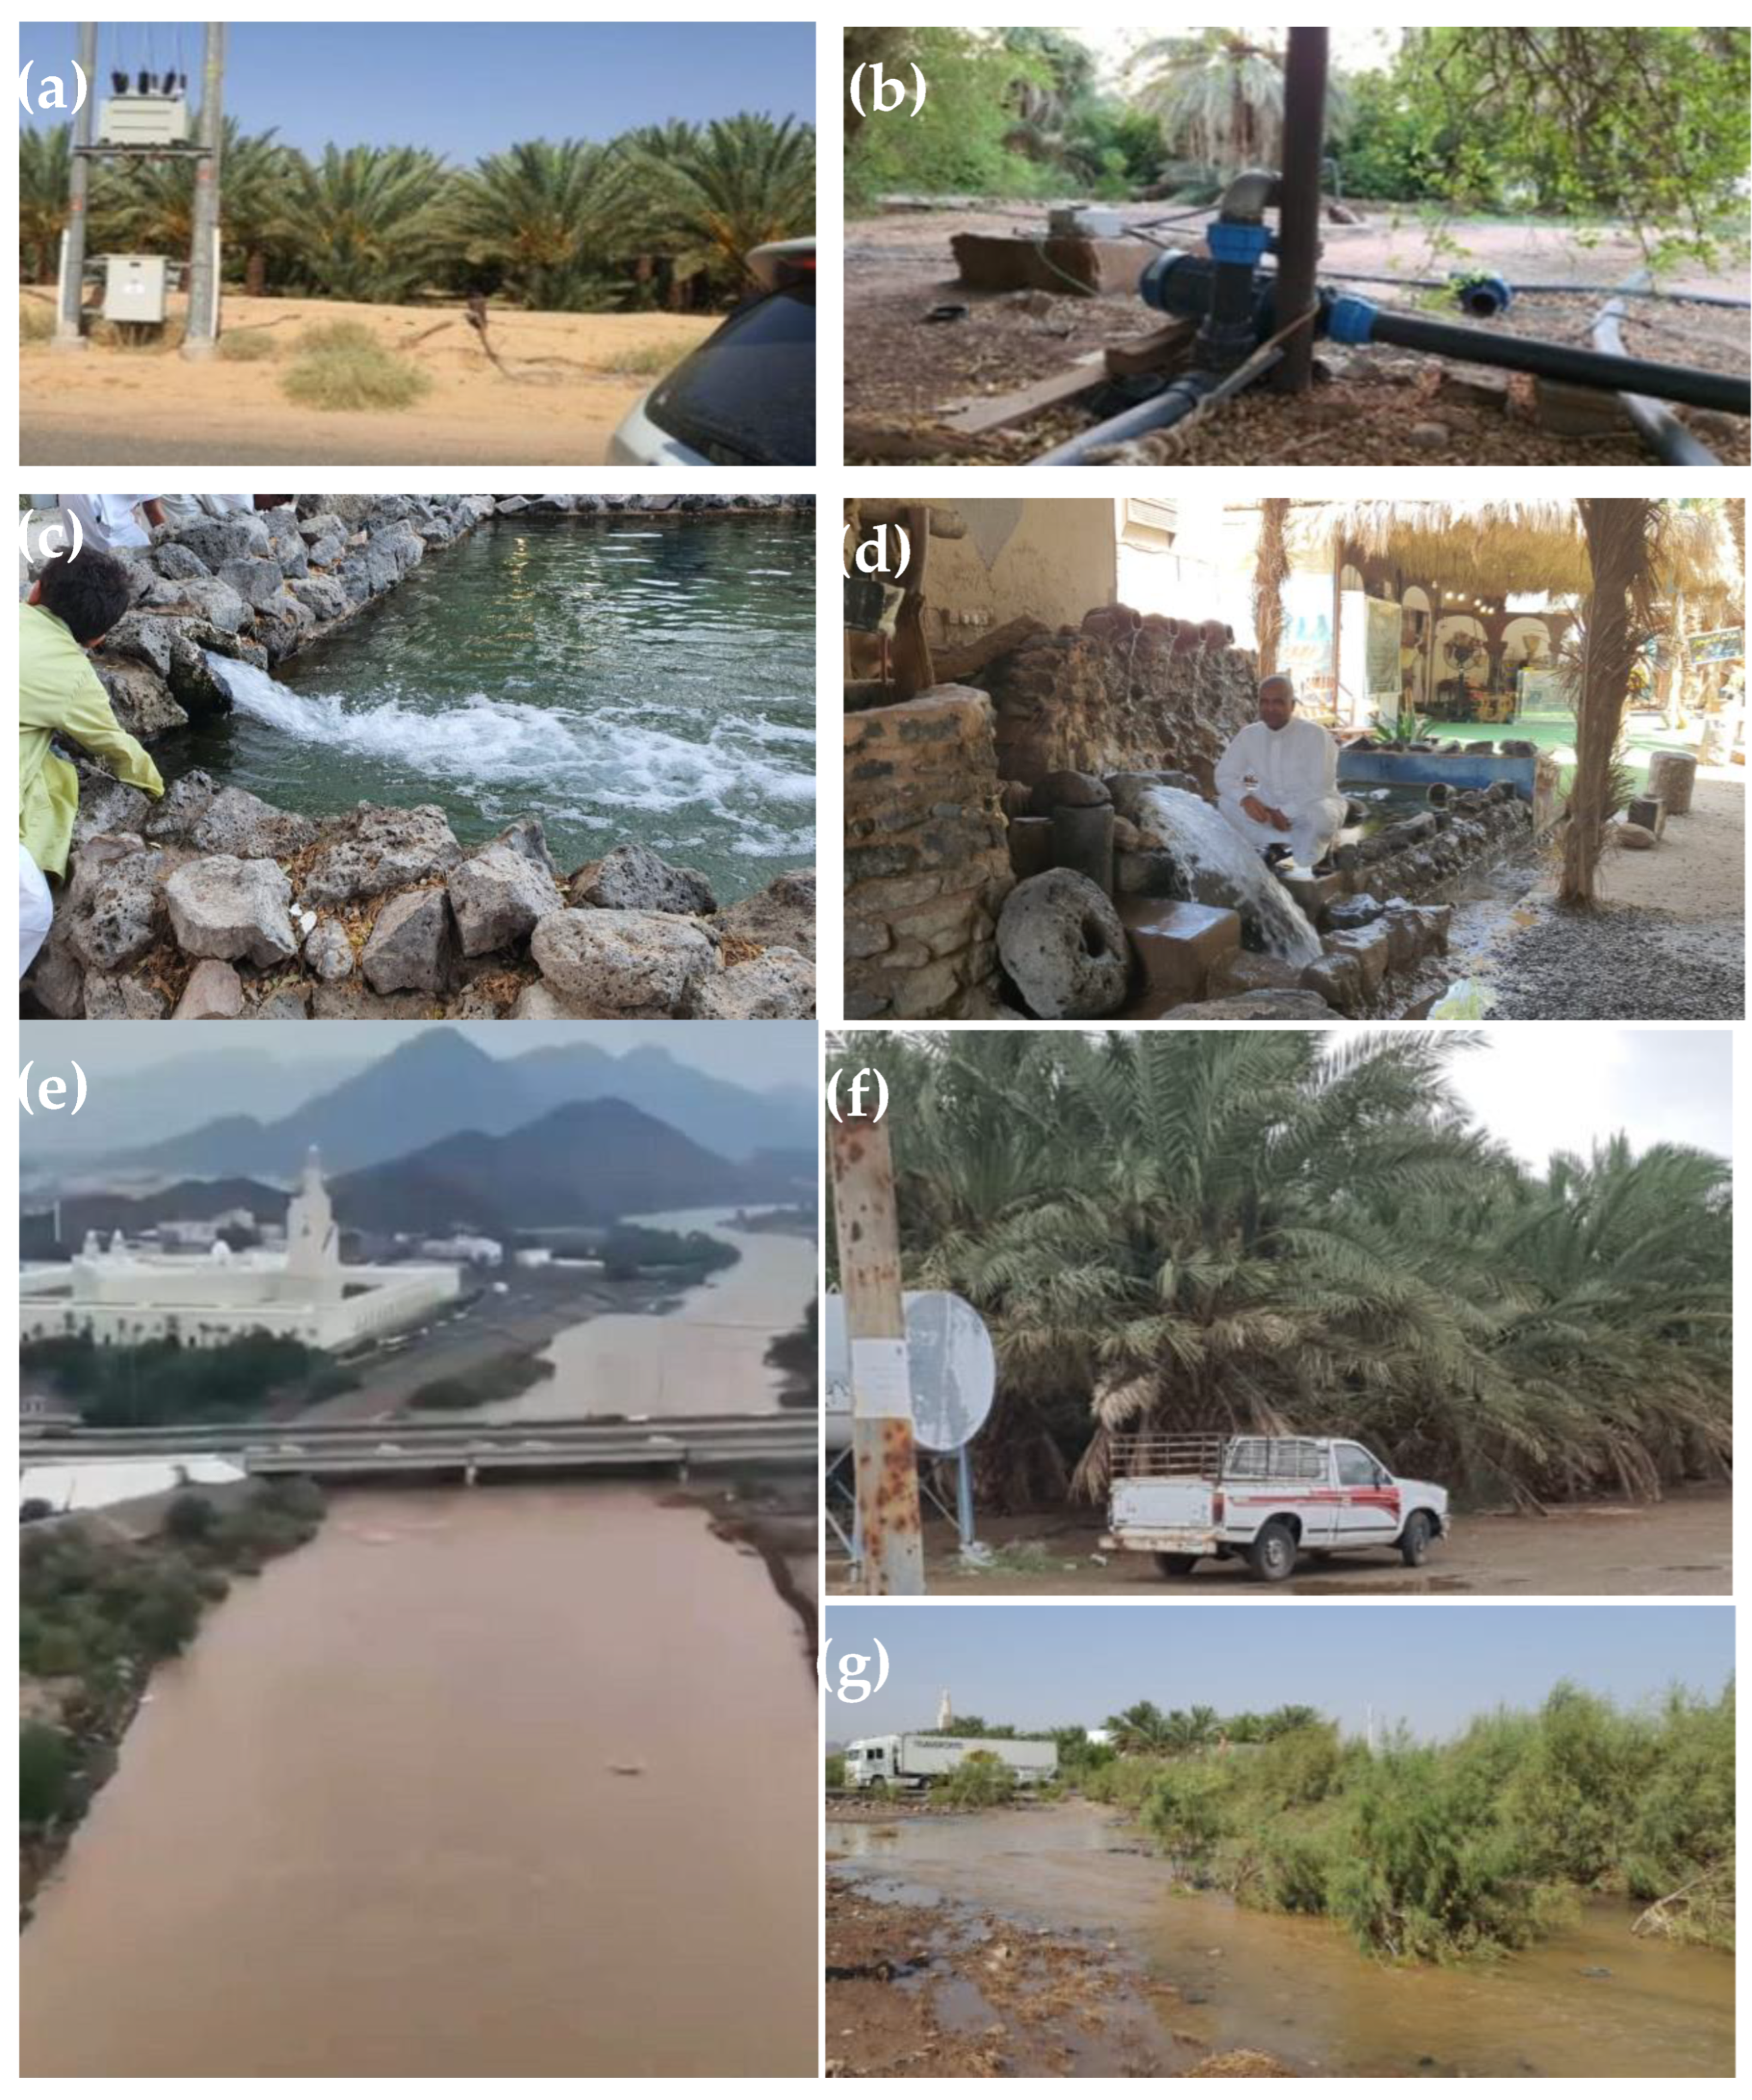
Figure 6b). Rainfall allows accumulation that facilitates groundwater infiltration, which replenishes the shallow acquirers (
Figure 7), as the area was recently hit by rainfall storms.
5. Groundwater Potential Mapping
Utilizing the FR model, we determined the locations of the wells (nearness for the groundwater) and the controlling factors (
Table 1). FR values below 1 are thought to suggest weak correlations, while those above 1 are thought to show strong correlations [
26,
81]. The highest FRs were found in the elevation classes from 485–756 (3.30), followed by those from 0 to 485 (1.47), but the lowest FR was found in the elevation classes from 1219 to 2335 (0.03). This was the case for areas with lower elevation which are more likely to hold groundwater than higher elevation [
16]. This correlated with areas of low slope that positively related to high groundwater potential. The areas with slopes from 0 to 3.7 had high FRs (1.29) but steep slopes 26.9–67.25 (0.28). Noteworthy, areas with lower TRIs (from 0.11 to 0.41) have the highest FR’s values (1.15) that are followed by 0.57–0.89 (1.14) but the class of 0.42–0.56 (0.83) is the lowest (
Table 1). Additionally, the curvature class −0.62 to 0.5 is the highest value, 1.103, that almost reveals areas that are almost flat, but areas of highest curvature displayed a low FR value (0.244).
The Dd classes display a positive correlation and steady increase with the FR values (
Table 1). The zones with high Dd values (from 0.3 to 0.39) have greater FRs (2.38), whereas the regions with low Dd values have the lowest FRs (
Table 1). Likewise, the TWI classes with higher values reveal higher FR values e.g., from 3.87 to 8.1 (FR = 0.53), followed by the TWI classes from 8.2 to 12 (FR = 1.20) and from 13 to 28 (FR = 1.66). Additionally, the values of the FR show a negative association as river distance increases. From 0 to 500, the locations closest to the rivers had the highest FRs (1.7), whilst the locations further away from the rivers had poor potentiality (FR = 0.165).
In terms of geologic characteristics, the Precambrian rocks display a high FR value (1.13) that is followed by Cenozoic volcanics (1.04), and Quaternary deposits (0.84), but the Paleozoic rock unit has the lowest (0.16). Loam, and clay loam classes have the highest, 3.43 and 1.20, respectively, but clay soil is the lowest (0.47). Furthermore, the higher the lineament density values, the higher the FR values, e.g., 0 to 5 (FR = 0.656; lowest) but 15–26 (FR = 5.34; the highest). The NDVI class displays a strong positive correlation with FR values. The NDVI classes with higher values, 2639–10,000, have FR = 42.54, but with low NDVIs from 235 to 1043 have the lowest (FR = 0.27). In terms of the rainfall classes, the areas that received from 0.17 to 0.19 mm/day had the highest FR value (1.46), followed by those that received from 0.066 to 0.11 mm (FR = 1.34).
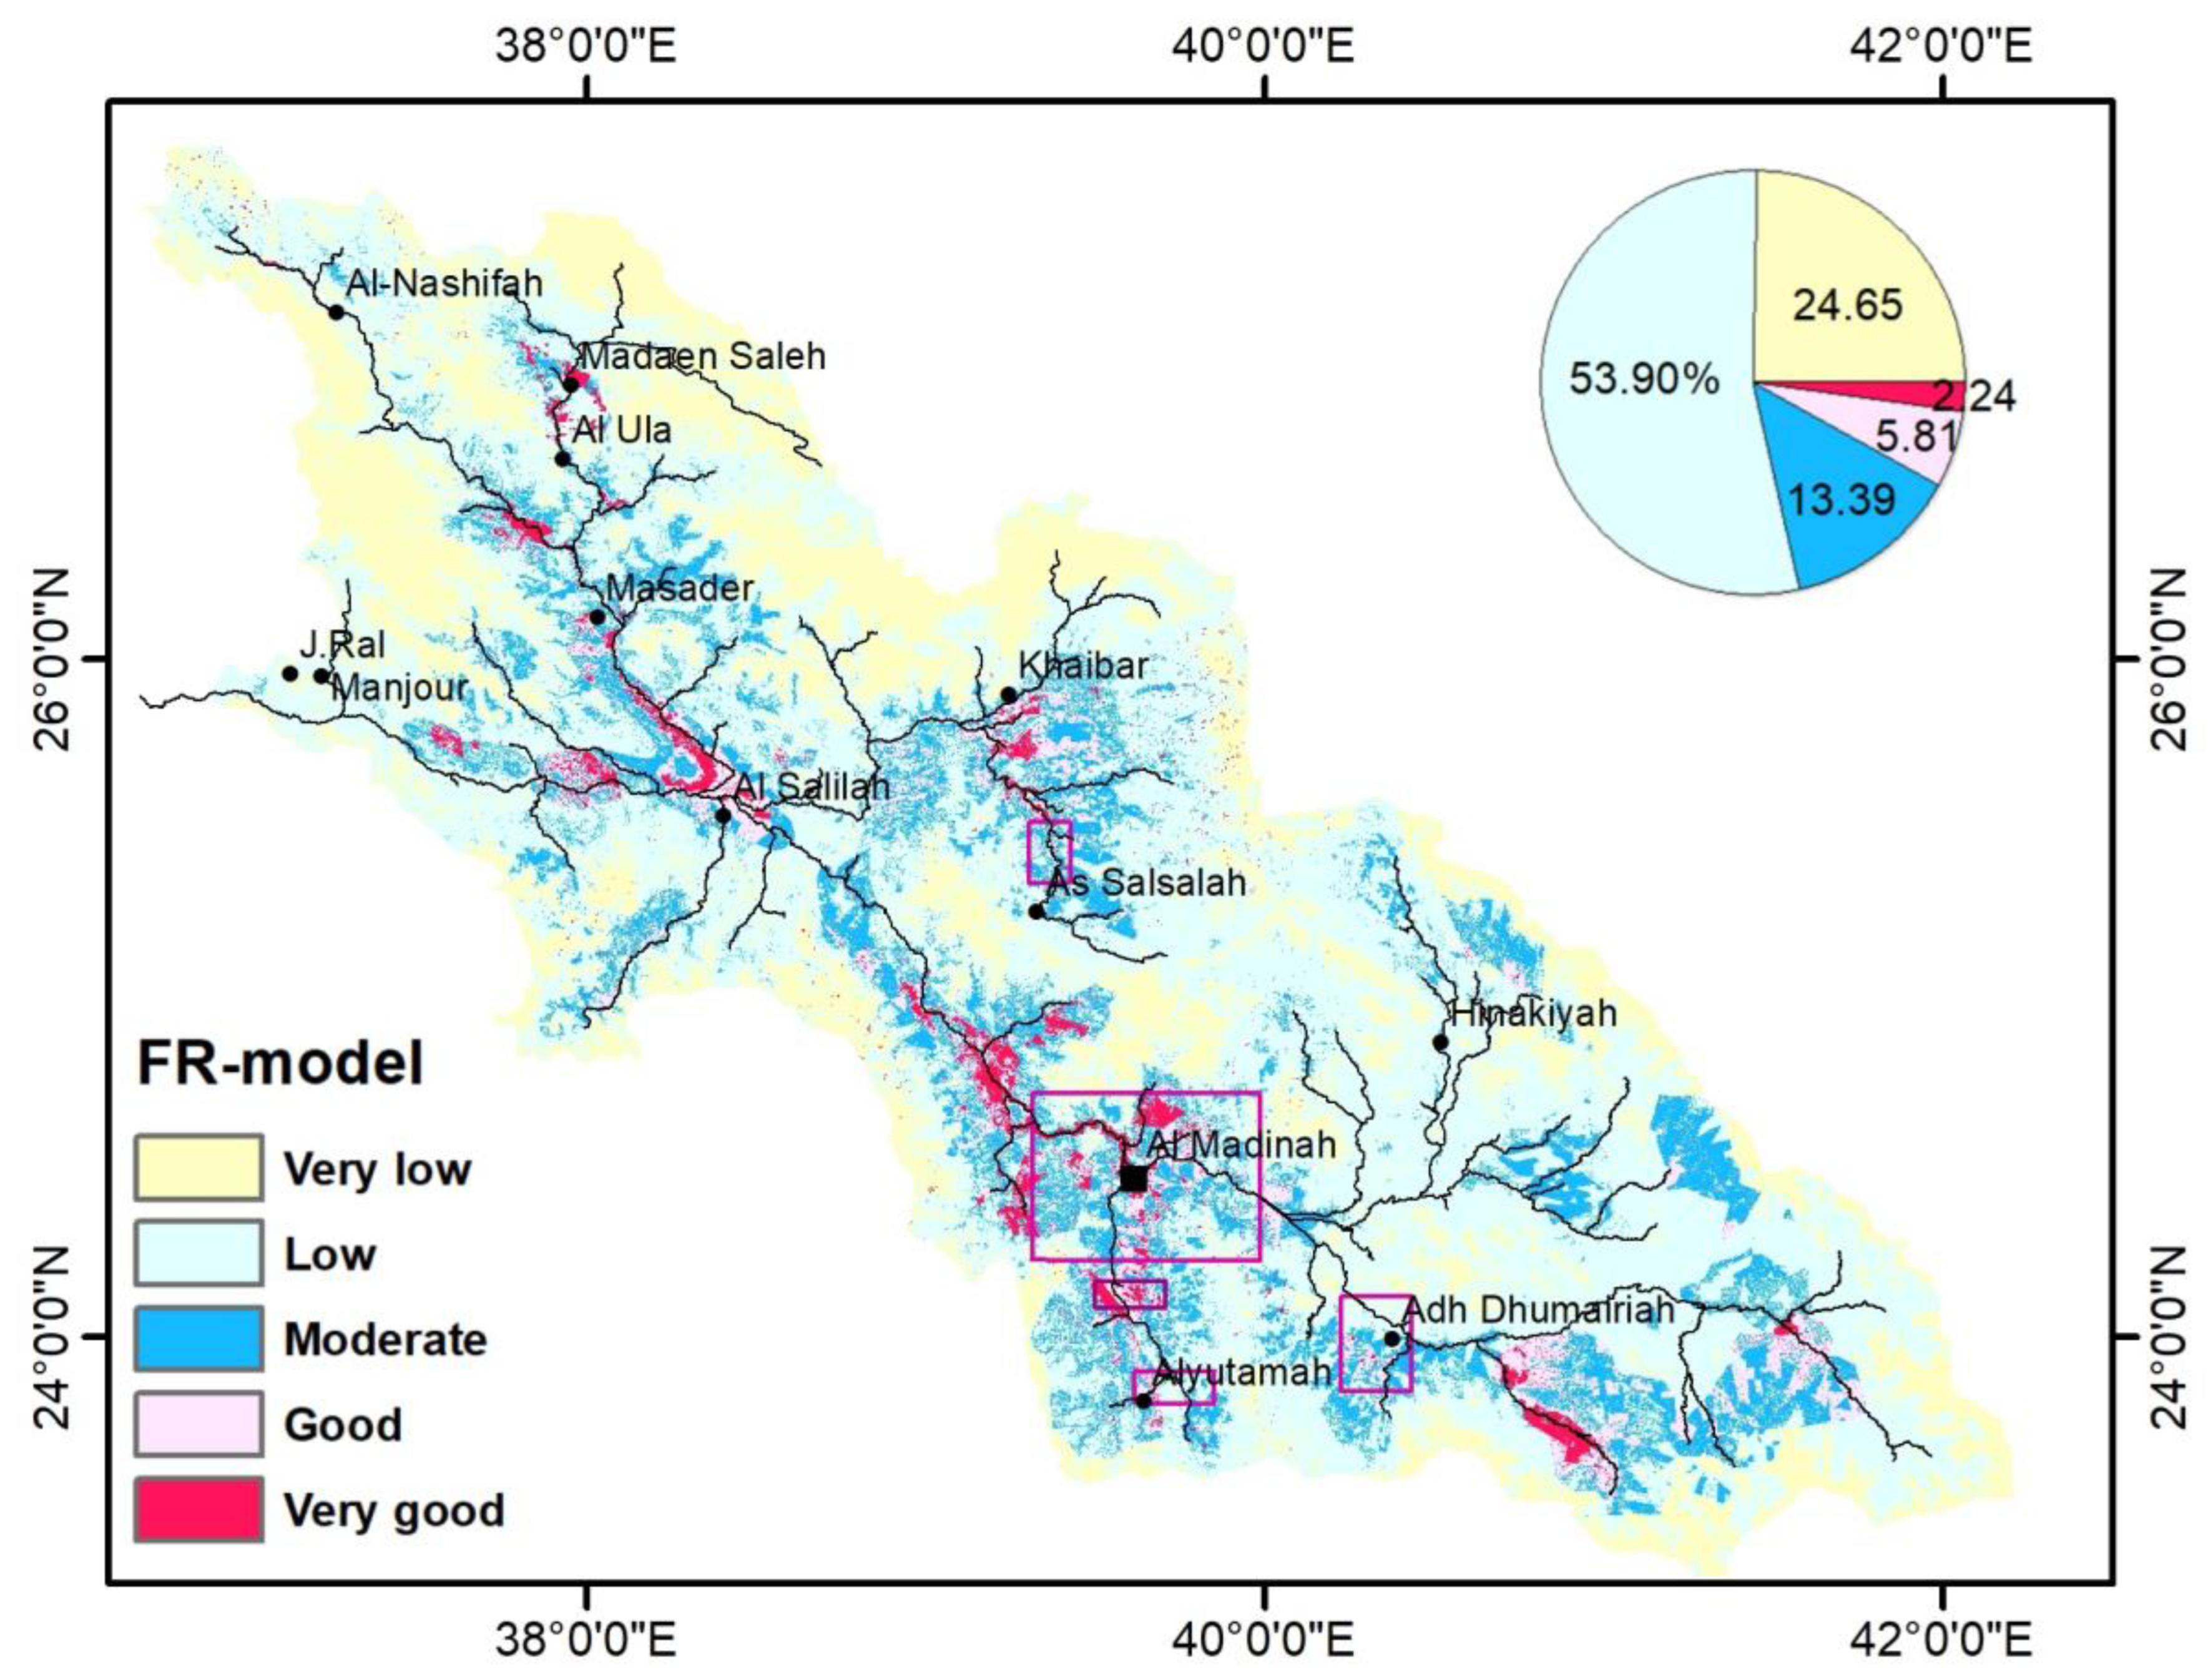
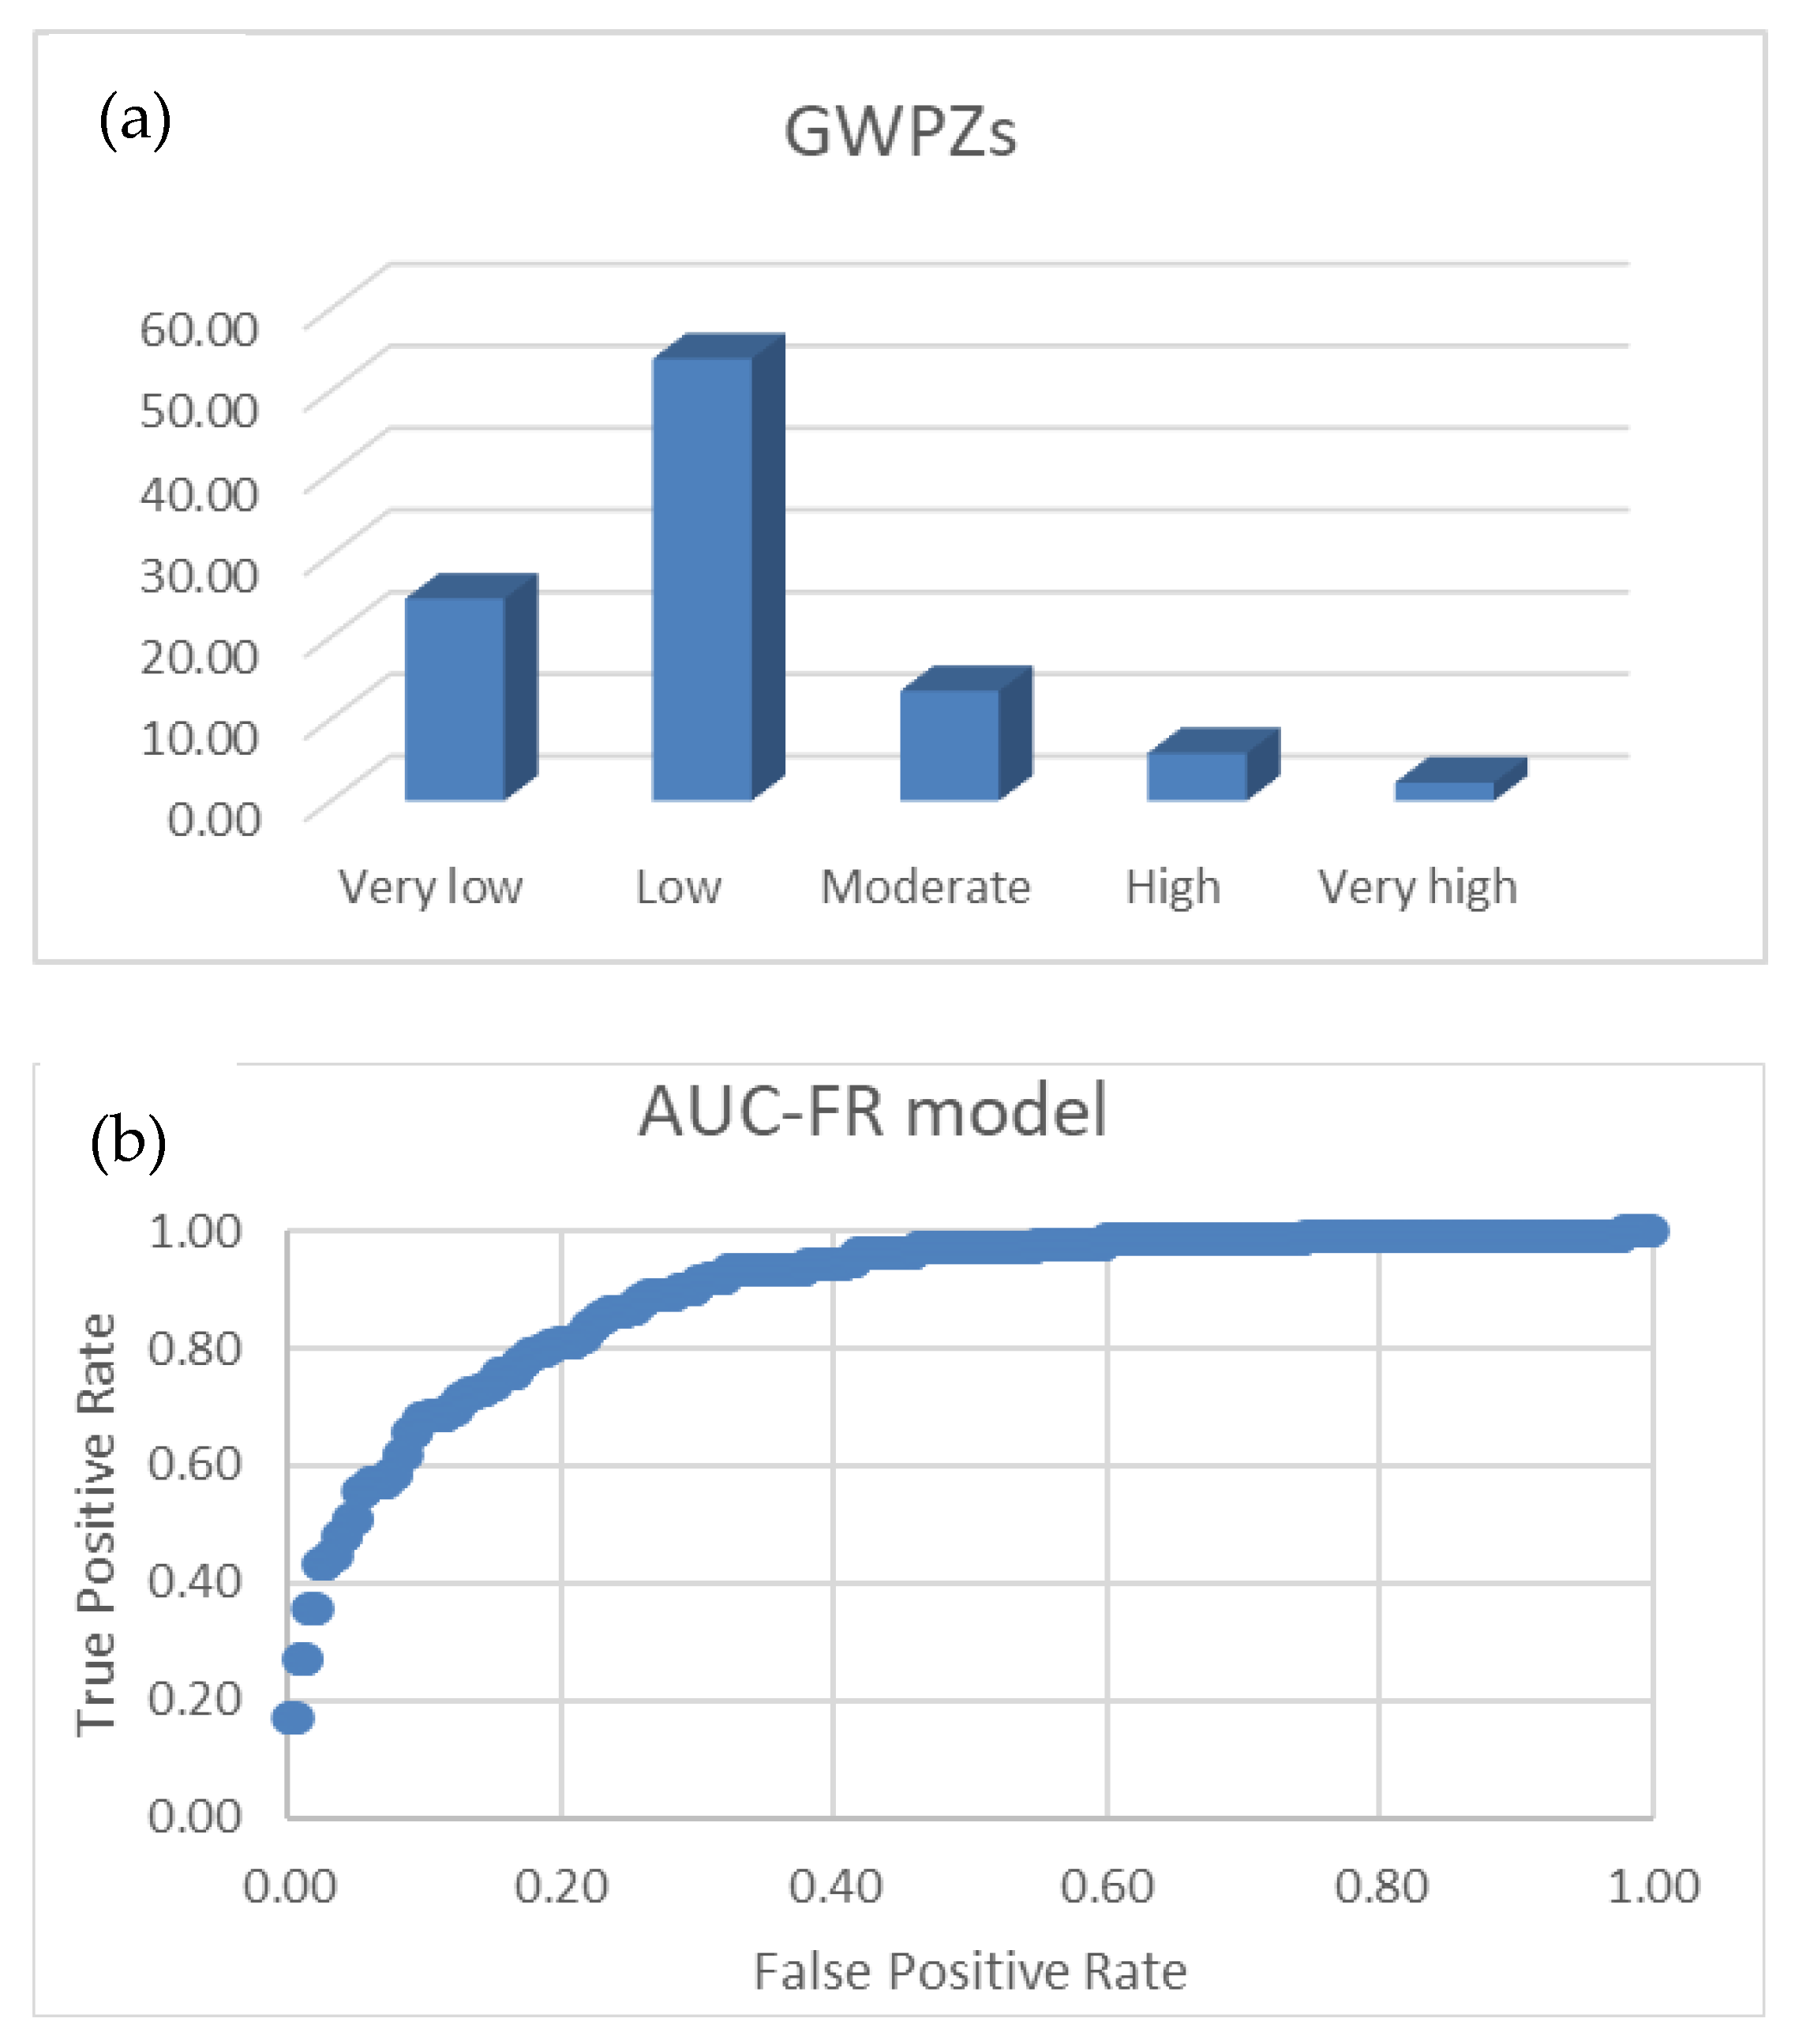
The twelve evidential layers are combined based on the discussed FR values. Following that, we divided the combined groundwater potential zones (GWPZs) map, created by combining 12 thematic maps, with the natural breaks method into five categories (
Figure 8a: 2.24, 5.81, 13.39, 53.90, and 24.65%). These, respectively, are very good, good, moderate, low, and very low. Using the ROC curve, the GWPZ map of the study area is validated (
Figure 9). The AUC can be used to describe the system’s capacity to accurately predict both the occurrence of “groundwater” and its absence, which emphasizes the value of its estimate. AUC values vary from 0 to 1, with smaller values suggesting a more useful prediction, and greater values reflecting more accurate estimates. The AUC result of the model is 0.893, representing better accuracy. The field observations validated the GWPZ map as several wells are consistent with the zones of high potentiality. Additionally, several farms coincide with those zones (
Figure 10). Vegetation and water resources make up the majority of the extremely high to extreme GWPZs, according to the Landsat-9 band composites 7, 5, and 3 (
Figure 11a–c) and Sentinel-2 (
Figure 11d,e).
6. Discussion
Using the FR model, we determine here the spatial relations between features and controlling factors (
Table 1). Areas of low elevation and slope are more likely to hold groundwater than higher elevation [
14,
16,
79]. This correlated with areas of low slope that are positively related to high groundwater potential. In terms of the hydrologic properties, the Dd reveals areas of high FR values and groundwater potentiality. The groundwater potential was promising for the highest TWI classes as TWI positively correlated with FR values [
26]. The areas close to the streams from 0 to 500 had the highest FRs (1.7) which reveals that the nearness to the streams results in more recharging capability. However, areas farther from the rivers had low potentiality. In terms of geologic properties, the Precambrian rocks display a high FR value and groundwater potential, as such areas are dominated by basement rocks that hold groundwater in a fractured aquifer. This coincides with the FR values that are higher with the lineament density as the Precambrian and Cenozoic volcanic rocks must have fractures to hold groundwater. The groundwater potential probability has a strong positive correlation with NDVI values, as the highest FR values coincide with the occurrence of vegetation and hence groundwater in arid regions [
26] and rainfall intensity. Although the area is characterized by rugged terrain with limited rainfall, combining the evidential layers revealed that good and very good zones cover ~8% of the study region.
Basement rocks and brecciated vesicular basalts in the area are overlain by alluvium that is composed of breccia and conglomerates, and the siltstone and the claystone (
Figure 12). Such rock units that are highly fracture, represent the main aquifer system that is recharged by the structurally controlled drainage pattern, e.g., parallel drainage in a northwesterly direction probably related to the Najd Fault System along with the N-S and the cross-cutting E-W Cenozoic trans tensional faults. The latter are related to the Red Sea Opening [
82]. Water occurrences can be significantly controlled by the size, shape, and arrangement of soil grains, as well as their associated pores systems Therefore, fine-grained soil of well sorted material such as sand has a lower rate of infiltration than coarse-grained soil [
68]. Accordingly, loam, sandy clay loam, and clay loam classes which occupy about 75% of the area have the highest FR values but clay soil has the lowest.
The Wadi Al-Aqiq valley connects all valleys at Al-Ayoun in Al-Madinah Al-Munawarah, providing a 150 km recharging region south of Al-Madinah. It discharges its water in a trellised drainage pattern. The Wadi Qanah-Al-Hamdh watershed connects all the valleys in the Al-Madinah and flows from the southeast to the northwest. It is >400 km long and around 150 km wide [
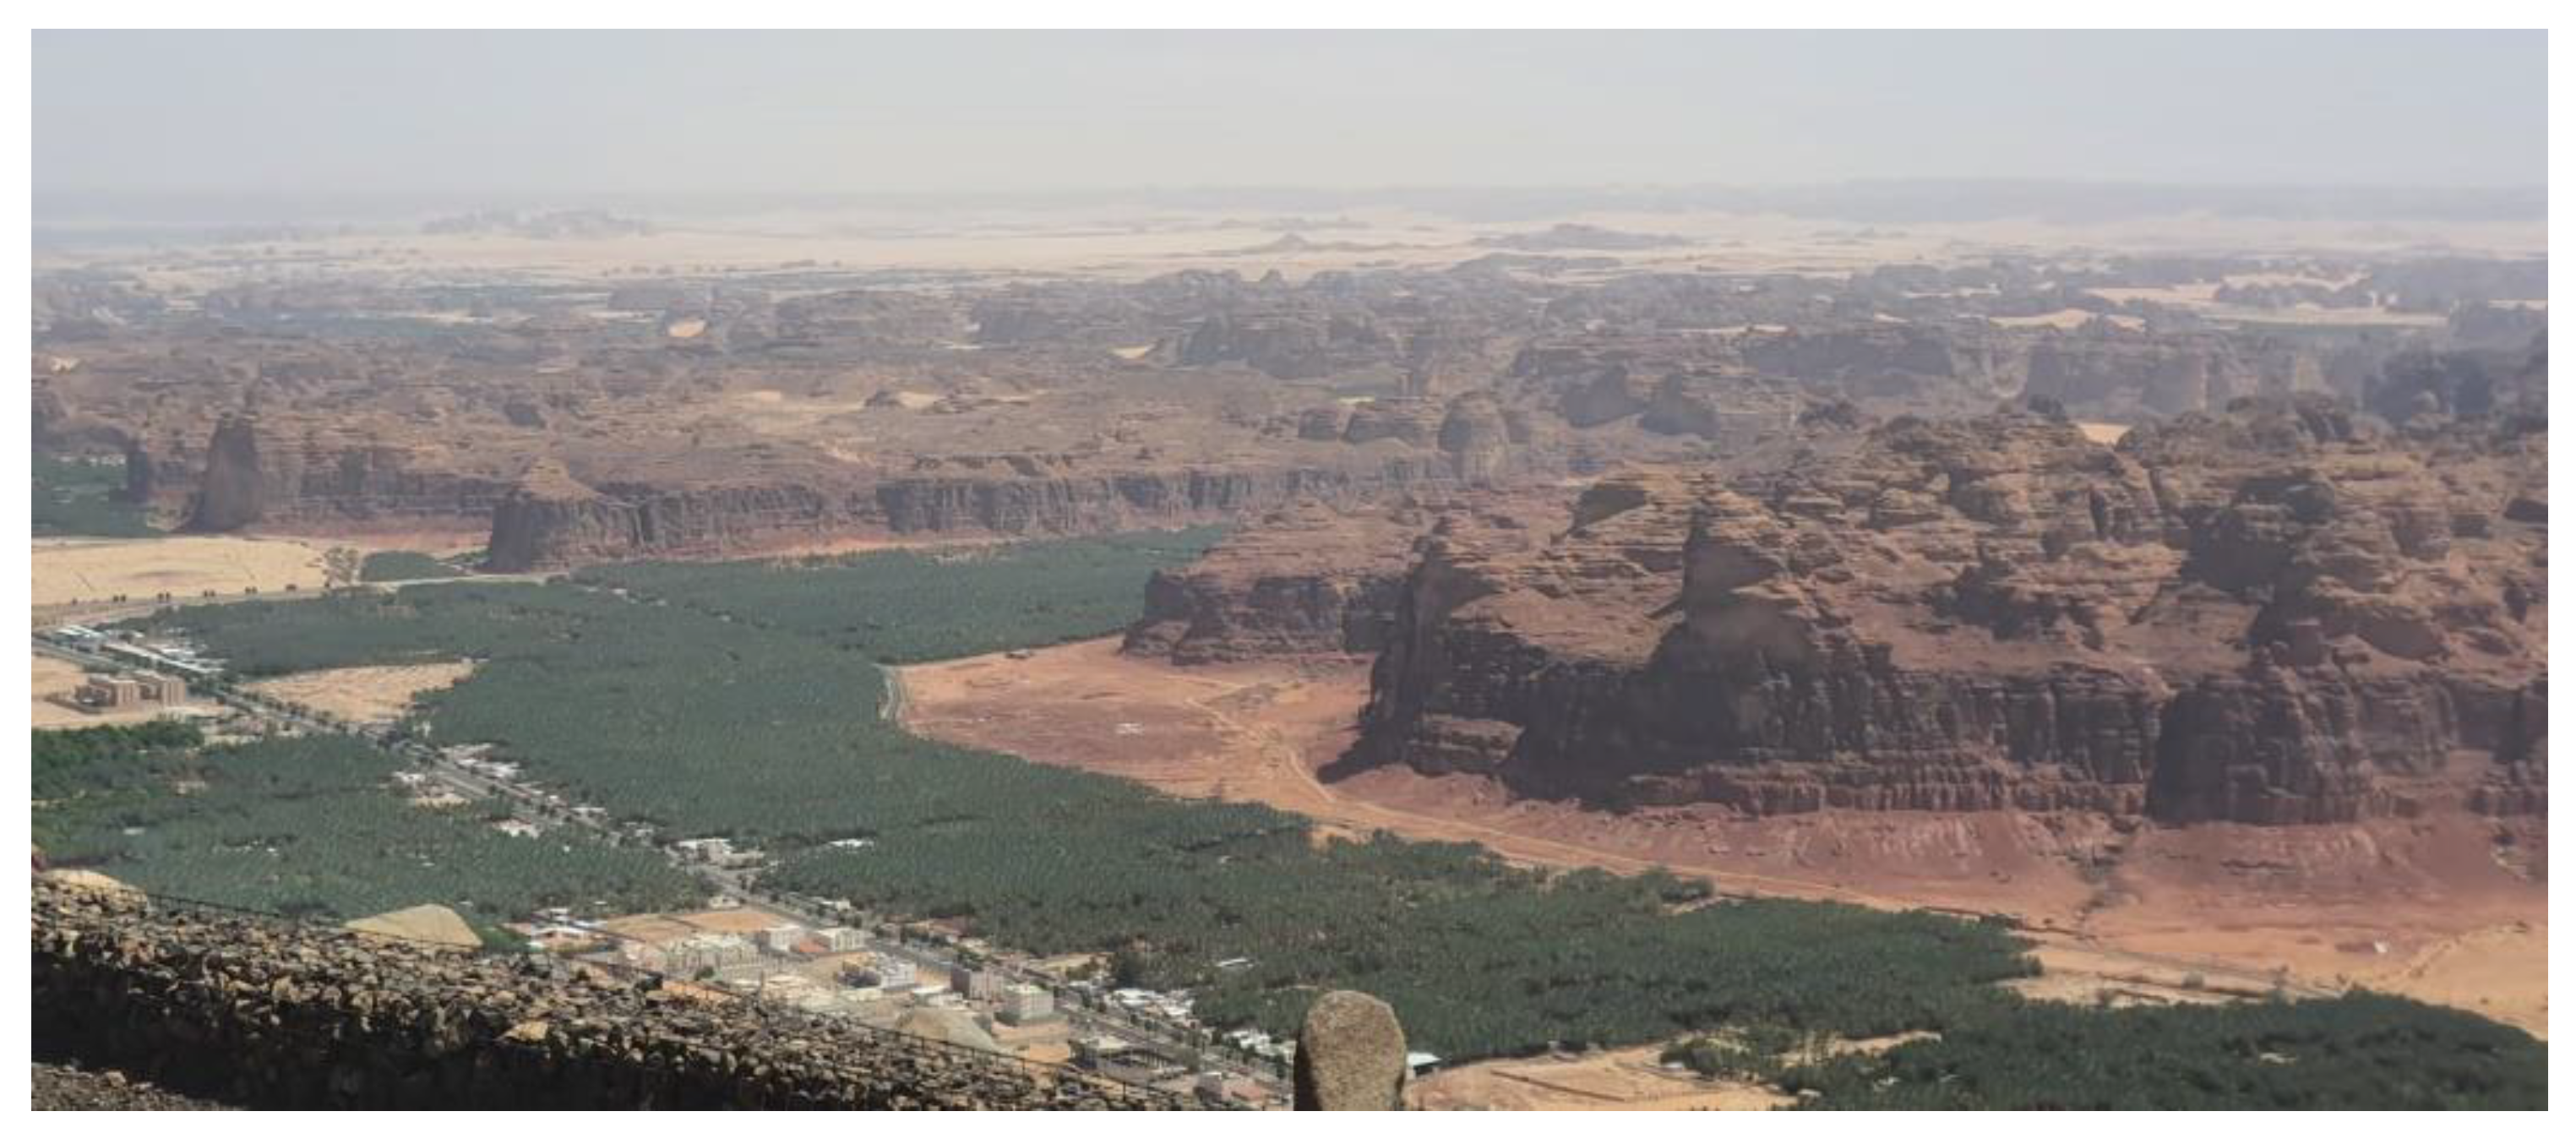
83]. The three mentioned sub-basins flow in the Tayef region; the Wadi Qanah-Al-Aqul valley is 300 kilometres southeast of Al-Madinah. These valleys’ watersheds display a trellised structure of drainage, which may be related to the Red Sea Rift. Additionally, groundwater wells that draw water from an aquifer of clastic Paleozoic rock are used to irrigate vegetation in Al Ula Town (
Figure 12).
7. Conclusions
In arid and hyper-arid locations, groundwater is especially a crucial supply of water for sustainable development. To reveal, evaluate, and monitor exploration data for water resources in various climatic situations, RS data and GIS-techniques are effectively merged. W. Al-Hamdh, in the Al-Madinah Al-Munawarah area, in the western part of Saudi Arabia was investigated using remote sensing and GIS techniques. The main goal was to identify prospective zones of groundwater potential and recharge zones. Here, we integrated twelve GIS thematic layers that depict the geology, geomorphic, climatic, and hydrologic conditions. These layers are soil, lithology, slope, elevation, curvature, TRI, Dd, TWI, distance to river, rainfall, NDVI, and lineament density. They were processed, normalized and integrated using GIS-based FR-overlay model. The result revealed the groundwater prospective areas, which are here categorized into five zones: very good, good, moderate, low, and very low that covering 2.24, 5.81, 13.39, 53.90, and 24.65% of the entire area. Field observation and the AUC validated the model which presented good performance (AUC: 0.893). The promising areas represent the artificial abstraction for groundwater supply. Overall, decision-makers and sustainability considerations greatly benefit from resultant GWPZ using RS and GIS. Moreover, this approach can be applied on a regional scale and in areas with comparable conditions.
Author Contributions
Conceptualization, M.A. and F.A.; methodology, M.A.; software, M.A.; validation, F.A., A.O.B. and N.A.-A.; investigation, M.A.; resources, N.A.-A.; writing—original draft preparation, M.A., F.E.-B. and A.O.B.; writing—review and editing, M.A. and F.E.-B. All authors have read and agreed to the published version of the manuscript.
Funding
This research received no external funding.
Data Availability Statement
Not applicable.
Acknowledgments
Nasir Al-Arifi extends his grateful to the Deanship of Scientific Research, King Saud University for funding through the Vice Deanship of Scientific Research Chairs.
Conflicts of Interest
The authors declare no conflict of interest.
References
- The United Nations World Water Development Report 2018 (WWDR). In Nature-Based Solutions for Water; UNESCO: Paris, France, 2018.
- World Health Organization (WHO). Progress on Sanitation and Drinking Water: 2015 Update and MDG Assessment; WHO: Geneva, Switzerland, 2015. [Google Scholar]
- Chow, V.T.; Maidment, D.R.; Mays, L.W. Applied Hydrology; McGraw-Hill Book Co.: Singapore, 1988. [Google Scholar]
- Black, M.; Talbot, R. Water, a Matter of Life and Health: Water Supply and Sanitation in Village India; Oxford University Press: Noida, India, 2005. [Google Scholar]
- Holden, J. Water Resources: An Integrated Approach; Routledge: New York, NY, USA, 2014. [Google Scholar]
- Molden, D. Water responses to urbanization. Paddy Water Environ. 2007, 5, 207–209. [Google Scholar] [CrossRef]
- Abd Manap, M.; Nampak, H.; Pradhan, B.; Lee, S.; Sulaiman, W.N.A.; Ramli, M.F. Application of probabilistic-based frequency ratio model in groundwater potential mapping using remote sensing data and GIS. Arab. J. Geosci. 2014, 7, 711–724. [Google Scholar] [CrossRef]
- Arulbalaji, P.; Padmalal, D.; Sreelash, K. GIS and AHP techniques based delineation of groundwater potential zones: A case study from Southern Western Ghats. India Sci. Rep. 2019, 9, 2082. [Google Scholar] [CrossRef] [PubMed] [Green Version]
- Abdelkareem, M.; Al-Arifi, N. The use of remotely sensed data to reveal geologic, structural, and hydrologic features and predict potential areas of water resources in arid regions. Arab. J. Geosci. 2021, 14, 704. [Google Scholar] [CrossRef]
- Barlow, M.; Clarke, T. Blue Gold: The Fight to Stop the Corporate Theft of the World’s Water; The New Press: New York, NY, USA, 2002. [Google Scholar]
- Hutti, B.; Nijagunappa, R. Identification of groundwater potential zone using Geoinformatics in Ghataprabha basin, North Karnataka, India. Int. J. Geomat. Geosci. 2011, 2, 91–109. [Google Scholar]
- Naghibi, S.A.; Vafakhah, M.; Hashemi, H.; Pradhan, B.; Alavi, S.J. Groundwater augmentation through the site selection of floodwater spreading using a data mining approach (case study: Mashhad Plain, Iran). Water 2018, 10, 1405. [Google Scholar] [CrossRef] [Green Version]
- Chen, W.; Zhao, X.; Tsangaratos, P.; Shahabi, H.; Ilia, I.; Xue, W.; Wang, X.; Ahmad, B.B. Evaluating the usage of tree-based ensemble methods in groundwater spring potential mapping. J. Hydrol. 2020, 583, 124602. [Google Scholar] [CrossRef]
- Abdelkareem, M.; Abdalla, F. Revealing potential areas of water resources using integrated remote-sensing data and GIS-based analytical hierarchy process. Geocarto Int. 2021, 37, 8672–8696. [Google Scholar] [CrossRef]
- Jha, M.K.; Chowdhury, A.; Chowdary, V.M.; Peiffer, S. Groundwater management and development by integrated remote sensing and geographic information systems: Prospects and constraints. Water Resour. Manag. 2007, 21, 427–467. [Google Scholar] [CrossRef]
- Sun, T.; Cheng, W.; Abdelkareem, M.; Al-Arifi, N. Mapping Prospective Areas of Water Resources and Monitoring Land Use/Land Cover Changes in an Arid Region Using Remote Sensing and GIS Techniques. Water 2022, 14, 2435. [Google Scholar] [CrossRef]
- Salman, S.A.; Shahid, S.; Mohsenipour, M.; Asgari, H. Impact of land use on groundwater quality of Bangladesh. Sustain. Water Resour. Manag. 2018, 4, 1031–1036. [Google Scholar] [CrossRef]
- Elmahdy, S.I.; Mohamed, M.M. Probabilistic frequency ratio model for groundwater potential mapping in Al Jaww plain, UAE. Arab. J. Geosci. 2015, 8, 2405–2416. [Google Scholar] [CrossRef]
- Avand, M.; Janizadeh, S.; Tien Bui, D.; Pham, V.H.; Ngo, P.T.T.; Nhu, V.-H. A tree-based intelligence ensemble approach for spatial prediction of potential groundwater. Int. J. Digit. Earth 2020, 13, 1408–1422. [Google Scholar] [CrossRef]
- Nguyen, P.T.; Ha, D.H.; Jaafari, A.; Nguyen, H.D.; Van Phong, T.; Al-Ansari, N.; Prakash, I.; Le, H.V.; Pham, B.T. Groundwater Potential Mapping Combining Artificial Neural Network and Real AdaBoost Ensemble Technique: The DakNong Province Case-study, Vietnam. IJERPH 2020, 17, 2473. [Google Scholar] [CrossRef] [Green Version]
- Jaafarzadeh, M.S.; Tahmasebipour, N.; Haghizadeh, A.; Pourghasemi, H.R.; Rouhani, H. Groundwater recharge potential zonation using an ensemble of machine learning and bivariate statistical models. Sci. Rep. 2021, 11, 5587. [Google Scholar] [CrossRef]
- Davoodi, M.D.; Rezaei, M.; Pourghasemi, H.R.; Pourtaghi, Z.S.; Pradhan, B. Groundwater spring potential mapping using bivariate statistical model and GIS in the Taleghan watershed Iran. Arab. J. Geosci. 2013, 8, 913–929. [Google Scholar] [CrossRef]
- Pourtaghi, Z.S.; Pourghasemi, H.R. GIS-based groundwater spring potential assessment and mapping in the Birjand Township, southern Khorasan Province, Iran. Hydrogeology 2014, 22, 643–662. [Google Scholar] [CrossRef]
- Naghibi, S.A.; Pourghasemi, H.R. A comparative assessment between three machine learning models and their performance comparison by bivariate and multivariate statistical methods in groundwater potential mapping. Water Resour Manag. 2015, 29, 5217–5236. [Google Scholar] [CrossRef]
- Maity, B.; Mallick, S.K.; Das, S.; Rudra, S. Comparative analysis of groundwater potentiality zone using fuzzy AHP, frequency ratio and Bayesian weights of evidence methods. Appl. Water Sci. 2022, 12, 12–63. [Google Scholar] [CrossRef]
- Li, Y.; Abdelkareem, M.; Al-Arifi, N. Mapping Potential Water Resource Areas Using GIS-Based Frequency Ratio and Evidential Belief Function. Water 2023, 15, 480. [Google Scholar] [CrossRef]
- Oh, H.J.; Kim, Y.S.; Choi, J.K.; Park, E.; Lee, S. GIS mapping of regional probabilistic groundwater potential in the area of Pohang City, Korea. J. Hydrol. 2011, 399, 158–172. [Google Scholar] [CrossRef]
- Razandi, Y.; Pourghasemi, H.R.; Neisani, N.S.; Rahmati, O. Application of analytical hierarchy process, frequency ratio, and certainty factor models for groundwater potential mapping using GIS. Earth Sci. Inform. 2015, 8, 867–883. [Google Scholar] [CrossRef]
- Arshad, A.; Zhang, Z.; Zhang, W.; Dilawar, A. Mapping favorable groundwater potential recharge zones using a GIS-based analytical hierarchical process and probability frequency ratio model: A case study from an agro-urban region of Pakistan. Geosci. Front. 2020, 11, 1805–1819. [Google Scholar] [CrossRef]
- Yariyan, P.; Avand, M.; Omidvar, E.; Pham, Q.B.; Linh, N.T.T.; Tiefenbacher, J.P. Optimization of statistical and machine learning hybrid models for groundwater potential mapping. Geocarto Int. 2020, 11, 2282–2314. [Google Scholar] [CrossRef]
- Das, S. Comparison among influencing factor, frequency ratio, and analytical hierarchy process techniques for groundwater potential zonation in Vaitarna basin, Maharashtra, India. Groundw. Sustain. Dev. 2019, 8, 617–629. [Google Scholar] [CrossRef]
- Siahkamari, S.; Haghizadeh, A.; Zeinivand, H.; Tahmasebipour, N.; Rahmati, O. Spatial prediction of food-susceptible areas using frequency ratio and maximum entropy models. Geocarto Int. 2018, 33, 927–941. [Google Scholar] [CrossRef]
- Razavi-Termeh, S.V.; Sadeghi-Niaraki, A.; Choi, S.-M. Groundwater potential mapping using an integrated ensemble of three bivariate statistical models with random forest and logistic model tree models. Water 2019, 11, 1596. [Google Scholar] [CrossRef] [Green Version]
- Balamurugan, G.; Seshan, K.; Bera, S. Frequency ratio model for groundwater potential mapping and its sustainable management in cold desert India. J. King Saud Univ.-Sci. 2017, 29, 333–347. [Google Scholar]
- Pellaton, C. Geologic Map of the Al Madinah Quadrangle, Sheet 24D, Kingdom of Saudi Arabia: Saudi Arabian Deputy Ministry for Mineral Resources Geosciences Map GM-52, Scale 1:250,000; Pascal and Francis: Orono, ME, USA, 1981; p. 19. [Google Scholar]
- Johnson, P.R. Explanatory Notes to the Map of Proterozoic Geology of Western Saudi Arabia: Saudi Geological Survey Technical Report SGS-TR-2006-4; Saudi Geological Survey: Jeddah, Kingdom of Saudi Arabia, 2006; p. 62, 22 figs., 2 plates. [Google Scholar]
- Yassin, M.A.; Abdullatif, O.M. Chemostratigraphic and sedimentologic evolution of Wajid group (Wajid sandstone): An outcrop analog study from the cambrian to permian, SW Saudi Arabia. J. Afr. Earth Sci. 2017, 126, 159–175. [Google Scholar] [CrossRef]
- Al-Ajmi, H.F.; Keller, M.; Hinderer, M.; Filomena, C.M. Lithofacies, depositional environments and stratigraphic architecture of the Wajid Group outcrops in southern Saudi Arabia. GeoArabia 2015, 20, 49–94. [Google Scholar] [CrossRef]
- Coleman, R.G.; Gregory, R.T.; Brown, G.F. Cenozoic Volcanic Rocks of Saudi Arabia: Saudi Arabian Deputy Ministry for Mineral Resources Open-File Report USGS-OF-03-93; U.S. Geological Survey: Reston, VA, USA, 1983; p. 82.
- Bamousa, A.O.; El Maghraby, M. Groundwater characterization and quality assessment, and sources of pollution in Madinah, Saudi Arabia. Arab. J. Geosci. 2016, 9, 536. [Google Scholar] [CrossRef]
- Metwaly, M.; Abdalla, F.; Taha, A. Hydrogeophysical Study of Sub-Basaltic Alluvia Aquifer in the Southern Part of Al-Madinah Al-Munawarah, Saudi Arabia. Sustainability 2021, 13, 9841. [Google Scholar] [CrossRef]
- O’Callaghan, J.F.; Mark, D.M. The extraction of drainage networks from digital elevation data. Comput. Vis. Graph. Image Process. 1984, 28, 323–3444. [Google Scholar] [CrossRef]
- Yousefi, S.; Sadhasivam, N.; Pourghasemi, H.R.; Ghaffari Nazarlou, H.; Golkar, F.; Tavangar, S.; Santosh, M. Groundwater spring potential assessment using new ensemble data mining techniques. Measurement 2020, 157, 107652. [Google Scholar] [CrossRef]
- Naghibi, S.A.; Pourghasemi, H.R.; Dixon, B. GIS-based groundwater potential mapping using boosted regression tree, classification and regression tree, and random forest machine learning models in Iran. Environ. Monit. Assess. 2016, 188, 44. [Google Scholar] [CrossRef]
- Karimi-Rizvandi, S.; Goodarzi, H.V.; Afkoueieh, J.H.; Chung, I.-M.; Kisi, O.; Kim, S.; Linh, N.T.T. Groundwater-potential mapping using a self-learning bayesian network model: A comparison among metaheuristic algorithms. Water 2021, 13, 658. [Google Scholar] [CrossRef]
- Al Saud, M. Mapping potential areas for groundwater storage in Wadi Aurnah Basin, western Arabian Peninsula, using remote sensing and geographic information system techniques. Hydrogeol. J. 2018, 18, 1481–1495. [Google Scholar] [CrossRef]
- Gupta, M.; Srivastava, P.K. Integrating GIS and remote sensing for identification of groundwater potential zones in the hilly terrain of Pavagarh, Gujarat, India. Water Int. 2010, 35, 233–245. [Google Scholar] [CrossRef]
- Kaewdum, N.; Chotpantarat, S. Mapping Potential Zones for Groundwater Recharge Using a GIS Technique in the Lower Khwae Hanuman Sub-Basin Area, Prachin Buri Province, Thailand. Front. Earth Sci. 2021, 9, 717313. [Google Scholar] [CrossRef]
- Naghibi, S.A.; Dolatkordestani, M.; Rezaei, A.; Amouzegari, P.; Heravi, M.T.; Kalantar, B.; Pradhan, B. Application of rotation forest with decision trees as base classifier and a novel ensemble model in spatial modeling of groundwater potential. Environ. Monit. Assess. 2019, 191, 248. [Google Scholar] [CrossRef]
- Kalantar, B.; Al-Najjar, H.A.H.; Pradhan, B.; Saeidi, V.; Halin, A.A.; Ueda, N.; Naghibi, S.A. Optimized Conditioning Factors Using Machine Learning Techniques for Groundwater Potential Mapping. Water 2019, 11, 1909. [Google Scholar] [CrossRef] [Green Version]
- Moghaddam, D.D.; Rahmati, O.; Haghizadeh, A.; Kalantari, Z. A Modeling Comparison of Groundwater Potential Mapping in a Mountain Bedrock Aquifer: QUEST, GARP, and RF Models. Water 2020, 12, 679. [Google Scholar] [CrossRef] [Green Version]
- Benjmel, K.; Amraoui, F.; Boutaleb, S.; Ouchchen, M.; Tahiri, A.; Touab, A. Mapping of Groundwater Potential Zones in Crystalline Terrain Using Remote Sensing, GIS Techniques, and Multicriteria Data Analysis (Case of the Ighrem Region, Western Anti-Atlas, Morocco). Water 2020, 12, 471. [Google Scholar] [CrossRef] [Green Version]
- Mukherjee, I.; Singh, U.K. Delineation of groundwater potential zones in a drought-prone semi-arid region of east India using GIS and analytical hierarchical process techniques. CATENA 2020, 194, 104681. [Google Scholar] [CrossRef]
- Magesh, N.S.; Chandrasekar, N.; Soundranayagam, J.P. Delineation of groundwater potential zones in Theni district, Tamil Nadu, using remote sensing, GIS and MIF techniques. Geosci. Front. 2012, 3, 189–196. [Google Scholar] [CrossRef] [Green Version]
- Tolche, A.D. Groundwater potential mapping using geospatial techniques: A case study of Dhungeta-Ramis sub-basin. Ethiop. Geol. Ecol. Landsc. 2020, 5, 65–80. [Google Scholar] [CrossRef]
- Senthilkumar, M.; Gnanasundar, D.; Arumugam, R. Identifying groundwater recharge zones using remote sensing & GIS techniques in Amaravathi aquifer system, Tamil Nadu, South India. Sustain. Environ. Res. 2019, 29, 15. [Google Scholar]
- Bera, A.; Mukhopadhyay, B.P.; Barua, S. Delineation of groundwater potential zones in Karha river basin, Maharashtra, India, using AHP and geospatial techniques. Arab. J. Geosci. 2020, 13, 693. [Google Scholar] [CrossRef]
- Pourali, S.H.; Arrowsmith, C.; Chrisman, N.; Matkan, A.A.; Mitchell, D. Topography wetness index application in flood-risk-based land use planning. Appl. Spat. Anal Pol 2016, 9, 39–54. [Google Scholar] [CrossRef]
- Pourghasemi, H.R.; Beheshtirad, M. Assessment of a data-driven evidential belief function model and GIS for groundwater potential mapping in the Koohrang Watershed, Iran. Geocarto Int. 2014, 30, 662–685. [Google Scholar] [CrossRef]
- Hasanuzzaman, M.D.; Mandal, M.H.; Hasnine, M.D.; Shit, P.K. Groundwater potential mapping using multi-criteria decision, bivariate statistic and machine learning algorithms: Evidence from Chota Nagpur Plateau, India. Appl. Water Sci. 2022, 12, 58. [Google Scholar] [CrossRef]
- Cuthbert, M.O.; Acworth, R.I.; Andersen, M.S.; Larsen, J.R.; McCallum, A.M.; Rau, G.C.; Tellam, J.H. Understanding and quantifying focused, indirect groundwater recharge from ephemeral streams using water table fluctuations. Water Resour. Res. 2016, 52, 827–840. [Google Scholar] [CrossRef] [Green Version]
- Golkarian, A.; Naghibi, S.A.; Kalantar, B.; Pradhan, B. Groundwater potential mapping using C5. 0, random forest, and multivariate adaptive regression spline models in GIS. Environ. Monit. Assess. 2018, 190, 149. [Google Scholar] [CrossRef]
- Shaban, A.; Khawlie, M.; Abdallah, C. Use of Remote Sensing and GIS to Determine Recharge Potential Zones: The Case of Occidental Lebanon. Hydrogeol. J. 2006, 14, 433–443. [Google Scholar] [CrossRef]
- Costache, R.; Hong, H.; Pham, Q.B. Comparative assessment of the flash-flood potential within small mountain catchments using bivariate statistics and their novel hybrid integration with machine learning models. Sci. Total Environ. 2020, 711, 134514. [Google Scholar] [CrossRef]
- Abdelkareem, M.; El-Baz, F.; Askalany, M.; Akawy, A.; Ghoneim, E. Groundwater prospect map of Egypt’s Qena Valley using data fusion. Int. J. Image Data Fusion 2012, 3, 169–189. [Google Scholar] [CrossRef]
- Kebede, S. Groundwater in Ethiopia: Features, Numbers and Opportunities; Springer Hydrogeology: Berlin/Heidelberg, Germany, 2013. [Google Scholar] [CrossRef]
- Opp, C. Bodenkörper. In Geographie—Physische Geographie und Humangeographie, 3rd ed.; Gebhardt, H., Glaser, R., Radtke, U., Reuber, P., Vött, A., Eds.; Springer: Berlin/Heidelberg, Germany, 2011; pp. 485–490. [Google Scholar]
- Senanayake, I.P.; Dissanayake, D.M.D.O.K.; Mayadunna, B.B.; Weerasekera, W.L. An approach to delineate groundwater recharge potential sites in Ambalantota, Sri Lanka using GIS techniques. Geosci. Front. 2016, 7, 115–124. [Google Scholar] [CrossRef] [Green Version]
- Shekhar, S.; Pandey, A.C. Delineation of groundwater potential zone in hard rock terrain of India using remote sensing, geographical information system (GIS) and analytic hierarchy process (AHP) techniques. Geocarto Int. 2015, 30, 402–421. [Google Scholar] [CrossRef]
- Han, L.; Liu, Z.; Ning, Y.; Zhao, Z. Extraction and analysis of geological lineaments combining a DEM and remote sensing images from the northern Baoji loess area. Adv. Space Res. 2018, 62, 2480–2493. [Google Scholar] [CrossRef]
- Abdelkareem, M.; El-Baz, F. Remote sensing of Paleodrainage systems west of the Nile River, Egypt. J. Geocarto Int. 2017, 32, 541–555. [Google Scholar] [CrossRef]
- Obi Reddy, G.P. Evaluation of groundwater potential zones using remote sensing data—A case study of Gaimukh watershed, Bhanadra District, Maharastra. J. Indian Soc. Remote Sens. 2000, 28, 19–32. [Google Scholar] [CrossRef]
- Pradeep, R. Remote sensing techniques to locate ground water potential zones in upper Urmil River Basin, District Chhatarpur—Central India. J. Indian Soc. Remote Sens. 1998, 26, 135–147. [Google Scholar]
- Sreedhar, G. Mapping of groundwater potential zones in the Musi basin using remote sensing data and GIS. Adv. Eng. Softw. 2009, 40, 506–518. [Google Scholar]
- Elewa, H.H.; Qaddah, A.A.; El-Feel, A.A. Determining potential sites for runoff water harvesting using remote sensing and geographic information systems-based modeling in Sinai. Am. J. Environ. Sci. 2012, 8, 42–55. [Google Scholar]
- Zhu, Q.; Abdelkareem, M. Mapping groundwater potential zones using a knowledge-driven approach and GIS analysis. Water 2021, 13, 579. [Google Scholar] [CrossRef]
- Krishna, R.; Kishan, D.; Sarup, J. Lineament extraction and lineament density assessment of Omkareshwar, M P, India, using GIS Techniques. Int. J. Eng. Manag. Res. 2015, 5, 717–720. [Google Scholar]
- Singh, L.K.; Jha, M.K.; Chowdary, V.M. Assessing the accuracy of GIS-based MultiCriteria Decision Analysis approaches for mapping groundwater potential. Ecol. Indic. 2018, 91, 24–37. [Google Scholar] [CrossRef]
- Hong, Y.; Abdelkareem, M. Integration of remote sensing and a GIS-based method for revealing prone areas to flood hazards and predicting optimum areas of groundwater resources. Arab. J. Geosci. 2022, 15, 114. [Google Scholar] [CrossRef]
- Abdelkareem, M.; Abdalla, F.; Mohamed, S.Y.; El-Baz, F. Mapping paleohydrologic features in the arid areas of Saudi Arabia using remote sensing data. Water 2020, 12, 417. [Google Scholar] [CrossRef] [Green Version]
- Lee, S.; Pradhan, B. Probabilistic landslide hazards and risk mapping on Penang Island, Malaysia. J. Earth Syst. Sci. 2006, 115, 661–672. [Google Scholar] [CrossRef] [Green Version]
- Bamousa, A.O.; Matar, S.S.; Daoudi, M.; Al-Doaan, M.I. Structural and geomorphic features accommodating groundwater of Al-Madinah City, Saudi Arabia. Arab. J. Geosci. 2013, 6, 3127–3132. [Google Scholar] [CrossRef]
- Howard, A.D. Drainage analysis in geologic interpretation: A summation. AAPG Bull. 1967, 51, 2246–2259. [Google Scholar]
| Disclaimer/Publisher’s Note: The statements, opinions and data contained in all publications are solely those of the individual author(s) and contributor(s) and not of MDPI and/or the editor(s). MDPI and/or the editor(s) disclaim responsibility for any injury to people or property resulting from any ideas, methods, instructions or products referred to in the content. |
© 2023 by the authors. Licensee MDPI, Basel, Switzerland. This article is an open access article distributed under the terms and conditions of the Creative Commons Attribution (CC BY) license (https://creativecommons.org/licenses/by/4.0/).

 ,
, 


