
Retrofitting Vertical Slot Fish Pass with Brush Blocks: Hydraulics Performance

1
Civil Engineering Department, Hydraulics Division, Hacettepe University, Beytepe, 06810 Ankara, Turkey
2
Department of Fisheries, University of Kahramanmaraş Sütçü İmam, 46050 Kahramanmaraş, Turkey
3
Laboratory of Hydraulics, Hydrology and Glaciology (VAW), ETH Zurich, HIA C 57, Hoenggerbergring 26, CH-8093 Zurich, Switzerland
*
Author to whom correspondence should be addressed.
Water 2023, 15(6), 1155; https://doi.org/10.3390/w15061155
Submission received: 27 January 2023
/
Revised: 13 March 2023
/
Accepted: 14 March 2023
/
Published: 16 March 2023
(This article belongs to the Special Issue Fish Passage at Hydropower Dams 2.0)
Abstract
:The mean and turbulent flow characteristics of a vertical slot fish pass, with and without brush blocks, were investigated at the Cataloluk Small Hydropower Plant on the Tekir River, located in the Ceyhan River Basin of Turkey. Within the scope of the project, three-dimensional velocity measurements were performed at different hydraulic conditions. The prototype flow measurements showed that by placing brush blocks and the substrate in the vertical-slot pool: (i) the maximum velocity observed downstream of the slot was reduced by 39%; (ii) the maximum lateral component of the Reynolds shear stress observed in the slot region was reduced by a factor of 3; and (iii) the spatially averaged resultant velocity was reduced by 20%. With brush blocks, the turbulent jet region was reduced and recirculation regions disappeared. Furthermore, the spatially-averaged lateral component of the Reynolds shear stress was 3.3 times higher than the spatially-averaged streamwise component of the Reynolds shear stress because of the lateral velocity gradient and mixing in the pool. The present findings will contribute to potential improvements in the non and less efficiently-functioning vertical slot fish pass and other fish pass types by adding brush blocks.
1. Introduction
The European Union Water Framework Directive introduced in 2000 demands the restoration of water bodies and the elimination of the negative impacts of hydropower plants (HPPs) as to both up- and downstream fish migration, sediment continuity, and hydropeaking. In addition, within the scope of the European Green Deal announced by the European Union on December 2019, restoring ecosystems and protecting biodiversity has been one of the priority areas for research projects to be funded. Today, to achieve sustainable hydropower and benefit from the carbon certificate, one of the essential criteria to be met is that of functional fish passages [1]. HPPs, dams, weirs, culverts, and spillways obstruct fish up- and downstream movements within the river system and between the river and ocean. The Strategic Industry Roadmap of hydropower in Europe, based on a survey with multiple stakeholders and a panel of experts, has prioritized fish connectivity as one of the most of concern for HPPs and emphasized the new progress required to enhance safe fish passage [2]. Recent studies and analyses have demonstrated that most fish passages are not functional and that, in many cases, certain fish species cannot use them. Moreover, adaptive technical solutions have been developed to facilitate the upstream migration of all fish species, particularly for small species [3]. Gysi [4] stated that only 36% of the existing fish migration structures in Switzerland are at the desired efficiency, while Gessner [5] reported that 50% of the fish passes in Austria were not functional. Similarly, Wanningen [6] stated that nearly half of the fish passes in the Netherlands did not function well because the local fish species could not pass, and hence structural adjustments were required in these fish passes. These field observations reveal that many upstream fish passage facilities in operation should be rehabilitated. Moreover, in many existing pool-type fish passes, the hydraulic conditions are not favorable for upstream moving fish due to the high turbulence levels and unfavorable flow conditions such as short-circuit currents, wall jets, and unacceptable energy dissipation rates [7].
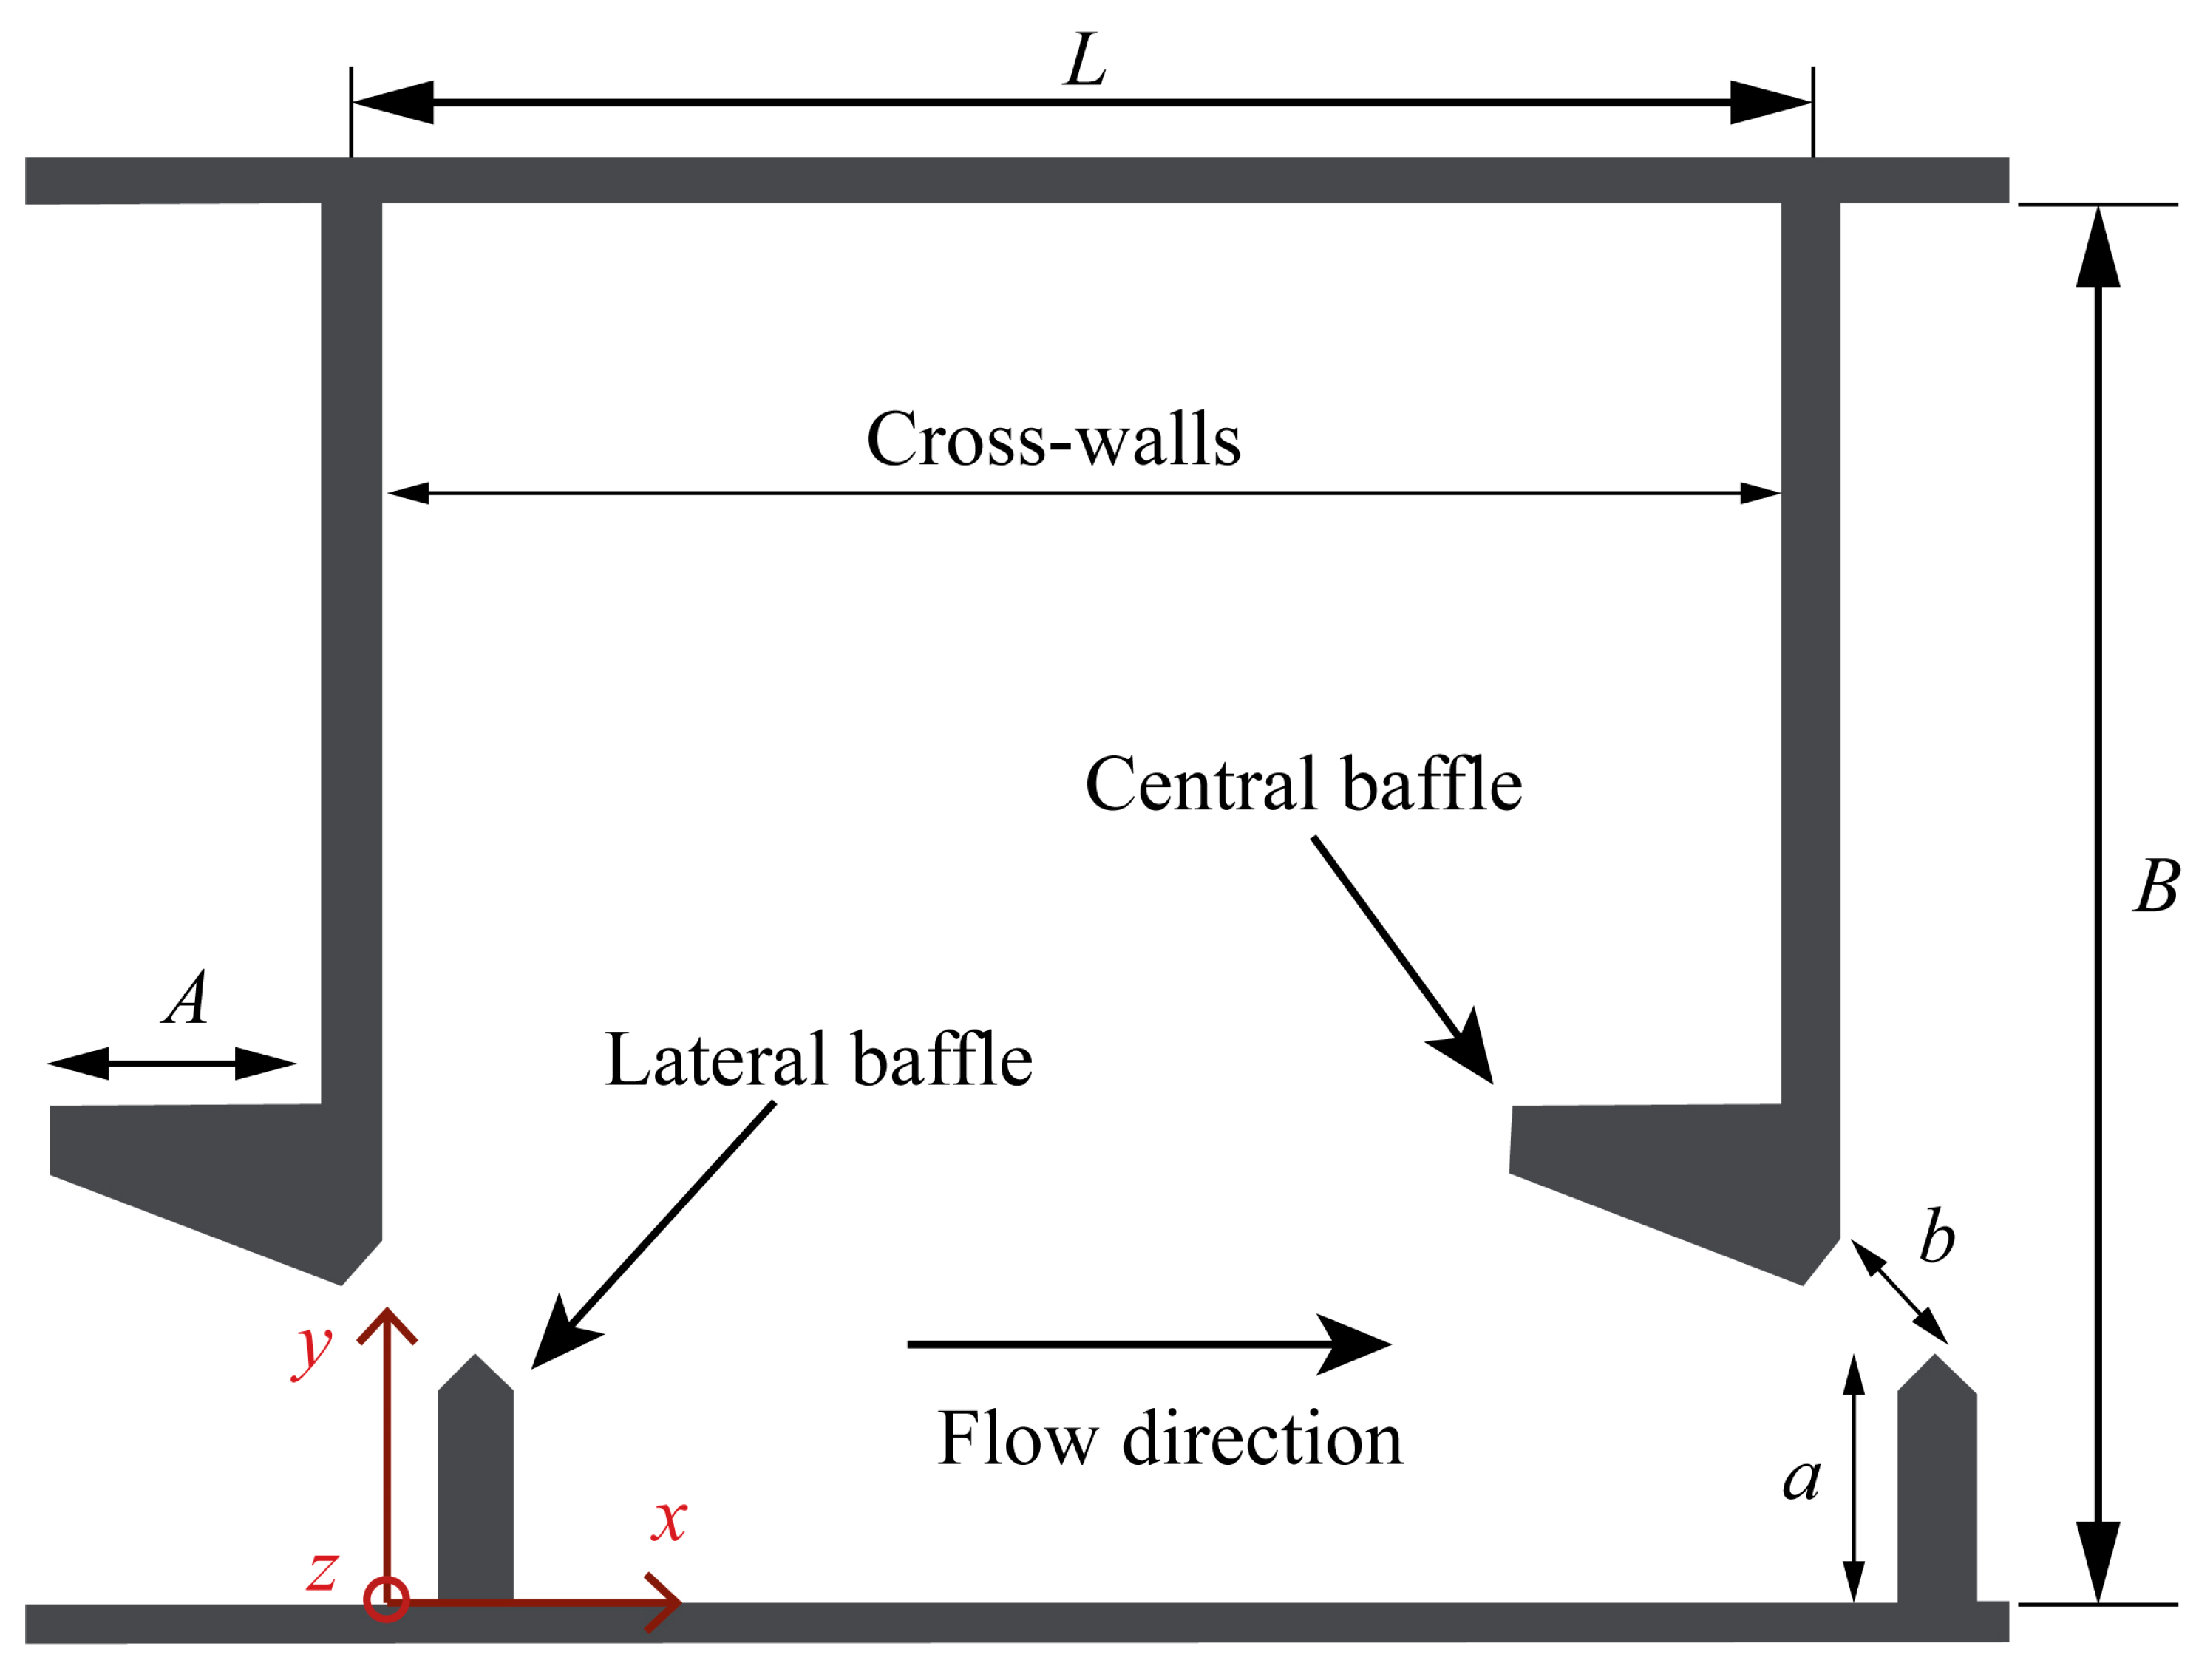
Vertical slot fishways (VSF) are widely used technical fish passes worldwide (Figure 1). A lateral baffle is installed at the base of the slot to better guide and stabilize the diagonal jet to prevent bypassing of the dissipation pool (Figure 1). After the pioneering study of Rajaratnam et al. [8] on the hydraulics of VSF, many experimental studies in the laboratory and the field as well as numerical model works have been conducted to investigate the mean and turbulence flow characteristics and establish design criteria [9,10,11,12,13,14,15,16]. As an advantage, the hydraulics of VSF is not affected by the variation in the discharge or water level in the pools. A typical VSF installation consists of natural or artificial bottom substrates, creating low flow velocities to allow the passage of benthic fauna. With regard to their main function, VSF may not allow for the passage of small fish with low swimming performance due to the high velocities and turbulence in their classical design [17,18]. Today, alternative arrangements are carried out to facilitate the passage of many fish species with a range of different swimming performances [19]. As an example, VSF with four slots was constructed on the Mekong Stream [20]. In this VSF, the maximum velocity in the smallest slot was 1.05 m/s, while it was 1.4 m/s in the most backward slot. This fish pass design aims at passing different fish species in a size range of 30–3000 mm [20]. However, applying this design in existing VSFs is not feasible in terms of cost. In this context, it is necessary to modify/retrofit existing VSFs to allow for the passage of fish with a weak swimming capacity. To this end, in previous studies, impermeable and rigid hydraulic elements were placed in the pools to dissipate the energy and dampen turbulence [21,22]. However, such a configuration causes a new turbulence field (wake) behind the obstacle and has not been particularly beneficial for the passage of small fish species. An alternative and cost-effective arrangement with flexible hydraulic elements (permeable brush block) for VSF was proposed and laboratory tested by Hassinger [17] to improve the fish passage efficiency of the VSF. Flexible elements enhance the energy dissipation and create resting areas for weak swimmers. In this study, we implemented such an arrangement in the pools of the VSF at the pilot HPP in Turkey and investigated this innovative concept in terms of the hydraulics. The study results will allow engineers to design and retrofit VSFs reliably with brush blocks to improve the hydraulic performance of the VSF.
2. Materials and Methods
2.1. Study Site
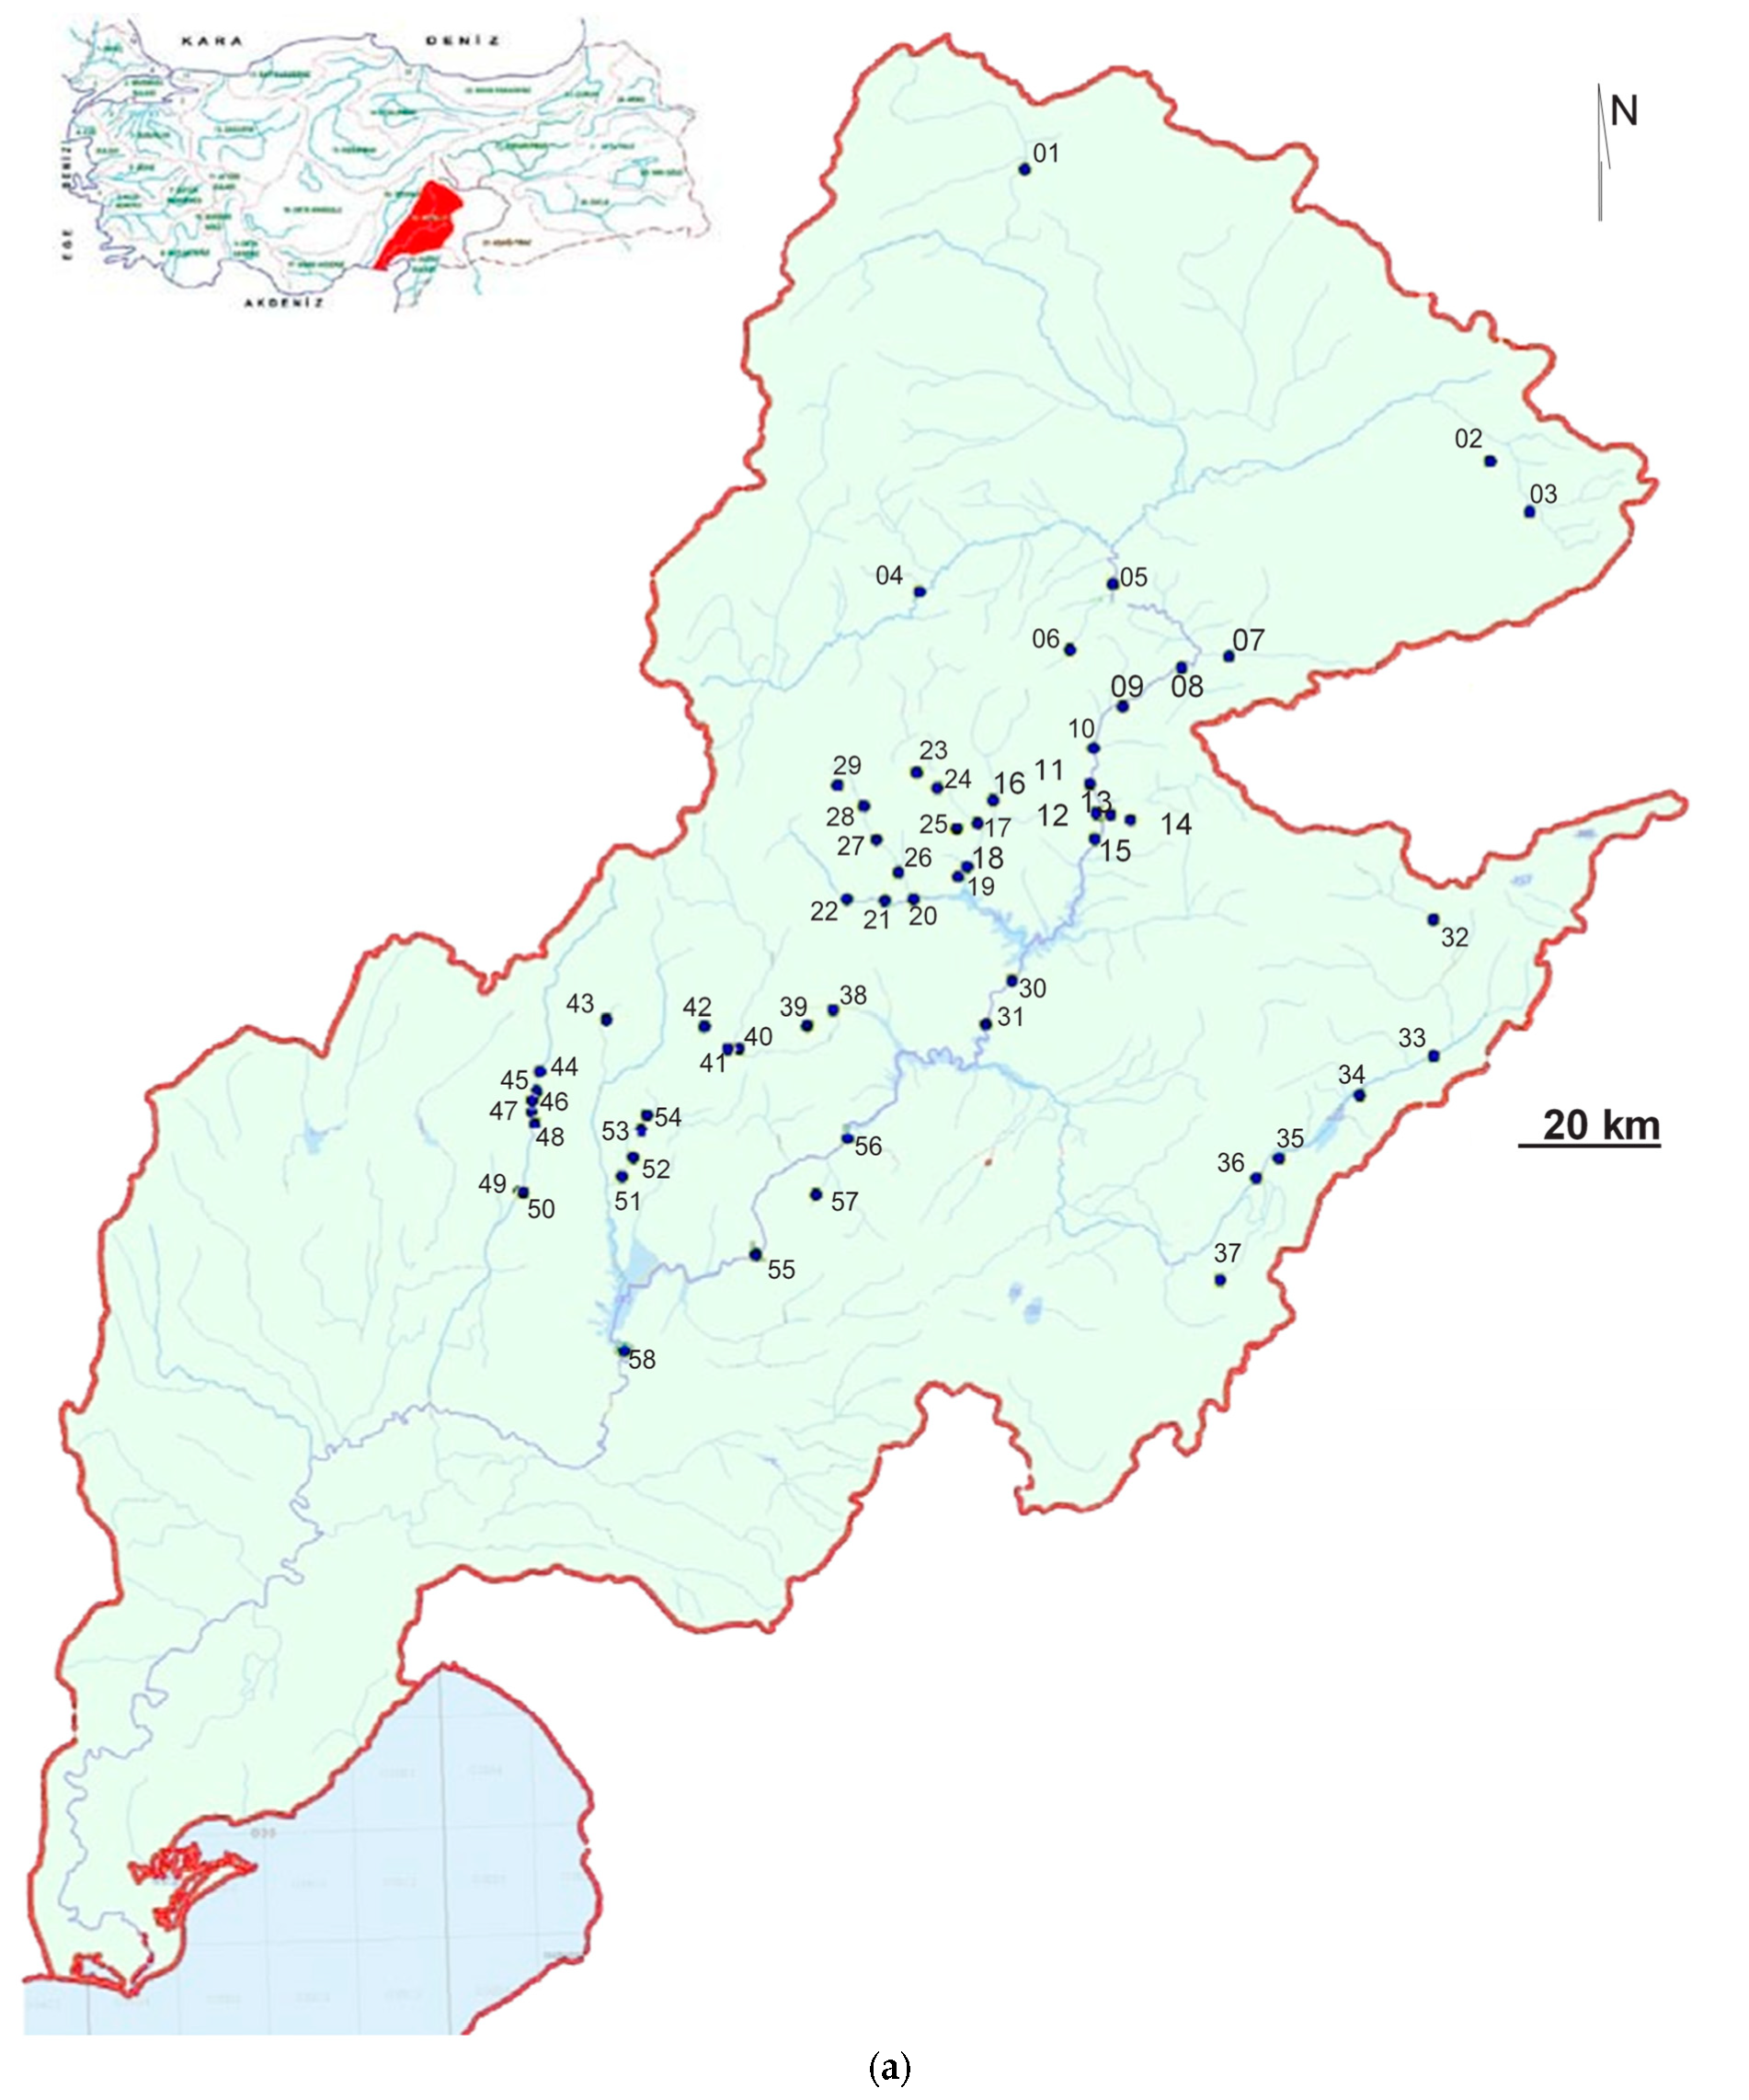
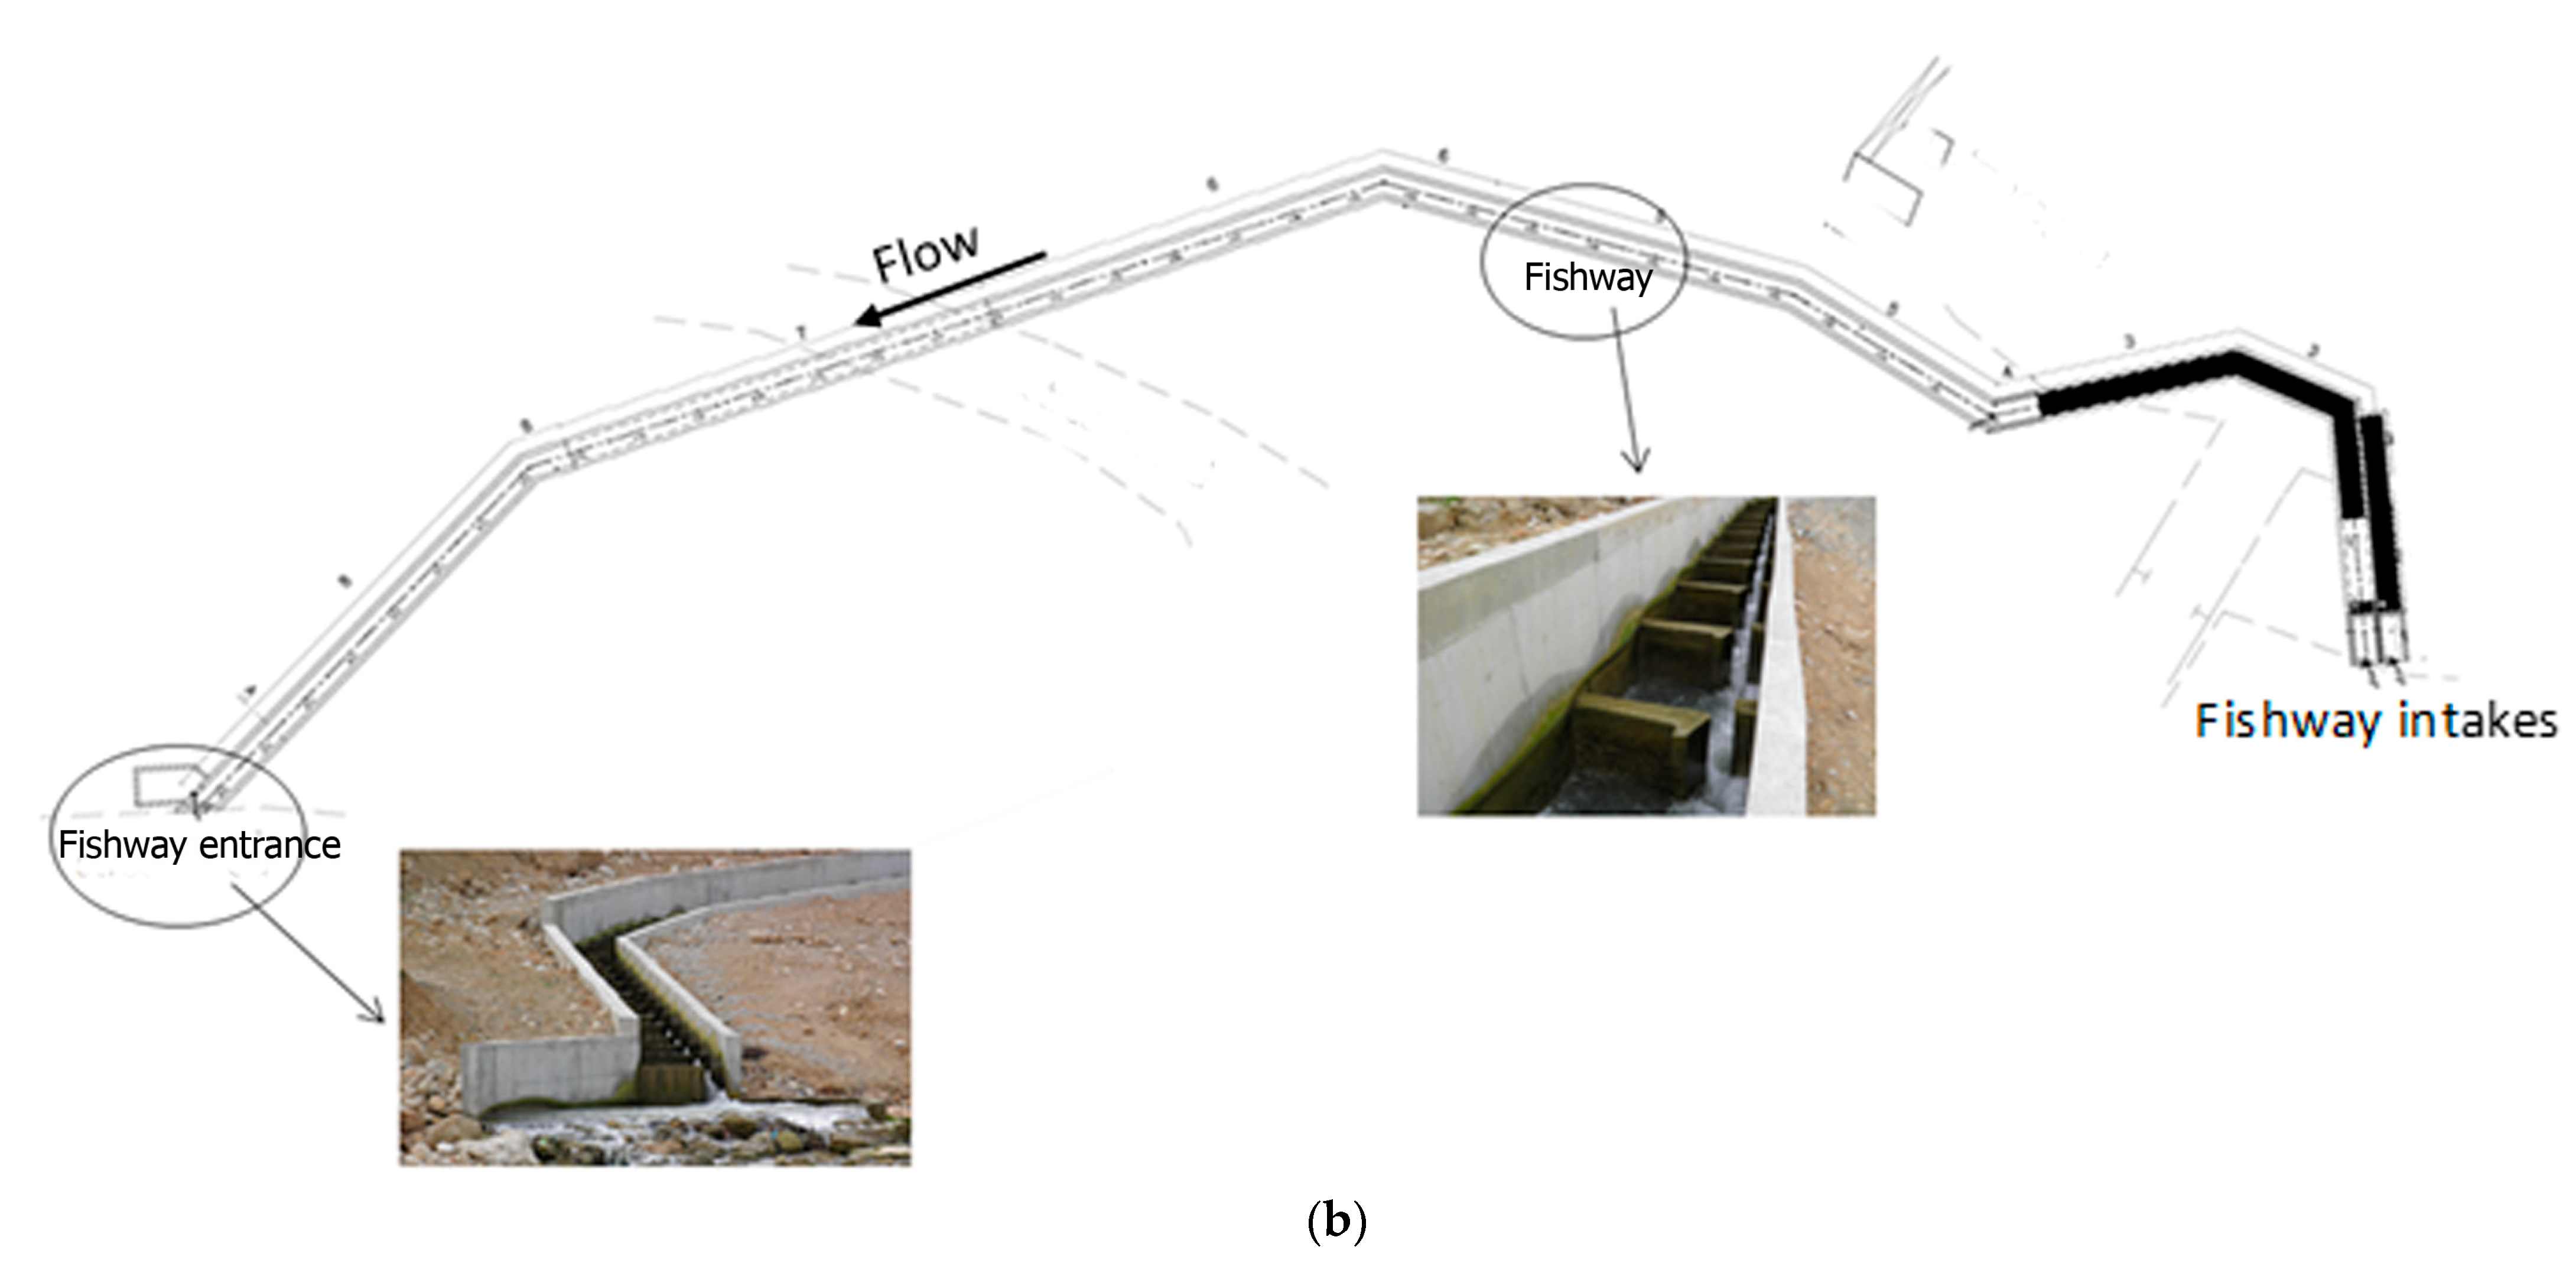
Within the scope of the present study, the vertical slot fish pass at the Çataloluk HPP, located on Tekir Stream in the Ceyhan River basin, was investigated (Figure 2). Çataloluk is a diversion-type HPP with a tunnel length of 2.68 km and a gross head of 109.40 m (net head = 106.60 m). The HPP is equipped with two horizontal Francis turbines with a total output of 9.84 MW at a design discharge of Qd = 10 m3/s. At the nominal operating level of the VSF with a design discharge of 330 L/s, the energy dissipation per unit volume in the pool was calculated as 200 W/m3. The width of the fish pass was 1.4 m, the length was 1.85 m, the width of the slot was 0.22 m, and the bed slope of the pool where the ADV measurements were taken was 7%. The fish pass had a total length of 140 m and a total height of 14.1 m with a variable bed slope of 7–10% (Figure 2). Due to the reservoir operation conditions, the fish pass had two water inlets at 837.50 m above sea level (asl) and 836.50 m asl. There were 66 pools in the fish pass. The volumetric energy dissipation rate of 200 W/m3 in the pass indicates that the flow in the pool is highly turbulent. The Çataloluk VSF was in the grayling river zone. Since the total head is higher than 9 m, the maximum allowable velocity in the project area is 1.7 m/s, and the limit value for the volumetric energy dissipation is 200 W/m3 [23]. The catchment area is 172.50 km2 and the annual average river discharge is 5 m3/s. The Kisik and Sucati HPPs are located upstream and downstream of the studied HPP, respectively.
The characteristics of the studied cyprinid fish species in the studied area are as follows: Capoeata Damescina occurs in lakes and streams with fast and slow-moving water currents in clear and muddy water, and spawns in small streams where it deposits its eggs on gravel and can attain a maximum body length of up to 50 cm. Alburnus kotschyi is found in a small isolated coastal stream at Arsuz on the eastern Mediterranean coast as well as in the Ceyhan and Seyhan River basins in southern Anatolia in Turkey, can attain a maximum body length of up to 16 cm, and this fish species is endemic to Turkey.
Although the VSF was dimensioned according to the DWA standard, the fish monitoring data revealed that it needs modification to improve the passage efficiency of small-bodied fish [24]. To this end, in the scope of the current project, porous brush blocks and bottom substrate (i.e., crushed stones (diameter in the range of 0.12–0.22 m)) were installed in the pools of the VSF (Figure 3).
2.2. Prototype Measurements
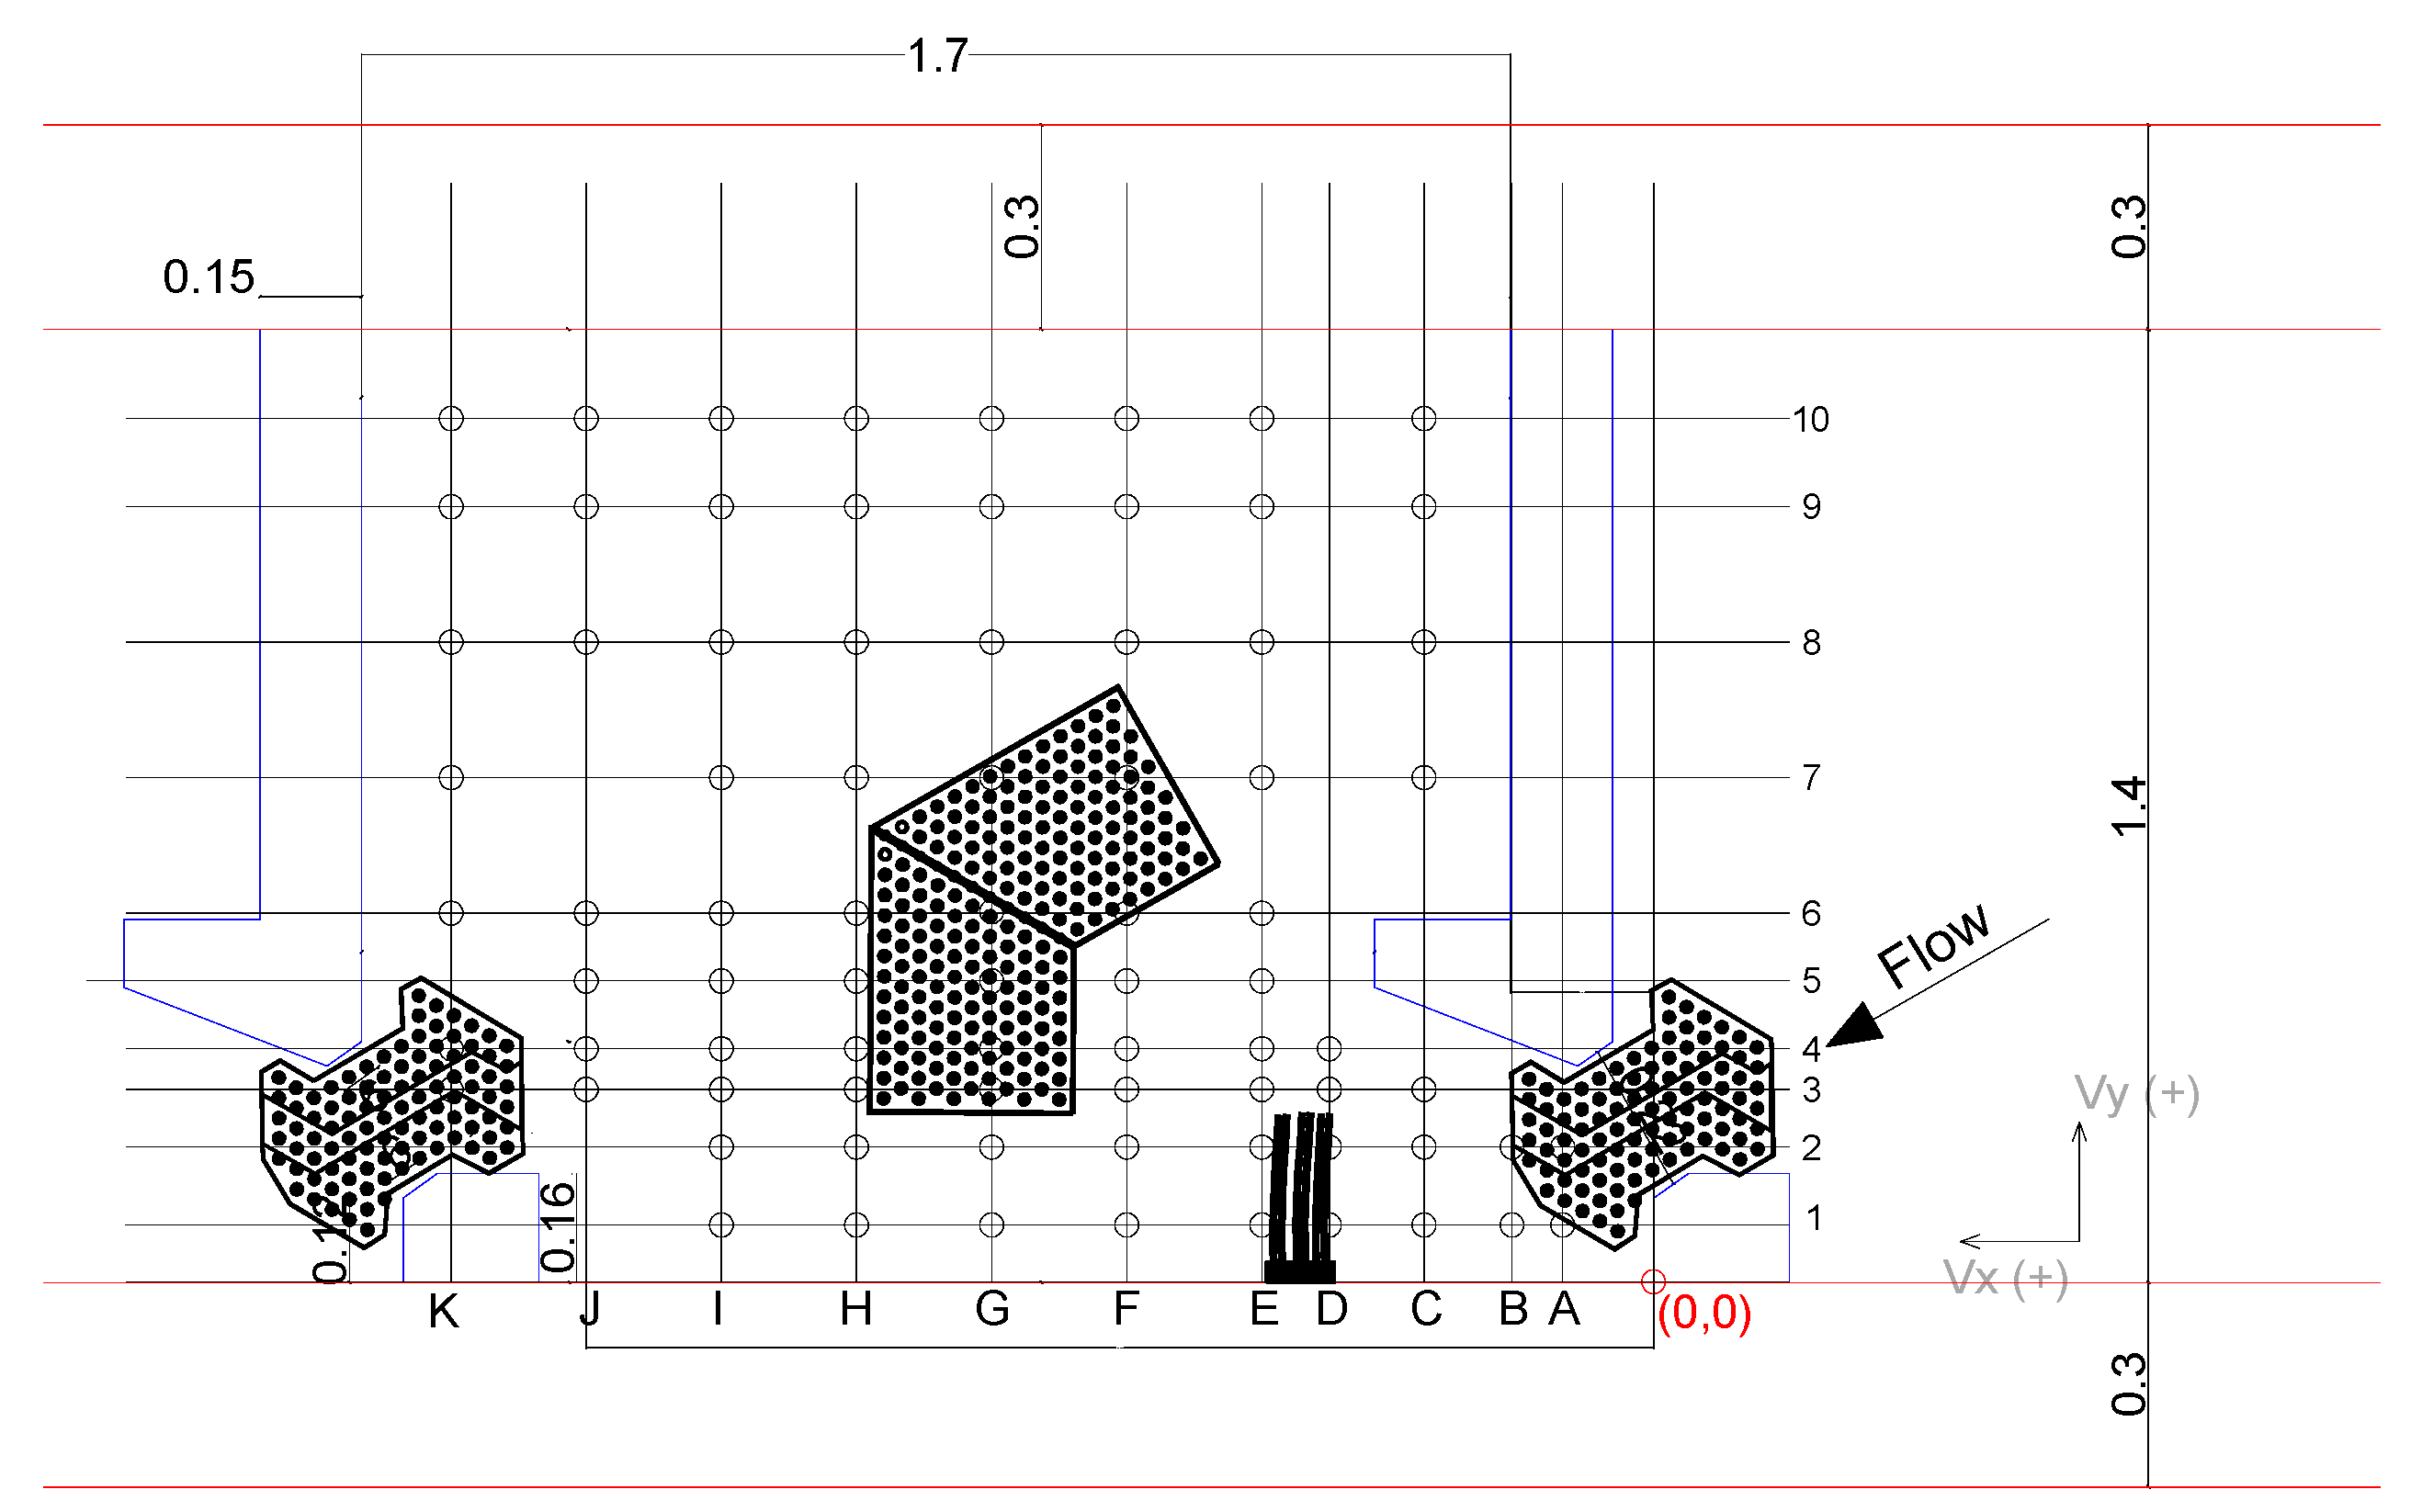
Hydrodynamic characteristics of the VSF, with and without brush blocks, were investigated at the Cataloluk HPP using an Acoustic Doppler Velocimeter, ADV (10-MHz Nortek Vectrino, Oslo, Norway). Instantaneous flow velocities were collected at a sampling frequency of 100 Hz for a sampling time of 30 s. Although a longer sampling duration with ADV could be better in the present case, it was not possible because of the dynamic operation of the HPP, affecting the headwater level and flow field in the pools. The hydraulic conditions in the pools had similar flow patterns. Therefore, a representative basin (20th pool from the fish passage entrance) was selected for the flow and turbulence measurements. In Figure 4, open circles show the velocity measurement points. The position accuracy was approximately 2 mm. The measuring grid was not distributed uniformly over the base area since it was expected that larger velocity gradients would occur in the area of the turbulent jet and in the vicinity of the wall. As shown in Figure 4, a grid with 10, 11, and 4 positions in the traverse, streamwise, and vertical directions points in the traverse direction, respectively, was established for the ADV measurements. To compare the flow and turbulent flow characteristics with the experimental data, our measurement grid spacing was kept similar to Hassinger’s [17] velocity sampling density. At the reference (design) pool depth of dp = 0.59 m, the ADV measurements were taken at four different vertical elevations from the bed (z = 0.05 m, z = 0.18 m, z = 0.31 m, z = 0.44 m). For the other pool depths, the ADV measurements were taken only at z = 0.05 m. The velocity data were collected for submerged brush blocks conditions below the brush level of hb = 0.47 m (Figure 3). We focused on the 2D flow structures in the horizontal plane. The measured ADV data were filtered with ExploreV software using the phase-space threshold despiking method. The signal post-processing included removing the average signal-to-noise ratio data less than 15 dB as well as the average correlation values less than 70%. The average pool depth (i.e., water level) was continuously monitored throughout the year by using an Ultrasonic Distance Sensor (UDS) with a sampling rate of 1 Hz at the representative pool of the fish passage with the Nivus i-series and Nivus GPRS datalogger. The 30-min time-averaged pool depths were recorded in the system.
From the 3D ADV measurements, the local mean resultant velocity Vres can be calculated using Equation (1)
where n is the number of velocity samples. The local mean resultant velocity (Vres) is a useful parameter for understanding the fish migration patterns [25]. The spatially-averaged resultant velocity <Vres> is obtained by numerically integrating the local Vres values through the horizontal plane. The maximum velocity in the pool can be estimated from the Toricelli equation:
where g is the acceleration of gravity and Δh is the water level difference between two pools. Furthermore, the spatial velocity gradient in the longitudinal (SVGx) and lateral (SVGy) directions are computed from
where SVGx is an important parameter related to flow acceleration or deceleration, which can trigger the avoidance or acceptance reaction of fish. From the time series of the velocity measurements, the root-mean-square of the turbulent fluctuation velocities in the longitudinal, lateral, and vertical directions, respectively, were calculated at each measurement point, and then the turbulence intensities in three directions were normalized as:
where Vmax is calculated from Equation (2). The x, y, and z coordinates represent the streamwise, lateral, and vertical directions, respectively. The turbulent kinetic energy per unit mass k is calculated from:
Then, the Reynolds shear stresses at the streamwise (τxz) and at the transverse (τxy) directions are computed from:
where ρ is the density of water. The Reynolds shear stresses are induced by velocity fluctuations and affect the momentum exchange and mixing processes [26]. The Reynolds shear stress represents a fluid force that involves a velocity gradient, which is essential for fish passage studies [27,28]. Fish may experience shear stress when moving between two layers of different velocities.
The energy dissipation per unit volume ∆P (W/m3) is calculated from:
where Q is the discharge; γ is the specific weight of the water; d is the uniform flow depth; and B is the channel width. Reynolds Re and bulk Froude number Fr are defined as
where q is the unit discharge and ν is the kinematic viscosity.
Quantifying fish movement is an essential task for evaluating the passage efficiency of fish passes. Accordingly, we installed two video cameras (Sony CCD 700 TVL, Tokyo, Japan) underwater in the fish pass to monitor the fish movements. The positions of the cameras were at the corners of the pool.
3. Results
The hydraulic parameters in the VSF at the study HPP are summarized in Table 1. The ADV velocity measurements were conducted at four different pool depths at the VSF without brush blocks. The pool depths and corresponding discharges were 0.59–1.19 m and 0.145–0.329 m3/s, respectively. The minimum pool depth was higher than the lower limit value of 0.5 m, which is recommended in DWA [23]. After retrofitting the VSF with the brush blocks and substrate, the ADV measurements were taken at the same pool depths excluding the hydraulic condition of dp = 1.19 m due to the overflow in the pool. The water elevation difference between the pools was 0.13 m. As seen in Table 1, the flow was subcritical under all hydraulic conditions. The jet Froude number ranged from 0.37 to 0.46; while, the jet Reynolds number varied between 6.6 × 10⁵ and 1.5 × 10⁶. In the calculation of the jet Reynolds and Froude numbers, the slot opening was taken as the length scale. In the present study, considering the high Reynolds number, viscous scale effects did not affect the results. Since the formation of vortices and momentum transfer were an important part of the investigation, the Reynolds number was of prime importance.
The velocity fields with and without brush blocks are compared in Figure 5. A turbulent jet (main flow) is discharged from a slot into a pool without brush blocks (Figure 5a). The centerline jet velocity decreases along the jet trajectory, which is consistent with the analytical solution of the turbulent jets [26]. This main flow is important for fish to attract and guide them for upstream migration. Without brush blocks, a maximum velocity of 1.48 m/s was measured at 0.21 m downstream of the slot (point B2). The maximum velocity value measured in the pool was roughly consistent with the theoretically calculated maximum velocity of Vmax = 1.6 m/s by Equation (2). The location of the maximum velocity indicates that the highest surface velocities occurred when the overfall flow plunged into the surface. The maximum velocity was reached at x = 0.21 m (just downstream of the slot), consistent with the study by Heimerl et al. [29]. The velocity vectors for the brush block case (Figure 5b) showed that a large recirculation was created around the main brush block, which was not observed in the pool with any brush block. After the installation of the brush blocks and bottom substrate, the maximum velocity downstream of the slot was reduced by 39% from 1.48 m/s to 1.05 m/s. The energy dissipation with the displacement of bristles caused a decrease in the maximum velocity in the slot, thus easing the upstream migration for fish. Moreover, the velocity magnitudes in the turbulent jet region were reduced and the recirculation region disappeared (Figure 5b). For the VSF, the spatial velocity gradient in the lateral direction was the dominant one. For the existing structure, the maximum SVGy with a value of −7.5 m/s/m was observed at x = 0.58 m and y = 0.2 m; after the structural modification maximum SVGy with a value of −2.2 m/s/m observed at x = 0.78 m and y = 0.34 m. Despite a strong reduction in SVGy, such values were still above the limiting value of 1–1.2 m/s/m [26,27,28]. However, these values were the maximum measured in the VSF, occurring only at specific locations where fish may avoid swimming through.
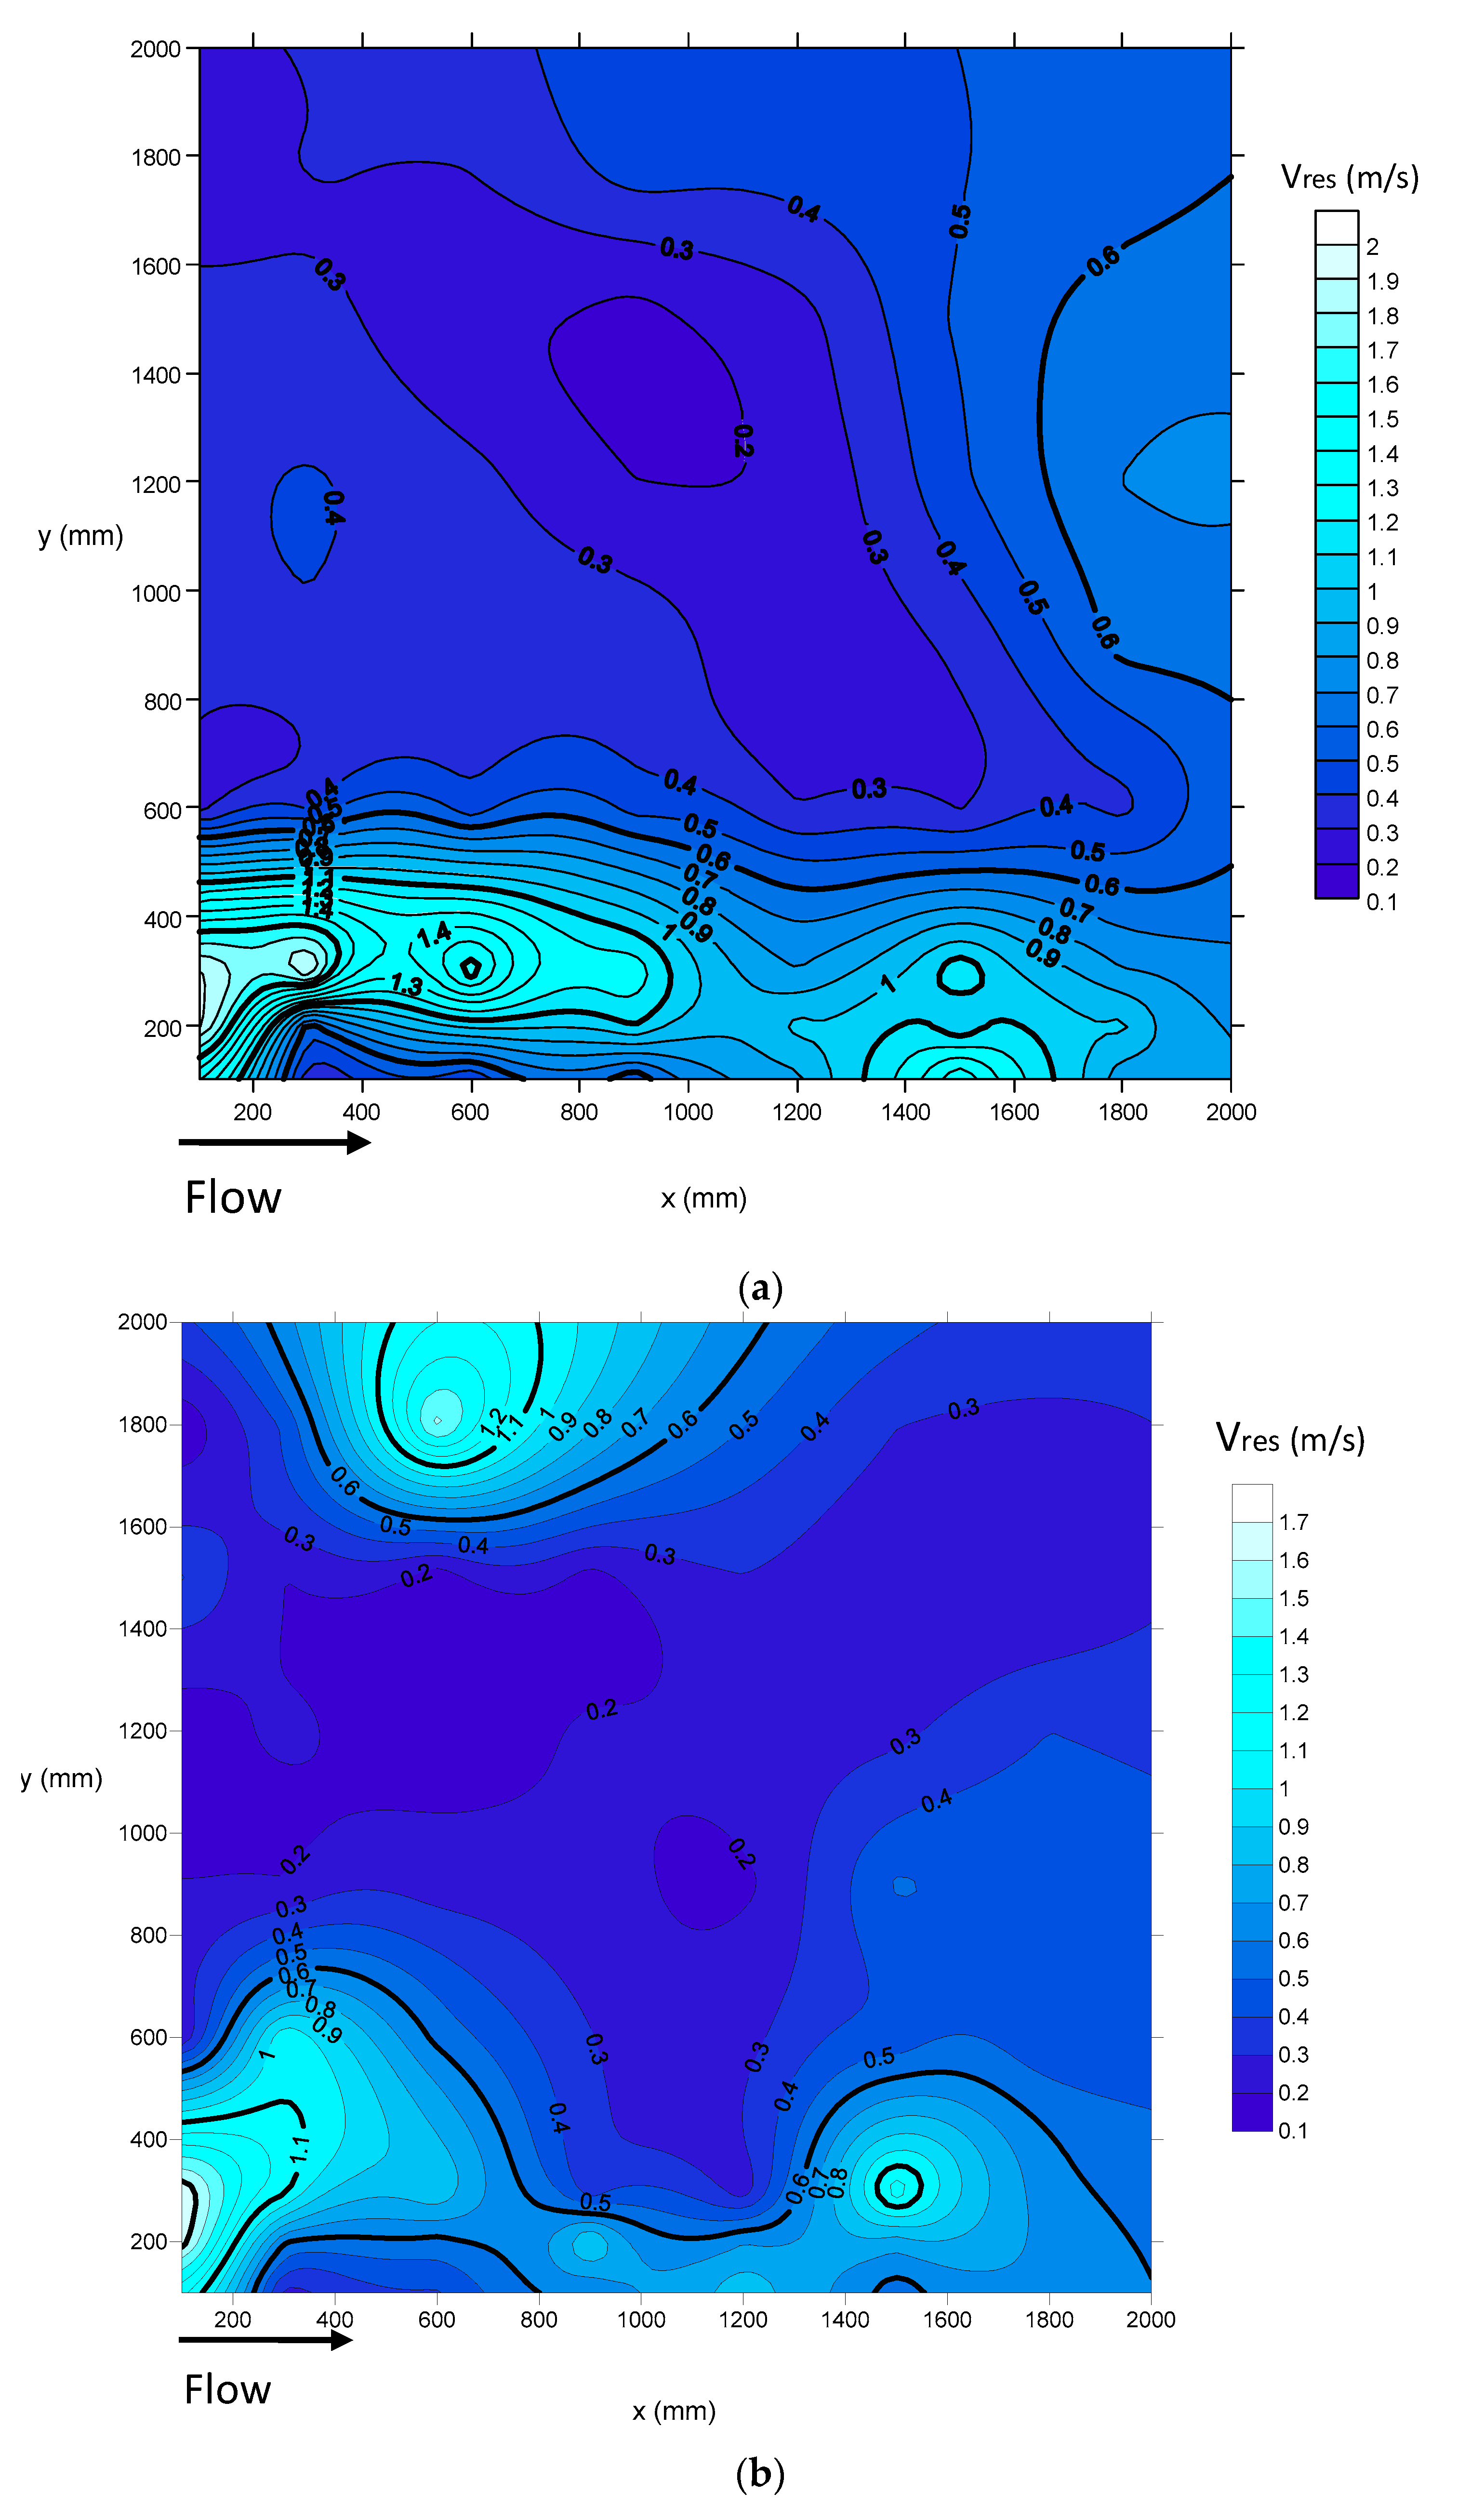
The spatial distribution of the local resultant velocity Vres in the pool is shown in Figure 6. The high-velocity level in the jet region (main flow) and reduced velocity zones aside from the jet can be seen in Figure 6a. The bristles mounted vertically deflect the flow to the right side of the pool in the flow direction, causing a flow circulation around the brush at the middle of the pool (Figure 6b). In the brush blocks, the flow’s kinetic energy is absorbed as a result of the flow–bristle interaction and thus the acceleration of the flow is prevented. In the VSF without modification, the spatial resultant velocity distribution in the pool varied between 0.1 m/s and 1.5 m/s; after the brush placement, Vres had a range of 0.1 m/s to 1.1 m/s. The measured velocity data indicate that the VSF with brushes meet the requirements of the threshold velocity values defined for different fish passage types based on different fish regions. The maximum temporal average resultant velocities were below 1.1 m/s, which is suitable in terms of the maximum allowable velocity of 1.7 m/s for the grayling river zone [23].
The distribution of the resultant velocity in the vertical section E (x = 0.58 m) is shown in Figure 7. In both conditions (with and without brush blocks), the velocity was not uniformly distributed over the pool depth and increased towards the water surface. The highest velocities were observed close to the upper half of the pool and the free-surface (Figure 7a). After the installation of the brush block, the main flow was directed into the pool center (i.e., y = 0.40 m) with reduced velocity values. Moreover, the velocities in the zone close to the bottom were reduced by the placement of the substrate and a new boundary was created (Figure 7b).
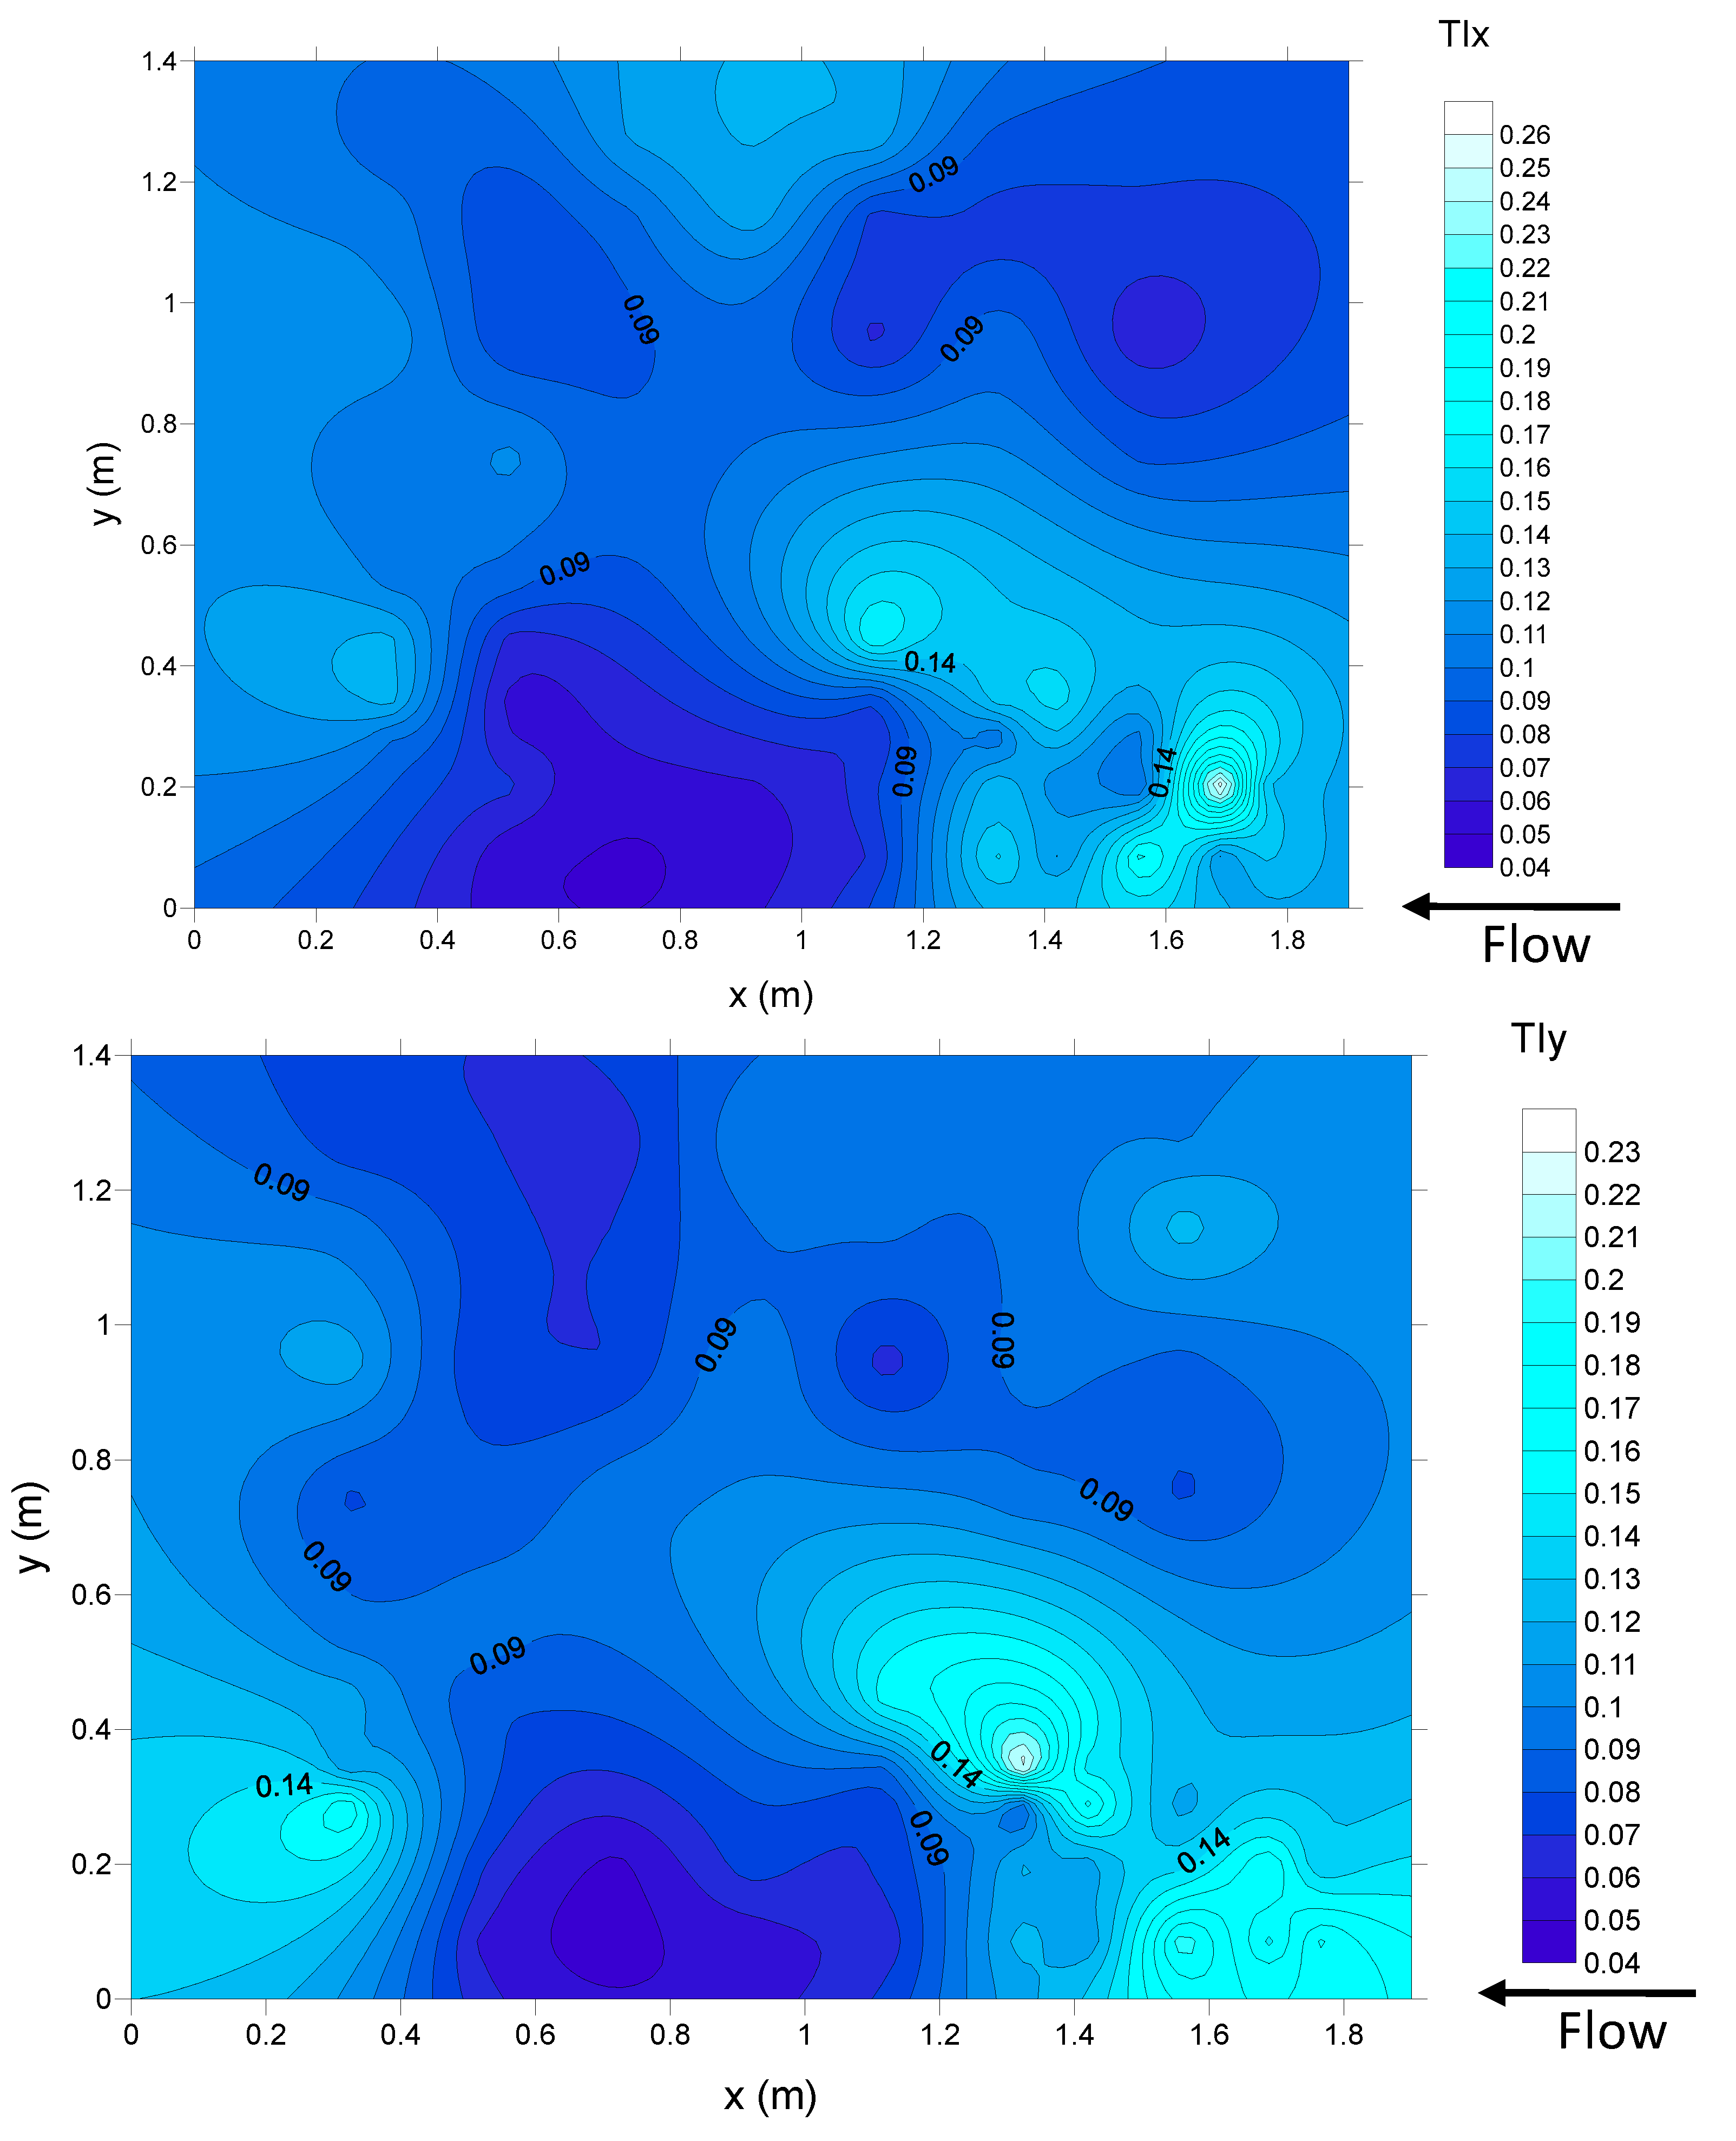
The spatial distribution of the streamwise (TIx) and transverse (TIy) turbulence intensities without and with the brushes are presented in Figure 7 and Figure 8, respectively. Figure 8 and Figure 9 show the distributions of the turbulence quantities at a 0.05 m distance from the bottom in order to reveal the influence of the bottom roughness. The important point in the turbulence intensity distributions in the VSF without the brushes is that the maximum transverse turbulence intensity was higher (i.e., TIy = 0.42 at x = 0.13 m) than that of the maximum streamwise turbulence intensity (i.e., TIx = 0.38 at x = 0.48 m) downstream of the slot in the jet region (Figure 8). After the installation of the brush block, the main turbulent intensity region shifted into the pool center with reduced intensity values (Figure 9). With the brush blocks, the maximum TIy and TIx were reduced by 45% and 31%, respectively.
In this study, τxy, the lateral component of the Reynolds shear stress, was also used as a reference parameter to evaluate the fish migration corridors and swimming costs. Figure 10 shows the distribution of the Reynold shear stress in the lateral direction with and without brush conditions in the pool. For the existing structure, the highest τxy, with a value of 88.64 Pa, was observed immediately downstream of the slot at x = 0.21 m, where the turbulent jet entered the pool. After the placement of brush blocks, the maximum shear stress τxy, with a value of 28.81 Pa, was measured immediately downstream of the slot at x = 0.34 m. The shear stress exhibited a uniform distribution of about 4 Pa in the circulation region with a low-velocity zone. The lowest values of τxy, in the order of 2 Pa, were generally observed at the back of the brush blocks and on the right side of the pool. These areas are considered as potential resting and refuge areas for fish. After the installation of the brush blocks and bottom substrate, the spatially-averaged lateral component of the shear stress was reduced by 43% (Figure 10b). Moreover, it was found that the spatially averaged lateral component of the Reynolds shear stress was higher than the streamwise component of the Reynolds shear stress with a factor of 3.3. The higher value in the Reynolds shear stress transverse component (τxy) can be explained due to the 2D flow structure and horizontal mixing in the pool. Accordingly, τxy was selected as the principal shear stress for the analysis.
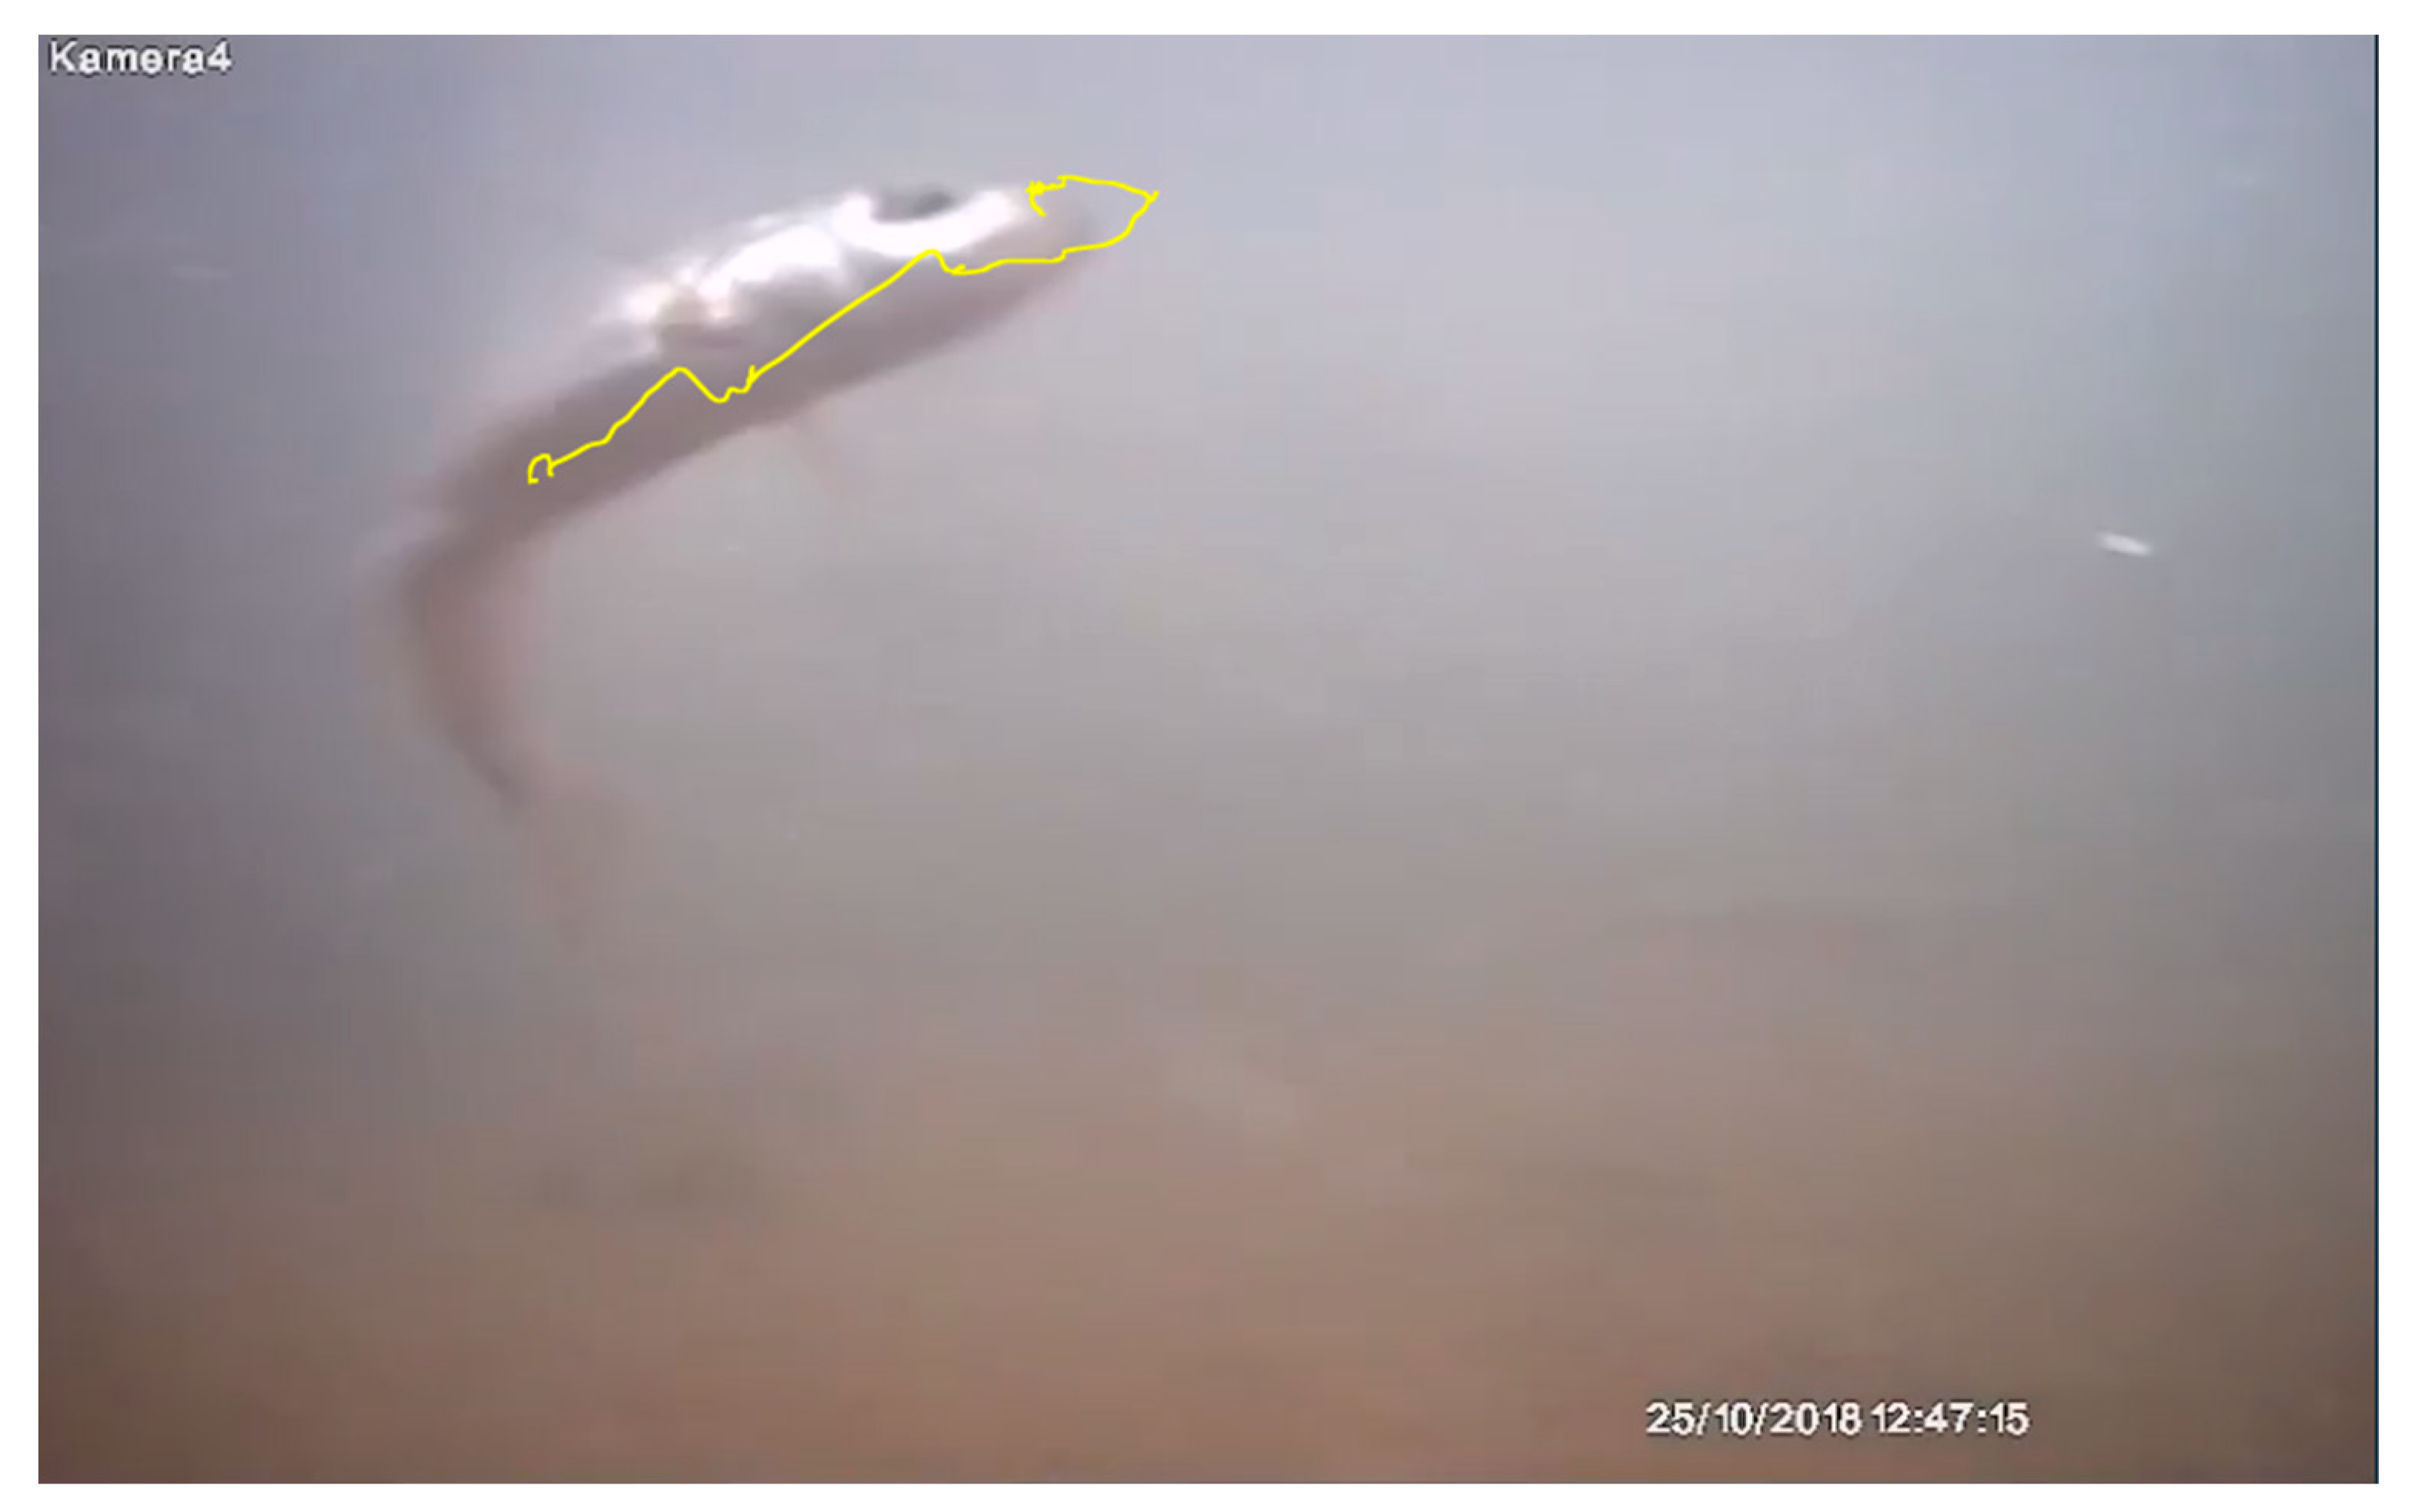
Consequently, the low Reynolds shear stress regions behind brush blocks would be suitable for fish passage because fish usually avoid entering areas of high turbulent shear regions at sustained swimming levels. Underwater video recordings revealed that the Reynolds shear stresses also strongly affected the fish swimming performance and stability in the slot region without brush blocks (Figure 11). After the retrofitting, the maximum lateral component of the Reynolds shear stress observed in the slot region was reduced by a factor of 3, which is crucial for the easy passage of fish.
4. Discussion
Herein, we compared the prototype results with the laboratory scale physical model results for a different geometry from the prototype with and without brush blocks in a VSF. The model tests were conducted by Hassinger [17] at a Froude scale of 1:1 in the hydraulics laboratory and testing facilities of Kassel University Department of Civil and Environmental Engineering. In this study, the measured data of the physical model were reanalyzed, and distributions of the velocity vectors were obtained for z = 0.05 m. Figure 12 shows the 2D vector maps for the modeled VSF without and with brush blocks. The general flow patterns and velocity magnitudes from the model measurements were in good agreement with those from the prototype measurements at the VSF of the Cataloluk HPP. There was a considerable difference between the maximum velocity value of 1.93 m/s and the theoretically calculated maximum velocity of 1.76 m/s in the model. This result is in agreement with the experimental study by Quaresma et al. [15], where they found that the maximum velocities in the slot were higher than the maximum theoretical velocity. Moreover, Bombač et al. [17] also found maximum velocities 50% higher than the maximum theoretical value when performing the flow field measurements in a vertical slot fishway. The physical model maximum measured velocity, observed just downstream of the slot, was reduced by 14.7% after the installation of brush blocks (Figure 12b). As can be seen from Figure 12b, when the bush blocks were installed in the pool, the recirculation regions disappeared. In the existing structure, the flow depth gradually increased, and the jet velocity decreased along the pool, creating a deceleration zone in the main flow region. For instance, the flow depth increased from 0.55 m at the pool entrance to 0.63 m at the pool exit [7].
Similar to the prototype observations, in the physical model without the brush condition, the spatial velocity gradient in the lateral direction was dominant and steeper than that in the rehabilitated case (Figure 13). Beck et al. [30] reported that the curved-bar rack-bypass system (CBR-BS) creates high SVGx values > 50 m/s/m near and in between the bars, and fish avoid such values and are hence guided to the bypass system. The CBR-BS is a behavioral fish protection and guidance system and consists of vertical curved bars, which are arranged with an equidistant spacing along the rack axis and mounted in a rack frame. The velocity component parallel to the rack guides the fish toward the bypass system without causing a shock from the major physical contact at the rack [31]. Haro et al. [32] and Enders et al. [33] reported a threshold value of SVGx ≤ 1.0–1.2 s−1 for Atlantic and Chinook salmon (Oncorhynchus tshawytscha) smolts, respectively, below which fish did not show an avoidance reaction. In the vertical slot-brush fish pass, the lateral velocity gradient created a transverse exchange of momentum. After the installation of the brush blocks, the deceleration zones were shortened and reduced considerably (Figure 13b). For the existing structure, a maximum Vres with a value of 1.93 m/s was observed at x = 0.3 m and y = 0.2 m; after the structural modification, the maximum Vres with a value of 1.65 m/s/m was observed at x = 0.2 m and y = 0.2 m. After the installation of the brush blocks and bottom substrate, the discharge was reduced by 12.1% for the same head.
In situ high-resolution measurements in the Cataloluk VSF revealed that the flow velocities did not change considerably with the increase in the discharge, but the TKE increased considerably in the pool with the increase in the discharge (Table 1). This result is consistent with the study by Tarrade et al. [11], who found that the discharge variation had little influence on the flow characteristics and topology in VSF. Moreover, our fieldwork in Cataloluk under real-time operation conditions confirmed the expected hydraulic performance of the brush blocks in VSFs. However, existing retrofitting designs for VSFs were only tested by laboratory experiments [21,22]. Furthermore, the proposed innovative design is cost-efficient and easy to implement in existing VSFs. The bristles are made of polypropylene and, according to current experiences, a service life of 15–20 years can be expected for the bristles [34,35]. However, in almost all brush-furnished passages, organic material will enter the bristle elements. Such a material within the brush blocks is of minor importance in terms of function as long as the slots remain open, and it is recommended that the bristle elements should be combed with a rake at least twice per year [7]. The prefabricated elements of brush blocks and bristle bundles shortened the construction duration considerably (i.e., there were no concrete pouring works). The investment cost is about EUR 15,000 and the retrofitting work was completed in one week, which is consistent with the study by Kucukali et al. [36,37]. It should be noted that in the literature, alternative hydraulic designs have been proposed for existing VSFs to improve the system’s efficiency such as increasing the pool length and changing the slot geometry [16,38]. However, applying the geometrical optimization in existing VSFs may not be feasible in terms of the cost and ease of construction. Kucukali et al. [39] conducted a fish-monitoring study at the fish pass of the present case study HPP by using the telemetry method. After the installation of the brush blocks and substrate, the upstream passage efficiency of Capoeta damascina increased by a factor of four.
5. Conclusions
The present study deals with the hydraulic performance of the prototype VSF without and with brush elements by conducting velocity measurements in the field. The case study of VSF for the upstream fish passage is located at the Cataloluk HPP on Tekir Stream in the Ceyhan River basin in Turkiye. The present results show that the flow–bristle interaction reduced the velocity magnitudes and fluctuations in the VSF and created refuge areas for fish. The VSF with brush blocks fulfills the requirements for an efficient fish passage by ensuring adequate hydraulic conditions and different migration corridors with no obstructions for different fish species. A significant amount of energy dissipation takes place in brush blocks with the displacement of bristles, giving rise to an energy transfer from the main flow to the bristles. The brush blocks deflected the velocity, changed the spatial distribution of the turbulent quantities, and dampened the unsteady flow dynamics. Accordingly, the velocity, turbulence intensity, and Reynolds shear stress values in the VSF with brush blocks were much lower than the corresponding values of the VSF without blocks, making it more beneficial for small-bodied fish. The modified VSF presented a larger suitable pool volume percentage for multiple fish species compared to the existing structure. The bristles, as energy absorbers, represent a cost-effective option, which can be retrofitted in a short time in existing facilities to improve the hydraulic conditions in fish passages.
Supplementary Materials
The following supporting information can be downloaded at: https://www.mdpi.com/article/10.3390/w15061155/s1, Video S1: influence of the turbulent shear stresses on the stability and swimming performance of Alburnus kotschyi, which is endemic to Turkey, at the base of the slot in existing fish pass.
Author Contributions
All authors contributed to writing and editing the manuscript. All authors listed have contributed substantially to the manuscript to be included as authors. Conceptualization, S.K.; Methodology, S.K., I.A. and A.A.; Formal analysis, S.K., I.A. and A.A.; Investigation, S.K. and A.A.; Resources, S.K. and A.A.; Writing—original draft preparation, S.K., I.A. and A.A.; Writing—review and editing, S.K., I.A. and A.A.; Supervision, S.K., I.A. and A.A.; Funding acquisition, S.K. All authors have read and agreed to the published version of the manuscript.
Funding
This research was funded by Turkish Scientific and Technological Council of Turkey (TUBITAK), grant number 117M151.
Acknowledgments
We thank the operators at the Cataloluk Hydropower Plant for their help during the field study.
Conflicts of Interest
The authors declare no conflict of interest.
References
- Alp AAkyüz, M.; Kucukali, S. Ecological impact scorecard of small hydropower plants in operation: An integrated approach. Renew. Energy 2020, 162, 1605–1617. [Google Scholar]
- HPE-Hydropower Europe Forum 2021. Research and Innovation Agenda (RIA). Available online: www.hydropower-europe.eu (accessed on 15 January 2023).
- Peter, A.; Schoelzel, N.; Wilmsmeier, L.; Albayrak, I.; Bravo-Córdoba, F.J.; García-Vega, A.; Fuentes-Pérez, J.F.; Valbuena-Castro, J.; Carazo-Cea, O.; Escudero-Ortega, C.; et al. The Attractiveness of Fishways and Bypass Facilities. In Novel Developments for Sustainable Hydropower; Rutschmann, P., Kampa, E., Wolter, C., Albayrak, I., David, L., Stoltz, U., Schletterer, M., Eds.; Springer: Cham, Switzerland, 2022; pp. 61–81. [Google Scholar] [CrossRef]
- Gysi, M.H. Combination of mitigation strategies & challenges for decisionmaking in Switzerland. In Proceedings of the FIThydro Stakeholder Workshop Alpine Region, Augsburg, Germany, 10–11 September 2018. [Google Scholar]
- Gessner, J. If we build it, will they use it? Fish passage facilitation at man-made obstacles. In Proceedings of the Fish Passages and Migrations Workshop, Istanbul, Turkey, 9–11 September 2016; p. 19. [Google Scholar]
- Wanningen, H. Swimways of the world: Optimizing the policy cycle to open up rivers for migratory fishes. In Proceedings of the Fish Passages and Migrations Workshop, Istanbul, Turkey, 9–11 September 2016; p. 18. [Google Scholar]
- Kucukali, S.; Hassinger, R. Flow and Turbulence Structure in a Vertical Slot–Brush Fish Pass. In Recent Trends in Environmental Hydraulics; Springer: Berlin, Germany, 2020; pp. 137–146. [Google Scholar]
- Rajaratnam, N.; Van der Vinne, G.; Katopodis, C. Hydraulics of vertical slot fishways. J. Hydraul. Eng. 1986, 112, 909–927. [Google Scholar] [CrossRef]
- Rajaratman, N.; Katopodis, C.; Solanki, S. New designs for vertical slot fishways. Can. J. Civ. Eng. 1992, 19, 402–414. [Google Scholar] [CrossRef]
- Tarrade, L.; Texier, A.; David, L.; Larinier, M. Topologies and measurements of turbulent flow in vertical slot fishways. Hydrobiologia 2008, 609, 177–188. [Google Scholar] [CrossRef] [Green Version]
- Tarrade, L.; Pineau, G.; Calluaud, D.; Texier, A.; David, L.; Larinier, M. Detailed experimental study of hydrodynamic turbulent flows generated in vertical slot fishways. Environ. Fluid Mech. 2011, 11, 1–21. [Google Scholar] [CrossRef] [Green Version]
- Marriner, B.A.; Baki, A.B.M.; Zhu, D.Z.; Thiem, J.D.; Cooke, S.J.; Katopodis, C. Field and numerical assessment of turning pool hydraulics in a vertical slot fishway. Ecol. Eng. 2014, 63, 88–101. [Google Scholar] [CrossRef]
- Liu, M.; Rajaratnam, N.; Zhu, D.Z. Mean flow and turbulence structure in vertical slot fishways. J. Hydraul. Eng. 2006, 132, 765–777. [Google Scholar] [CrossRef]
- Bermúdez, M.; Puertas, J.; Cea, L.; Pena, L.; Balairón, L. Influence of pool geometry on the biological efficiency of vertical slot fishways. Ecol. Eng. 2010, 36, 1355–1364. [Google Scholar] [CrossRef]
- Bombač, M.; Novak, G.; Mlačnik, J.; Četina, M. Extensive field measurements of flow in vertical slot fishway as data for validation of numerical simulations. Ecol. Eng. 2015, 84, 476–484. [Google Scholar] [CrossRef]
- Quaresma, A.L.; Romão, F.; Branco, P.; Ferreira, M.T.; Pinheiro, A.N. Multi slot versus single slot pool-type fishways: A modelling approach to compare hydrodynamics. Ecol. Eng. 2018, 122, 197–206. [Google Scholar] [CrossRef]
- Hassinger, R. Steigerung der energieumwandlung in schlitzpässen mit borstenelemen-ten. In Report on Laboratory Tests on a 1:1 Scale; Kassel University: Kassel, Germany, 2007. (In German) [Google Scholar]
- Puertas, J.; Cea, L.; Bermudez, M.; Pena, L.; Rodriguez, A.; Rabunal, J.R.; Balairon, L.; Lara, A.; Aramburu, E. Computer application for the analysis and design of vertical slot fishways in accordance with the requirements of the target species. Ecol. Eng. 2012, 48, 51–60. [Google Scholar] [CrossRef]
- Mallen-Cooper, M. Fish passage in Australia: Universal lessons. In Proceedings of the Fish Passage 2015 Conference, Groningen, The Netherlands, 22–24 June 2015. [Google Scholar]
- Coe, T. Swimming abilities of Mekong fish species. In Proceedings of the Fish Passage 2016 Conference, Amherst, MA, USA, 22 June 2016. [Google Scholar]
- Santos, J.M.; Branco, P.; Katopodis, C.; Ferreira, T.; Pinheiro, A. Retrofitting pool-and-weir fishways to improve passage performance of benthic fishes: Effect of boulder density and fishway discharge. Ecol. Eng. 2014, 73, 335–344. [Google Scholar] [CrossRef]
- Calluaud, D.; Pineau, G.; Texier, A.; David, L. Modification of vertical slot fishway flow with a supplementary cylinder. J. Hydraul. Res. 2014, 52, 614–629. [Google Scholar] [CrossRef]
- DWA (German Association for Water, Wastewater and Waste). Merkblatt DWA-M 509: Fischaufstiegsanlagen und Fischpassierbare Bauwerke—Gestaltung, Bemessung, Qualitätssicherung; Deutsche Vereinigung für Wasserwirtschaft: Hennef, Germany, 2014. (In German) [Google Scholar]
- Alp, A.; Akyüz, A.; Özcan, M. Efficiency and suitability of fish passages in River Ceyhan, Turkey. In Proceedings of the Fish Passage 2015 Conference, Groningen, The Netherlands, 22–24 June 2015. [Google Scholar]
- Kucukali, S.; Hassinger, R. Flow and turbulence structure in a baffle–brush fish pass. PI Civ. Eng.-Water Manag. 2018, 171, 6–17. [Google Scholar] [CrossRef]
- Piquet, J. Turbulent Flows. Models and Physics; Springer: Berlin, Germany, 2010. [Google Scholar]
- Silva, A.T.; Santos, J.M.; Ferreira, M.T.; Pinheiro, A.N.; Katopodis, C. Effects of water velocity and turbulence on the behaviour of Iberian barbell (Luciobarbus bocagei, Steindachner 1864) in an experimental pool-type fishway. River Res. Appl. 2011, 27, 360–373. [Google Scholar] [CrossRef]
- Enders, E.C.; Castro-Santos, T.; Lacey, R.W.J. The effects of horizontally and vertically oriented baffles on flow structure and ascent performance of upstream-migrating fish. J. Ecohydraulics 2017, 2, 38–52. [Google Scholar] [CrossRef] [Green Version]
- Heimerl, S.; Hagmeyer, M.; Echteler, C. Numerical flow simulation of pool-type fishways: New ways with well-known tools. Hydrobiologia 2008, 609, 189–196. [Google Scholar] [CrossRef]
- Beck, C.; Albayrak, I.; Meister, J.; Boes, R.M. Hydraulic performance of fish guidance structures with curved bars: Part 1: Head loss assessment. J. Hydraul. Res. 2020, 58, 807–818. [Google Scholar] [CrossRef]
- Albayrak, I.; Boes, R.M. Fish Guidance Structure with Wide Bar Spacing: Mechanical Behavioural Barrier. In Novel Developments for Sustainable Hydropower; Rutschmann, P., Kampa, E., Wolter, C., Albayrak, I., David, L., Stoltz, U., Schletterer, M., Eds.; Springer: Cham, Switzerland, 2022; pp. 99–104. [Google Scholar] [CrossRef]
- Haro, A.; Odeh, M.; Noreika, J.; Castro-Santos, T. Effect of water acceleration on downstream migratory behavior and passage of Atlantic salmon smolts and juvenile American shad at surface bypasses. Trans. Am. Fish. Soc. 1998, 127, 118–127. [Google Scholar] [CrossRef]
- Enders, E.C.; Gessel, M.H.; Anderson, J.J.; Williams, J.G. Effects of decelarating and accelerating flows on juvenile salmonid behavior. Trans. Am. Fish. Soc. 2012, 141, 357–364. [Google Scholar] [CrossRef]
- Kucukali, S. An experimental investigation of flow resistance and turbulent flow in brush fish pass. PI Civ. Eng.-Water Manag. 2019, 172, 241–256. [Google Scholar] [CrossRef]
- Kucukali, S.; Hassinger, R. Hydraulic model test results of baffle–brush fish pass. PI Civ. Eng.-Water Manag. 2015, 168, 189–194. [Google Scholar] [CrossRef]
- Kucukali, S.; Verep, B.; Alp, A.; Turan, D.; Mutlu, T.; Kaya, C.; Yildirim, Y.; Toreyin, B.U.; Ozelçi, D. Flow structure and fish passage performance of a brush-type fish way: A field study in the Iyidere River, Turkey. Mar. Freshw. Res. 2019, 70, 1619–1632. [Google Scholar] [CrossRef]
- Kucukali, S.; Verep, B.; Albayrak, I. Hydrodynamic Characteristics of Diagonal Brush Fish Pass: Prototype Measurements. Water 2023, 15, 88. [Google Scholar] [CrossRef]
- Kedrovic, M.; Krdrovic, J. Upgrading the fish pass at the Nitra scheme, Slovakia. Int. J. Hydropower Dams 2019, 5, 97–99. [Google Scholar]
- Kucukali, S.; Alp, A.; Akyuz, A. Enhancing the Performance of Vertical Slot Fish Pass by Using Brush Elements: A Pilot Project for Çataloluk SHP. TUBITAK Project Final Report; Projet No: 117M151; Ankara, Turkey, Unpublished Work 2019. Available online: https://search.trdizin.gov.tr/tr/proje/ara (accessed on 14 March 2023). (In Turkish)
Figure 1.
Pool configuration with L = pool length, B = pool width, a = lateral baffle length, b = slot width, A = central baffle length, and axes of references (z is the vertical axis). Adapted from Peter et al. [3].
Figure 1.
Pool configuration with L = pool length, B = pool width, a = lateral baffle length, b = slot width, A = central baffle length, and axes of references (z is the vertical axis). Adapted from Peter et al. [3].

Figure 2.
(a) The location of Cataloluk HPP in the Ceyhan River basin, Turkey. Cataloluk HPP is shown at Point 27. (b) Plan view of the fish passage at the Cataloluk HPP.
Figure 2.
(a) The location of Cataloluk HPP in the Ceyhan River basin, Turkey. Cataloluk HPP is shown at Point 27. (b) Plan view of the fish passage at the Cataloluk HPP.


Figure 3.
To restore the VSF of Cataloluk HPP, the brush blocks and substrate were placed in the pools. The bristle modulus of elasticity Eb = 1.45 GPa (polypropylene), and the density of the bristle ρb = 905 kg/m3. Arrow shows the flow direction.
Figure 3.
To restore the VSF of Cataloluk HPP, the brush blocks and substrate were placed in the pools. The bristle modulus of elasticity Eb = 1.45 GPa (polypropylene), and the density of the bristle ρb = 905 kg/m3. Arrow shows the flow direction.

Figure 4.
Top view of the vertical slot-brush fishway and the velocity measurement grid (open circles) in a repeating section. Capital letters show the longitudinal measurement sections. Red lines show the reinforced concrete side walls. Dimensions are in m.
Figure 4.
Top view of the vertical slot-brush fishway and the velocity measurement grid (open circles) in a repeating section. Capital letters show the longitudinal measurement sections. Red lines show the reinforced concrete side walls. Dimensions are in m.

Figure 5.
Flow field in the VSF of Cataloluk HPP, Q = 0.145 m3/s, z = 0.18 m. (a) Existing structure and (b) after the installation of the brush blocks and substrate. Dimensions are in m.
Figure 5.
Flow field in the VSF of Cataloluk HPP, Q = 0.145 m3/s, z = 0.18 m. (a) Existing structure and (b) after the installation of the brush blocks and substrate. Dimensions are in m.

Figure 6.
Resultant velocity distribution in the Cataloluk vertical slot fish pass pool on the horizontal plane, Q = 0.145 m3/s, z = 0.18 m. (a) Existing structure and (b) after the installation of the brush blocks and substrate.
Figure 6.
Resultant velocity distribution in the Cataloluk vertical slot fish pass pool on the horizontal plane, Q = 0.145 m3/s, z = 0.18 m. (a) Existing structure and (b) after the installation of the brush blocks and substrate.

Figure 7.
Spatial distribution of the resultant velocity in the vertical section E. Q = 0.145 m3/s. (a) Existing structure, and (b) after the installation of the brush blocks and substrate.
Figure 7.
Spatial distribution of the resultant velocity in the vertical section E. Q = 0.145 m3/s. (a) Existing structure, and (b) after the installation of the brush blocks and substrate.

Figure 8.
The spatial distribution of the streamwise (TIx) and transverse (TIy) turbulence intensities in the existing structure. Q = 0.261 m3/s, z = 0.05 m.
Figure 8.
The spatial distribution of the streamwise (TIx) and transverse (TIy) turbulence intensities in the existing structure. Q = 0.261 m3/s, z = 0.05 m.

Figure 9.
The spatial distribution of the streamwise (TIx) and transverse (TIy) turbulence intensities after the installation of the brush blocks and substrate. Q = 0.261 m3/s, z = 0.05 m.
Figure 9.
The spatial distribution of the streamwise (TIx) and transverse (TIy) turbulence intensities after the installation of the brush blocks and substrate. Q = 0.261 m3/s, z = 0.05 m.

Figure 10.
The spatial distribution of τxy. Q = 0.261 m3/s, z = 0.05 m. (a) Existing structure, and (b) after the installation of the brush blocks and substrate.
Figure 10.
The spatial distribution of τxy. Q = 0.261 m3/s, z = 0.05 m. (a) Existing structure, and (b) after the installation of the brush blocks and substrate.

Figure 11.
Video frame of Alburnus kotschyi, which is endemic to Turkey, in the slot region without the brush block condition. The body form of Alburnus kotschyi shows that fish cannot ensure its stability due to the high turbulent shear forces in the slot region. The underwater video recording of this video frame is available in the Supplementary Materials to this paper.

Figure 12.
The flow field in the physical model, z = 0.05 m. (a) Without the brush condition, Q = 0.182 m3/s, and (b) with the brush condition, Q = 0.160 m3/s. The physical model of the VSF was built in a 2 m wide rectangular flume and the water surface elevation difference between the pools was 0.158 m.

Figure 13.
The resultant velocity distribution in the physical model, z = 0.05 m. (a) Existing structure Q = 0.182 m3/s, and (b) after the installation of the brush blocks and substrate. Q = 0.160 m3/s.
Figure 13.
The resultant velocity distribution in the physical model, z = 0.05 m. (a) Existing structure Q = 0.182 m3/s, and (b) after the installation of the brush blocks and substrate. Q = 0.160 m3/s.


Table 1.
The flow conditions in the pool where the ADV measurements were taken at the VSF.
| dp (m) | 0.59 | 0.73 | 0.97 | 1.19 |
| Q (m3/s) | 0.145 | 0.183 | 0.261 | 0.329 |
| Rej | 6.6 × 10⁵ | 8.3 × 10⁵ | 1.2 × 10⁶ | 1.5 × 10⁶ |
| Frj | 0.46 | 0.43 | 0.40 | 0.37 |
| <Vres> (m/s) | 0.40 | 0.45 | 0.48 | 0.49 |
| <TKE> (m2/s2) | 0.04 | 0.05 | 0.05 | 0.06 |
| (Vres)max (m/s) | 1.40 | 1.53 | 1.76 | 1.57 |
| (TKE)max (m2/s2) | 0.14 | 0.22 | 0.33 | 0.24 |
Notes: dp = average pool depth, Q = discharge, Rej = jet Reynolds number, Frj = jet Froude number, <Vres> = spatially-averaged resultant velocity, <TKE> = spatially-averaged turbulent kinetic energy, (Vres)max = maximum local resultant velocity, (TKE)max = maximum local turbulent kinetic energy.
Disclaimer/Publisher’s Note: The statements, opinions and data contained in all publications are solely those of the individual author(s) and contributor(s) and not of MDPI and/or the editor(s). MDPI and/or the editor(s) disclaim responsibility for any injury to people or property resulting from any ideas, methods, instructions or products referred to in the content. |
© 2023 by the authors. Licensee MDPI, Basel, Switzerland. This article is an open access article distributed under the terms and conditions of the Creative Commons Attribution (CC BY) license (https://creativecommons.org/licenses/by/4.0/).
Share and Cite
MDPI and ACS Style
Kucukali, S.; Alp, A.; Albayrak, I. Retrofitting Vertical Slot Fish Pass with Brush Blocks: Hydraulics Performance. Water 2023, 15, 1155. https://doi.org/10.3390/w15061155
AMA Style
Kucukali S, Alp A, Albayrak I. Retrofitting Vertical Slot Fish Pass with Brush Blocks: Hydraulics Performance. Water. 2023; 15(6):1155. https://doi.org/10.3390/w15061155
Chicago/Turabian StyleKucukali, Serhat, Ahmet Alp, and Ismail Albayrak. 2023. "Retrofitting Vertical Slot Fish Pass with Brush Blocks: Hydraulics Performance" Water 15, no. 6: 1155. https://doi.org/10.3390/w15061155
Note that from the first issue of 2016, this journal uses article numbers instead of page numbers. See further details here.