Article

Microplastics in Marine Sediments in Eastern Guangdong in the South China Sea: Factors Influencing the Seasonal and Spatial Variations

1
Institute of Marine Sciences and Guangdong Provincial Key Laboratory of Marine Disaster Prediction and Prevention, Shantou University, Shantou 515063, China
2
State Key Laboratory of Satellite Ocean Environment Dynamics, Second Institute of Oceanography, Ministry of Natural Resources of the People’s Republic of China, Hangzhou 310012, China
3
Key Laboratory of Industrial Ecology and Environmental Engineering (Ministry of Education, China), School of Environmental Science and Technology, Dalian University of Technology, Dalian 116024, China
*
Authors to whom correspondence should be addressed.
These authors contributed equally to this work.
Water 2023, 15(6), 1160; https://doi.org/10.3390/w15061160
Submission received: 3 February 2023 / Revised: 24 February 2023 / Accepted: 25 February 2023 / Published: 17 March 2023

Abstract

:
Little is known about the comprehensive factors influencing temporal changes in microplastic abundance in marine ecosystems. We investigated seasonal variations in the microplastic distribution in marine sediments in multiple-used zones of Eastern Guangdong in the South China Sea. The top 10 cm sediments from 26 sites were collected by grab sampling in the spring, summer, and winter of 2021. Marine sediments had the lowest microplastic abundance in summer, significantly lower than in other seasons. The size of microplastics varied from 22.5 to 4363.3 µm but the 50–200 µm range was the most abundant. Transparent and fragmented microplastics were the most frequently observed composition. Microplastic abundance negatively correlated to distance to the coast. However, seaweed ecosystems impacted microplastic abundance by changing the microenvironment and/or direct contact and entrapment. Microplastic abundance is closely related to coastal mariculture and local residential and industrial activities. Polypropylene, polypropylene-polyethylene copolymer, polyethylene terephthalate, and polyethylene were the most frequently detected compositions, probably from packaging materials, textiles, and electronic/electrical/building industries. This work helps to understand the role of multiple-used zones and their influence on microplastic distributions in marine ecosystems. Appropriate management of the use and disposal of plastic waste on land was recommended to alleviate microplastic pollution in the marine environment.

1. Introduction

Plastics have been widely applied in human life, with a large quantity of production (globally from 1.7 million tons in 1950 to 359 million tons in 2018) and consumption and, accordingly, an increase in plastic waste [1,2]. Plastic debris of 1–5000 µm, namely microplastics, has recently attracted increasing attention [3,4]. Microplastics have been observed in the ocean worldwide, from estuaries to polar regions and from surface water to the deep sea. High abundances of microplastics are generally associated in the coastal regions with intensive anthropogenic activities, e.g., residential, touristic, industrial, and fishery activities [5,6]. Previous reports showed marine sediments near dense populations have high levels of microplastic abundance, such as coastal areas beside cities rather than offshore areas/deep sea [7,8,9]. Moreover, the composition of microplastics varies based on different human activities. For example, polypropylene (PP) and polyethylene (PE) are widely applied in food packaging, which accordingly appears regularly in populated areas such as tourist attractions [10]. The abundance and distribution of microplastics in the coastal region could be influenced by geographic factors including regional runoff and meteorological conditions [11,12]. Additionally, marine currents, tidal waves, circulation, and wind could be responsible for microplastic movement and accumulation in the estuary, coastal and pelagic regions. The trapped microplastics in the estuary were transported to the surface water under the influence of upwelling in the spring in the Ría de Vigo estuary, Spain [13].
Microplastics in the marine environment are also associated with ecological factors apart from geographic aspects. Microplastics may bring potential harm to organisms with physical and toxic effects [14,15]; as the size of microplastics is small, they are easily ingested by organisms, such as zooplankton, mollusks, and fish, in aquatic environments [16,17,18,19]. Moreover, microplastics can be bioavailable to organisms in the food web [20,21,22,23]. Seaweed ecosystems have been recognized as traps/sinks of microplastics. Seaweed is able to retain microplastics by slowing down the water velocity and/or by direct contact and entrapment. Subsequently, microplastics can become integrated into food webs when seaweed is consumed and further passed on to higher trophic levels [24,25,26,27]. In addition, microplastics trapped by seaweed alter with seasons as the seaweed grows. Microplastic was found to translocate in the crab to its hemolymph and tissues [28]. Thus, there is a potential for microplastics to enter the human body via the food web [28]. Microplastics threaten benthic organisms in marine sediments, and the biodiversity and function of sediment microorganism communities are greatly affected by microplastics and the pollutants adsorbed on the surface [29,30,31].
To date, temporal and spatial studies of microplastics in marine sediments have mostly concerned geographic and anthropogenic effects, some with considerations of habitat or ecosystem [32,33,34,35]. However, systematic studies are scarce on the seasonal variability of microplastic distribution in marine sediments with an understanding of comprehensive factors, including all aspects mentioned above [36]. Herein, the multiple-used zones of Eastern Guangdong, the South China Sea, is a representative area, although small, where complex geographic factors vary seasonally, with natural habitats and diverse ecosystems. The complex movement of the current system in this region makes it a sandwiched structure, providing an advantageous and nutritious area for mariculture in nature. The region has plenty of nearshore aquacultures, and the largest natural seaweed cultivation area in Guangdong Province is located here. We hypothesized that the geographic features, including upwellings and dilution water, would lead to converse trends in microplastic abundance in sediment. The ecological features, such as seaweed ecosystems and benthic communities, would be sinks for microplastics, but microplastics may have negative impacts on benthic communities. The objectives of this study are (1) to investigate the effects of the geographic and ecological features on microplastic spatial and temporal distributions, (2) to evaluate the seasonal influence on microplastic morphological features, and (3) to estimate the anthropogenic impacts on microplastic compositions in the surface sediments from the multiple-used zones in the South China Sea throughout the year. This study provides a comprehensive perception of the relations between microplastics and these natural and anthropogenic features in the marine environment. Moreover, plastic particles >5 mm and <1 μm, defined as mesoplasctics and nanoplastics, were excluded from this study [8,37].

2. Materials and Methods

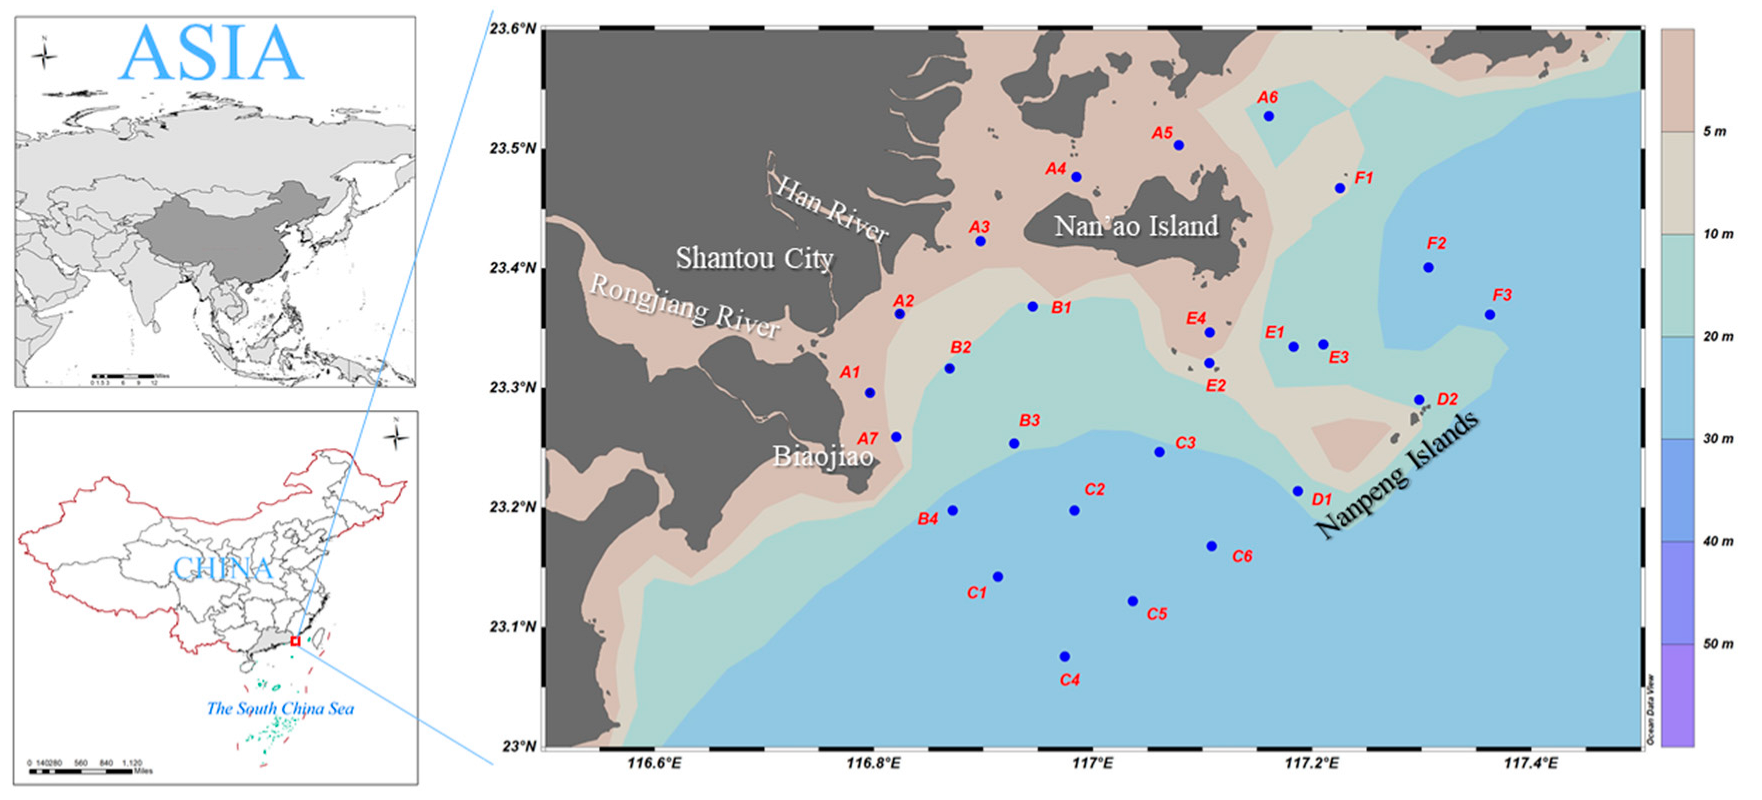
2.1. Study Area and Sampling

Eastern Guangdong, the South China Sea, receives the Rongjiang River and Han River. The geographic environment in this sea area is complex and impacted by the current system. In the summer, two upwelling regions (B2–B4 and F2–F3 in Figure 1) were reported as affected by the Pearl River plume dynamics and Taiwan Bank, the offshore freshwater and alongshore counterpart [38]. In winter, the alongshore area (A1–A5 and A7) is mainly influenced by the dilution of water from the Rongjiang River and Han River, while the outer parts are by the Zhe-Min coastal current from the northeast [39]. Anthropogenic activities also greatly affected the sea area beside downtown Shantou. Nan’ao Island is a famous tourist attraction, and summer is usually the peak season. In addition, the sea area is rich in ecological resources, such as fish, shrimp, crab, shellfish, and seaweed, as an important source of seafood in Eastern Guangdong. The bay northwest of Nan’ao Island creates a unique place for mariculture and fishery. There is a seaweed ecosystem to the southeast of Nan’ao Island and farther from the National Nature Reserve of the Nanpeng Islands.
The top 10 cm sediments from 26 locations were collected from the present study using grab sampling. The study site is located in Eastern Guangdong in the South China Sea (23.08–23.5° N, 116.80–117.36° E) (Figure 1, Table S1). Three representative seasons, spring (April), summer (August), and winter (December) in 2021 were chosen, indicating the dry season, the warm and wet season with upwellings, and the cold season with dilution water. The spring, summer, and winter temperature ranges were 21.4–22.9 °C, 22.1–28.6 °C, and 18.7–20.9 °C; the dissolved oxygen ranges were 5.6–13.7 mg/L, 5.6–13.7 mg/L, and 5.6–13.7 mg/L; the turbidity ranges were 0.4–58.8 FTU, 0.1–48.6 FTU, and 1.7–123.7 FTU (Table S2).

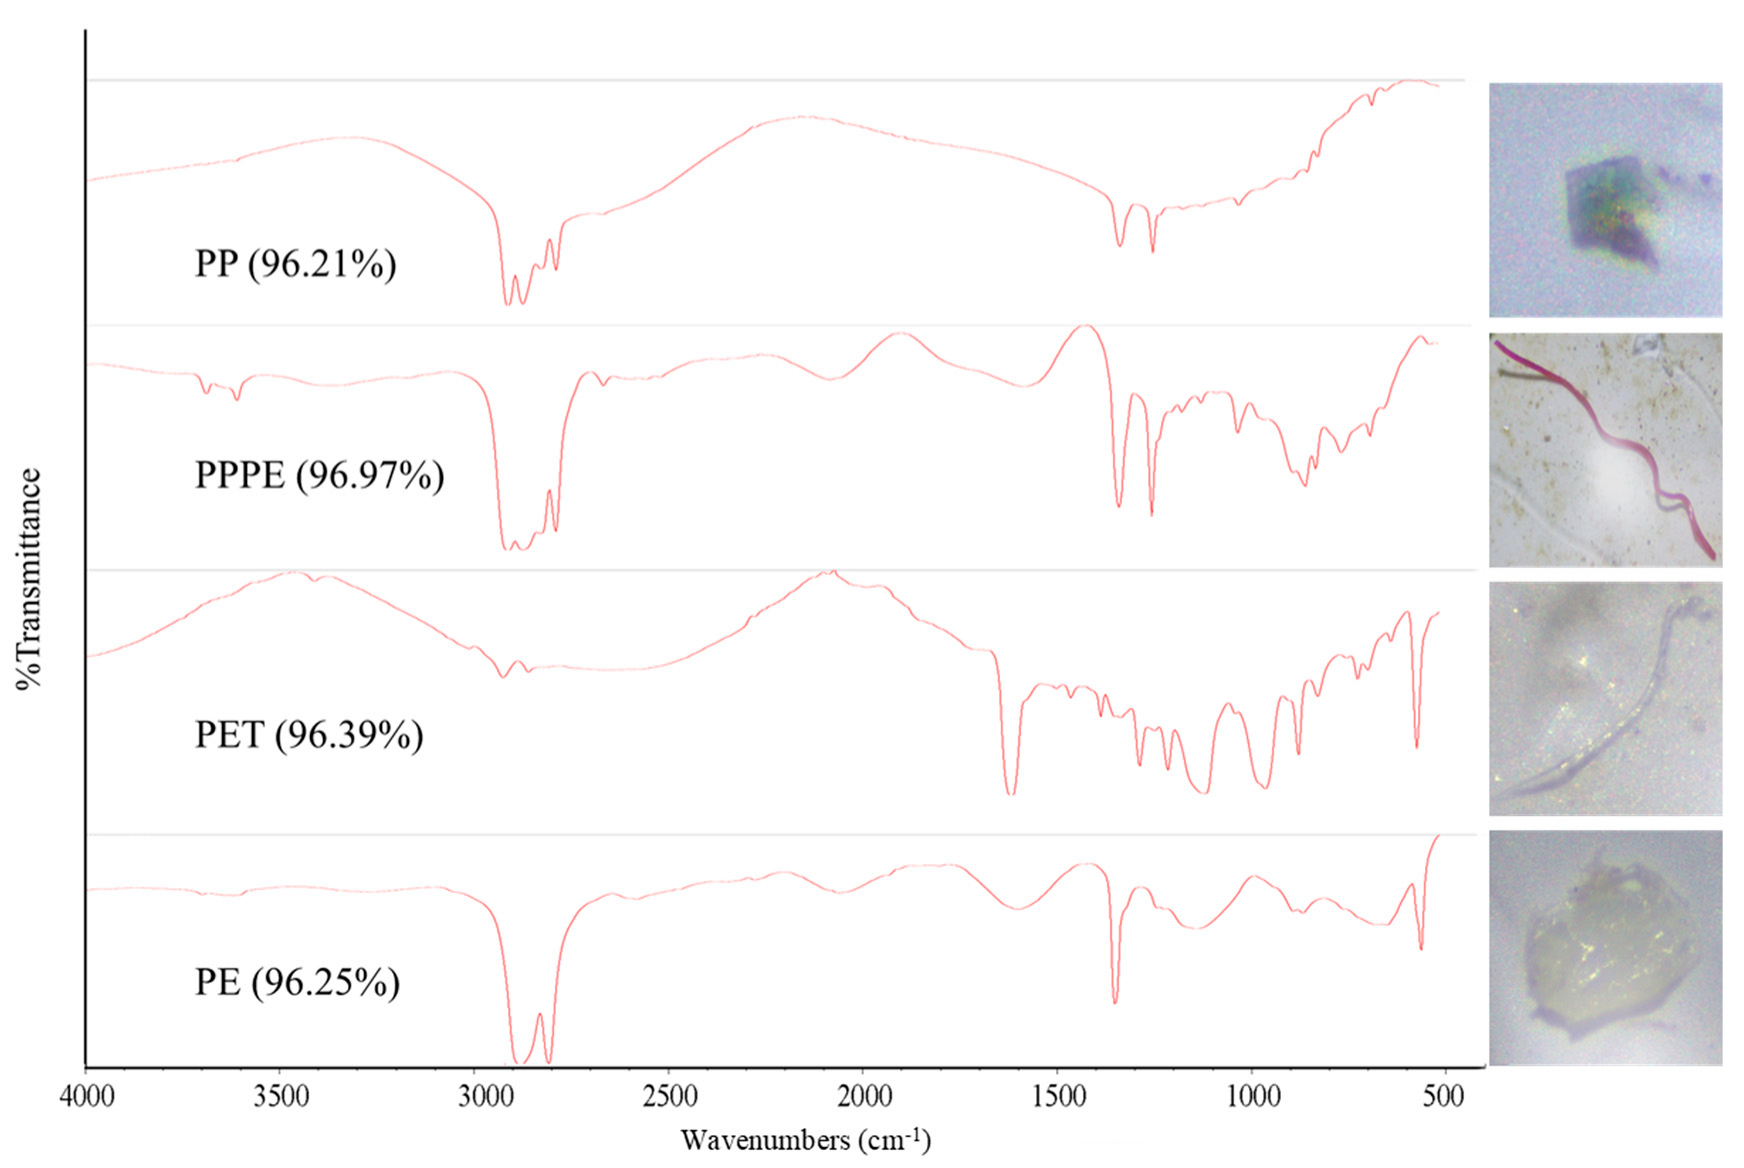
2.2. Sample Analysis

The extraction method of microplastics in sediment samples was slightly modified from the recommended standards [40,41] and reported methods [8,42]. Typically, sediment samples from each location were dried in an oven at 50 °C for >24 h to a constant weight, and then carefully separated into fine grains (by gently tapping and shaking to avoid damaging microplastics) before being filtered by a stainless steel sieve with 5 mm openings. An aliquot of ~100 g (dry weight, dw) sediment from each site was transferred into a clean glass beaker. Afterward, each sample was treated with 30% H2O2 solution to degrade organic matter and was dried again at 50 °C for >24 h to a constant weight. Sodium chloride (Xilong Scientific Co., Ltd., Shantou, China) with Milli-Q water was used to prepare a saturated NaCl solution (1.2 g/mL). After being filtered by a Whatman glass microfiber filter (GF/F, 0.7 μm pore size), the NaCl solution was added and well mixed with the sediment, followed by a 24-h settlement. The supernatant was then vacuum filtered by Sartorius cellulose nitrate filter paper (1.2 μm pore size). The filter paper was dried at room temperature until a constant weight before the microscopic inspection.
The microplastic particles were visually inspected by a dissecting stereomicroscope (Mshot MZ62). Microplastic particles with distinct and homogeneous colors but without organic structures were visually identified and measured. Photographs of all suspected microplastics were taken by a Mshot MSX2 camera. Afterward, the identification of suspected microplastics was conducted by a micro-Fourier transform infrared spectrometer (μ-FTIR, Nicolet iN10, Germany) using transmittance mode and attenuated total reflectance mode. The spectra were compared with the OMNIC polymer spectra library, and those matching >85% were considered microplastics. Examples are given for the top four most abundant microplastics (Figure 2). Peaks at 2956–2840 cm−1 were assigned to CH3, CH2, and CH [43]. The 1716 cm−1 peak was designated to C=O, while the 970 cm−1 peak for C-O-C [44]. Peaks at 730–718 cm−1 were also ascribed to CH2 [45]. The detection limit was approximately 20 μm.
Microplastic particles were categorized by color, shape, size, and composition. The colors were classified into six categories: transparent (colorless particles), yellow (including orange and brown), red (including pink and purple), white, blue (including green), and black (including grey). The shapes of the detected microplastic particles were sorted into three types: fragments, fibers, and pellets. Examples of categorization by color and shape are shown in Figure S1. Microplastics with different sizes were grouped as 1–100 μm, 101–500 μm, 501–1000 μm, and 1001–5000 μm.

2.3. Quality Assurance and Control

The outer edge of each sediment sample was removed by a stainless steel spatula to mitigate possible contamination or disturbance by the sampling equipment [46]. The experiment followed strict measures to minimize possible plastic pollution, e.g., wearing a cotton lab coat and closing lab windows. All containers and tools were nonplastic. All glassware was wrapped with aluminum foil and treated in a muffle furnace at 450 °C for 4 h prior to use. The treated Al foil was also applied as a cover for any exposed surface. Anhydrous ethanol was used to clean the KBr window between samples. Three procedural blanks were conducted. In addition, the wet blank filter paper was placed alongside each batch of experiments to evaluate possible contamination from the laboratory environment. No microplastic pollution was observed in any blanks.

2.4. Statistical Analyses

Data analysis was conducted by IBM SPSS 25. For multiple comparisons among data sets, the nonparametric Kruskal–Wallis H test was employed, while the Mann–Whitney U test was performed for pairwise comparisons. Spearman correlation was applied to assess the relationship between microplastic abundance and different environmental factors. P < 0.05 was considered statistically significant.

3. Results and Discussions

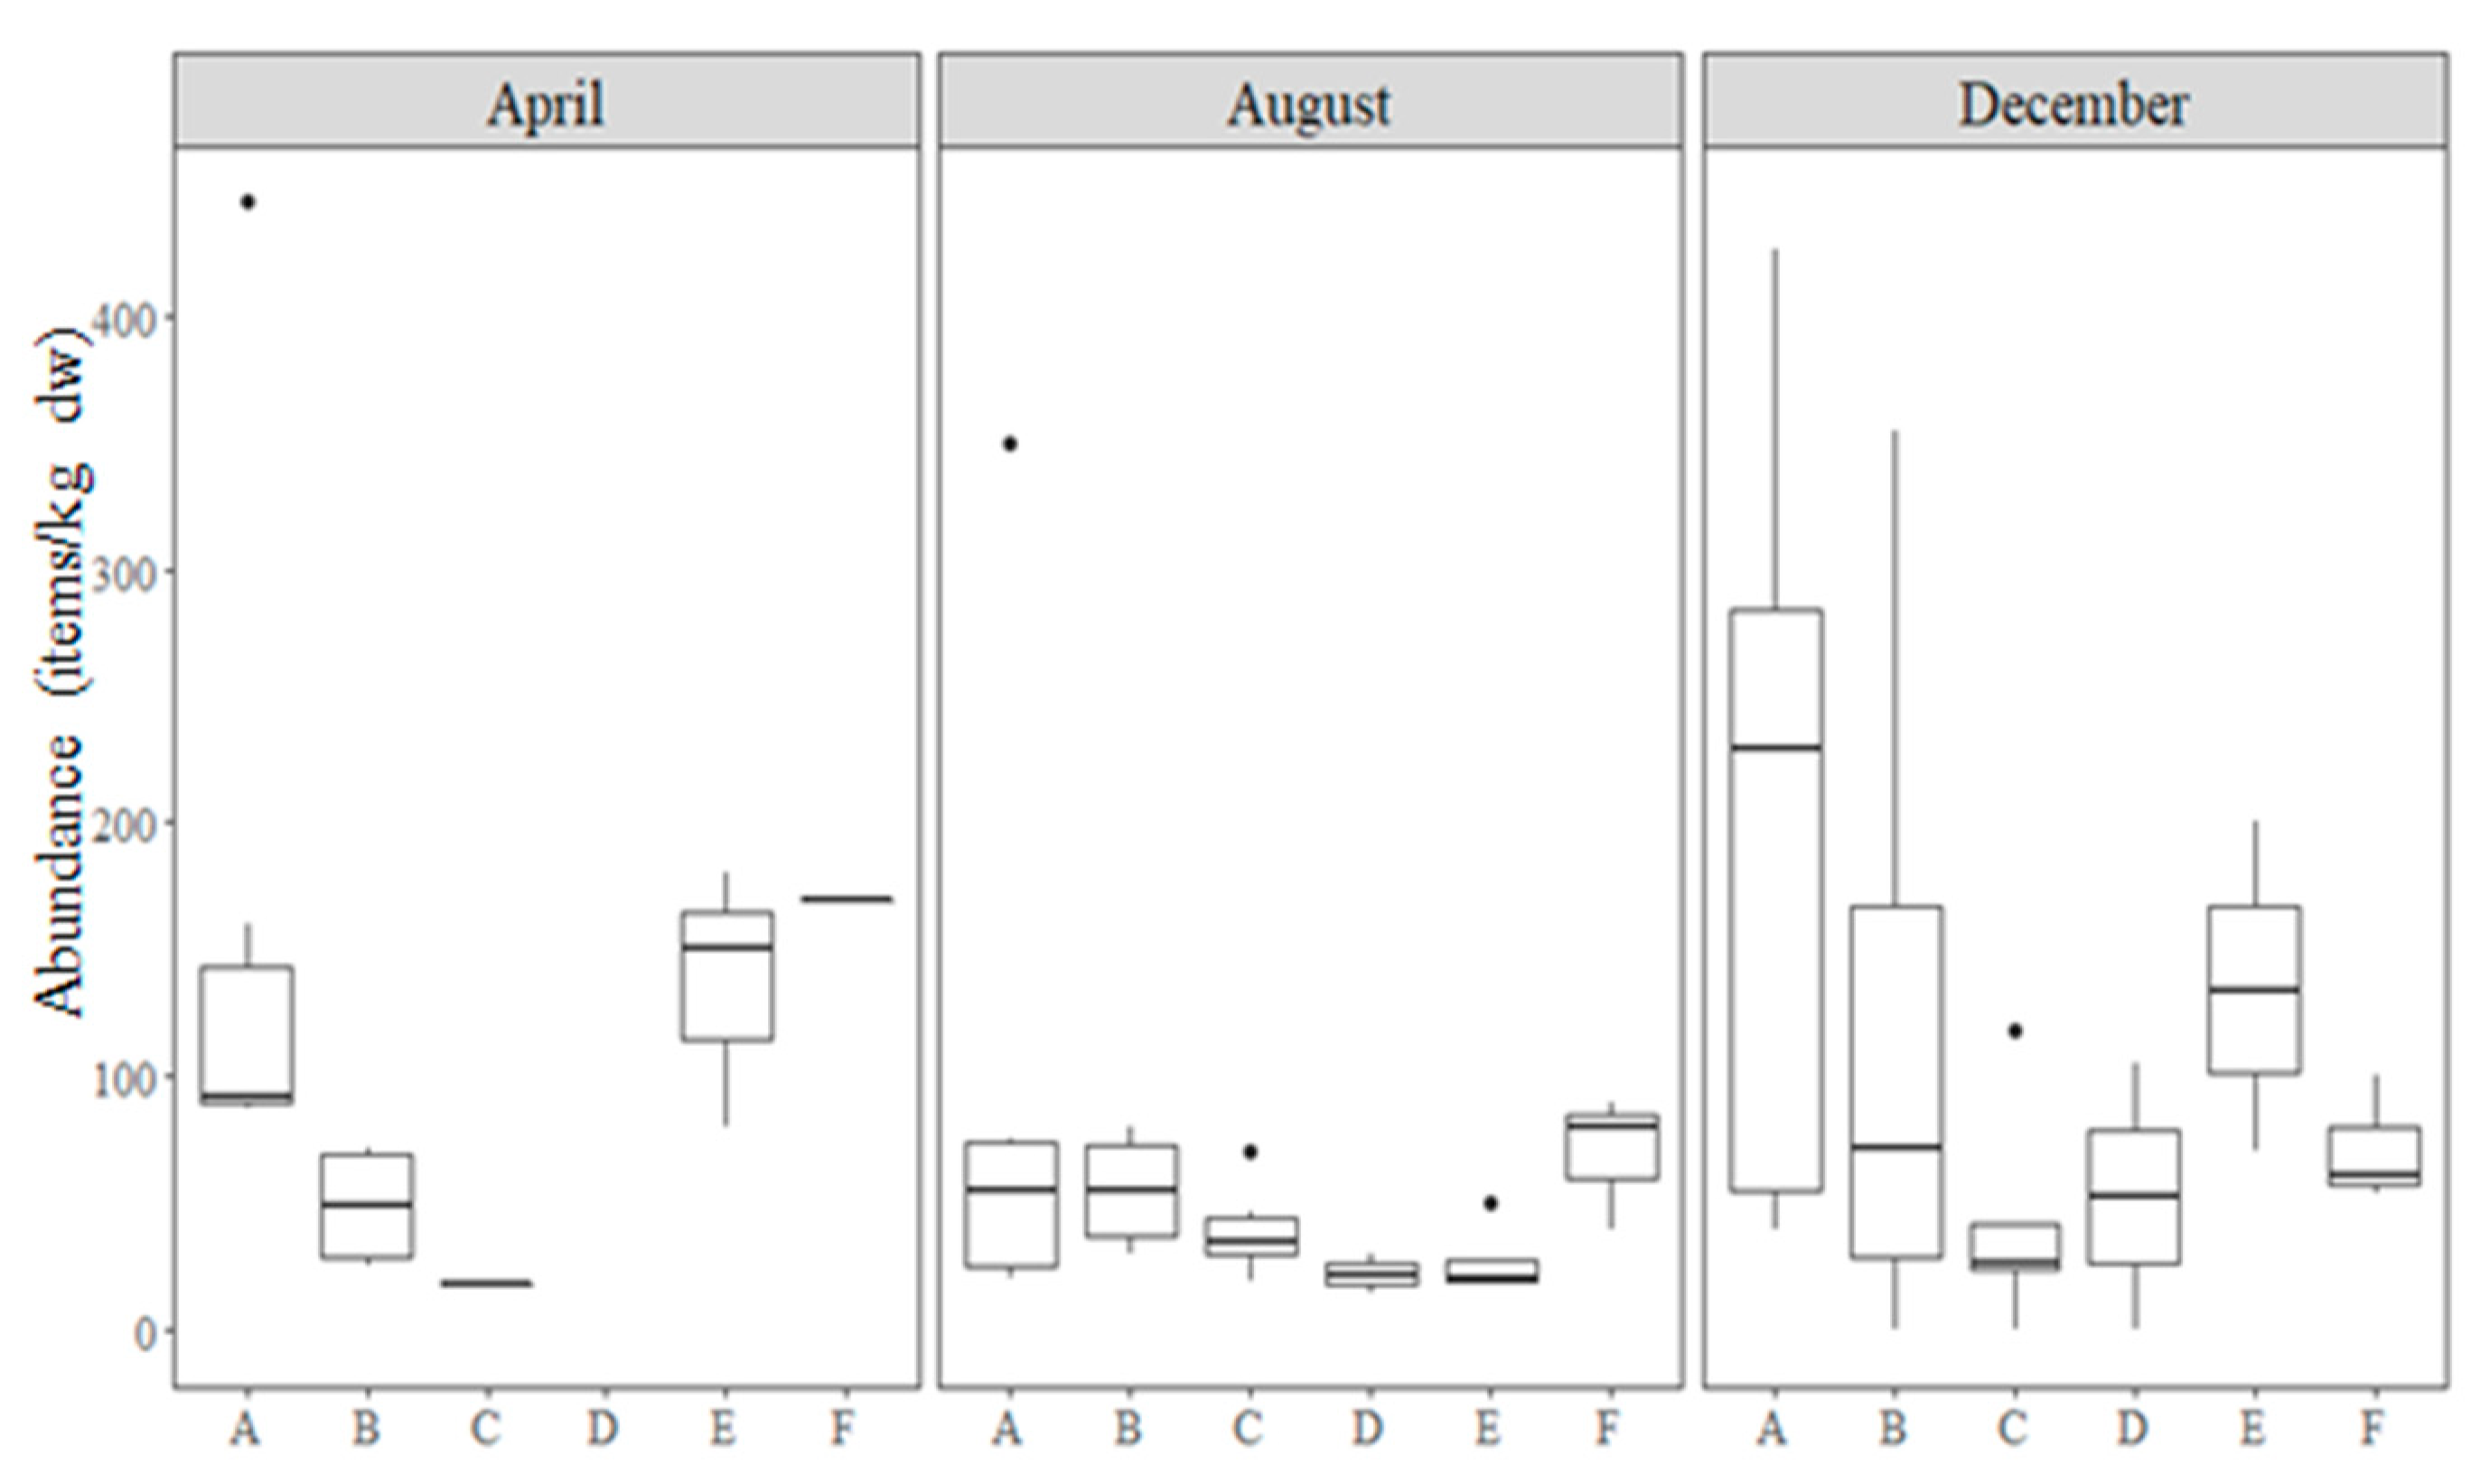
3.1. Microplastic Abundance and Distribution Affected by Geographic Features

The abundance and distribution of microplastics in sediment samples from Eastern Guangdong in the South China Sea in April, August, and December 2021 are shown in Figure 3. The microplastic abundance in the sediment varied from 0 to 444.4 items/kg dw at all study sites, with the average abundances for April, August, and December of 117.4 ± 25.9 items/kg dw, 55.7 ± 12.9 items/kg dw, and 116.9 ± 23.8 items/kg dw, respectively. The highest abundance was at Site A4 in April, while no microplastics were detected at D2, B3, and C6 in December. As shown in Table S3, the microplastic abundance was approximately the same order of magnitude as in Beibu Gulf in 2017 [47], Bohai Sea, and Yellow Sea in 2016 [48]. However, the abundance in the South Yellow Sea and Sanggou Bay in 2017 was approximately one order of magnitude higher than the present study [6,49].
Note: PA: polyamide, nylon; PE: polyethylene; PET: polyethylene terephthalate; PP: polypropylene; PPPE: polypropylene-polyethylene copolymer; PS: polystyrene; PVC: polyvinyl chloride; N/A: not mentioned in the referred study.
A decrease in microplastic abundance from nearshore to offshore distance was found in the winter season, indicating the contribution from land on microplastic abundance was higher (Figure 3). Geographically, A1–A7 are along the coast; A1, A7, B4, C1, and C4 are along the estuary section of the Rongjiang River, while A2, B2, B3, C2, and C5 are along the Han River. A larger estuary (Rongjiang River in Figure 1) may have a greater contribution to microplastic abundance in the sediment than a smaller estuary (Han River in Figure 1). The microplastic abundance presented a trend from high to low along the estuary section of the Rongjiang River from nearshore to offshore in April, August, and December. For the Han River estuary section, the abundance was relatively stable in April and August (19–90 items/kg dw). However, the abundance in December displayed notable fluctuation, with B2 exhibiting remarkably high abundance (355 items/kg dw), while no microplastics were detected for B3; the abundances for A2 and C2 were 40 and 42 items/kg dw, respectively (Figure S2). Spearman’s correlation among coastal locations (A1–A7, the average distance to coast as 3.105 km) and the offshore sites with short (B1–B4, the average distance to coast as 13.438 km) and long distances (C1–C6, the average distance to coast as 30.849 km) exhibited notable negative connections between microplastic abundance and distance to coast (Table S4), especially in April (Table S5). These results indicated that urban river input and human activities on land may have a great contribution to microplastic abundance in the coastal sediments. The coastal sites received a large amount of microplastics from the Rongjiang River and Han River prior to being transported to offshore sites by water movement including waves, tides, and currents. The distribution of microplastics was affected by hydraulic conditions and peripheral environments [50]. Offshore areas with stronger hydrodynamic conditions retained fewer microplastics than nearshore areas. The correlation between microplastic abundance and human activities has been commonly reported [8]. The lowest microplastic abundance in Singapore mangroves was observed to be related to human activities at low levels [7]. A high correlation between human inputs and microplastic distribution was also found in the Lagoon of Venice, Italy [9].
Seasonal currents can influence the microplastic abundance in the sediment. A relatively higher abundance of microplastics was found in winter than in summer (Figure 3). The increase in microplastic abundance in coastal sediments in December was possibly due to dilution from rivers [51]. As A1–A5 and A7 are in the dilution water area in winter with salinities <30‰, the decrease in salinity resulted in a reduction in floating microplastics, therefore, an increase in their sedimentation. Furthermore, the river input also brought large quantities of microplastics into the coastal area. Additionally, the raft culture along the coastlines resulted in biofilms generated on the microplastic surface and promoted their deposition with increased density; similar phenomena were also reported elsewhere [52]. Although the tendency of microplastic accumulation in the sediment was found during the dry season (spring, April), resuspension might be induced during the wet season (summer, August), leading to the decrease of microplastics in sediment. This phenomenon was also observed in the Liangfeng River where microplastics tended to settle in the dry season and resuspend in the wet season [15]. Upwellings in summer also affected the floatation of microplastics, which were observed at Sites B2–B4 and F2–F3 in August [53,54]. These sites are located in the margins where the depth changes, and the upwellings in the marginal waters of the Eastern Guangdong continental shelf in summer are related to the shelf break [55]. As a result, the microplastic abundance of B2–B4 and F2–F3 in August was low. However, no statistical significance was found between microplastic abundance at sites within the summer upwellings affected area and in other areas (p > 0.05). Likewise, the statistical insignificance of microplastic abundance between upwelling and non-upwelled sites was also noticed in seawater from the Benguela upwelling sites in the Atlantic Ocean [56]. Nevertheless, microplastic concentrations were observed to be higher near the water surface during upwelling than during downwelling conditions in Ría de Vigo, Spain [13]. In addition, the lower fluctuation of microplastic distribution in August compared to those in April and in December was due to weaker hydrodynamic conditions including tides, waves, and currents, similar to observations from the Bay of Brest, France [57].

3.2. Microplastic Abundance Associated with Habitats

In addition to the geographic features, the biological habitat may have correlations with the microplastic abundances to varying degrees. Zone E is located in the Sargassum seaweed ecosystem. The major seaweed species below water were Sargassum henslowianum. The microplastic abundance for Zone E in August was lower than in April and December. The seaweed, S. henslowianum, grows rapidly in the winter and slowly dies off after March and resting in summer [58]. Therefore, microplastics were retained by seaweed via direct contact and entrapment in Zone E in December and April. On the other hand, seaweed is able to change the microenvironment, such as slowing water velocity, so as to promote sedimentation [24,25,26]; hence, in vegetated sediments, seaweed ecosystems become substantial sinks for microplastics.
Discrepancies exist in the biodiversity of benthic communities in the nature reserve and the microplastic abundance. The Nanpeng National Nature Reserve is located in Zone D, presented as a hotspot of biodiversity. Our preliminary site survey found 27.7 and 53.6 g/m2 of benthos, including Mollusca, Annelida, Chordata, Echinodermata, Nemertea, and Arthropoda for the winter and summer seasons, respectively (Table S6). Relatively higher microplastic abundance in Site D was found in December than in August (Figure 3). Previous studies implicated that a high concentration of microplastics in marine ecosystems may lead to decreases in biodiversity and disturbances in ecophysiological functions [30,59]. Moreover, the chemical leachates, such as phthalates or heavy metals from degraded plastics, may induce toxicities in the microorganisms [29,31]. Moreover, the low abundance in the high biodiverse area was possible because of the high potential for ingestion of microplastics by organisms, reducing microplastic sedimentation [60]. The negative trend observed in this work was consistent with the studies mentioned above.

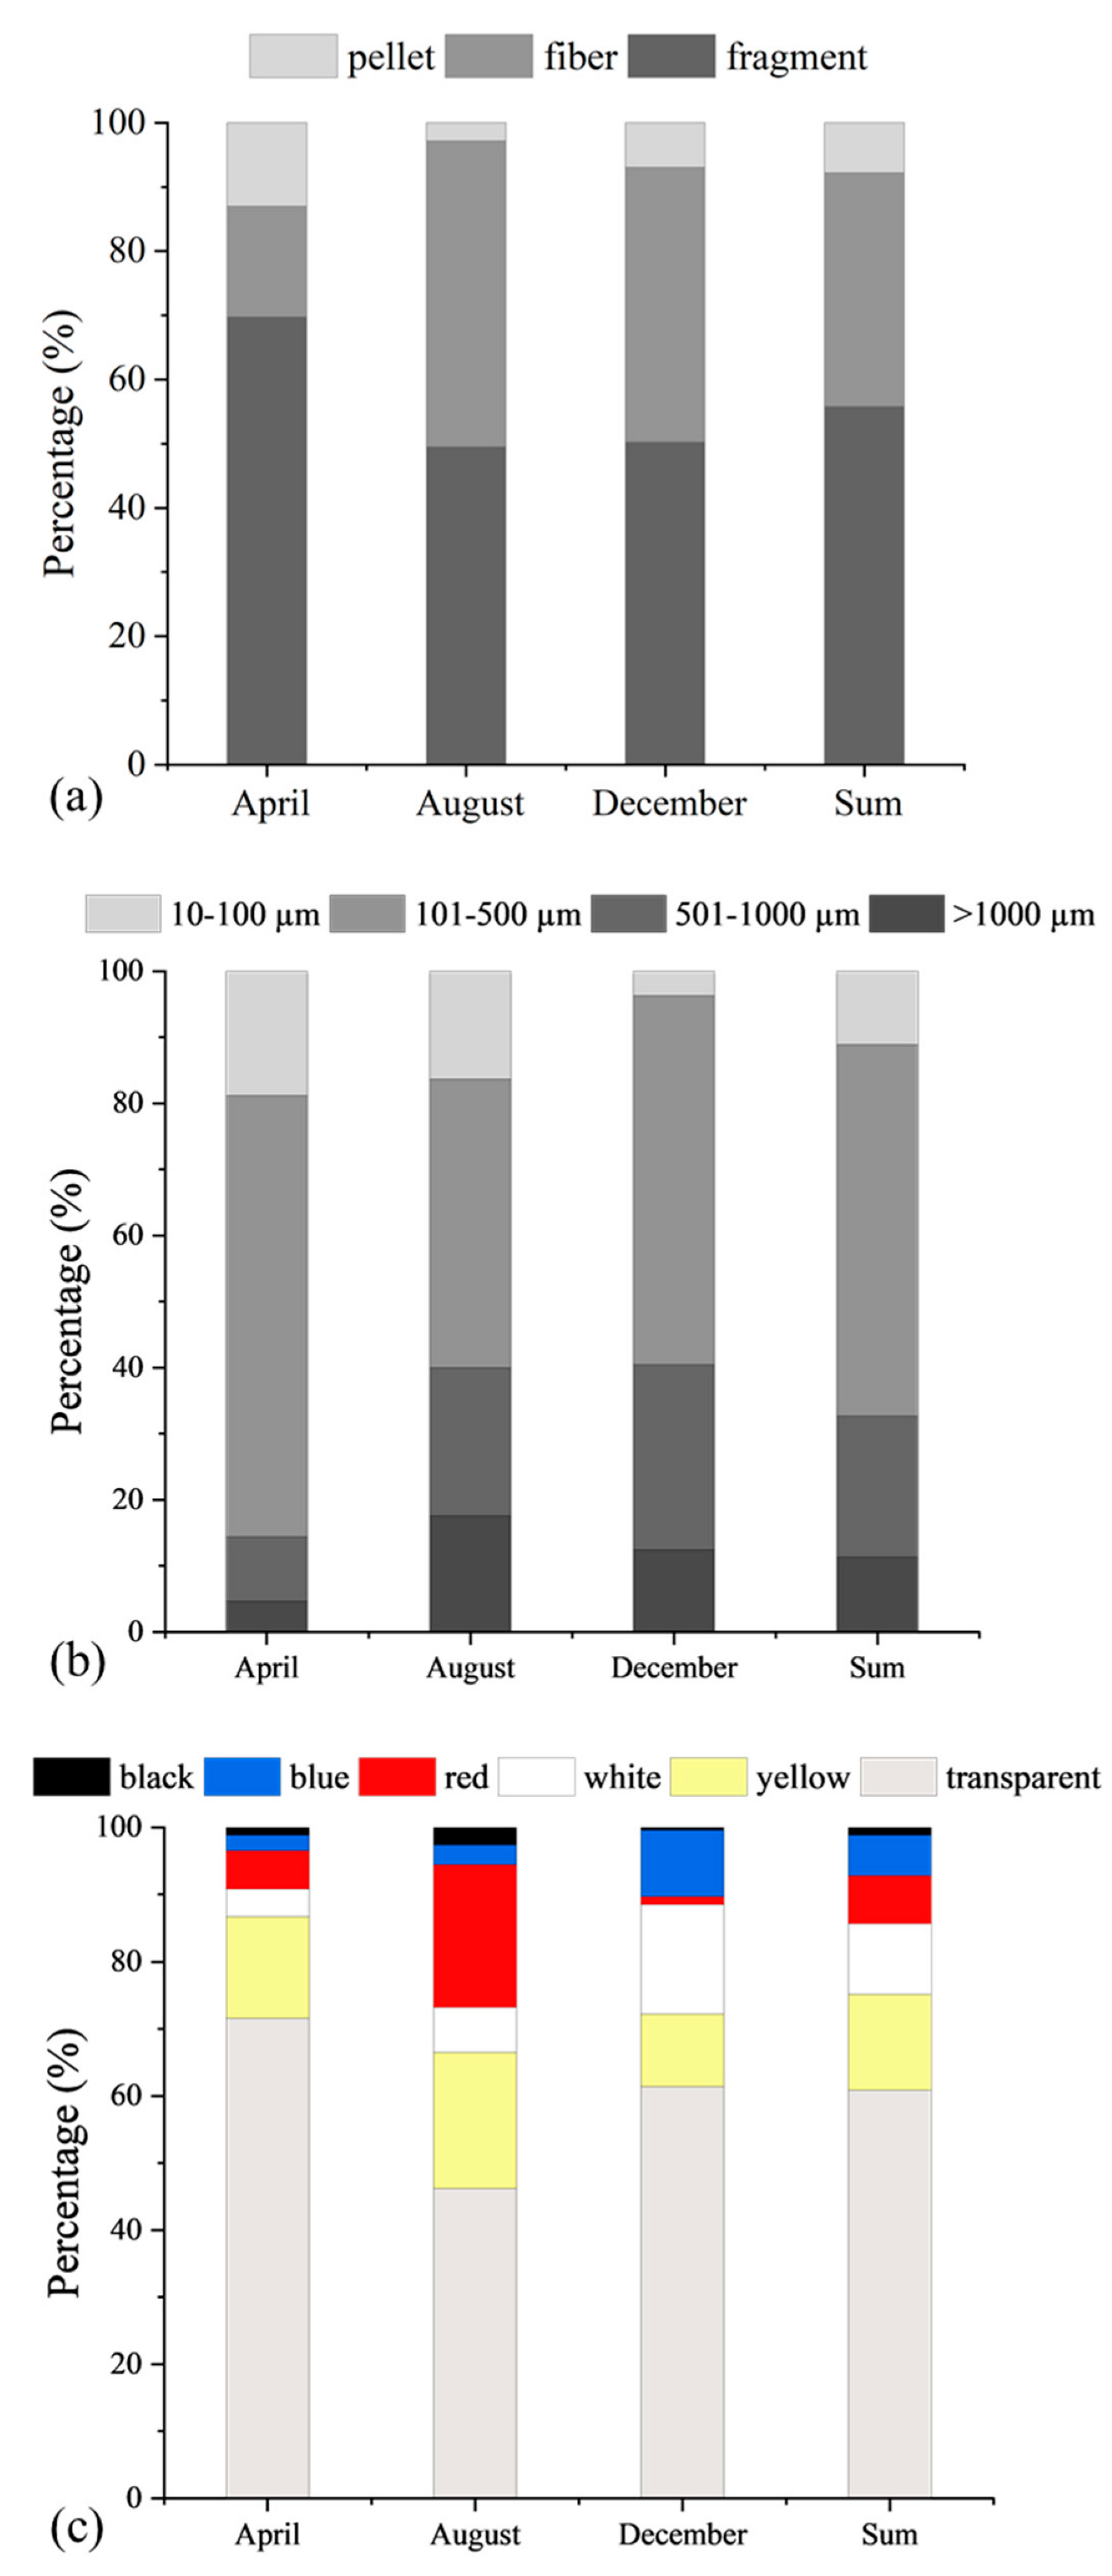
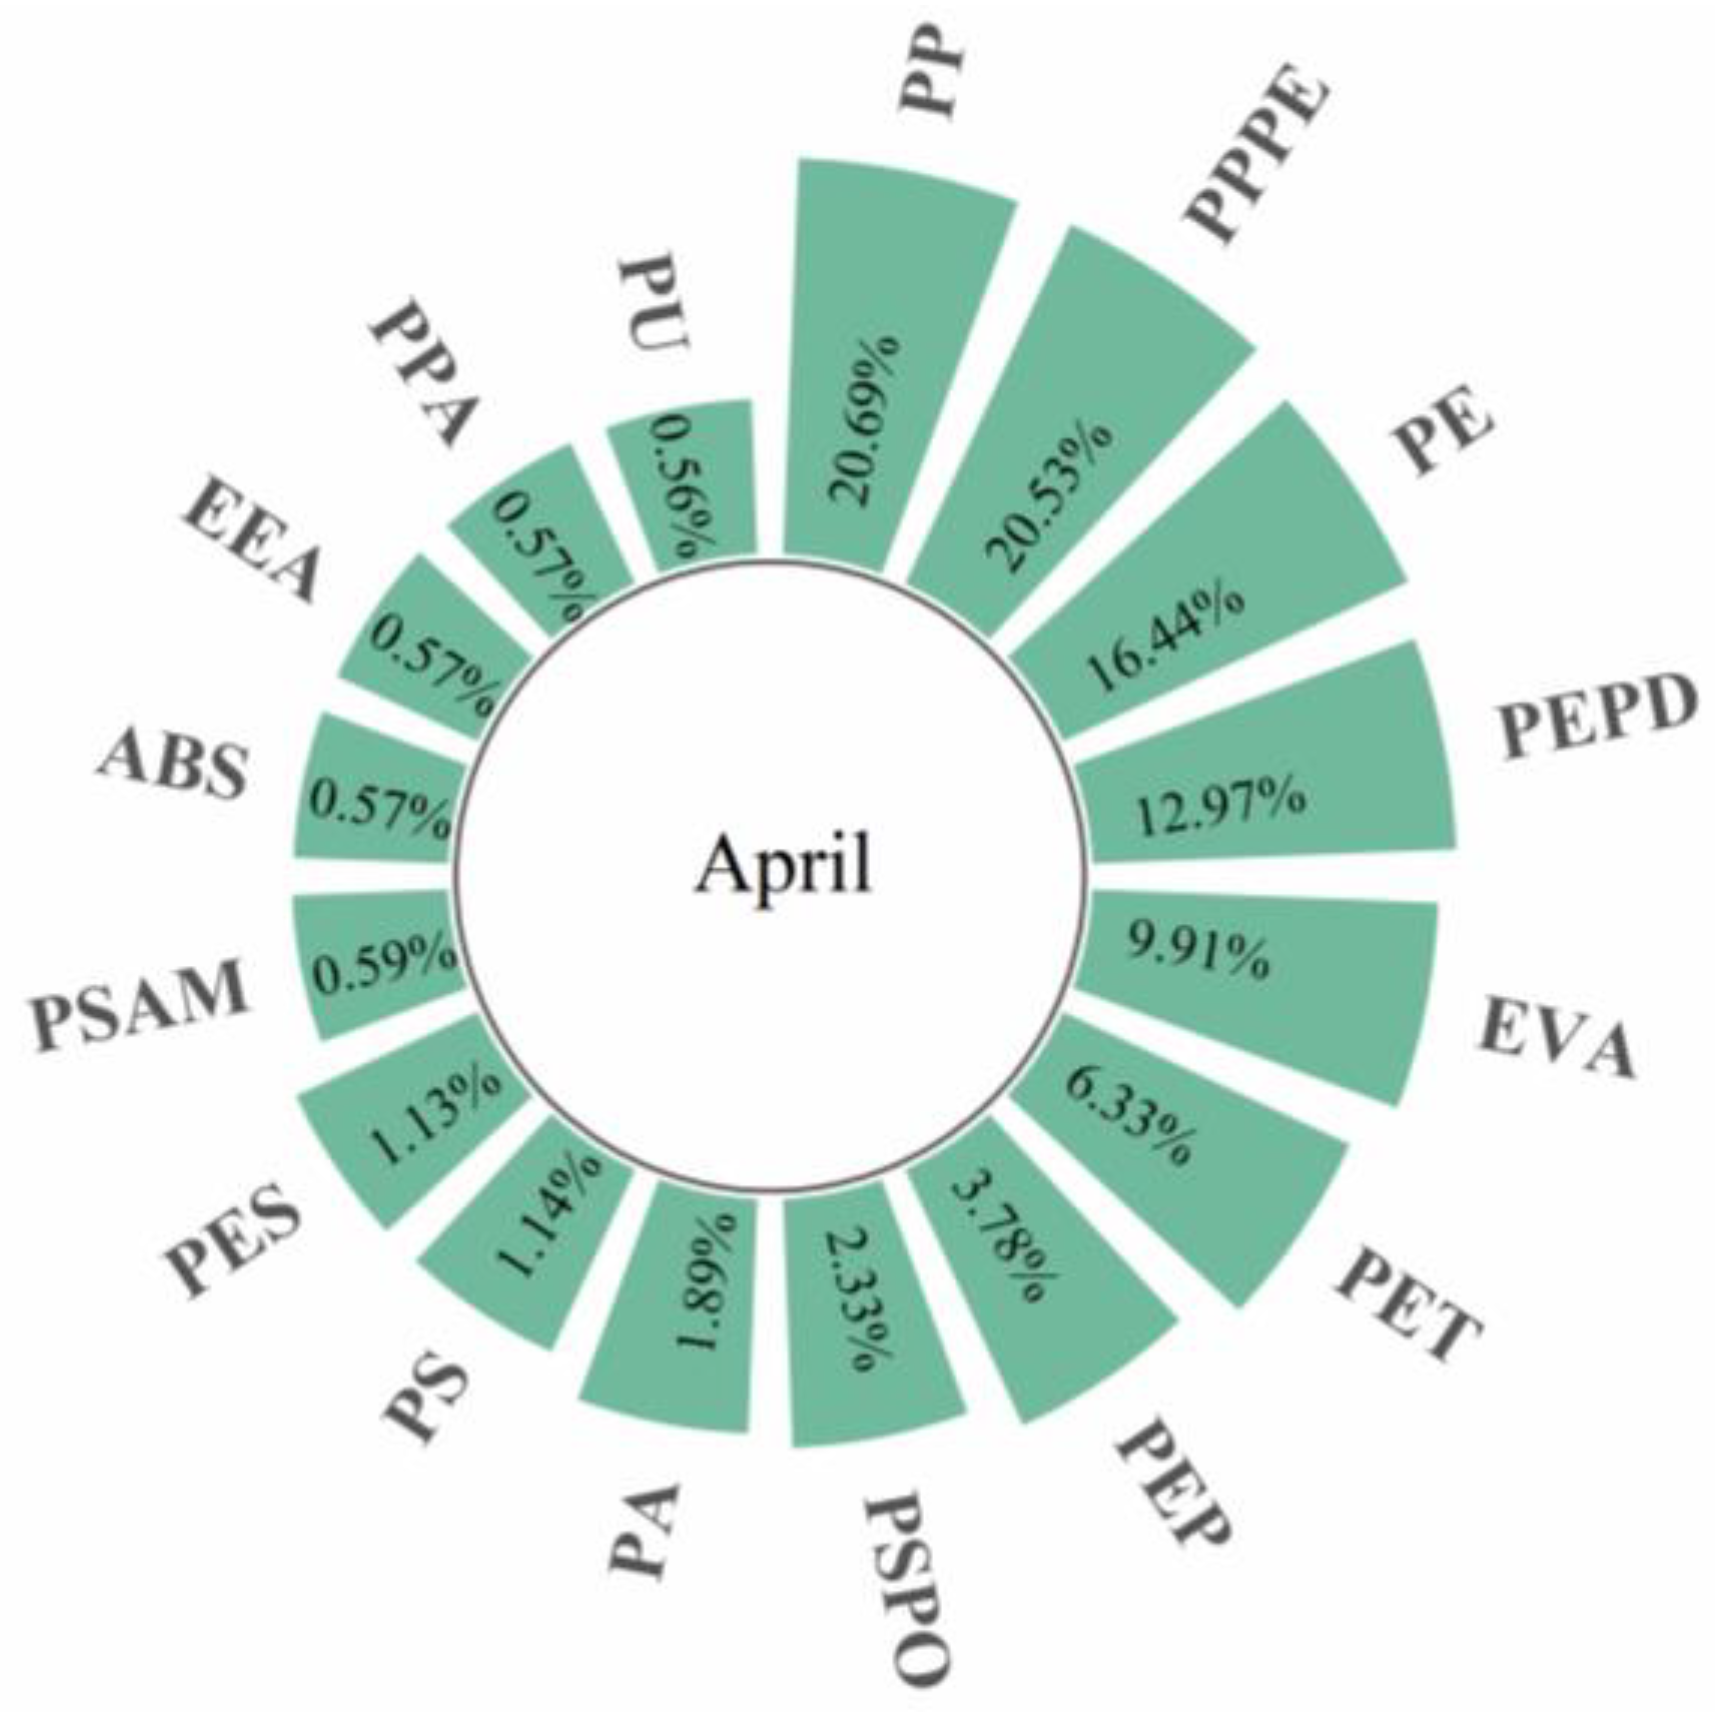
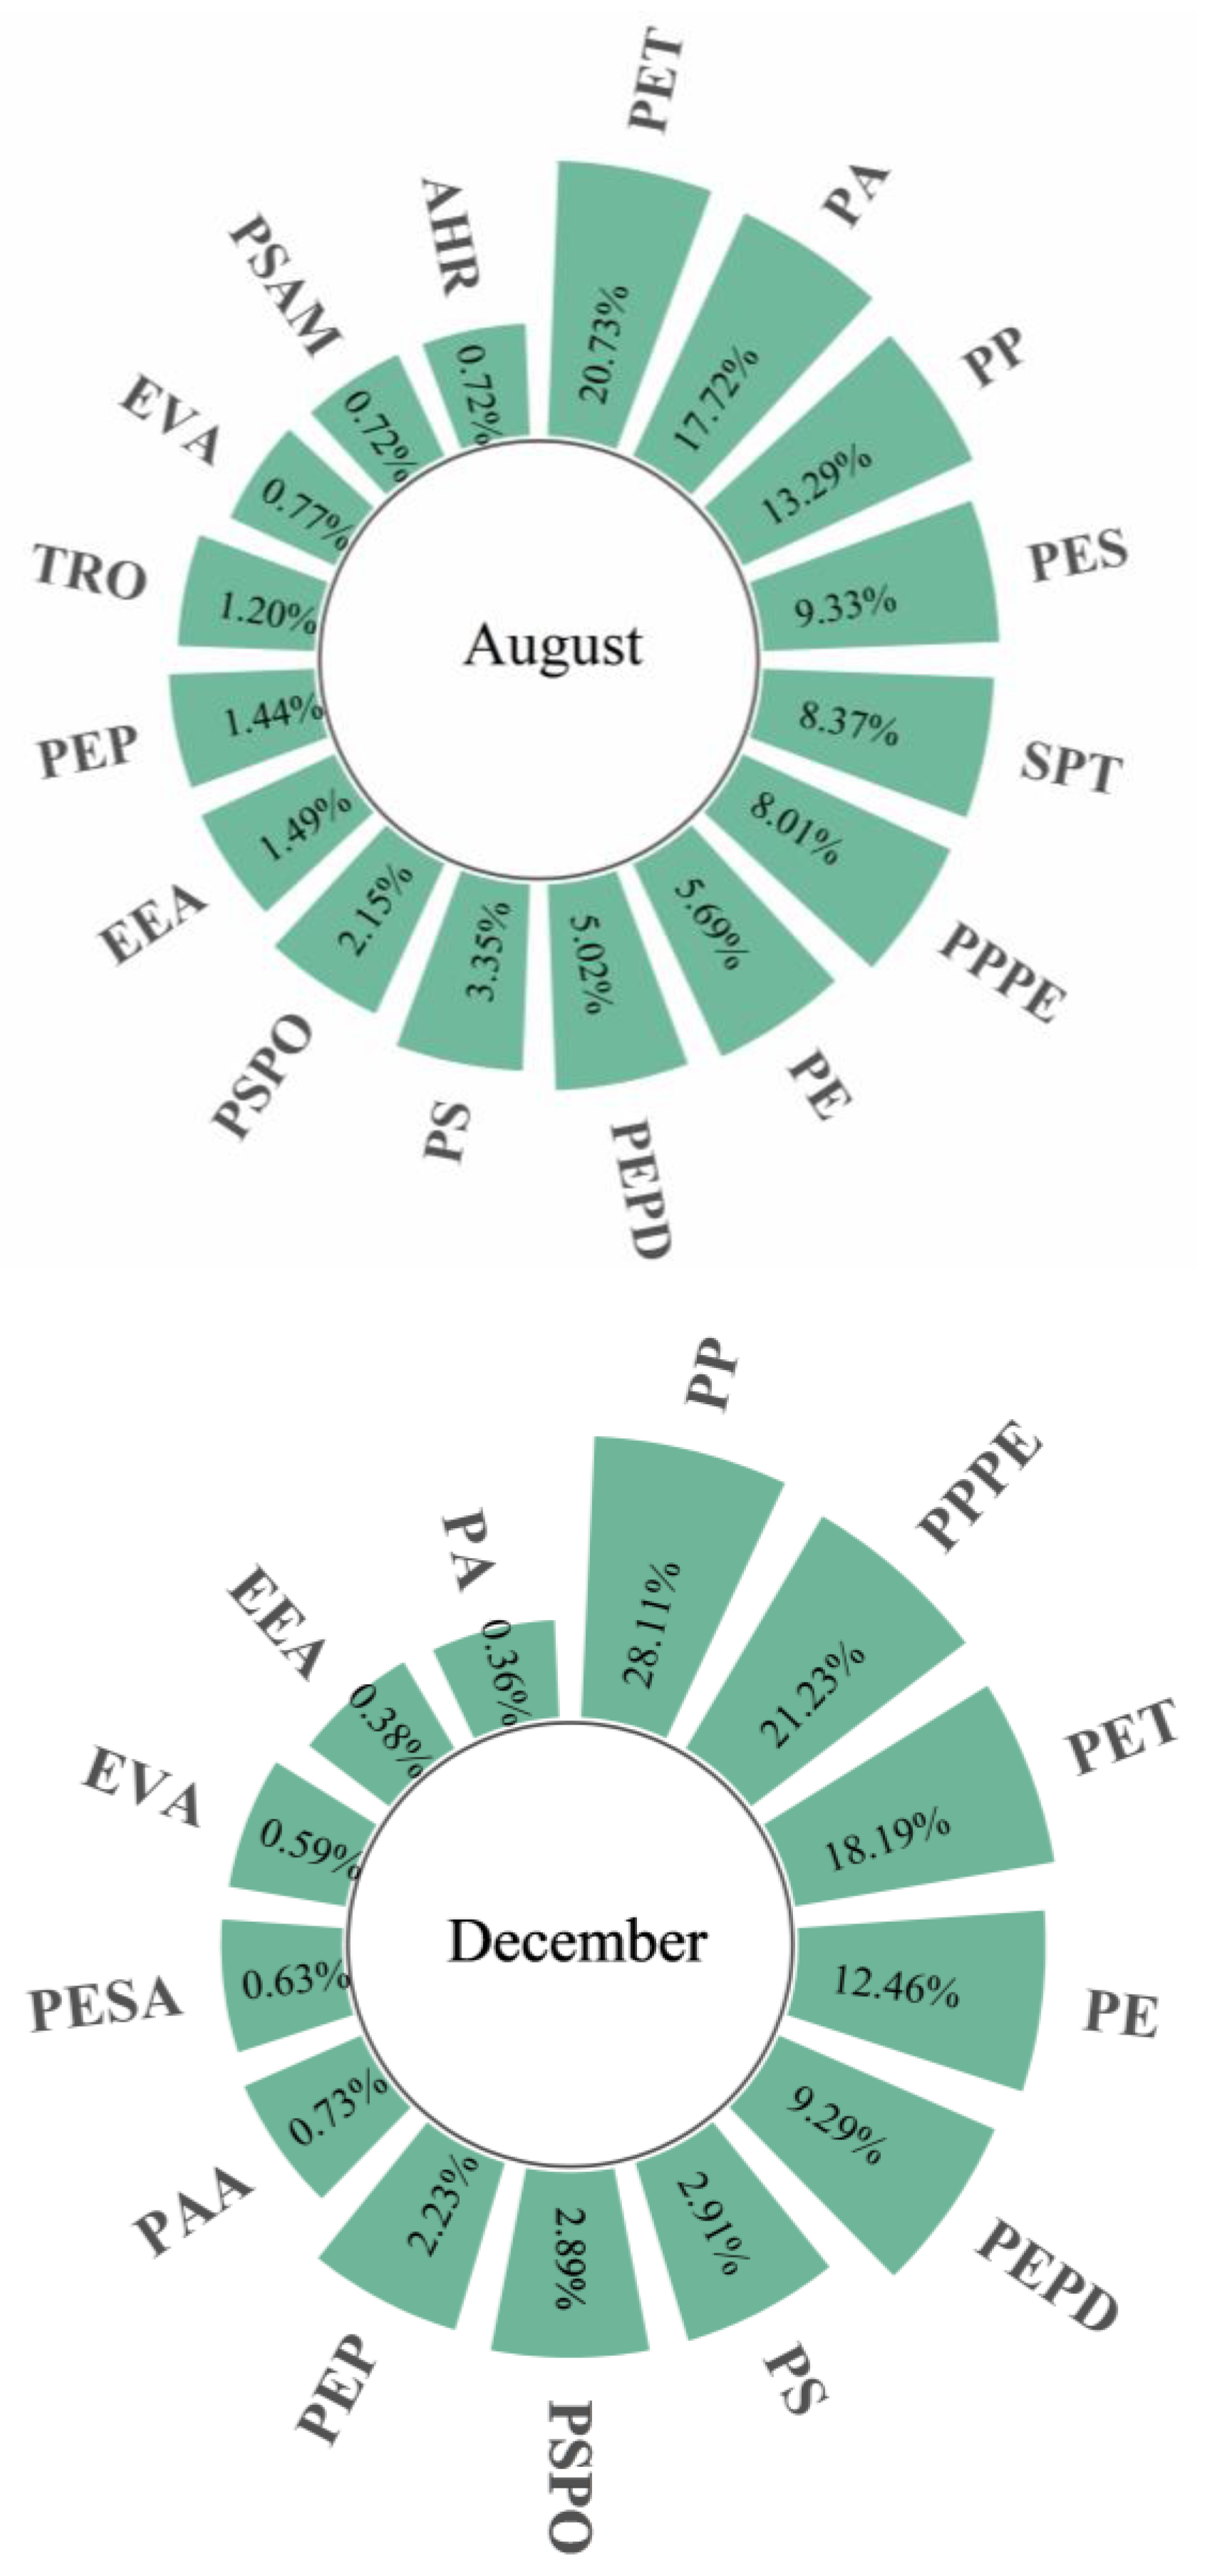
3.3. Seasonal Influence on Microplastic Morphological Features

As displayed in Figure 4a, the shapes of the detected microplastics were mainly fragments (55.8% in total, 69.8% in April, 49.5% in August, and 50.3% in December), followed by fiber (36.4% in total, 17.2% in April, 47.6% in August, and 42.7% in December), and pellets (7.8% in total, 13.0% in April, 2.8% in August, and 7.0% in December). Fragments were detected to comprise 90% of the microplastics, much more than fibers, in sediment at Tirpitzmole in Kiel Fjord, Germany [61], while they were 34–43% in the Bay of Bengal, India [33]. However, fiber was found to be the most prevalent in many other sediments, e.g., Changjiang Estuary, China (93%, [8], intertidal and subtidal sediments on the coastline of Ireland (86%, Marques Mendes et al., 2021), Jakarta Bay, Indonesia (55.7%, [5]. The low specific surface area and high density of fragments and fibers improved their sedimentation [62]. It was found that fragments were attributed to the degradation of macro- and mesoplastics (>5 mm) (Free et al., 2014), while fibers were possibly from fishing and sewage (including synthetic fibers from laundering) [12,48].
The size of microplastics varied from 22.5 to 4363.3 µm, with an average of 507.2 ± 315.0 µm and a median of 313.9 µm. The size distribution of microplastics is demonstrated in Figure S3, and the size of microplastics clustered in the range of 50–200 µm. Microplastics with a size of 101–500 μm were predominant (56.2% in total, 66.8% in April, 43.7% in August, and 55.8% in December, respectively, as shown in Figure 4b). Overall, the size of 101–500 µm (56.3%) was much more than those of 501–1000 µm (21.3%), 1001–5000 µm (11.3%), and 10–100 µm (11.1%). Interestingly, there were more small microplastics (10–100 µm, 18.8%) than mid-sized to large microplastics (9.7% and 4.6% for 501–1000 µm and 1001–5000 µm, respectively) in April; however, the proportion of small microplastics slightly decreased in August (16.3%) and particularly in December to only 3.7%. Meanwhile, microplastics with sizes of 501–1000 µm increased gradually from April (9.7%), August (22.4%) to December (28.0%). The difference in the ratio of large microplastics (1001–5000 µm) was relatively stable, at 4.6%, 17.5%, and 12.4% for April, August, and December, respectively. Previous reports (Table S3) demonstrated that small microplastics abundantly appeared on seafloor sediments [7,48]. Microplastics 50–100 µm in size are prevalent in the South Yellow Sea [6]. The size of 100–500 µm was the largest for nonfibrous microplastics, while the size of 1000–5000 µm was found to be predominant in fibrous microplastics in the Beibu Gulf [47]. For the Bay of Bengal, 501–1000 µm was the main size range for July 2019, January 2020, and July 2020 [33]. Microplastics <1000 µm were the majority in the Changjiang Estuary [8]. Hence, small microplastics were likely to be transferred from the freshwater system to the marine environment, leading to their wide dispersion [33].
The colors of microplastics varied, and transparent particles dominated in all 3 months (46.2–71.6%, 60.9% in total), while black microplastics were the least abundant found (0.4–2.7%, 1.1% in total), as displayed in Figure 4c. Yellow, red, white, and blue particles accounted for 14.3%, 7.2%, 10.5%, and 6.1% of the total particles, respectively. Transparent microplastics were also found to be the most abundant in sediments in the Changjiang Estuary [8], Beibu Gulf [47], and coastal sediments of Ireland [63] (Table S3). These transparent microplastics were very likely from packaging materials by eye. The compositions of microplastics were further identified for verification using µ-FTIR.

3.4. Anthropogenic Influences on Microplastic Compositions

Overall, 21 kinds of polymers were detected, among which, 16 were detected in April, 16 were detected in August, and 13 were detected in December (Table 1, Figure 5 and Figure S4). On the whole, polypropylene (PP), polypropylene-polyethylene copolymer (PPPE), polyethylene terephthalate (PET), and polyethylene (PE) comprised 22.41%, 17.89%, 15.28%, and 12.96% of the detected microplastics, respectively (Figure 5). These compositions are commonly used in the textile, packaging, automobile, electronic, and electrical industries. For instance, PP and PE are frequently applied in food packaging, cosmetics containers, and furniture. Polyethylene terephthalate is generally used in drink bottles, cosmetics containers, and textiles. The increased proportion of PET in August was ascribed to the improved consumption of bottled drinks in warm summer. The polypropylene-polyethylene copolymer is frequently utilized in the automobile, electronic and electrical industries, and the building industry. The identification of compositions was in line with the observation of colors, as most transparent microplastics were found to be components widespread in packaging materials. Urbanization and industrialization have been reported to extensively influence microplastic contamination [64]. The growth of the population during urbanization increases the use of plastics in daily life; accordingly, the production of plastic products by industries increases so as to satisfy the raising needs of the growing population. The improved production and use of plastics along with the improper management of plastic waste consequently enhances the amount of plastics entering the environment. Furthermore, abrasive wear during the production and use of plastics is unavoidable, which is presented as microplastics in the environment. Hence, anthropogenic activities have intensive relations with water environments, which are at a high risk of microplastic pollution [65]. The sampling area is largely affected by human activities, as it is nearshore and close to the downtown area of Shantou city and Nan’ao Island, with high urbanization and tourism. Various manufactories in industrial areas of Shantou, producing plastic packaging/toys, furniture, etc., are not far from the river net. Moreover, some factories scattered along rivers may contribute to microplastics in the sea, e.g., the electroplating factory along the downstream region of the Rongjiang River. In addition, laundering in the downtown area and tourism in the city may be sources of microplastics entering the marine environment.
In addition, the primary plastic production of PP, PE, and PET in the world and waste generation resulted in their high abundance [66]. Polypropylene, polyethylene, and polyethylene terephthalate were frequently observed in sediments as the main components of detected microplastics—for freshwater sediments: Ciwalengke River in Indonesia [67], St. Lawrence River in Canada [68], Nakdong River in South Korea [69], Antuã River in Portugal [70], Thames River in the UK [71], and Pearl River in China [62]; for marine sediments: Jakarta Bay in Indonesia [5], Huruslahti Bay of Finland [65], Sanggou Bay [49], Yellow Sea [6], and Beibu Gulf [47] in China (Table S3).

4. Conclusions

The distribution and characterization of microplastics in the surface sediment of the multiple-used zones in Eastern Guangdong in the South China Sea in the spring, summer, and winter of 2021 were assessed. For geographic factors, distance to the coast significantly affected microplastic distribution with a negative correlation to the abundance, due to coastal human activities. Dilution of water in winter was helpful for increasing microplastic precipitation at coastal sites. However, the impacts of summer upwellings were insignificant on microplastic abundance. For ecological factors, a negative trend was observed between the biodiversity of benthic communities and microplastic concentrations in the Nanpeng Natural Reserve. Seaweed ecosystems presented a positive influence on the microplastic abundance in summer, which became sinks for microplastics. The morphological features of microplastics displayed seasonal variations, mostly transparent fragments in 101–500 µm. For anthropogenic factors, the high production and consumption of PP, PPPE, PET, and PE in industrial and residential activities resulted in the prevalence of these compositions in the environment. Overall, the microplastic pollution level in the multiple-used zones of Eastern Guangdong, the South China Sea, is comparable to or even slightly less than that in many other marine sediments with intensive human activities. Appropriate management of the use and disposal of plastic waste on land was recommended to alleviate microplastic pollution in the marine environment.

Supplementary Materials

The following supporting information can be downloaded at: https://www.mdpi.com/article/10.3390/w15061160/s1, Figure S1: Microscopic images of typical microplastics; Figure S2: The microplastic abundance along the estuary section of the Han River from nearshore to offshore in April, August and December; Figure S3: Size distribution of microplastics in surface sediments of multiple-used zones in Eastern Guangdong, the South China Sea; Figure S4: The overall proportions of polymer types in microplastics abundance in surface sediments of multiple-used zones in Eastern Guangdong, the South China Sea; Table S1: Location of sampling sites; Table S2: Seawater parameters and sediment moisture content in 2021; Table S3: Comparisons of abundance and characteristics of microplastics found in marine sediments; Table S4: Spearman’s correlation among microplastics abundance at coastal locations and the offshore sites with short (B1–B4) and long distance (C1–C6) across the year; Table S5: Results of normality test and Mann–Whitney U test for microplastics abundance comparisons between coastal locations (A1–A7) and the offshore sites (B2–B4 and C1–C6). Table S6: Biomass of benthos in the Nanpeng Nature Reserve and peripheral area in spring and summer.

Author Contributions

Conceptualization, W.L., R.B. and T.W.; methodology, X.C., W.L. and T.W.; formal analysis, X.C., P.Z. and L.W.; investigation, X.C., P.Z., L.W., H.Z., X.W. and Z.Z.; resources, W.L. and R.B.; data curation, X.C. and P.Z.; writing—original draft preparation, X.C.; writing—review and editing, X.C., R.B., P.Z. and D.W.; supervision, R.B. and P.L.; project administration, P.L.; funding acquisition, D.W., P.L., W.L. and R.B. All authors have read and agreed to the published version of the manuscript.

Funding

This work was supported by National Key R&D Program of China under Grant No. 2018YFB0505005, the Li Ka Shing Foundation Interdisciplinary Research Project (2020LKSFG04E), the Key Research and Development Plan of Zhejiang Province under contract No. 2017C03037, the National Natural Science Foundation of China under contract No. 41476157, Science and Technology Plan Projects of Guangdong Province (2021B1212050025, STKJ2021125), and the Key Program of Marine Economy Development (Six Marine Industries) Special Foundation of Department of Natural Resources of Guangdong Province (GDNRC [2022]48).

Conflicts of Interest

The authors declare no conflict of interest.

References

  1. Wang, J.; Qin, X.; Guo, J.; Jia, W.; Wang, Q.; Zhang, M.; Huang, Y. Evidence of selective enrichment of bacterial as-semblages and antibiotic resistant genes by microplastics in urban rivers. Water Res. 2020, 183, 116113. [Google Scholar] [CrossRef]
  2. Wright, S.L.; Kelly, F.J. Plastic and Human Health: A Micro Issue? Environ. Sci. Technol. 2017, 51, 6634–6647. [Google Scholar] [CrossRef]
  3. Browne, M.A.; Galloway, T.; Thompson, R. Microplastic—An emerging contaminant of potential concern? Integr. Environ. Assess. Manag. 2007, 3, 559–561. [Google Scholar] [CrossRef]
  4. Desforges, J.-P.W.; Galbraith, M.; Dangerfield, N.; Ross, P.S. Widespread distribution of microplastics in subsurface seawater in the NE Pacific Ocean. Mar. Pollut. Bull. 2014, 79, 94–99. [Google Scholar] [CrossRef]
  5. Takarina, N.D.; Purwiyanto, A.I.S.; Rasud, A.A.; Arifin, A.A.; Suteja, Y. Microplastic abundance and distribution in surface water and sediment collected from the coastal area. Global J. Environ. Sci. Manag. 2022, 8, 183–196. [Google Scholar]
  6. Wang, J.; Wang, M.; Ru, S.; Liu, X. High levels of microplastic pollution in the sediments and benthic organisms of the South Yellow Sea, China. Sci. Total. Environ. 2019, 651, 1661–1669. [Google Scholar] [CrossRef]
  7. Nor, N.H.M.; Obbard, J.P. Microplastics in Singapore’s coastal mangrove ecosystems. Mar. Pollut. Bull. 2014, 79, 278–283. [Google Scholar]
  8. Peng, G.; Zhu, B.; Yang, D.; Su, L.; Shi, H.; Li, D. Microplastics in sediments of the Changjiang Estuary, China. Environ. Pollut. 2017, 225, 283–290. [Google Scholar] [CrossRef]
  9. Vianello, A.; Boldrin, A.; Guerriero, P.; Moschino, V.; Rella, R.; Sturaro, A.; Da Ros, L. Microplastic particles in sedi-ments of Lagoon of Venice, Italy: First observations on occurrence, spatial patterns and identification. Estuar. Coast. Shelf Sci. 2013, 130, 54–61. [Google Scholar] [CrossRef]
  10. Yu, X.; Zhao, Y.; Zhang, C.; Yang, C.; Ouyang, Z.; Liu, P.; Guo, X.; Zhu, L. Abundance and characteristics of micro-plastics in the surface water and sediment of parks in Xi’an city, Northwest China. Sci. Total Environ. 2022, 806, 150953. [Google Scholar] [CrossRef]
  11. Isobe, A.; Uchida, K.; Tokai, T.; Iwasaki, S. East Asian seas: A hot spot of pelagic microplastics. Mar. Pollut. Bull. 2015, 101, 618–623. [Google Scholar] [CrossRef]
  12. Zhu, L.; Bai, H.; Chen, B.; Sun, X.; Qu, K.; Xia, B. Microplastic pollution in North Yellow Sea, China: Observations on occurrence, distribution and identification. Sci. Total. Environ. 2018, 636, 20–29. [Google Scholar] [CrossRef]
  13. Diez-Minguitoa, M.; Bermudez, M.; Gago, J.; Carretero, O.; Vinas, L. Observations and idealized modelling of micro-plastic transport in estuaries: The exemplary case of an upwelling system (Ria de Vigo, NW Spain). Mar. Chem. 2020, 222, 103780. [Google Scholar] [CrossRef]
  14. Law, K.L.; Thompson, R.C. Microplastics in the seas. Science 2014, 345, 144–145. [Google Scholar] [CrossRef]
  15. Xia, F.; Yao, Q.; Zhang, J.; Wang, D. Effects of seasonal variation and resuspension on microplastics in river sediments. Environ. Pollut. 2021, 286, 117403. [Google Scholar] [CrossRef]
  16. Desforges, J.-P.W.; Galbraith, M.; Ross, P.S. Ingestion of Microplastics by Zooplankton in the Northeast Pacific Ocean. Arch. Environ. Contam. Toxicol. 2015, 69, 320–330. [Google Scholar] [CrossRef]
  17. Kolandhasamy, P.; Su, L.; Li, J.; Qu, X.; Jabeen, K.; Shi, H. Adherence of microplastics to soft tissue of mussels: A novel way to uptake microplastics beyond ingestion. Sci. Total. Environ. 2018, 610–611, 635–640. [Google Scholar] [CrossRef]
  18. Neves, D.; Sobral, P.; Ferreira, J.L.; Pereira, T. Ingestion of microplastics by commercial fish off the Portuguese coast. Mar. Pollut. Bull. 2015, 101, 119–126. [Google Scholar] [CrossRef]
  19. Zhang, L.; Xie, Y.; Zhong, S.; Liu, J.; Qin, Y.; Gao, P. Microplastics in freshwater and wild fishes from Lijiang River in Guangxi, Southwest China. Sci. Total. Environ. 2021, 755, 142428. [Google Scholar] [CrossRef]
  20. Betts, K. Why small plastic particles may pose a big problem in the oceans. Environ. Sci. Technol. 2008, 42, 8995. [Google Scholar] [CrossRef]
  21. Free, C.M.; Jensen, O.P.; Mason, S.A.; Eriksen, M.; Williamson, N.J.; Boldgiv, B. High-levels of microplastic pollution in a large, remote, mountain lake. Mar. Pollut. Bull. 2014, 85, 156–163. [Google Scholar] [CrossRef] [PubMed]
  22. Thompson, R.C.; Swan, S.H.; Moore, C.J.; vom Saal, F.S. Our plastic age. Philos. Trans. R. Soc. Lond. B Biol. Sci. 2009, 364, 1973–1976. [Google Scholar] [CrossRef] [PubMed] [Green Version]
  23. Wright, S.L.; Thompson, R.C.; Galloway, T.S. The physical impacts of microplastics on marine organisms: A review. Environ. Pollut. 2013, 178, 483–492. [Google Scholar] [CrossRef] [PubMed]
  24. Goss, H.; Jaskiel, J.; Rotjan, R. Thalassia testudinum as a potential vector for incorporating microplastics into benthic marine food webs. Mar. Pollut. Bull. 2018, 135, 1085–1089. [Google Scholar] [CrossRef]
  25. Jones, K.L.; Hartl, M.G.; Bell, M.C.; Capper, A. Microplastic accumulation in a Zostera marina L. bed at Deerness Sound, Orkney, Scotland. Mar. Pollut. Bull. 2020, 152, 110883. [Google Scholar] [CrossRef]
  26. Ng, K.L.; Suk, K.F.; Cheung, K.W.; Shek, R.H.T.; Chan, S.M.N.; Tam, N.F.Y.; Cheung, S.G.; Fang, J.K.-H.; Lo, H.S. Macroalgal morphology mediates microplastic accumulation on thallus and in sediments. Sci. Total. Environ. 2022, 825, 153987. [Google Scholar] [CrossRef]
  27. Setälä, O.; Fleming-Lehtinen, V.; Lehtiniemi, M. Ingestion and transfer of microplastics in the planktonic food web. Environ. Pollut. 2014, 185, 77–83. [Google Scholar] [CrossRef]
  28. Farrell, P.; Nelson, K. Trophic level transfer of microplastic: Mytilus edulis (L.) to Carcinus maenas (L.). Environ. Pollut. 2013, 177, 1–3. [Google Scholar] [CrossRef]
  29. Kong, X.; Jin, D.; Jin, S.; Wang, Z.; Yin, H.; Xu, M.; Deng, Y. Responses of bacterial community to dibutyl phthalate pollution in a soil-vegetable ecosystem. J. Hazard. Mater. 2018, 353, 142–150. [Google Scholar] [CrossRef]
  30. Li, C.; Gan, Y.; Dong, J.; Fang, J.; Chen, H.; Quan, Q.; Liu, J. Impact of microplastics on microbial community in sediments of the Huangjinxia Reservoir—Water source of a water diversion project in western China. Chemosphere 2020, 253, 126740. [Google Scholar] [CrossRef]
  31. Wang, Z.G.; You, Y.M.; Xu, W.H.; Chen, W.J.; Zeng, J.; Zhao, X.S.; Su, Y.P.; Wu, L.Y. Dimethyl phthalate altered the microbial metabolic pathways in a Mollisol. Eur. J. Soil Sci. 2018, 69, 439–449. [Google Scholar] [CrossRef]
  32. Beckwith, V.K.; Fuentes, M.M. Microplastic at nesting grounds used by the northern Gulf of Mexico loggerhead recovery unit. Mar. Pollut. Bull. 2018, 131, 32–37. [Google Scholar] [CrossRef] [PubMed]
  33. Dhineka, K.; Sambandam, M.; Sivadas, S.K.; Kaviarasan, T.; Pradhan, U.; Begum, M.; Mishra, P.; Murthy, M.V.R. Characterization and seasonal distribution of microplastics in the nearshore sediments of the south-east coast of India, Bay of Bengal. Front. Environ. Sci. Eng. 2022, 16, 10. [Google Scholar] [CrossRef]
  34. Herrera, A.; Asensio, M.; Martínez, I.; Santana, A.; Packard, T.; Gómez, M. Microplastic and tar pollution on three Canary Islands beaches: An annual study. Mar. Pollut. Bull. 2018, 129, 494–502. [Google Scholar] [CrossRef]
  35. Jemaa, S.; Mahfouz, C.; Kazour, M.; Lteif, M.; Hassoun, A.E.R.; Ghsoub, M.; Amara, R.; Khalaf, G.; Fakhri, M. Floating Marine Litter in Eastern Mediterranean From Macro to Microplastics: The Lebanese Coastal Area as a Case Study. Front. Environ. Sci. 2021, 9, 699343. [Google Scholar] [CrossRef]
  36. Ouyang, X.; Duarte, C.M.; Cheung, S.-G.; Tam, N.F.-Y.; Cannicci, S.; Martin, C.; Lo, H.S.; Lee, S.Y. Fate and Effects of Macro- and Microplastics in Coastal Wetlands. Environ. Sci. Technol. 2022, 56, 2386–2397. [Google Scholar] [CrossRef]
  37. Andrady, A.L. Microplastics in the marine environment. Mar. Pollut. Bull. 2011, 62, 1596–1605. [Google Scholar] [CrossRef]
  38. Chen, Z.; Jiang, Y.; Liu, J.T.; Gong, W. Development of upwelling on pathway and freshwater transport of Pearl River plume in northeastern South China Sea. J. Geophys. Res. Oceans 2017, 122, 6090–6109. [Google Scholar] [CrossRef]
  39. Wang, C.; Guo, X.-F.; Fang, J.; Li, Q.-S. Characteristics of seasonal spatial expansion of Fujian and Zhejiang Coastal Current and their bay effects. J. Appl. Oceanogr. 2018, 37, 1–8. [Google Scholar]
  40. Hartmann, N.B.; Hüffer, T.; Thompson, R.C.; Hassellöv, M.; Verschoor, A.; Daugaard, A.E.; Rist, S.; Karlsson, T.M.; Brennholt, N.; Cole, M.; et al. Are We Speaking the Same Language? Recommendations for a Definition and Categorization Framework for Plastic Debris. Environ. Sci. Technol. 2019, 53, 1039–1047. [Google Scholar] [CrossRef] [Green Version]
  41. Thompson, R.C.; Olsen, Y.; Mitchell, R.P.; Davis, A.; Rowland, S.J.; John, A.W.; McGonigle, D.; Russell, A.E. Lost at sea: Where is all the plastic? Science 2004, 304, 838. [Google Scholar] [CrossRef] [PubMed]
  42. Wang, F.; Lai, Z.; Peng, G.; Luo, L.; Liu, K.; Huang, X.; Xu, Y.; Shen, Q.; Li, D. Microplastic abundance and distribution in a Central Asian desert. Sci. Total. Environ. 2021, 800, 149529. [Google Scholar] [CrossRef] [PubMed]
  43. Torres-Huerta, A.M.; Del Angel-López, D.; Domínguez-Crespo, M.A.; Palma-Ramírez, D.; Perales-Castro, M.E.; Flores-Vela, A. Morphological and Mechanical Properties Dependence of PLA Amount in PET Matrix Processed by Single-Screw Extrusion. Polym. Technol. Eng. 2016, 55, 672–683. [Google Scholar] [CrossRef]
  44. Gonzalez-Canche, N.; Flores-Johnson, E.; Cortes, P.; Carrillo, J. Evaluation of surface treatments on 5052-H32 aluminum alloy for enhancing the interfacial adhesion of thermoplastic-based fiber metal laminates. Int. J. Adhes. Adhes. 2018, 82, 90–99. [Google Scholar] [CrossRef]
  45. Smith, B.C. The Infrared Spectra of Polymers II: Polyethylene. Spectroscopy 2021, 36, 24–29. [Google Scholar] [CrossRef]
  46. Zou, H.; Cui, W.; Wang, Z.L.; Wang, Z. The hitchhiker’s guide to core samples: Key issues and lessons learned. Sci. Total Environ. 2019, 685, 867–888. [Google Scholar] [CrossRef]
  47. Xue, B.; Zhang, L.; Li, R.; Wang, Y.; Guo, J.; Yu, K.; Wang, S. Underestimated Microplastic Pollution Derived from Fishery Activities and “Hidden” in Deep Sediment. Environ. Sci. Technol. 2020, 54, 2210–2217. [Google Scholar] [CrossRef] [PubMed]
  48. Zhao, J.; Ran, W.; Teng, J.; Liu, Y.; Liu, H.; Yin, X.; Cao, R.; Wang, Q. Microplastic pollution in sediments from the Bohai Sea and the Yellow Sea, China. Sci. Total. Environ. 2018, 640–641, 637–645. [Google Scholar] [CrossRef]
  49. Wang, J.; Lu, L.; Wang, M.; Jiang, T.; Liu, X.; Ru, S. Typhoons increase the abundance of microplastics in the marine environment and cultured organisms: A case study in Sanggou Bay, China. Sci. Total. Environ. 2019, 667, 1–8. [Google Scholar] [CrossRef]
  50. Liu, D.; Guo, Z.F.; Xu, Y.Y.; Ka Shun Chan, F.; Xu, Y.Y.; Johnson, M.; Zhu, Y.G. Widespread occurrence of micro-plastics in marine bays with diverse drivers and environmental risk. Environ. Int. 2022, 168, 107483. [Google Scholar] [CrossRef]
  51. Yu, S.; Chen, W. Seasonal variations of diluted water extension from Minjiang River. J. Oceanogr. Taiwan Strait 2012, 31, 160–165. [Google Scholar]
  52. Gopalakrishnan, K.; Kashian, D.R. Extracellular polymeric substances in green alga facilitate microplastic deposition. Chemosphere 2021, 286, 131814. [Google Scholar] [CrossRef]
  53. Luo, L.; Li, S.; Wang, D. Modelling of hypoxia in the Pearl River estuary in summer. Adv. Water Sci. 2008, 19, 729–735. [Google Scholar]
  54. Shuai, Y.; Chen, Y.; Liu, Z.; Ge, Z.; Ma, M.; Zhang, Y.; Li, Q. Distribution of Pearl-River diluted water and its ecological characteristics during spring monsoon transitional period in 2016. J. Oceanogr. 2021, 40, 63–71. [Google Scholar]
  55. Jiang, R.; Wang, Y. A preliminary ecological modeling study on response of the East Guangdong coastal ecosystem to summer coastal upwelling. Ecol. Sci. 2017, 36, 25–34. [Google Scholar]
  56. Kanhai, L.D.K.; Officer, R.; Lyashevska, O.; Thompson, R.C.; O’Connor, I. Microplastic abundance, distribution and composition along a latitudinal gradient in the Atlantic Ocean. Mar. Pollut. Bull. 2017, 115, 307–314. [Google Scholar] [CrossRef]
  57. Frère, L.; Paul-Pont, I.; Rinnert, E.; Petton, S.; Jaffré, J.; Bihannic, I.; Soudant, P.; Lambert, C.; Huvet, A. Influence of environmental and anthropogenic factors on the composition, concentration and spatial distribution of microplastics: A case study of the Bay of Brest (Brittany, France). Environ. Pollut. 2017, 225, 211–222. [Google Scholar] [CrossRef] [PubMed] [Green Version]
  58. Liu, C.L.; Tang, D.L. Spatial and temporal variations in algal blooms in the coastal waters of the western South China Sea. J. Hydro-Environ. Res. 2012, 6, 239–247. [Google Scholar] [CrossRef]
  59. Browne, M.A.; Niven, S.J.; Galloway, T.S.; Rowland, S.J.; Thompson, R. Microplastic Moves Pollutants and Additives to Worms, Reducing Functions Linked to Health and Biodiversity. Curr. Biol. 2013, 23, 2388–2392. [Google Scholar] [CrossRef] [Green Version]
  60. Ling, S.; Sinclair, M.; Levi, C.; Reeves, S.; Edgar, G. Ubiquity of microplastics in coastal seafloor sediments. Mar. Pollut. Bull. 2017, 121, 104–110. [Google Scholar] [CrossRef]
  61. Schröder, K.; Kossel, E.; Lenz, M. Microplastic abundance in beach sediments of the Kiel Fjord, Western Baltic Sea. Environ. Sci. Pollut. Res. 2021, 28, 26515–26528. [Google Scholar] [CrossRef]
  62. Lin, L.; Zuo, L.-Z.; Peng, J.-P.; Cai, L.-Q.; Fok, L.; Yan, Y.; Li, H.-X.; Xu, X.-R. Occurrence and distribution of microplastics in an urban river: A case study in the Pearl River along Guangzhou City, China. Sci. Total. Environ. 2018, 644, 375–381. [Google Scholar] [CrossRef]
  63. Mendes, A.M.; Golden, N.; Bermejo, R.; Morrison, L. Distribution and abundance of microplastics in coastal sediments depends on grain size and distance from sources. Mar. Pollut. Bull. 2021, 172, 112802. [Google Scholar] [CrossRef]
  64. Vaughan, R.; Turner, S.D.; Rose, N.L. Microplastics in the sediments of a UK urban lake. Environ. Pollut. 2017, 229, 10–18. [Google Scholar] [CrossRef]
  65. Saarni, S.; Hartikainen, S.; Meronen, S.; Uurasjärvi, E.; Kalliokoski, M.; Koistinen, A. Sediment trapping—An attempt to monitor temporal variation of microplastic flux rates in aquatic systems. Environ. Pollut. 2021, 274, 116568. [Google Scholar] [CrossRef] [PubMed]
  66. Geyer, R.; Jambeck, J.R.; Law, K.L. Production, use, and fate of all plastics ever made. Sci. Adv. 2017, 3, e1700782. [Google Scholar] [CrossRef] [Green Version]
  67. Alam, F.C.; Sembiring, E.; Muntalif, B.S.; Suendo, V. Microplastic distribution in surface water and sediment river around slum and industrial area (case study: Ciwalengke River, Majalaya district, Indonesia). Chemosphere 2019, 224, 637–645. [Google Scholar] [CrossRef]
  68. Castañeda, R.A.; Avlijas, S.; Simard, M.A.; Ricciardi, A. Microplastic pollution in St. Lawrence River sediments. Can. J. Fish. Aquat. Sci. 2014, 71, 1767–1771. [Google Scholar] [CrossRef]
  69. Eo, S.; Hong, S.H.; Song, Y.K.; Han, G.M.; Shim, W.J. Spatiotemporal distribution and annual load of microplastics in the Nakdong River, South Korea. Water Res. 2019, 160, 228–237. [Google Scholar] [CrossRef]
  70. Rodrigues, M.O.; Abrantes, N.; Goncalves, F.J.M.; Nogueira, H.; Marques, J.C.; Goncalves, A.M.M. Spatial and tem-poral distribution of microplastics in water and sediments of a freshwater system (Antuã River, Portugal). Sci. Total Environ. 2018, 633, 1549–1559. [Google Scholar] [CrossRef]
  71. Horton, A.A.; Svendsen, C.; Williams, R.J.; Spurgeon, D.J.; Lahive, E. Large microplastic particles in sediments of tributaries of the River Thames, UK–Abundance, sources and methods for effective quantification. Mar. Pollut. Bull. 2017, 114, 218–226. [Google Scholar] [CrossRef] [PubMed] [Green Version]
Figure 1. Surface sediment sampling sites for microplastic abundance in the multiple-used Zones A–F in Eastern Guangdong, the South China Sea (A: nearshore sites; B&C: offshore sites with mid and long distance to coast; D: the National Nature Reserve of Nanpeng Islands; E: seaweed ecosystems; F: offshore sites in the east); the water depth annotation as the color bar shown on the right.
Water 15 01160 g001
Figure 2. Typical µ-FTIR spectra of microplastics detected in multiple-used zones in Eastern Guangdong, the South China Sea; PP: poly(propylene); PPPE: polypropylene-polyethylene copolymer; PET: polyethylene terephthalate; PE: polyethylene; percentage in the bracket: matching degree with the standard.
Water 15 01160 g002
Figure 3. Microplastic abundance and distribution in the multiple-used Zones A–F in Eastern Guangdong, the South China Sea (A: nearshore sites; B&C: offshore sites with mid and long distance to coast; D: the National Nature Reserve of Nanpeng Islands; E: seaweed ecosystems; F: offshore sites in the east). The top/bottom edge of each box: the upper/lower quartiles; the top/bottom edge of each line on/beneath the box: the minimum/maximum; the line inside the box: the median; the dot above/below the box: the outlier.
Water 15 01160 g003
Figure 4. Microplastic abundance in surface sediments of multiple-used zones in Eastern Guangdong, the South China Sea classified by shape (a), size (b), and color (c).
Water 15 01160 g004
Figure 5. Proportions of polymer types in microplastics abundance in surface sediments of multiple-used zones in Eastern Guangdong, the South China Sea.
Water 15 01160 g005aWater 15 01160 g005b
Table 1. Polymer types detected in surface sediments of Eastern Guangdong, South China Sea.
AbbreviationPolymers Including
ABSAcrylonitrile butadiene styrene plastic
AHRAromatic hydrocarbon resin
EEAPolyethylene/ethyl acrylate copolymer
EVAEthylene vinyl acetate, poly(vinyl acetate:ethylene) 4:1
PANylon (polyamide), polyamide 6, polyamide 6,6
PAAPoly(acrylic acid, ammonium salt)
PEPolyethylene, low-density polyethylene, polyethylene white layer (TiO2)
PEPPoly(ethylene:propylene)
PEPDPoly(ethylene:propylene:diene)
PESPolyethylene with kaolin filler, polyester
PESAPoly(ethylacrylate:st:acrylamide)
PETPolyethylene terephthalate, polyester terephthalate
PPPoly(propylene), atactic/syndiotactic
PPPEPolypropylene-polyethylene copolymer
PPAPoly(phthalamide)
PSPoly(styrene), atactic
PSPOPoly(styrene:propylene oxide)
PSAMPoly(styrene:acrylonitrile:mma)
PUPolyether urethane, PPO+MBI
SPTSynthetic polyterpene
TROThermoplastic resin from mixed olefins
Disclaimer/Publisher’s Note: The statements, opinions and data contained in all publications are solely those of the individual author(s) and contributor(s) and not of MDPI and/or the editor(s). MDPI and/or the editor(s) disclaim responsibility for any injury to people or property resulting from any ideas, methods, instructions or products referred to in the content.

