
Evaluation of Social Vulnerability to Flood Hazard in Basilicata Region (Southern Italy)
by
 , , ,
, , ,
Isabella Lapietra
1,
Angela Rizzo
1,2,*,
Rosa Colacicco
1 ,
,
Pierfrancesco Dellino
1 and
Domenico Capolongo
1,2 1
Department of Earth and Geoenvironmental Sciences, Campus Universitario, University of Bari Aldo Moro, Via Edoardo Orabona 4, 70125 Bari, Italy
2
Interdepartmental Research Centre for Coastal Dynamics, Campus Universitario, University of Bari Aldo Moro, Via E. Orabona, 4, 70125 Bari, Italy
*
Author to whom correspondence should be addressed.
Water 2023, 15(6), 1175; https://doi.org/10.3390/w15061175
Submission received: 21 December 2022
/
Revised: 2 March 2023
/
Accepted: 16 March 2023
/
Published: 18 March 2023
(This article belongs to the Special Issue Socio-Economic Assessment Approaches for Improving Flood Resilience)
Abstract
:Floods are the most common natural hazards causing damage to properties and loss of life worldwide. They are not preventable but vulnerability assessments, hazard mitigation, and effective emergency management plans can reduce their impacts and facilitate recovery actions. Floods can have different impacts depending on the local physical conditions and on the social context represented by the economic and cultural patterns of a specific community. Social vulnerability is the susceptibility of social groups to the adverse impacts of natural hazards, including disproportionate death, injury, loss, or disruption of livelihood. Therefore, the social vulnerability analysis becomes of primary importance in understanding the main factors influencing the capacity of a specific community to anticipate, cope with, and recover from a flood event. In this context, this paper investigates the correlation between flood hazard and socio-economic factors across the Basilicata Region (southern Italy). The aim of this research is to evaluate flood hazard and social vulnerability index through a Geographic Information System (GIS) approach. Multivariate factor analysis was applied in this work to construct an overall social vulnerability index which was combined with the flood hazard distribution. Our results underline the presence of 107,587 people with a high level of both flood hazard and social vulnerability.
1. Introduction
River floods occur when a river overtops its banks and inundates adjacent areas [1,2,3]. They are the most common natural hazards causing damage to properties and loss of life [4,5,6,7]. In 2011, floods were reported to be the third most common natural disaster, after earthquakes and tsunamis, with 5202 deaths and affecting millions of people [8]. According to the most recent model-based scenarios, these natural phenomena will increase in frequency and magnitude due to ongoing climate changes and global warming [9]. In addition, human actions such as urbanization, changes in land use, and deforestation could speed up the process and accentuate the threat. The investigation of flood exposure of critical/social infrastructure is a necessity for a rational flood risk assessment and targeted mitigation measure implementation, as well as for the preparedness of local communities. To that end, large-scale assessments of flood-exposed areas and their spatial inequalities have drawn the attention of scientific communities in recent years [10,11].
As reported in the international Disaster Database (https://www.emdat.be, accessed on 15 December 2022), 181 flood events occurred in the last 10 years (2012–2022) in Europe. Particularly, USD 40,000,000 of damages were registered in Germany during the flood event of April 2021.
In Italy, 16 significant floods were reported by the Copernicus Emergency Management Service in the last five years (2017–2022). The most recent one occurred on 15 September 2022 in the Marche Region (Central Italy), causing the death of 11 people. According to the last assessment carried out by the Italian Institute for Environmental Research and Protection, 93,9% of Italian municipalities (7423) are prone to flooding and about 6.8 million inhabitants, nearly 34,000 cultural sites, and 1,549,759 buildings can be considered at risk [12].
The expected impacts of floods result from the complex interaction between the characteristics of the physical process, expressed in terms of frequency and severity, and the exposed natural and anthropogenic assets and their characteristics [13,14]. In Europe, flood risk assessment and management have been addressed by the European Union Flood Directive (2007/60/EC) which requires, for each member state, the redaction of hazard maps, the detection of risk areas, and the definition of effective monitoring and alerting systems [15]. Flood risk can be calculated by using the approach proposed by the United Nations Office for Disaster Risk Reduction [16] and adopted by the climate community since 2014 [17] where risk is described as the product of hazard, exposure, and vulnerability. Hazard is defined as “the potential occurrence of a natural or human-induced physical event or trend or physical impact that may cause loss of life, injury or other health impacts, property damage, social and economic disruption or environmental degradation” [18,19]. Exposure refers to the inventory of elements in an area in which hazardous events can occur [16,20,21]. Vulnerability refers to the propensity of exposed elements such as human beings, their livelihoods, and assets to suffer adverse effects when impacted by hazardous events [18,20,21,22,23,24,25,26,27,28,29,30,31]. In this regard, the current understanding of vulnerability to hazards is guided by theories, methodologies, and measurement standards derived from different schools of thought [32], most including components of exposure [33,34], susceptibility [35,36], and adaptive capacity [37,38]. The definition of vulnerability affects the method applied to address it. In particular, the main conceptual frameworks include the risk–hazard perspective such as the Human Adjustment to Natural Hazard Model [39], the political ecology/economy point of view (the Causal Structure of Vulnerability conceptual model [33], or the Disaster Pressure and Release Model [38]) and the Hazards of Place approach [40], which implement a Geographic Information System (GIS) to spatially integrate biophysical and social vulnerability.
In this context, as mentioned by Cutter et al. [41], the main concept of the present research is that a natural disaster can have more devastating effects on one place than another depending on the local vulnerability of each place. Every disaster, including floods, can have a significant impact depending on the local context represented by social, cultural, and economic patterns [42,43,44,45,46,47,48]. When a flood occurs, the impact spreads in different ways on the community and the extent of damages depends on the vulnerability of the affected people and infrastructure [49]. Consequently, one of the main issues connected with the impact of flood hazard relates to the socio-economic aspects of the communities potentially affected by a flood event and to the lack of financial resources that decrease the population’s ability to deal with disasters. For this reason, the need to integrate social science research concerning social vulnerability into territorial planning and decision-making policies [50,51] clearly emerges. As identified by the United Nations Expert Working Group on ‘Measuring Vulnerability’, one of the approaches to identify vulnerable people is the definition of a tailored vulnerability index [52].
Over the last years, several studies in different countries were proposed to measure social vulnerability to hazards at national and sub-national scales such as the United States of America [40,53,54], Australia [55], the United Kingdom [56,57], Latin America and the Caribbean [58], Spain [59], Israel [60], Germany [61,62], and Indonesia [63]. However, there are only a few studies assessing social vulnerability in Italy [50,51,64] of which most are linked to flood risk in Northern Italy [65,66,67]. Consequently, the investigation of social vulnerability in southern regions (widely recognized as less developed at the national scale [68]) is required.
Starting from the general definition of risk, this study aims to explore two of the main components influencing flood risk by constructing a Social Vulnerability Index (SVI) and relating it with flood hazard in the Basilicata Region (southern Italy). The present research follows the hazard of places approach proposed by Cutter et al. [41] by applying the inductive method where measurements of social vulnerability are based on the underlying factors that influence a community’s ability to prepare for, deal with, and recover from an impact [59,69]. In this respect, a social vulnerability index is defined as an aggregated or composite measurement of selected vulnerability indicators that results in a numerical value of the social vulnerability of a given geographical unit [29]. Quantifying and mapping social vulnerability can support the identification of groups of people considered the most vulnerable. Such kind of analysis allows to identify the key driving factors influencing social vulnerability [70] and to promote disaster reduction [71]. Since the quality of the data used to represent these indicators directly affects the outcomes of the overall risk assessment [72], its improvement is relevant to risk management and spatial planning [65].
Being based on available data at the national level, the proposed investigation can be applied for the social vulnerability evaluation of all the municipalities potentially affected by flood hazard.
2. Study Area
The Basilicata Region is located in southern Italy and covers a total area of 10,073 km2 (https://www.istat.it/it/archivio/222527, accessed on 18 December 2022). The Region includes 131 municipalities and hosts 541,168 inhabitants (http://dati.istat.it/Index.aspx?QueryId=18564, accessed on 18 December 2022).
From a geomorphological perspective, the region is characterized by marked differences between the western and the eastern sectors, highlighting the division between Potenza (6594.28 km2) and Matera province (3478.84 km2) (Figure 1) which is also reflected in the waterway’s development [73]. The rivers on the Tyrrhenian side have limited lengths and are characterized by a rather steep longitudinal profile, at least in the upper and middle reaches. On the other hand, the Ionian side is crossed by five main rivers (Bradano, Basento, Cavone, Agri, and Sinni) which reach the Gulf of Taranto with a cross-shore pattern. The longitudinal profile of these rivers shows a first short regular steep section and a medium-low to a very low gradient in the remaining part, resulting in braided (braided-channel) beds in the middle course and meanders in the final section.
The Basilicata Region is one of the most hazard-prone areas of the Italian territory with a strong hydrogeological instability. Nearly 50% of the towns are exposed to a high risk of landslides or floods [74,75]. The area affected by flood risk is 260 km2 wide (2.6% of the whole territory) and mainly includes the hilly areas and the coastal belt, which are exploited in agriculture, the main regional economic source [76].
The territory of the Basin Authority of Basilicata falls within the Hydrographic District of the southern Apennines which provides flood hazard (http://www.adb.basilicata.it/adb/pStralcio/pericol_alluv.asp, accessed on 8 January 2023) risk maps (http://www.adb.basilicata.it/adb/pStralcio/rischio_alluv.asp, accessed on 8 January 2023) as well as the Flood Risk Management Plan (https://www.distrettoappenninomeridionale.it/index.php/definizione-e-competenze-menu-pgra, accessed on 8 January 2023). Moreover, data about coastal flooding are provided for the Ionian and Tyrrhenian coastal zones (http://www.adb.basilicata.it/adb/pStralcio/maregg_alluv.asp, accessed on 16 January 2023.
The Flood Risk Plan is the regulative framework aiming to identify the riverbeds, floodplains, and next areas that can be flooded in case of flow discharges with return period until 30 years, 200 years, and 500 years [15]. It also provides management, mitigation strategies, and restraints to land use in flood risk areas, in order to reduce damages produced by human activities and natural phenomena and to preserve natural hydraulic dynamics of water surface bodies [77].
In this respect, the flood hazard maps identify the geographical areas that could be affected by floods according to the three main flood scenarios. For each scenario, the extent of the flood, water height, velocity, and flow rate are indicated for the major watercourses and some of their tributaries [78]. These maps also contain indications of alluvial phenomena with a high volume of transported sediments and debris flows. The floodable areas at different return periods were mapped using digital topographic cartography (1:5000 scale), topographic surveys of river sections, orthophotos in 1:5000 scale, and photographic DTM (precision of 1.5 m × 0.8 m).
The flood risk maps indicate the potential negative consequences deriving from floods in the context of the scenarios listed above, expressed in terms of indicative number of potentially affected inhabitants, infrastructure, environmental, historical and cultural assets of significant interest, distribution and typology of economic activities, and potentially polluting plants and industries. The risk classes are those defined by the Italian Ministerial Decree 189/1998 where R1 = moderate risk (social, economic and environmental damage is marginal), R2 = medium risk (minor damage to buildings, infrastructure, and the environmental heritage is possible but it does not affect the safety of people, the usability of buildings, and the functionality of economic activities), R3 = high risk (there are possible issues for the safety of people, functional damage to buildings and infrastructure, with consequent unavailability and interruption of socio-economic activities, significant damage to the environmental heritage) and R4 = very high risk (possible loss of life or serious injury to people, damage to buildings, infrastructure, and environmental assets, destruction of socio-economic activities). The flood risk maps were developed taking into account the hazard maps and the potential damage maps (http://www.adb.basilicata.it/adb/pStralcio/danno_alluv.asp, accessed on 27 February 2023).
Recently, several high-resolution analyses were conducted for a more accurate flooding hazard analysis [79,80] as hydro-geomorphological processes are linked to changes in the landform caused by channel form and mobility, continuity and connectivity of the stream, slope angle of the channel, riverbed structure, type and size of the substrate, water depth, and flow velocity [81]. Dal Sasso et al. highlighted that, between 1925 and 2015, these phenomena occurred with higher frequencies along the basins of Basento, Bradano, and Cavone, during winter seasons [82]. The recent increase in the annual and intra-annual frequency of alluvial episodes, especially in the Metaponto plain, has caused large damage to the agricultural land, urban fabric, and archaeological heritage [83], strongly affecting its economic stability. Indeed, the area of Metaponto is characterized by a high tourist vocation due to the remarkable archaeological heritage and the numerous accommodation facilities [84]. It is worth noting that the territory of Metaponto includes the archaeological Park of Metaponto and the National Archaeological Museum, whereas the Heraclea (Herakleia) Greek colony raised on a hill between the mouth of rivers Agri and Sinni (https://www.sitiarcheologiciditalia.it/en/parco-archeologico-di-heraclea/ accessed on 15 December 2022).
3. Materials and Methods
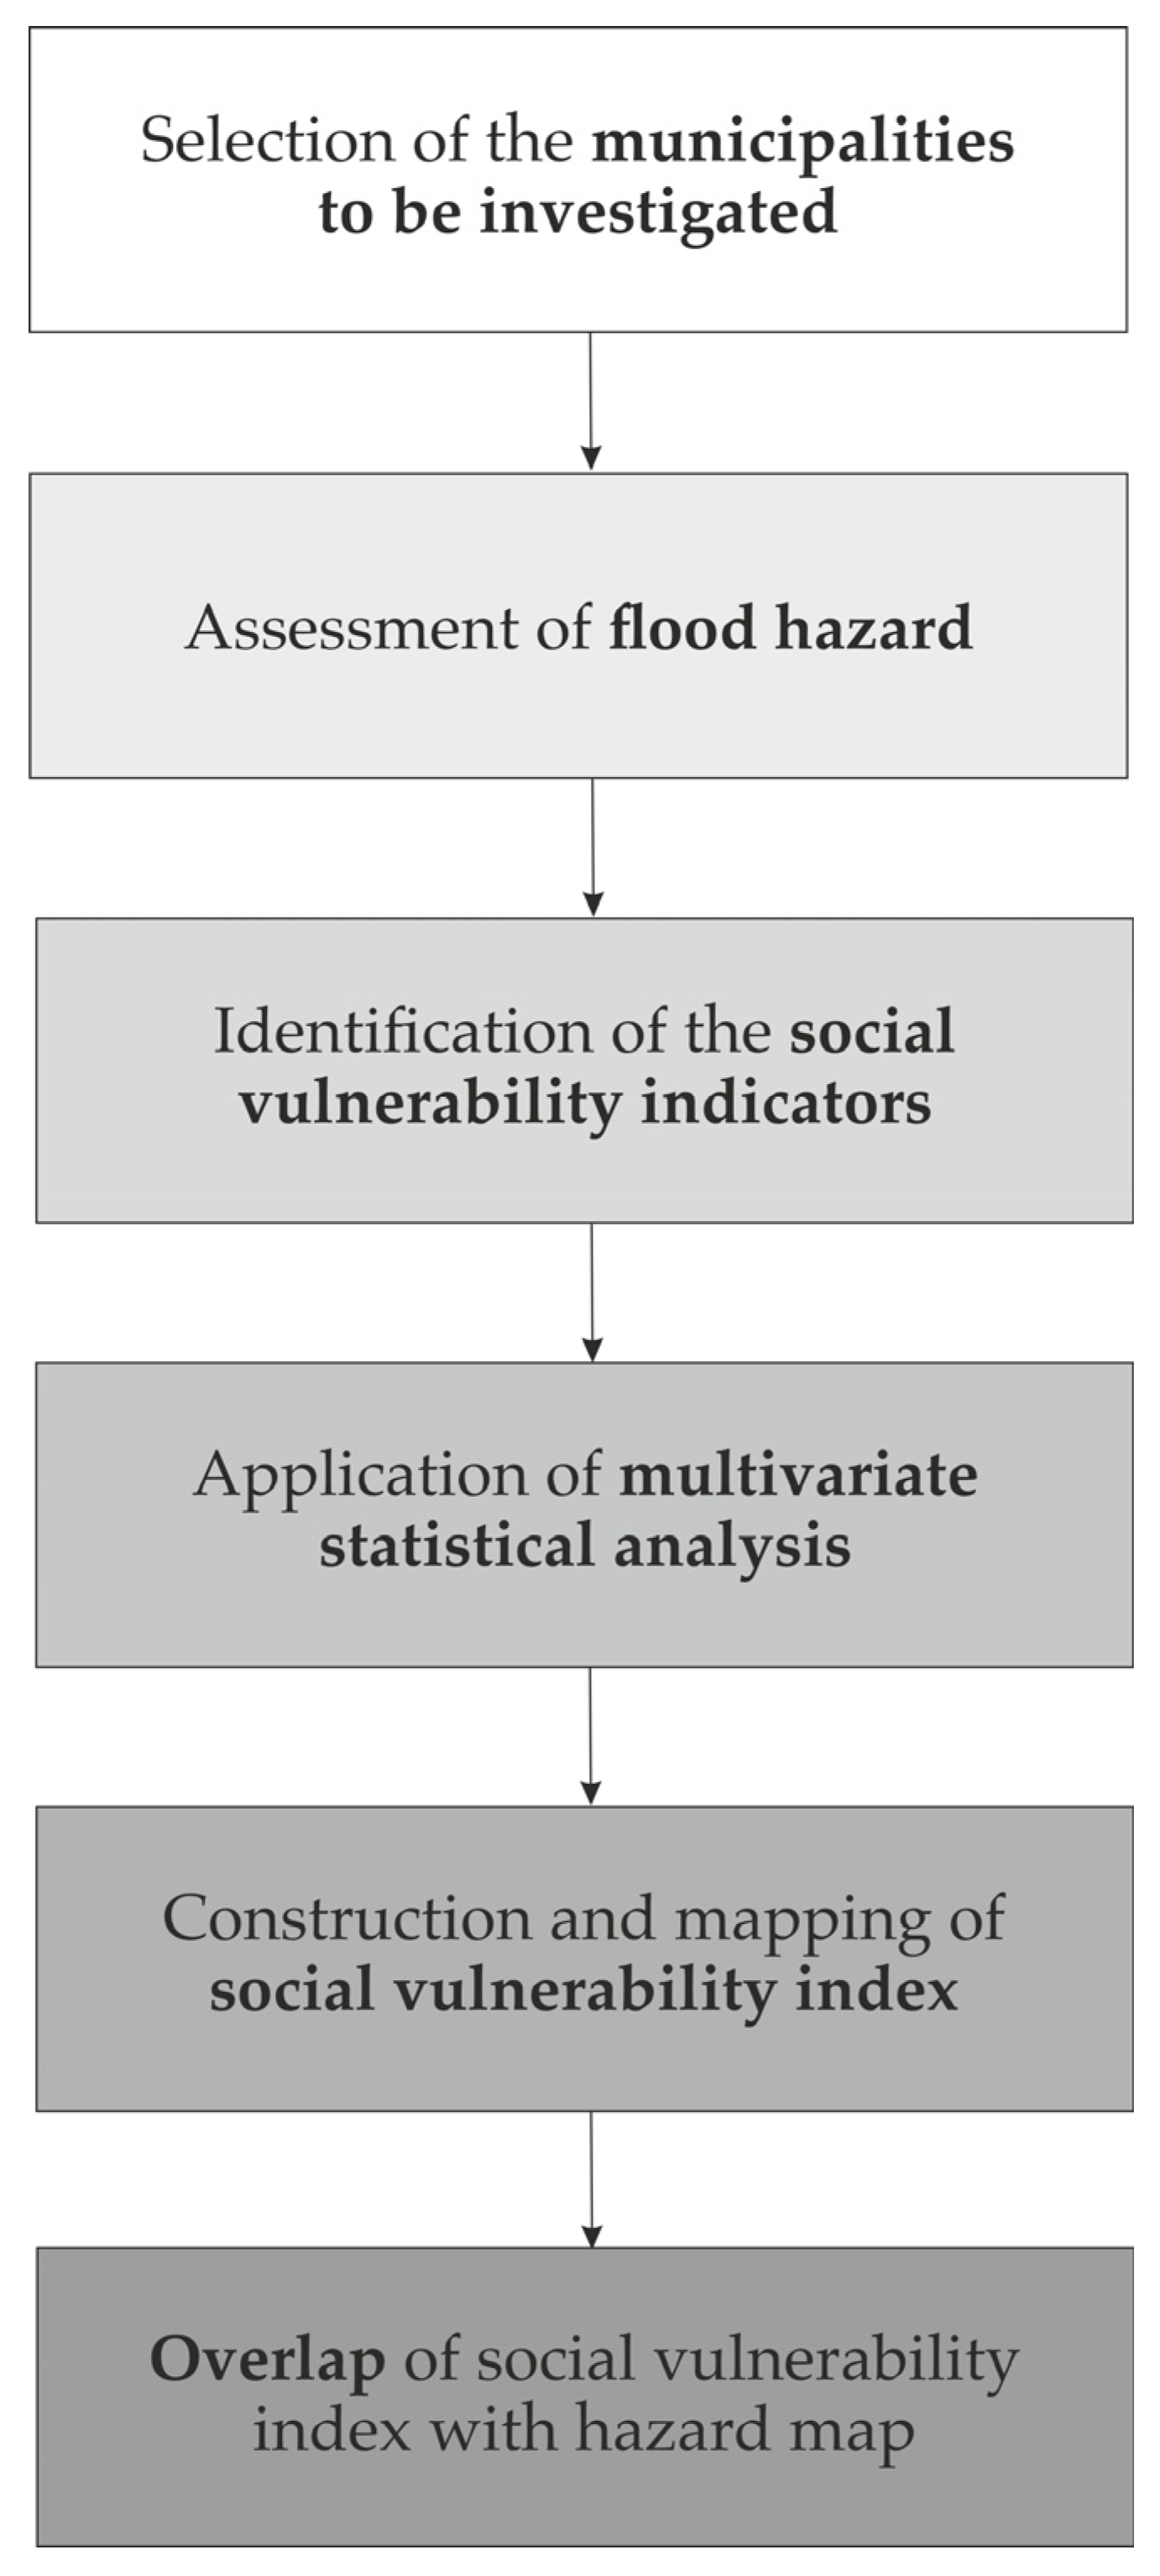
The method provided in this research focuses on the application of a GIS-based approach that allows to combine flood hazard with the SVI at the municipality level. The choice to work at this administrative level was based on the availability of national open data (https://www.istat.it/, accessed on 18 January 2023). A multivariate statistical method was applied to analyze the socio-economic characteristics of the study area, whereas a spatial distribution through GIS was adopted to assess flood hazard, map SVI, and combine results. As shown in Figure 2, the proposed procedure consists of different steps represented in the flow chart and explained in detail in the following sections.
3.1. Selection of the Municipalities
The identification of the municipalities to be investigated was based either on data related to past flooding events or on the probability of future events in the Basilicata Region. To this aim, flood hazard data, provided by ISPRA (https://idrogeo.isprambiente.it/app/page/open-data, accessed on 17 December 2022), were overlaid in a GIS environment on the administrative municipality boundaries, collected from the National Institute of Statistics (https://www.istat.it/it/archivio/222527, accessed on 18 December 2022). Data derive from national open-source platforms, and they represent the base to assess the physical characteristics of the study area.
The ISPRA dataset defines the extension of the areas prone to be flooded, and accounts for three probability scenarios, as required by the Flood Directive [15]:
- High Probability
- Medium Probability
- Low Probability
According to the Italian Legislative Decree 49/2010, these scenarios correspond to areas that can be flooded with return periods ranging between 20 and 50 years (HPH—high probability or frequent floods), 100 and 200 years (MPH—average probability or infrequent floods), and greater than 200 years (LPH—low probability or extreme event scenarios), respectively.
3.2. Assessment of Flood Hazard at the Municipality Level
The extent in km2 of the LPH, MPH, and HPH flood scenarios in each municipality was compared with the total extent of the municipality, in order to classify the municipalities in terms of relative hazard levels. For each municipality, the percentage of territory potentially affected by LP, MP, and HP flood was calculated. Since the LPH flood scenario included also the area characterized by MHP and HPH, its relative percentage values were used to classify the municipalities into five hazard levels: H1 (very low), H2 (low), H3 (medium), H4 (high), and H5 (very high).
3.3. Identification of the Social Vulnerability Indicators
Following the methodological approach proposed by Cutter et al. [41], the social vulnerability assessment requires the selection of the main indicators influencing social vulnerability. The choice of indicators is a critical aspect in constructing the social vulnerability index, but there are no reference guidelines providing information on the data to be used and the statistical treatment to use during the investigation [51]. In this paper, the identification of the socio-economic indicators was based upon a review of the recent literature, the socio-economic context of the Region, and the addition of national census data (https://ottomilacensus.istat.it/ and https://www.istat.it/, accessed on 17 December 2022), which describe the demographic structure of the population residing in each municipality of Italy.
3.4. Application of the Multivariate Statistical Analysis
One of the most common statistical methods used for the construction of a social vulnerability index is the Factor Analysis (FA) [42,63,85] which is part of the inductive model [48]. This multivariate statistical approach enables the reduction of a large number of proxy variables to a smaller number of components [86], which are easier to interpret in terms of the causal process without losing too much information from the input data. The application of this method has proven to be highly effective in extracting the main components influencing social vulnerability across a given area. As a first step, being the variables characterized by different unit measures, data normalization was carried out through a standardization operation (consisted in subtracting, for each datum, the mean and dividing by the standard deviation). The standardization transforms each variable to have a zero mean and a standard deviation of one.
According to Chakraborty et al. [55], a reliability and consistency dataset investigation was carried out before conducting the FA. In particular, the Kaiser–Meyer–Olkin (KMO) measure was adopted to detect multicollinearity issues. The KMO overall statistic registered a value > 0.60, suggesting the application of the FA [87].
Consequently, the FA with varimax rotation was applied to extract the main factors describing the variance of the entire dataset. The statistical software to compute the multivariate statistical analysis was Minitab. Lastly, these factors were mapped in a GIS environment to analyze their spatial distribution.
3.5. Construction and Mapping of the SVI
In order to construct the social vulnerability index (SVI), the main factors obtained from the multivariate statistical analysis (cf. Section 3.4) were combined to provide a unique number score. In detail, the factors were aggregated by applying the equation provided by Siagian et al. [63]:
SVI = Σ(((Variance1 × Factor1)/Tot.Variance)) + ((Variance2 × Factor2)/TotVariance)) + ((VarianceN × FactorN)/(TotVariance))
Since the variance explains the degree of representation of each factor with respect to the entire dataset, this method allows to compute the SVI, giving each factor a specific influence (weight).
Once all the SVI values were calculated for each investigated municipality, the results were spatially distributed through a GIS-based standard deviation method showing the variation of the of social vulnerability level in the study area (V1 = very low social vulnerability, V2 = low social vulnerability, V3 = medium social vulnerability, V4 = high social vulnerability, and V5 = very high social vulnerability).
3.6. Overlap of Flood Hazard with Social Vulnerability Maps
As a final step, flood hazard levels were combined with the values of the SVI. This operation was carried out through a GIS-based raster analysis tool, which allowed the combination of different raster datasets into one and the obtainment of the final map. A raster analysis was conducted to overlap the raster of the social vulnerability index and flood hazard levels.
Considering the qualitative assessment risk matrix, the resulting raster was classified into five categories (1 = Very low, 2 = Low, 3 = Medium, 4 = High, and 5 = Very high).
4. Results
4.1. Municipalities under Investigation
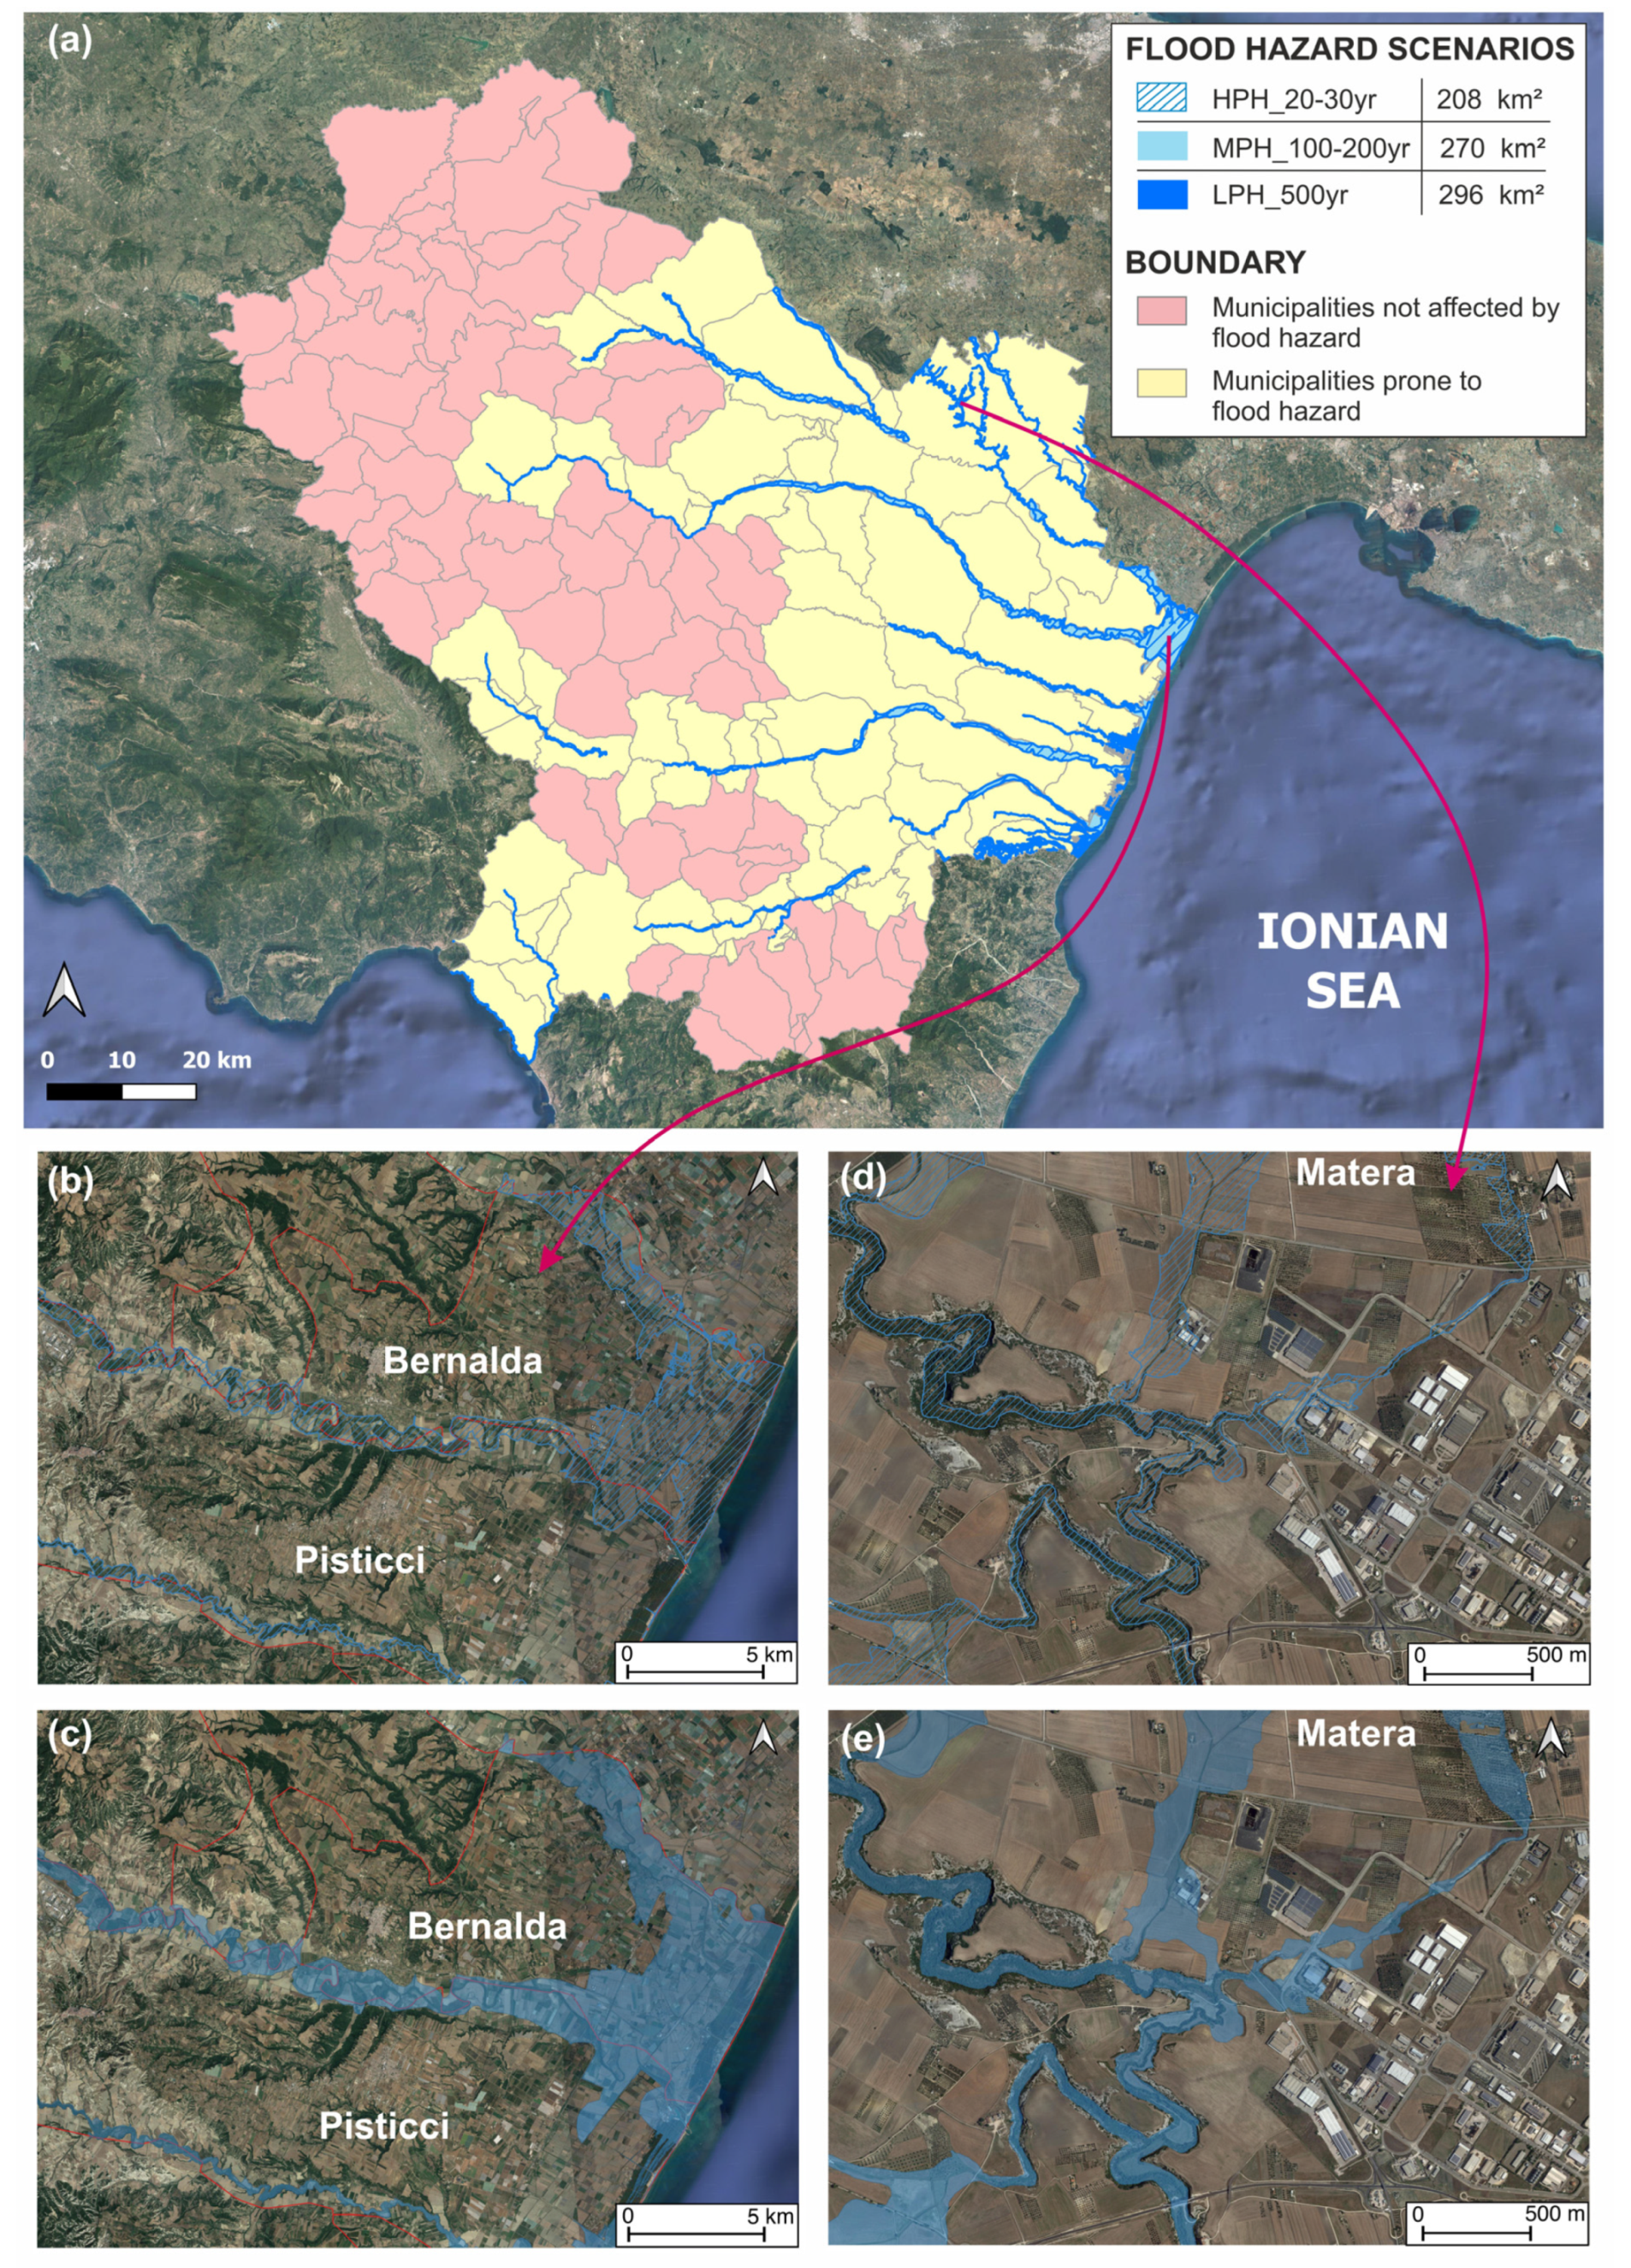
As a result of the overlay between the Basilicata municipalities and flood hazard data provided by ISPRA, 56 municipalities were selected to be further investigated in terms of hazard and social vulnerability (Figure 3). They are located in the eastern sector of the Basilicata region, along the Ionian plain where the main hydrographic network extends. In particular, 31 municipalities belong to the province of Potenza, whereas 25 are part of Matera (Table 1).
In detail, 208 km2 (corresponding to 2.1% of the regional territory) are characterized by high flood probability (HPH); such a surface extends up to 270 km2 (2.7% of the regional territory) in case of medium flood probability (MPH) and reaches 296 km2 in the case of a low flood probability (LPH), with a percentage of regional territory prone to be flooded equal to 2.9% of the total surface. The area potentially affected by flood mainly includes the hilly areas and the coastal belt which are exploited by agriculture (the main regional economic source).
4.2. Flood Hazard Scenarios
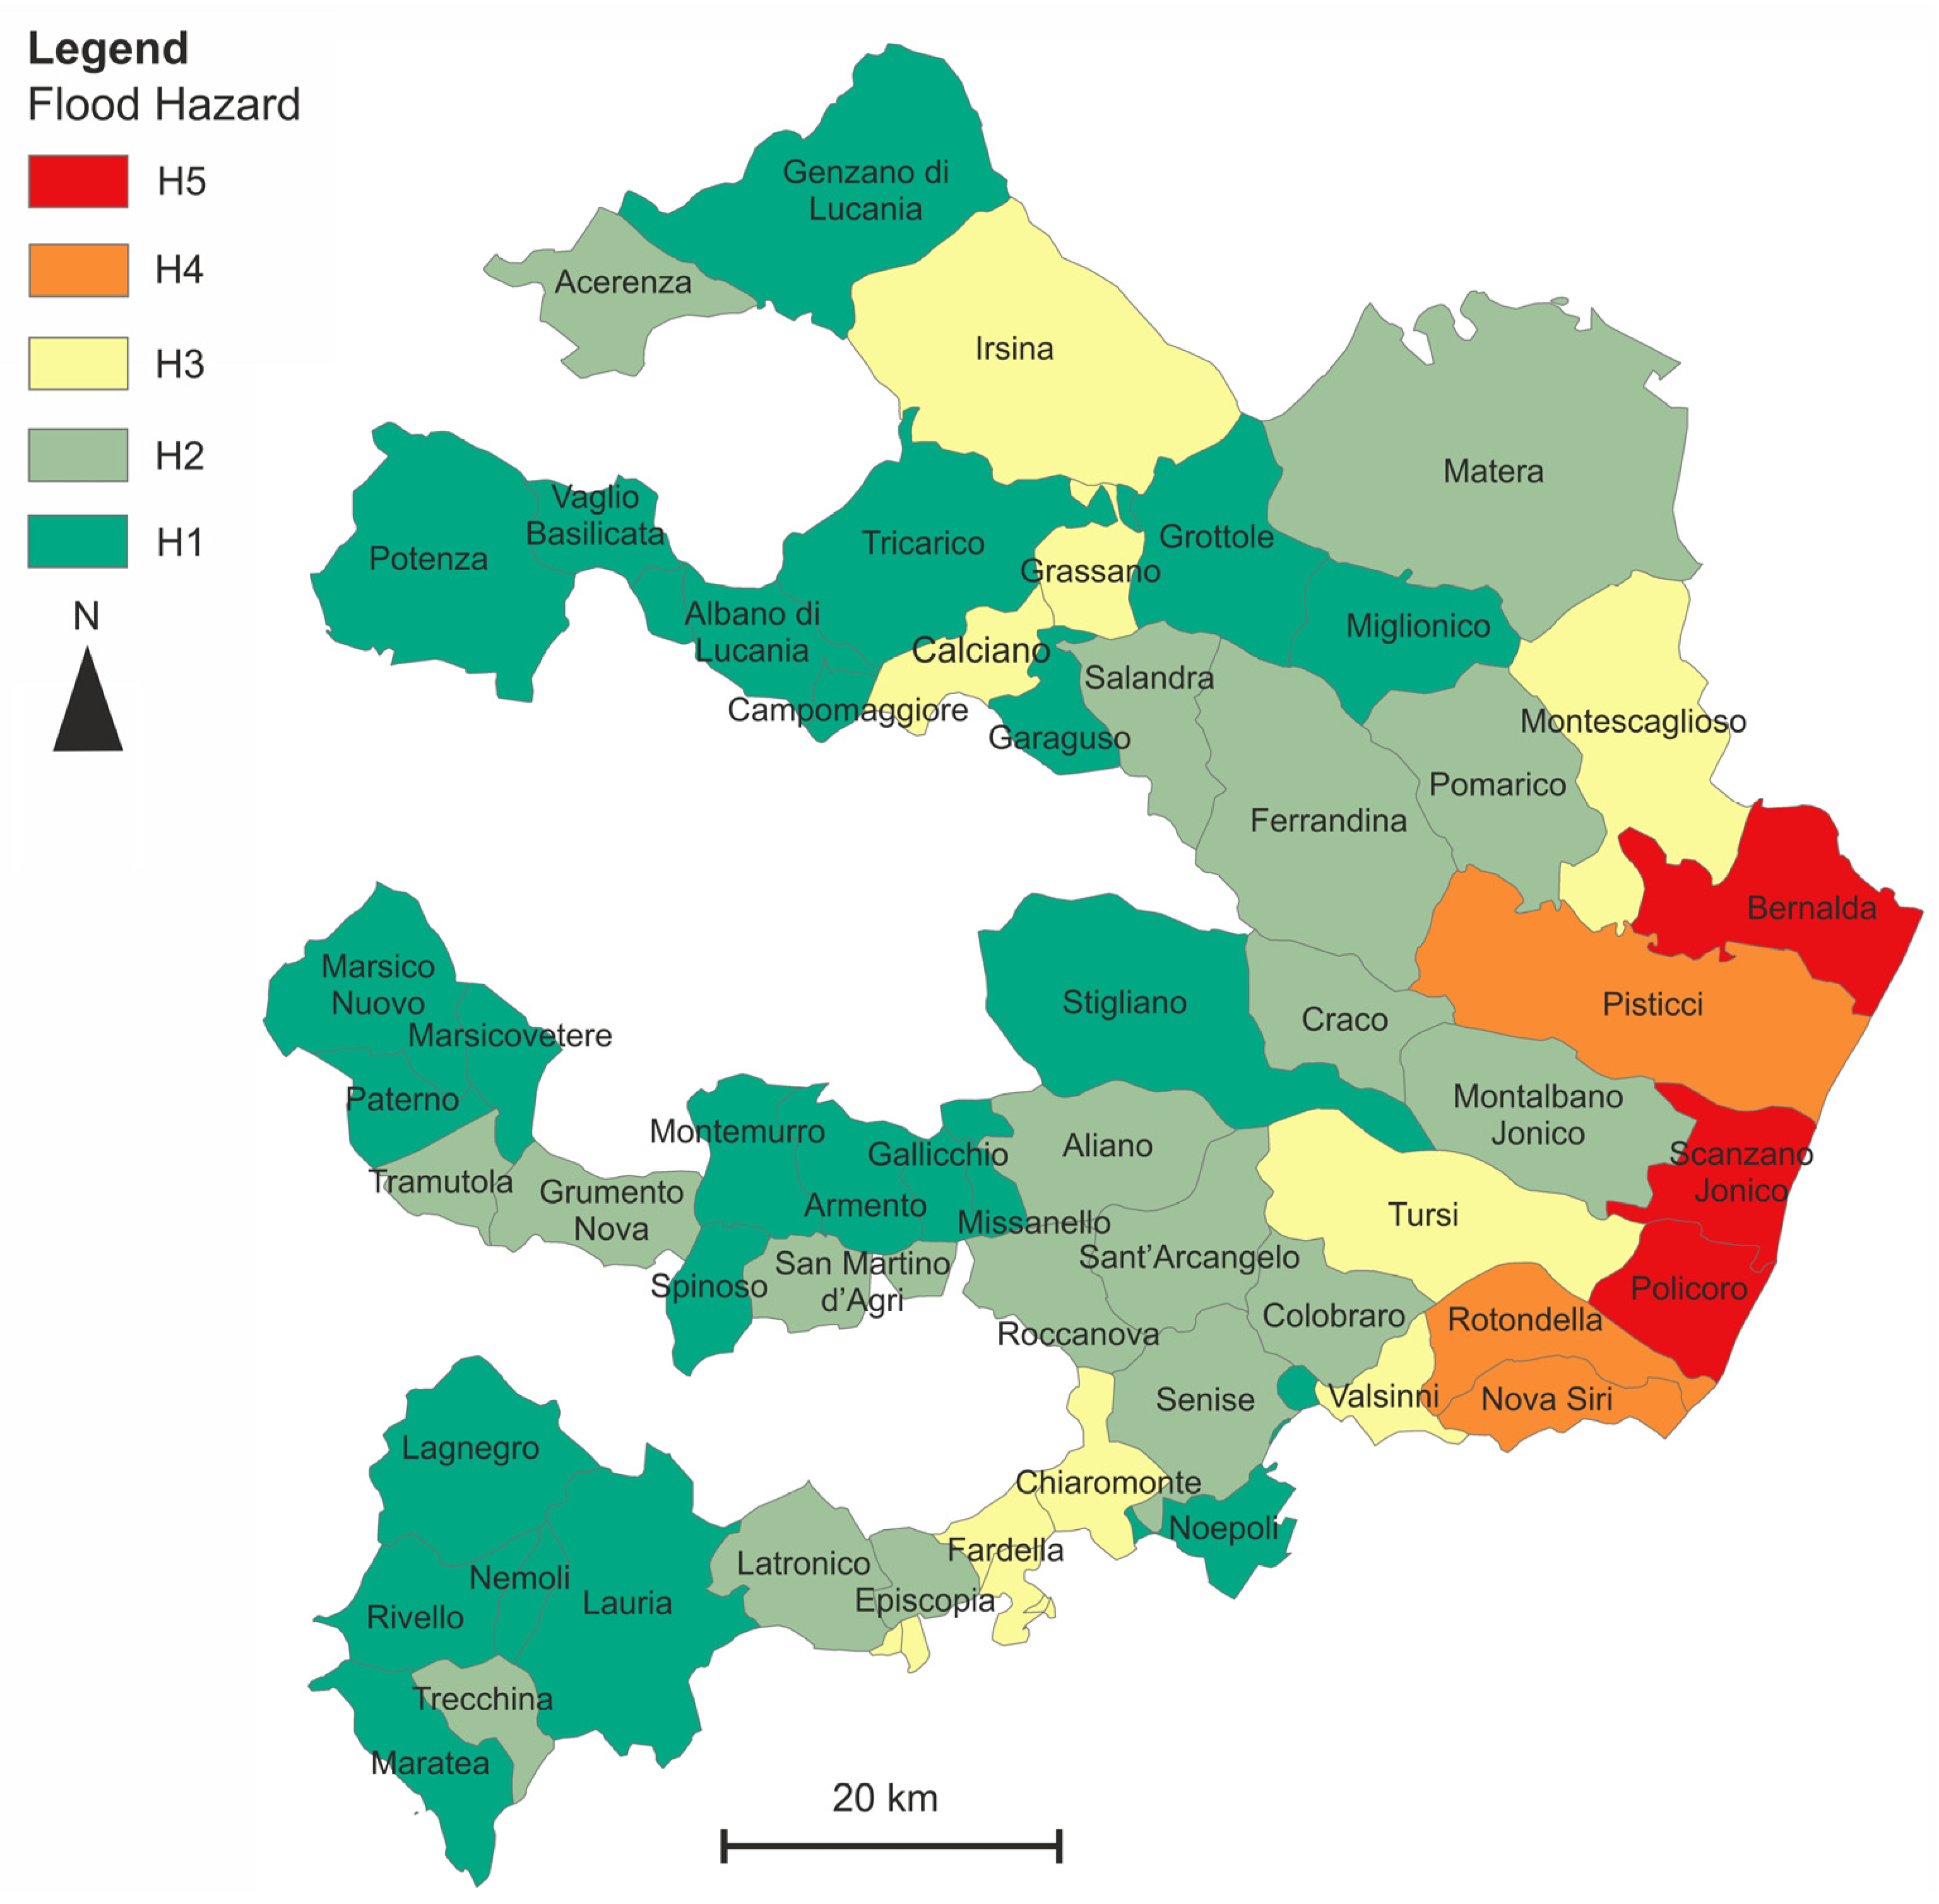
The flood hazard assessment (cf. Section 3.2) highlights that the main municipalities with the highest percentage of area prone to be flooded are: Bernalda, Pisticci, Policoro, Rotondella, Scanzano Jonico, and Nova Siri (Figure 4). Bernalda records a very high-level flood hazard (H5) in all flood probability scenarios. Indeed, more than 30% of the municipality territory could be flooded in the case of HPH, MPH, and LPH. Secondly, Scanzano Jonico registers a range between 13% and 24% of floodable areas followed by Policoro (7%–24%), Rotondella (11%–19%), Nova Siri (13%–17%), and Pisticci (9%–14%). The latter municipalities register an increasing flood hazard trend (between H3 and H5), moving from the HPH scenario to an LPH scenario. However, as shown in Figure 5, these municipalities are located along the same Ionian coastal zone in the southeastern sector of the study area. As for the remaining municipalities, they fall between the H3 (medium) and H1 (very low) hazard zones, registering less than 12% of the municipal area prone to be flooded.
4.3. Social Vulnerability Indicators
Concerning the main socio-economic indicators, Table 2 represents an overview of the main socio-economic indicators chosen for the statistical investigation with their relative proxy variables.
The age indicator is represented by the percentage of youths and the elderly as well as the ageing and the dependency index [64]. For instance, young people are dependent on adults in terms of monetary support and decision-making. Both young and old people may be unable to respond to disasters on their own [18], requiring special needs and resources. They can be also particularly affected in terms of health repercussions in the aftermath [88]. They can be vulnerable due to not only mobility problems or illnesses, but because of their way of thinking and experience even related to the different cycles of weather [41].
Regarding the gender indicator, women in particular can be badly hit due to social and cultural gender norms, as family care responsibilities and the increment of workload can have a huge impact on women in the aftermath and recovery phase [26,41,88].
In addition, residents with different ethnicities can have increased vulnerability due to different languages and cultures that affect access to post-disaster resources and sometimes a misunderstanding of flood warning information [41,85,88,89,90,91].
Moreover, education represents the ability to understand warning information during disaster events and to provide access to recovery resources in the aftermath [41,51,85,92].
Economically poorer people in comparison to those in other categories are considered more susceptible to extreme events [93], as structural maintenance and operative mitigation initiatives are often out of reach for low-income households [94]. The unemployment rate and therefore, very low income, can exacerbate losses and increase vulnerability within a social system [37,41,95]. For this reason, the percentage of residents belonging to the three lowest income classes were included as variables for the corresponding indicator.
4.4. Main Socio-Economic Factors
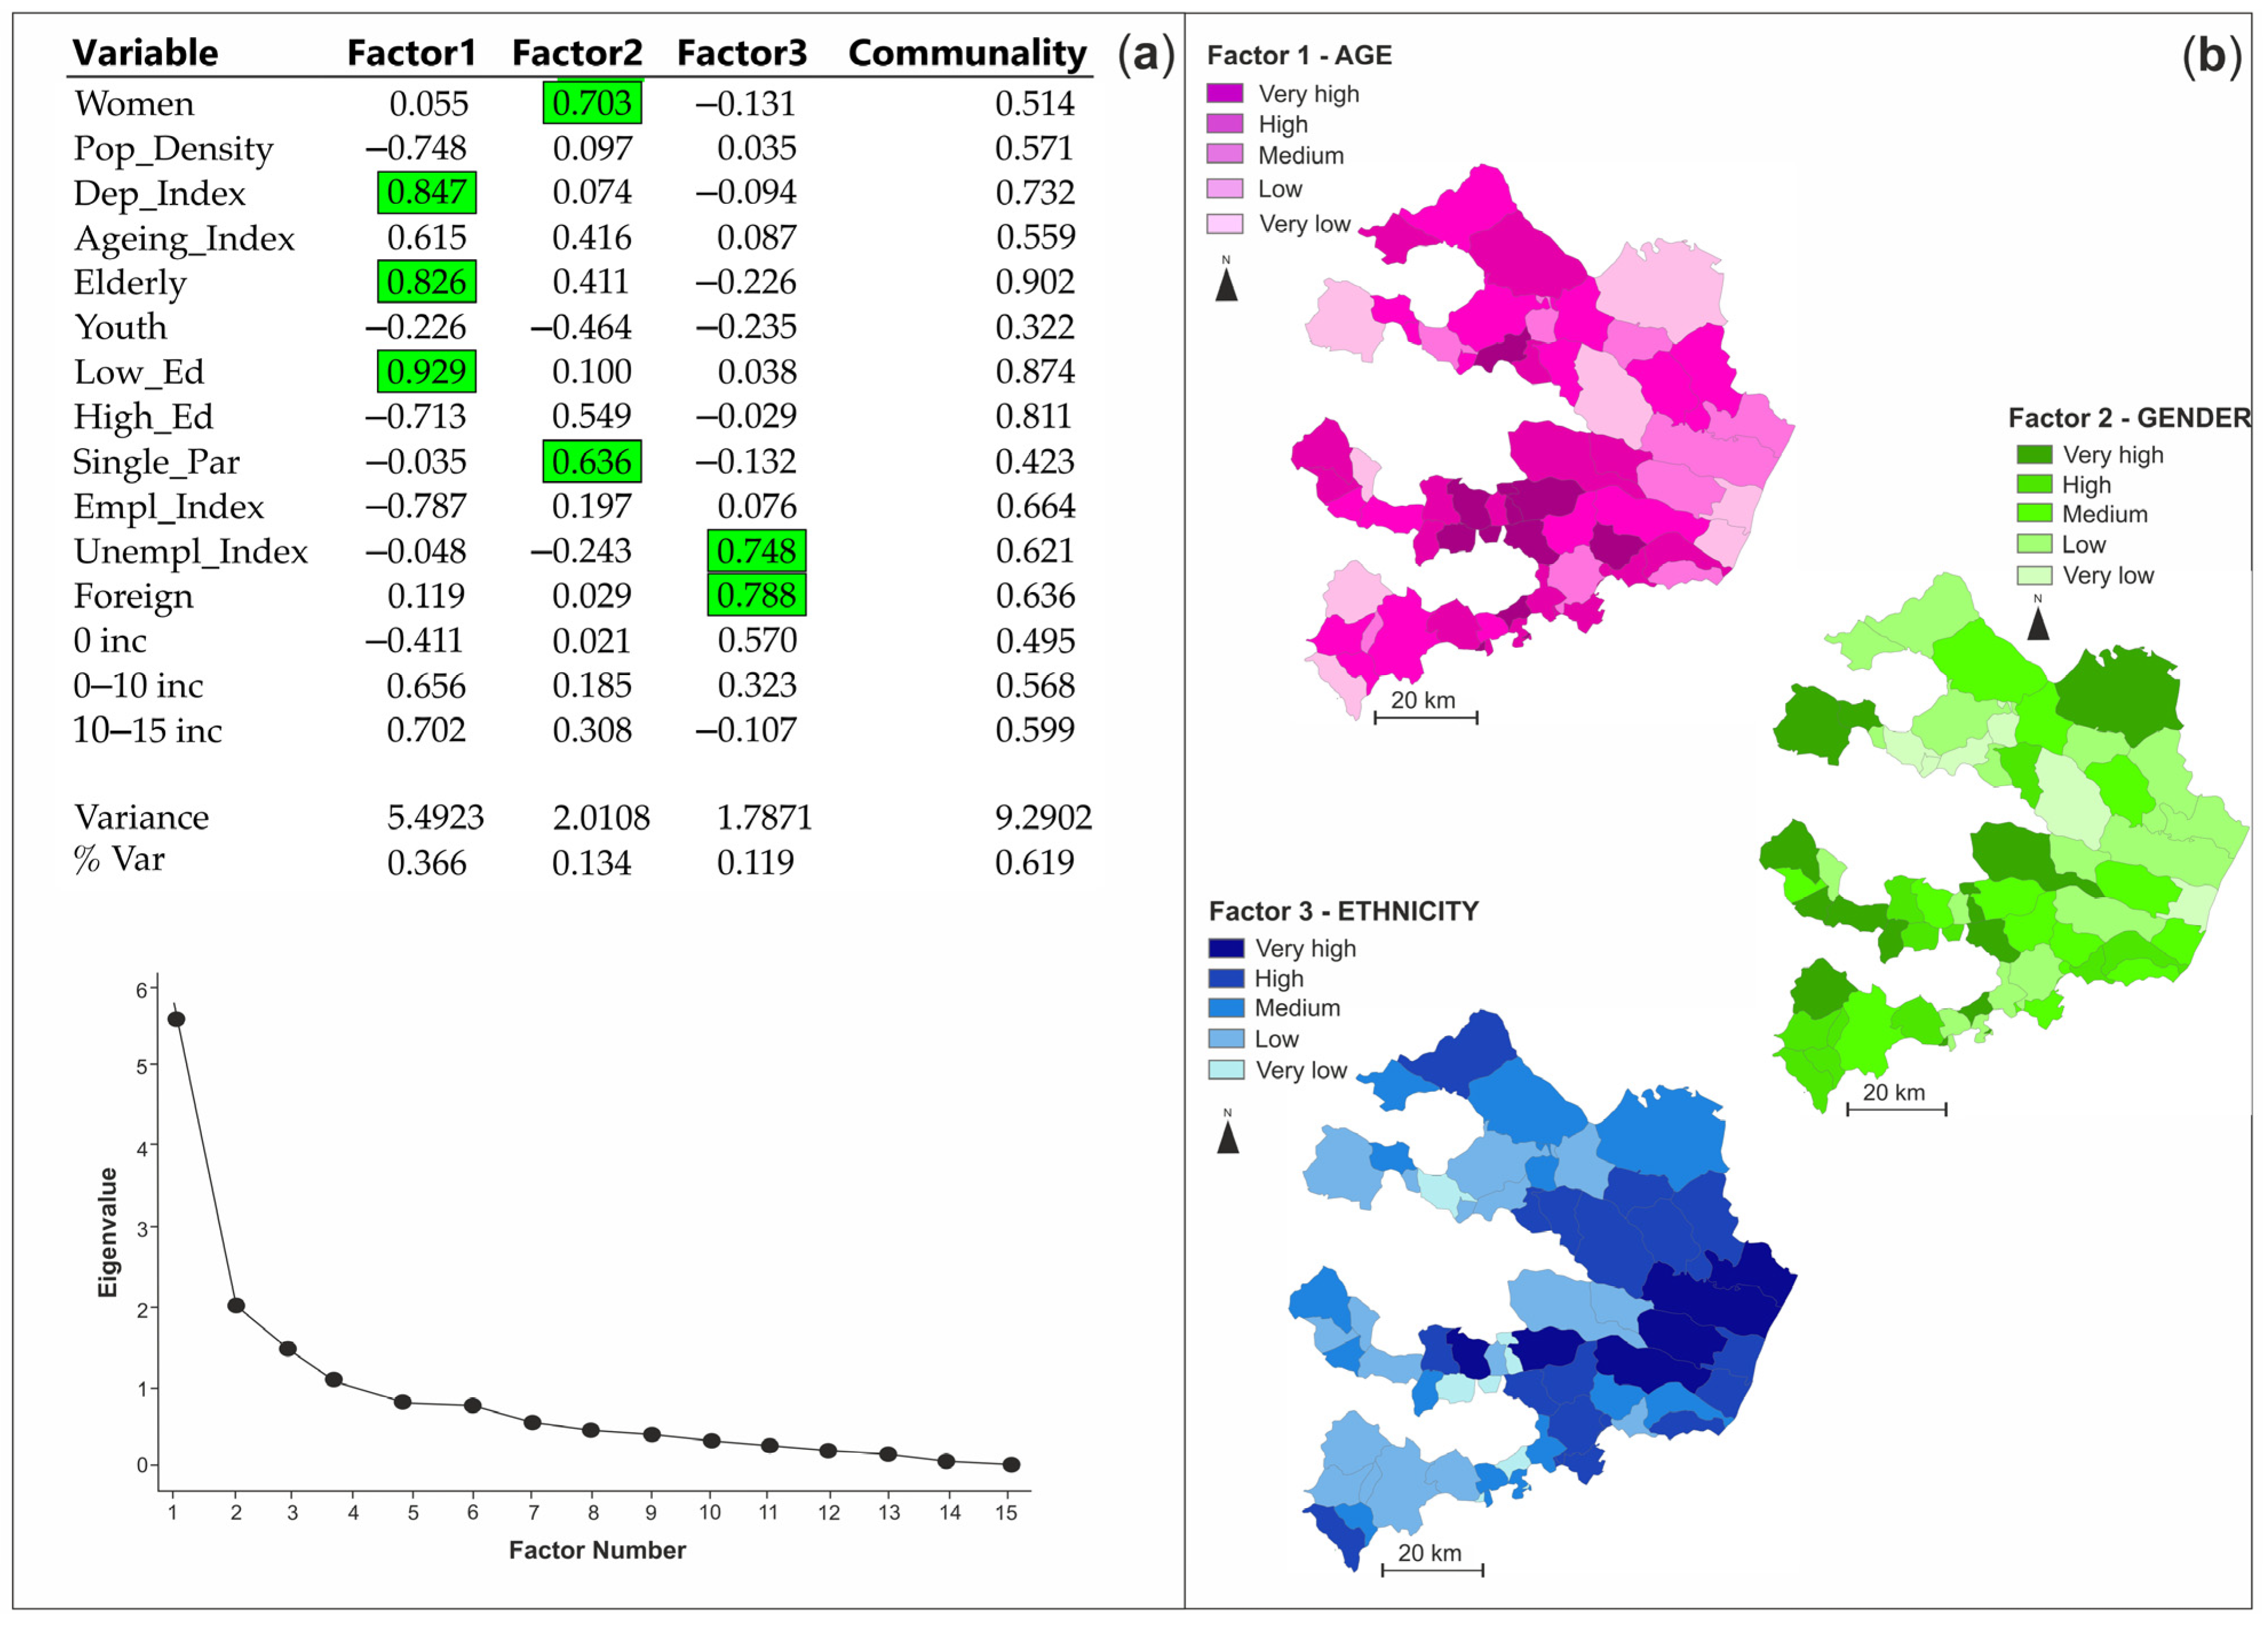
Based on the results of the FA (Figure 6a), three factors were extracted from the whole set of available proxies. Indeed, the proxy variables represented by the highest correlation values are aggregated into one main factor.
In particular, the first socio-economic factor is mainly described by age explaining 36.6% of the variance, followed by gender with 13.4% and ethnicity with 11.9%. Such results are also evident from the Scree Plot shown in Figure 6a, where factors with eigenvalues greater than 1 (meaning that they are significant in representing the original data) are those that better explain the dataset (61.9% of the variance).
In Figure 6b, the spatial distribution of the main factors across the study area is shown. In particular, the map related to the first selected factor (age) underlines a significant presence of a consistent percentage of dependent residents with an age over 65 across the study area. Eight municipalities fall in very low values of standard deviation such as Matera and Potenza, whereas very high classes are depicted in Calciano, Colobraro, Roccanova, Aliano, Missanello, Montemurro, Spinoso, and Fardella. On the other hand, high values of standard deviation of the gender factor are registered in 11 municipalities, where high percentages of women as single parents live. Lastly, the map showing the spatial distribution of the third factor underlines the Metaponto plain as the main area inhabited by foreign residents.
4.5. SVI and Raster Analysis
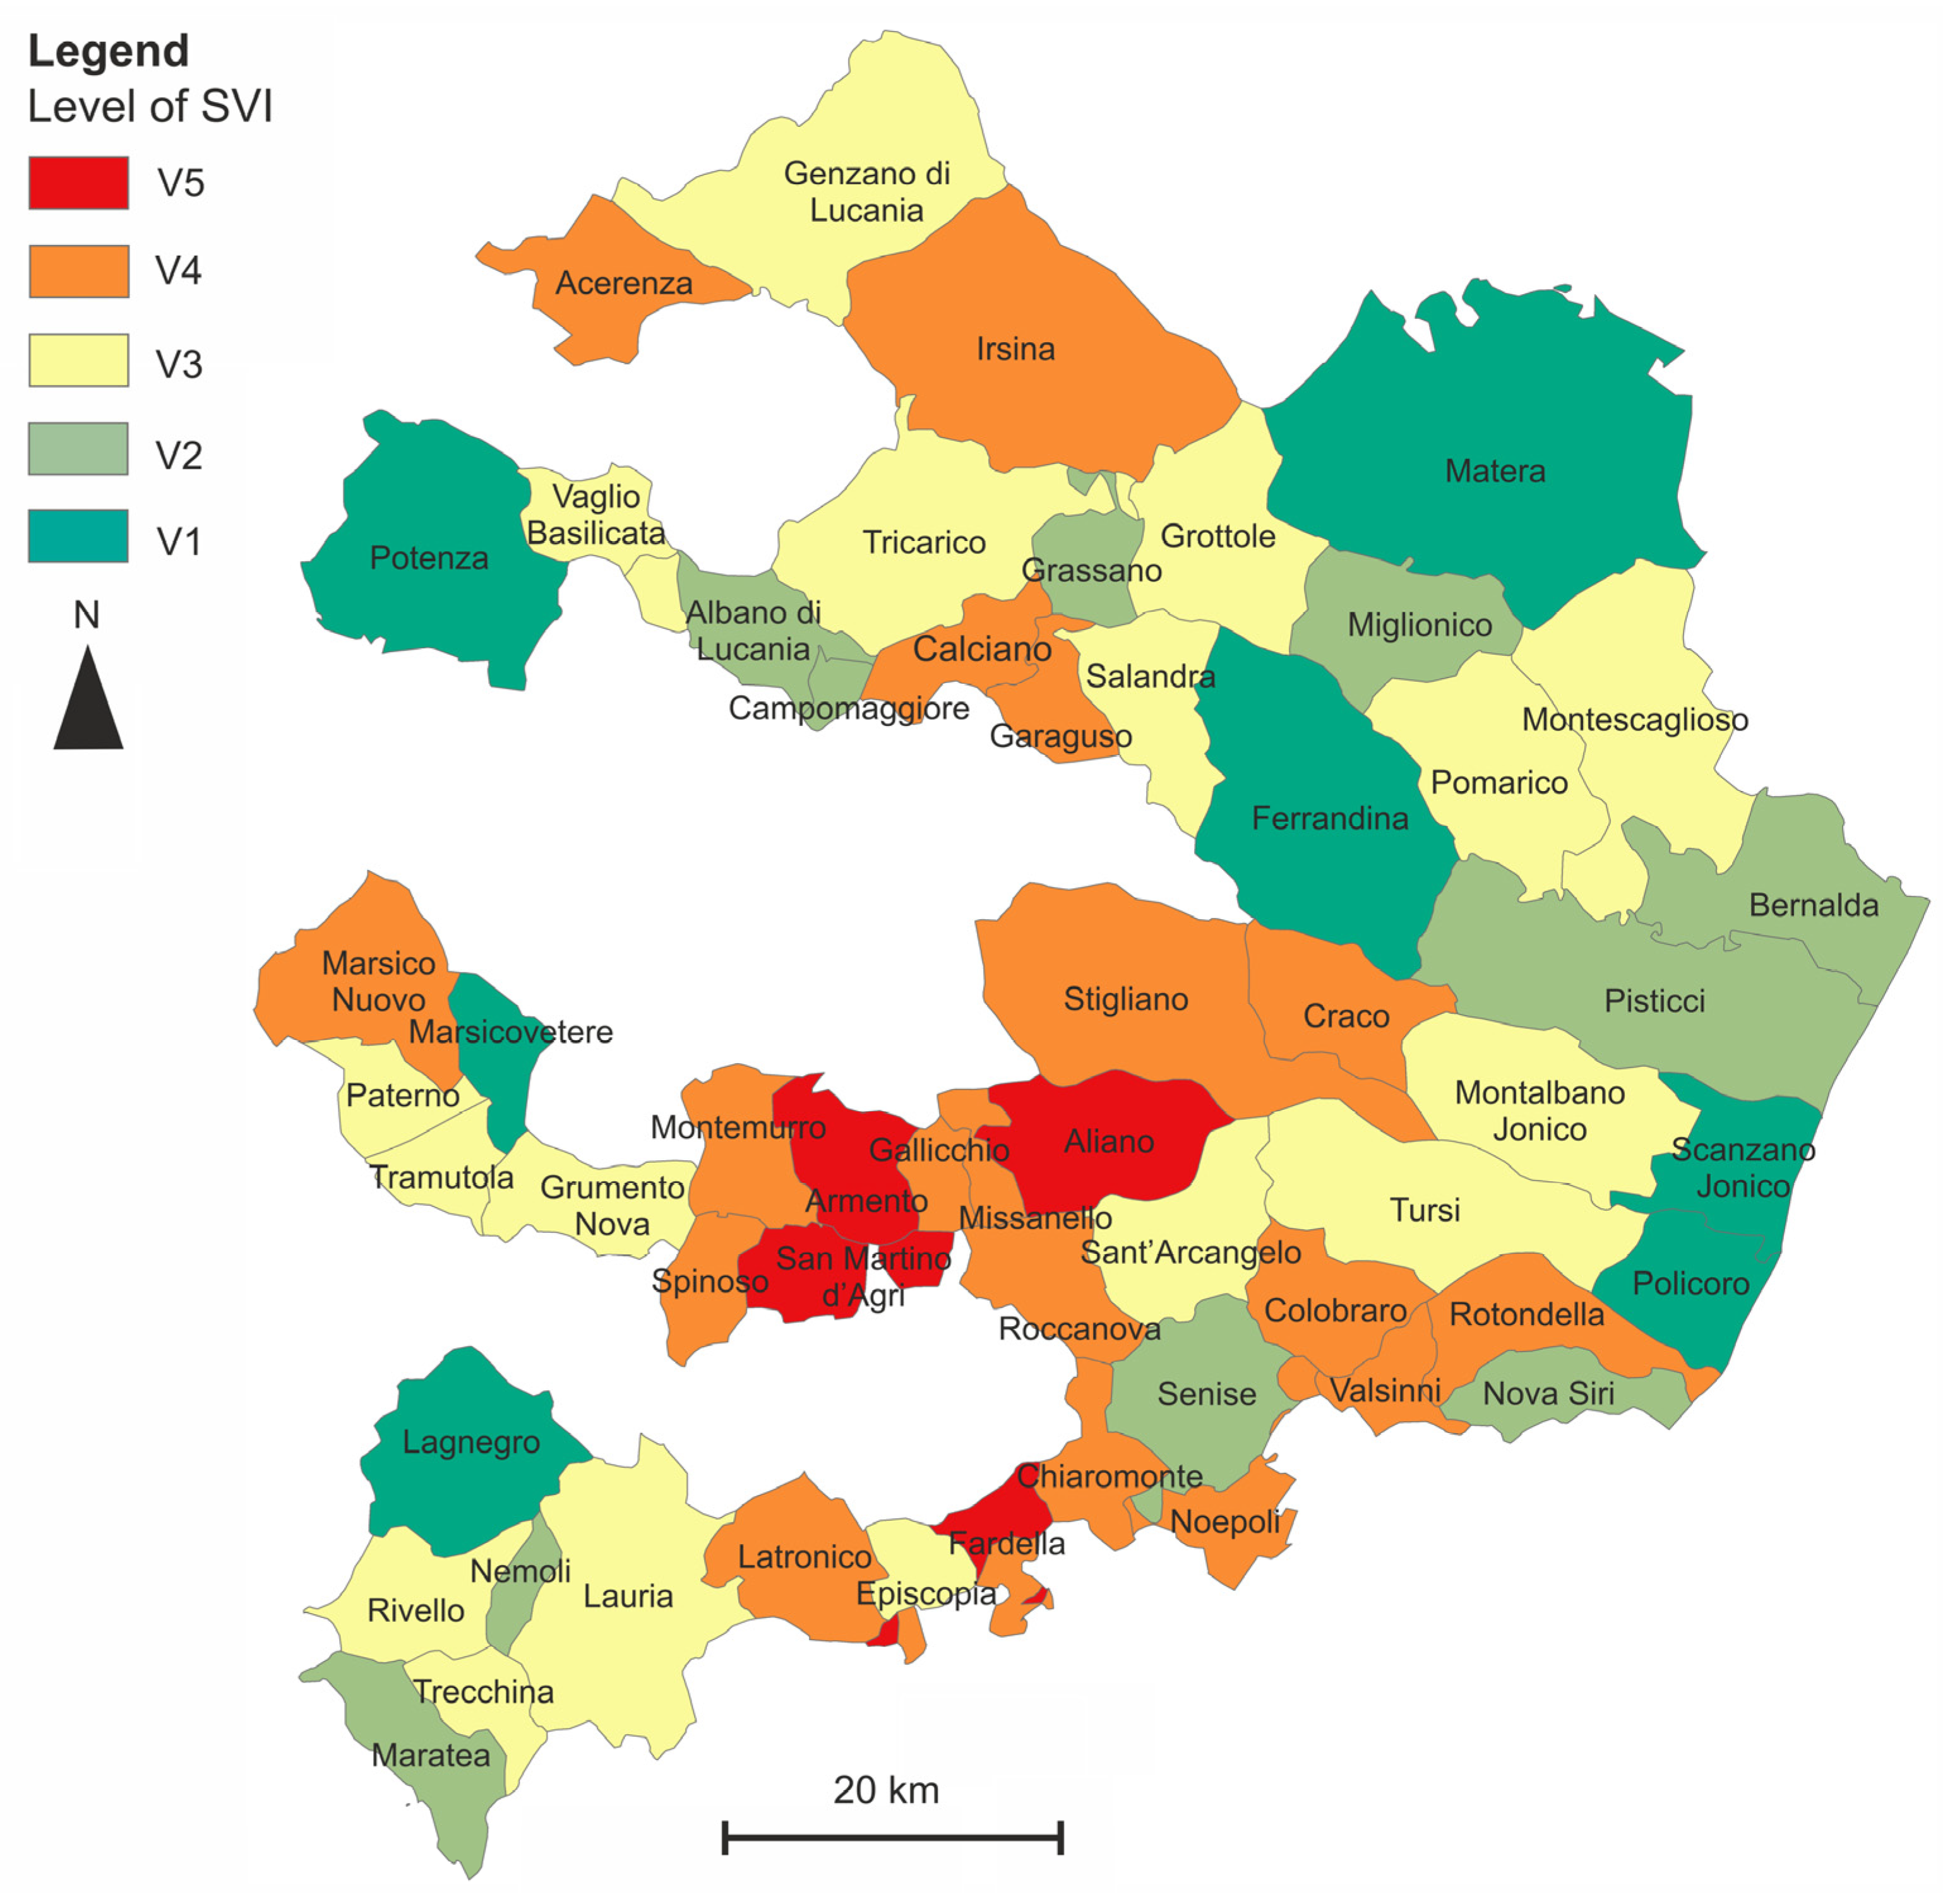
The main factors identified through the application of the FA were combined by the application of Equation (1) so as to obtain a “synthetic” score, and for each municipality, the SVI score was evaluated (cf. Section 3.5). In Figure 7, the spatial distribution of the SVI classified in different levels is provided. As is shown in the map, 24 municipalities fall in the highest level of social vulnerability (V4 and V5). For instance, Craco is one of the most emblematic examples of the high value of social vulnerability, as the city has been subjected to various landslides and flood events leading to total depopulation.
Seven municipalities fall in very low social vulnerability classes such as Matera and Potenza, whereas the Metaponto Valley is characterized by a medium and a low level of social vulnerability.
The final results of this research are shown in Figure 8. This map represents the combination of flood hazard and social vulnerability and it is segmented into five classes (from very low = class 1 to very high = class 5).
This outcome represents a preparatory evaluation in the flood risk analysis, in which the physical dimension of the flood probability and the social vulnerability is considered. In particular, the map highlights that 25 municipalities are characterized by high values of both flood probability and social vulnerability (ranging between classes 4 and 5), especially Bernalda, Rotondella, Nova Siri, Valsinni, Colobraro, Irsina, Calciano, Aliano, Missanello, Roccanova, San Martino d’Agri, Fardella, and Chiaromonte. Therefore, a total of 107,587 people can have difficulties coping with flood events.
5. Discussion and Conclusions
The present research analyzes the flood hazard and the socio-economic patterns of the Basilicata Region (southern Italy). The main goal is to integrate two of the main components influencing flood risk by constructing a Social Vulnerability Index (SVI) and relating it with flood hazard in order to provide an outline of the most vulnerable social groups that need special attention in flood management and risk reduction strategies.
The result of the study highlights the importance of the integration between Social and Earth Sciences in the context of risk management and disaster reduction. Risk management is more efficient if, instead of working from single disciplines and separate perspectives, multidisciplinary approaches are adopted to enrich the co-production of knowledge and co-management of disaster risk [96]. This represents a paradigm shift in research practice, requiring mutual learning, collaboration, and exchange within academia [97]. Understanding behaviour and citizens’ behavioural response to flood occurrence is equally as important as improving hazard assessment [98].
Although vulnerability is a controversial concept and can be defined in different ways, the outcomes related to this research underline the need to improve methods in constructing an overall vulnerability index and to link it with physical aspects [99]. The final outcomes of this research are presented in the form of maps, showing the combination between physical hazard (expressed in terms of probability of occurrence) and social vulnerability. From the overlay of the available informative layers, it emerges that 13 municipalities fall in a very high class of both flood hazard and social vulnerability.
As regards the social vulnerability investigation, it is significant to emphasize that although the flood hazard evaluation highlights only six municipalities with the highest flooding probability, the factor analysis was carried out for all municipalities within the study area. This was done starting from the assumption that if a community is located in a low-hazard zone but is characterized by a high social vulnerability feature, it could encounter difficulties in dealing with flood events due to its socio-economic conditions.
Concerning the main factors influencing the social vulnerability in the investigated area, the results related to the first factor (age) represent the demographic phenomenon occurring in Basilicata Region where young people leave small towns such as Aliano, Calciano, and Roccanova without services to move towards more developed cities such as Matera and Potenza (Figure 6b-AGE). The latter are the main developed socio-economic centers of the Basilicata Region where the lowest values of the social vulnerability index are registered. On the contrary, the second factor is represented by women correlated with the single parent variable which is more concentrated in the main cities (Figure 6b-GENDER). The third significant factor (ethnicity with a correlation between foreign residents and the unemployed index) explains how migrants from poor countries can face difficulties in job searching due to poor language knowledge or social exclusion.
Given this evidence, limitations and recommendations need to be considered in order to improve the method of constructing the overall index and to analyze flood hazard impacts.
Not all the municipal area under study is highly populated or occupied by buildings. The inhabited centers are often located on high reliefs not suffering major damage during flood events; therefore, studies at a more local scale in specific places at a high level of hazard could increase the precision of our SVI classification. In this study, the results indicate the Ionian coastal zone as the most prone to flood risk. Therefore, studies at a smaller scale (census block) should be useful in localities where high values of flood hazard and social vulnerability are registered [100,101] in order to provide a set of information suitable to support the sustainable management of the territory and to enable local authorities, administrative planners, and civil protection actors to locate the most vulnerable social groups that need special attention in flood management and risk reduction strategies. However, local vulnerability information at the district level is often unavailable. National statistical institutes focus more on environmental or socio-economic patterns at the national or sub-national level, also excluding data related to disaster risk, much more commonly provided by global offices such as EM-DAT (Emergency Events Database), SFM (Sendai Framework Monitor), the World Bank, and the INFORM Natural Hazard Risk Index.
The usefulness for this work of national open-access data is noteworthy. The use and development of data that can be accessed, shared, and re-used for any purpose without restriction, called Open Data (OD) [102], is essential in various domains: education, health, security, transportation systems, climate, and Earth Observation. They are considered “an essential resource for economic growth, job creation, and societal progress” (https://digital-strategy.ec.europa.eu/en/policies/strategy-data, accessed on 15 December 2022).
Moreover, due to the distribution of the most vulnerable communities along the Ionian coastal sector, research development could be carried out by applying a multi-risk analysis procedure and taking into account also the hazard distribution of other marine- and climate-related processes (i.e., coastal retreat, coastal flooding, and coastal inundation) and their combination [103,104,105,106,107,108]. In fact, interest in the multi-risk assessment increased in the last decades at the international level [109,110] especially for the analysis of coastal areas, which are potentially exposed to different processes, such as storms, coastal erosion, saltwater intrusion, and sea level rise [9,17,111,112,113,114].
Other possible improvements to the present research could be the inclusion of additional flood characteristics, such as water depth and flood velocity, as underlined also in the Directive 2007/60/EC, among needed elements to define floods scenarios with low, medium, or high probability, functional to define Flood Hazard Maps [77]. Moreover, the implementation of water depth and flood velocity allows the definition of tailored flood-depth damage curves and, as a consequence, leads to an increase in information regarding the vulnerability of different building categories [115,116].
In conclusion, this study could be considered preparatory for further research that will be aimed at providing a more detailed assessment of the potential impacts of physical processes (fluvial flooding, coastal erosion, and coastal flooding) affecting the investigated municipalities and accounting for each aspect contributing to the increase in the hazard, exposure, and vulnerability level. The vulnerability analysis conducted in the present study could contribute to other projects to increase the level of awareness among people by helping academic researchers and governments to face and deal with flood events. Finally, it is worth noting that the investigated area is located in the Mediterranean basin, which is considered by the scientific community as a hot spot of climate change [117,118,119], and therefore, frequency and intensity of fluvial and marine floods are expected to increase, making people more exposed to risk. However, working on preparedness and mitigation and implementing community-based strategies that focus on a participatory approach could persuade people to increase awareness of the hazard context. In this way, community resilience can be increased by preparing society to better deal with future natural events.
Author Contributions
Conceptualization, I.L. and D.C.; investigation, I.L. and R.C.; data curation, I.L., A.R. and R.C.; writing—original draft preparation, I.L. and R.C.; writing—review and editing, A.R., P.D. and D.C.; supervision, P.D. and D.C. All authors have read and agreed to the published version of the manuscript.
Funding
The study has been funded by RPASinAir—Integrazione dei Sistemi Aeromobili a Pilotaggio Remoto nello spazio aereo non segregato per servizi”, PON ricerca e innovazione 2014-2020.
Data Availability Statement
Data are available from the authors upon request.
Acknowledgments
This research has been carried out in the framework of the APRIAMOCI Project (Analisi e Percezione del Rischio Ambientale con MOdelli di Calcolo Integrati) funded by the University of Bari Aldo Moro under the Horizon Europe Seeds program and within the RETURN Extended Partnership and received funding from the European Union Next-GenerationEU (National Recovery and Resilience Plan–NRRP, Mission 4, Component 2, Investment 1.3–D.D. 1243 2/8/2022, PE0000005). The authors are thankful to the reviewers for their suggestions that allowed to significantly improve the quality of the paper.
Conflicts of Interest
The authors declare no conflict of interest. The funders had no role in the design of the study; in the collection, analyses, or interpretation of data; in the writing of the manuscript; or in the decision to publish the results.
References
- Goldsmith, M.; Williams, J.; Payan, J.L.; Stocker, H. Flood Hazard of Dunedin’s Urban Streams. Review of Dunedin City District Plan: Natural Hazards; Otago Regional Council: Dunedin, New Zealand, 2014; ISBN 978-0-478-37680-7. [Google Scholar]
- Rhoads, B. The Dynamics of Floodplains. In River Dynamics: Geomorphology to Support Management; Cambridge University Press: Cambridge, UK, 2020; pp. 319–342. [Google Scholar] [CrossRef]
- Merz, B.; Blöschl, G.; Vorogushyn, S.; Dottori, F.; Aerts, J.C.J.H.; Bates, P.; Bertola, M.; Kemter, M.; Kreibich, H.; Lall, U.; et al. Causes, impacts and patterns of disastrous river floods. Nat. Rev. Earth Environ. 2021, 2, 592–609. [Google Scholar] [CrossRef]
- Chan, N.W. Impacts of Disasters and Disasters Risk Management in Malaysia: The Case of Floods. In Economic and Welfare Impacts of Disasters in East Asia and Policy Responses; Sawada, Y., Oum, S., Eds.; ERIA Research Project Report 2011-8; ERIA: Jakarta, Indonesia, 2012; pp. 503–551. [Google Scholar]
- WHO (World Health Organization). Flooding: Managing Health Risks in the WHO European Region; WHO Regional Office for Europe UN City: Copenhagen, Denmark, 2017; ISBN 9789289052795. [Google Scholar]
- Farsangi, E.N. Natural Hazards—Impacts, Adjustments and Resilience; IntechOpen: London, UK, 2021. [Google Scholar] [CrossRef]
- Refice, A.; Capolongo, D.; Chini, M.; D’Addabbo, A. Improving flood detection and monitoring through remote sensing. Water 2022, 14, 364. [Google Scholar] [CrossRef]
- CRED (Center for Research on the Epidemiology of Disasters) Crunch. Natural Hazards & Disasters. In An Overview of the First Half of 2022; Issue no. 68; Institute of Health & Society (IRSS), UCLouvain: Brussels, Belgium, 2022. [Google Scholar]
- IPCC (Intergovernmental Panel on Climate Change). Climate Change 2022: Impacts, Adaptation and Vulnerability. Contribution of Working Group II to the Sixth Assessment Report of the Intergovernmental Panel on Climate Change; Pörtner, H.-O., Roberts, D.C., Tignor, M., Poloczanska, K.E.S., Mintenbeck, A., Alegría, M., Craig, S., Langsdorf, S., Löschke, V., Möller, A., et al., Eds.; Cambridge University Press: Cambridge, UK; New York, NY, USA, 2022; p. 3056. [Google Scholar] [CrossRef]
- Stefanidis, S.; Alexandridis, V.; Theodoridou, T. Flood Exposure of Residential Areas and Infrastructure in Greece. Hydrology 2022, 9, 145. [Google Scholar] [CrossRef]
- Koks, E.E.; van Ginkel, M.J.E.; Lemnitzer, A. Brief communication: Critical infrastructure impacts of the 2021 mid-July western European flood event. Nat. Hazards Earth Syst. Sci. 2022, 22, 3831–3838. [Google Scholar] [CrossRef]
- ISPRA. Landslides and Floods in Italy: Hazard and Risk Indicators, 2021 ed.; ISPRA: Rome, Italy, 2021; ISBN 978-88-448-1085-6. [Google Scholar]
- Di Baldassarre, G.; Viglione, A.; Carr, G.; Kuil, L.; Yan, K.; Brandimarte, L.; Blöschl, G. Debates—Perspectives on socio-hydrology: Capturing feedbacks between physical and social processes. Water Resour. Res. 2015, 51, 4770–4781. [Google Scholar] [CrossRef]
- Merz, B.; Aerts, J.; Arnbjerg-Nielsen, K.; Baldi, M.; Becker, A.; Bichet, A.; Blöschl, G.; Bouwer, L.M.; Brauer, A.; Cioffi, F.; et al. Floods and climate: Emerging perspectives for flood risk assessment and management. Nat. Hazards Earth Syst. Sci 2014, 14, 1921–1942. [Google Scholar] [CrossRef] [Green Version]
- Directive 2007/60/EC of the European Parliament and of the Council of 23 October 2007 on the Assessment and Management of Flood Risks (Text with EEA relevance) OJ L 288, 06/11/2007, 27–3. Available online: https://eur-lex.europa.eu/eli/dir/2007/60/oj (accessed on 17 February 2023).
- UNDRR (United Nations for Disaster Risk Reduction). Global Assessment Report on Disaster Risk Reduction 2015: Making Development Sustainable: The Future of Disaster Risk Management; United Nations Office for Disaster Risk Reduction: Geneva, Switzerland, 2015. [Google Scholar]
- IPCC. Climate Change 2014: Mitigation of Climate Change. Contribution of Working Group III to the Fifth Assessment Report of the Intergovernmental Panel on Climate Change; Edenhofer, O.R., Pichs-Madruga, Y., Sokona, E., Farahani, S., Kadner, K., Seyboth, A., Adler, I., Baum, S., Brunner, P., Eickemeier, B., et al., Eds.; Cambridge Cambridge University Press: Cambridge, UK; New York, NY, USA, 2014. [Google Scholar]
- Clark, G.; Moser, S.; Ratick, S.; Dow, K.; Meyer, W.; Emani, S.; Jin, W.; Kasperson, J.; Kasperson, R.; Schwarz, H.E. Assessing the vulnerability of coastal communities to extreme storms: The case of Revere, MA, USA. Mitig. Adapt. Strateg. Glob. Chang. 1998, 3, 59–82. [Google Scholar] [CrossRef]
- UNDRR. Hazard Definition & Classification Review; United Nations Office for Disaster Risk Reduction: Geneva, Switzerland, 2020. [Google Scholar]
- UNISDR (United Nations International Strategy for Disaster Reduction). Living with Risk: A Global Review of Disaster Reduction Initiatives; United Nations International Strategy for Disaster Reduction: Geneva, Switzerland, 2004. [Google Scholar]
- UNISDR. Terminology on Disaster Risk Reduction; United Nations International Strategy for Disaster Reduction: Geneva, Switzerland, 2009. [Google Scholar]
- Liverman, D.M. Vulnerability to Global Environmental Change. In Understanding Global Environmental Change: The Contributions of Risk Analysis and Management; Kasperson, R.E., Dow, K., Golding, D., Kasperson, J.X., Eds.; Clark University: Worcester, MA, USA, 1990; pp. 27–44. [Google Scholar]
- Maskrey, A. Vulnerability Accumulation in Peripheral Regions in Latin America: The Challenge for Disaster Prevention and Management. In Natural Disasters: Protecting Vulnerable Communities; Merriman, P.A., Browitt, C.W., Eds.; IDNDR: London, UK, 1993; pp. 461–472. [Google Scholar]
- Cannon, T. Vulnerability Analysis and the Explanation of ‘Natural’ Disasters. In Disasters, Development and Environment; Varley, A., Ed.; John Wiley and Sons: Chichester, UK, 1994; pp. 13–29. [Google Scholar]
- Cannon, T. Vulnerability Analysis, Livelihoods and Disasters. In Risk 21: Coping with Risks Due to Natural Hazards in the 21st Century; Ammann, W.J., Dannenmann, S., Vulliet, L., Eds.; Taylor and Francis Group: London, UK, 2006; pp. 41–49. [Google Scholar]
- Blaikie, P.; Cannon, T.; Davis, I.; Wisner, B. Vulnerabilidad, el Entorno Social de los Desastres; La RED-ITDG: Bogota, Colombia, 1996. [Google Scholar]
- Weichselgartner, J. Disaster mitigation: The concept of vulnerability revisited. Disaster Prev. Manag. 2001, 10, 85–94. [Google Scholar] [CrossRef]
- Bogardi, J.; Birkmann, J. Vulnerability Assessment: The First Step towards Sustainable Risk Reduction. In Disasters and Society—From Hazard Assessment to Risk Reduction; Malzahn, D., Plapp, T., Eds.; Logos Verlag: Berlin, Germany, 2004; pp. 75–82. [Google Scholar]
- Birkmann, J. Indicators and Criteria for Measuring Vulnerability: Theoretical Bases and Requirements. In Measuring Vulnerability to Natural Hazards: Towards Disaster Resilient Societies; Birkmann, J., Ed.; United Nations University Press: Tokyo, Japan; New York, NY, USA, 2006; pp. 55–77. [Google Scholar]
- Janssen, M.A.; Schoon, M.L.; Ke, W.; Börner, K. Scholarly networks on resilience, vulnerability and adaptation within the human dimensions of global environmental change. Glob. Environ. Chang. 2006, 16, 240–252. [Google Scholar] [CrossRef] [Green Version]
- Thywissen, K. Core Terminology of Disaster Risk Reduction: A comparative Glossary. In Measuring Vulnerability to Natural Hazards; Birkmann, J., Ed.; UNU Press: Tokyo, Japan, 2006; pp. 448–496. [Google Scholar]
- Burton, C.; Rufat, S.; Tate, S. Social Vulnerability: Conceptual Foundations and Geospatial Modeling. In Vulnerability and Resilience to Natural Hazards; Fuchs, S., Thaler, T., Eds.; Cambridge University Press: Cambridge, UK, 2018; pp. 53–81. [Google Scholar]
- Bohle, H.G.; Downing, T.E.; Watts, M.J. Climate change and social vulnerability. Toward a sociology and geography of food insecurity. Glob. Environ. Chang. 1994, 4, 37–48. [Google Scholar] [CrossRef]
- Turner, B.L.I.; Kasperson, R.E.; Matson, P.; McCarthy, J.J.; Corell, R.W.C.; Christensen, L.; Eckley, N.; Kasperson, J.X.; Luers, A.; Martello, M.L.; et al. Framework for Vulnerability Analysis in Sustainability Science. Proc. Natl. Acad. Sci. USA 2003, 100, 8074–8079. [Google Scholar] [CrossRef] [PubMed] [Green Version]
- Alexander, D. Principles of Emergency Planning and Management; Terra Publishing: Guildford, UK, 2002. [Google Scholar]
- Adger, W.N. Vulnerability. Glob. Environ. Change 2006, 16, 268–281. [Google Scholar] [CrossRef]
- Mileti, D. Disasters by Design: A Reassessment of Natural Hazards in the United States; Joseph Henry Press: Washington, DC, USA, 1999. [Google Scholar]
- Wisner, B.; Blaikie, P.; Cannon, T.; Davis, I. At Risk: Natural Hazards, People’s Vulnerability and Disasters; Routledge: New York, NY, USA, 2004. [Google Scholar]
- Kates, R.W. Natural Hazard in Human Ecological Perspective: Hypotheses and Models. Econ. Geogr. 1971, 47, 438–451. [Google Scholar] [CrossRef] [Green Version]
- Cutter, S.L. Vulnerability to environmental hazard. Prog. Hum. Geogr. 1996, 20, 529–539. [Google Scholar] [CrossRef]
- Cutter, S.; Boruff, B.; Shirley, W. Social vulnerability to environmental hazards. Soc. Sci. Q. 2003, 84, 242–261. [Google Scholar] [CrossRef]
- Sapir, D.G. Natural and man-made disasters: The vulnerability of women-headed households and children without families. World Health Stat. Q. 1993, 4, 227–233. [Google Scholar]
- Morduch, J. Poverty and Vulnerability. Am. Econ. Rev. 1994, 84, 221–225. [Google Scholar]
- NRC (National Research Council). The Impacts of Natural Disasters: A Framework for Loss Estimation; Committee on Assessing the Costs of Natural Disasters, National Research Council, National Academy Press: Washington, DC, USA, 1999; p. 80. [Google Scholar]
- Fang, Z. A Function-Oriented Methodology of Flood Vulnerability Assessment. Master’s Thesis, Water Resources Management, Civil Engineering, Delft University of Technology, Delft, The Netherlands, 2009. [Google Scholar]
- Long, A. Poverty is the new prostitution: Race, poverty, and public housing in post-Katrina New Orleans. J. Am. Hist. 2007, 94, 795–803. [Google Scholar] [CrossRef]
- Oxfam America. Exposed: Social Vulnerability and Climate Change in the US Southeast; Oxfam America: Boston, MA, USA, 2009. [Google Scholar]
- Tate, E. Uncertainty analysis for a social vulnerability index. Ann. Assoc. Am. Geogr. 2013, 103, 526–543. [Google Scholar] [CrossRef]
- Müller, A.; Reiter, J.; Weiland, U. Assessment of urban vulnerability towards floods using an indicator-based approach—A case study for Santiago de Chile. Nat. Hazards Earth Syst. Sci. 2011, 11, 2107–2123. [Google Scholar] [CrossRef] [Green Version]
- Frigerio, I.; Ventura, S.; Strigaro, D.; Mattavelli, M.; De Amicis, M.; Mugnano, S.; Boffi, M. A GIS-based approach to identify the spatial variability of social vulnerability to seismic hazard in Italy. Appl. Geogr. 2016, 74, 12–22. [Google Scholar] [CrossRef]
- Frigerio, I.; De Amicis, M. Mapping social vulnerability to natural hazards in Italy: A suitable tool for risk management strategies. Environ. Sci. Policy 2016, 63, 187–196. [Google Scholar] [CrossRef]
- Birkmann, J. Measuring Vulnerability to Natural Hazard: Towards Disaster Resilient Societies; United Nations University Press: Tokyo, Japan; New York, NY, USA; Paris, France, 2014. [Google Scholar]
- Cutter, S.; Finch, C. Temporal and spatial changes in social vulnerability to natural hazards. Proc. Natl. Acad. Sci. USA 2008, 105, 2301–2306. [Google Scholar] [CrossRef] [PubMed] [Green Version]
- Wu, S.Y.; Yarnal, B.; Fisher, A. Vulnerability of coastal communities to sealevel rise: A case study of Cape May county New Jersey, USA. Clim. Res. 2002, 22, 255–270. [Google Scholar] [CrossRef] [Green Version]
- Chakraborty, J.; Tobin, G.A.; Montz, B.E. Population evacuation: Assessing spatial variability in geophysical risk and social vulnerability to natural hazards. Nat. Hazard. Rev. 2005, 6, 23–33. [Google Scholar] [CrossRef]
- Dwyer, A.; Zoppou, C.; Nielsen, O.; Day, S.; Roberts, S. Quantifying Social Vulnerability: A Methodology for Identifying Those at Risk to Natural Hazards; Geoscience Australia Record: Canberra, Australia, 2004. [Google Scholar]
- Tapsell, S.M.; Penning-Rowsell, E.C.; Tunstall, S.M.; Wilson, T.L. Vulnerability to flooding: Health and social dimensions. Phil. Trans. R. Soc. A 2002, 360, 1511–1525. [Google Scholar] [CrossRef]
- Kuhlicke, C.; Scolobig, A.; Tapsell, S.M.; Steinführer, A.; De Marchi, B. Contextualizing social vulnerability: Findings from case studies across Europe. Nat. Hazards 2011, 58, 789–810. [Google Scholar] [CrossRef]
- Cardona, O.D. Indicators of Disaster Risk and Risk Management: Program for Latin America and the Caribbean: Summary Report; Inter-American Development Bank: Washington, DC, USA, 2005. [Google Scholar]
- Weichselgartner, J. About the Capacity to be Wounded: The Need to Link Disaster Mitigation and Sustainable Development. In Extreme Naturereignisse—Folgen, Vorsorge, Werkzeuge; DKKV: Bonn, Germany, 2002; pp. 150–158. [Google Scholar]
- Felsenstein, D.; Lichter, M. Social and economic vulnerability of coastal communities to sea-level rise and extreme flooding. Nat. Hazards 2014, 71, 463–491. [Google Scholar] [CrossRef]
- Fekete, A. Validation of a social vulnerability index in context to river floods in Germany. Nat. Hazards Earth Syst. Sci. 2009, 9, 393–403. [Google Scholar] [CrossRef] [Green Version]
- Siagian, T.H.; Purhadi, P.; Suhartono, S.; Ritonga, H. Social vulnerability to natural hazards in Indonesia: Driving factors and policy implications. Nat. Hazards 2014, 70, 1603–1617. [Google Scholar] [CrossRef]
- Frigerio, I.; Carnelli, F.; Cabinio, M.; De Amicis, M. Spatiotemporal Pattern of Social Vulnerability in Italy. Int. J. Disaster Risk Sci. 2018, 9, 249–262. [Google Scholar] [CrossRef] [Green Version]
- Amadio, M.; Mysiak, J.; Marzi, S. Mapping Socioeconomic Exposure for Flood Risk Assessment in Italy. Risk Anal. 2019, 39, 829–845. [Google Scholar] [CrossRef]
- Roder, G.; Sofia, G.; Wu, Z.; Tarolli, P. Assessment of Social Vulnerability to Floods in the Floodplain of Northern Italy. Weather. Clim. Soc. 2017, 9, 717–737. [Google Scholar] [CrossRef]
- Bonati, S. Contested flood risk reduction: An analysis of environmental and social claims in the city of Genoa. Int. J. Disaster Risk Reduct. 2022, 67, 102637. [Google Scholar] [CrossRef]
- Fina, S.; Heider, B.; Prota, F. Unequal Italy. Regional Socio-Economic Disparities in Italy. 2021. Available online: https://feps-europe.eu/wp-content/uploads/2021/07/Unequal-Italy-Regional-socio-economic-disparities-in-Italy.pdf (accessed on 17 February 2023).
- Tate, E. Social vulnerability indices: A comparative assessment using uncertainty and sensitivity analysis. Nat. Hazards 2012, 63, 325–347. [Google Scholar] [CrossRef]
- Rufat, S.; Tate, E.; Burton, C.G.; Maroof, A.S. Social Vulnerability to Floods: Review of Case Studies and Implications for Measurement. Int. J. Disaster Risk Reduct. 2015, 14, 470–486. [Google Scholar] [CrossRef] [Green Version]
- Edwards, J.; Gustaffson, M.; Näslund-Landenmark, B. Handbook of Vulnerability Mapping; Swedish Rescue Services Agency Janet Edwards; EU and International Affairs Department: Vienna, Austria, 2007. [Google Scholar]
- Thieken, A.H.; Muller, M.; Kleist, L.; Seifert, I.; Borst, D.; Werner, U. Regionalisation of asset values for risk analyses. Nat. Hazards Earth Syst. Sci. 2006, 6, 167–178. [Google Scholar] [CrossRef]
- Schiattarella, M. Inquadramento Geografico e Geomorfologico. In Guide Geologiche Regionali, Basilicata; Tropeano, M., Sabato, L., Schiattarella, M., Eds.; Società Geologica Italiana: Roma, Italy, 2020. [Google Scholar]
- Lazzari, M.; Gioia, D.; Anzidei, B. Landslide inventory of the Basilicata region (Southern Italy). J. Maps 2018, 14, 348–356. [Google Scholar] [CrossRef] [Green Version]
- Dal Sasso, S.F.; Manfreda, S.; Capparelli, G.; Versace, P.; Samela, C.; Spilotro, G.; Fiorentino, M. Hydrological and Geological Hazards in Basilicata. L’Acqua 2017, 3. Available online: http://centrofunzionalebasilicata.it/it/pdf/2017_Dal_Sasso_et_al__L%27Acqua%20n.%203_bassa.pdf (accessed on 17 February 2023).
- Piccarreta, M.; Pasini, A.; Capolongo, D.; Lazzari, M. Changes in daily precipitation extremes in the Mediterranean from 1951 to 2010: The Basilicata region, southern Italy. Int. J. Climatol. 2013, 33, 3229–3248. [Google Scholar] [CrossRef]
- Vita, M.; Biscione, A.; Bruno, F.; Gerardi, M.; Lo Vecchio, G. Long term planning of flood risks and processes of urbanistic development: The case of the Basilicata region (southern Italy). Sustain. Dev. Plan. IV 2009, 2, 953. [Google Scholar] [CrossRef] [Green Version]
- Autorità di Bacino della Basilicata. Mappe della Pericolosità e Mappe del Rischio Idraulico: Relazione Maggio 2013. Available online: http://www.adb.basilicata.it/adb/Pstralcio/pianoacque/relazione_tecnica.pdf (accessed on 17 February 2023).
- Manfreda, S.; Samela, C. A digital elevation model based method for a rapid estimation of flood inundation depth. J. Flood Risk Manag. 2019, 12, e12541. [Google Scholar] [CrossRef] [Green Version]
- La Salandra, M.; Roseto, R.; Mele, D.; Dellino, P.; Capolongo, D. Probabilistic hydro-geomorphological hazard assessment based on UAV-derived high-resolution topographic data: The case of Basento river (Southern Italy). Sci. Total Environ. 2022, 842, 156736. [Google Scholar] [CrossRef] [PubMed]
- De Musso, M.; Capolongo, D.; Caldara, M.; Surian, N.; Pennetta, L. Channel changes and controlling factors over the past 150 years in the Basento River (Southern Italy). Water 2020, 12, 307. [Google Scholar] [CrossRef] [Green Version]
- Manfreda, S.; Sole, A.; De Costanzo, G. Le Precipitazioni Estreme in Basilicata; Universosud Società Cooperativa: Potenza, Italy, 2015. [Google Scholar]
- Rizzo, A.; Aucelli, P.; Gioia, D.; Di Leo, P.; Schiattarella, D. Coastal Erosion and Inundation Assessment along the Ionian Coast of Basilicata, Southern Italy. In Proceedings of the SGI, Naples, Italy, 7–9 September 2016. [Google Scholar]
- Bentivenga, M.; Giano, S.; Piccarreta, M. Recent Increase of Flood Frequency in the Ionian Belt of Basilicata Region, Southern Italy: Human or Climatic Changes. Water 2020, 12, 2062. [Google Scholar] [CrossRef]
- Rygel, L.; O’Sullivan, D.; Yarnal, B. A method for constructing a social vulnerability index: An application to hurricane storm surges in a developed country. Mitig. Adapt. Strateg. Glob. Change 2005, 11, 741–764. [Google Scholar] [CrossRef]
- Sharma, S. Applied Multivariate Techniques; John Wiley and Sons Inc.: New York, NY, USA, 1996; p. 512. [Google Scholar]
- Tabachnick, B.G.; Fidell, L.S. Using Multivariate Statistics, 5th ed.; Allyn and Bacon: New York, NY, USA, 2007. [Google Scholar]
- Morrow, B. Identifying and mapping community vulnerability. Disasters 1999, 23, 1–18. [Google Scholar] [CrossRef]
- Enarson, E. Gender and Natural Disasters. Focus Programme on Crisis Response and Reconstruction Working Paper 1. 2000, pp. 73p. Available online: http://natlex.ilo.ch/wcmsp5/groups/public/@ed_emp/@emp_ent/@ifp_crisis/documents/publication/wcms_116391.pdf (accessed on 17 February 2023).
- Bolin, R.; Stanford, L. Shelter, housing and recovery: A comparison of us disasters. Disasters 1991, 15, 24–34. [Google Scholar] [CrossRef]
- Bolin, R. Household and Community Recovery after Earthquakes; Institute of Behavioural Science, University of Colorado: Boulder, CO, USA, 1993. [Google Scholar]
- Pulido, L. Rethinking Environmental Racism: White Privilege and Urban Development in Southern California. Ann. Assoc. Am. Geogr. 2000, 90, 12–40. [Google Scholar] [CrossRef] [Green Version]
- Garbutt, K.; Ellul, C.; Fujiyama, T. Mapping Social Vulnerability to flood Hazard in Norfolk, England. Environ. Hazards 2015, 14, 156–186. [Google Scholar] [CrossRef]
- Fatemi, F.; Ardalan, A.; Aguirre, B.; Mansouri, N.; Mohammadfam, I. Social vulnerability indicators in disasters: Findings from a systematic review. Int. J. Disaster Risk Reduct. 2017, 22, 219–227. [Google Scholar] [CrossRef]
- Burton, C.G. Social vulnerability and hurricane impact modeling. Nat. Hazards 2010, 11, 58–68. [Google Scholar] [CrossRef]
- UNDRR. Global Assessment Report on Disaster Risk Reduction 2022. Our World at Risk: Transforming Governance for a Resilient Future; United Nations Office for Disaster Risk Reduction: Geneva, Switzerland, 2022. [Google Scholar]
- OECD (Organisation for Economic Co-operation and Development). Addressing Societal Challenges Using Transdisciplinary Research. In OECD Science, Technology and Industry Policy Papers; OECD Publishing: Paris, France, 2020; p. 88. [Google Scholar] [CrossRef]
- Priest, S. Why understanding behaviour matters for flood risk management? Flood Risk Manag. 2021, 14, 2724. [Google Scholar] [CrossRef]
- Rizzo, A.; Vandelli, V.; Buhagiar, G.; Micallef, A.S.; Soldati, M. Coastal vulnerability assessment along the north-eastern sector of Gozo Island (Malta, Mediterranean Sea). Water 2020, 12, 1405. [Google Scholar] [CrossRef]
- Tate, E.; Rahman, M.A.; Emrich, C.T.; Sampson, C.C. Flood exposure and social vulnerability in the United States. Nat. Hazards 2021, 106, 435–457. [Google Scholar] [CrossRef]
- Percival, S.; Teeuw, R. A methodology for urban micro-scale coastal flood vulnerability and risk assessment and mapping. Nat. Hazards 2019, 97, 355–377. [Google Scholar] [CrossRef] [Green Version]
- Murray-Rust, P. Open Data in Science. Nat. Preced. 2008. [Google Scholar] [CrossRef]
- Rangel-Buitrago, N.; Neal, W.J.; de Jonge, V.N. Risk assessment as tool for coastal erosion management. Ocean. Coast. Manag. 2020, 186, 105099. [Google Scholar] [CrossRef]
- Pollard, J.A.; Spencer, T.; Brooks, S.M. The interactive relationship between coastal erosion and flood risk. Prog. Phys. Geogr. Earth Environ. 2019, 43, 574–585. [Google Scholar] [CrossRef] [Green Version]
- Vandelli, V.; Sarkar, N.; Micallef, A.S.; Soldati, M.; Rizzo, A. Coastal inundation scenarios in the north-eastern sector of the Island of Gozo (Malta, Mediterranean Sea) as a response to sea level rise. J. Maps 2022, 1–10. [Google Scholar] [CrossRef]
- Scardino, G.; Anzidei, M.; Petio, P.; Serpelloni, E.; De Santis, V.; Rizzo, A.; Liso, S.I.; Zingaro, M.; Capolongo, D.; Vecchio, A.; et al. The Impact of Future Sea-Level Rise on Low-Lying Subsiding Coasts: A Case Study of Tavoliere Delle Puglie (Southern Italy). Remote Sens. 2022, 14, 4936. [Google Scholar] [CrossRef]
- Rizzo, A.; Vandelli, V.; Gauci, C.; Buhagiar, G.; Micallef, A.; Soldati, M. Potential Sea Level Rise Inundation in the Mediterranean: From Susceptibility Assessment to Risk Scenarios for Policy Action. Water 2022, 14, 416. [Google Scholar] [CrossRef]
- Aucelli, P.P.C.; Di Paola, G.; Rizzo, A.; Rosskopf, C.M. Present day and future scenarios of coastal erosion and flooding processes along the Italian Adriatic coast: The case of Molise region. Environ. Earth Sci. 2018, 77, 1–19. [Google Scholar] [CrossRef]
- Galina, V.; Torresan, S.; Critto, A.; Sperotto, A.; Glade, T.; Marcomini, A. A review of multi-risk methodologies for natural hazards: Consequences and challenges for a climate change impact assessment. J. Environ. Manag. 2016, 168, 123–132. [Google Scholar] [CrossRef] [PubMed]
- Galina, V.; Torresan, S.; Zabeo, A.; Critto, A.; Glade, T.; Marcomini, A. A Multi-Risk Methodology for the Assessment of Climate Change Impacts in Coastal Zones. Sustainability 2020, 12, 3697. [Google Scholar] [CrossRef]
- Nicholls, R.J.; Cazenave, A. Sea-level rise and its impact on coastal zones. Science 2010, 328, 1517–1520. [Google Scholar] [CrossRef]
- Utami, P. Measuring Social Vulnerability in Volcanic Hazards: The Case Study of Merapi Volcano, Indonesia, Earth Sciences. Master’s Thesis, University of Bristol, Bristol, UK, 2008. [Google Scholar]
- Torresan, S.; Critto, A.; Rizzi, J.; Marcomini, A. Assessment of coastal vulnerability to climate change hazards at the regional scale: The case study of the North Adriatic Sea. Nat. Hazards Earth Syst. Sci. 2012, 12, 2347–2368. [Google Scholar] [CrossRef]
- Armaroli, C.; Duo, E.; Viavattene, C. From Hazard to Consequences: Evaluation of Direct and Indirect Impacts of Flooding Along the Emilia-Romagna Coastline, Italy. Front. Earth Sci. 2019, 7, 203. [Google Scholar] [CrossRef] [Green Version]
- Huizinga, J.; De Moel, H.; Szewczyk, W. Global Flood Depth-Damage Functions: Methodology and the Database with Guidelines; EUR 28552 EN; Publications Office of the European Union: Luxembourg, Luxembourg, 2017; ISBN 978-92-79-67781-6. [Google Scholar] [CrossRef]
- Amadio, M.; Mysiak, J.; Carrera, L.; Koks, E. Improving flood damage assessment models in Italy. Nat. Hazards 2016, 82, 2075–2088. [Google Scholar] [CrossRef] [Green Version]
- Giorgi, F. Climate change hot-spots. Geophys. Res. Lett. 2006, 33, 8. [Google Scholar] [CrossRef]
- Cramer, W.; Guiot, J.; Marini, K. Climate and Environmental Change in the Mediterranean Basin–Current Situation and Risks for the Future; First Mediterranean Assessment Report; MedECC (Mediterranean Experts on Climate and Environmental Change), Union for the Mediterranean, Plan Bleu, UNEP/MAP: Marseille, France, 2020; ISBN 978-2-9577416-0-1. [Google Scholar]
- Sarkar, N.; Rizzo, A.; Vandelli, V.; Soldati, M. A Literature Review of Climate-Related Coastal Risks in the Mediterranean, a Climate Change Hotspot. Sustainability 2022, 14, 15994. [Google Scholar] [CrossRef]
Figure 1.
(a) Subdivision of Basilicata territory in the two provinces; (b) Geographical location of Basilicata Region within the Italian context.
Figure 1.
(a) Subdivision of Basilicata territory in the two provinces; (b) Geographical location of Basilicata Region within the Italian context.

Figure 2.
Methodological workflow followed to combine social vulnerability and flood hazard.

Figure 3.
(a) Map showing the main municipalities (yellow color) prone to flood hazard in Basilicata Region. The areal extension of each scenario is represented in the legend. HPH = High probability flood; MPH = Medium probability flood; LHP = Low probability flood. (b) Spot of Bernalda and Pisticci in HPH and (c) LPH scenarios; the red line represents the administrative boundary at the municipality level. (d) Spot of Matera in HPH and (e) LPH scenarios.

Figure 4.
Percentage of the municipal territory affected by floodable areas for LPH, MPH, and HPH.

Figure 5.
Classification of the municipalities based on the maximum percentage of municipal territory occupied by areas prone to be flooded in case of low hazard scenario (return period = 500 years).
Figure 5.
Classification of the municipalities based on the maximum percentage of municipal territory occupied by areas prone to be flooded in case of low hazard scenario (return period = 500 years).

Figure 6.
Outcomes of the factor analysis with varimax rotation. (a) Loadings and communalities showing the factor correlations (green color) and, on the bottom, the Scree Plot of the variables with their eigenvalues; Pop_Density = population density, Dep_Index= Dependency index; Low_Ed = low education; High_Ed = High Education, Single_Par = Single Parents, Empl_Index = Employment Index, Unemp_Index = Unemployment Index; 0 inc = 0 income; 0–10 = income between 0 and 10,000 euros; 10–15 inc = income between 10,000–15,000 euros. (b) Spatial distribution of the main social-economic factors representing the entire dataset.

Figure 7.
Spatial distribution of social vulnerability index across the study area. V1 = very low social vulnerability, V2 = low social vulnerability, V3 = medium social vulnerability, V4 = high social vulnerability, V5 = very high social vulnerability.
Figure 7.
Spatial distribution of social vulnerability index across the study area. V1 = very low social vulnerability, V2 = low social vulnerability, V3 = medium social vulnerability, V4 = high social vulnerability, V5 = very high social vulnerability.

Figure 8.
Final raster derived from the overlap between flood hazard and social vulnerability index. Class 1 = very low; class 2 = low; class 3 = medium; class 4 = high; class 5 = very high.
Figure 8.
Final raster derived from the overlap between flood hazard and social vulnerability index. Class 1 = very low; class 2 = low; class 3 = medium; class 4 = high; class 5 = very high.


Table 1.
Municipalities affected by flood hazard in Basilicata Region.
| Province | Municipality | Area (km2) | Number of Inhabitants |
|---|---|---|---|
| Aliano | 97.25 | 895 | |
| Bernalda | 124.02 | 11998 | |
| Calciano | 49.7 | 662 | |
| Colobraro | 65.54 | 1064 | |
| Craco | 76.41 | 639 | |
| Ferrandina | 216.93 | 8061 | |
| Garaguso | 38.32 | 987 | |
| Grassano | 41.05 | 4784 | |
| Grottole | 115.79 | 2059 | |
| Irsina | 261.87 | 4427 | |
| Matera | 389.17 | 59869 | |
| MATERA | Miglionico | 88.33 | 2356 |
| Montalbano Jonico | 133.88 | 6781 | |
| Montescaglioso | 174.42 | 9194 | |
| Nova Siri | 52.086 | 6691 | |
| Pisticci | 232.06 | 16832 | |
| Policoro | 67.03 | 17779 | |
| Pomarico | 127.77 | 3819 | |
| Rotondella | 76.17 | 2441 | |
| Salandra | 76.39 | 2558 | |
| Stigliano | 209.09 | 3680 | |
| Tricarico | 175.98 | 4835 | |
| Tursi | 158.62 | 4807 | |
| Valsinni | 32.1 | 1365 | |
| Scanzano Jonico | 71.84 | 7556 | |
| Acerenza | 77.68 | 2112 | |
| Albano di Lucania | 55.64 | 1358 | |
| Armento | 59.6 | 579 | |
| Campomaggiore | 12.5 | 732 | |
| Chiaromonte | 70.82 | 1743 | |
| Episcopia | 28.86 | 1273 | |
| Fardella | 28.36 | 573 | |
| Gallicchio | 23.83 | 811 | |
| Genzano di Lucania | 207.39 | 5262 | |
| Grumento Nova | 66.71 | 1559 | |
| Lagonegro | 112.2 | 5127 | |
| Latronico | 75.84 | 4104 | |
| Lauria | 175.64 | 11993 | |
| POTENZA | Maratea | 68.59 | 4767 |
| Marsico Nuovo | 99.77 | 3839 | |
| Marsicovetere | 38.34 | 5545 | |
| Missanello | 21.97 | 480 | |
| Montemurro | 56.63 | 1109 | |
| Noepoli | 45.77 | 767 | |
| Nemoli | 19.49 | 1402 | |
| San Martino d’Agri | 50.63 | 687 | |
| Sant’Arcangelo | 88.49 | 5996 | |
| Senise | 95.82 | 6586 | |
| Spinoso | 37.62 | 1347 | |
| Tramutola | 35.28 | 2925 | |
| Trecchina | 37.72 | 2149 | |
| Paterno | 40.37 | 3036 | |
| Vaglio Basilicata | 43.36 | 1871 | |
| Potenza | 174 | 64786 | |
| Rivello | 69.74 | 2537 | |
| Roccanova | 61.67 | 1311 |
Table 2.
Social vulnerability indicators with their proxy variables. The relative influence of each proxy variable on the social vulnerability is defined as (+) in the case of a positive correlation and as (−) in the case of no influence or negative influence.
Table 2.
Social vulnerability indicators with their proxy variables. The relative influence of each proxy variable on the social vulnerability is defined as (+) in the case of a positive correlation and as (−) in the case of no influence or negative influence.
| Indicator | Proxy Variable | Influence on Social Vulnerability |
|---|---|---|
| Age | Children with age < 14 years (%) | + |
| Elderly with age > 65 years (%) | + | |
| Population dependency ratio | + | |
| Ageing index | + | |
| Gender | Female residents (%) | + |
| Ethnicity | Foreign residents (%) | + |
| Lone parents | Single parents (%) | + |
| Education | High education rate | – |
| Low education rate | + | |
| Employment | Employment rate | – |
| Unemployment rate | + | |
| Population exposure | Population density | + |
| Low Income | Residents with 0 € per year (%) | + |
| Residents with 0–10,000 € per year (%) | + | |
| Residents with 10,000–15,000 € per year (%) | + |
Disclaimer/Publisher’s Note: The statements, opinions and data contained in all publications are solely those of the individual author(s) and contributor(s) and not of MDPI and/or the editor(s). MDPI and/or the editor(s) disclaim responsibility for any injury to people or property resulting from any ideas, methods, instructions or products referred to in the content. |
© 2023 by the authors. Licensee MDPI, Basel, Switzerland. This article is an open access article distributed under the terms and conditions of the Creative Commons Attribution (CC BY) license (https://creativecommons.org/licenses/by/4.0/).
Share and Cite
MDPI and ACS Style
Lapietra, I.; Rizzo, A.; Colacicco, R.; Dellino, P.; Capolongo, D. Evaluation of Social Vulnerability to Flood Hazard in Basilicata Region (Southern Italy). Water 2023, 15, 1175. https://doi.org/10.3390/w15061175
AMA Style
Lapietra I, Rizzo A, Colacicco R, Dellino P, Capolongo D. Evaluation of Social Vulnerability to Flood Hazard in Basilicata Region (Southern Italy). Water. 2023; 15(6):1175. https://doi.org/10.3390/w15061175
Chicago/Turabian StyleLapietra, Isabella, Angela Rizzo, Rosa Colacicco, Pierfrancesco Dellino, and Domenico Capolongo. 2023. "Evaluation of Social Vulnerability to Flood Hazard in Basilicata Region (Southern Italy)" Water 15, no. 6: 1175. https://doi.org/10.3390/w15061175
Note that from the first issue of 2016, this journal uses article numbers instead of page numbers. See further details here.