Article

Energy and Exergy Analysis of Solar Air Gap Membrane Distillation System for Seawater Desalination

1
Laboratory of Biomaterials and Transport Phenomena, University of Medea, Medea 26000, Algeria
2
Laboratoire de Génie des Procédés Chimiques, Department of Process Engineering, University of Ferhat Abbas, Setif 19000, Algeria
3
Univ Rennes, Ecole Nationale Supérieure de Chimie de Rennes, CNRS, ISCR—UMR6226, F-35000 Rennes, France
4
Laboratory of Management and Valorization of Natural Resources and Quality Assurance, SNVST Faculty, Bouira University, Bouira 10000, Algeria
5
Département de Génie des Procédés, Faculté de Technologie, Université de Bejaia, Bejaia 06000, Algeria
6
Research Unit on Analysis and Technological Development in Environment (URADTE CRAPC), BP 384, Bou-Ismail, Tipaza 42000, Algeria
7
School of Engineering, Merz Court, Newcastle University, Newcastle upon Tyne NE1 7RU, UK
8
College of Engineering, Imam Mohammad Ibn Saud Islamic University, IMSIU, Riyadh 11432, Saudi Arabia
*
Authors to whom correspondence should be addressed.
Water 2023, 15(6), 1201; https://doi.org/10.3390/w15061201
Submission received: 18 February 2023 / Revised: 10 March 2023 / Accepted: 16 March 2023 / Published: 20 March 2023
(This article belongs to the Special Issue Feature Papers of Water-Energy Nexus, Volume II)

Abstract

:
Air gap membrane distillation (AGMD) is a widely utilized technology for producing drinking water due to its low heat loss, high thermal efficiency, and compatibility with solar energy. The application of the first and second laws of thermodynamics in energy and exergy analyses provides a comprehensive evaluation of the efficiency of thermal processes. This study aims to examine numerically the energy and exergy performance indicators of a solar AGMD system used for seawater desalination. The simulation was carried out using MATLAB 9.7 software. The total thermal efficiency and overall efficiency of each element in the AGMD system were calculated for various solar field energy outputs, and moreover, a parametric study was conducted. The results indicate that the exergetic efficiency of the AGMD system components was the lowest in the solar field, with the concentrator having the lowest energy efficiency. Additionally, the thermal and exergetic efficiency of the entire solar AGMD system decreases along with the raise of ambient temperature. An additional investigation was conducted to better apprehend the sources of exergy destruction in the solar field. The obtained results from this study can be employed as a guide to reduce exergy destruction in the whole solar AGMD desalination system with recognition of the main sources of irreversibility.

1. Introduction

Exergy refers to the amount of energy that is available for use within a system from a thermodynamic perspective. It represents the useful and usable portion of energy. The exergy analysis takes into consideration the quality and quantity of the energy exchange processes with the environment. This analysis helps to uncover the underlying reasons for any energy system malfunctions. Energy analysis is based on the first law of thermodynamics and is only concerned with energy conversion. It does not show how and where irreversibility or losses occur in the system. Exergy analysis goes beyond this by pointing to the association of extreme irreversibility or destruction with processes and helps identify pathways to sustainability. Unlike energy, external energy is destroyed and can only be conserved when all processes that occur in the system and its surrounding environment are reversible. Therefore, exergy is a useful tool for determining the location, type, and true magnitude of energy loss, which manifests as waste energy destruction or emission [1,2,3].
The focus of exergy studies in solar desalination technologies using membrane distillation (MD) is to determine the exergy efficiencies of the key components, especially the membrane modules. There has been a lot of research done on the exergy analysis of membrane desalination processes. For example, Guillén-Burrieza et al. [4] conducted an experimental study on a solar AGMD desalination pilot system, where they found that at a feed temperature of 85 °C, the distillate product flow reached its maximum value of 7 L.h−1.m−2. Another study in Algeria by Moudjeber et al. [5] focused on AGMD for solar water desalination and found that the maximum exergy analysis value of 6% was obtained for the largest feed flow rate. Recent research by Sandid et al. has carried out a dynamic simulation study of the AGMD process [6]. In their work, they used a photovoltaic panel system and a flat plate collector; therefore, for the analysis and simulation of the AGMD process, TRNSYS 18.0 software was utilized. According to their findings, at a temperature of 85 °C, the flow of distilled water from the distillation membrane reaches 5 kg/h and remains stable throughout the year when powered solely by solar energy. Another related study shows that the energy efficiency of the AGMD unit is 68% while the collector efficiency is 74% [7].
In addition, coupling desalination technologies with renewable energy sources has the potential to provide sustainable fresh water for future demand. Currently, 131 desalination plants powered by renewable energy produce only 1% of the world’s desalinated water. In the field of renewable energy use, solar photovoltaic (PV) energy leads at43%, followed by solar energy at 27%, wind at 20% and hybrid at 10%. Therefore, the use of solar energy reduces emissions, with an expected amount of about 400 million tons of carbon equivalent annually by 2050 in the case of using traditional fossil fuel-powered desalination technologies, and reduces energy consumption, which exceeds 75.2 TWh/year, which is equivalent to about 0.4% of global electricity consumption [8].
In the field of AGMD, various studies, whether experimental or simulated, have also been conducted on solar seawater desalination by Vacuum Membrane Distillation (VMD) [9,10] or Direct Contact Membrane Distillation (DCMD) [11,12] and Sweeping Gas Membrane Distillation (SGMD) [13]. In light of the literature review, there are several studies conducted on energy and exergy analysis for different systems such as a multi-effect membrane distillation system [14], a type of solar thermal power plant known as the parabolic trough concentrating solar thermal power plant (PTCSTPP) [15], counter hollow fiber membrane-based humidifier [16], solar thermal hollow fiber vacuum membrane distillation system [17], novel hybrid solar heating, cooling and power generation system for remote areas [18], solar thermal collectors and processes [19], solar-driven power, desalination and cooling poly-generation system [3], and poly-generation systems for sustainable desalination [20]. Only a few researchers have examined the exergy analyses of processes that use membranes for desalination or water purification. Banat and Jwaied [21] performed an analysis of exergy destruction in both small and large solar-powered membrane distillation (MD) systems. According to their findings, the majority of exergy destruction occurred within the MD modules, accounting for 98.8% and 55.14% of the compact and large-scale systems, respectively. The exergy efficiency of a 24,000 m3/day DCMD desalination plant was also reported, with an efficiency of 28.3% when a heat recovery system was utilized and 25.6% when it was not [22]. In addition, they provided data on energy consumption for the same plant, which was measured to be 39.7 kWh.m−3 with heat recovery and 45 kWh.m−3 without, respectively.
Tian and Zhao [23] presented a review of a variety of solar collectors and thermal energy storage in solar thermal applications. Furthermore, a comparison of heliostat field collectors, parabolic dish collectors and parabolic trough collectives is also made. In light of the need for new methods that reduce the environmental burdens associated with traditional types of seawater desalination technologies, which must meet the growing demand for drinking water simultaneously [8], there is also an evolution in hybridization directions for desalination technologies such as MED-AD, MSF-MED and RO-MSF to improve process performance by overcoming the limitations of conventional methods but also to increase operational reliability and recovery [24,25,26,27,28].
Because of the high cost and the great importance, energy and exergy analysis of membrane desalination processes have been discussed in some studies. In the previously reported research works [29,30,31], the exergy and energy analysis of the integrated membrane desalination systems are explored, and it is found that such systems have the most favorable thermal performance, making them an attractive and promising option for the desalination processes. Meanwhile, Banat and Jwaied [21] mentioned that the external energy efficiency of the combined unit related to the external energy obtained from the solar collector is approximately 0.3–0.5%.
Wang et al. [32] also carried out a complete analysis of direct contact membrane distillation (DCMD) performance to estimate the mass flow and thermal efficiency. Al-Obaidani et al. [22] and Choi et al. [33] also presented studies dealing with exergy analysis of a Direct Contact Membrane Distillation (DCMD) process. Miladi et al. [34] conducted research into the exergy analysis of a VMD unit powered by solar energy, utilizing two models, and their findings provided important results about energy efficiency [35,36]. Elan et al. [37] presented another important study addressing energy-efficient conductive-gap membrane distillation. In a recent study, Woldemariam et al. examined the exergy analysis and destruction effectiveness of two different types of flat air-gap membrane distillation AGMD systems for a variety of feed and coolant temperatures [38]. Also, Signorato et al. [14] conducted a detailed thermodynamic analysis of the proposed distillation technology, utilizing second law analysis to gain a more comprehensive understanding. Their report provides a thorough exergy analysis, which provides valuable insights into the production of irreversibilities within each component of the system.
Table 1 summarizes the values of the exergy efficiencies obtained in the most common desalination technologies. To confirm the choice of AGMD, a comparison of desalinated water production costs is presented. The energy consumption and final water production cost of desalination systems depend on the nature of the processes, the type of energy used and their drinking water production capacity. The specific energy consumption by RO is between 2 and 3 kWh.m−3 [39], while that of MED varies from 5 to 10.33 kWh.m−3 and 14.56 kWh.m−3 for the MSF [40]. The energy consumption and water cost of DM systems vary respectively from 1 to 9000 kWh.m−3 and from 0.3 to 130 $/m3 depending on the configurations used [41]. Guillén-Burrieza et al. [42] carried out the technical and economic analysis of a 100 m3/day project for a desalination unit based on membrane distillation technology associated with a field of solar collectors. During their in-depth economic assessment, the cost of water was estimated at between 10.6 and 12 $.m−3.
The economic evaluation of membrane distillation configurations (AGMD, DCMD and VMD) powered by autonomous solar systems shows that AGMD is the most expensive [21]. Economic factors are, therefore, the main obstacles to the diffusion of solar energy for desalination processes. Solar-powered membrane distillation technology is still expensive compared to other desalination processes; the full cost of water is estimated between 15 and 18 $.m−3 for a large unit [47]. Despite this, solar-powered membrane distillation is an attractive and viable method for freshwater production in remote arid areas. It is essential for certain populations, particularly in isolated sites, to design new energy-saving systems for the production of drinking water.
Accurately assessing the performance of separation systems that employ solar energy and MD relies heavily on the evaluation of exergy. The major goal of this research is to undertake a thermodynamic analysis of a desalination system using solar energy and AGMD, with an emphasis on performance parameters. The solar AGMD desalination system was modeled using MATLAB 9.7 software, and a series of mathematical calculations were carried out based on previously described design parameters to assess the system's performance under varying operating conditions. The proposed system consists of an AGMD desalination unit and a solar thermal collector, and the analysis of the system is performed by examining variations in energy efficiency and exergy efficiency.

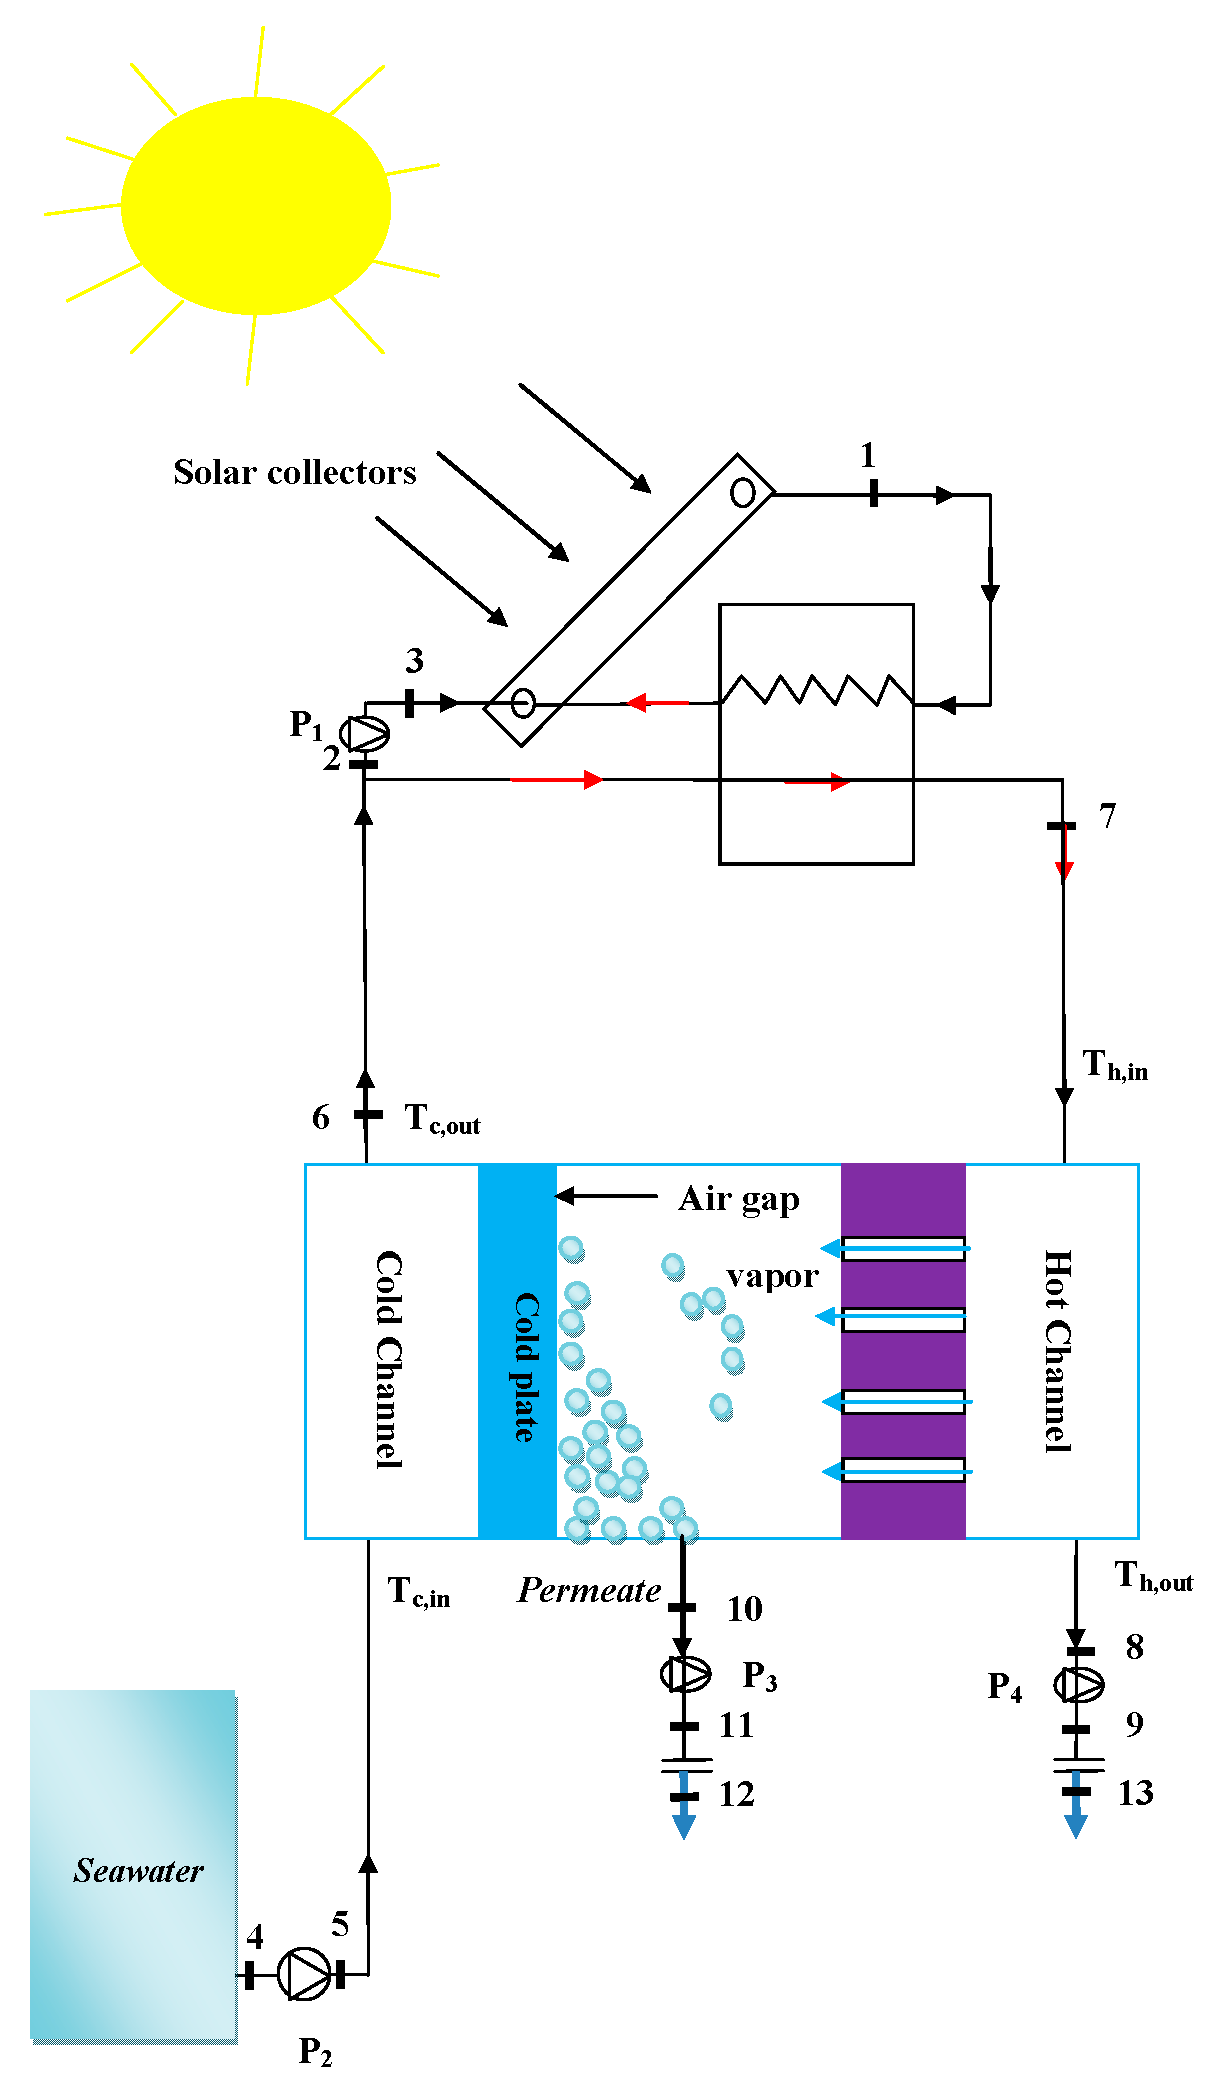
2. System Description

Figure 1 is a schematic diagram showing a process aimed at producing high-quality distilled water while conserving energy. The system is made upof a solar flat plate collector paired with an AGMD unit. The brine’s heat is recovered by preheating the feed solution, and the feed temperature is maintained by a pump that circulates the solution through the AGMD unit’s cold and hot channels.The combination of the flat plate collector provides the system with self-sufficiency. The solar collector utilizes sunlight to extract heat, and the absorber inside the collector converts the sun’s radiation into heat. This type of installation, combining these advanced technologies, can have practical applications in sectors such as the navy, emergency medical aid, or enhancing the living conditions in remote areas.

3. Numerical Modeling

3.1. Thermodynamic Analysis

A mathematical representation of the AGMD desalination system combined with solar energy has been established utilizing the principles of the first and second laws of thermodynamics. The model incorporates equations for determining the physical characteristics of seawater and brine as well as heat transfer coefficients (Table 2).
To simplify the developed model, the following assumptions and hypotheses were considered:
-
The system runs at a dynamic state throughout;
-
Thermal losses have been studied;
-
Kinetic and potential exergies are ignored;
-
An average pump efficiency of 75% is estimated;
-
Dead state properties for fluids are evaluated at T0 = 25 °C and the dead state salinity X0 = 35 g.kg−1.
The quantity of energy consumed in relation to the amount of freshwater generated is used to assess the performance of desalination units. The Gained Output Ratio (GOR) is a measure of the desalination process’s energy efficiency, depicted by the ratio of the amount of energy required to evaporate permeate flow over the total energy consumed. GOR can be mathematically represented by Equation (18). For a desalination system, the Performance Ratio (PR) is defined as the ratio of distillate mass to energy input. It can be expressed by Equation (19).
G O R = m ˙ p × Δ h v m ˙ s w × C p , s w × T h , i n T h , o u t
P R = m ˙ p Q h
The universal performance ratio (UPR) is a common platform to evaluate the desalination processes based on primary energy consumption [49]:
UPR = evaporative   energy primary   energy   input = λ m 3.6 × Q P S E
where λ m is equivalent to vapor energy and Q P S E is the standard primary energy calculated as:
Q P S E = kWh elc m 3 × C F e l c + kWh elc m 3 × C F t h
where C F e l c and C F t h are, respectively, the conversion factors for electricity and thermal input primary energy. The kilowatt hour per cubic meter (kWh.m−3) is the specific energy consumption in terms of electrical and thermal energy.
The thermodynamic limit (TL) is an ideal concept of desalination with no entropy generation, and hence, the system is independent as there is zero recovery. Depending on the source of seawater, where the salinity may vary from 3.0% to 4.5% by weight, the specific energy consumption is calculated to be in the range of 0.7 to 0.85 kWh.m−3. The TL that has a minimum work of typical seawater at ambient temperature and 3.5% concentration by weight of dissolved salts is about 0.78 kWh.m−3 or 2.8 kJ.kg−1 as given by the Gibbs equations. As a result, the UPR theoretical limit based on minimum separation work theory is 828 [49,50].

3.2. Exergy Analysis

There are four main parts to the overall energy rate: physical ( E ˙ p h ), chemical ( E ˙ c h ), kinetic ( E ˙ k e ), and potential ( E ˙ p e ) [51]. The general energy balance can be obtained by the following equation:
E x ˙ = E ˙ p h + E ˙ c h + E ˙ k e + E ˙ p e
The principle of exergy balance in steady-state open systems can be expressed by the equation [52]:
j Q ˙ j 1 T 0 T j W ˙ cv + i m ˙ i e i e m ˙ e e e E ˙ d = 0
The determination of the destructive (irreversible) external energy resulting from the generation of entropy is given by the Gouy-Stodola equation as follows:
E ˙ d = T 0 S ˙ g
However, the second law is given by the following statement [53]:
S ˙ g = e m ˙ e e e i m ˙ i e i + Q ˙ j T 0
where:
S ˙ g : The rate of entropy generation refers to the amount of entropy generated during the process is due to its inherent irreversibility.
Q ˙ j : It expresses the rate of heat transfer at the reference temperature T 0 .
Q ˙ j T 0 : Denotes the entropy transfer rate.
By disregarding the heat transfer as well as the current’s kinetic and potential energies, we arrive at the conclusion:
W ˙ u = i m ˙ i e i e m ˙ e e e T 0 S ˙ g
The components of the steady flow do not contribute to the work done during the process S ˙ g = 0 because its limits are fixed; useful work can be obtained if the entropy generation term is changed [47].
W ˙ r e v = W ˙ u , m a x = m ˙ e i e e
The values for both physical and chemical exergy are calculated as follows:
E ˙ p h = m ˙ e p h = m ˙ h s h 0 T 0 s s s 0
E ˙ c h , w = m ˙ e c h = m ˙ ω k µ k s µ o k o
The subscript (s) in the equations in question denotes the reference state and represents the initial state (0). The symbols ( μ ) and ( ω ) refer to chemical potential and mass fraction, respectively, while ( e p h ) and ( e c h ) refer to specific physical and chemical exergy.
The component destruction exergy ( E x ˙ d ) is given by the following equation:
E x ˙ d = i E x ˙ i e E x ˙ e
The AGMD desalination unit consists of three separate streams: seawater, pure water, and steam. The thermodynamic characteristics of the relevant fluids are determined through the use of empirical models that have been documented in references [32,33,34,35,36,37].
A system’s exergy efficiency is the ratio between the minimum separation work and the fuel energy:
η e x = W ˙ m i n E ˙ f
Minimum work to separate ( W ˙ m i n ) is the energy of the product in the desalination process, while fuel energy ( E ˙ f ) is the thermal energy provided to the system.

4. Results and Discussion

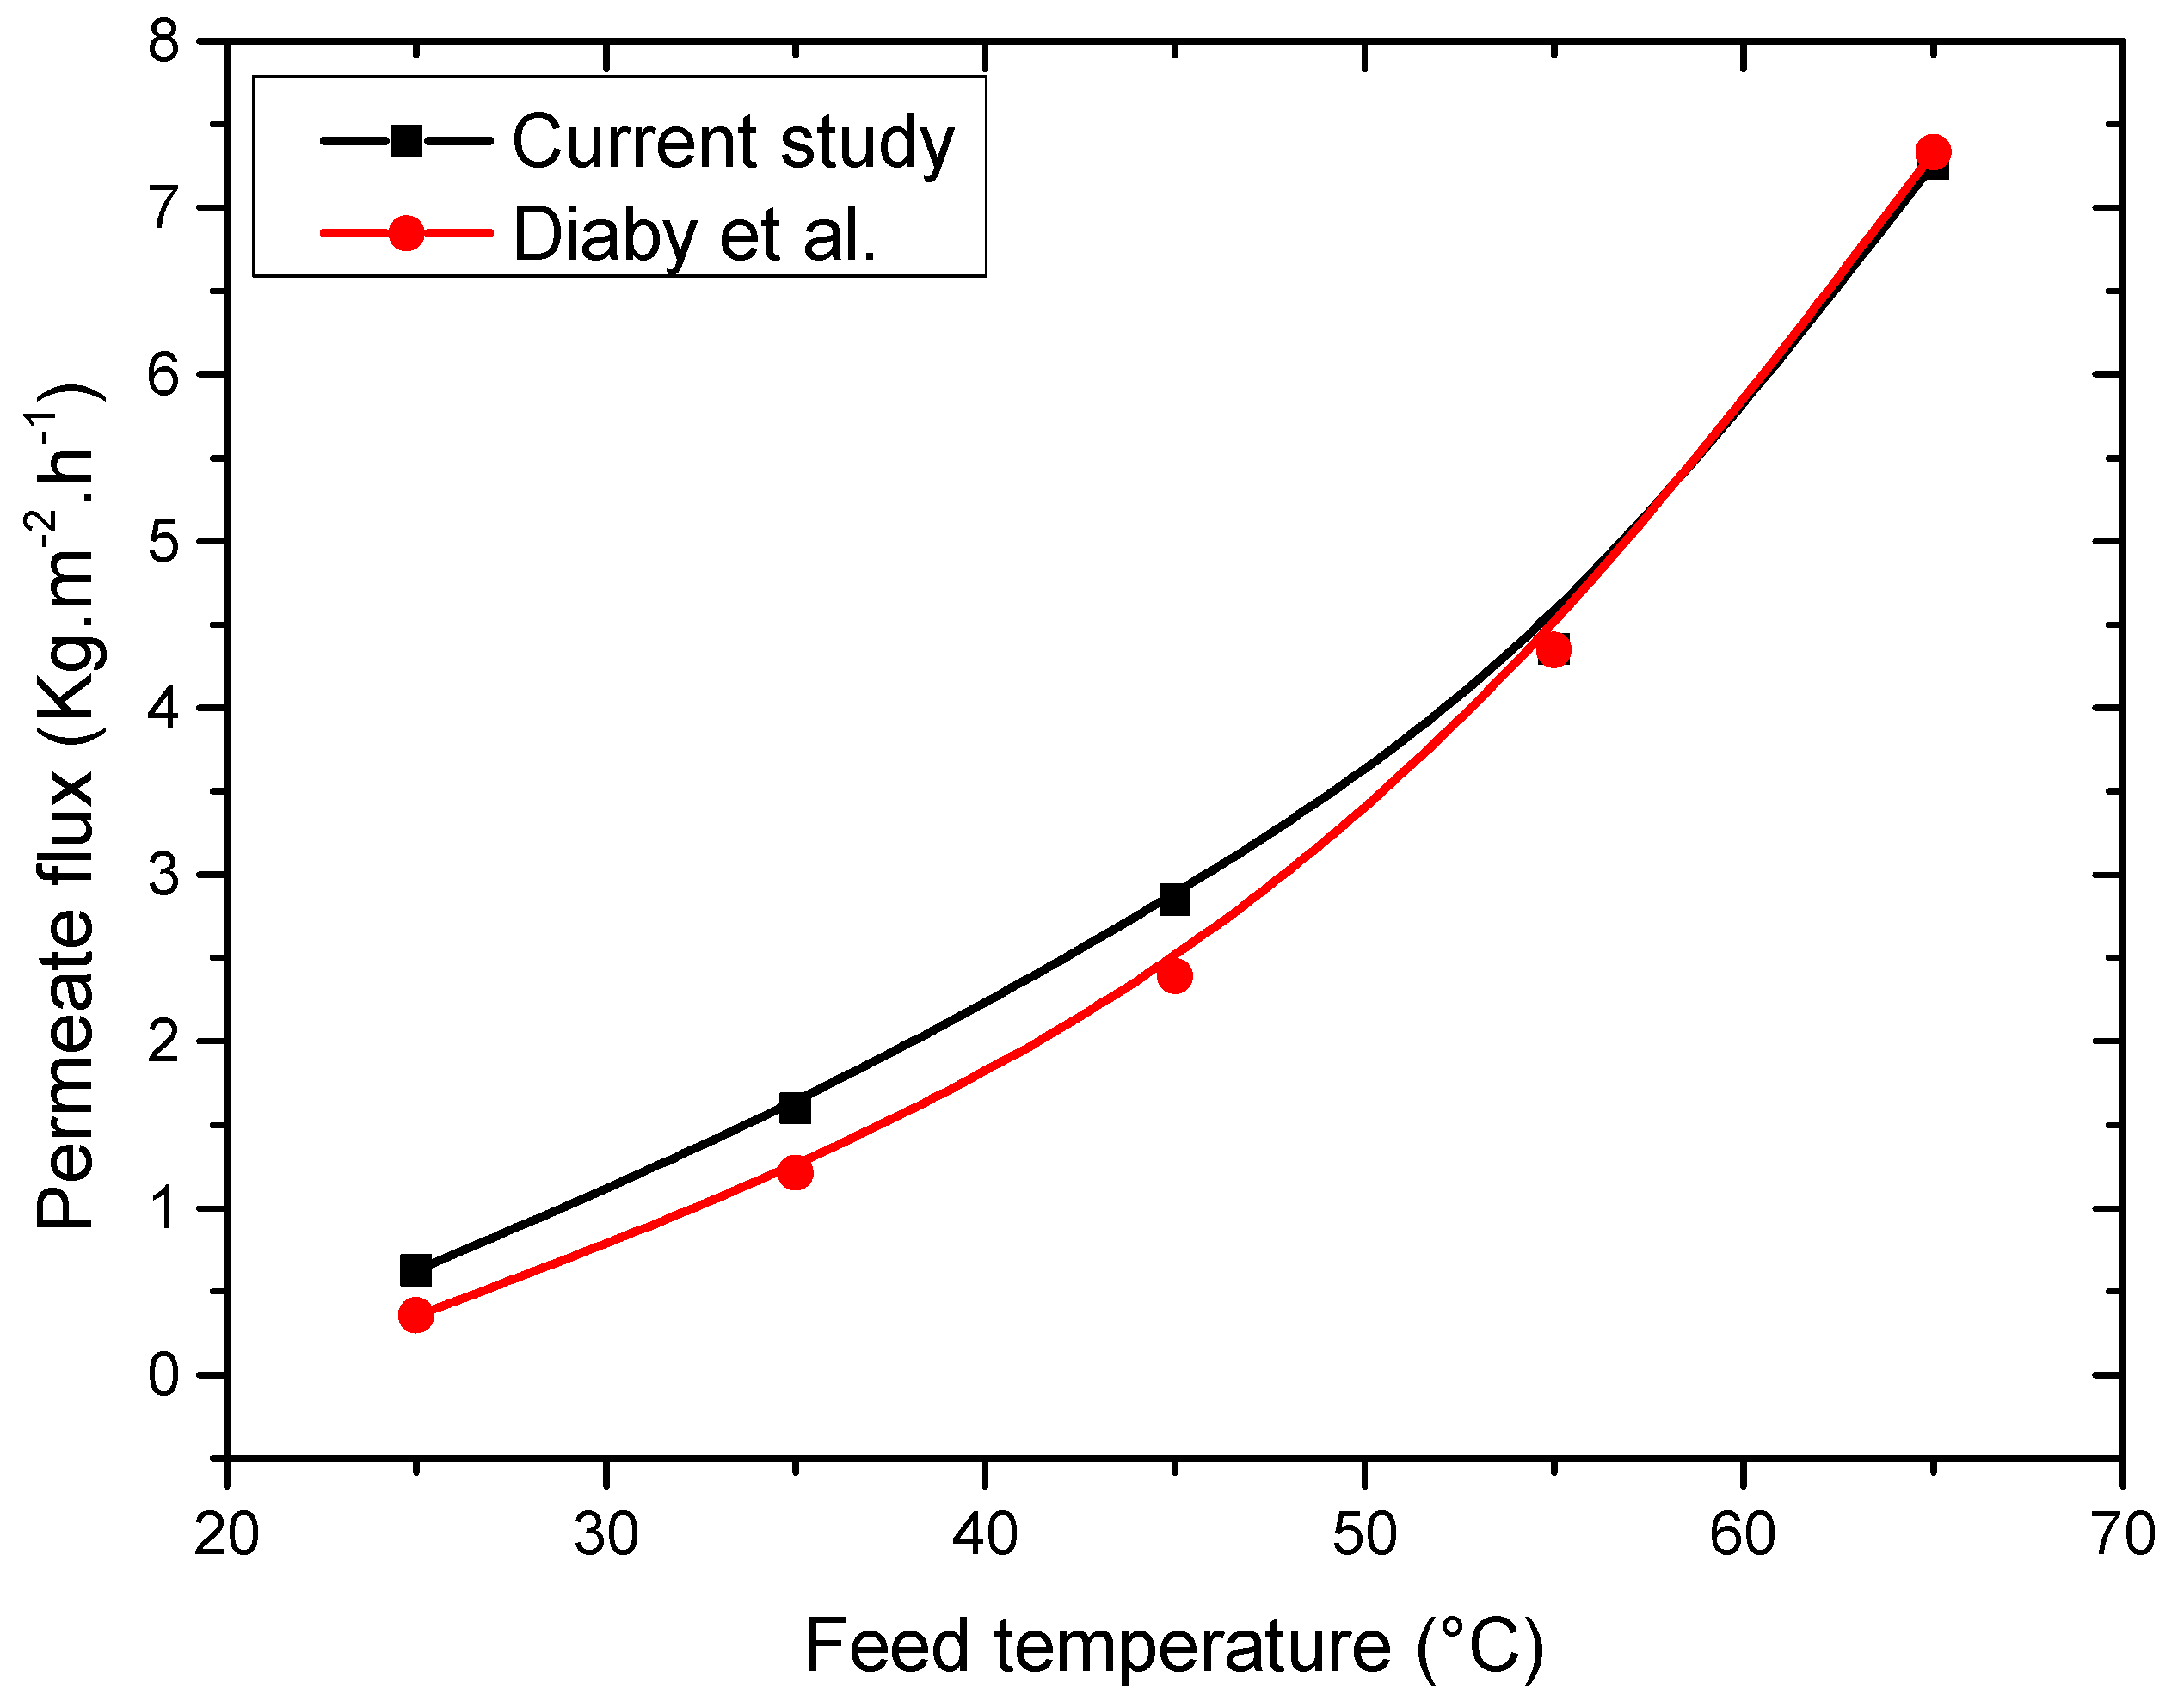
4.1. Model Validation

In this study, the experimental results obtained by Diaby et al. [48] were used to validate the model predictions. The evolution of the predicted and measured water vapor flow was compared at different feed water temperatures. It can be seen from Figure 2 shows that the temperature of the feed water affects how the permeate flow evolves. The permeate flow increases exponentially as the feed temperature rises. In this temperature range, the permeate flow goes from 0.625 to 7.03 kg.m−2.h−1 at a cooling temperature set at 15 °C and a cooling flow rate set at 5 L.min−1. This variation in permeate flow value is explained by the increase in the transmembrane force of water vapor. The obtained results are in concordance with those reported in the literatures [54,55]. The characteristics of PTFE membrane are listed in Table 3.

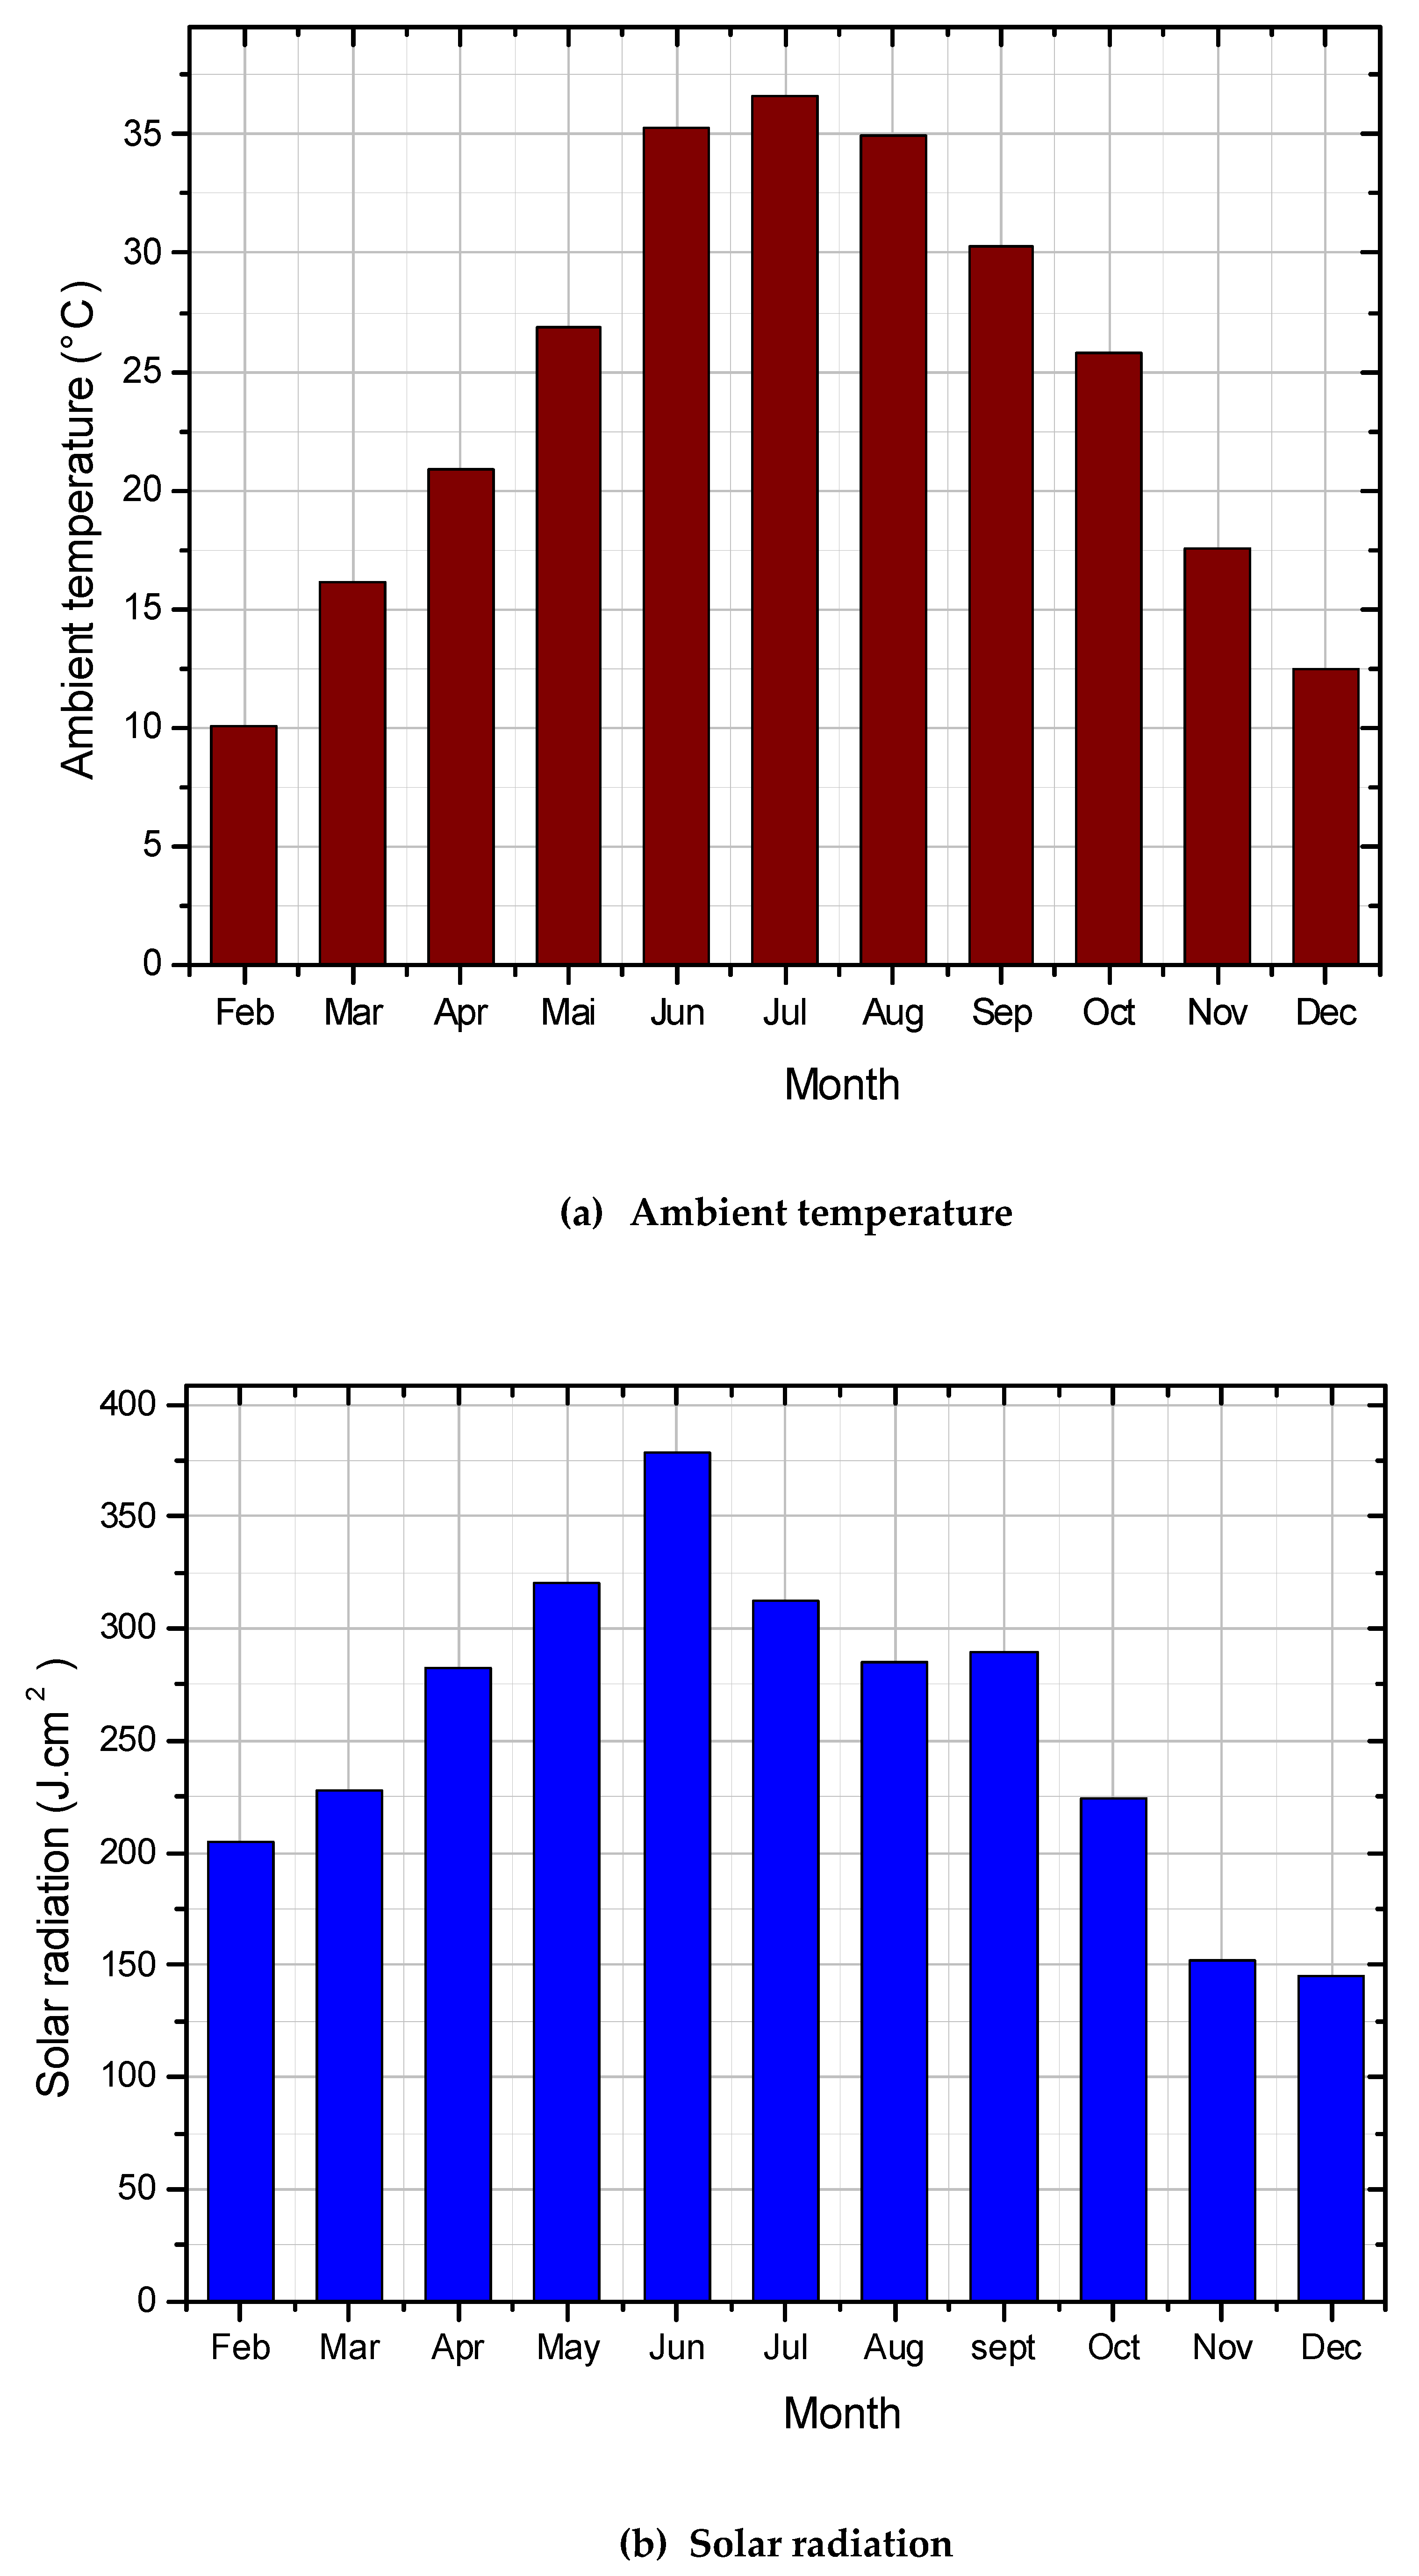
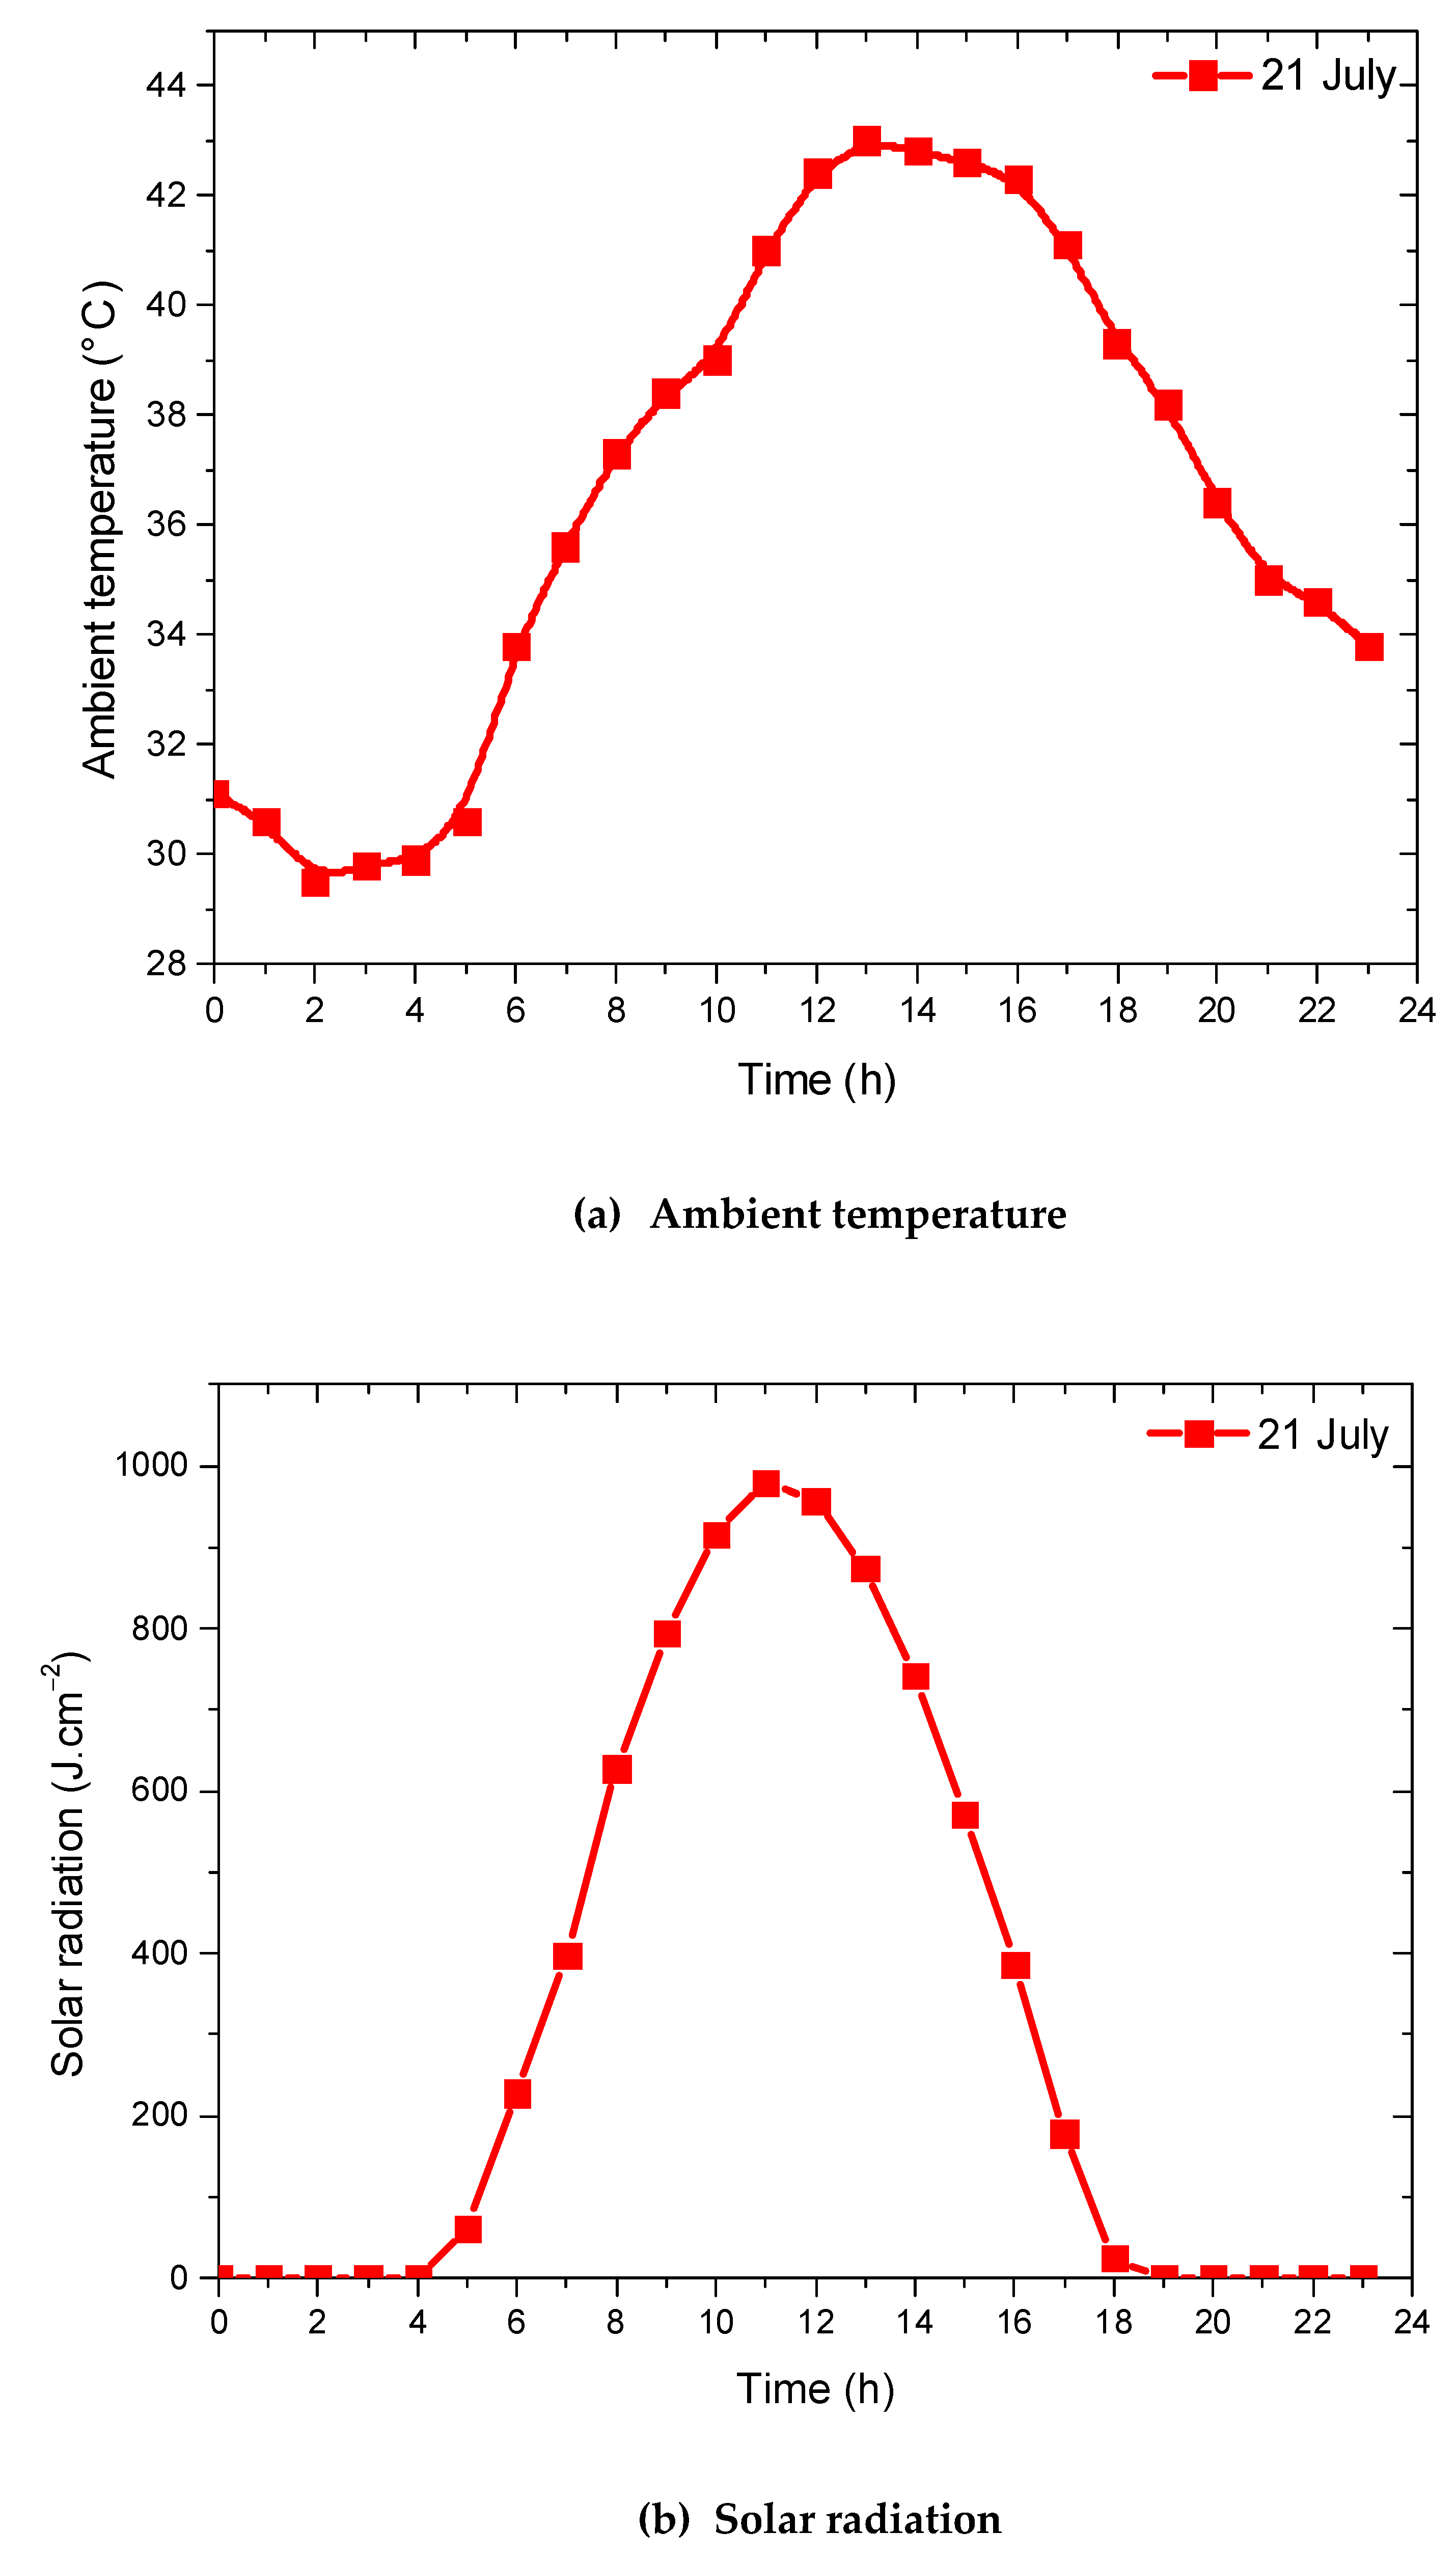
4.2. Evaluation of Solar Potential

The solar radiation data utilized in this study wereobtained with high accuracy from a radiometric station located on the roof of the applied research unit for renewable energies (URAER) building in Ghardaia. The data was collected over a period of 335 days, from 9 February to 31 December 2012, and is depicted in Figure 3. The results show that the highest temperature was recorded in July with a temperature of 43 °C, while the lowest value of 11 °C was recorded in the month ofJanuary. As a resultof this study, the month of July is considered the most suitable time for the study.
Figure 4 shows the global solar irradiation evolution with daytime for the month of July. The irradiation has a bell-shaped profile that is consistent with the prediction of well-known semi-empirical models from the literature. It is also noted that the highest temperature and solar radiation values are recorded on July 21, which is the most appropriate day to be considered in the present work.
Table 4 shows the Solar AGMD system operating conditions obtained from the thermodynamic analysis. We have taken these conditions to be those of the dead state: P0 = 1.01 bar, T0 = 302.65 K, h0 = 117.76 k J.kg−1.K−1, dead state specific entropy S0 = 0.4097 kJ.kg−1.

4.3. System Performance

The inlet temperature of the hot channel Th,in corresponds to the change in the temperature of the heat exchanger over the hours within a day (Figure 5). It can be seen that Th,in increases and reaches its maximum (Th,in = 62 °C), with an air gap thickness of 1 mm and flow rate of 2 L.min−1 for different initial tank feed temperatures. This means that the output temperature of SFPC increases the inlet temperature in the hot channel; this is because the residence time of the feed solution is longer when the flow rate is lower.
Figure 6 shows the permeate flux and GOR as a function of the local time. It can be seen that the permeate flux increases at the beginning of the day to reach about 5.6 kg.m−2.h−1 at a feed temperature of 62 °C and a flow rate of 0.01 kg.s−1 as the maximum value is obtained at 12:00 h. The obtained results show a good agreement with the results provided in the literature. The main performance parameters for thermal desalination system evaluation are gained output ratio (GOR). The larger GOR is, the higher the thermal energy utilized efficiency is [56]. From Figure 5, we can conclude that the GOR increases proportionally as the temperature difference across the AGMD membrane increases because of the increase in the amount of thermal energy needed to heat the feed water. However, as the feed temperature increases, permeate flux increases exponentially while the thermal energy consumption for heating the feed water solution increases. The maximum value of GOR = 2.3 is recorded at 12:00 h, mainly because of the maximum value of the hourly pure water. Figure 7 shows that the PR increases as the inlet temperature of the hot fluid increases in the same way as for the GOR and reaches its maximum PR = 0.98 at around 12:00 h. A high PR means that a high flow rate of distillate is obtained for a given thermal energy input. Usually, high PR can be achieved by using well-designed system components with high energy efficiency and good insulation material.
The variation of UPR% of the thermodynamic limit and the thermodynamic limit over the local time is shown in Figure 8. The UPR value of the solar AGMD system is found to be 187.89, which is much higher compared to desalination processes reported in the literature such as MED-TVC (UPR = 102.2), MED (UPR = 88) and RO (UPR = 86). This is mainly because AGMD uses low-grade vapor, which contains a very small percentage of the primary energy. Furthermore, the obtained results show that the solar AGMD system is operating at 20.43% of the ideal or thermodynamic limit and is close to achieving sustainable desalination, which ranges from 25% to 30% of TL [50]. Variations of Standard Primary Energy and the Universal Performance Ratio over the local time are shown in Figure 9. It can be seen that the maximum QSPE value for the AGMD solar system is found to be 8.43 kWh.m−3 which is similar to the results obtained during desalination processes reported in the literature, such as MSF (QSPE = 8.22 kWh.m−3), RO (QSPE = 7.12 kWh.m−3), MED (QSPE = 6 kWh.m−3) and MED-TVC (QSPE = 5.3 kWh.m−3). Therefore, Standard Primary Energy Consumption allows the efficient comparison of all desalination processes.

4.4. Energy and Exergy Analysis

To assess irreversibility in a system, the exergy analysis was conducted using the second law of thermodynamics. This later refers to the equivalent amount of mechanical work that can be produced from other forms of energy. The exergetic analysis was conducted using data from July 21, which corresponds to the day when the collector field received the highest solar flux density. The minimum work of separation W ˙ m i n represents the product exergy in the desalination process. Figure 10 shows the minimum work of separation and exergy efficiency of AGMDaccording to local time. The maximum value of W ˙ m i n is 0.17 kW and is recorded at 12:00 h for a feed temperature of 62 °C and flow rate of 2 L.min−1. Hence, low-temperature vapor could be employed to improve minimum work. The obtained values are comparable to those obtained by Miladi et al. [34], where it is revealed that the highest values for exergetic efficiency were recorded at 0.116%.Additionally, it is evident that the overall exergy efficiency calculated for the AGMD system has a maximum value of 56.3% at 12:00 h at a cold channel inlet temperature of 29.5 °C. However, the obtained value is similar to that reported in the literature for other AGMD, ranging between 52.1% and 55.4% for a cold channel inlet temperature Tc,in varies from 33.8 °C to 36.2 °C and for a flow rate of 2 L.min−1 [48].
Figure 11 and Figure 12 illustrate the performance curves of the solar collectors that were tested during the study. It is important to note that the exergetic efficiency recorded was notably lower than the energy efficiency, with the highest energy yield recorded at 52% and the maximum exergy efficiency at 4.45%. Energy efficiency solely measures the quantity and does not provide a thorough evaluation of the various losses that may occur in solar collectors. The results obtained in this study are similar to those found by Banat and Jwaied [21] and Miladi et al. [34], who recorded maximum exergetic efficiency values of 6.5% and 5.03%, respectively, and maximum energetic efficiency values of 55% and 48.12%, respectively. The energy forms indicated that the solar collector field is effective from an energy perspective but not from an exergy perspective. According to the energy profile, the solar collector field is efficient from an energy viewpoint and inefficient from an exergy viewpoint. Hence, performing an exergetic analysis of other solar field elements would provide the opportunity to make decisions that are more efficient and prevent membrane degradation.

4.5. Maximum Percentage of Component Destruction Exergy

The key outcome of the exergy analysis is the identification and quantification of the portions of exergy destroyed in each component. This result enables the measurement and recognition of the exergy loss areas, as well as the target components or sub-systems responsible for inefficiency. Thus, the error is determined. Figure 13 displays the distribution of exergy destruction in the AGMD, heat exchanger pumps, and flat plate collector. It can be observed that the majority of the total exergy loss, 95%, takes place in the solar collectors. However, the heat exchanger is the next significant source of exergy destruction, accounting for 2.55% of the total exergy loss, while the AGMD contributes to only 1.44% of the total energy loss. This disparity is primarily due to the different temperature values between the flat plate collector, heat exchanger, AGMD, and pumps.
Exergy destruction in solar collectors can be reduced by taking the following measures:
-
Improving thermal insulation: A good thermal insulation system reduces thermal losses and helps to maintain the temperature of the collector. This can be achieved by using high-quality insulation materials and ensuring proper installation;
-
Reducing radiation losses: Solar collectors can lose energy through radiation to the environment. To reduce this, you can use selective coatings on the absorber plates, which absorb more solar radiation and reflect less thermal radiation. This can increase the efficiency of the collector;
-
Improving heat transfer: Heat transfer losses can occur due to poor fluid flow or inadequate heat transfer between the absorber plate and the fluid. You can reduce these losses by optimizing the fluid flow rate and using high-efficiency heat transfer fluids.
-
Optimizing collector design: The design of the solar collector can also impact its efficiency. A collector with a larger surface area and a smaller heat transfer distance can reduce exergy destruction by minimizing thermal losses;
-
Regular maintenance: Proper maintenance of the solar collector can help to ensure its efficiency over time. This includes cleaning the collector regularly to remove dust and debris and checking for leaks in the system.

5. Conclusions

In this study, detailed energy and exergy analysis of a solar-powered AGMD system for saline water desalination in the Gherdaïa region, Algeria, was conducted. A one-dimensional dynamic model was developed to analyze the heat and mass transfer processes in the AGMD system combined with a flat plate collector in order to predict water production and flux. The model was validated using previously reported flux data and used to examine the impact of various parameters on the efficiency of the solar AGMD desalination system. In addition, both energy and exergy analyses were conducted to evaluate the overall thermodynamic behavior of the solar AGMD desalination system. The main conclusions are summarized as follows:
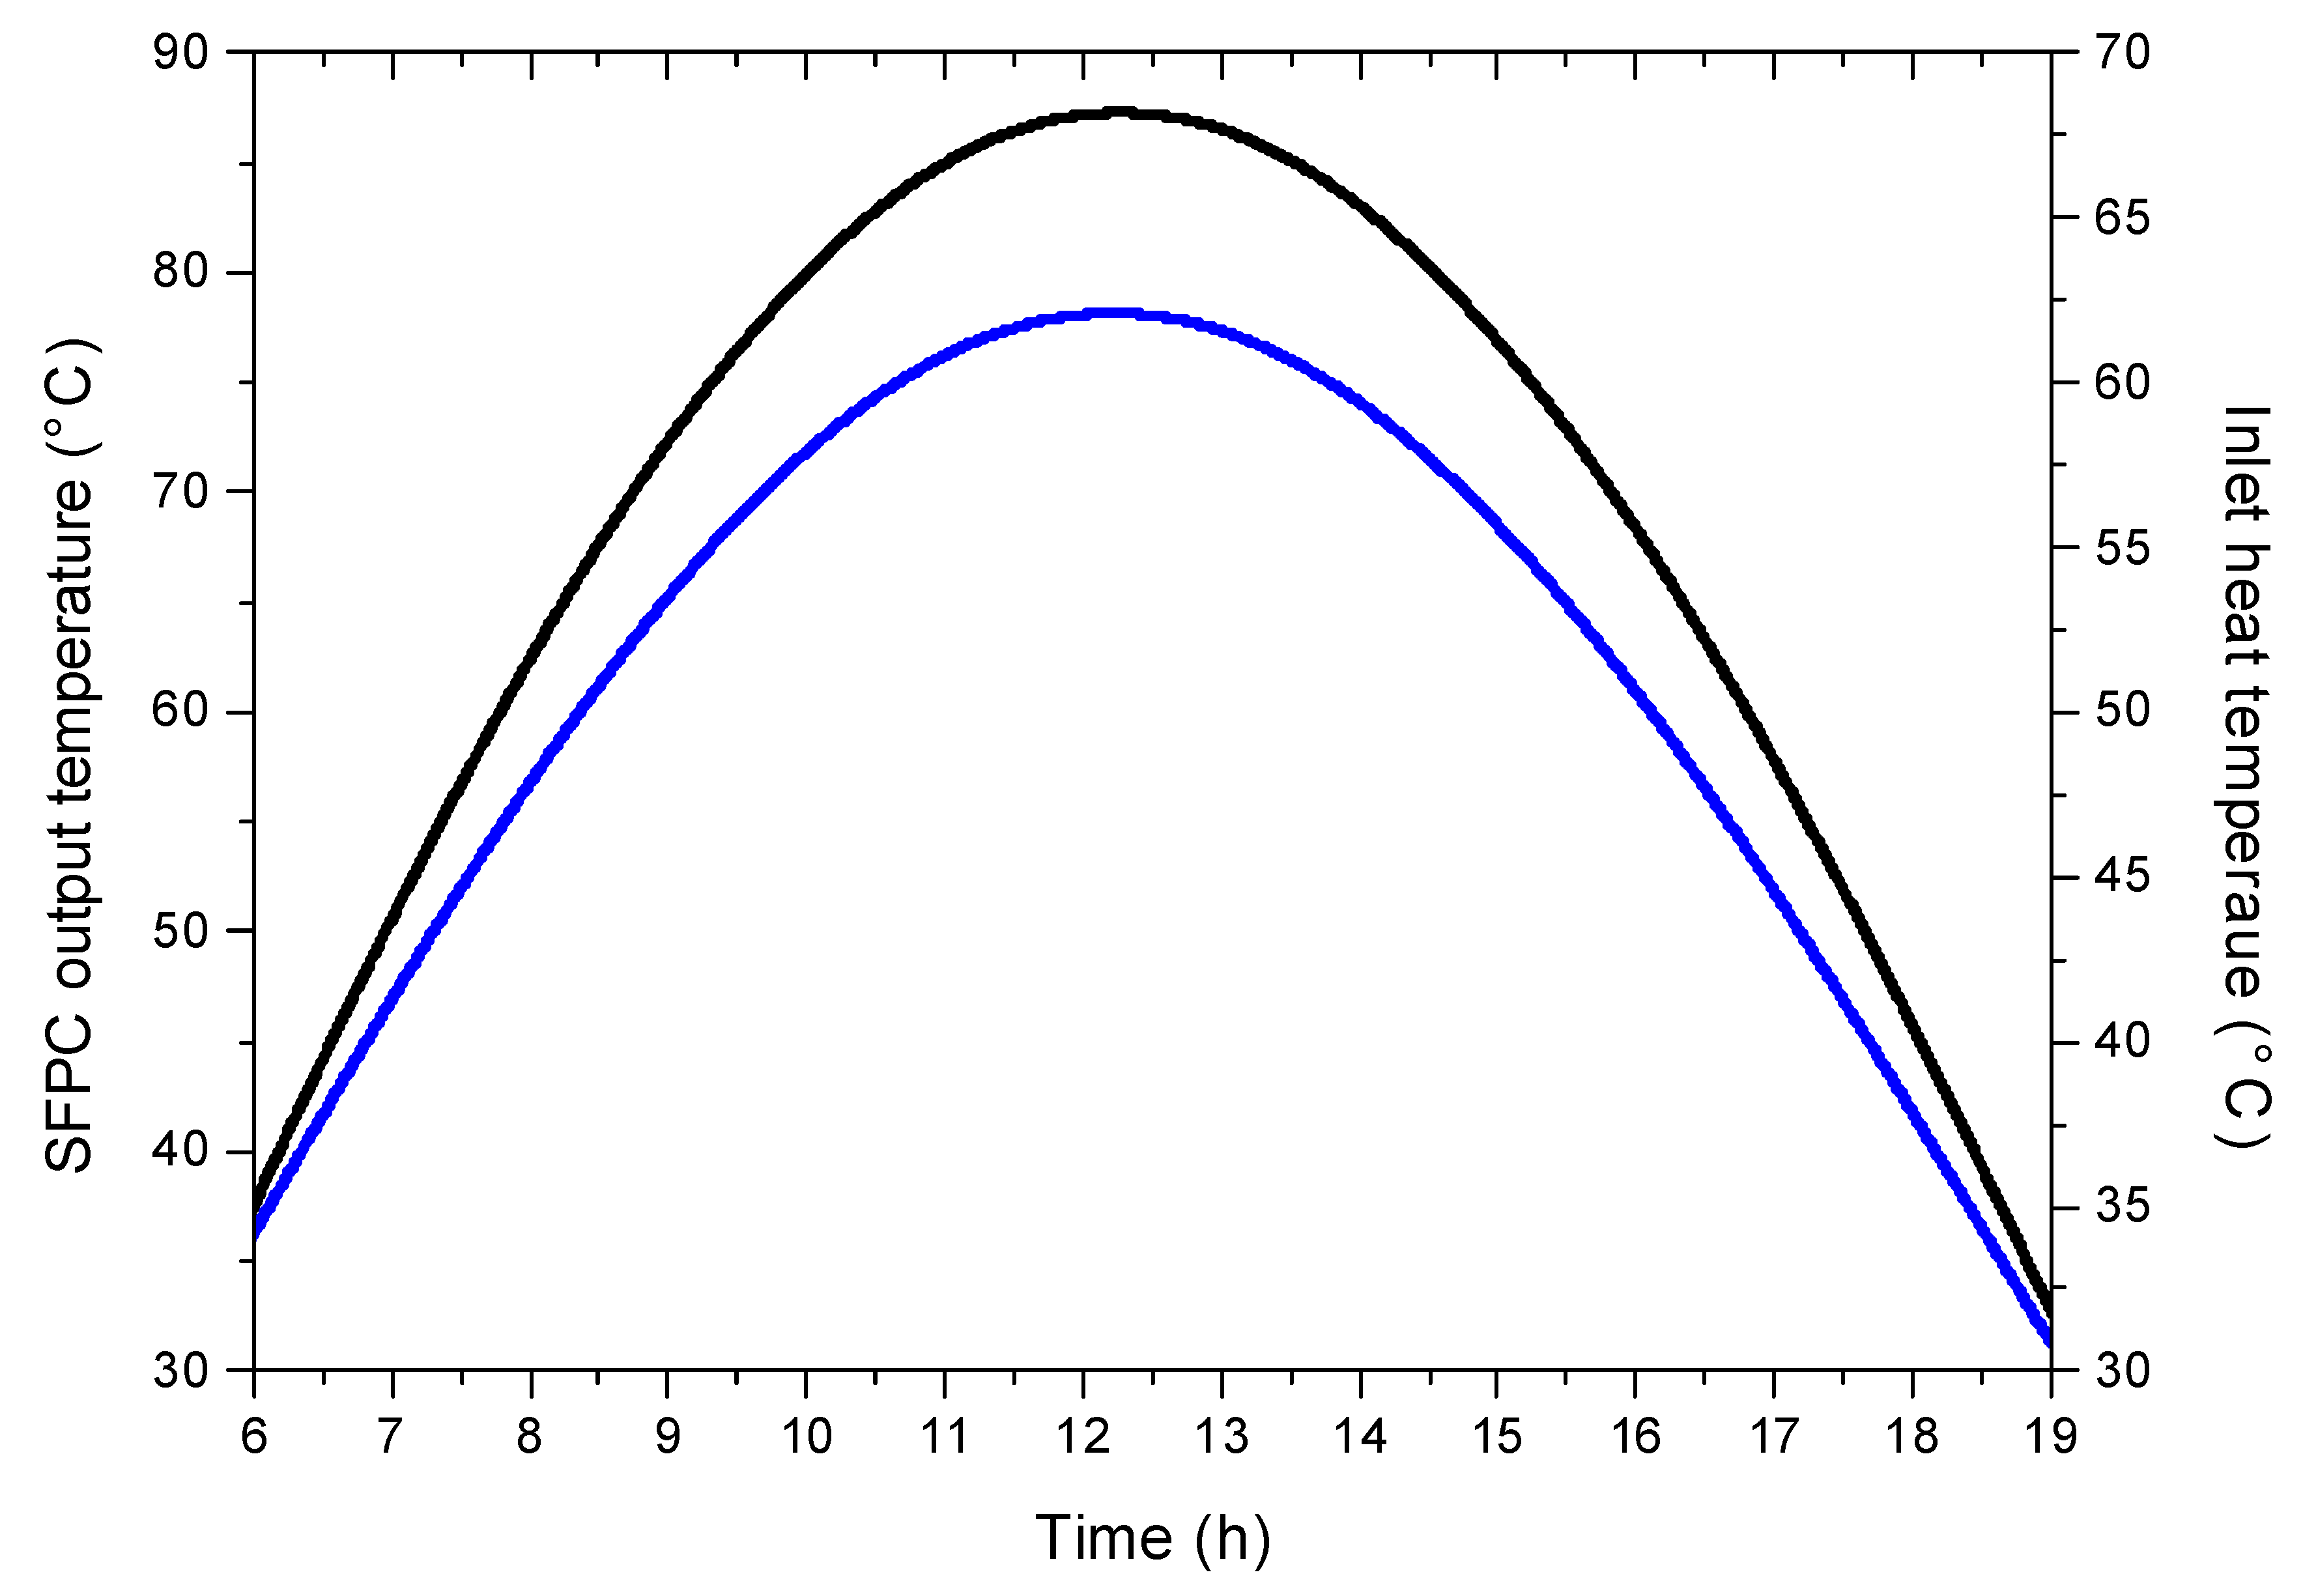
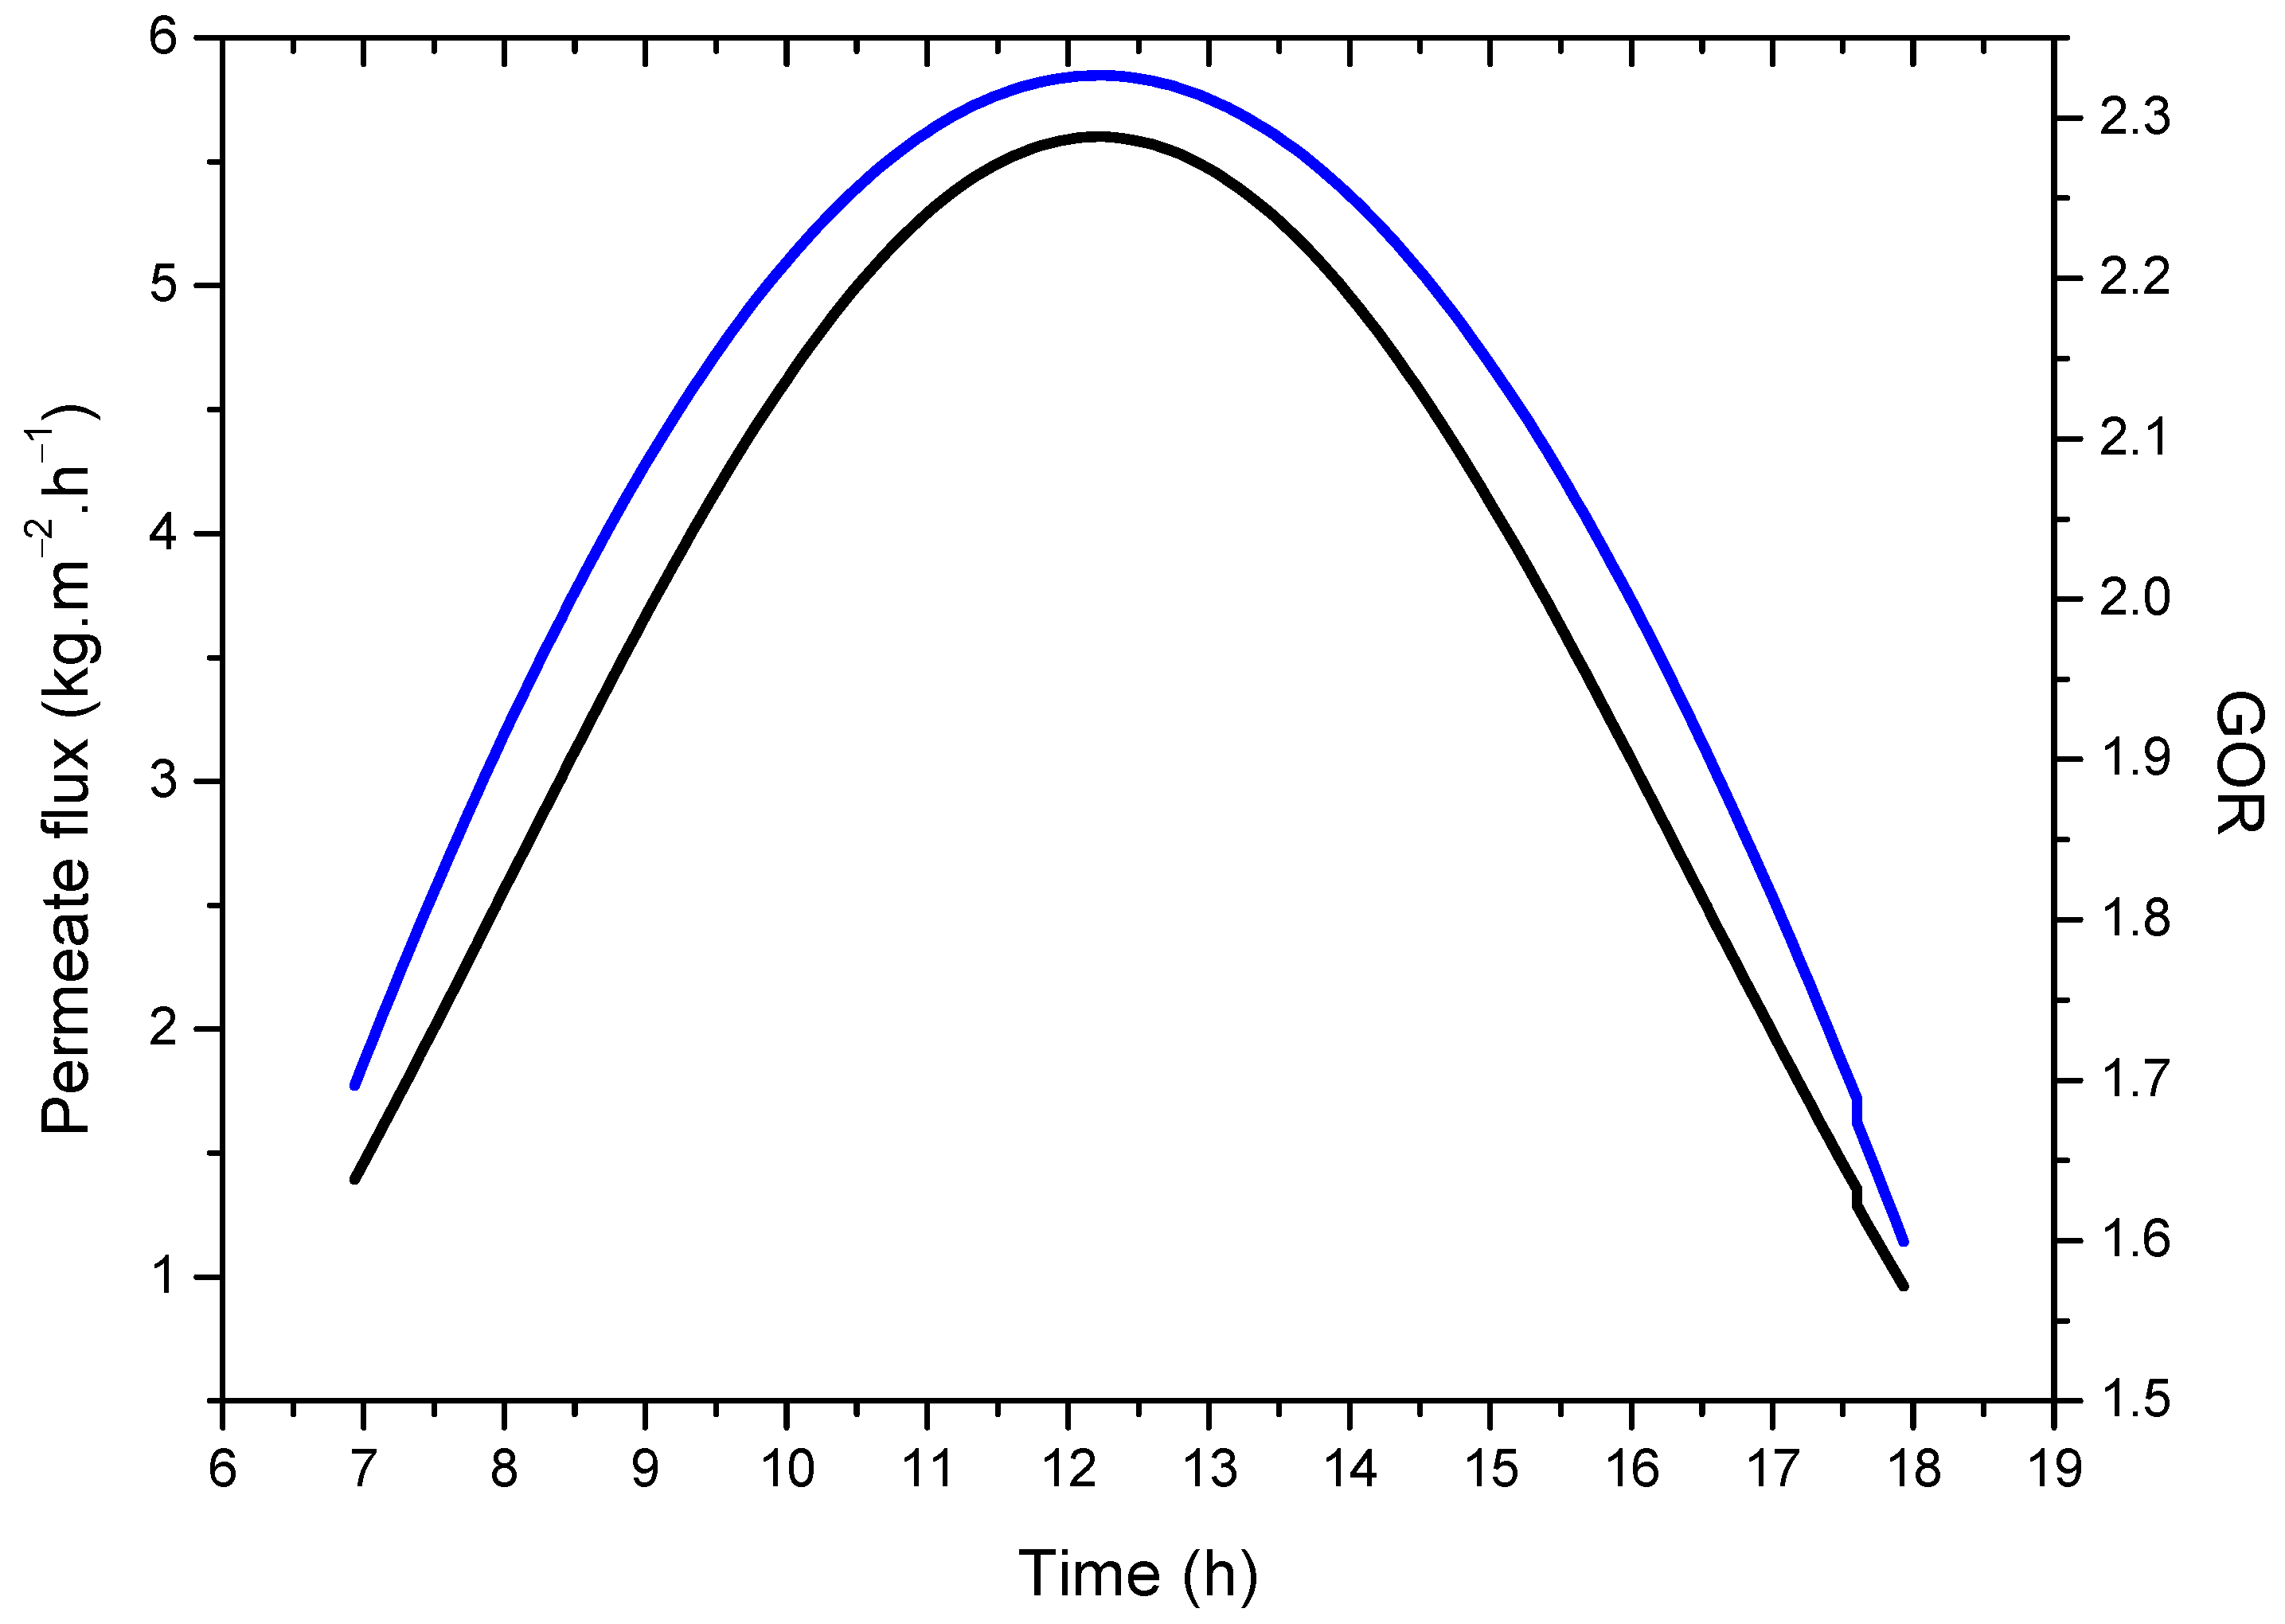
  • Based on the obtained numerical results, an average distillate water production of 5.5 kg.m−2.h−1 could be achieved at a feed temperature of 62 °C and feed flow rate of 2 L.min−1;
  • Increasing the air gap thickness reduces the risk of direct contact between the membrane and the considered surface but will cause thermal and mass resistance, and thus a decrease in mass flux and thermal efficiency of the AGMD process. Therefore, it must be carefully considered based on the specific requirements and limitations of the system;
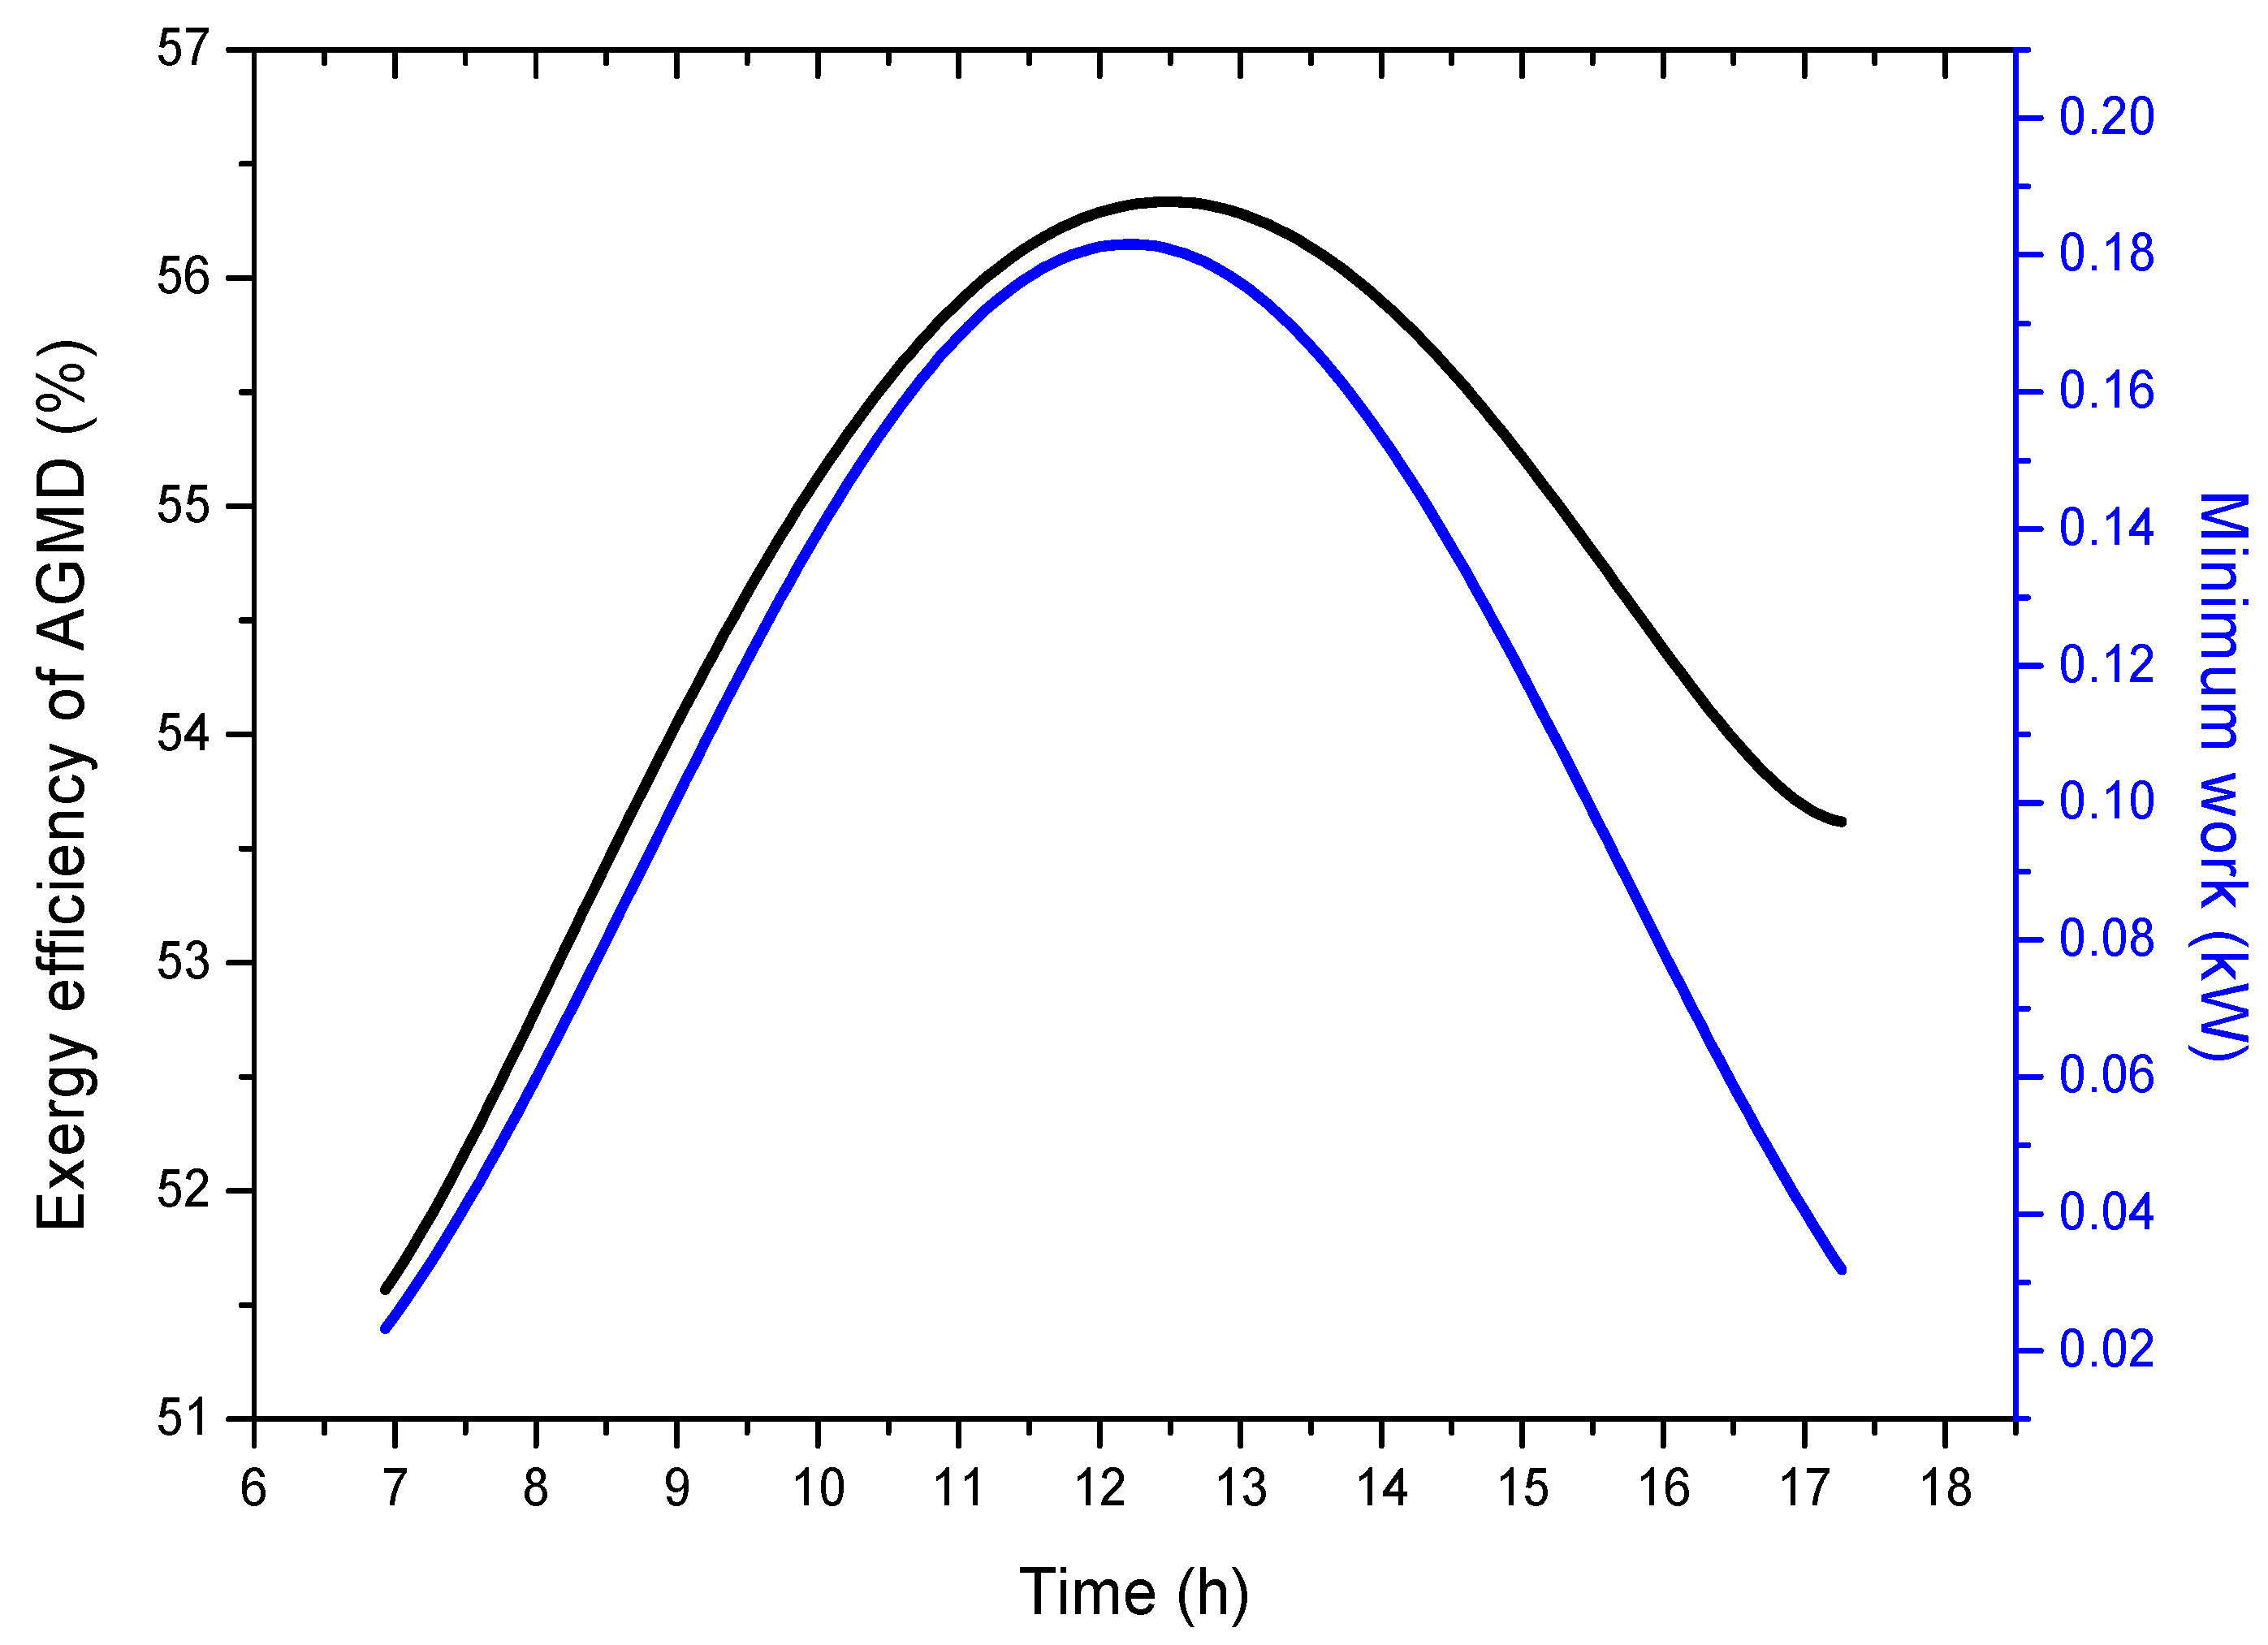
  • The exergy efficiency for the AGMD system is found to be 56.3%, which indicates that the AGMD module of the current design is moderately efficient, and large amounts of energy can be saved. It is important to highlight that all desalination processes have very low energy efficiencies. However, what distinguishes AGMD is that it operates at a lower temperature compared to other thermal distillation processes. This facilitates its coupling with solar energy;
  • The maximum exergy destruction occurs in the solar collector (95%) because of the large temperature difference between solar heat and the coolant fluid in the collector field, which results in high irreversibilities. Hence, effort should be made to reduce this exergy loss. Potential improvement of the solar collector field might be achieved by maximizing the collector’s optical efficiency as well as minimizing the overall heat losses of the collector area;
  • The two main sources of exergy destruction are the solar thermal collector and the desalination unit 95% of the total exergy loss is destroyed in the collector, while 2.55% of the loss of total exergy is destroyed in the heat exchanger and only 1.44% of the total exergy loss is destroyed in the desalination system;
  • Increasing the inlet temperature of the hot channel increases the system's overall energy and exergy efficiencies; while it reduces the total exergy destruction rate leading to the improvement in the performance of the system;
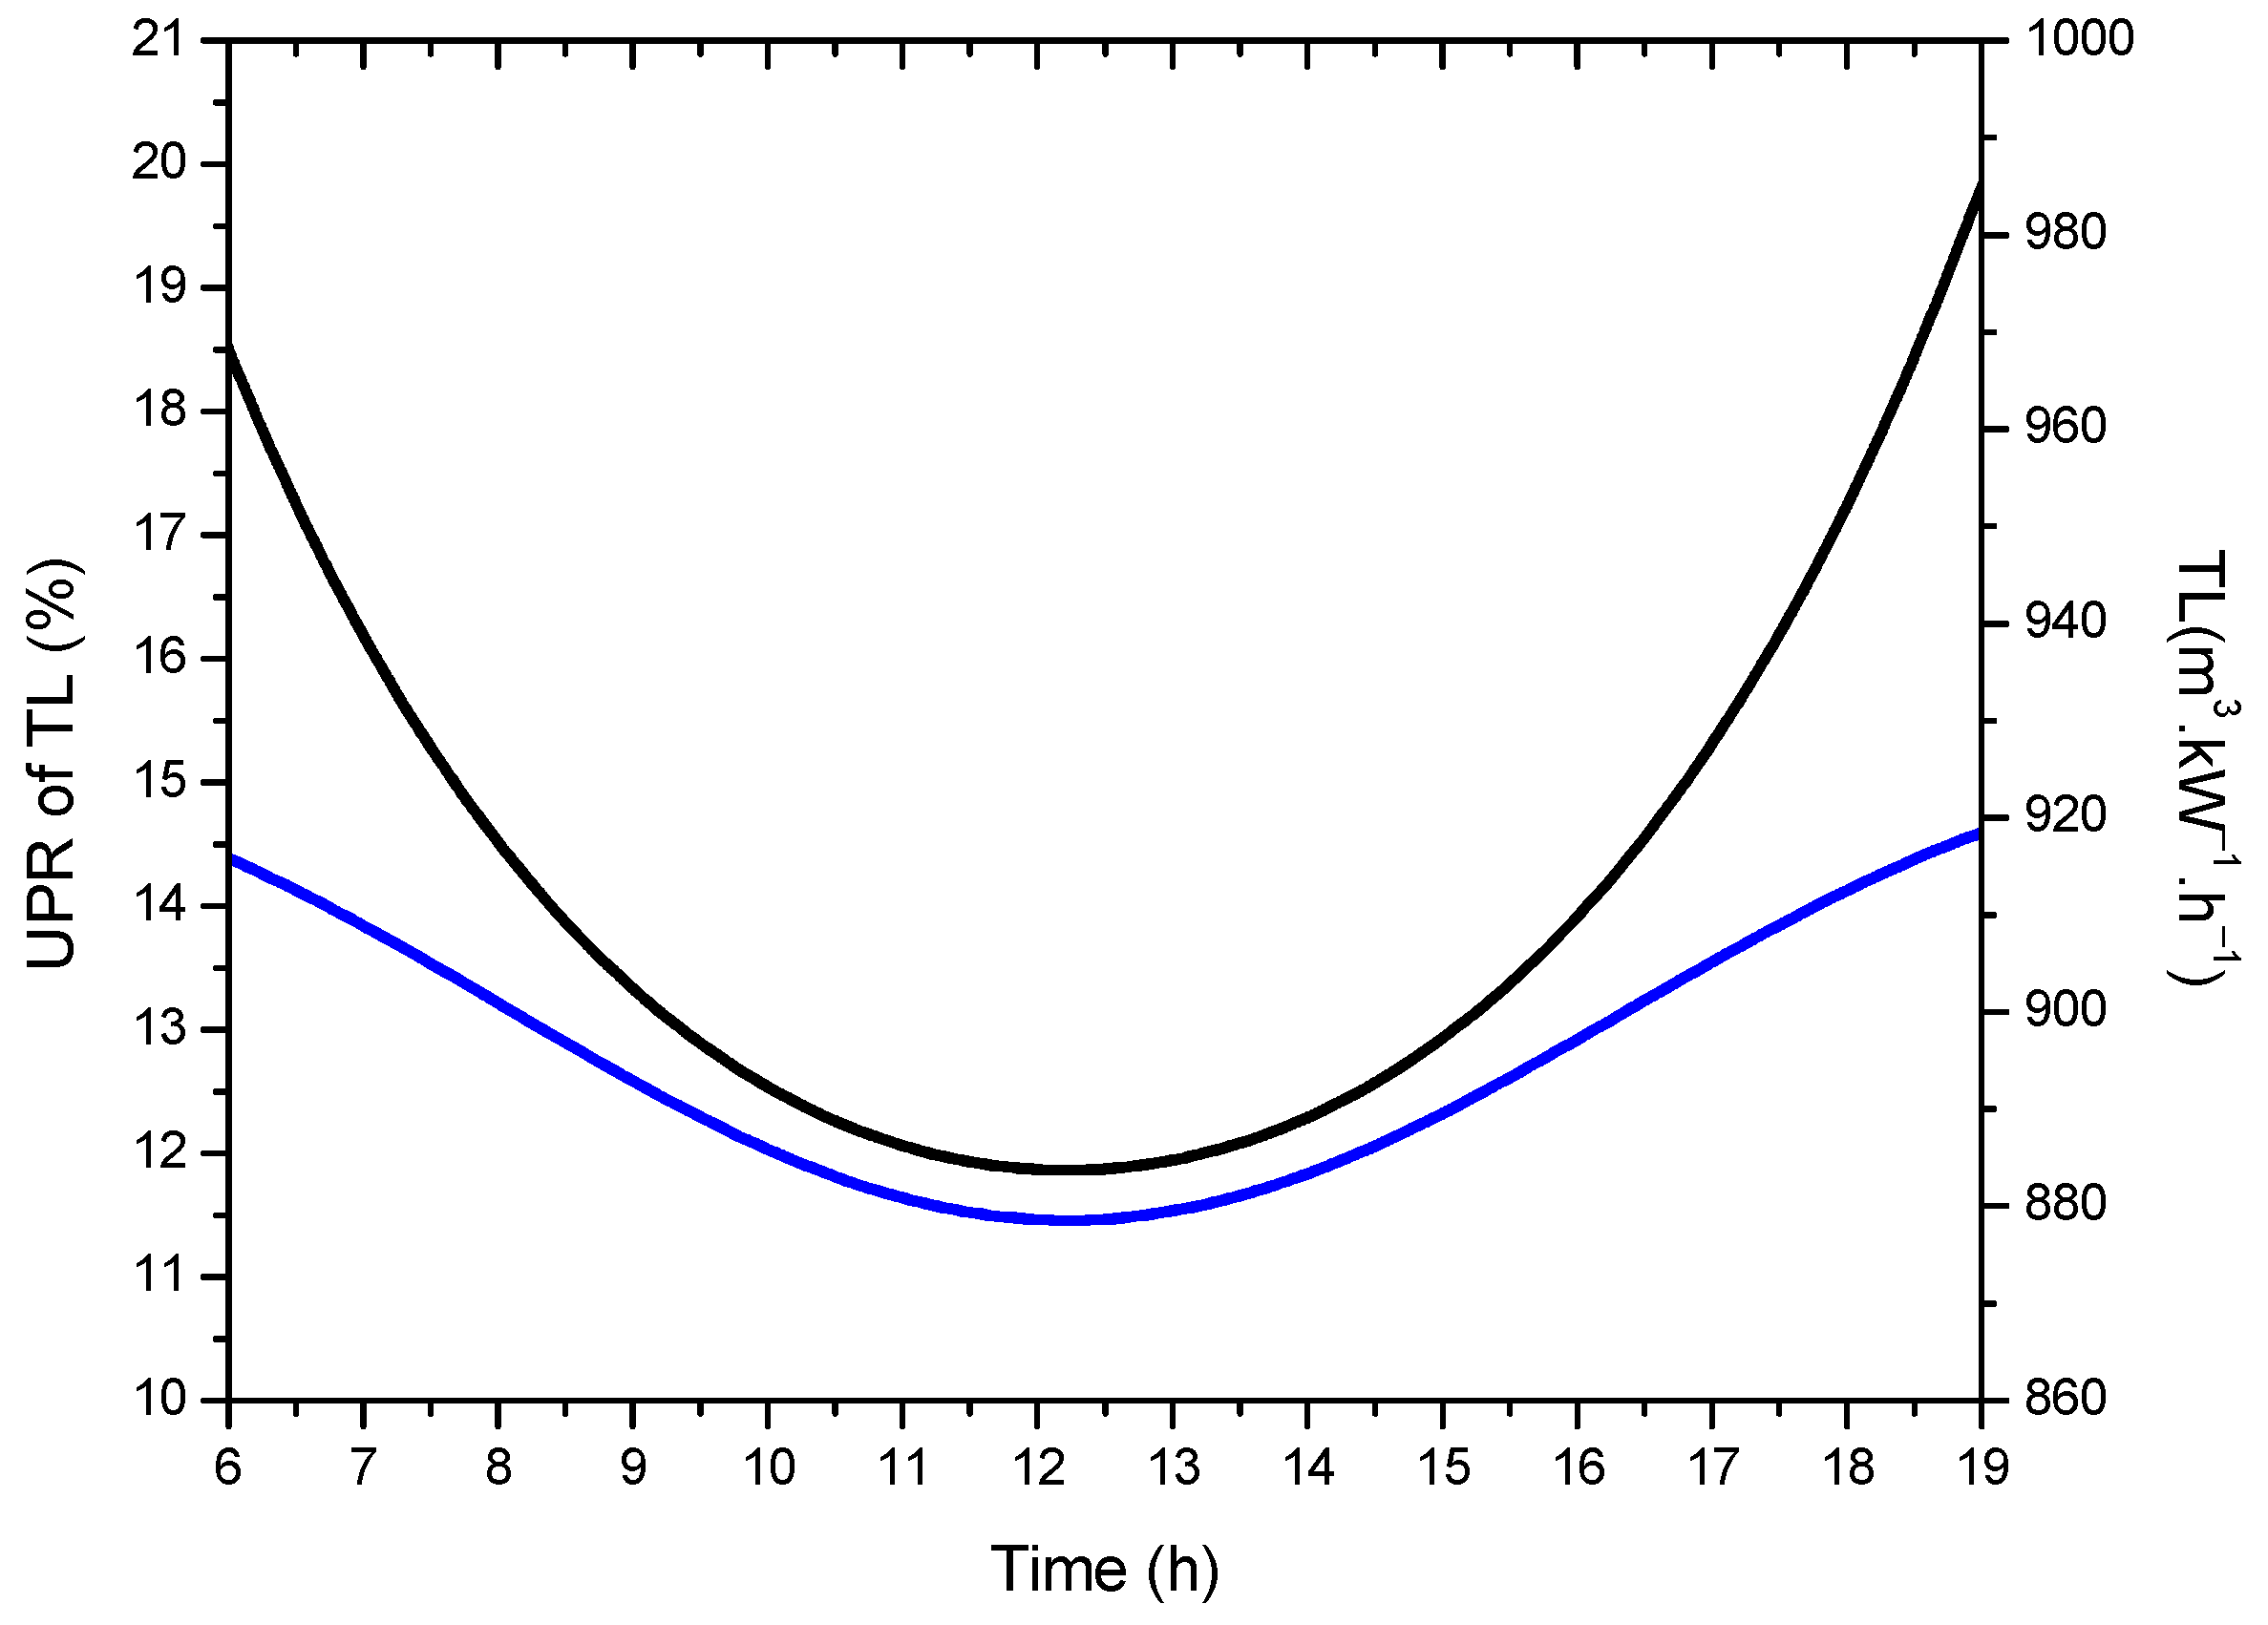
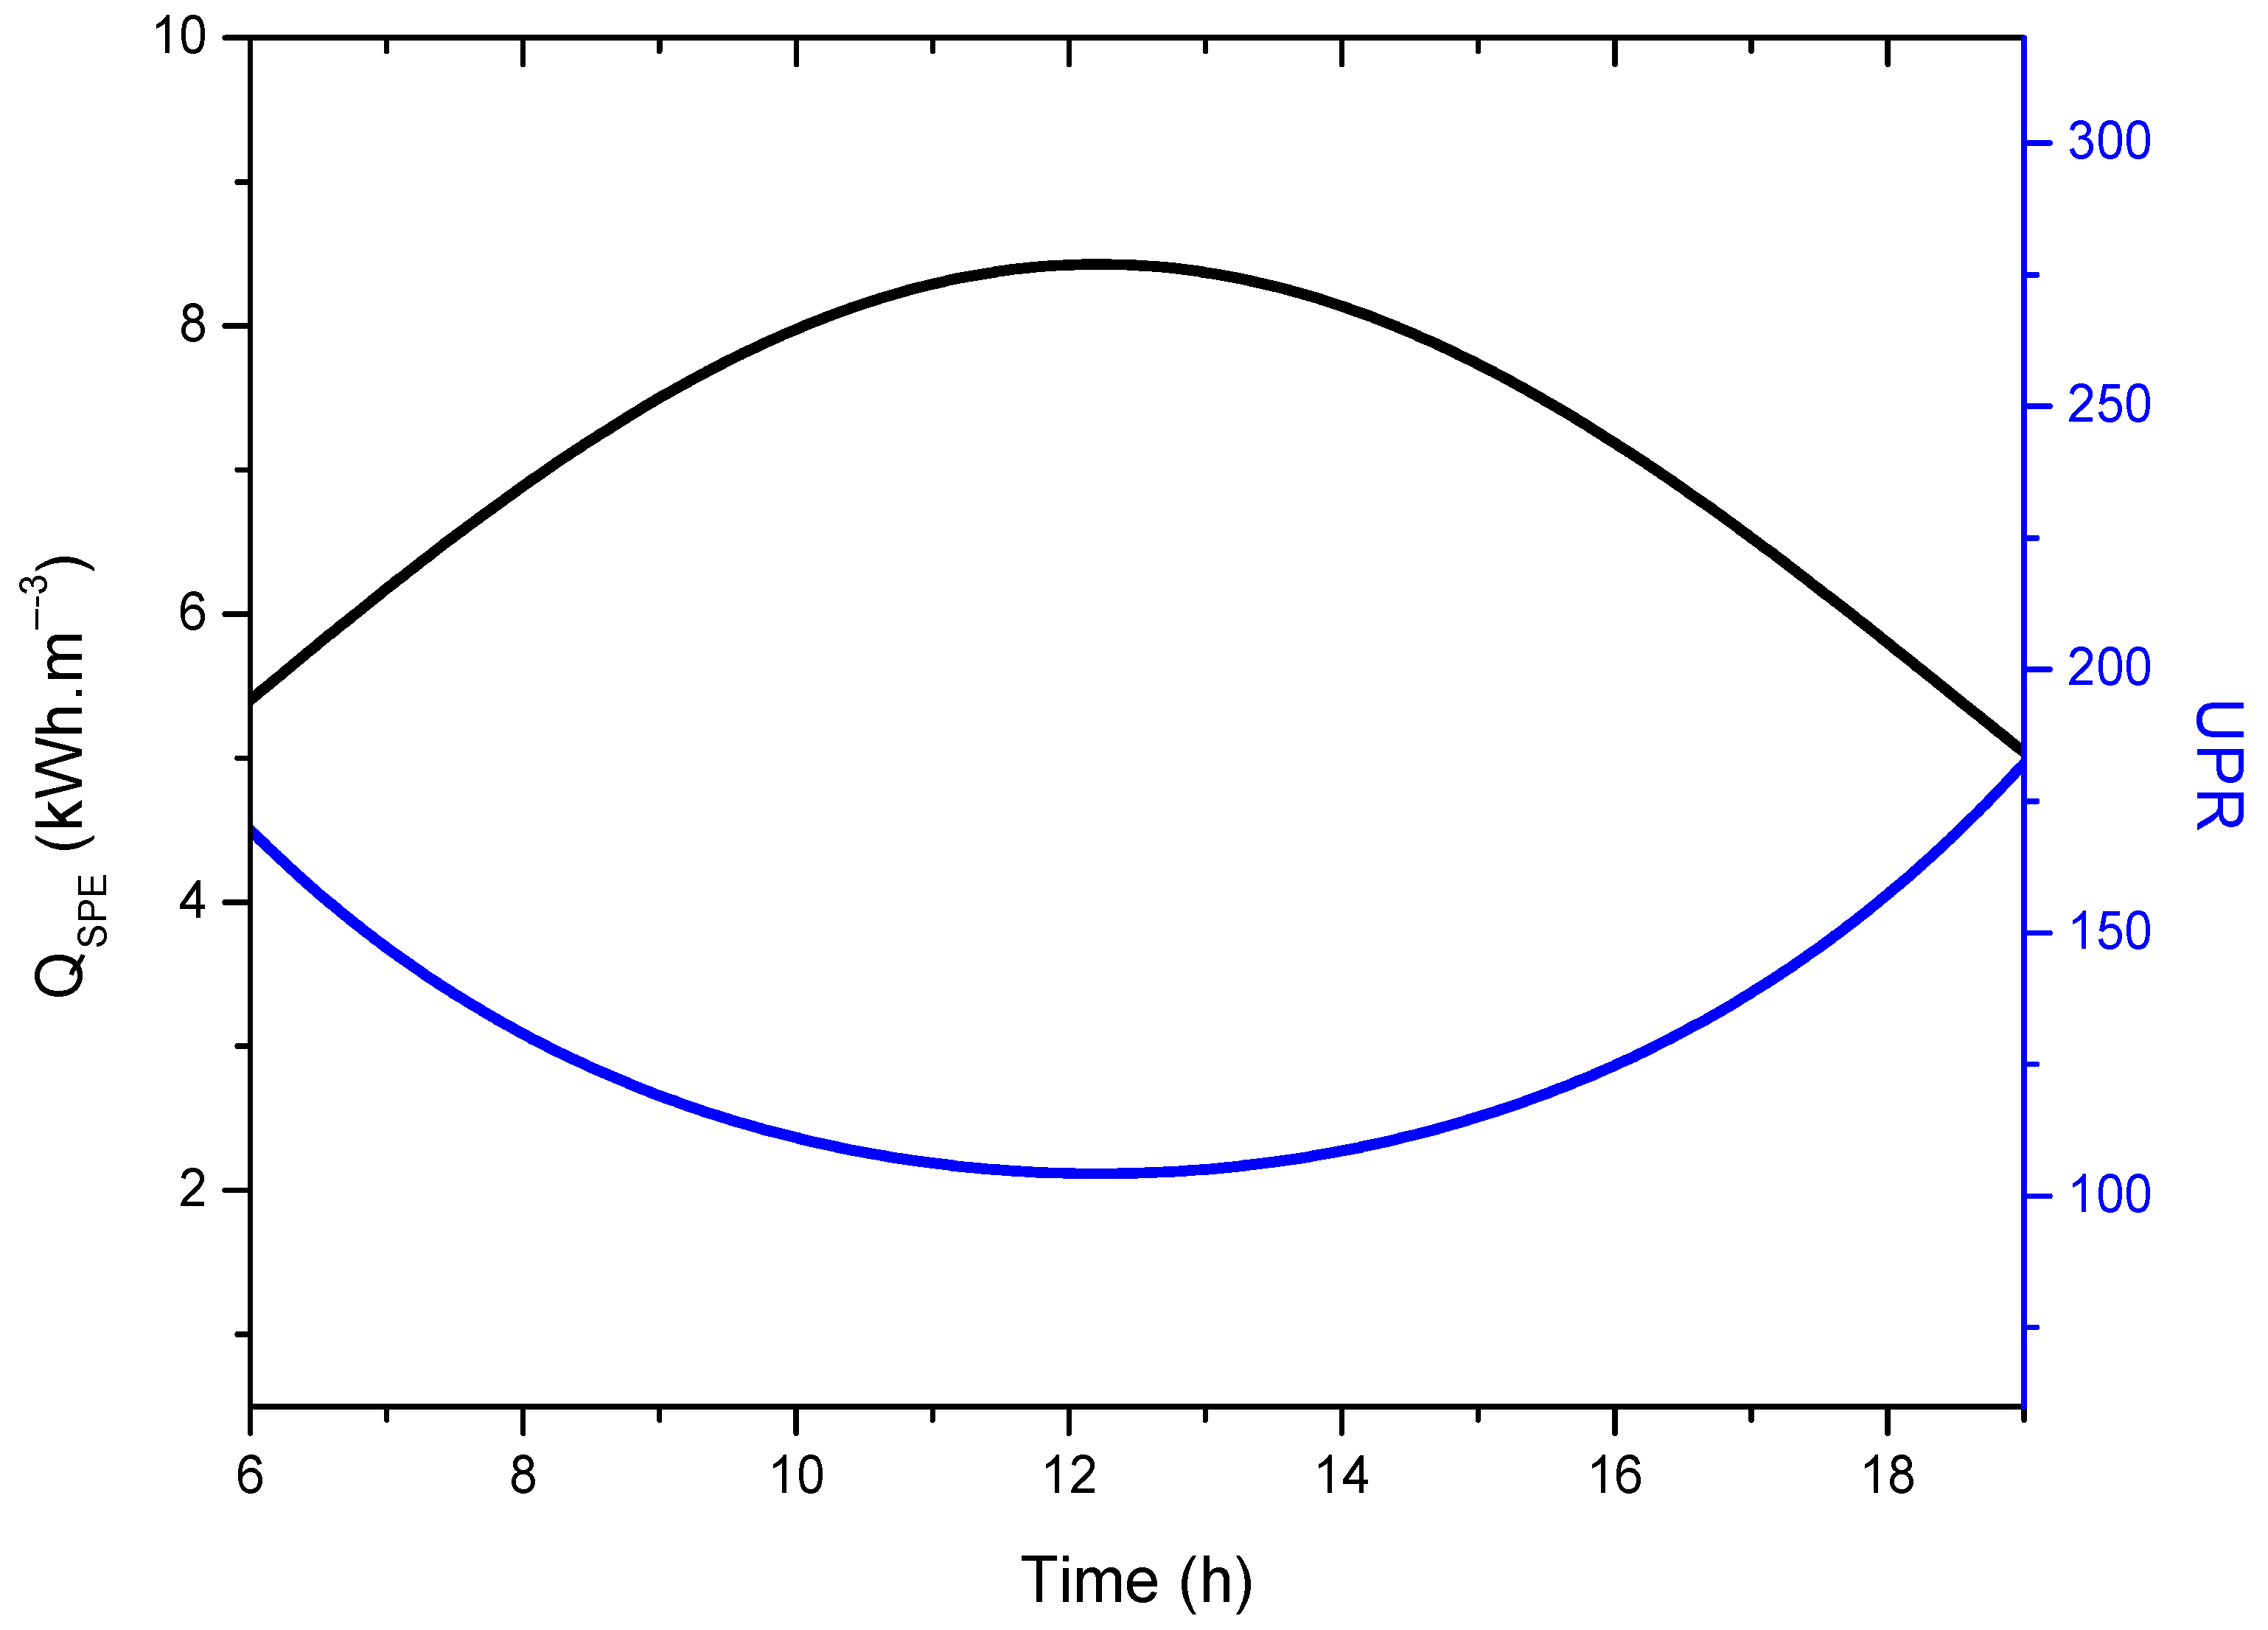
  • The results also confirm that the solar AGMD process is operating at 20.43% of the thermodynamic limit of UPR, which is unsustainable for future desalinated water supplies; therefore, there are a lot of opportunities to improve desalination system performance to achieve UPR at greater rates by hybridizing existing processes and developing better materials.
Finally, the outcomes derived from this study suggest that the design and operation of the AGMD solar water desalination system can be improved by exploring various ways to optimize its operating parameters. Additional research will be conducted to enhance its thermodynamic efficiency and overall economic and environmental impact and to examine the possibility of integrating the solar AGMD system with other systems.

Author Contributions

Conceptualization, N.M., Z.T., A.-E.B., H.T., A.A., S.C., N.B., M.K., J.Z., A.A.A. and L.M.; Methodology, N.M., Z.T., A.-E.B., A.A., J.Z. and A.A.A.; Software, N.M., Z.T., H.T., N.B. and J.Z.; Validation, N.M., Z.T., A.-E.B., H.T., A.A., S.C., A.H., M.K., J.Z., A.A.A. and L.M.; Formal analysis, N.M., Z.T., A.-E.B., H.T., A.A., S.C., A.H., N.B., M.K., J.Z., A.A.A. and L.M.; Investigation, N.M., Z.T., A.-E.B., A.A., A.H., N.B., M.K., A.A.A. and L.M.; Resources, N.M., Z.T., A.-E.B. and A.A.; Data curation, N.M., Z.T., A.-E.B., H.T. and A.A.; Writing—original draft, N.M. and Z.T.; Writing—review & editing, A.-E.B., H.T., A.A., M.K., J.Z., A.A.A. and L.M.; Visualization, N.M., Z.T., A.-E.B., H.T., A.A., S.C., A.H., N.B., M.K., J.Z., A.A.A. and L.M.; Supervision, Z.T., A.-E.B. and A.A.; Project administration, Z.T., A.-E.B., A.A., J.Z. and L.M. All authors have read and agreed to the published version of the manuscript.

Funding

This work was supported by the Biomaterials and Transport Phenomena Laboratory agreement N° 303 03-12-2003 at the University of Medea. The authors acknowledge and gratefully thank the financial support provided by DG-RSDT of Algeria.

Data Availability Statement

Not applicable.

Conflicts of Interest

The authors declare no conflict of interest.

Nomenclature

Asurface area [m2]
Bwmass transfer coefficient [kg.m−2.h−1.Pa−1]
Cpthermal capacity [J.kg−1·K−1]
Dvathermal diffusivity of water vapor in the air [m2.s−1]
dhhydraulic diameter [m]
Lmodule length [m]
m ˙ mass flow rate [kg.s−1]
Ppressure [Pa]
PRPerformance Ratio [–]
Rthermal resistance [m2·K.W−1]
Ssalinity [g.kg−1]
Ttemperature [°C]
Ttime [s]
Uheat transfer coefficient [W.m−2·K−1]
W ˙ m i n Minimum work (kW)
Greek letters
αactivity coefficient [–]
βwater fraction [–]
δthickness [m]
εporosity [–]
ŋEfficiency
μdynamic viscosity [kg.m−1·s−1]
ρdensity [kg.m−3]
τtortuosity [–]
φthermal flux [W.m−2]
Subscripts
0reference state
aAir
agair gap
cCold
evEvaporator
exExergy
EFeed
hHot
hmhot fluid-membrane interface
InInlet
mMembrane
mamembrane-air gap interface
outOutlet
PPermeate
pccold fluid-plate interface
pptemperature at the permeate-plate interface
SoSource
swSeawater
thThermal
vVapor

References

  1. Kanoglu, M.; Dincer, I.; Rosen, M.A. Understanding Energy and Exergy Efficiencies for Improved Energy Management in Power Plants. Energy Policy 2007, 35, 3967–3978. [Google Scholar] [CrossRef]
  2. Tsatsaronis, G. Definitions and Nomenclature in Exergy Analysis and Exergoeconomics. Energy 2007, 32, 249–253. [Google Scholar] [CrossRef]
  3. Kerme, E.D.; Orfi, J.; Fung, A.S.; Salilih, E.M.; Khan, S.U.-D.; Alshehri, H.; Ali, E.; Alrasheed, M. Energetic and Exergetic Performance Analysis of a Solar Driven Power, Desalination and Cooling Poly-Generation System. Energy 2020, 196, 117150. [Google Scholar] [CrossRef]
  4. Guillén-Burrieza, E.; Blanco, J.; Zaragoza, G.; Alarcón, D.-C.; Palenzuela, P.; Ibarra, M.; Gernjak, W. Experimental Analysis of an Air Gap Membrane Distillation Solar Desalination Pilot System. J. Membr. Sci. 2011, 379, 386–396. [Google Scholar] [CrossRef]
  5. Moudjeber, D.-E.; Ruiz-Aguirre, A.; Ugarte-Judge, D.; Mahmoudi, H.; Zaragoza, G. Solar Desalination by Air-Gap Membrane Distillation: A Case Study from Algeria. Desalination Water Treat. 2016, 57, 22718–22725. [Google Scholar] [CrossRef]
  6. Sandid, A.; Nehari, D.; Elmeriah, A.; Remlaoui, A. Dynamic Simulation of an Air-Gap Membrane Distillation (AGMD) Process Using Photovoltaic Panels System and Flat Plate Collectors. J. Therm. Eng. 2021, 7, 117–133. [Google Scholar] [CrossRef]
  7. Sandida, A.M.; Neharia, T.; Neharia, D. Simulation Study of an Air-Gap Membrane Distillation System for Seawater Desalination Using Solar Energy. Desalination Water Treat. 2021, 229, 40–51. [Google Scholar] [CrossRef]
  8. Shahzad, M.W.; Burhan, M.; Ang, L.; Ng, K.C. Energy-Water-Environment Nexus Underpinning Future Desalination Sustainability. Desalination 2017, 413, 52–64. [Google Scholar] [CrossRef]
  9. Mericq, J.-P.; Laborie, S.; Cabassud, C. Evaluation of Systems Coupling Vacuum Membrane Distillation and Solar Energy for Seawater Desalination. Chem. Eng. J. 2011, 166, 596–606. [Google Scholar] [CrossRef]
  10. Frikha, N.; Matlaya, R.; Chaouachi, B.; Gabsi, S. Simulation of an Autonomous Solar Vacuum Membrane Distillation for Seawater Desalination. Desalination Water Treat. 2014, 52, 1725–1734. [Google Scholar] [CrossRef]
  11. Chen, T.-C.; Ho, C.-D. Immediate Assisted Solar Direct Contact Membrane Distillation in Saline Water Desalination. J. Membr. Sci. 2010, 358, 122–130. [Google Scholar] [CrossRef]
  12. Shim, W.G.; He, K.; Gray, S.; Moon, I.S. Solar Energy Assisted Direct Contact Membrane Distillation (DCMD) Process for Seawater Desalination. Sep. Purif. Technol. 2015, 143, 94–104. [Google Scholar] [CrossRef]
  13. Li, G.; Lu, L. Modeling and Performance Analysis of a Fully Solar-Powered Stand-Alone Sweeping Gas Membrane Distillation Desalination System for Island and Coastal Households. Energy Convers. Manag. 2020, 205, 112375. [Google Scholar] [CrossRef]
  14. Signorato, F.; Morciano, M.; Bergamasco, L.; Fasano, M.; Asinari, P. Exergy Analysis of Solar Desalination Systems Based on Passive Multi-Effect Membrane Distillation. Energy Rep. 2020, 6, 445–454. [Google Scholar] [CrossRef]
  15. Reddy, V.S.; Kaushik, S.C.; Tyagi, S.K. Exergetic Analysis and Performance Evaluation of Parabolic Trough Concentrating Solar Thermal Power Plant (PTCSTPP). Energy 2012, 39, 258–273. [Google Scholar] [CrossRef]
  16. He, Z.; Liang, C. Experimental Study on Energy and Exergy Analysis of a Counter Hollow Fiber Membrane-Based Humidifier. Int. J. Energy Power Eng. 2020, 9, 95–107. [Google Scholar] [CrossRef]
  17. Abdallah, S.B.; Frikha, N.; Gabsi, S. Simulation of Solar Vacuum Membrane Distillation Unit. Desalination 2013, 324, 87–92. [Google Scholar] [CrossRef]
  18. Zhai, H.; Dai, Y.J.; Wu, J.Y.; Wang, R.Z. Energy and Exergy Analyses on a Novel Hybrid Solar Heating, Cooling and Power Generation System for Remote Areas. Appl. Energy 2009, 86, 1395–1404. [Google Scholar] [CrossRef]
  19. Kalogirou, S.A.; Karellas, S.; Braimakis, K.; Stanciu, C.; Badescu, V. Exergy Analysis of Solar Thermal Collectors and Processes. Prog. Energy Combust. Sci. 2016, 56, 106–137. [Google Scholar] [CrossRef]
  20. KhoshgoftarManesh, M.H.; Onishi, V.C. Energy, Exergy, and Thermo-Economic Analysis of Renewable Energy-Driven Polygeneration Systems for Sustainable Desalination. Processes 2021, 9, 210. [Google Scholar] [CrossRef]
  21. Banat, F.; Jwaied, N. Exergy Analysis of Desalination by Solar-Powered Membrane Distillation Units. Desalination 2008, 230, 27–40. [Google Scholar] [CrossRef]
  22. Al-Obaidani, S.; Curcio, E.; Macedonio, F.; Di Profio, G.; Al-Hinai, H.; Drioli, E. Potential of Membrane Distillation in Seawater Desalination: Thermal Efficiency, Sensitivity Study and Cost Estimation. J. Membr. Sci. 2008, 323, 85–98. [Google Scholar] [CrossRef]
  23. Tian, Y.; Zhao, C.-Y. A Review of Solar Collectors and Thermal Energy Storage in Solar Thermal Applications. Appl. Energy 2013, 104, 538–553. [Google Scholar] [CrossRef] [Green Version]
  24. Shahzad, M.W.; Thu, K.; Kim, Y.; Ng, K.C. An Experimental Investigation on MEDAD Hybrid Desalination Cycle. Appl. Energy 2015, 148, 273–281. [Google Scholar] [CrossRef]
  25. Ng, K.C.; Thu, K.; Oh, S.J.; Ang, L.; Shahzad, M.W.; Ismail, A.B. Recent Developments in Thermally-Driven Seawater Desalination: Energy Efficiency Improvement by Hybridization of the MED and AD Cycles. Desalination 2015, 356, 255–270. [Google Scholar] [CrossRef]
  26. Shahzad, M.W.; Ng, K.C.; Thu, K.; Saha, B.B.; Chun, W.G. Multi Effect Desalination and Adsorption Desalination (MEDAD): A Hybrid Desalination Method. Appl. Therm. Eng. 2014, 72, 289–297. [Google Scholar] [CrossRef]
  27. Son, H.S.; Shahzad, M.W.; Ghaffour, N.; Ng, K.C. Pilot Studies on Synergetic Impacts of Energy Utilization in Hybrid Desalination System: Multi-Effect Distillation and Adsorption Cycle (MED-AD). Desalination 2020, 477, 114266. [Google Scholar] [CrossRef]
  28. Shahzad, M.W.; Burhan, M.; Ng, K.C. Pushing Desalination Recovery to the Maximum Limit: Membrane and Thermal Processes Integration. Desalination 2017, 416, 54–64. [Google Scholar] [CrossRef]
  29. Criscuoli, A.; Drioli, E. Energetic and Exergetic Analysis of an Integrated Membrane Desalination System. Desalination 1999, 124, 243–249. [Google Scholar] [CrossRef]
  30. Macedonio, F.; Drioli, E. An Exergetic Analysis of a Membrane Desalination System. Desalination 2010, 261, 293–299. [Google Scholar] [CrossRef]
  31. Macedonio, F.; Curcio, E.; Drioli, E. Integrated Membrane Systems for Seawater Desalination: Energetic and Exergetic Analysis, Economic Evaluation, Experimental Study. Desalination 2007, 203, 260–276. [Google Scholar] [CrossRef]
  32. Wang, Q.; Hu, M.; Yang, H.; Cao, J.; Li, J.; Su, Y.; Pei, G. Energetic and Exergetic Analyses on Structural Optimized Parabolic Trough Solar Receivers in a Concentrated Solar–Thermal Collector System. Energy 2019, 171, 611–623. [Google Scholar] [CrossRef]
  33. Choi, J.; Choi, Y.; Lee, J.; Kim, Y.; Lee, S. Exergy Analysis of a Direct Contact Membrane Distillation (DCMD) System Based on Computational Fluid Dynamics (CFD). Membranes 2021, 11, 525. [Google Scholar] [CrossRef] [PubMed]
  34. Miladi, R.; Frikha, N.; Gabsi, S. Exergy Analysis of a Solar-Powered Vacuum Membrane Distillation Unit Using Two Models. Energy 2017, 120, 872–883. [Google Scholar] [CrossRef]
  35. Miladi, R.; Frikha, N.; Kheiri, A.; Gabsi, S. Energetic Performance Analysis of Seawater Desalination with a Solar Membrane Distillation. Energy Convers. Manag. 2019, 185, 143–154. [Google Scholar] [CrossRef]
  36. Miladi, R.; Frikha, N.; Gabsi, S. Modeling and Energy Analysis of a Solar Thermal Vacuum Membrane Distillation Coupled with a Liquid Ring Vacuum Pump. Renew. Energy 2021, 164, 1395–1407. [Google Scholar] [CrossRef]
  37. Elan, D.; Chung, W. (12) Patent Application Publication (10). U.S. Patent 2016/0074812 A1, 7 July.
  38. Woldemariam, D.; Martin, A.; Santarelli, M. Applied sciences Exergy Analysis of Air-Gap Membrane Distillation Systems for Water Purification Applications. Appl. Sci. 2017, 7, 301. [Google Scholar] [CrossRef] [Green Version]
  39. Ali, A.; Tufa, R.A.; Macedonio, F.; Curcio, E.; Drioli, E. Membrane technology in renewable-energy-driven desalination. Renew. Sustain. Energy Rev. 2018, 81, 1–21. [Google Scholar] [CrossRef]
  40. Ihm, S.; Al-Najdi, O.Y.; Hamed, O.A.; Jun, G.; Chung, H. Energy cost comparison between MSF, MED and SWRO: Case studies for dual purpose plants. Desalination 2016, 397, 116–125. [Google Scholar] [CrossRef]
  41. Khayet, M. Membranes and theoretical modeling of membrane distillation: A review. Adv. Colloid Interface Sci. 2011, 164, 56–88. [Google Scholar] [CrossRef]
  42. Guillén-Burrieza, E.; Alarcón-Padilla, D.-C.; Palenzuela, P.; Zaragoza, G. Technoeconomic assessment of a pilot-scale plant for solar desalination based on existing plate and frame MD technology. Desalination 2015, 374, 70–80. [Google Scholar] [CrossRef]
  43. Saffarini, R.B.; Summers, E.K.; Arafat, H.A.; Lienhard, J.H. Economic evaluation of stand-alone solar powered membrane distillation systems. Desalination 2012, 299, 55–62. [Google Scholar] [CrossRef]
  44. Banat, F.; Jwaied, N. Economic evaluation of desalination by small-scale autonomous solar-powered membrane distillation units. Desalination 2008, 220, 566–573. [Google Scholar] [CrossRef]
  45. Cerci, Y. Exergy analysis of a reverse osmosis desalination plant in California. Desalination 2002, 142, 257–266. [Google Scholar] [CrossRef]
  46. Drioli, E.; Curcio, E.; Di Profio, G.; Macedonio, F.; Criscuoli, A. Integrating Membrane Contactors Technology and Pressure-Driven Membrane Operations for Seawater Desalination. Chem. Eng. Res. Des. 2006, 84, 209–220. [Google Scholar] [CrossRef]
  47. Menasri, R.; Triki, Z.; Bouaziz, M.N.; Hamrouni, B. Energy and exergy analyses of a novel multi-effect distillation system with thermal vapor compression for seawater desalination. Desalination Water Treat. 2022, 246, 54–67. [Google Scholar] [CrossRef]
  48. Diaby, A.T.; Byrne, P.; Loulergue, P.; Balannec, B.; Szymczyk, A.; Maré, T.; Sow, O. Design Study of the Coupling of an Air Gap Membrane Distillation Unit to an Air Conditioner. Desalination 2017, 420, 308–317. [Google Scholar] [CrossRef]
  49. Shahzad, M.W.; Burhan, M.; Son, H.S.; Oh, S.J.; Ng, K.C. Desalination Processes Evaluation at Common Platform: A Universal Performance Ratio (UPR) Method. Appl. Therm. Eng. 2018, 134, 62–67. [Google Scholar] [CrossRef] [Green Version]
  50. Ng, K.C.; Shahzad, M.W.; Son, H.S.; Hamed, O.A. An Exergy Approach to Efficiency Evaluation of Desalination. Appl. Phys. Lett. 2017, 110, 184101. [Google Scholar] [CrossRef] [Green Version]
  51. Baaloudj, O.; Nasrallah, N.; Kebir, M.; Guedioura, B.; Amrane, A.; Nguyen-Tri, P.; Nanda, S.; Assadi, A.A. Artificial neural network modeling of cefixime photodegradation by synthesized CoBi2O4 nanoparticles. Environ. Sci. Pollut. Res. 2021, 28, 15436–15452. [Google Scholar] [CrossRef]
  52. Terzi, R. Application of Exergy Analysis to to Energy Systems. In Application of Exergy; InTech: London, UK, 2018; p. 109. [Google Scholar] [CrossRef] [Green Version]
  53. Sharqawy, M.H.; Lienhard, J.H.; Zubair, S.M. Thermophysical Properties of Seawater: A Review of Existing Correlations and Data. Desalination Water Treat. 2010, 16, 354–380. [Google Scholar] [CrossRef]
  54. Alsaadi, A.S.; Ghaffour, N.; Li, J.-D.; Gray, S.; Francis, L.; Maab, H.; Amy, G.L. Modeling of Air-Gap Membrane Distillation Process: A Theoretical and Experimental Study. J. Membr. Sci. 2013, 445, 53–65. [Google Scholar] [CrossRef] [Green Version]
  55. Banat, F.A. Membrane Distillation for Desalination and Removal of Volatile Organic Compounds from Water. Ph.D. Dissertation, Department of Chemical Engineering, McGill University, Montreal, QC, Canada, 1994. [Google Scholar]
  56. Rahimi-Ahar, Z.; Hatamipour, M.S.; Ahar, L.R. Air Humidification-Dehumidification Process for Desalination: A Review. Prog. Energy Combust. Sci. 2020, 80, 100850. [Google Scholar] [CrossRef]
Figure 1. Schematic diagram of the AGMD process.
Water 15 01201 g001
Figure 2. Evolution of permeate flux as a function of feed temperature [48].
Water 15 01201 g002
Figure 3. Annual temperature and solar radiation evolution (Ghardaïa site).
Water 15 01201 g003
Figure 4. Environmental conditions on 21 July (Ghardaïa site).
Water 15 01201 g004
Figure 5. Variation of output inlet temperatures of the hot channel over the local time.
Water 15 01201 g005
Figure 6. Variation of permeate flux and GOR over the local time.
Water 15 01201 g006
Figure 7. Variation of performance ratio over the local time.
Water 15 01201 g007
Figure 8. Variation of UPR% of thermodynamic limit and the thermodynamic limit over the local time.
Water 15 01201 g008
Figure 9. Variation of Standard Primary Energy and Universal Performance Ratio over the local time.
Water 15 01201 g009
Figure 10. Variation of exergy efficiency of AGMD andthe minimum separation work with time.
Water 15 01201 g010
Figure 11. Variation of the collector energy efficiency variation with a solar with time.
Water 15 01201 g011
Figure 12. Variation of the collector exergy efficiency variation with a solar with time.
Water 15 01201 g012
Figure 13. Rates of exergy destruction in the solar AGMD system components.
Water 15 01201 g013
Table 1. Summary of exergy efficiency for different MD configurations from the literature.
TypeCapacity (m3/Day)Exergy Efficiency (%)Reference
RO72504.3[43]
MD on RO retentate22,34419.1–21.9[44]
MED-TVC4,802,9763.6[45]
MD0.310.3[46]
DCMD with HR24,00028.3[22]
DCMD without HR24,00025.6[22]
AGMD (Xzero)0.22–0.738.54–19.32[38]
AGMD (Elixir500)0.1–0.1718.3–26.5[38]
Table 2. Mass and energy balance model equations [48].
AGMD Unit
Heat transfer
ParameterEquationNo.
Energy conservation φ h = φ m = φ a g = φ p = φ c (1)
Heat flux in the hot channel φ h = h C h ( T h T h m ) (2)
Heat flux from the surface of the membrane to the condensate φ m = 1 R m T T h m T m g + J w   .   Δ H v (3)
Heat flux through the air gap φ a g = 1 R a g T m g T p (4)
Heat flux in the boundary layer of the cold channel φ c = h c c T p T c (5)
Mass transfer
Permeate flux J w = B w α β P h m P p (6)
Antoine equation P = e x p ( 23.1964 3816.44 T 46.13 ) (7)
Permeability of the membrane B w = ε   M   P   D v a R     T m   δ m τ + δ a g   P   a   l n , a (8)
Heat exchangers
Heat exchanged φ = F × U × A × L M D T (9)
φ = m ˙ s o × C p , s o × A × Δ T s o (10)
φ = m r × Δ H r (11)
Solar Flat Plate Collector
Energy gained by the absorber Q r = α τ e f f   I T (12)
Quantity of solar radiation received by the collector Q i = I T × A c (13)
Energy gained by the absorber Q 0 = U L A c   T c T a (14)
Useful energy absorbed by the collector Q u = Q r Q 0 = α τ e f f   I T   A c U L A c   T c T a (15)
Collector heat removal factor F R = m ˙ C p   T 0 T i α τ e f f   I T   A c U L T i T a (16)
Ratio of useable energy gain η = F R   A [ α τ e f f F R U L T i T a I T ] (17)
Table 3. Characteristic of the used membrane [48].
PropertiesValue
Thickness0.28
Pore size0.2
Porosity80
Tortuosity1.5
Table 4. Solar AGMD system operating conditions obtained from thermodynamic analysis (maximum values).
NTemperature (K)Mass Fow Rate
(kg/s)
Salinity
(g/kg)
Enthalpy
(kJ/kg.K)
Entropy
(kJ/kg)
Exergy
(kW)
187.50.0240385.581.26190.556
262.660.0240262.080.86420.2344
362.690.0240262.470.86520.2352
462.950.0330.35117.760.40970
529.80.0330.35118.960.41370.2036
657.910.0330.35151.430.51950.0158
762.110.0330.35248.60.82020.2260
858.770.030.43232.220.77600.1863
958.840.030.43232.50.76680.1872
1029.700.0030124.520.43170.030
1129.880.0030125.280.43420.0310
1229.80.0030125.170.42600.0303
1329.80.030.43118.040.40760.1510
Disclaimer/Publisher’s Note: The statements, opinions and data contained in all publications are solely those of the individual author(s) and contributor(s) and not of MDPI and/or the editor(s). MDPI and/or the editor(s) disclaim responsibility for any injury to people or property resulting from any ideas, methods, instructions or products referred to in the content.

