Article

Photocatalytic Decolorization of Direct Red16 from an Aqueous Solution Using B-ZnO/TiO2 Nano Photocatalyst: Synthesis, Characterization, Process Modeling, and Optimization

by
Saba Abdulmunem Habeeb
1,2,
Ali Akbar Zinatizadeh
1,3,4,* and
Hadis Zangeneh
5
1
Department of Applied Chemistry, Faculty of Chemistry, Razi University, Kermanshah 67187-73654, Iran
2
Department of Pharmaceutical Chemistry, Faculty of Pharmacy, University of Babylon, Babylon 51002, Iraq
3
Environmental Pollution and Engineering Group, Environmental Research Center (ERC), Razi University, Kermanshah 67187-73654, Iran
4
Australian Centre for Water and Environmental Biotechnology (ACWEB, formerly AWMC), Gehrmann Building, The University of Queensland, St. Lucia, Brisbane 4072, Australia
5
Department of Chemical Engineering, Isfahan University of Technology, Isfahan 84156-83111, Iran
*
Author to whom correspondence should be addressed.
Water 2023, 15(6), 1203; https://doi.org/10.3390/w15061203
Submission received: 16 January 2023 / Revised: 25 February 2023 / Accepted: 3 March 2023 / Published: 20 March 2023

Abstract

:
The aim of this study was to modify the TiO2 photocatalyst with different amounts of ZnO (0.25, 0.5, and 1 wt. %) and B (1, 5, and 10 wt. %), as B-ZnO/TiO2, for mineralization and photodegradation of direct red 16 (DR16). B-ZnO/TiO2 was synthesized by the sol-gel method and the composite with 5 wt. % of B and 0.5 wt. % of ZnO was selected as the optimal composition, based on DR16 removal experiments. Th results showed that the removal efficiencies for optimum amounts of B and ZnO were 47 and 87 % in B-TiO2 and B-ZnO/TiO2 composition, respectively. The structural and chemical characteristics, modeling and optimization of the operating variables, adsorptive behavior, and reusability of the synthesized photocatalyst were evaluated. The acquired findings confirmed the generation of an amorphous phase with a low recombination rate and an improvement of photodegradation efficiency under visible light irradiation. The effects of (NH4)2S2O8, H2O2, KCl, and KHCO3 salts on dye photocatalytic removal were evaluated, and the maximum positive effect was observed using (NH4)2S2O8. The results of optimization of the operational variables and their optimum values proved that an increase in B-ZnO/TiO2 loading, reaction time, LED intensity, and a decrease in DR16 concentration and initial pH, improved the removal efficiency. The maximum DR16 degradation (100%) was obtained in the presence of 10 ppm DR16 and 1 g/L B5%-ZnO0.5%/TiO2, at pH 3, under visible light irradiation, after 200 min. The DR16 adsorption process by the B-ZnO/TiO2 followed a pseudo-second-order model. The mechanism of the photodegradation of DR16 dye was ascribed to the absorbed h+ and OH active species. According to the results, the B-ZnO/TiO2 photocatalyst can be considered as a promising candidate for actual dye removal under visible light irradiation.

1. Introduction

Dyes, detergents, acids, organic compounds, and heavy metals are ingredients of textile industry effluent that can cause serious environmental problems. Dye treatment before discharging effluent into the aquatic medium is mandatory, due to their serious ecological effects. Nowadays, various physico-chemical methods are applied for dye removal [1,2]. Azo dyes, with the presence of one or more azo bonds (–N=N–) in their molecular structure, as one group of synthetic dyes, have various applications in diverse industries. Azo dyes including methylene blue, methyl red, Rhodamine B, DR16, etc., which have high solubility in water, are common pollutants of industrial wastewaters. On the other hand, the resistance of these dyes to biological processes, and their carcinogenicity and toxicity to biological organisms, affords serious hazards to aquatic organisms and human life. So, removing these pollutants from water resources is a serious challenge for environmental scientists [3,4]. Various physical (adsorption, membrane filtration, and UV irradiation), chemical (chemical oxidation, ozonation, chlorination, and advanced oxidation), and biological techniques have been examined for removing textile dyes from industrial wastewater [4]. Among these methods, advanced oxidation processes (AOPs) have been described as efficient techniques for the removal of resistant pollutants [5,6].
It seems that the only way to deal with dyes is through biological and advanced oxidation processes. These processes can degrade the organic pollutants into harmless inorganic substances, such as H2O and CO2, under mild conditions. Moreover, advanced oxidation processes for wastewater treatment containing organic dyes are prevalent. The basis of AOPs performance is the generation of strong oxidizing radicals [7]. The utilization of powerful and nonselective oxidants, that can decompose most organic compounds (e.g., OH), is the key feature of AOPs for the degradation of contaminants in water [8,9]. The role of photocatalysis and other advanced oxidation processes (AOPs) in dealing with the challenge of drinking water supply is undeniable. Abundant research on air and water purification confirms that photocatalytic oxidation reactions are eco-friendly and green techniques. They have the potential to completely mineralize organic compounds into safe and harmless materials [9,10]. Semiconductor photocatalysts have many applications in the removal of environmental pollutants such as air purification and water and wastewater treatments, due to their unique optical and electrical properties. Titanium dioxide (TiO2) seems to be the most suitable semiconductor photocatalyst for environmental applications, due to its properties such as biological and chemical stability, high oxidation power, nontoxicity, and affordable price [11,12]. However, anatase TiO2 can be excited only by UV light irradiation, because of its bandgap (3.2 eV), which limits its performance under solar light irradiation. In addition, TiO2 exhibits a low quantum efficiency and limited photocatalytic activity, due to the high recombination rate of electron–hole pairs [13,14]. Zinc oxide (ZnO) is an attractive candidate for the degradation of various environmental pollutants with different sources [15].
ZnO is an n-type semiconductor, that has various applications in solar cells, optical and antibacterial coatings, photocatalysts, electric devices, gas sensors, etc., due to its significant properties, such as a wide band gap (3.3 eV), large excitation binding energy (60 mV), and eco-friendly nature [16]. Two-component catalysts, with essentially enhanced photocatalytic features, are a promising methodology to increase the photocatalytic activity [16]. A bicomponent semiconductor photocatalyst of ZnO/TiO2 has been studied in different research, and some achievements were obtained. The ZnO/TiO2 nanocomposite film was prepared via the sol-gel process, which is a popular route applied to prepare nanomaterial with the significant advantages of high purity, good structural uniformity, low-temperature synthesis, and easily controlled reaction conditions [15]. The ZnO/TiO2 heterojunction has not just got a productive e/h+ pair, with the best response, but also brings wrinkle and imperfection contact into the band gap of TiO2, which may minimize the band gap of TiO2 and lower the excitation energy of the catalyst. Then again, the coupling can slow the transition cycle for e/h+ pairs, consequently diminishing their chance of recombination [16,17,18].
To overcome the photocatalytic limitations of TiO2 and make optimum use of solar light, several methods have been proposed: doping metal ions, doping non-metal substances, combining TiO2 with other semiconductors, sensitizing TiO2 with dyes, and doping with up conversion luminescence agents. The better performance of TiO2 doped with non-metals is explained by three mechanisms: (a) bandgap narrowing, (b) impurity energy levels, and (c) oxygen vacancies. It was reported that all these three mechanisms could occur when non-metals such as B, C, F, N, S, and others were doped into TiO2 in substitutional or interstitial modes. Because of the atomic size and electronic structure of B, B doping has attracted much attention. TiO2 doped with B, demonstrates an increased thermal stability and reduced carrier recombination center. Furthermore, the introduction of B leads to the effective separation of photogenerated charges in TiO2, enhanced grain size, and increased surface area [19,20,21]. The composite of TiO2 with other semiconductors can also improve photocatalytic performance by preventing the recombination of charge carriers. Various methods were used for nanocomposite synthesis including hydrolysis deposition, thermal chemical vapor deposition, radio frequency magnetron sputtering, spray pyrolysis, and sol-gel methods [19].
In this study, the B-ZnO/TiO2 nanocomposite was synthesized by the sol-gel approach, as an economical industrial method. Where different weight ratios of boron and zinc oxide were loaded on the titanium oxide crystal lattice. The efficiency of the catalyst was examined in its removal of azo dye from an aqueous solution. With this goal, five process and operating variables were studied, in a specific range for each of them, to estimate which variables improve the efficiency of the catalyst at removing direct red 16 dye. For the same purpose, a number of acceptor electron reagents were added to measure their effect on the performance of the B-ZnO/TiO2. The isotherm adsorption, mechanism, and reusability of the B-ZnO/TiO2 were also evaluated during this study.

2. Experimental

2.1. Materials

Tetra-n-butyl orthotitanate (C16H36O4Ti, TBOT, 99.0%) was purchased from Sigma-Aldrich company. Boric acid (H3BO3), acetic acid (CH3COOH), zinc nitrate hexahydrate (Zn (NO3)2. 6H2O), diethanolamine (C4H11NO2 99.3%), hydrogen peroxide (H2O2, 35%), and ethanol (C2H5OH, 99%) were purchased from Sigma-Aldrich, United Kingdom. (NH4)2S2O8, KCl, KHCO3, ammonium oxalate ((NH4)2C2O4, AO), potassium dichromate (K2Cr2O7, PS), isopropanol alcohol (C3H8O, IPA), parabenzoquinone (C6H4O2, PBQ), and sodium azide (NaN3, SA), as trapping regents, and HCl (36%) and NaOH for controlling the pH of the media, were purchased from Merck, Germany.

2.2. Synthesis of TiO2, B-TiO2, ZnO/TiO2, and B-ZnO/TiO2

2.2.1. TiO2

To synthesize TiO2, 10 mL of TBOT was added to 34 mL ethanol under magnetic stirring for 30 min. Then a mixture of 9.8 mL acetic acid, 0.5 mL ultra-pure deionized water, and 10 mL ethanol, was added dropwise to the aforementioned yellow sol under continuous stirring (400 rpm). For aging, the obtained gel was kept overnight under stirring for 24 h in ambient conditions. The gel was dried in the oven at 80 °C for 24 h and finally calcined in the furnace at 500 °C for 150 min [20].

2.2.2. B-TiO2

The synthesis procedure of B-doped TiO2 was very similar to the pure TiO2 synthesis method. For doping B in TiO2, the ethanolic sol of H3BO3 (1, 5 and 10 wt.% B) was prepared and added to TiO2 sol before aging [21].

2.2.3. ZnO/TiO2

To prepare the bicomponent photocatalyst (ZnO/TiO2), the desired amounts of zinc nitrate hexahydrate (to prepare 0.25, 0.5, and 1 wt. % of ZnO) were dissolved in 10 mL ethanol, while stirring for 10 min. During the experiments, the photocatalysts were prepared several times with the above-mentioned preparation method, with consistent performance, indicating the repeatability of the methodology. A mixture of diethanolamine, ethanol, and ultra-pure distilled water was mixed with the above ethanoic solution gradually, under magnetic stirring, to obtain a milk-white sol of ZnO. The suspension was stirred for 2 h at room temperature and mixed with TiO2 sol before gelation and aging. The time and temperature of the drying and calcination steps were similar to pure TiO2 synthesis conditions [17].

2.2.4. B-ZnO/TiO2

After identifying the optimum amounts of B and ZnO for dye removal, the B-ZnO/TiO2 with the selected values of B and ZnO was synthesized by adding the ZnO and B sols to TiO2 sol under stirring [13,15].

2.3. Instruments for Analysis and Characterizations

The concentration of the DR16 in each sample was analyzed with a UV-1800 spectrophotometer (Shimadzu 1800), measuring the absorbance at λmax = 520 nm, a furnace for catalyst samples’ calcination (KSL-1200 made in USA), a pH meter, X-ray diffraction patterns (XRD) of samples were reordered at room temperature using a Rigaku D-max C III, X-ray diffractometer, with Ni-filtered Kα radiation and 2θ = 5–80°. The morphology of the synthesized photocatalysts was observed by field emission scanning electron microscopy (FESEM) (Philips XL 30 and S-4160). For evaluation of the particle size distribution, the analysis software of NIH Image J was used to process the surface morphology from the SEM images. The particle size measurement was repeated for 30 particles randomly and their average was reported. Photoluminescence (PL) spectra were obtained using a Perkin Elmer/LS55 fluorescence spectrometer, using a photomultiplier tube and monochromatic light from a 300 W Xenon lamp at room temperature. The zeta potential of the samples was measured via a UV–Vis spectrophotometer (Shimadzu 1800) at various pH values, of 3–13. The UV–Vis diffuse reflectance spectra (DRS) were carried out using a JS94H instrument.

2.4. Adsorption Activity Experiments

To study the adsorption activity of the B-ZnO/TiO2, a 250 mL Erlenmeyer glass flask was used as a reactor. A volume of 100 mL solution, with different concentrations of DR16, was used at pH = 3 (by adding 0.1 N HCl), with special amounts of the B-ZnO/TiO2 as adsorbent. The flask was fixed in an isotherm shaker to shake at 280 rpm speed for a specific reaction time, at room temperature. The adsorption capacity was calculated by the following equation:
e =   C 0 C e   V m
where C0 is the dye concentration before adsorption (ppm), Ce is the dye concentration after adsorption at equilibrium state (ppm), V is the volume of dye solution (L), and m is the mass of the B-ZnO/TiO2 (g).

2.5. Photocatalytic Activity Experiments

To study the photodegradation activity of the synthesized photocatalysts, a 250 mL cylindrical quartz reactor was used, in which the outer wall was coated with LEDs with three electric switches to control the light intensity (30, 50, and 70 W), with a temperature control system set at 25 °C. This reactor was placed on a magnetic stirrer in a black nonconductive wooden box, which was equipped with two fans on its upper wall.
The reactor was filled with 200 mL of direct red 16 (DR16) aqueous solution (10, 15, and 25 ppm) and catalyst (0.5, 1, 2 g/L). The pH of the solution was controlled by 0.1 N HCl and 0.1 N NaOH solutions. Before light irradiation, the mixture of dye solution and catalyst was kept in dark conditions under continuous stirring for 30 min, to reach the adsorption/desorption equilibrium. After regular irradiation time intervals (1 h), 5 mL of the treated solution was sampled, centrifuged (400 rpm), and analyzed. The dye concentration of the solution was calculated using the absorbance intensity of the dye solution at λmax = 520 nm, measured by a UV-Vis spectrophotometer (UV-1100, China). The dye removal percentage was obtained from the following equation:
Dye   removal   efficiency   ( % )   =   C 0 C t C 0 × 100
where C0 is the initial concentration of the DR16 solution (mg/L), and Ct is the dye concentration after a certain time (t). In addition, the trapping experiments of B-ZnO/TiO2 were applied under the same conditions, by adding the trapping reagent (5 mmol) to DR16 media (15 ppm).
To investigate the reusability of the B-ZnO/TiO2, the photocatalyst was used in four cycles under the optimum conditions (pH = 3, 70 W LED light irradiation, t = 5 h). These experiments were performed in two modes: (a) with reactivation of the photocatalyst after each cycle, and (b) without reactivation of the photocatalyst. For reactivation, the catalyst was stirred in 0.05 M H2O2 solution under UV irradiation for 4 h. Then, the suspension was filtered and the photocatalyst was dried at 100 °C, for 10 h.

2.6. Experimental Design Methodology

To design the photodegradation experiments, for mathematical modeling, and for data analysis, central composite design (CCD) from response surface methodology (RSM) was employed. The effects of the independent variables were modeled, and the optimum conditions of the process were explored. Pollutant concentration (DR16 concentration), catalyst concentration (B-ZnO/TiO2 loading), pH, irradiation time, and LED intensity were chosen as five influential processing parameters. The experimental range and independent variables’ levels are shown in Table 1. A total of 50 experimental runs were investigated by CCD and a quadratic polynomial model, according to the independent and dependent variables, was presented as follows (Equation (3)):
Y = β 0 + i = 1 k β i x i + i = 1 k β i i x i 2 + i 1 n β i j x i x j + ε
where Y is the predicted response, β0, βi, and βij are the regression coefficients, k represents the number of independent variables, ε is the residual, and Xi and Xj are the independent variables [22].
The optimization process, the model fitting, and the evaluation of the adequacy of the models for DR16 removal were studied by the analysis of variance (ANOVA) and the results of CCD.

3. Results and Discussion

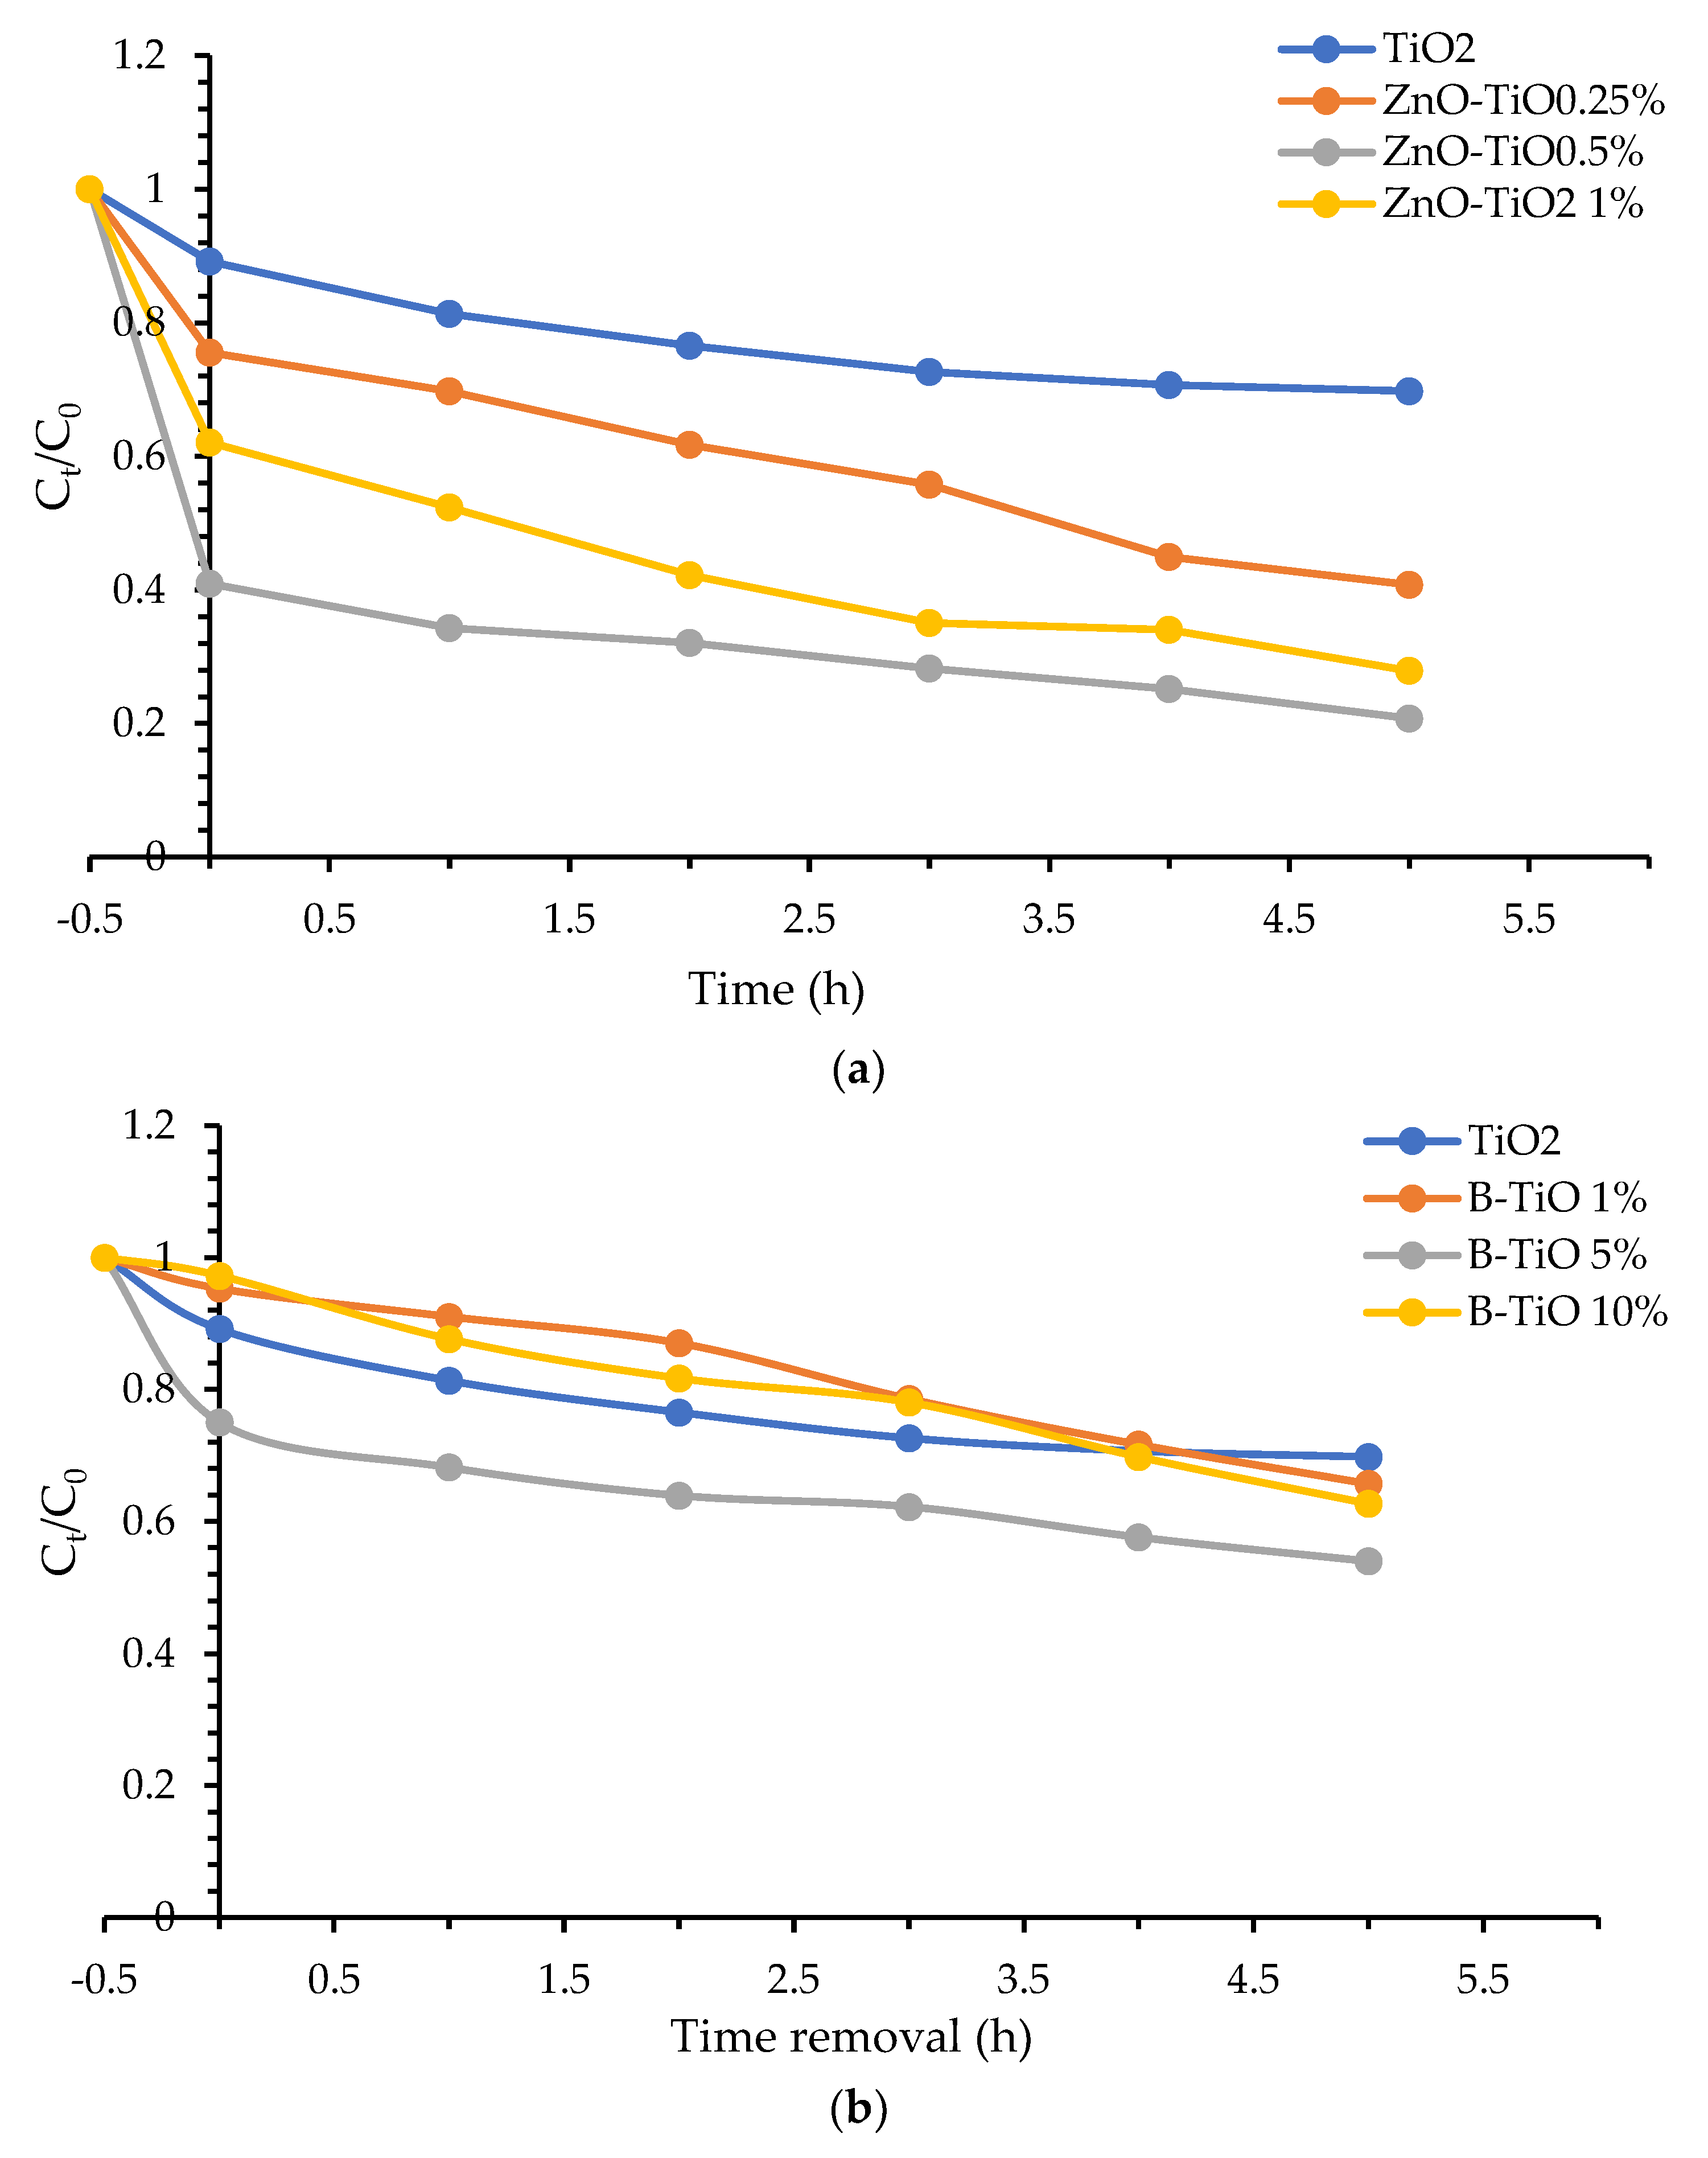
3.1. Determination of B and ZnO Amounts in B-ZnO/TiO2 Nanocomposite

The amounts of B and ZnO were optimized to obtain a B-ZnO/TiO2 photocatalyst with the best photodegradation performance. To this end, the DR16 dye degradation (15 ppm) using 1 g/L B-TiO2 with different loadings of B, i.e., 1, 5, and 10 wt. % and also ZnO/TiO2 with 0.25, 0.5, and 1 wt. % of ZnO, under 70 W/m2 LED light irradiation, during 5 h were investigated.
Figure 1a,b indicates the effect of adding ZnO to TiO2 and doping B into TiO2 on the dye removal efficiency, respectively. From Figure 1a, by adding 0.25 wt. % of ZnO to TiO2, the dye removal increased to 59%. Furthermore, by increasing the ZnO amounts from 0.25% to 0.5%, the dye removal efficiency increased from 59% to 79%. The addition of 1% ZnO to TiO2 led to a decrease in dye removal efficiency. This can be attributed to two reasons: (1) adding a high dose of ZnO to TiO2 decreases the light penetration in the photocatalyst suspension and thus reduces the degradation rate, and (2) the photocatalytic activity depends on particle size and surface areas, which provide active sites for adsorption and degradation. A smaller particle size gives a greater total surface area and subsequently more active sites. The addition of ZnO to TiO2 enhances the photocatalyst size and decreases the surface area. In addition, the formation of photoinactive Zn2TiO4 at a high ZnO amount decreases photocatalytic activity [19]. The generated electron–hole pairs must be trapped in the photocatalytic process, to enhance their lifetime and avoid recombination. The adequate loading of ZnO into TiO2 increases the generation rate of electron–hole pairs and the lifetime of excitations, via trapping electrons and holes and avoiding fast recombination.
In the case of B doping into TiO2, the addition of 1% and 5% of B improved the dye removal to 34 and 47%, respectively, while further addition (10%) had no more promoting effect on the dye removal efficiency. A possible reason for this behavior at 10% doping of B is that a maximum saturation level of the dopant on the particle surface was reached. An excessive amount of dopant occupies active sites of the catalyst and inhibits light absorption and also dye adsorption, on the surface of the photocatalyst. Furthermore, a decrease in photocatalytic activity occurs due to the crystallization of sassolite (HBO3) and an increase in the rutile phase. The better performance of modified TiO2 with 5% of B, in comparison with pure TiO2, confirmed the potential of the doping technique for the removal of organic contaminants. The good photocatalytic performance of B-TiO2 can be ascribed to the following reasons:
  • An ability to absorb visible light;
  • B-doped TiO2 forms two new chemical bonds B–O–Ti and B–O–B, which are beneficial for photodegradation;
  • A decrease in particle size and increase in the surface area and active sites by doping B into TiO2;
  • Formation of a mesoporous structure;
  • Improving the microstructure properties of TiO2 due to occupying of interstitial positions of TiO2 by B;
  • Formation of Ti (III), with its beneficial effect in reducing the recombination of photoexcited electrons and holes [23].
Finally, to prepare optimum the B-ZnO/TiO2 composite, 0.5 wt. % of ZnO and 5 wt. % of B were doped into TiO2.

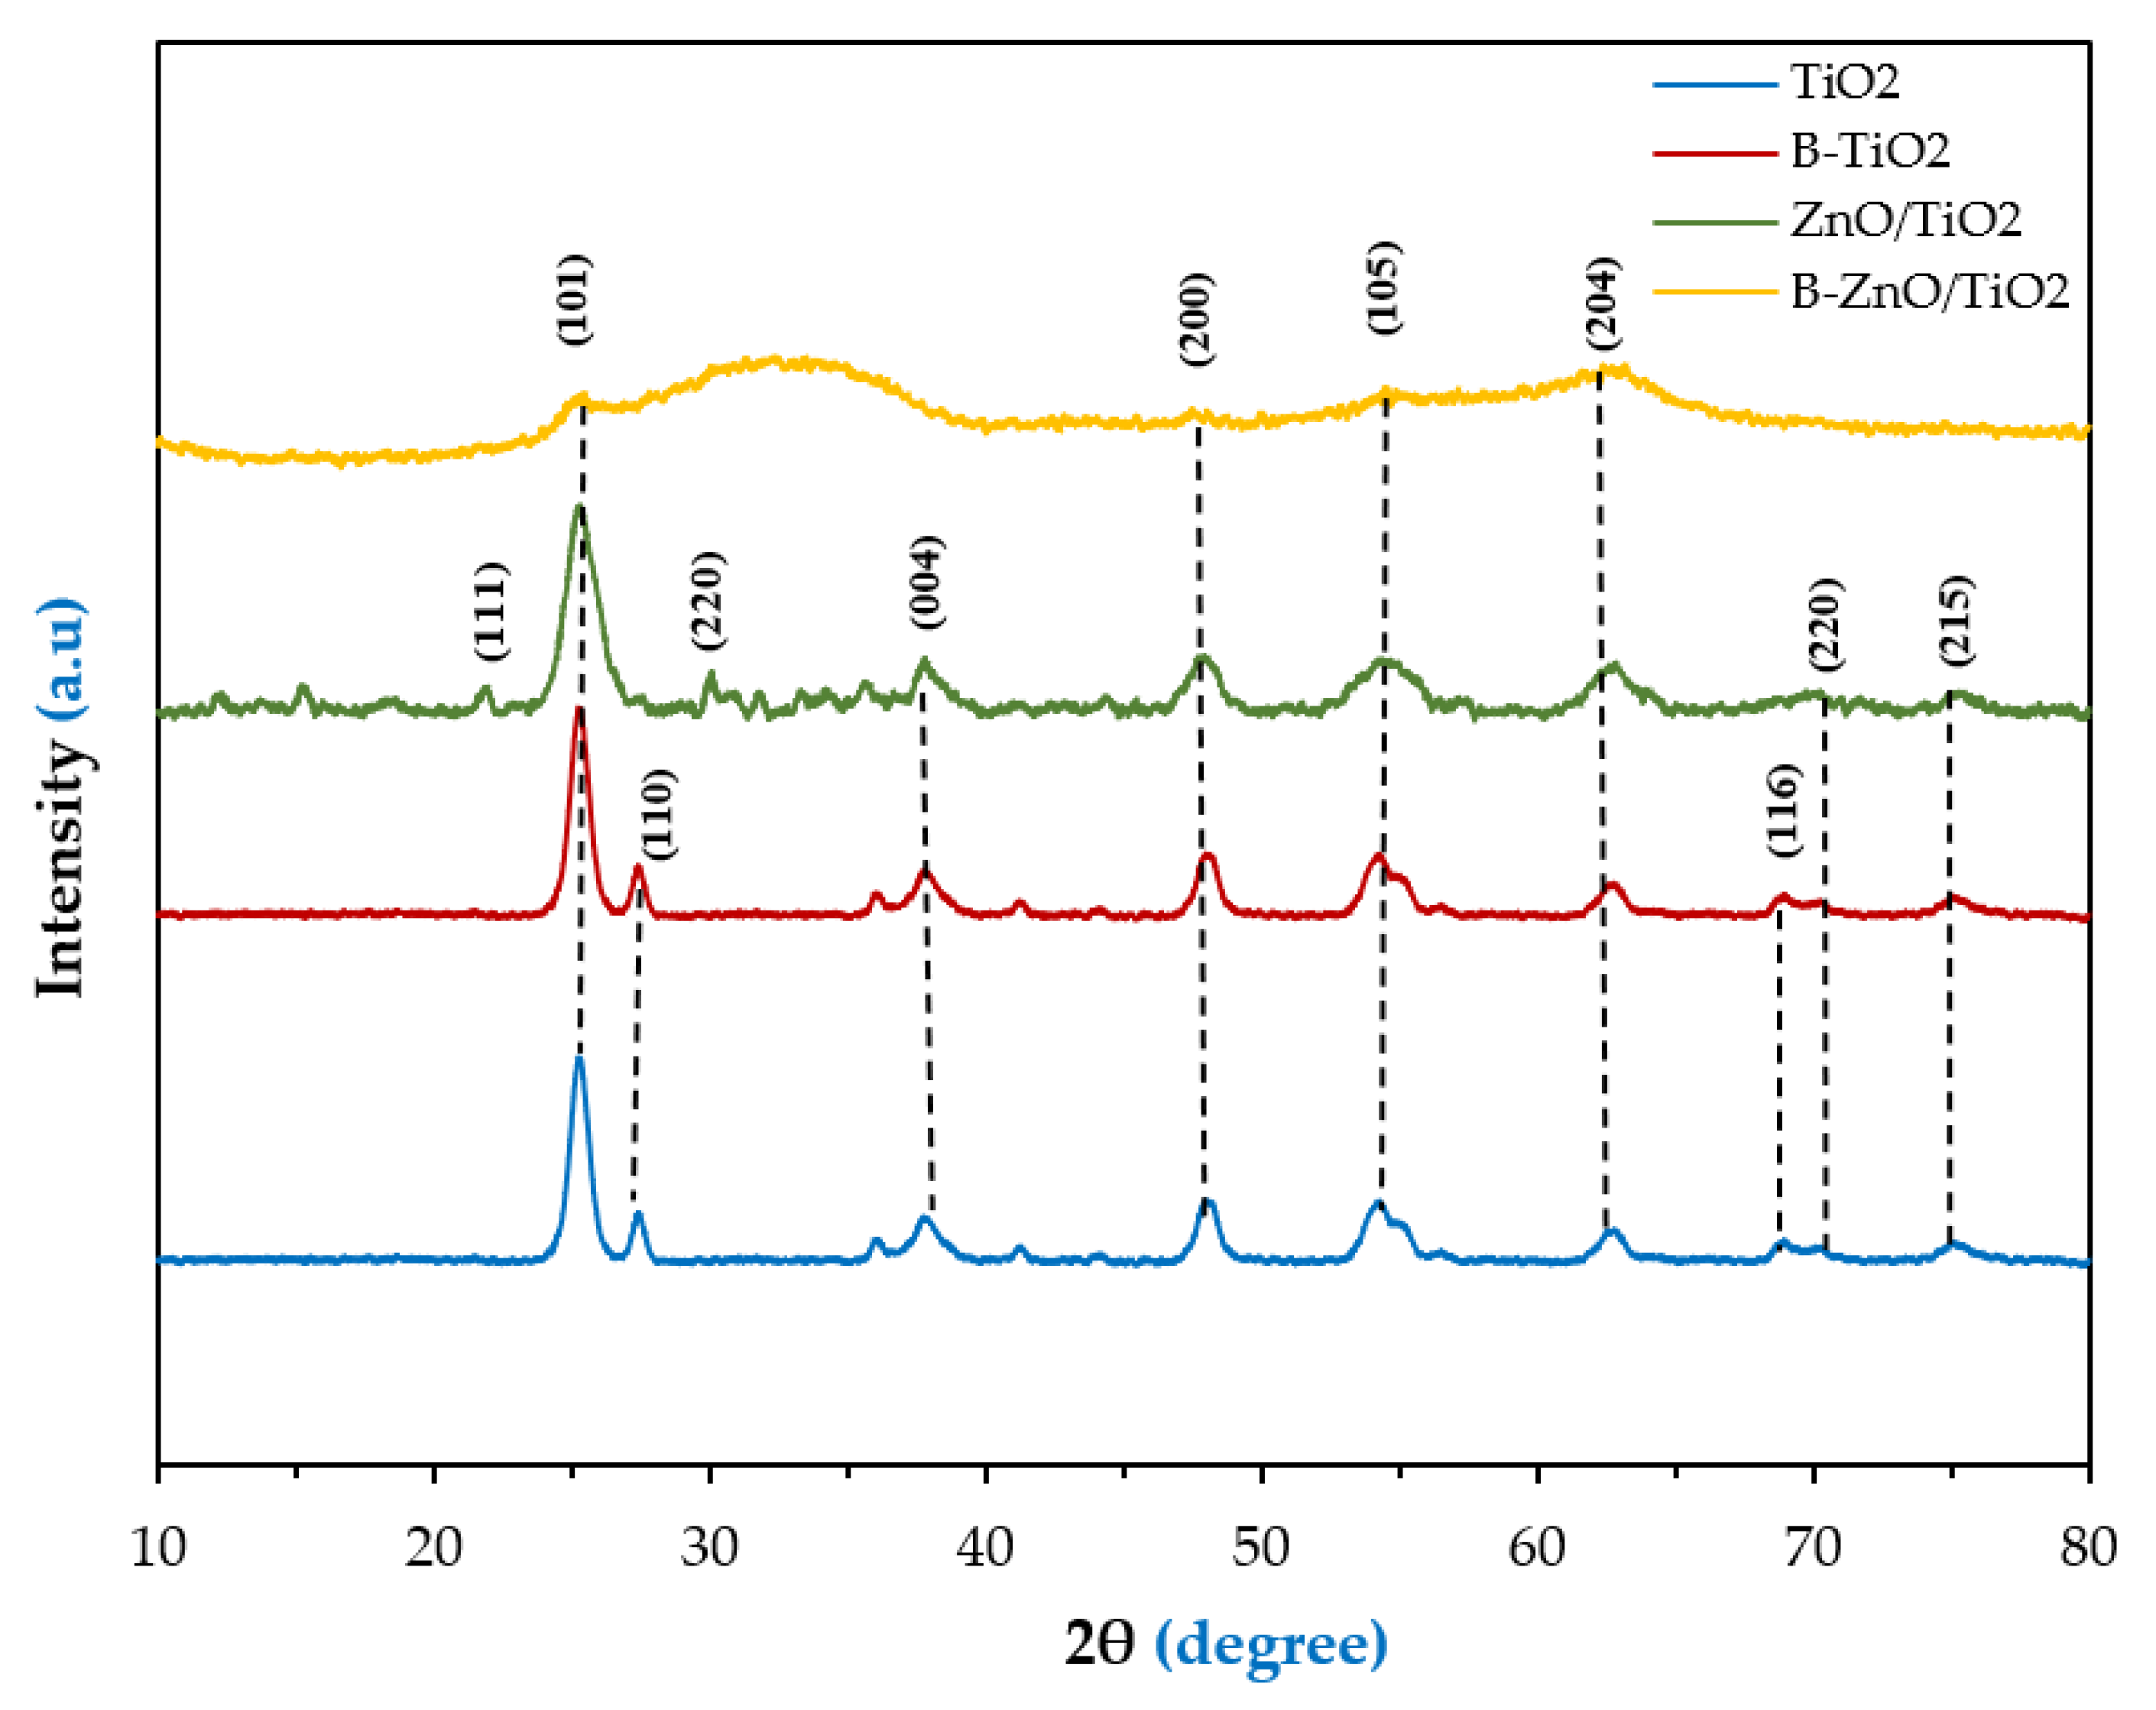
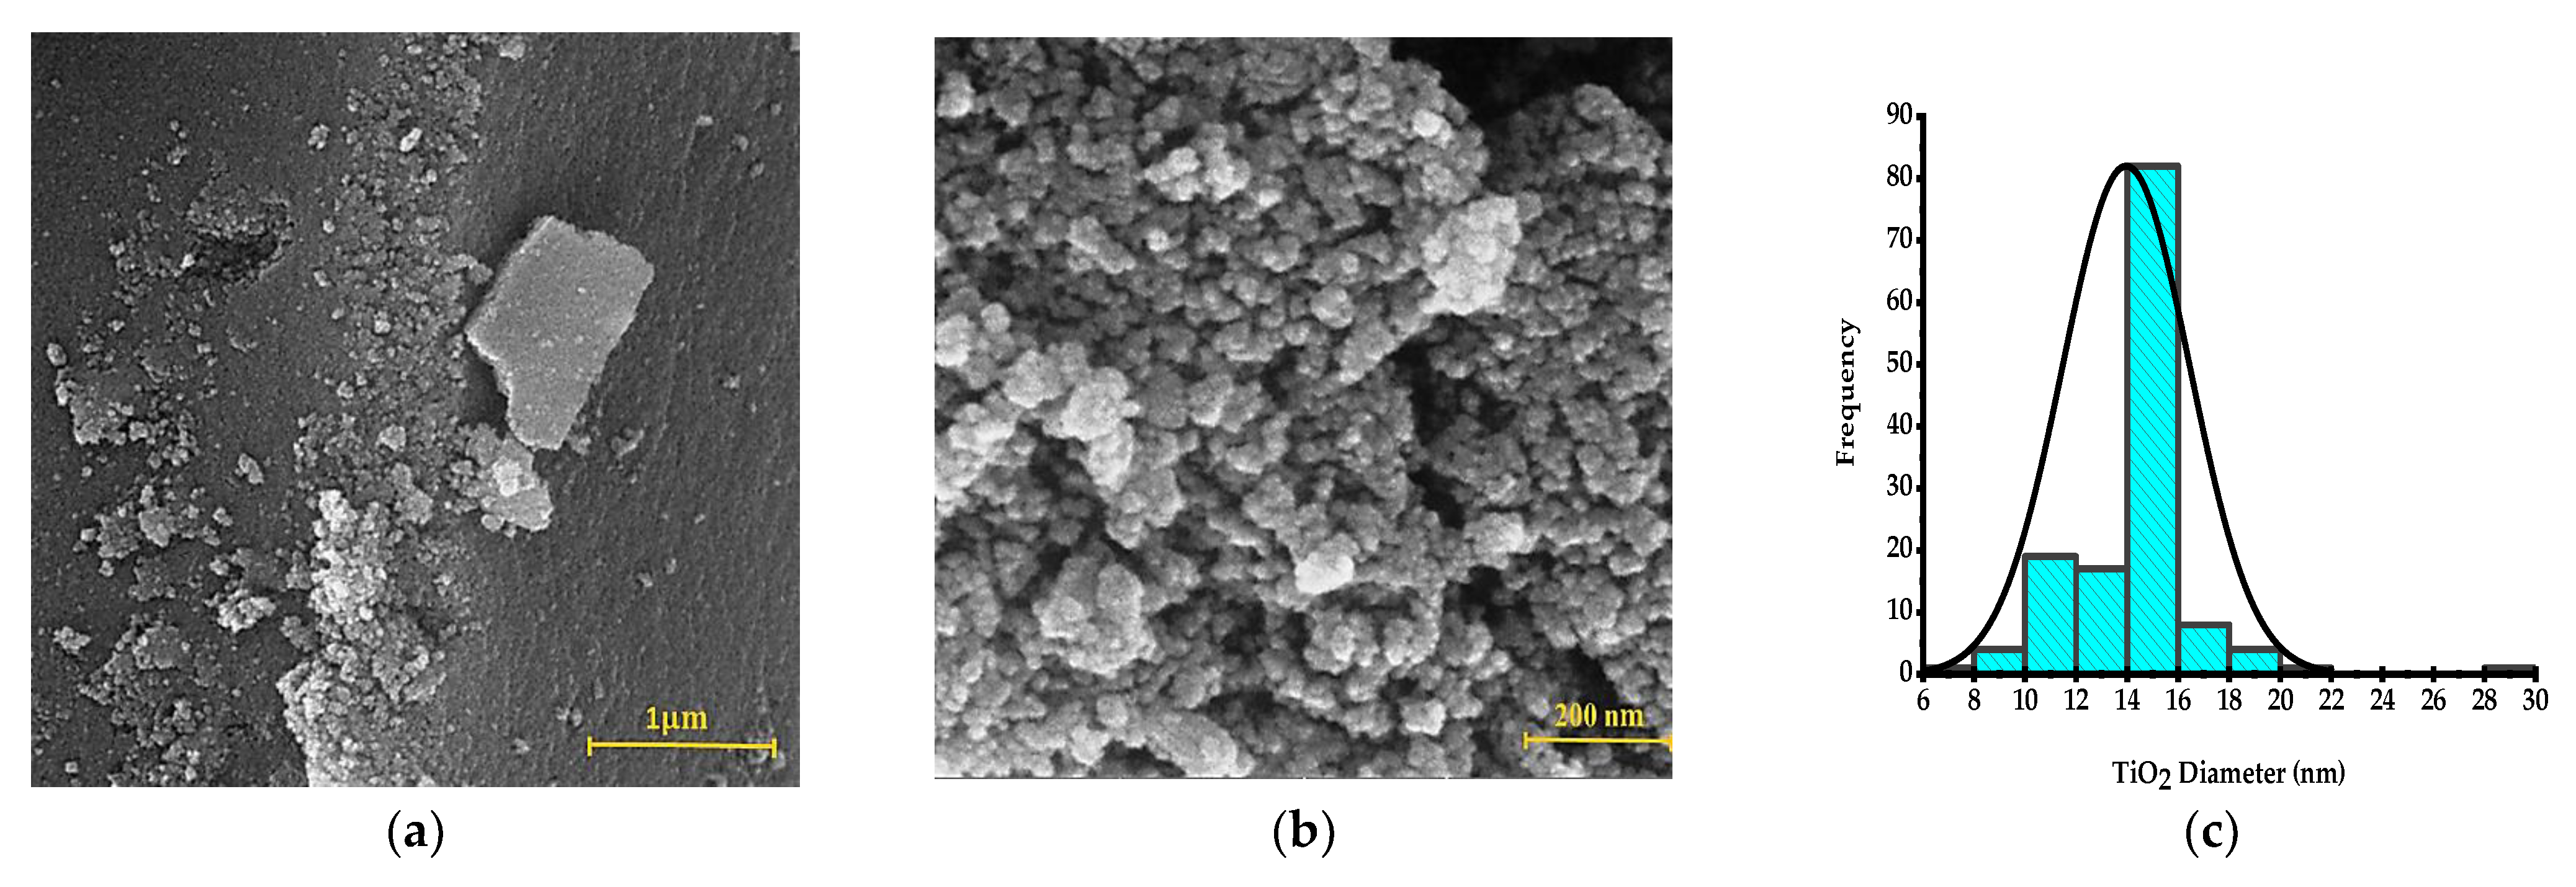
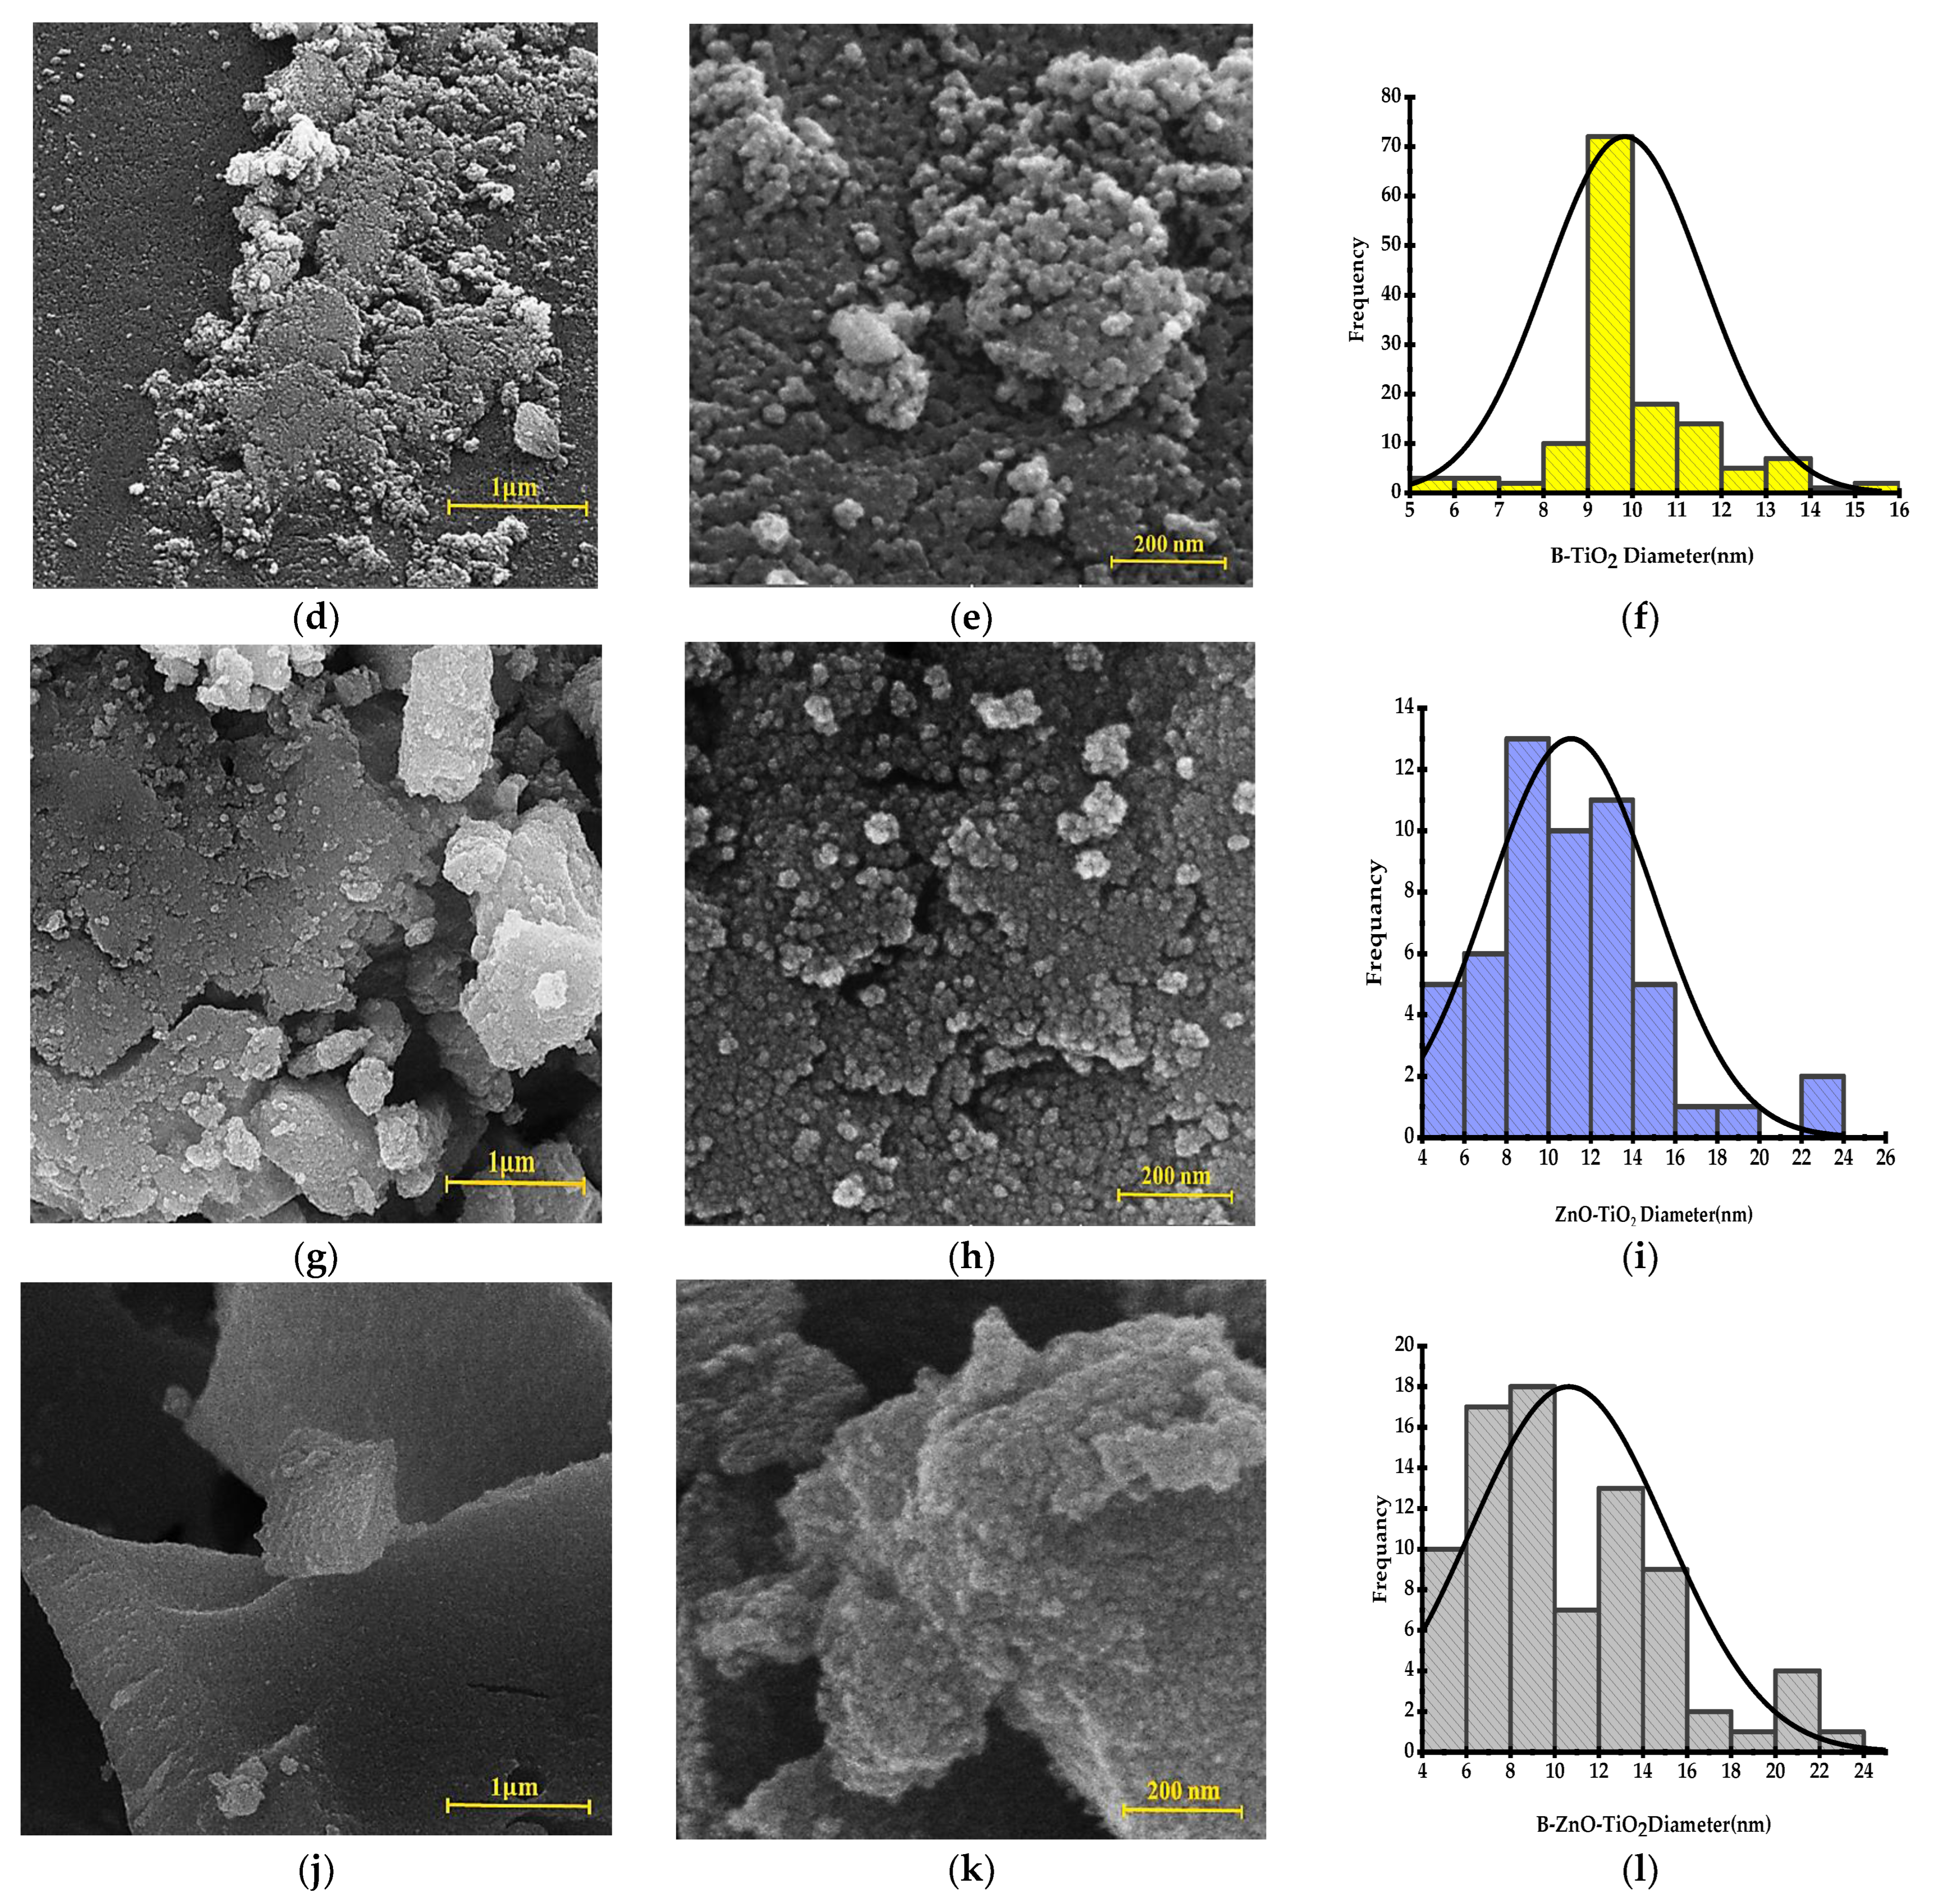
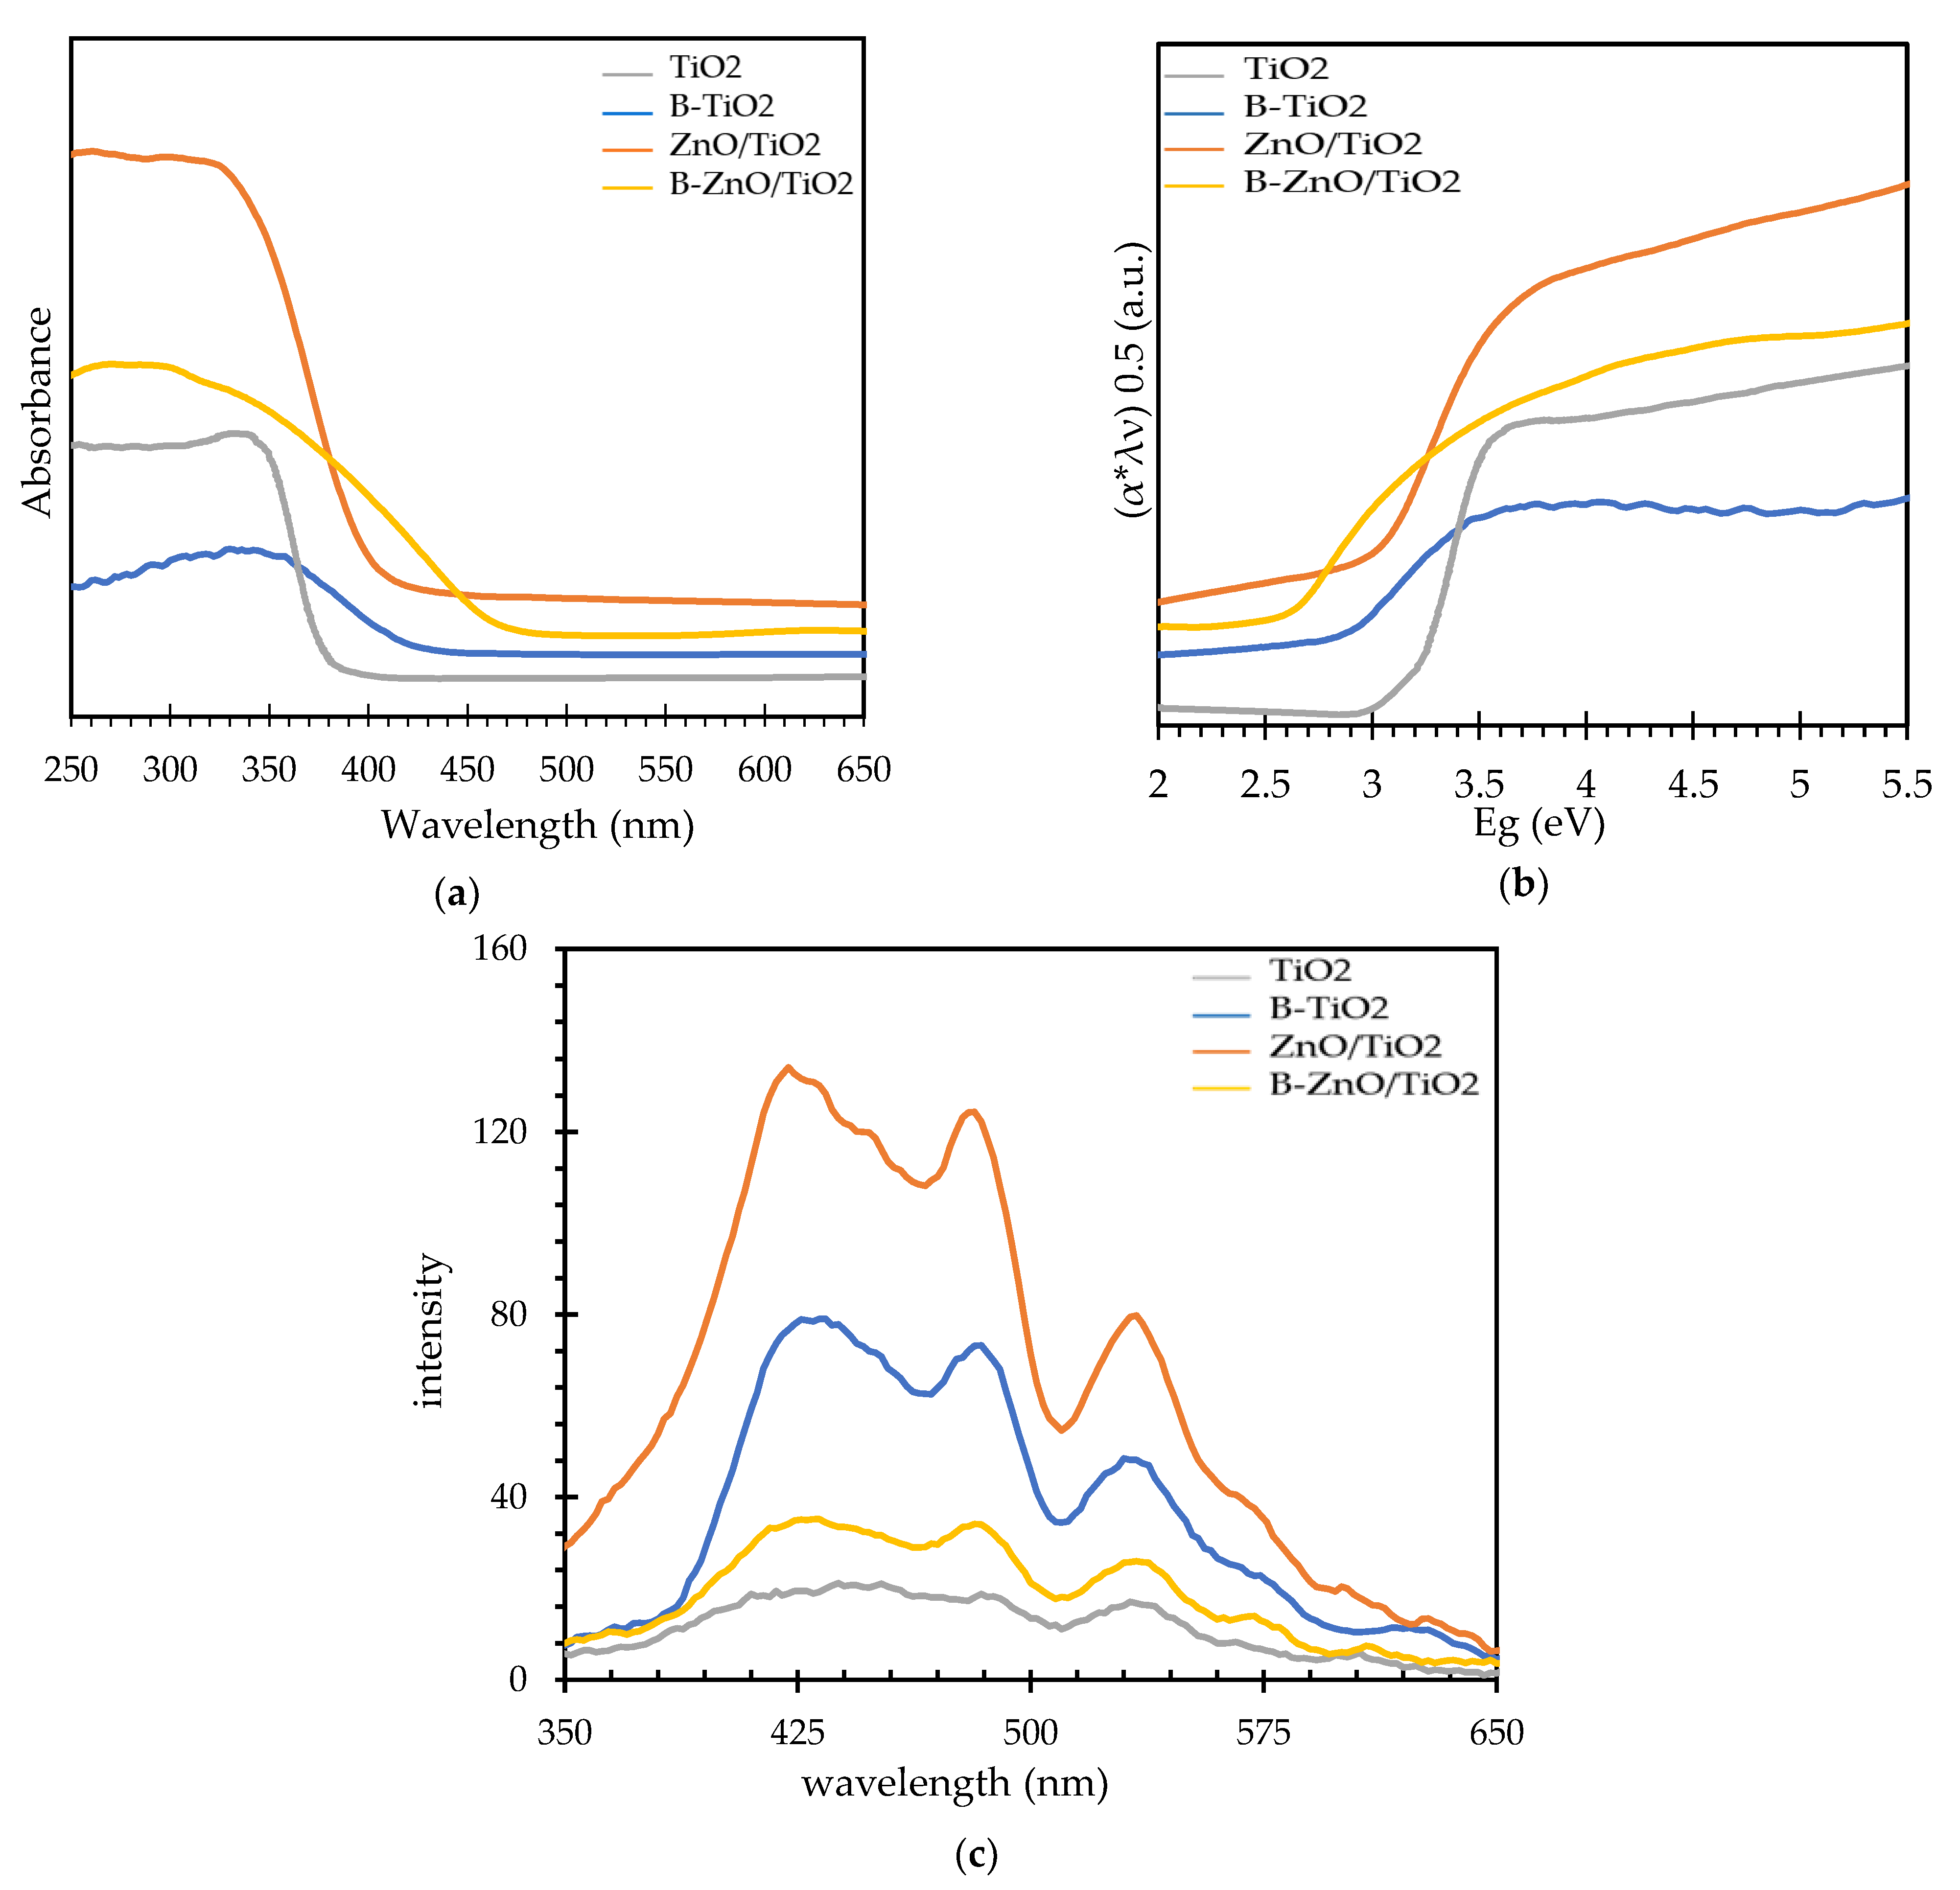
3.2. Characterization of the Synthesized B-ZnO/TiO2

The crystal structure and phase of the synthesized samples were examined by XRD. The diffraction patterns of pure TiO2, B (5%)-TiO2, ZnO (0.5%)/TiO2, and B (5%)-ZnO (0.5%)/TiO2 are shown in Figure 2. TiO2 was crystallized in the anatase, and rutile phases. According to the literature, the diffraction peaks related to the anatase phase at 2θ = 25.1°, 37.8°, 48.1°, 53.9°, 55.0°, 62.5°, 68.8°, 70.5°, and 75.5° correspond to (101), (004), (200), (105), (211), (204), (116), (220), and (215) planes, respectively [24]. The diffraction peaks at 27° and 36° under index (110) and (103), respectively, can be assigned to the rutile phase [25]. The diffraction peaks of B (5%)-TiO2 revealed both rutile and anatase phases, but there was no evidence of the presence of B in the crystalline structure, which means that doping B in TiO2 does not affect the crystalline phase. The absence of a B-related peak can be attributed to the low amount of B, as well as the low sensitivity of the XRD instrument to detecting small amounts of B diffractions. By adding ZnO to TiO2, the rutile phase disappeared and the diffraction peak at 2θ = 30.6°, indexed with (220), appeared, and the same was seen in B-ZnO/TiO2, with the generation of broad and compact peaks such as 2θ = 31.8°, 35°, and 57.6° for (100), (002), and (110), respectively, which indicate the presence of ZnO as zincite and Ti-Zn phase, respectively [26]. Other XRD peaks that are related to a new structure of ZnO-loaded TiO2 (Zn2TiO4 composite) were found at 2θ = 18.6° and 30.1°, indexed with (111) and (220), respectively [27,28,29,30,31]. The X-ray diffraction peaks of B (5%)-ZnO (0.5%)/TiO2 are broad, with low intensity. This could be due to the presence of amorphous phases in the sample.
The SEM images of pure TiO2, B-TiO2, ZnO-TiO2, and B-ZnO/TiO2 are presented in Figure 3. The SEM images of pure TiO2, B-TiO2, and ZnO/TiO2 illustrate the catalyst outer surfaces are grainy, spherical, and aggregated, with a wide range of particle sizes. The particle size decreased following the addition of B and ZnO into TiO2. The particles of the B-ZnO/TiO2 composite had an incomplete spherical shape and were highly agglomerated, due to their small size and the amorphous nature of the photocatalytic composite (Figure 3j–l). In the SEM images, the particle size was calculated using the NIH Image J software. The crystallite and particle size of pure TiO2, B-TiO2, ZnO/TiO2, and B-ZnO/TiO2 are summarized in Table 2. Furthermore, the distribution and uniform features for element mapping are investigated by EDS spectra in Figure 4. The EDS elemental mapping of B-doped ZnO/TiO2 clearly confirms the presence and uniform spatial distribution of Ti, O, Zn, and B in the nanocomposite (Figure 4a–d).
The average crystallite sizes of pure TiO2, B-TiO2, ZnO/TiO2, and B-ZnO/TiO2 were calculated from X-ray line broadening using Scherrer’s equation, and were 9.6, 6.8, 5.8, and 6.3 nm, respectively. The results showed that the crystallite size decreased when adding B and ZnO. These findings were in agreement with the previous literature [22,24].
The zeta potential value depends on the atomic arrangement of the photocatalyst surface and controls its adsorption property. The zeta potential and stability terms of the TiO2, B-TiO2, ZnO/TiO2, and B-ZnO/TiO2 photocatalytic composites are tabulated in Table 3. By doping 5 wt. % B into TiO2, the positive charge value was increased from +40.7, for pure TiO2, to +64, for B-TiO2 [17,18,19]. This means that B enhances TiO2 stability, despite a reduction in size from 9.6 to 6.9 nm [20]. The addition of ZnO to TiO2 decreased the zeta potential value severely, although it remained in the positive range (+9.38). The zeta potential decreased more by doping 5 wt. % B into ZnO/TiO2, achieving a negative value. The change in boron atoms and ZnO particles arrangement on the catalyst surface, due to loaded ZnO as coupling agent and B as dopant into TiO2, led to a decrease in the zeta value, to −6.99 mV [32].
The DRS spectra and Tauc plots of the prepared photocatalysts (TiO2, B-TiO2, ZnO/TiO2, and B-ZnO/TiO2) are shown in Figure 5a,b. To calculate the photocatalysts band gaps, the Tauc plots were used by extrapolating the linear portion of (αhν)0.5 versus band gap energy (Eg) curve [32,33], as shown in Figure 5b. From the results, it is seen that the UV absorbance peak shifted with the modification of TiO2 with B and ZnO. Figure 5 indicates that the optical band gap energies (Eg) of TiO2, B-TiO2, ZnO/TiO2, and B-ZnO/TiO2 are 3.16, 2.6, 2.8, and 2.4 eV, respectively.
Moreover, the PL signal was used to investigate the lifetime and separation of charge carriers. Figure 5c represents PL spectra of pure TiO2, B-TiO2, ZnO/TiO2, and B-ZnO/TiO2 photocatalysts. The spectra of the TiO2, B-TiO2, and B-ZnO/TiO2 show three peaks in the visible area, at 426, 484, and 534 nm, respectively, while that of ZnO/TiO2 shows a peak at 534 nm. The peak at 426 nm (2.89 eV) is attributed to the relaxation of self-trapped excites localized on the TiO6 octahedral [22,23]. According to the PL spectrum, doping B into TiO2 had no positive effect on the PL spectrum’s shape and peak intensity [33,34,35,36].
The overall decrease in PL intensity indicates a decreased recombination rate of the electron–hole pair under light irradiation [37]. The PL spectra of ZnO/TiO2 and B-ZnO/TiO2 indicate a decrease in peak intensity, which can be attributed to the immigration of photoinduced holes to the VB of ZnO [13]. The lower emission intensity peak for B-ZnO/TiO2 compared to pure TiO2 and ZnO/TiO2 was related to less recombination of photoinduced electrons and holes, and hence a longer life of photogenerated carriers. The addition of B atoms into the oxygen sites of the TiO2 lattice led to the creation of new electronic impurity levels between the VB and CB of TiO2 resulting decreased TiO2 band gap [38]. On the other hand, the photoexcited electrons in the CB of B-TiO2 under visible light, can be transferred to the CB in ZnO, while the photogenerated holes remain, that lead to the mitigation of the e/h+ recombination rate [34].

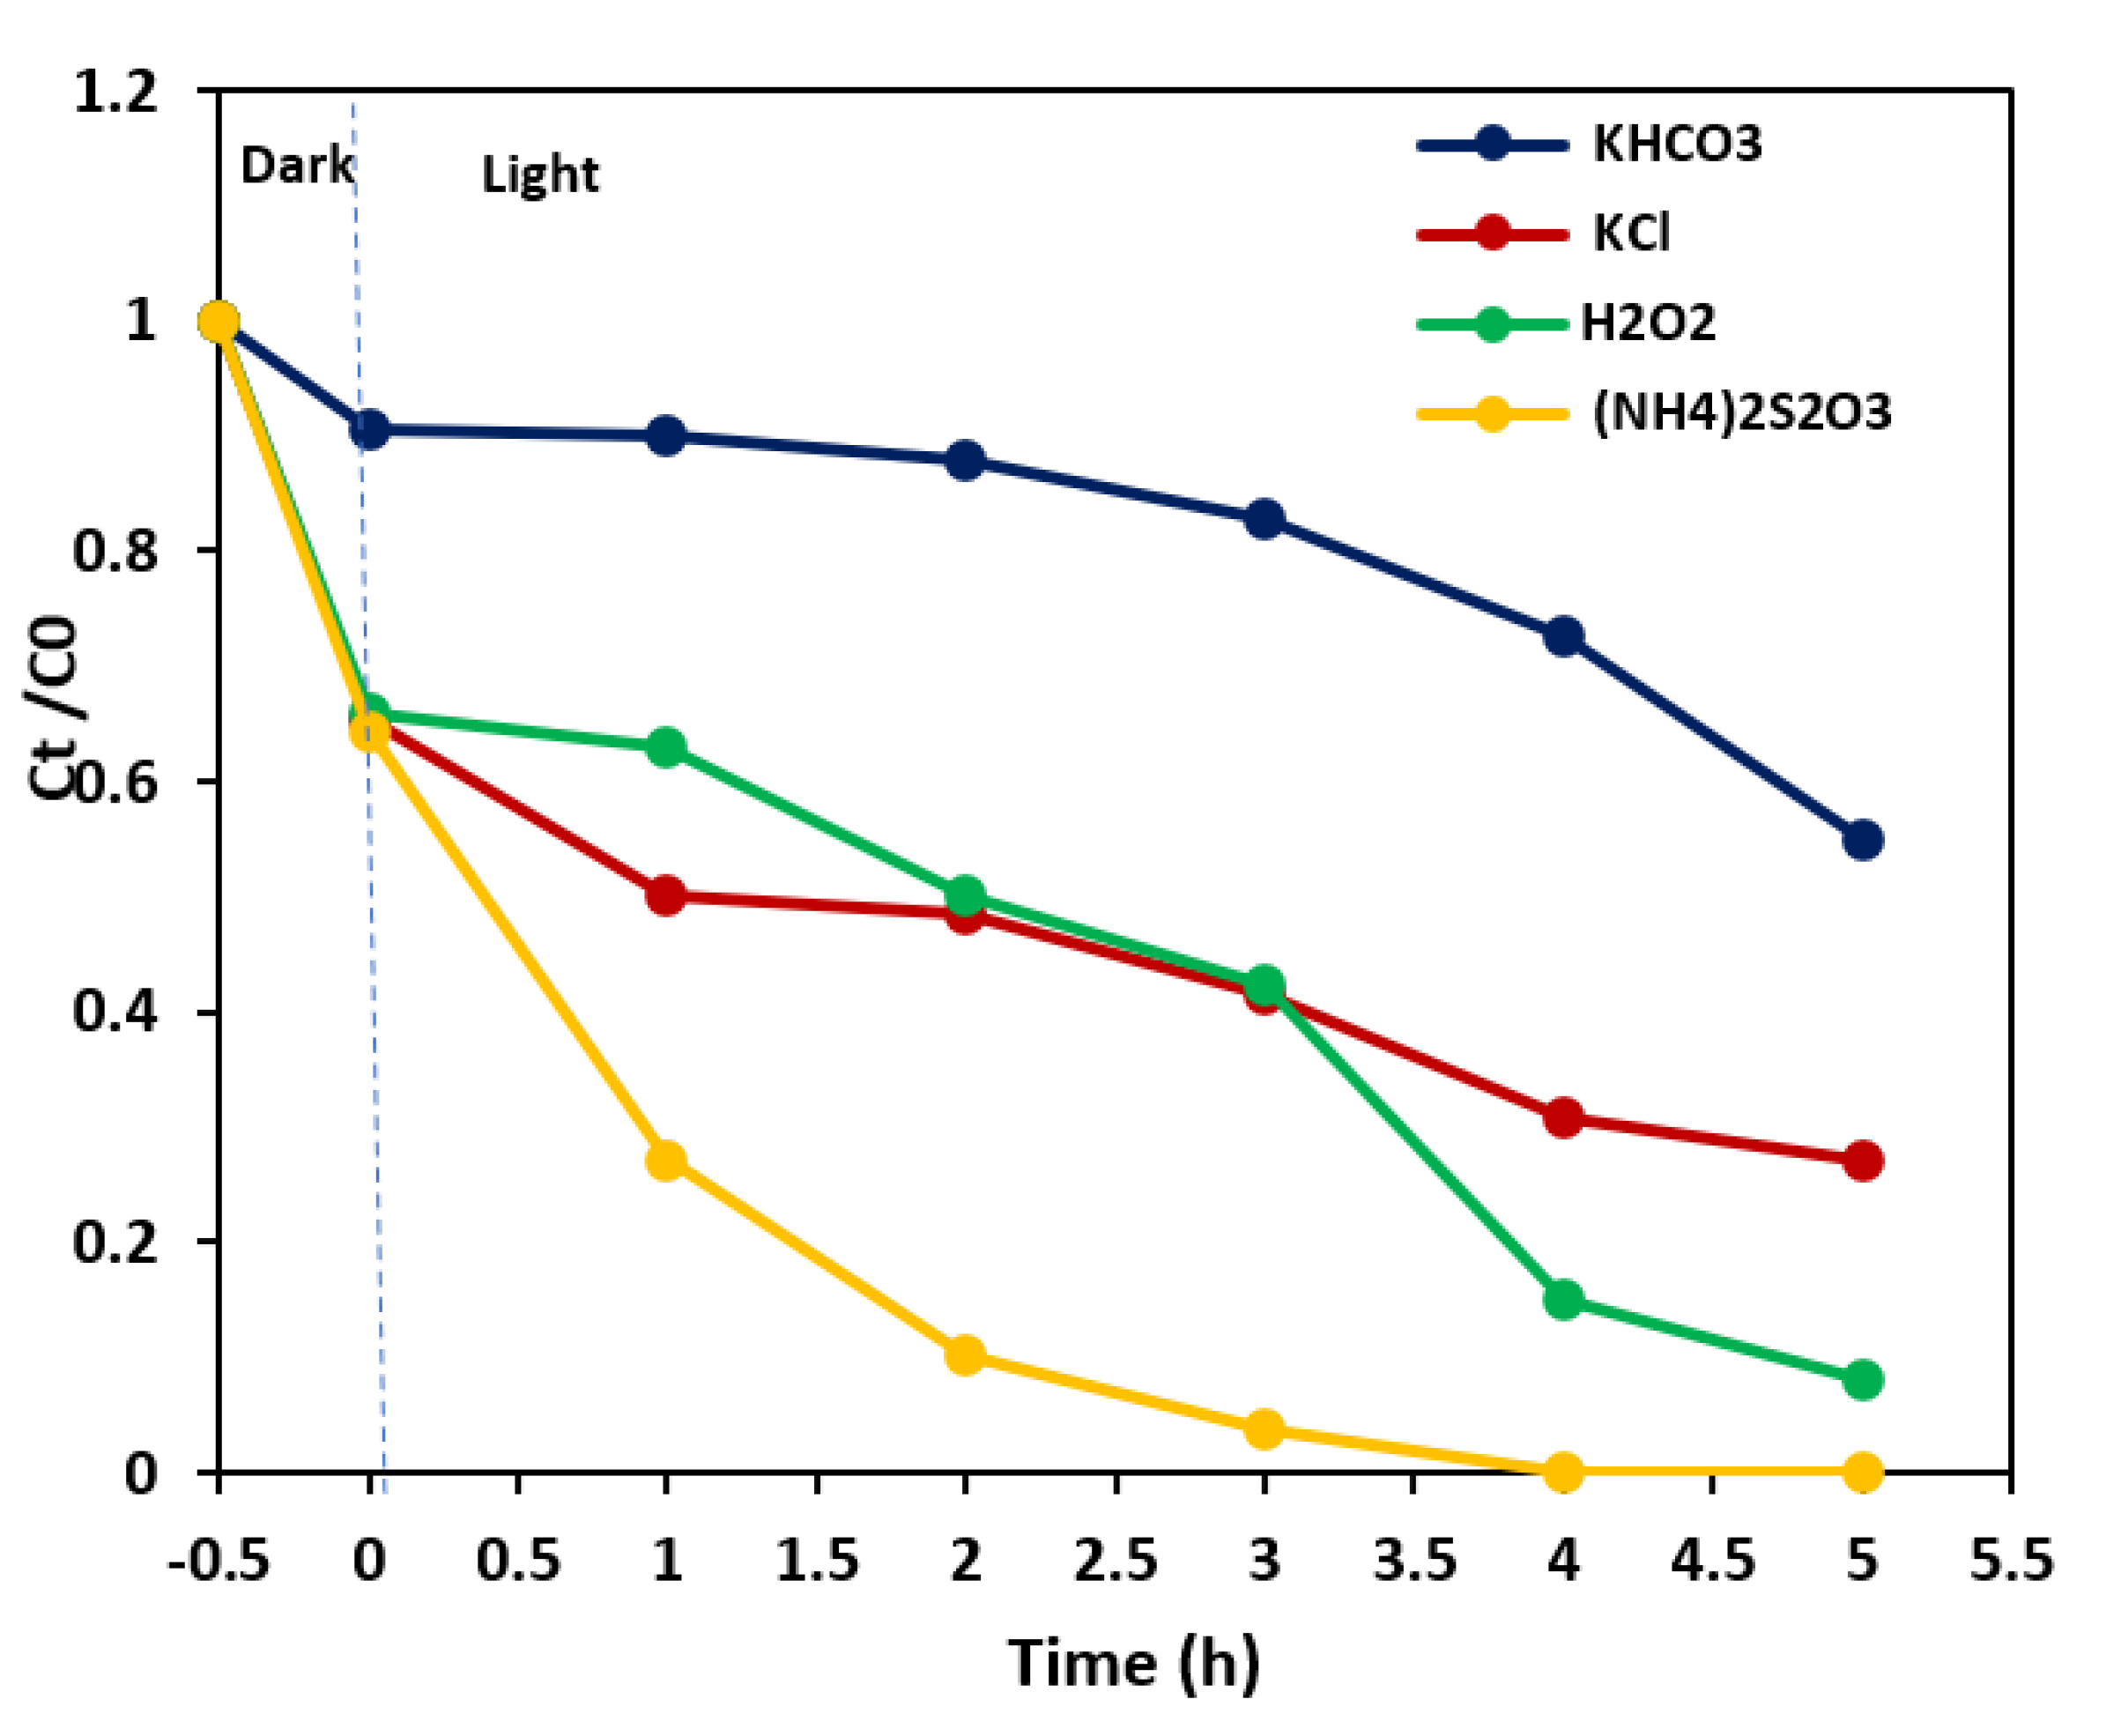
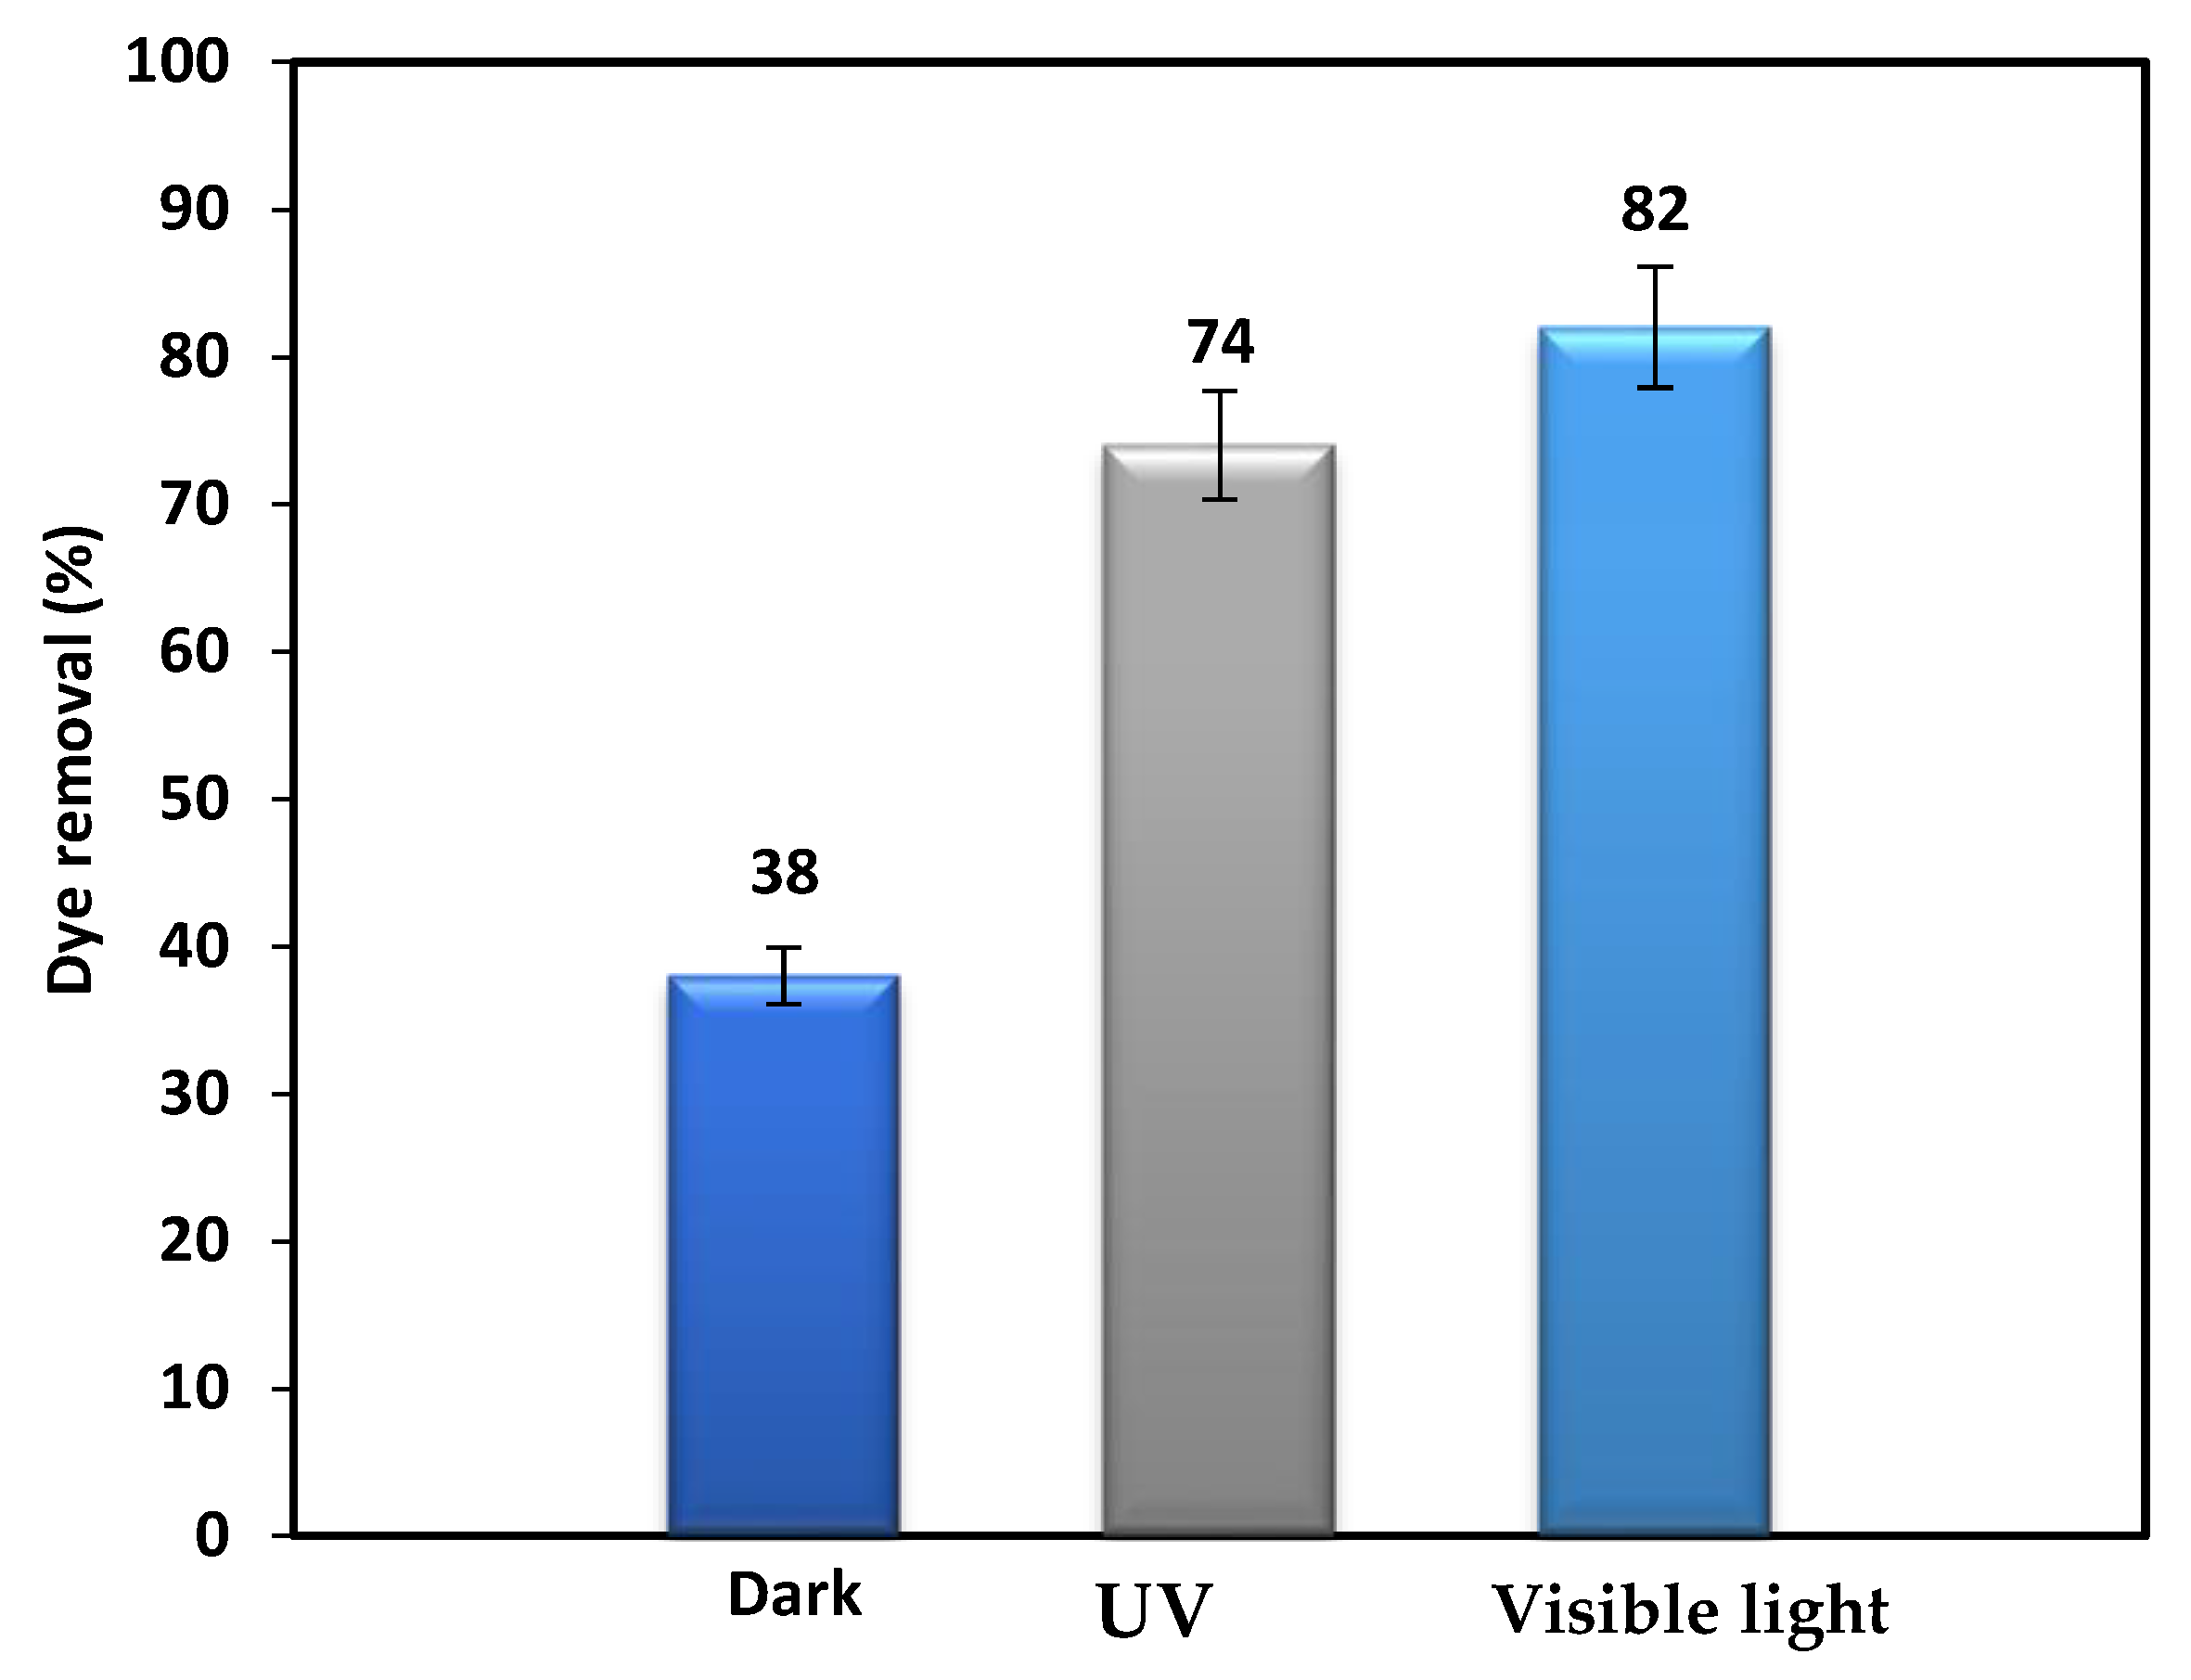
3.3. Effect of Electron Acceptors and Type of Irradiation on the Photodegradation Process

To investigate the effect of inorganic reagents on the dye removal efficiency, 1 g/L of (NH4)2S2O8, H2O2, KCl, and KHCO3 were added to the dye solution. Figure 6 presents the effects of these acceptor reagents on the dye removal efficiency. Dye removal efficiencies of 99%, 91%, 71.5%, and 47% were obtained in the presence of (NH4)2S2O8, H2O2, KCl, and KHCO3, respectively. In order to evaluate the mineralization percentage during the photodegradation process, total organic carbon (TOC) was also measured, and values of 90.5%, 83%, 59%, and 40% as TOC removal were achieved, respectively. From these results, by adding (NH4)2S2O8 and H2O2, the dye removal is enhanced during the photocatalysis processes. In the presence of (NH4)2S2O8, the dye was completely removed after 4 h, while the reaction time under light irradiation was 5 h. This can be related to the presence of S2O82− anions, which react with photogenerated electrons according to the following reaction:
TiO 2   e cb   + S 2   O 8 2     SO 4 +   SO 4 2
The sulfate radical anion, SO4•–, can generate hydroxyl radicals in a reaction with water molecules. SO4•– is a strong oxidant, that participates in the decolorization process [39]. Ammonium persulfate, (NH4)2S2O8, as an electron acceptor, can prevent electron–hole pair recombination [40]. On the other hand, (NH4)2S2O8 acidifies the reaction media, which has an important role in increasing the removal efficiency.
The improvement of performance in the presence of H2O2, is due to an increase in the hydroxyl radical concentration [41]. Photocatalytic decolorization occurs on the surface of the photocatalyst, and O2 and H2O2 are necessary for photocatalytic decolorization [39].
T i O 2   e c b   + O 2       O 2
e c b + H 2 O 2       O H   + O H
H2O2 may be photolyzed or react with a superoxide anion to form a hydroxyl radical directly [26].
H 2 O 2 + h v     2 H O
H 2 O 2 +   O 2   OH   + H + + O 2  
The results demonstrated that KCl and KHCO3 have inhibitory effects on dye removal. This behavior can be explained by the formation of a double layer of salt at the surface of the catalyst, that decreases the dye adsorption [42]. Accordingly, the surface adsorption of DR16 molecules on the surface of the catalyst was limited due to the formation of an inorganic salt layer at the surface of B-ZnO/TiO2.
Besides, in the case of KCl, the Cl ion is a hole scavenger, and during the following reactions slows down and prevents the removal process [41]:
Cl + h vb +   Cl
Cl + Cl     Cl 2
Cl + OH     HOCl
HOCl +   H +   Cl +   H 2 O  
The Cl radicals are capable of oxidizing pollutants, but at lower rates than the OH radicals, due to their lower oxidation power. The decrease in the dye removal efficiency in the presence of KHCO3 can be related to the reaction of positive holes (h+) and hydroxyl radicals (OH) with bicarbonates (HCO3), as in the following reaction [41]:
HCO 3 +   OH   H 2 O +   CO 3
In order to optimize the reaction conditions to achieve a high dye removal efficiency, the effect of the light source was investigated. Figure 7 shows the effect of darkness, UV light, and visible light irradiation on the removal of DR16 solution with 1 g/L of the B-ZnO/TiO2 photocatalyst at room temperature after 5 h. The highest decolorization efficiency was obtained under LED visible light irradiation (87%), while under UV irradiation it was 74%, and the lowest dye removal was obtained in dark conditions, equal to 38%. This means that B-ZnO/TiO2 had higher activity under exposure to visible light irradiation in comparison to UV irradiation. The higher activity of B-ZnO/TiO2 in visible light is attributed to the presence of B as a dopant element, which helps to narrow the band gap of TiO2 by introducing its energy levels between the bandgap of TiO2, or by mixing with the valence bands of pure TiO2. Pure TiO2 has higher photoactivity under UV light irradiation, while boron-doped TiO2 is more photoactive under visible light irradiation. B atoms doped into TiO2 can occupy interstitial and substitutional (replace oxygen) positions. B in the substitutional case makes intermediate energy levels in the band gap and leads to the redshift of the absorption edge [34]. Moreover, the small particle size and greater surface area of B-ZnO/TiO2 contribute to its high photoactivity.

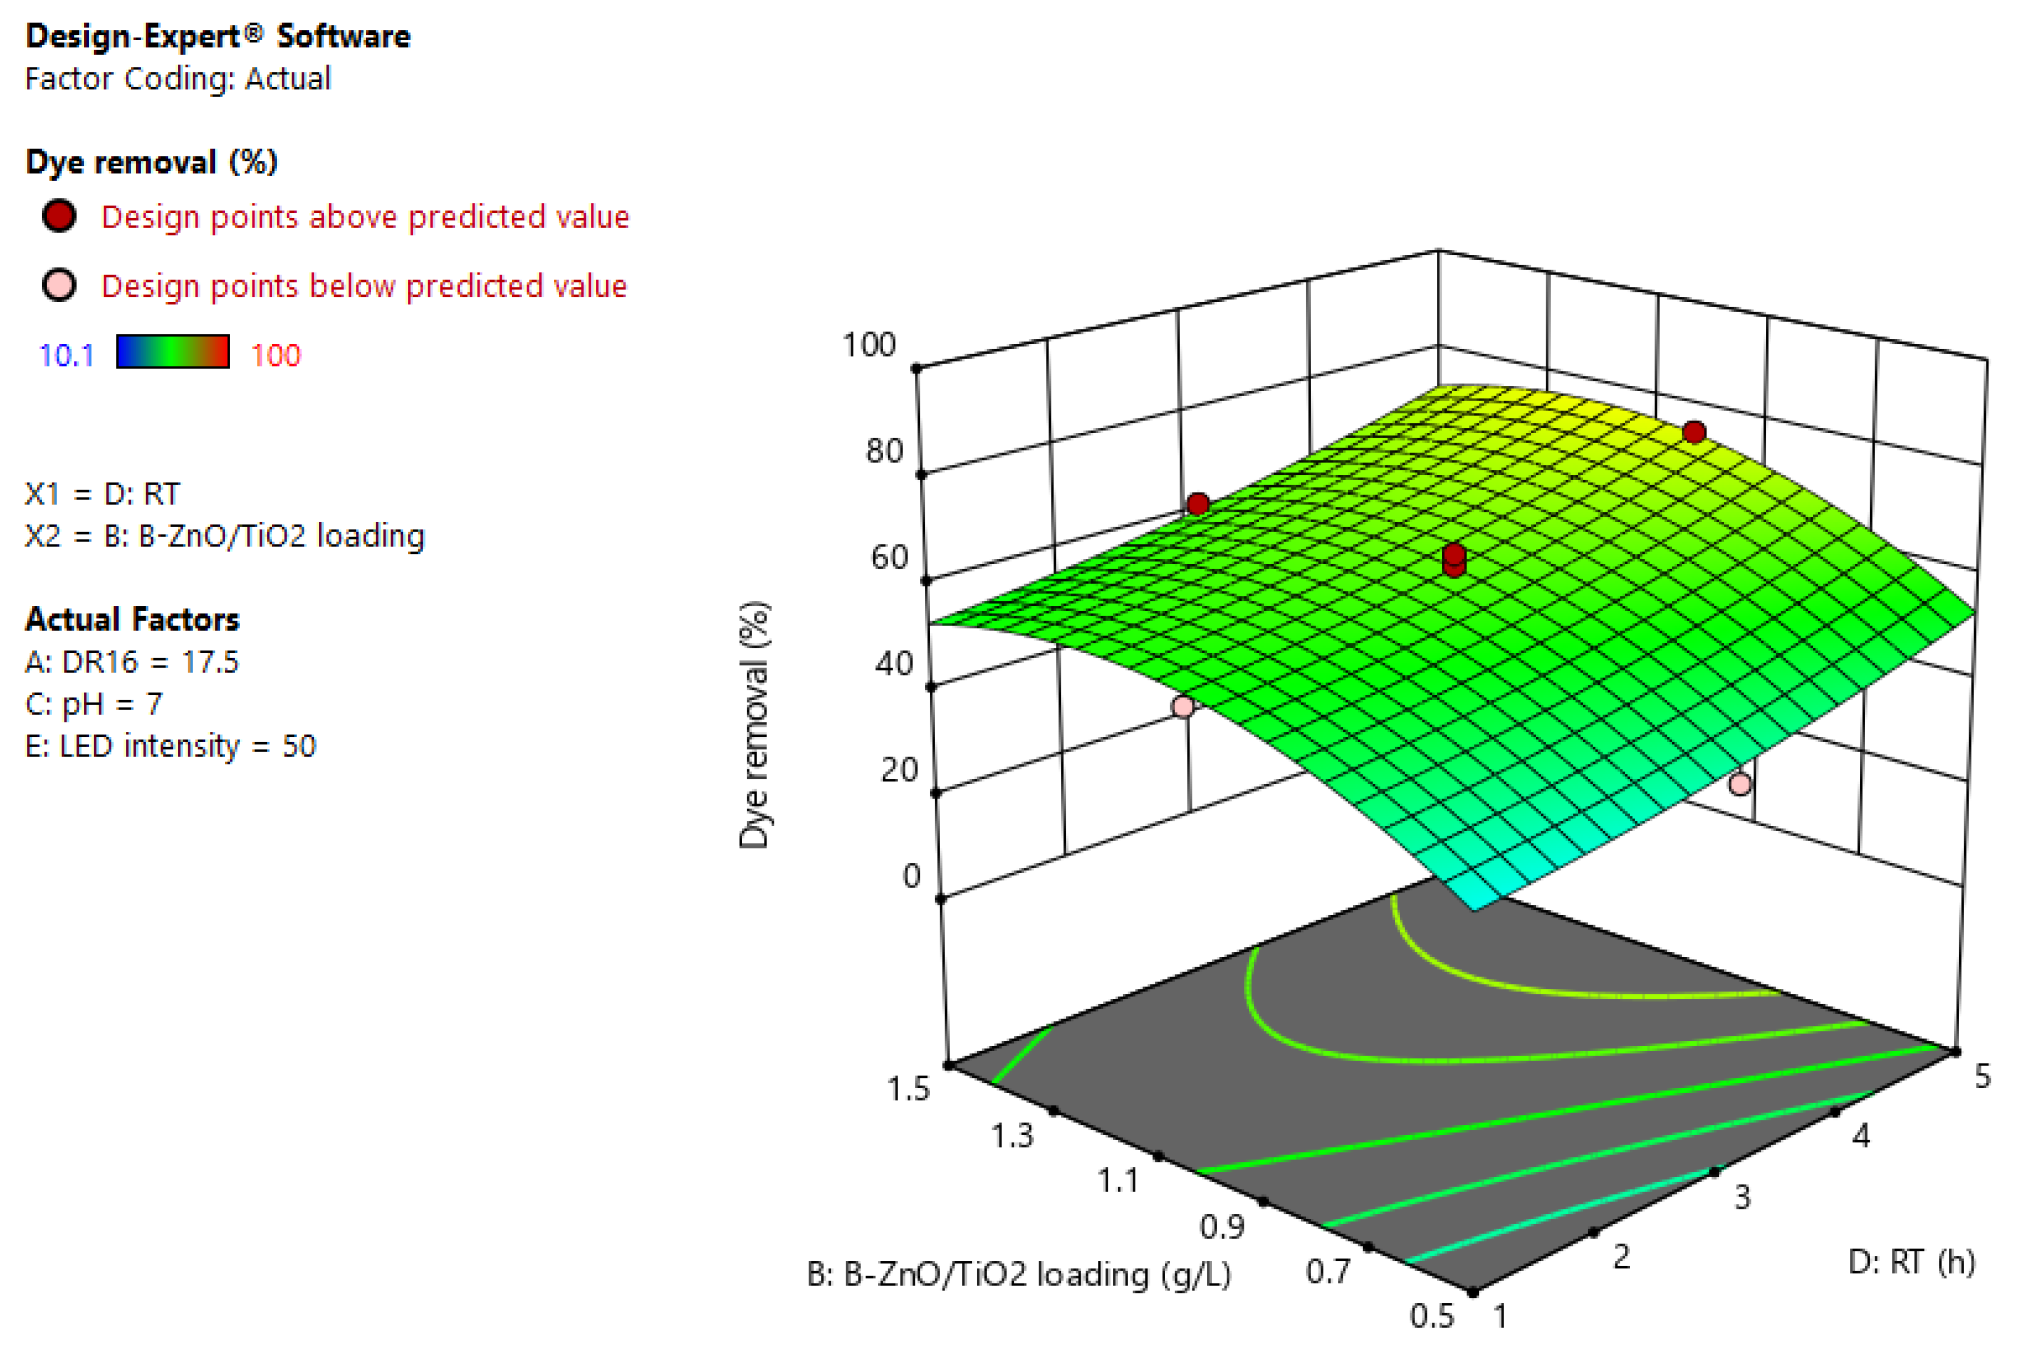
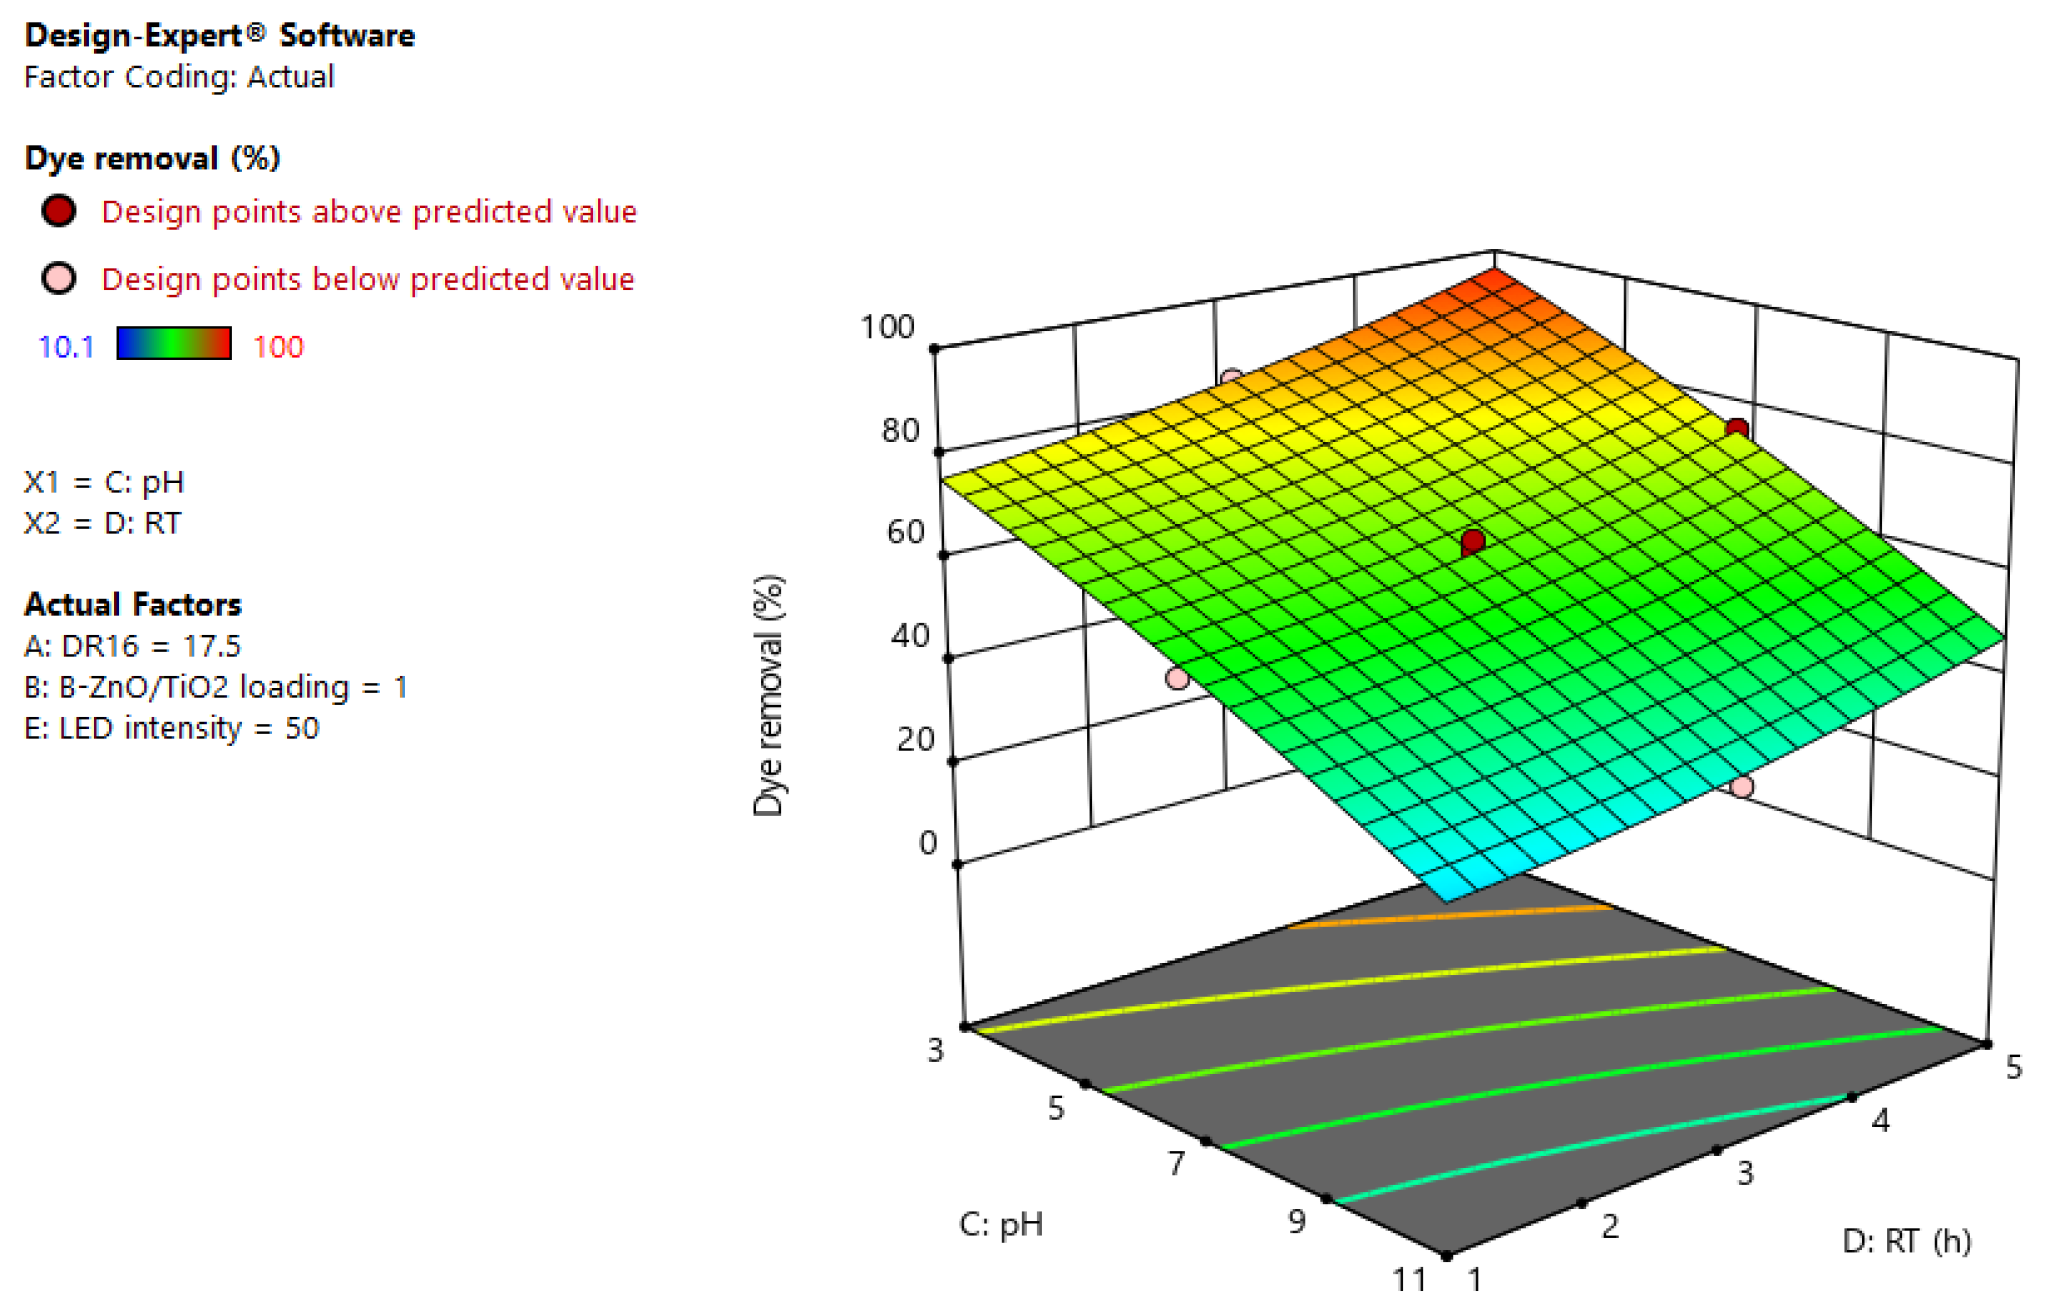
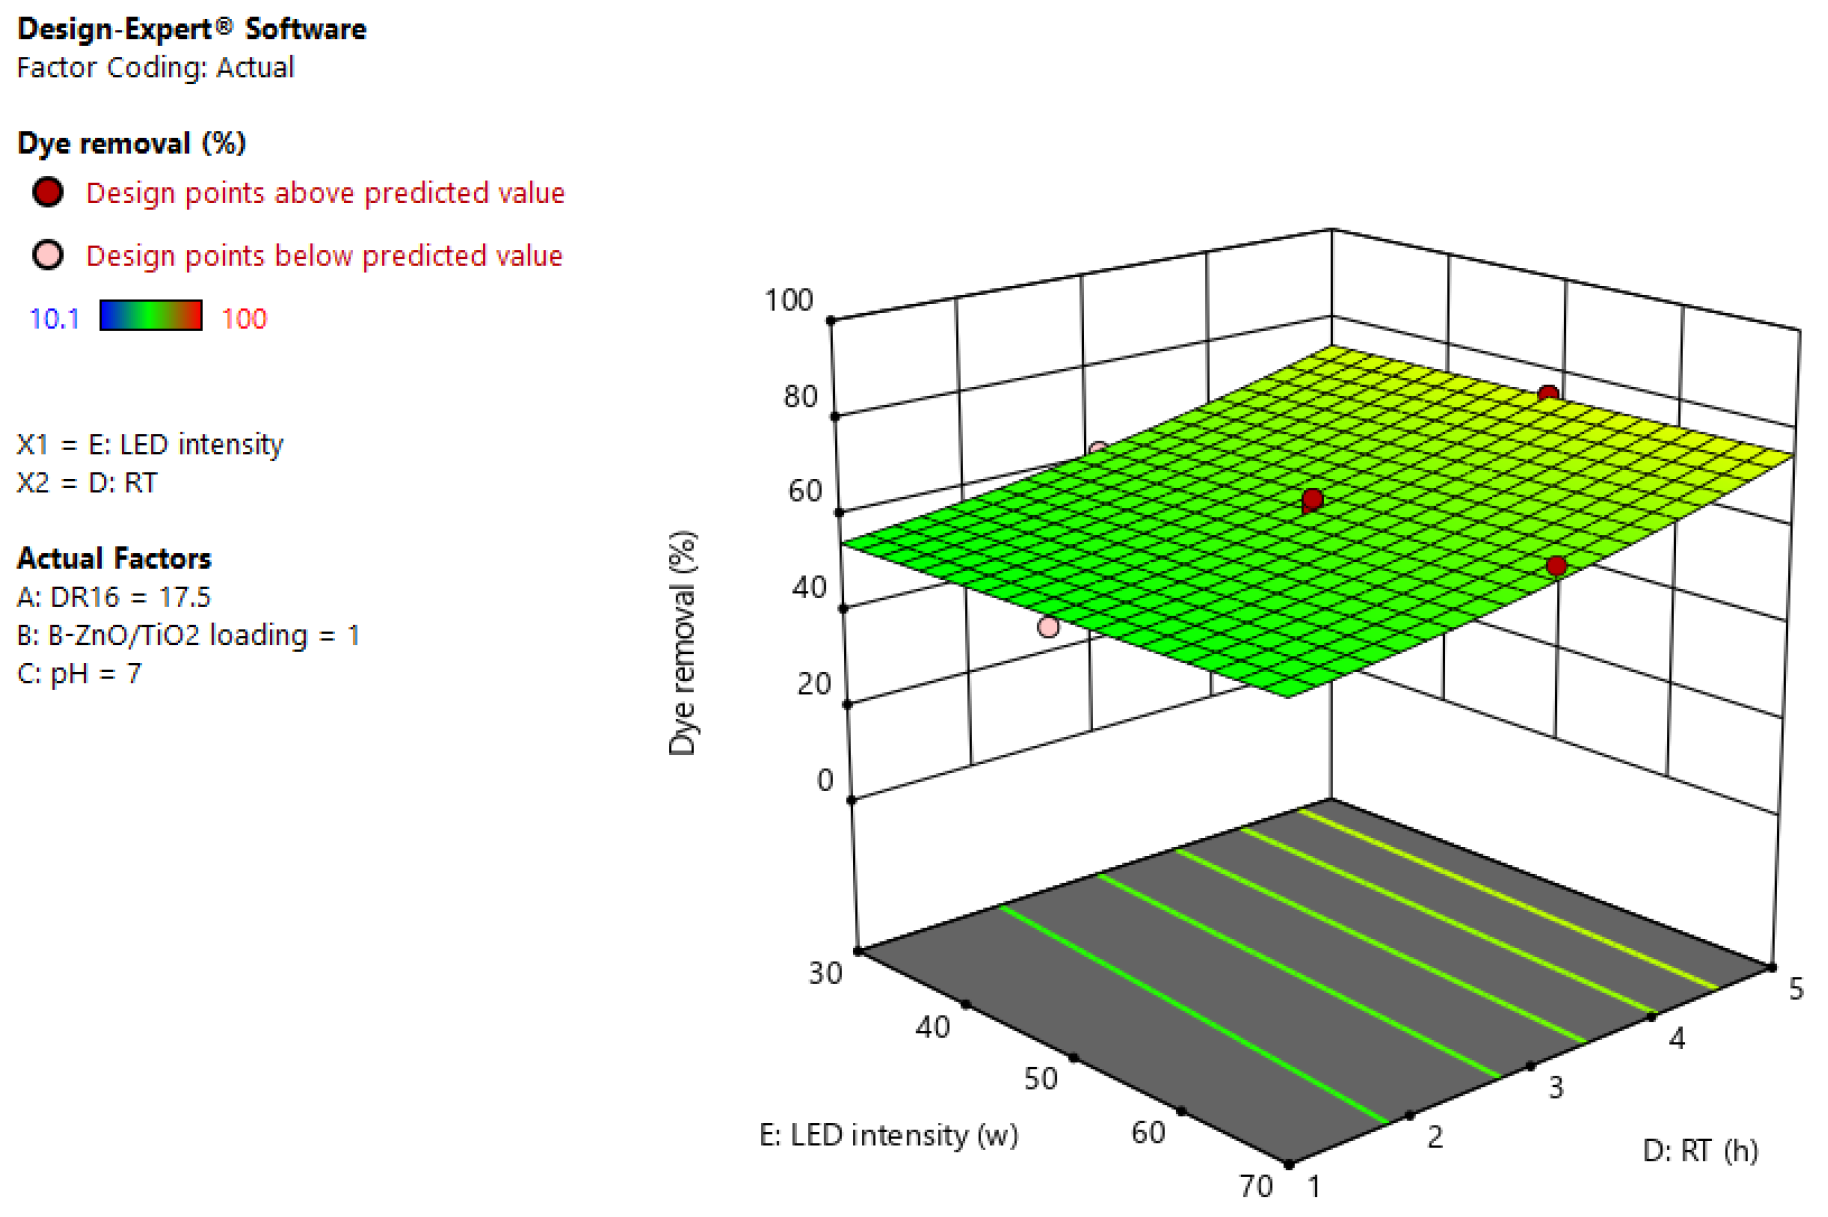
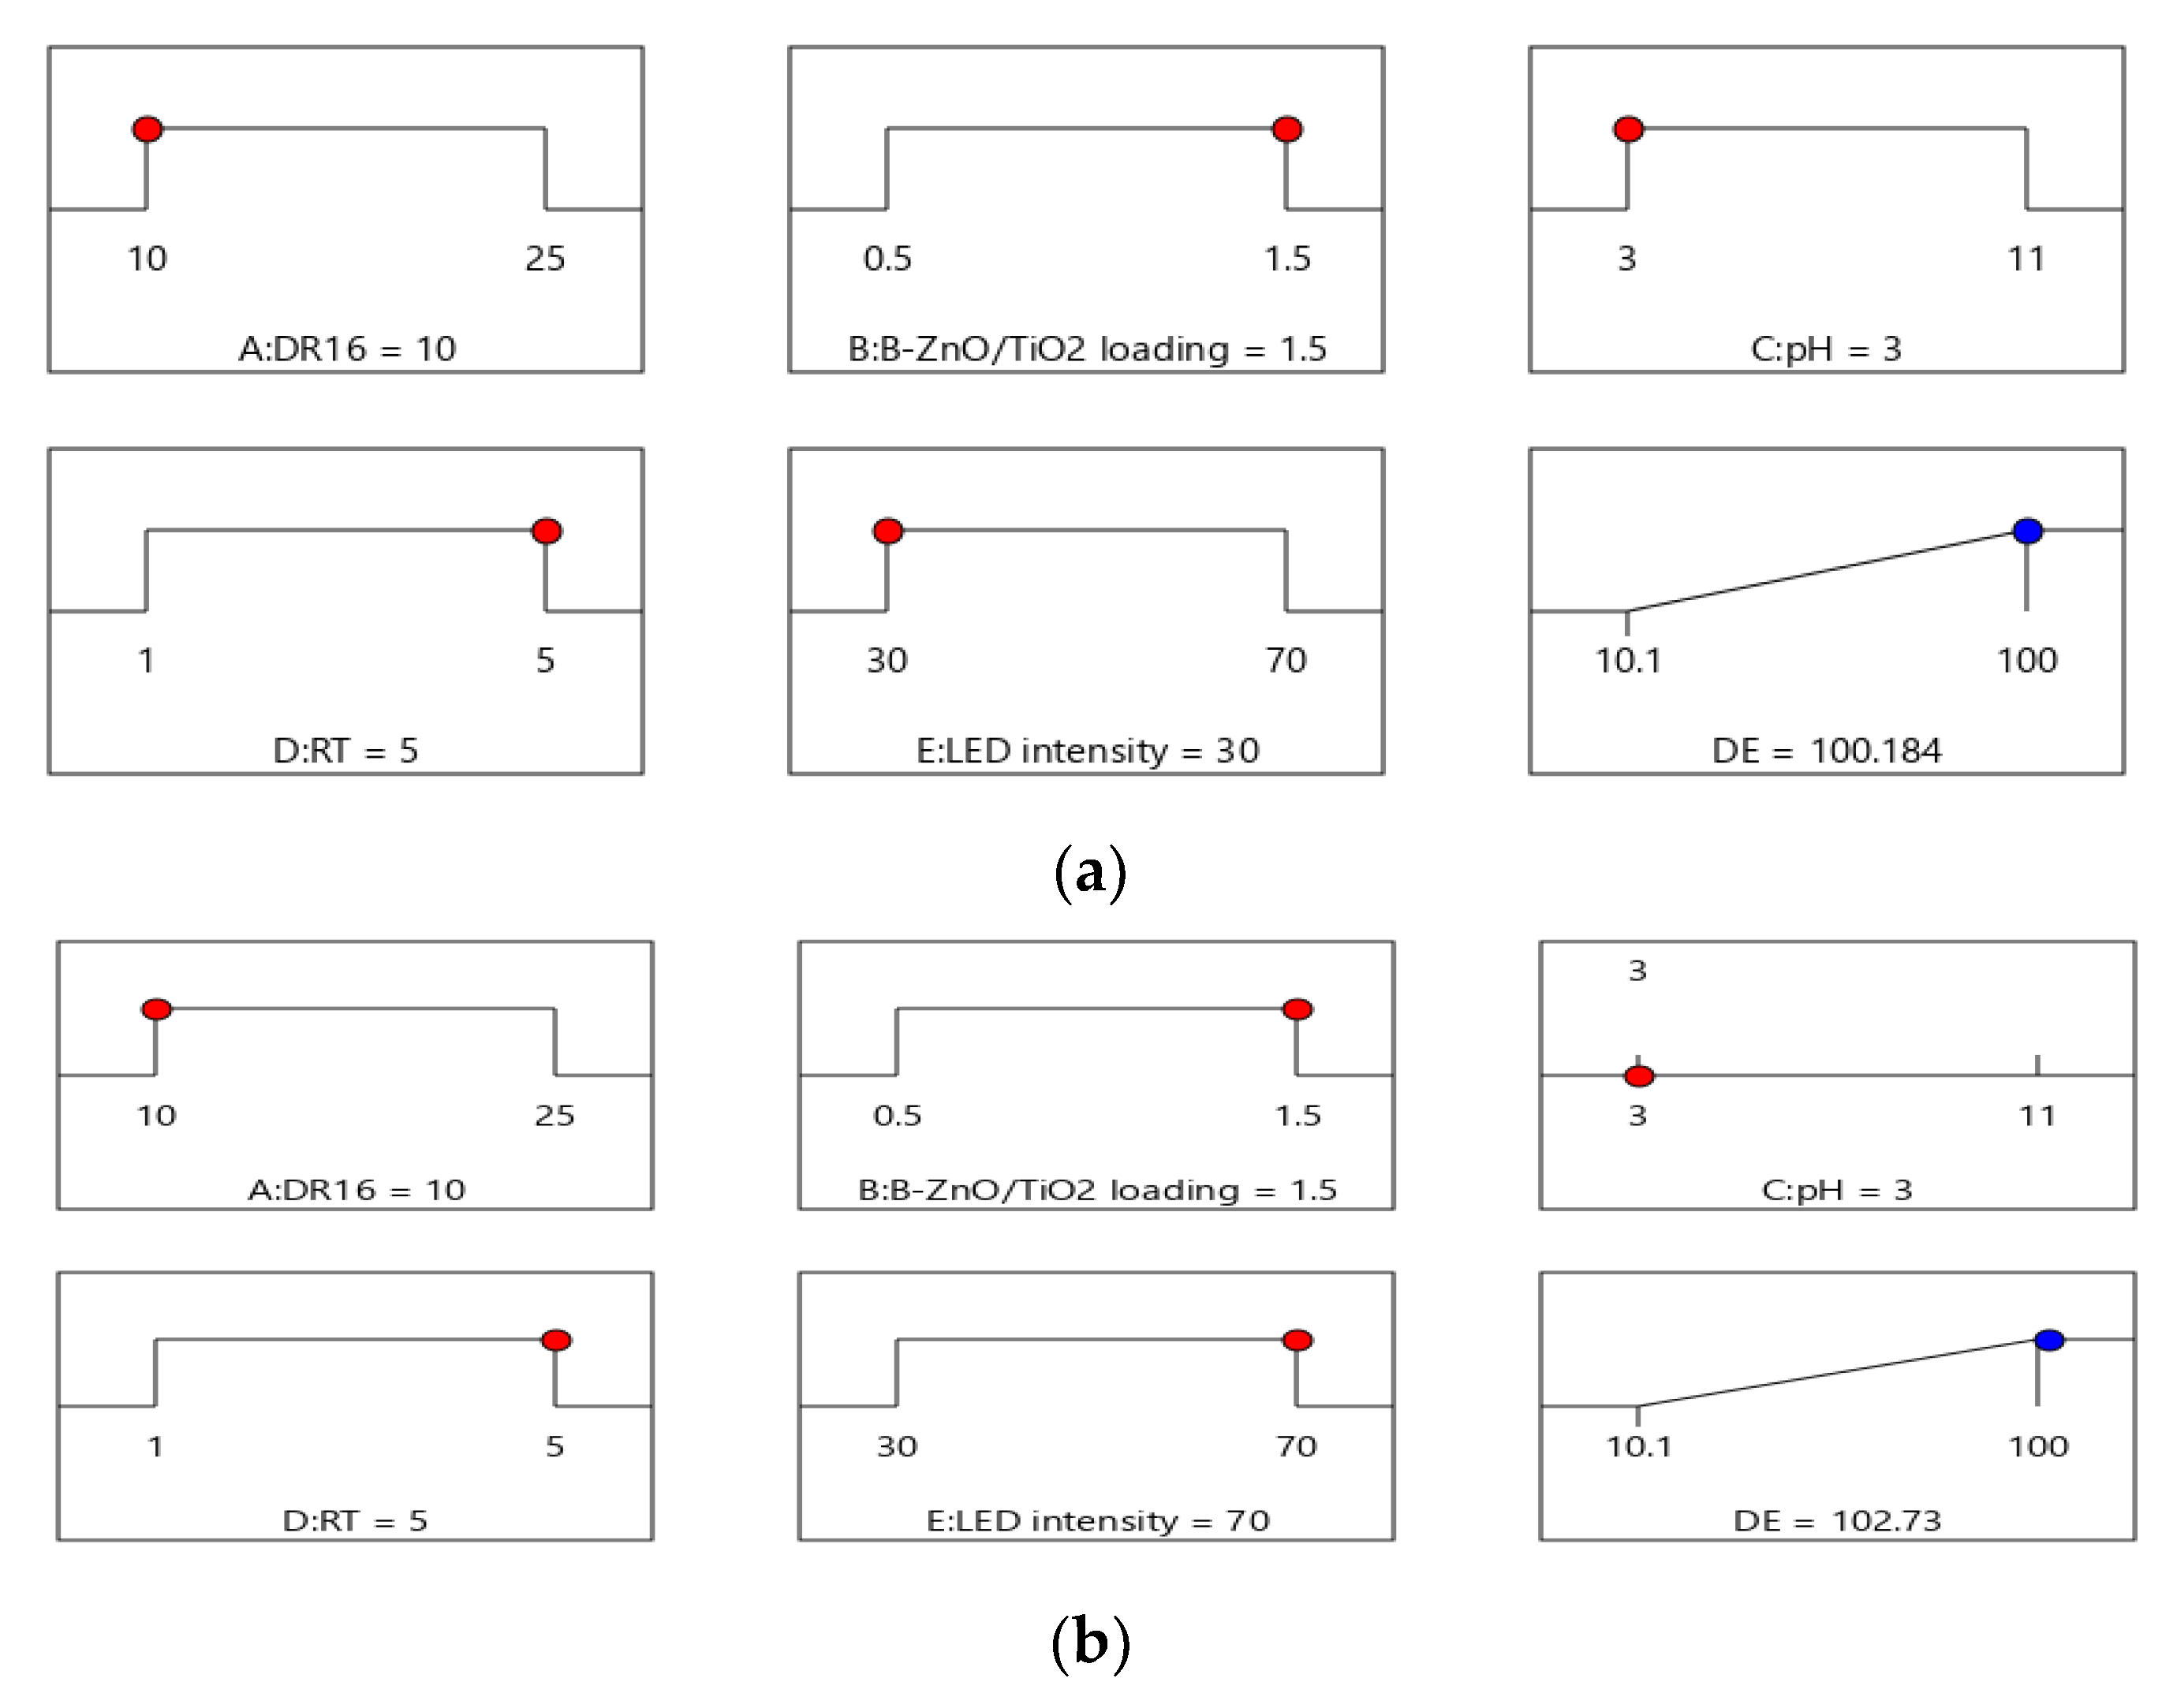
3.4. Photodegradation Process Modeling and Optimization

The relationships between independent variables and DR16 removal (response) were determined according to a second-order polynomial equation as follows:
Dye removal (%) = 62.5122 − 3.82353 A + 9.50588 B − 23.4971 C + 9.62059 D + 0.629412 E − 2.02187 AC − 1.99687 AD − 2.24062 AE − 3.16563 BC − 2.52188 BE − 0.890625 CD − 1.52188 CE − 11.7736 B2 − 2.4236 C2 + 2.3764 D2
where A and B are DR16 concentration (ppm) and B-ZnO/TiO2 loading (g/L), respectively. In addition, C, D, and E represent pH, reaction time (h), and LED intensity (W), respectively. The ANOVA results to assess the significance and suitability of the model are summarized in Table 4.
The ANOVA results reveal that the model was significant, as the F-value was 470.70. p-values less than 0.05 indicate model terms are significant, while values greater than 0.05 indicate the model terms are not significant. Accordingly, A, B, C, D, E, AC, AD, AE, BC, BE, CD, CE, and B² are significant model terms based on their p-values. Based on the ANOVA, all of the independent variables had significant effects on the response, while some interaction terms, including AB, BD, and DE, and some of the quadratic terms, including A2 and E2, had no significant effects. This study confirmed the parameters that influenced DR16 removal were not equal. According to the equation magnitude and the F-values of the variables, it can be concluded that C (pH) had the most influence on the DR16 removal, but A (DR16 concentration) and E (LED intensity) affected DR16 removal slightly. The positive signs in the equation indicate the positive effects of increasing B-ZnO/TiO2 loading, reaction time, and LED intensity on DR16 removal, and the negative signs indicate the negative effect of increasing DR16 concentration and pH on DR16 removal. The F-value of lack of fit (2.2) implied the model was good. The adequate precision was far more than 4 (84.076), which indicated an adequate signal (Table 5).
Three-dimensional plots were applied, to achieve a better understanding of the effects of changing the levels of the parameters on the removal efficiency, and to determine the optimal values. The influence of B-ZnO/TiO2 loading and reaction time on dye removal efficiency is observed in Figure 8. This 3D plot shows that, by increasing the B-ZnO/TiO2 loading from 0.5 to 1.5 g/L, and the reaction time from 1 to 5, the dye removal increases from 40 to 70%.
An increase in the amount of photocatalyst in the photodegradation process provides more reactive species and reactive sites, improving dye removal efficiency. On the other hand, a longer reaction time gives more opportunities for dye molecules to react with active species and be degraded.
Figure 9 depicts the effect of pH and reaction time on the dye removal at an initial concentration of DR16 of 17.5 mg/L, B-ZnO/TiO2 loading of 1 g/L, and LED intensity of 50. According to Figure 9, the change in pH from 3 to 11 leads to a significant decrease in the dye removal. This can be explained by the anionic nature of DR16 and the negative surface charge of B-ZnO/TiO2. In an acidic medium, the presence of positive ions neutralizes these negative charges and this creates the chance for dye molecules to approach the photocatalyst surface and adsorb on reactive sites, while in an alkaline medium the repulsion is dominant, inhibiting the dye molecules reacting with the surface. As can be seen in Figure 9, at acidic pH (3) and a middle level of retention time (3 h), a dye degradation of about 85 percent was obtained, while the TOC removal was 76.5%, which indicates the mineralization share. A similar result has been reported for DR16 photodegradation using C-N-TiO2/ZnFe2O4 under LED visible light and at an acidic pH (about 4) [43].
The effects of reaction time and LED intensity on dye removal at [DR16] = 17.5 mg/L, B-ZnO/TiO2 loading = 1, and pH = 7, are illustrated in Figure 10. By increasing the time from 1 to 5 h, the dye removal efficiency increased by about 15%, due to it having more time to react. A longer reaction and irradiation time led to the production of more reactive species, hence improving the dye removal efficiency.
Figure 11 reveals the optimization parameters for the two predicted maximum dye removals. Figure 11a shows the optimum conditions to reach the maximum predicted degradation efficiency under 30 W/m2 light irradiation, and Figure 11b is for 70 W/m2 light irradiation. From Figure 11, it is seen that both LED intensities applied could achieve maximum degradation efficiency with the highest desirability.

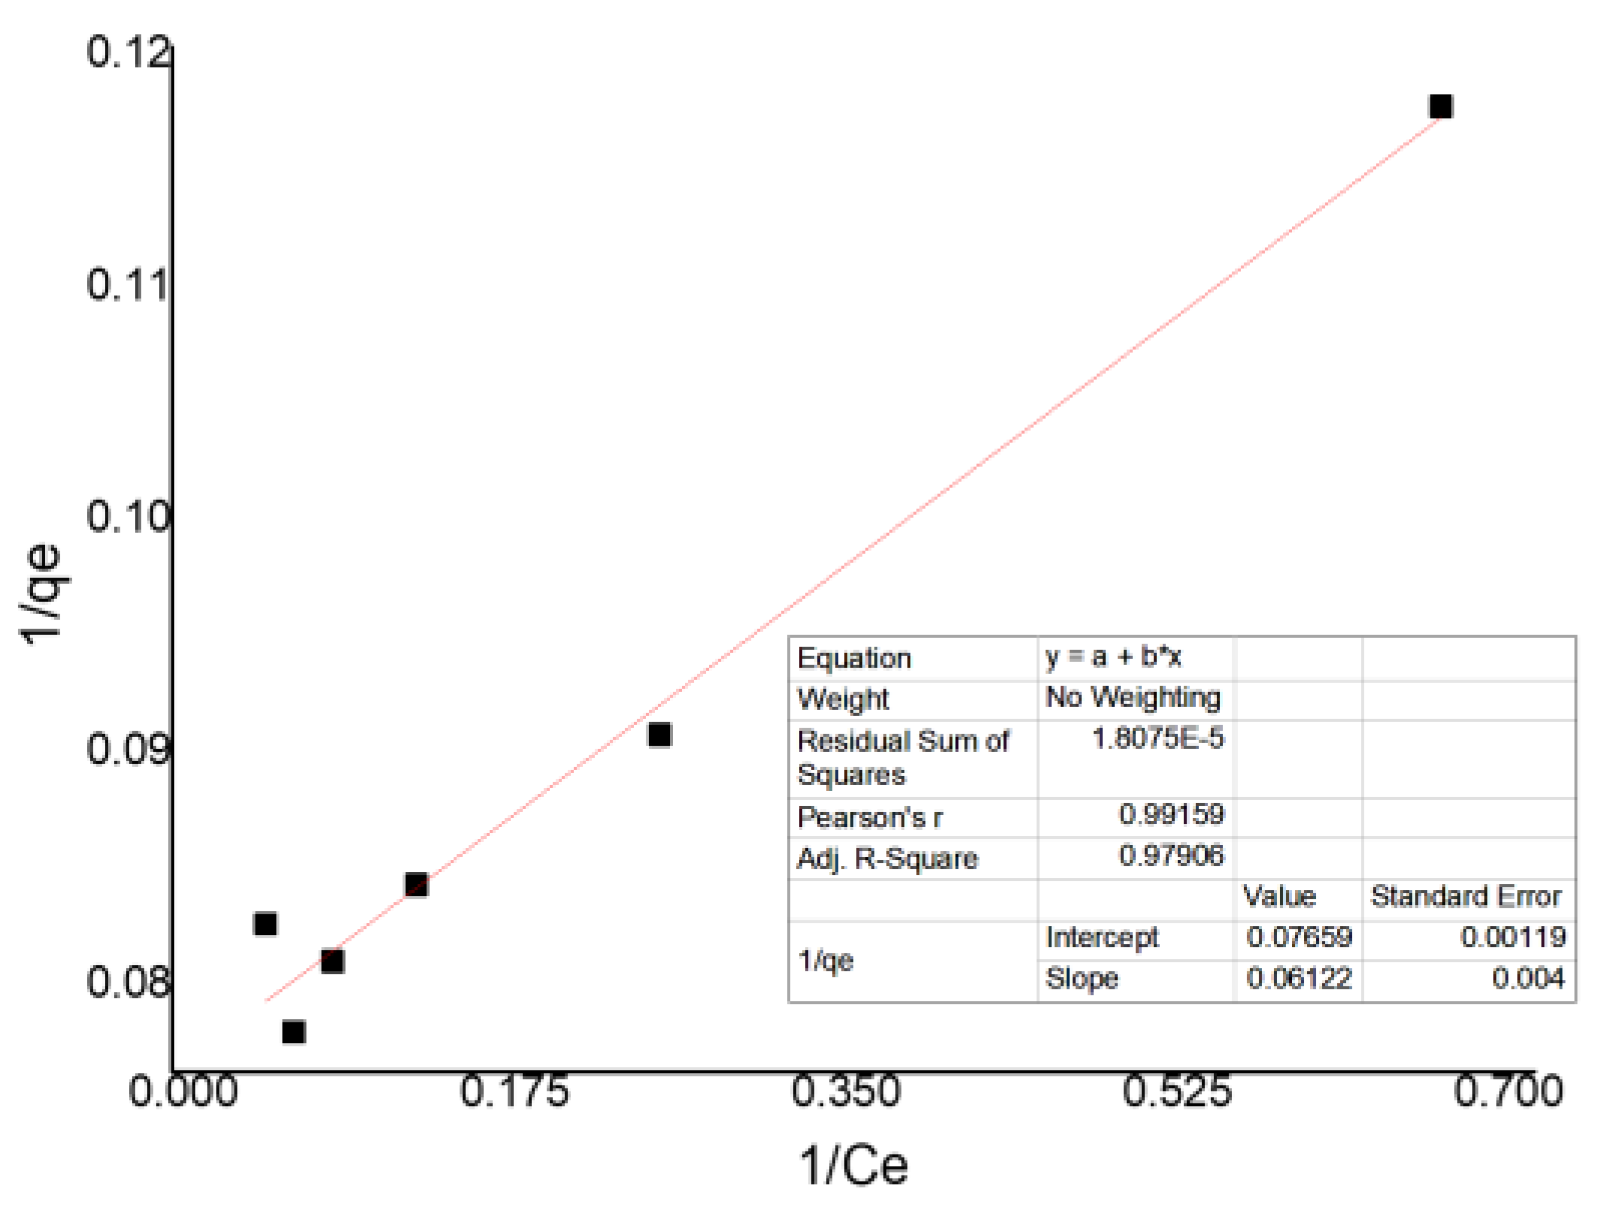
3.5. Evaluation of B-ZnO/TiO2 Isothermal Adsorption

Adsorption plays an important role in dye removal and photodegradation using photocatalysts. In the current study, the adsorption behavior of the B-ZnO/TiO2 photocatalyst was evaluated in an acidic solution under dark conditions for 180 min. The pseudo-first-order (Equation (15)) and pseudo-second-order equations (Equation (16)) were applied to the experimental data. Investigation of the adsorption kinetics confirmed that the DR16 adsorption by B-ZnO/TiO2 followed a pseudo-second-order model, according to the value of the regression correlation coefficient R2.
l n   q e q t = l n   q e k 1 t  
1 q e   = 1 K L q m a x   × 1   C e + 1 q m  
where qe is the amount of DR16 after adsorption time (mg/g), KL is the Langmuir constant, qmax is the maximum adsorption capacity (mg/g), and Ce is the concentration of DR16 at the equilibrium state.
Figure 12 shows the plot of 1/qe vs. 1/Ce. The slope and intercept were calculated from this plot by the Origin software. The separation factor (RL) was obtained from Equation (17).
R L = 1 1 + K L C 0
Figure 13a,b represent the B-ZnO/TiO2 nanocomposite powder before and after DR16 adsorption. Figure 13c shows the qualitative results of one of the adsorption experiments. The color of DR16 solution was faded after 180 min. The kinetic parameters of DR16 adsorption using B-ZnO/TiO2 nanocomposite are also represented in the Table 6.

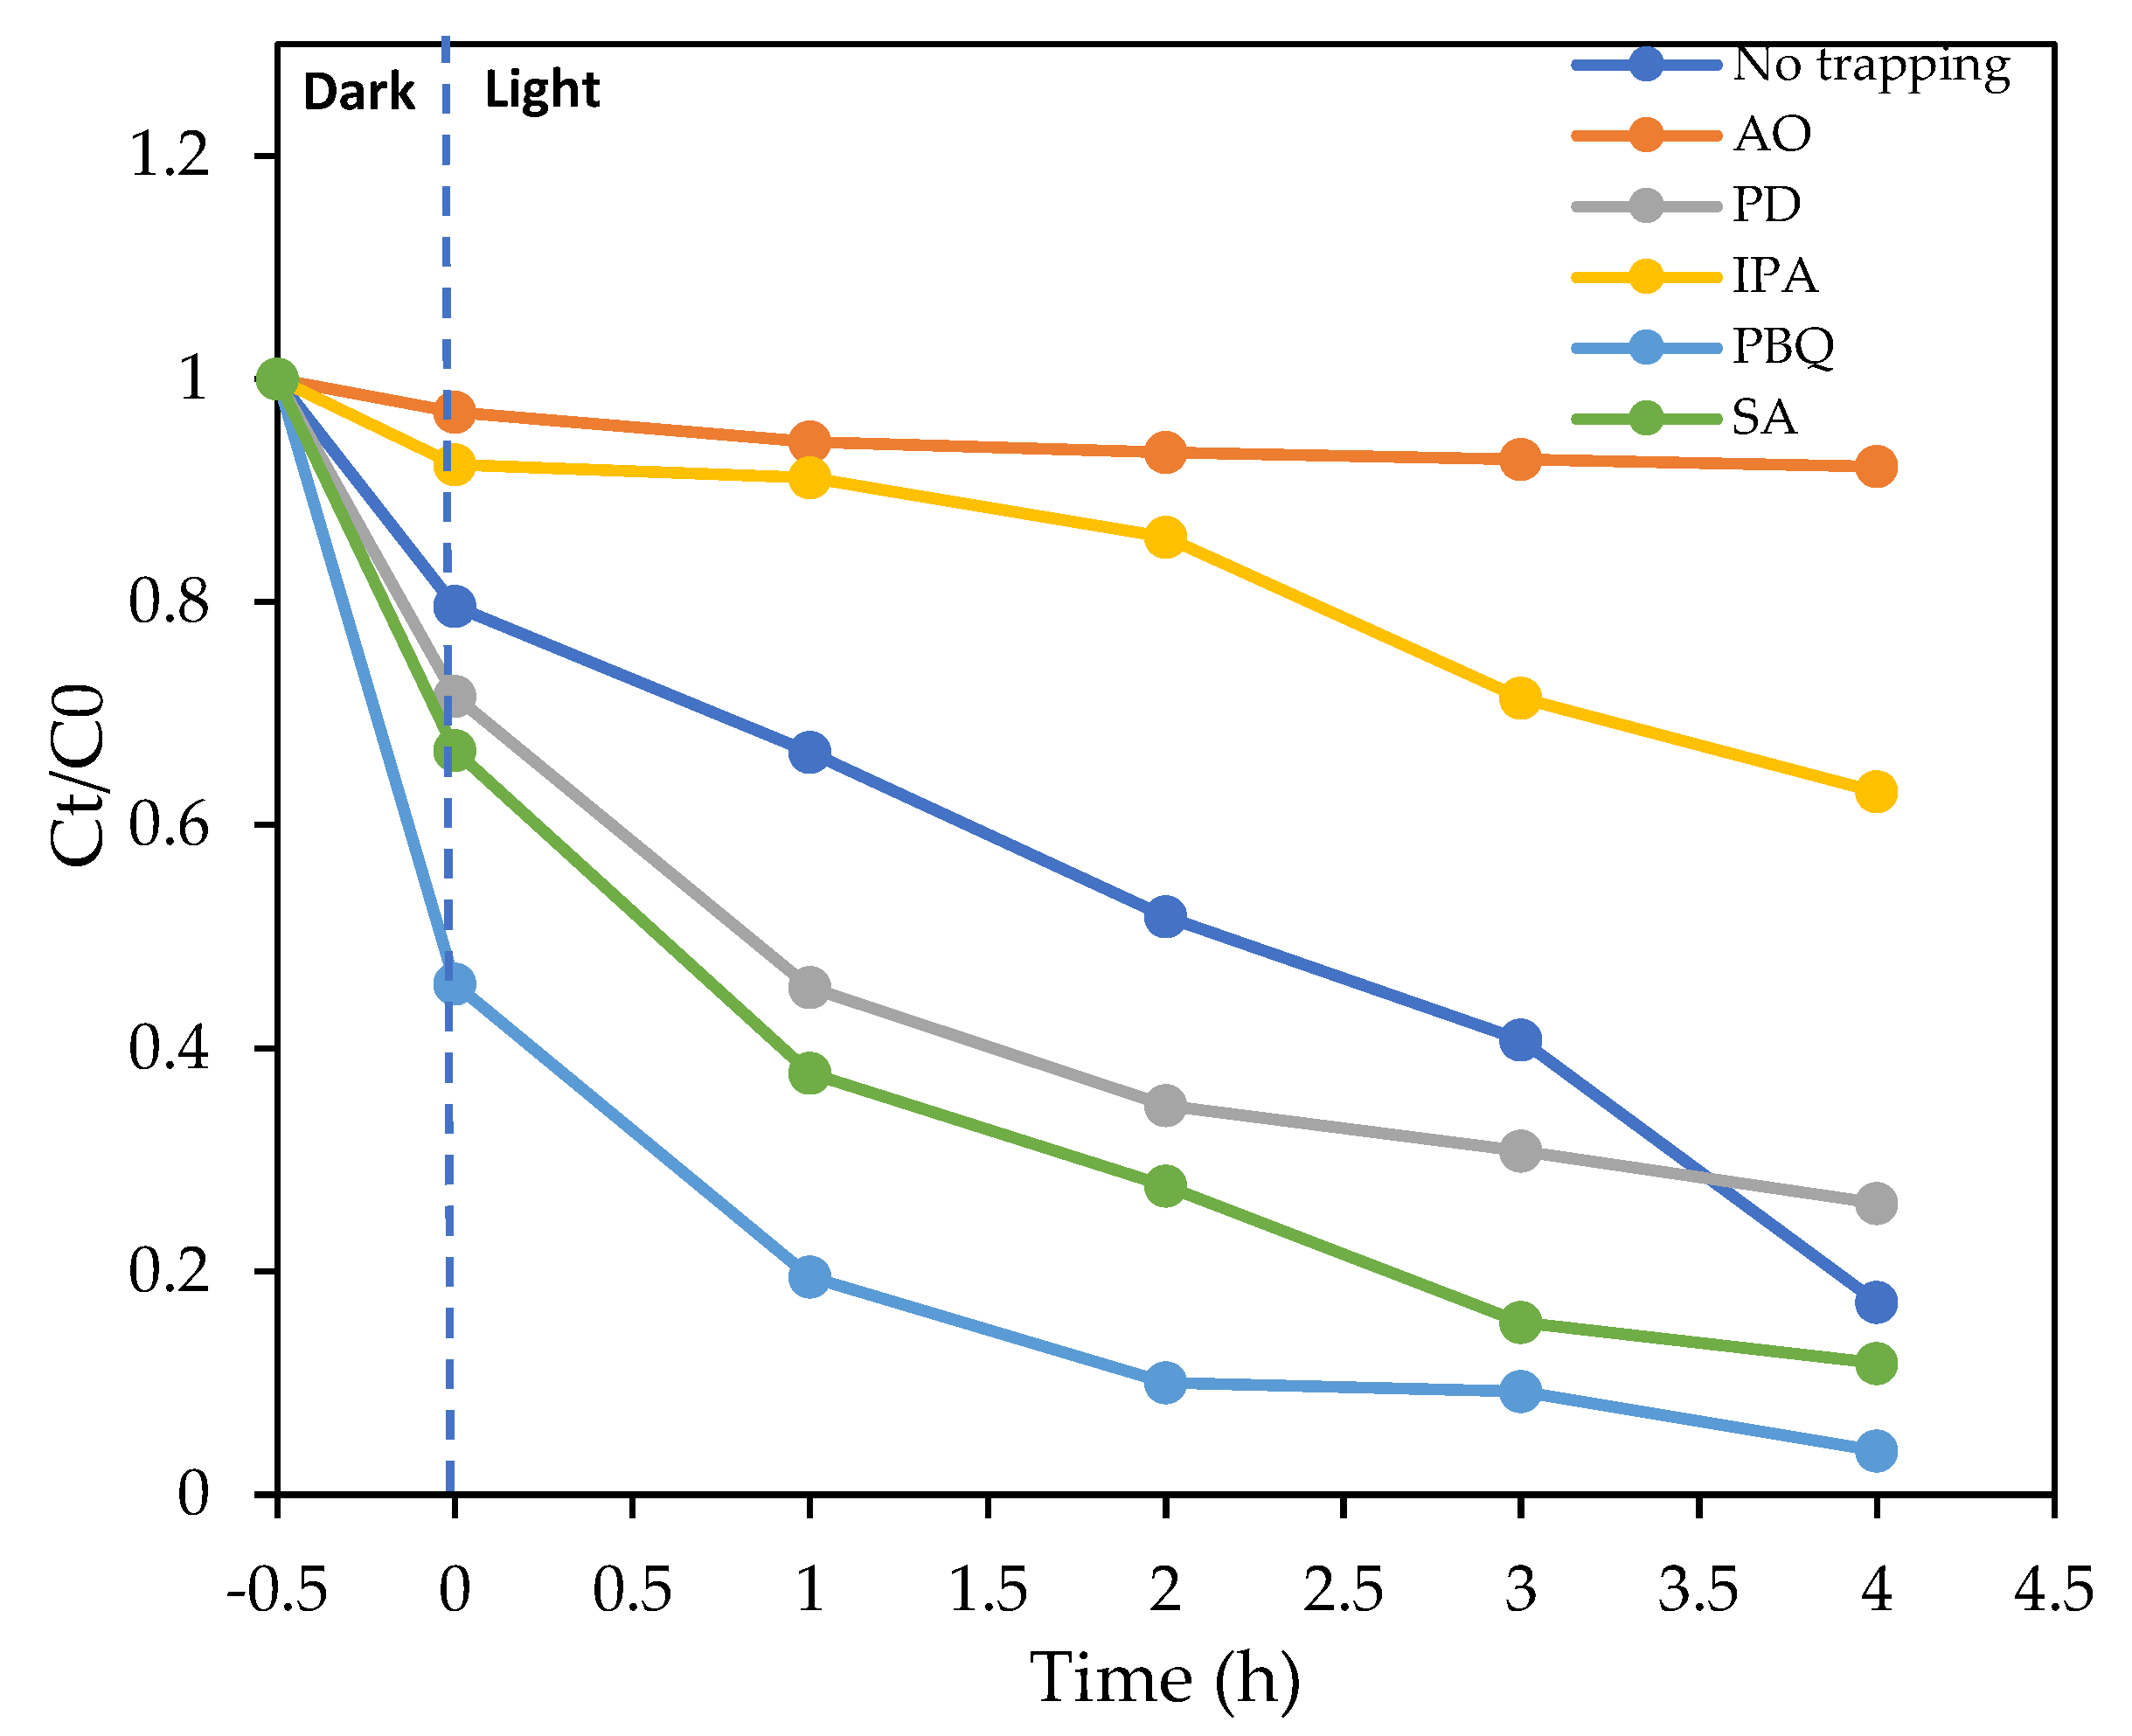
3.6. The Mechanism of Photodegradation of DR16 under Visible Light

In order to evaluate the contribution of the effective species (OH, O2•−, O2, e, and h+) for the photodegradation process of DR16, various scavengers including ammonium oxalate (AO) as an h+ reagent, potassium dichromate (PA) as an e reagent, isopropyl alcohol (IPA) as an OH reagent, para-benzoquinone (PBQ) as an O2•− reagent, and sodium azide (SA) as an O2 reagent, were employed. Figure 14 depicts the variation of Ct/C0 of DR16 as a function of irradiation time in the absence and presence of the scavengers used in this study. The h+ was the most effective species in the photodegradation of DR16 by B-ZnO/TiO2 (minimum photodegradation effect on DR16 was from adding ammonium oxalate). From the results, OH also shows an important role as an active species (effect of IPA on the Ct/C0). The least effective species was found to be O2 and O2 with the maximum response (Ct/C0).

3.7. Reusability of B-ZnO/TiO2

The reusability and stability of a photocatalyst during pollutant removal plays an essential role in industrial applications, and reduces wastewater treatment costs. The reusability of the B-ZnO/TiO2 photocatalyst during four cycles of photodegradation of DR16 was evaluated, with and without reactivation of the photocatalyst. The dye removal efficiency per cycle versus time is shown in Figure 15. The results show the photocatalytic performance with the reactivation process after each cycle decreased slightly, due to the loss of 81 mg of the photocatalyst. The photocatalyst’s performance without the reactivation procedure decreased significantly. This reduced performance could be related to catalyst loss during filtration, catalyst poisoning by pollutants, and dye accumulation on the catalyst surface [45]. The results confirmed that reactivation of photocatalysts improved their reusability and retained their efficiency.

3.8. Comparative Study

The features and performance of some previously reported ZnO/TiO2-based photocatalysts are compared to the results of this study, in Table 7. The studied B-ZnO/TiO2 photocatalyst considerably outperforms other photocatalysts in terms of the synthesis method, organic pollution removal, and reusability. Consequently, the B-ZnO/TiO2 photocatalyst appears to have a bright future in wide-spread practical use.

4. Conclusions

In this research, a B-ZnO/TiO2 photocatalyst was successfully prepared by the sol-gel method. The properties of this nanocomposite were characterized by XRD, SEM, zeta potential, PL, and DRS (UV-visible) analysis. XRD patterns revealed that the modification of TiO2 using B or ZnO separately, had no significant effects on the crystalline structure of TiO2, while applying the two simultaneously decreased the crystalline nature and created an amorphous composite. The surface charge evaluation confirmed that the addition of B enhanced particle stability, but ZnO coupling decreased the positive surface charge of particles severely, and hence reduced the composite’s stability and increased the agglomeration tendency. PL showed that doping B and ZnO into TiO2 improved the lifetime of photogenerated charge carriers. The photocatalytic and adsorption performances of B-ZnO/TiO2 were evaluated by photodegradation and adsorption of DR16, as an azo dye. The effects of five variables including DR16 concentration, B-ZnO/TiO2 dosage, pH, reaction time, and intensity of LED visible irradiation were optimized in the dye removal process. The adsorption process follows a pseudo-second-order model. B (5%)-ZnO (0.05%)/TiO2 maintained its photodegradation efficiency after four cycles with reactivation of the photocatalyst.

Author Contributions

Conceptualization, S.A.H., A.A.Z. and H.Z.; methodology, S.A.H., A.A.Z. and H.Z.; software, S.A.H. and H.Z.; formal analysis, S.A.H., A.A.Z. and H.Z.; investigation, A.A.Z. and H.Z.; resources, A.A.Z.; data curation, S.A.H., A.A.Z. and H.Z.; writing—original draft preparation, S.A.H.; writing—review and editing, S.A.H., A.A.Z. and H.Z.; visualization, H.Z.; supervision, A.A.Z. and H.Z.; project administration, A.A.Z. and H.Z.; funding acquisition, A.A.Z. All authors have read and agreed to the published version of the manuscript.

Funding

This research received no external funding.

Data Availability Statement

Data are contained within the article.

Acknowledgments

The authors would like to gratefully acknowledge Razi University and Iran Nanotechnology Initiative Council for the financial support and equipment provided for this research.

Conflicts of Interest

The authors declare no conflict of interest.

References

  1. Boumaza, S.; Kaouah, F.; Hamane, D.; Trari, M.; Omeiri, S.; Bendjama, Z. Visible light assisted decolorization of azo dyes: Direct Red 16 and Direct Blue 71 in aqueous solution on the p-CuFeO2/n-ZnO system. J. Mol. Catal. A Chem. 2014, 393, 156–165. [Google Scholar] [CrossRef]
  2. Farooq, U.; Chaudhary, P.; Ingole, P.P.; Kalam, A.; Ahmad, T. Development of cuboidal KNbO3@α-Fe2O3hybrid nanostructures for improved photocatalytic and photoelectrocatalytic applications. ACS Omega 2020, 5, 20491–20505. [Google Scholar] [CrossRef] [PubMed]
  3. Abdolmohammad-Zadeh, H.; Nejati, K.; Ghorbani, E. Synthesis, Characterization, and Application of Zn-Al Layered Double Hydroxide as a Nano-Sorbent for the Removal of Direct Red 16 from Industrial Wastewater Effluents. Chem. Eng. Commun. 2015, 202, 1349–1359. [Google Scholar] [CrossRef]
  4. Khan, I.; Saeed, K.; Zekker, I.; Zhang, B.; Hendi, A.H.; Ahmad, A.; Ahmad, S.; Zada, N.; Ahmad, H.; Shah, L.A.; et al. Review on Methylene Blue: Its Properties, Uses, Toxicity and Photodegradation. Water 2022, 14, 242. [Google Scholar] [CrossRef]
  5. Jamil, N.; Khan, M.; Ahsan, N.; Anwar, J.; Qadir, A.; Zameer, M.; Shafique, U. Removal of direct red 16 (Textile Dye) from industrial effluent by using feldspar. J. Chem. Soc. Pakistan 2014, 36, 191–197. [Google Scholar]
  6. Soleymani, A.R.; Saien, J.; Chin, S.; Le, H.A.; Park, E.; Jurng, J. Modeling and optimization of a sono-assisted photocatalytic water treatment process via central composite design methodology. Process Saf. Environ. Prot. 2015, 94, 307–314. [Google Scholar] [CrossRef]
  7. Fard, B.H.; Khojasteh, R.R.; Gharbani, P. Photocatalytic degradation of direct red 16 dye using Ag/Ag3VO4/AgVO3/GO nanocomposite. S. Afr. J. Chem. 2020, 73, 1–8. [Google Scholar] [CrossRef]
  8. Naeem, H.T.; Hassan, A.A.; Al-Khateeb, R.T. Wastewater-(Direct red dye) treatment-using solar fenton process. J. Pharm. Sci. Res. 2018, 10, 2309–2313. [Google Scholar]
  9. Araujo, F.P.; Trigueiro, P.; Honório, L.M.C.; Oliveira, D.M.; Almeida, L.C.; Garcia, R.P.; Lobo, A.O.; Cantanhêde, W.; Silva-Filho, E.C.; Osajima, J.A. Eco-friendly synthesis and photocatalytic application of flowers-like ZnO structures using Arabic and Karaya Gums. Int. J. Biol. Macromol. 2020, 165, 2813–2822. [Google Scholar] [CrossRef]
  10. Farooq, U.; Naz, F.; Phul, R.; Pandit, N.A.; Jain, S.K.; Ahmad, T. Development of Heterostructured Ferroelectric SrZrO3/CdS Photocatalysts with Enhanced Surface Area and Photocatalytic Activity. J. Nanosci. Nanotechnol. 2019, 20, 3770–3779. [Google Scholar] [CrossRef]
  11. Ahmad, S.; Almehmadi, M.; Janjuhah, H.T.; Kontakiotis, G.; Abdulaziz, O.; Saeed, K.; Ahmad, H.; Allahyani, M.; Aljuaid, A.; Alsaiari, A.A.; et al. The Effect of Mineral Ions Present in Tap Water on Photodegradation of Organic Pollutants: Future Perspectives. Water 2023, 15, 175. [Google Scholar] [CrossRef]
  12. De Oliveira, W.V.; Morais, A.Í.S.; Honorio, L.M.C.; Trigueiro, P.A.; Almeida, L.C.; Garcia, R.R.P.; Viana, B.C.; Furtini, M.B.; Silva-Filho, E.C.; Osajima, J.A. TiO2 Immobilized on Fibrous Clay as Strategies to Photocatalytic Activity. Mat. Res. 2020, 23, 1439–1516. [Google Scholar] [CrossRef]
  13. Li, W.; Wu, D.; Yu, Y.; Zhang, P.; Yuan, J.; Cao, Y.; Cao, Y.; Xu, J. Investigation on a novel ZnO/TiO2-B photocatalyst with enhanced visible photocatalytic activity. Phys. E Low-Dimens. Syst. Nanostruct. 2014, 58, 118–123. [Google Scholar] [CrossRef]
  14. Yang, C.C.; Dao, K.C.; Lin, Y.S.; Cheng, T.Y.; Chen, K.F.; Tsai, Y.P. Impacts of mixing mode on photocatalytic reduction of hexavalent chromium over titanium dioxide nanomaterial under various environmental conditions. Water 2021, 13, 2291. [Google Scholar] [CrossRef]
  15. Freitas, W.A.; Soares, B.E.C.F.; Rodrigues, M.S.; Trigueiro, P.; Honorio, L.M.C.; Peña-Garcia, R.; Alcântara, A.C.S.; Silva-Filho, E.C.; Fonseca, M.G.; Furtini, M.B.; et al. Facile synthesis of ZnO-clay minerals composites using an ultrasonic approach for photocatalytic performance. J. Photochem. Photobiol. A Chem. 2022, 429, 113934. [Google Scholar] [CrossRef]
  16. Wang, Y.; Liu, X.; Guo, L.; Shang, L.; Ge, S.; Song, G.; Naik, N.; Shao, Q.; Lin, J.; Guo, Z. Metal organic framework-derived C-doped ZnO/TiO2 nanocomposite catalysts for enhanced photodegradation of Rhodamine B. J. Colloid Interface Sci. 2021, 599, 566–576. [Google Scholar] [CrossRef] [PubMed]
  17. Tian, J.; Wang, J.; Dai, J.; Wang, X.; Yin, Y. N-doped TiO2/ZnO composite powder and its photocatalytic performance for degradation of methyl orange. Surf. Coat. Technol. 2009, 204, 723–730. [Google Scholar] [CrossRef]
  18. Bai, N.; Liu, X.; Li, Z.; Ke, X.; Zhang, K.; Wu, Q. High-efficiency TiO2/ZnO nanocomposites photocatalysts by sol–gel and hydrothermal methods. J. Sol-Gel Sci. Technol. 2021, 99, 92–100. [Google Scholar] [CrossRef]
  19. Zhang, W.; Liu, Y. Sol-gel Synthesis of Boron Doped TiO2/hollow Glass Bubbles Composite Powders for Photocatalytic Degradation of Azophloxine. Curr. Nanosci. 2021, 17, 475–483. [Google Scholar] [CrossRef]
  20. Khan, R.; Kim, S.W.; Kim, T.J.; Nam, C.M. Comparative study of the photocatalytic performance of boron-iron Co-doped and boron-doped TiO2 nanoparticles. Mater. Chem. Phys. 2008, 112, 167–172. [Google Scholar] [CrossRef]
  21. Cano-Casanova, L.; Ansón-Casaos, A.; Hernández-Ferrer, J.; Benito, A.M.; Maser, W.K.; Garro, N.; Lillo-Ródenas, M.A.; Román-Martínez, M.C. Surface-Enriched Boron-Doped TiO2Nanoparticles as Photocatalysts for Propene Oxidation. ACS Appl. Nano Mater. 2022, 5, 12527–12539. [Google Scholar] [CrossRef] [PubMed]
  22. Moradi, S.; Aberoomand-Azar, P.; Raeis-Farshid, S.; Abedini-Khorrami, S.; Givianrad, M.H. The effect of different molar ratios of ZnO on characterization and photocatalytic activity of TiO2/ZnO nanocomposite. J. Saudi Chem. Soc. 2016, 20, 373–378. [Google Scholar] [CrossRef] [Green Version]
  23. Bakhtkhosh, P.; Mehrizad, A. Sonochemical synthesis of Sm-doped ZnS nanoparticles for photocatalytic degradation of Direct Blue 14: Experimental design by response surface methodology and development of a kinetics model. J. Mol. Liq. 2017, 240, 65–73. [Google Scholar] [CrossRef]
  24. Cavalcante, R.P.; Dantas, R.F.; Bayarri, B.; González, O.; Giménez, J.; Esplugas, S.; Machulek, A. Synthesis and characterization of B-doped TiO2 and their performance for the degradation of metoprolol. Catal. Today 2015, 252, 27–34. [Google Scholar] [CrossRef]
  25. Shathy, R.A.; Fahim, S.A.; Sarker, M.; Quddus, S.; Moniruzzaman, M.; Masum, S.M.; Molla, A.I. Natural Sunlight Driven Photocatalytic Removal of Toxic Textile Dyes in Water Using B-Doped ZnO/TiO2 Nanocomposites. Catalysts 2022, 12, 308. [Google Scholar] [CrossRef]
  26. Zou, X.; Dong, X.; Wang, L.; Ma, H.; Zhang, X.; Zhang, X. Preparation of ni doped ZnO-TiO2 composites and their enhanced photocatalytic activity. Int. J. Photoenergy 2014, 2014, 893158. [Google Scholar] [CrossRef] [Green Version]
  27. Ji, L.; Li, J.; Lei, J.; Ren, Y.; Zhou, S.; Liang, L. Preparation and characterization of Cu2+/ZnO/TiO2 nanocomposites for the treatment of typical benzene series in oilfield produced water. Catal. Commun. 2023, 174, 106572. [Google Scholar] [CrossRef]
  28. Nassar, M.Y.; Ali, A.A.; Amin, A.S. A facile Pechini sol-gel synthesis of TiO2/Zn2TiO2/ZnO/C nanocomposite: An efficient catalyst for the photocatalytic degradation of Orange G textile dye. RSC Adv. 2017, 7, 30411–30421. [Google Scholar] [CrossRef] [Green Version]
  29. Sienkiewicz, A.; Wanag, A.; Kusiak-Nejman, E.; Ekiert, E.; Rokicka-Konieczna, P.; Morawski, A.W. Effect of calcination on the photocatalytic activity and stability of TiO2 photocatalysts modified with APTES. J. Environ. Chem. Eng. 2021, 9, 104794. [Google Scholar] [CrossRef]
  30. Wanag, A.; Sienkiewicz, A.; Rokicka-Konieczna, P.; Kusiak-Nejman, E.; Morawski, A.W. Influence of modification of titanium dioxide by silane coupling agents on the photocatalytic activity and stability. J. Environ. Chem. Eng. 2020, 8, 103917. [Google Scholar] [CrossRef]
  31. Joseyphus, R.S.; Pushparajan, J.; Akansha, M.; Johnson, K.; Anjana, P.M.; Arish, D. Selective detection of Fe3+ ion using Zn2TiO4 through fluorescence quenching probes. Res. Sq. 2022. preprint. [Google Scholar] [CrossRef]
  32. Gebru, K.A.; Das, C. Removal of chromium (VI) ions from aqueous solutions using amine-impregnated TiO2 nanoparticles modified cellulose acetate membranes. Chemosphere 2018, 191, 673–684. [Google Scholar] [CrossRef]
  33. Liao, D.L.; Wu, G.S.; Liao, B.Q. Zeta potential of shape-controlled TiO2 nanoparticles with surfactants. Colloids Surfaces A Physicochem. Eng. Asp. 2009, 348, 270–275. [Google Scholar] [CrossRef]
  34. Pirinejad, L.; Maleki, A.; Shahmoradi, B.; Daraei, H.; Yang, J.K.; Lee, S.M. Synthesis and application of Fe-N-Cr-TiO2 nanocatalyst for photocatalytic degradation of Acid Black 1 under LED light irradiation. J. Mol. Liq. 2019, 279, 232–240. [Google Scholar] [CrossRef]
  35. Raguram, T.; Rajni, K.S. Influence of boron doping on the structural, spectral, optical and morphological properties of TiO2 nanoparticles synthesized by sol–gel technique for DSSC applications. Mater. Today Proc. 2019, 33, 2110–2115. [Google Scholar] [CrossRef]
  36. Jaiswal, R.; Patel, N.; Dashora, A.; Fernandes, R.; Yadav, M.; Edla, R.; Varma, R.; Kothari, D.; Ahuja, B.; Miotello, A. Efficient Co-B-codoped TiO2 photocatalyst for degradation of organic water pollutant under visible light. Appl. Catal. B Environ. 2016, 183, 242–253. [Google Scholar] [CrossRef]
  37. Patel, N.; Dashora, A.; Jaiswal, R.; Fernandes, R.; Yadav, M.; Kothari, D.C.; Ahuja, B.L.; Miotello, A. Experimental and Theoretical Investigations on the Activity and Stability of Substitutional and Interstitial Boron in TiO2 Photocatalyst. J. Phys. Chem. C 2015, 119, 18581–18590. [Google Scholar] [CrossRef]
  38. Pozan, G.S.; Kambur, A. Significant enhancement of photocatalytic activity over bifunctional ZnO-TiO2 catalysts for 4-chlorophenol degradation. Chemosphere 2014, 105, 152–159. [Google Scholar] [CrossRef] [PubMed]
  39. Vučić, M.D.R.; Mitrović, J.Z.; Kostić, M.M.; Velinov, N.D.; Najdanović, S.M.; Bojić, D.V.; Bojić, A.L. Heterogeneous photocatalytic degradation of anthraquinone dye reactive blue 19: Optimization, comparison between processes and identification of intermediate products. Water SA 2020, 46, 291–299. [Google Scholar] [CrossRef]
  40. Zebardast, M.; Shojaei, A.F.; Tabatabaeian, K. Enhanced removal of methylene blue dye by bimetallic nano-sized MOF-5s. Iran. J. Catal. 2018, 8, 297–309. [Google Scholar]
  41. Bouanimba, N.; Laid, N.; Zouaghi, R.; Sehili, T. Effect of pH and inorganic salts on the photocatalytic decolorization of methyl orange in the presence of TiO2 P25 and PC500. Desalin. Water Treat. 2015, 53, 951–963. [Google Scholar] [CrossRef]
  42. Guillard, C.; Lachheb, H.; Houas, A.; Ksibi, M.; Elaloui, E.; Herrmann, J.M. Influence of chemical structure of dyes, of pH and of inorganic salts on their photocatalytic degradation by TiO2 comparison of the efficiency of powder and supported TiO2. J. Photochem. Photobiol. A Chem. 2003, 158, 27–36. [Google Scholar] [CrossRef]
  43. Zangeneh, H.; Farhadian, M.; Zinatizadeh, A.A. A reusable visible driven N and C-N doped TiO2 magnetic nanocomposites for photodegradation of direct red 16 azo dye in water and wastewater. Environ. Technol. 2022, 43, 1269–1284. [Google Scholar] [CrossRef]
  44. Yagub, M.T.; Sen, T.K.; Afroze, S.; Ang, H.M. Dye and its removal from aqueous solution by adsorption: A review. Adv. Colloid Interface Sci. 2014, 209, 172–184. [Google Scholar] [CrossRef] [PubMed]
  45. Ani, I.J.; Akpan, U.G.; Olutoye, M.A.; Hameed, B.H. Photocatalytic degradation of pollutants in petroleum refinery wastewater by TiO2- and ZnO-based photocatalysts: Recent development. J. Clean. Prod. 2018, 205, 930–954. [Google Scholar] [CrossRef]
Figure 1. Effect of ZnO loading (a) and B loading (b) in the nanocomposite on dye removal efficiency.
Water 15 01203 g001
Figure 2. XRD patterns of TiO2, B-TiO2, ZnO/TiO2, and B-ZnO/TiO2.
Water 15 01203 g002
Figure 3. SEM images and particle size analysis of pure TiO2 (ac), B-TiO2 (df), ZnO/TiO2 (gi), and B-ZnO/TiO2 (jl).
Water 15 01203 g003aWater 15 01203 g003b
Figure 4. EDS elemental mapping analysis of B-ZnO/TiO2 nanocomposite.
Water 15 01203 g004
Figure 5. (a) DRS spectra, (b) Tauc plots, and (c) PL analysis for pure TiO2, B-TiO2, ZnO/TiO2, and B-ZnO/TiO2.
Water 15 01203 g005
Figure 6. Effect of acceptor reagents on DR16 dye removal.
Water 15 01203 g006
Figure 7. Effect of irradiation type on DR16 removal efficiency.
Water 15 01203 g007
Figure 8. Three-dimensional surface plots of dye removal efficiency as a function of reaction time and B-ZnO/TiO2 loading at [DR16] = 17.5 mg/L, pH = 7, and LED intensity = 50.
Water 15 01203 g008
Figure 9. Three-dimensional surface plots of dye removal efficiency as a function of reaction time and pH at [DR16] = 17.5 mg/L, B-ZnO/TiO2 loading = 1, and LED intensity = 50.
Water 15 01203 g009
Figure 10. Three-dimensional surface plots of dye removal efficiency as a function of reaction time and LED intensity at [DR16] = 17.5 mg/L, B-ZnO/TiO2 loading = 1, and pH = 7.
Water 15 01203 g010
Figure 11. Optimization parameters for two predictions at LED intensities of (a) 40 W/m2, and (b) 70 W/m2, with desirability = 1.
Water 15 01203 g011
Figure 12. Kinetic study of DR16 adsorption process. RL values demonstrate the type of adsorption, with RL = 0 attributed to irreversible adsorption, 0 < RL < 1 for favorable adsorption, RL = 1 for linear adsorption, and RL > 1 for unfavorable adsorption. RL for DR16 removal was obtained as 0.444235, which confirmed the adsorption type is favorable [44]. The intercept, slope, qmax, KL, RL, and R2 are listed in Table 6.
Water 15 01203 g012
Figure 13. B-ZnO/TiO2 changes during DR16 adsorption: before adsorption (a), after adsorption (b), and (c) color changes in DR16 solution (35 ppm) after 180 min adsorption.
Water 15 01203 g013
Figure 14. Photocatalytic degradation of DR16 by B-ZnO/TiO2 under visible light irradiation, in the presence of scavengers used in this study.
Water 15 01203 g014
Figure 15. Cycling runs of B-ZnO/TiO2 for the photodegradation of DR16 with and without reactivation.
Water 15 01203 g015
Table 1. Range and levels of the experimental parameters.
ParametersRange and Levels
−10+1
A: DR16 concentration (ppm)1017.525
B: B-ZnO/TiO2 loading (g/L)0.511.5
C: pH 3711
D: Retention time (h)135
E: Light (LED) intensity (W)305070
Table 2. Crystallite and particle size of pure TiO2, B-TiO2, ZnO-TiO2, and B-ZnO/TiO2.
CatalystD, nmAverage, nmMax., nmMin., nmMode, nm
XRDSEMXRDSEMXRDSEMXRDSEMXRDSEM
TiO29.6>1211.511.110.823.75.84.39.511
B-TiO26.9>128.911.725.411.755.76.610.5
ZnO-TiO25.8>1211.411.431.728.53.51.5412.9
B-ZnO/TiO26.3>2515.321.465.246.51.913.32.622
Table 3. Zeta potential value for pure TiO2, B-TiO2, ZnO/TiO2, and B-ZnO/TiO2 measured at room temperature.
SampleActual Zeta ValuesStability Terms
TiO2+40.7Moderate stability, without aggregation [18,19,20]
B-TiO2+64Excellent stability, without aggregation [19,20]
ZnO/TiO2+9.38Rapid coagulation or flocculation full [30]
B-ZnO/TiO2−6.99Rapid coagulation or flocculation full [30]
Table 4. ANOVA results of model terms.
SourceSum of SquaresdfMean SquareF-Valuep-Value
Model28,085.38151872.36498.75<0.0001Significant
A-DR16497.061497.06132.41<0.0001
B-B-ZnO/TiO2 loading3072.3013072.30818.39<0.0001
C-pH18,771.80118,771.805000.38<0.0001
D-RT3146.8913146.89838.26<0.0001
E-LED intensity13.47113.473.590.0667
AC130.821130.8234.85<0.0001
AD127.601127.6033.99<0.0001
AE160.651160.6542.79<0.0001
BC320.681320.6885.42<0.0001
BE203.521203.5254.21<0.0001
CD25.38125.386.760.0137
CE74.12174.1219.74<0.0001
401.821401.82107.04<0.0001
17.03117.034.540.0405
16.37116.374.360.0443
Residual127.64343.75
Lack of Fit116.71274.322.770.0833Not significant
Table 5. ANOVA results of the predicted model.
ResponseProbabilityR2Adj. R2Pre. R2S.DCVLack of Fit
Dye removal (%)<0.00010.9950.99350.99021.943.560.0833
Table 6. Kinetic parameters of DR16 adsorption by B-ZnO/TiO2.
InterceptSlopeqmaxKLRLR2
0.076590.0612213.056531.2510620.4442350.97906
Table 7. Performance comparison of some published works focusing on the fabrication of ZnO/TiO2-based photocatalysts.
CatalystProcedureWaste TypeOptimum ConditionEfficiency %ReusabilityRef.
B-ZnO/TiO2Sol-gelDR16Cata. mass = 1 g/L
Dye = 10 ppm
pH = 3
Time = 200 min
1004 cycles with/without reactivation processPresent study
B-ZnO/TiO2Mechano-chemical–calcinationM.B.Cata. mass = 30 mg/50 mL
Dye = 15 mg/L
pH = 11
Time = 30 min
94.25 cycles[37]
B-ZnO/TiO2Sol-gel4-chlorophenolCata. mass = 10 mg
Waste = 5 × 10⁻⁵ mole
pH = 5.38
Time = 480 min
58.2-[38]
Ni-ZnO/TiO2Sol—gelAnthraquinone
dye (reactive brilliant blue KN-R)
Cata. mass = 1.3 g/L
Waste = 6 mg/L
pH = 4
Time = 120 min
694 cycles[39]
C-ZnO/TiO2Microwave hydrothermalRhodamine BCata. mass = 50 mg/100 mL
Waste = 10 mg/L
Time = 45 min
965 cycles[26]
Cu2+/ZnO/TiO2Sol-gelAnilineCata. mass = 2 g/L
Waste = 125 mg/L
pH = 11
Time = 7 h
Temp. = 25 °C
COD = 77.8%- [27]
TiO2/Zn2TiO2/ZnO/CSol–gel Orange G dye (OG)Cata. mass = 50 mg/50 mL
Waste = 20 mg/L
Time = 50 min sunlight
180 min—UV
100—sun light
40—UV
5 cycles[28]
Disclaimer/Publisher’s Note: The statements, opinions and data contained in all publications are solely those of the individual author(s) and contributor(s) and not of MDPI and/or the editor(s). MDPI and/or the editor(s) disclaim responsibility for any injury to people or property resulting from any ideas, methods, instructions or products referred to in the content.

