Article

Optimization Model of Water Resources Allocation in Coal Mine Area Based on Ecological Environment Priority

1
Shanxi Academy of Eco-Environmental Planning and Technology, Taiyuan 030009, China
2
College of Water Resources Science and Engineering, Taiyuan University of Technology, Taiyuan 030024, China
3
Shanxi Environmental Protection Institute of Transport Co., Ltd., Taiyuan 030032, China
4
Shanxi Yangquan Yinying Coal Industry Co., Ltd., Yangquan 045000, China
*
Authors to whom correspondence should be addressed.
Water 2023, 15(6), 1205; https://doi.org/10.3390/w15061205
Submission received: 1 March 2023 / Revised: 16 March 2023 / Accepted: 18 March 2023 / Published: 20 March 2023
(This article belongs to the Section Water Resources Management, Policy and Governance)

Abstract

:
It is of great practical significance to explore the efficient water resources allocation model based on ecological environment priority in coal mine areas. In this paper, an open-well coal mining area is selected as the study area. Firstly, the changing characteristics of water supply and demand balance in the study area during 2015–2020 are studied, and the defects of the existing water resources allocation mode are analyzed. Then, considering the economic, social, and ecological factors, a multi-objective model of optimal allocation of water resources was established. Finally, the optimal water resource allocation scheme was obtained by using a particle swarm optimization algorithm. The results indicate that both the water supply and consumption in the study area decreased from 2015 to 2020. The utilization rate of fresh water also has been declining year by year, and the water source structure tilted to the reclaimed water resources. Among water users, coal mining water consumption is the highest, while ecological water consumption is the lowest. There is still a large amount of recycled water that has not been reused, resulting in a waste of water resources. The optimal water resources allocation scheme shows that the allocation scheme meets the needs of each water user within the limits of the water supply source. The sewage reuse rate reached nearly 100%, which realized the maximum utilization efficiency of water resources. The utilization rate of fresh water was 29.94%, and the dependence on freshwater resources was reduced. Reclaimed water accounts for 77.8% of the total water consumption. The water source structure has been optimized to realize efficient use of water resources.

1. Introduction

Coal exploitation plays an important role in economic development and national energy security. Coal mining and utilization both need a lot of water resources as support; water resources seriously restrict coal mining. Therefore, using fewer freshwater resources in coal mining, making comprehensive use of mine drainage, and realizing the overall efficient utilization of water resources in mining areas are urgent problems to be solved.
Research on coal mine water resources can be divided into two categories. On the one hand, it is about water resources. Mining will first have an impact on the regional land structure, leading to the reduction of regional water resources. The eco-hydrological model can be used to analyze water resources under different land conditions before and after mining and guide water resources regulation [1]. The whole life cycle theory was used to establish an evaluation model for the water footprint of energy production [2,3]. On the other hand, it is the resource utilization of mine water. Some scholars build mine water utilization models, including the bidirectional coordination mine water supply and demand evaluation model based on the TOPSIS evaluation model [4]. There are also ecological utilization systems and evaluation models of mine water established from a systematic perspective [5]. At present, the relevant studies of mine water utilization are mainly focused on the technical level and lack a systematic study of mine water management.
The water resources system has uncertainty and multiple objectives, so the construction of the water resources allocation model also has diversity. At present, there are multi-objective models [6], such as the SD-MOM model [7], the simulation-optimization model [8], the two-stage method model [9], etc. The optimal allocation of water resources has been studied and analyzed in different regions, such as Ejin Oasis [6], Qingdao [7], Qaidam Basin [10], Shiyang River Basin [11], Tianjin [12], etc. The water quality and quantity of the region have been jointly studied to provide feasible decision-making references for water quality type shortage [12]. Ecological water demand [13] and unconventional water resources are considered in the research scope of water resource allocation [14]. Besides, carbon footprint methods have also been introduced to build an optimal allocation model of water resources based on carbon footprint [15]. The water resources allocation model provides a theoretical basis for sustainable and efficient utilization of water resources in the region.
For the calculation of water resource allocation, many scholars have expanded on and improved the existing algorithm research. The algorithms used for water resources allocation include the NSGA-II algorithm [13], the NSGA-III algorithm [16], the improved particle swarm optimization algorithm [14], the improved cuckoo algorithm [17], the whale optimization algorithm [18], the improved artificial beehive—particle swarm algorithm [19], the simulated annealing particle swarm algorithm [20], the fish swarm algorithm [21], the improved traditional chicken flock algorithm [22], the improved Grey Wolf algorithm [23], the genetic algorithm introduced fruit fly algorithm [24], the dual-objective immune particle swarm optimization [25], training big data [26], reinforcement learning method [27], etc. Different algorithms have their advantages and disadvantages, so it is necessary to compare and choose the best method when using them.
When aiming for research on the optimal allocation of water resources in mining areas, Deng studied the optimal allocation of water resources in the Hongshaquan open-pit mine [28]. Duan studied and analyzed the Lujinglian mining area in Pingshuo [29]. Fang studied the Shanxi coal base and analyzed its water resources carrying capacity [30]. Bai conducted research on water resource planning in the Fengfeng mine area [31]. Zhang took Benxi Shanling Iron Mine as the research object to study the allocation of water resources [32]. There have been several studies on the impact of coal mining on water resources and the allocation of water resources, but few studies on the rational allocation and utilization of coal mine water resources from the perspective of ecological environment priority.
Large open-well mining areas have multiple water source types, multiple production units and industrial types, multiple water requirements, complex drainage structures, the uncoordinated spatial and temporal distribution of water supply and demand, and different technological levels of sewage treatment stations. All these factors directly affect the allocation level of water resources in mining areas. They then affect the efficient utilization of water resources. In order to make the sustainable and coordinated development of coal mining, water resources and ecology, it is necessary to construct a multi-objective water resources allocation model for mining areas. This paper, taking an open-well mining area as the study area, first collected the annual utilization data of water resources in the study area and analyzed the variation characteristics of water resources and water quality of water sources and water users. Then, the balance of supply and demand is calculated to clarify the rules of water resources development and utilization in the study area and identify the existing problems. Then, according to the current characteristics of water resource utilization, the efficiency coefficient was introduced, and the optimal allocation model of water resources in the mining area was established by a particle swarm optimization algorithm. Finally, this model is used to optimize the allocation of water in the study area, and an efficient water resource utilization scheme based on ecological environment priority is proposed.

2. Analysis of Water Resources Utilization in the Study Area
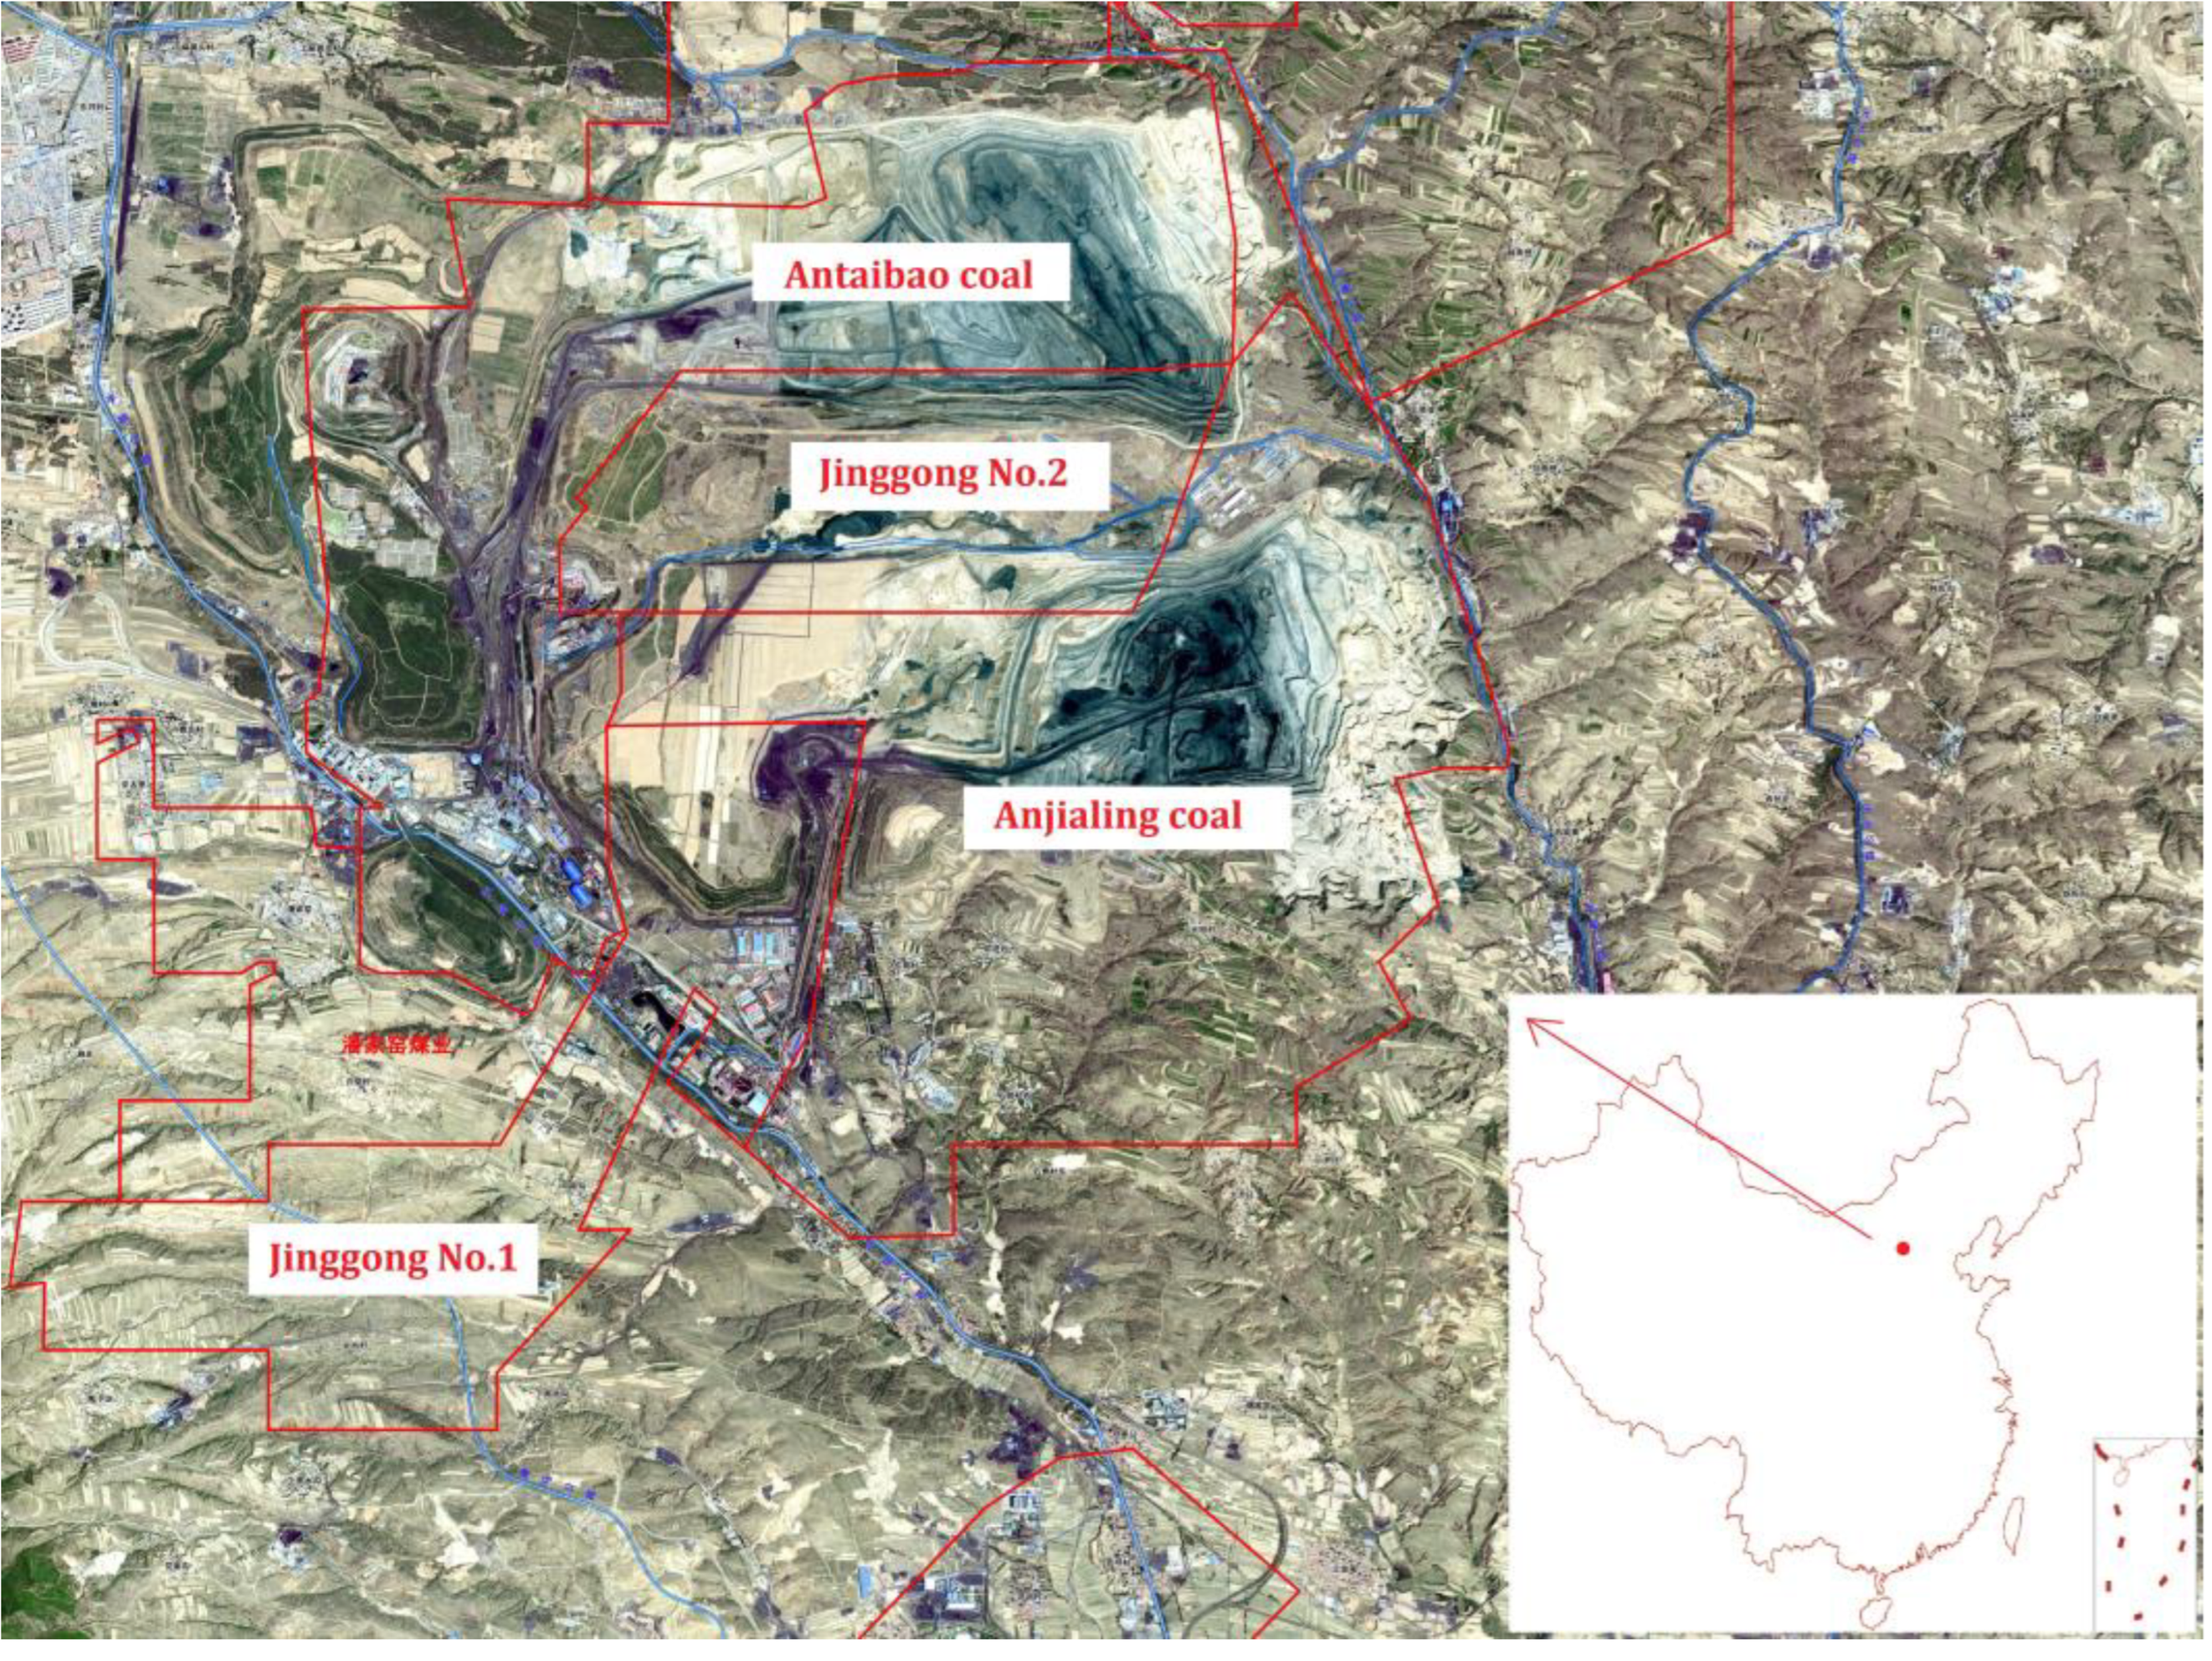
2.1. Study Area

Pingshuo mining area is located in Shuozhou city, Shanxi Province. It is the first open-well mining area in China. The depth of the coal seam is 100~350 m. In this paper, Anjialing (AJL) opencast coal mine, Antaibao (ATB) opencast coal mine and Jionggong (JG) No.1 coal mine in the Pingshuo Mining area are selected as research areas (Figure 1) [33]. Among them, the approved production capacity of AJL and ATB mines is 20 million t/a, and the approved production capacity of JG No.1 mine is 10 million t/a. There are three rivers in the study area from west to east, namely the Machan river, the Maying river and the Qili river. AJL reservoir is located in the upper reaches of the Qili river near the AJL mine. The water source of the reservoir is mainly from the treated standard water of the AJL terminal sewage treatment station, the underground water treatment station of the Shangyao area of JG No.1 Mine, the underground water treatment station of the Taixi area of JG No.1 Mine and domestic sewage treatment station of AJL.
The ATB region is adjacent to the AJL region, and their water supply systems have been the same since the beginning of mine construction. JG No. 1 mine is divided into two production areas: the Shangyao area and the Taixi area. In the production process, the excess water is treated by the underground water treatment station and then discharged into the storage reservoir after meeting the requirements of the downhole drainage. The water consumption of open pit mines is huge, and the displacement of well mines is rich. Ecological water mainly includes replenishment of landscape reservoir, afforestation of the mining area, and reclamation water of waste dump.
Through field investigation, it is found that from the perspective of water supply, in order to pursue the maximization of production benefits, very little of the treated effluent from all water supply treatment stations in the study area is used for the adjacent production water units. Most of the remaining reclaimed water is uniformly discharged into the storage reservoir and transferred to the coal-washing plant and industrial cooling water with low water quality. From the point of water demand, water quality requirements of different departments vary greatly. The study area relies heavily on freshwater sources, which is not conducive to the improvement of water resource utilization efficiency.

2.2. Dynamic Characteristics of Water Resources Development and Utilization

2.2.1. Water Supply Analysis

The water supply in the study area is mainly composed of three parts: surface water, groundwater and reclaimed water. The surface water comes from the Yellow River water, about 5 million m3/a. Groundwater comes from the Liujiakou water source, which is about 4.015 million m3/a. The reclaimed water mainly comes from mine gushing water and wastewater after treatment. The water supply of the study area from 2015 to 2020 is shown in Table 1. It can be seen that the freshwater supply in the study area has not changed in recent years, and the reclaimed water has a trend of decreasing year by year, so the total water supply also decreases year by year. From 2015 to 2020, the total water supply decreased from 19.92 million m3 to 17.32 million m3.

2.2.2. Water Consumption Analysis

The composition of water users in the study area is diverse. The water sources from 2015 to 2020 are shown in Table 2. It can be seen that the water consumption of surface water ranges from 2.06 million m3 to 4.74 million m3, and the water consumption decreases year by year. The groundwater consumption is 1.57~2.78 million m3, and it also decreases year by year. The water consumption of reclaimed water is 4.5~7.8 million m3 and increases yearly. From 2015 to 2020, the proportion of reclaimed water use was 37.7%, 45.5%, 53.6%, 58.7%, 67.7%, and 65.6%, respectively. It indicates that the water use structure tilts to renewable water resources year by year, the proportion of fresh water use decreases year by year, and the water-saving measures have achieved good results.
Multiple water users were categorized into a total of 10 types of water users. The annual water consumption of different water users is shown in Table 3. It can be seen that the total amount of water used from 2015 to 2020 shows a decreasing trend, which follows the annual trend of 12.07 million m3, 10.39 million m3, 11.59 million m3, 11.92 million m3, 11.48 million m3 and 10.54 million m3, respectively. Coal mining consumes the most water, accounting for about half of the total water use. The second highest use is for coal washing and other auxiliary production activities. The amount of water resources used for ecology in the study area is small. In order to realize the coordinated development of coal, water, and ecology, it is necessary to strengthen the restoration and protection of the ecological environment with the support of water resources.

2.2.3. Analysis of Water Supply and Consumption Balance

The water supply from 2015 to 2020 is analyzed in supply–consumption balance, and the results are shown in Table 4. The water supply in the study area was greater than the water consumption from 2015 to 2020. The supply of surface water, groundwater and reclaimed water can meet the water consumption of the mining area, and there is surplus water. The utilization rates are 61%, 57%, 61%, 65%, 64%, and 61%, respectively. The utilization rate of fresh water decreased year by year, while that of reclaimed water increased year by year. The study area still relies on fresh water, and a large amount of recycled water is not reused and discharged to nearby rivers, resulting in a waste of water resources and huge environmental pollution. Therefore, when the water quality is satisfactory, we should reduce the use of fresh water, make full use of recycled water, and improve the utilization efficiency of water resources.
Table 5 shows the calculation results of water resource supply and consumption in the study area in 2020. It can be seen that the water supply can meet the requirements of water use, and the total utilization of water resources is also reflecting a surplus. In addition, the supply of reclaimed water reached 8.31 million m3. However, the reclaimed water cannot be fully utilized, and the surplus water is discharged to the nearby river. In general, the water supply in the study area is greater than the water demand, but there is a problem with an unreasonable supply and demand structure. Because water quality cannot meet the high demand of water users, the reuse scope is limited, and the efficient utilization of water resources cannot be realized.

2.2.4. Forecast of Supply and Demand Balance

According to the current and planned water supply capacity of the coal mine, the water supply of the study area in 2030 is predicted, and the results are shown in Table 6. According to the water resources conditions and economic development of the mining area, the water demand of the study area in 2030 is predicted (Table 7). Among them, the ecological water demand includes the water demand of mining area greening, landscape reservoir replenishment and reclamation water demand, etc. Reclamation water demand is calculated by the area quota method, and the calculation formula is as follows
W = W i = A i r i
where Wi is the water demand of type i vegetation, m3/a; Ai is the planting area of type i vegetation, m2; ri is the water demand quota of type i vegetation, m3/ (a·m2).
Based on the analysis of remote sensing images, it is predicted that the green area in 2030 will be 60.05 km2, the water requirement for the ecological environment will be 125 m3/ (a·hm2), and the water requirement for reclamation will be 750,700 m3.
According to Table 6 and Table 7, the total water supply is forecast to be 18.45 million m3, and the total water demand will be 11.03 million m3 in 2030. Although it is predicted that the total water consumption of the study area will be satisfied in 2030, the water supply and demand still cannot be rationally allocated. It is necessary to explore the efficient utilization mode of water resources in mining area so as to use less freshwater resources and increase the reuse rate of reclaimed water.

3. Optimization Model of Water Resources Allocation Based on Ecological Environment Priority

3.1. Water Resources Allocation Model

3.1.1. Allocation Rules and Decision Variables

The establishment of the water resources allocation model is based on the following principles: (1) The maximized coordinated development of resources, ecology and economy. (2) The water supply resources of different water quality will be accurately matched among water users. (3) The principle of nearby water supply. (4) The principle of ecological water priority. (5) The prioritized use of reclaimed water and reduced use of fresh water.
According to the development and utilization of water resources in the study area, water supply sources are divided into seven types and water users into 10 types, as shown in Table 8 and Table 9. Therefore, the total number of decision variables is 7 × 10 = 70.

3.1.2. Objective Function

When allocating water resources in the study area, three objectives are set: an economic objective, a social objective, and an ecological objective.
(1)
Economic objective
In the allocation of water resources, water supply costs must be minimized.
max f 1 x = j = 1 J i = 1 I b j x i j λ i θ j
where xij denotes the water supply of the i th water source to the j th water user.
(2)
Social objective
Water resource allocation must meet the minimum total water shortage of each water user.
min f 2 x = j = 1 J D j i = 1 I x i j
where Dj is the water demand of different water users.
(3)
Social objective
Water resource allocation must simultaneously satisfy the minimum total water shortage of ecological water.
min f 3 x = D 1 i = 1 I x i 1
where xi1 denotes the amount of ecological water supplied by different water sources, and D1 is the amount of ecological water required.

3.1.3. Constraint Condition

The allocation of water resources in mining areas should be calculated under certain constraint conditions. When the constraint conditions are different or unreasonable, the result of water resource allocation will be very different. In this paper, four constraints are selected, including the available water supply, water demand, water quality and non-negative constraints.
(1)
Available water supply constraint
Available water supply from different water sources should meet
j = 1 J x i j C i
where Cj is the maximum amount of water supplied by different sources.
(2)
Water demand constraint
Water demand for different water users should meet
D j i = 1 I x i j 1.2 × D j
where Dj is the water demand of different water users. The water supply for users should be no less than the water demand of water users and no more than 1.2 times the water demand of water users.
(3)
Water quality constraint
In the process of water resource allocation, the water quality requirements of different water users should be met, and a water quality supply and demand matrix should be established. When the water quality of the water supply source meets that of water users, supply will be provided; otherwise, there is no supply and demand relationship.
(4)
Negative constraint
The amount of water supplied to each user cannot be negative.
x i j 0

3.1.4. Model Parameter

(1)
Supply order coefficient
The supply order coefficient of different water sources, λi, is calculated by
λ i = 1 + m m a x m i i = 1 I 1 + m m a x m i
where mi is the water supply sequence number of the i th water source, and mmax is the maximum water supply sequence number.
The water resource allocation model gives priority to the use of reclaimed water resources. The water supply sequence number of five types of reclaimed water is set as 1: UWTS-SY-JG, UWTS-TX-JG, TSTS-ATB, DSS-AJL and TSTS-AJL. The water supply sequence number of groundwater and surface water is set as 2 and 3, respectively. Table 8 shows the calculation results of water supply order coefficients.
(2)
Water use equity factor
The water use equity coefficient of water users, θj, is calculated by
θ j = 1 + n m a x n j j = 1 J 1 + n m a x n j
where nj is the water consumption sequence number of the j th user, and nmax is the maximum water consumption sequence number.
The water resource allocation model constructed this time is based on ecological environment priority, so the water consumption sequence number of ecological water is set as 1. The water consumption sequence number of mining water users is set to 2–9. Other water consumption can finally be satisfied, so its sequence number is set as 10. See Table 9 for the calculation results of the water consumption equity coefficient.
(3)
Production benefit coefficient
In order to ensure that the ecological environment, production support activities and other water benefits are satisfied, an appropriately large value should be assigned. In combination with the actual situation of the study area, the benefit coefficient of the three is set as 550 Yuan/m3. For coal mining and washing activities, the benefit coefficient is taken as the reciprocal of the water consumption of ten thousand yuan of output value, which is determined to be 625 Yuan/m3. For details about the production benefit coefficient, see Table 9.
(4)
Maximum water supply and demand value
Maximum water supply and demand values adopt the predicted values in 2030, as shown in Table 6 and Table 7.
(5)
Water supply-demand matrix
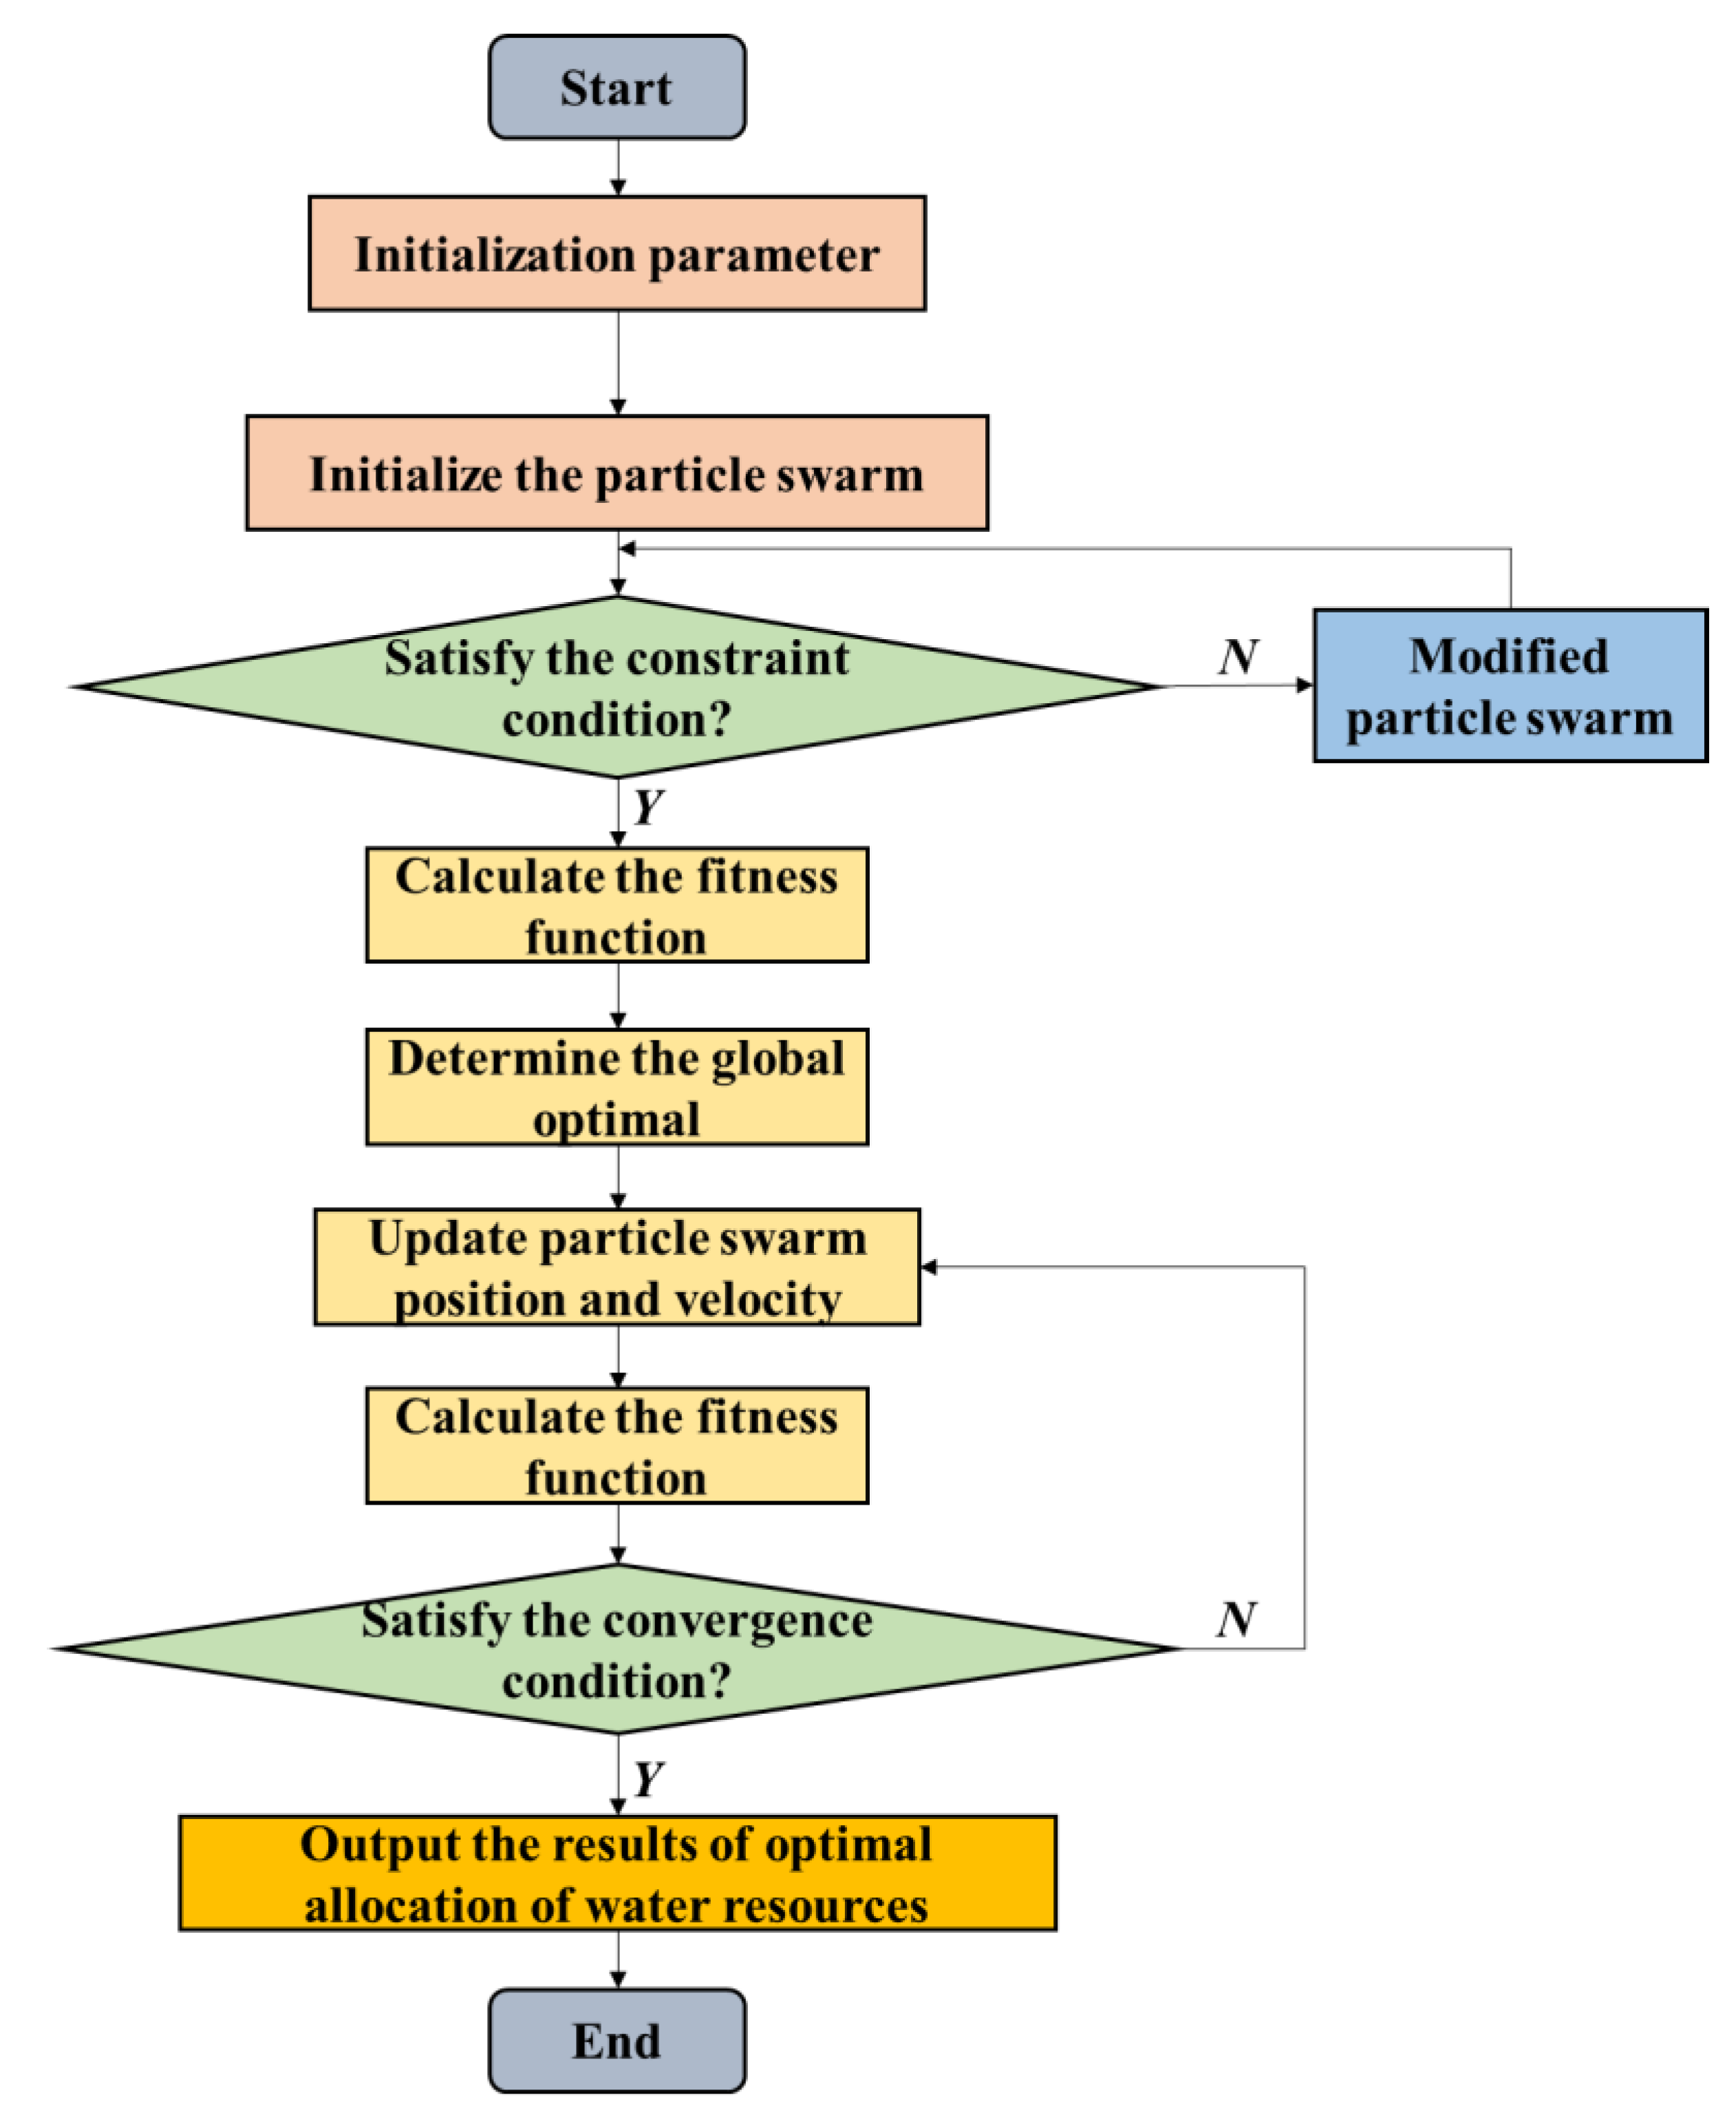
Based on the analysis of the water quality supply–demand relationship and the principles followed by water resource allocation, the supply–demand relationship matrix is determined in Table 10.

3.2. Model Solution

The water resources allocation model constructed in the study area is a multi-objective model, so it needs to adopt the multi-objective decision method to solve it. In multi-objective programming, a satisfactory value and a disallowed value are determined for each evaluation index. With the satisfactory value as the upper limit and the disallowed value as the lower limit, the degree to which each index achieves the satisfactory value is calculated, and the score of each index is determined based on it. The score is the efficiency coefficient of the index. In this paper, the evaluation function of the efficiency coefficient is constructed, and the multi-objective optimization problem is transformed into a single-objective optimization problem. The evaluation function of the constructed efficacy coefficient is as follows:
m i n F x = ω k φ k x
φ k x = f k x f k , m i n f k , m a x f k ,   m i n
where fk(x) is the k th objective function, fk,min is the minimum and fk,max is the maximum of optimization fk(x). φk(x) is the corresponding efficiency coefficient of the k th objective function, and ωk is the weight corresponding to the k th objective function. The weight of the ecological objective is set as 0.4. Both economic and social objectives were given a weight of 0.3.
Firstly, the three objectives are independently optimized, and the maximum and minimum values of each objective function are obtained. Then, according to Equation (10), the multi-objective function is converted into a single objective function, and then the optimization calculation is carried out. For single object optimization, the particle swarm optimization (PSO) algorithm is used this time [19]. PSO is a kind of evolutionary algorithm. Based on the observation of animal cluster activities and behaviors, it makes use of the information shared by individuals in the group to make the movement of the whole group evolve from disorder to order in the problem solving space, so as to obtain the optimal solution. Assuming that a particle swarm with M particles seeks the optimal position in an N-dimensional space, the position of particle i in the N-dimensional space can be expressed as:
X i = x i 1 , x i 2 , ,
Its speed can be expressed as:
V i = v i 1 , v i 2 , , v i N
The fitness function value is calculated according to the position information to obtain the optimal position information of the i th particle:
P i = p i 1 , p i 2 , , p i N
The global optimal is obtained according to the position of each particle:
G = g 1 , g 2 , , g N
In each iteration calculation, the position and velocity of particle i in the D-dimension need to be updated:
x i d t + 1 = x i d t + v i d t + 1
v i d t + 1 = ω v i d t + c 1 r 1 p i d t x i d t + c 2 r 2 g d t x i d t
where ω is the inertia factor, and the larger the value, the easier to find the global optimal. c1 and c2 are acceleration constants, which are used to adjust the global and local optimal weights. r1 and r2 are random numbers between [0, 1] to maintain the diversity of the particle swarm.
The solution steps of the PSO algorithm are shown in Figure 2. In this process, the quantity of water use unit and water supply unit in the study area is represented by the number of “particles”. The initial magnitude of the water supply value is represented in the model by randomly generated numbers. The minimum water demand per unit of regional water use, the maximum water demand per unit of water supply, the non-negative of water volume, the water quality relationship between units of water use and units of water supply and other constraints are used to control the change of the model “particle” to ensure that the variable space of “particle” has practical significance. The water resources allocation scheme achieved in a single iteration is optimized according to the fitness function determined for different purposes. When the convergence condition is reached, the model jumps out of the loop and finally achieves the optimal configuration result.

3.3. Results and Discussions of Water Resources Allocation

Water resource supply and demand allocation results are obtained and seen in Table 11. By comparing the amount of water allocated to water users and their demand, it is found that 10 types of water users all meet their water demand requirements and have a small amount of surplus water, which can meet various working activities in the mining area, and the water guarantee rate is more than 100%. We compared the water supply and the available water supply of the water supply source. We found that the water supply of the water supply source is within the range of the available water supply, which meets the constraint conditions of the available water supply.
The balance between supply and demand is calculated based on the results of the op-timal allocation of water resources (Table 12). It can be seen that for the use of reclaimed water, the water supply is 9,437,100 m3, the water consumption is 9,437,700 m3, and the surplus is 10,000 m3. The sewage reuse rate reaches nearly 100%, which realizes the max-imum utilization efficiency of water resources.
For the use of fresh water, the water consumption of surface water and groundwater is less than the water supply, and the surplus is 3.363,500 m3 and 2.952,100 m3, respectively. The proportion of water resources utilization is 32.73% and 26.47%, and the total freshwa-ter consumption accounts for 29.94% of the freshwater supply. The results show that the optimal allocation mode of water resources can greatly reduce the use of freshwater re-sources and reduce the dependence on freshwater resources. It minimized the damage to groundwater caused by industrial production.
Figure 3 shows the water source structure after the optimal allocation of water resources. It can be seen that after optimal allocation, reclaimed water accounts for 77.8% of total water consumption, while fresh water only accounts for 22.2%. The proportion of surface water use is 13.5%, and groundwater use is 8.8%. The results showed that the water resources allocation optimized the water source structure, improved the utilization rate of reclaimed water, reduced the utilization rate of fresh water, and realized the efficient utilization of water resources.
At present, there are many model methods for solving the optimal allocation of regional water resources [13,14,15,16,17,18,19,20]. In actual production, optimization objectives are often mutually restricted and conflicting. This increases the complexity of optimization problems to some extent. It often requires strong prior knowledge to solve the established model. The PSO algorithm adopted in this paper is an optimization algorithm with global randomness in the process of optimization. This algorithm does not require the object it optimizes to have an analytic function, and PSO is excellent for nondifferentiable nonlinear problems that are difficult to solve. Duan found that the PSO algorithm is suitable for complex multi-water source and multi-water user models in mining areas [29]. However, in the process of using the PSO algorithm alone, it may fall into the local optimal feasible solution and cannot jump out of the search because of the lack of its global search ability, which leads to premature phenomenon [19,24]. Ni proposed that the genetic algorithm and PSO can be combined to enhance the diversity of particle population by using the cross-mutation strategy of the genetic algorithm and reduce the possibility of the algorithm converging to the local optimal in advance [34]. Zhao et al. combined the simulated annealing algorithm with the PSO algorithm, improved the inertia weight adaptively and simplified the velocity position update formula in the PSO algorithm, thus improving the global searchability of the algorithm [35]. In order to obtain efficient, stable and accurate algorithms, future research can be carried out in the direction of parameter optimization and the integration of various algorithms.

3.4. Efficient Water Resources Utilization Mode
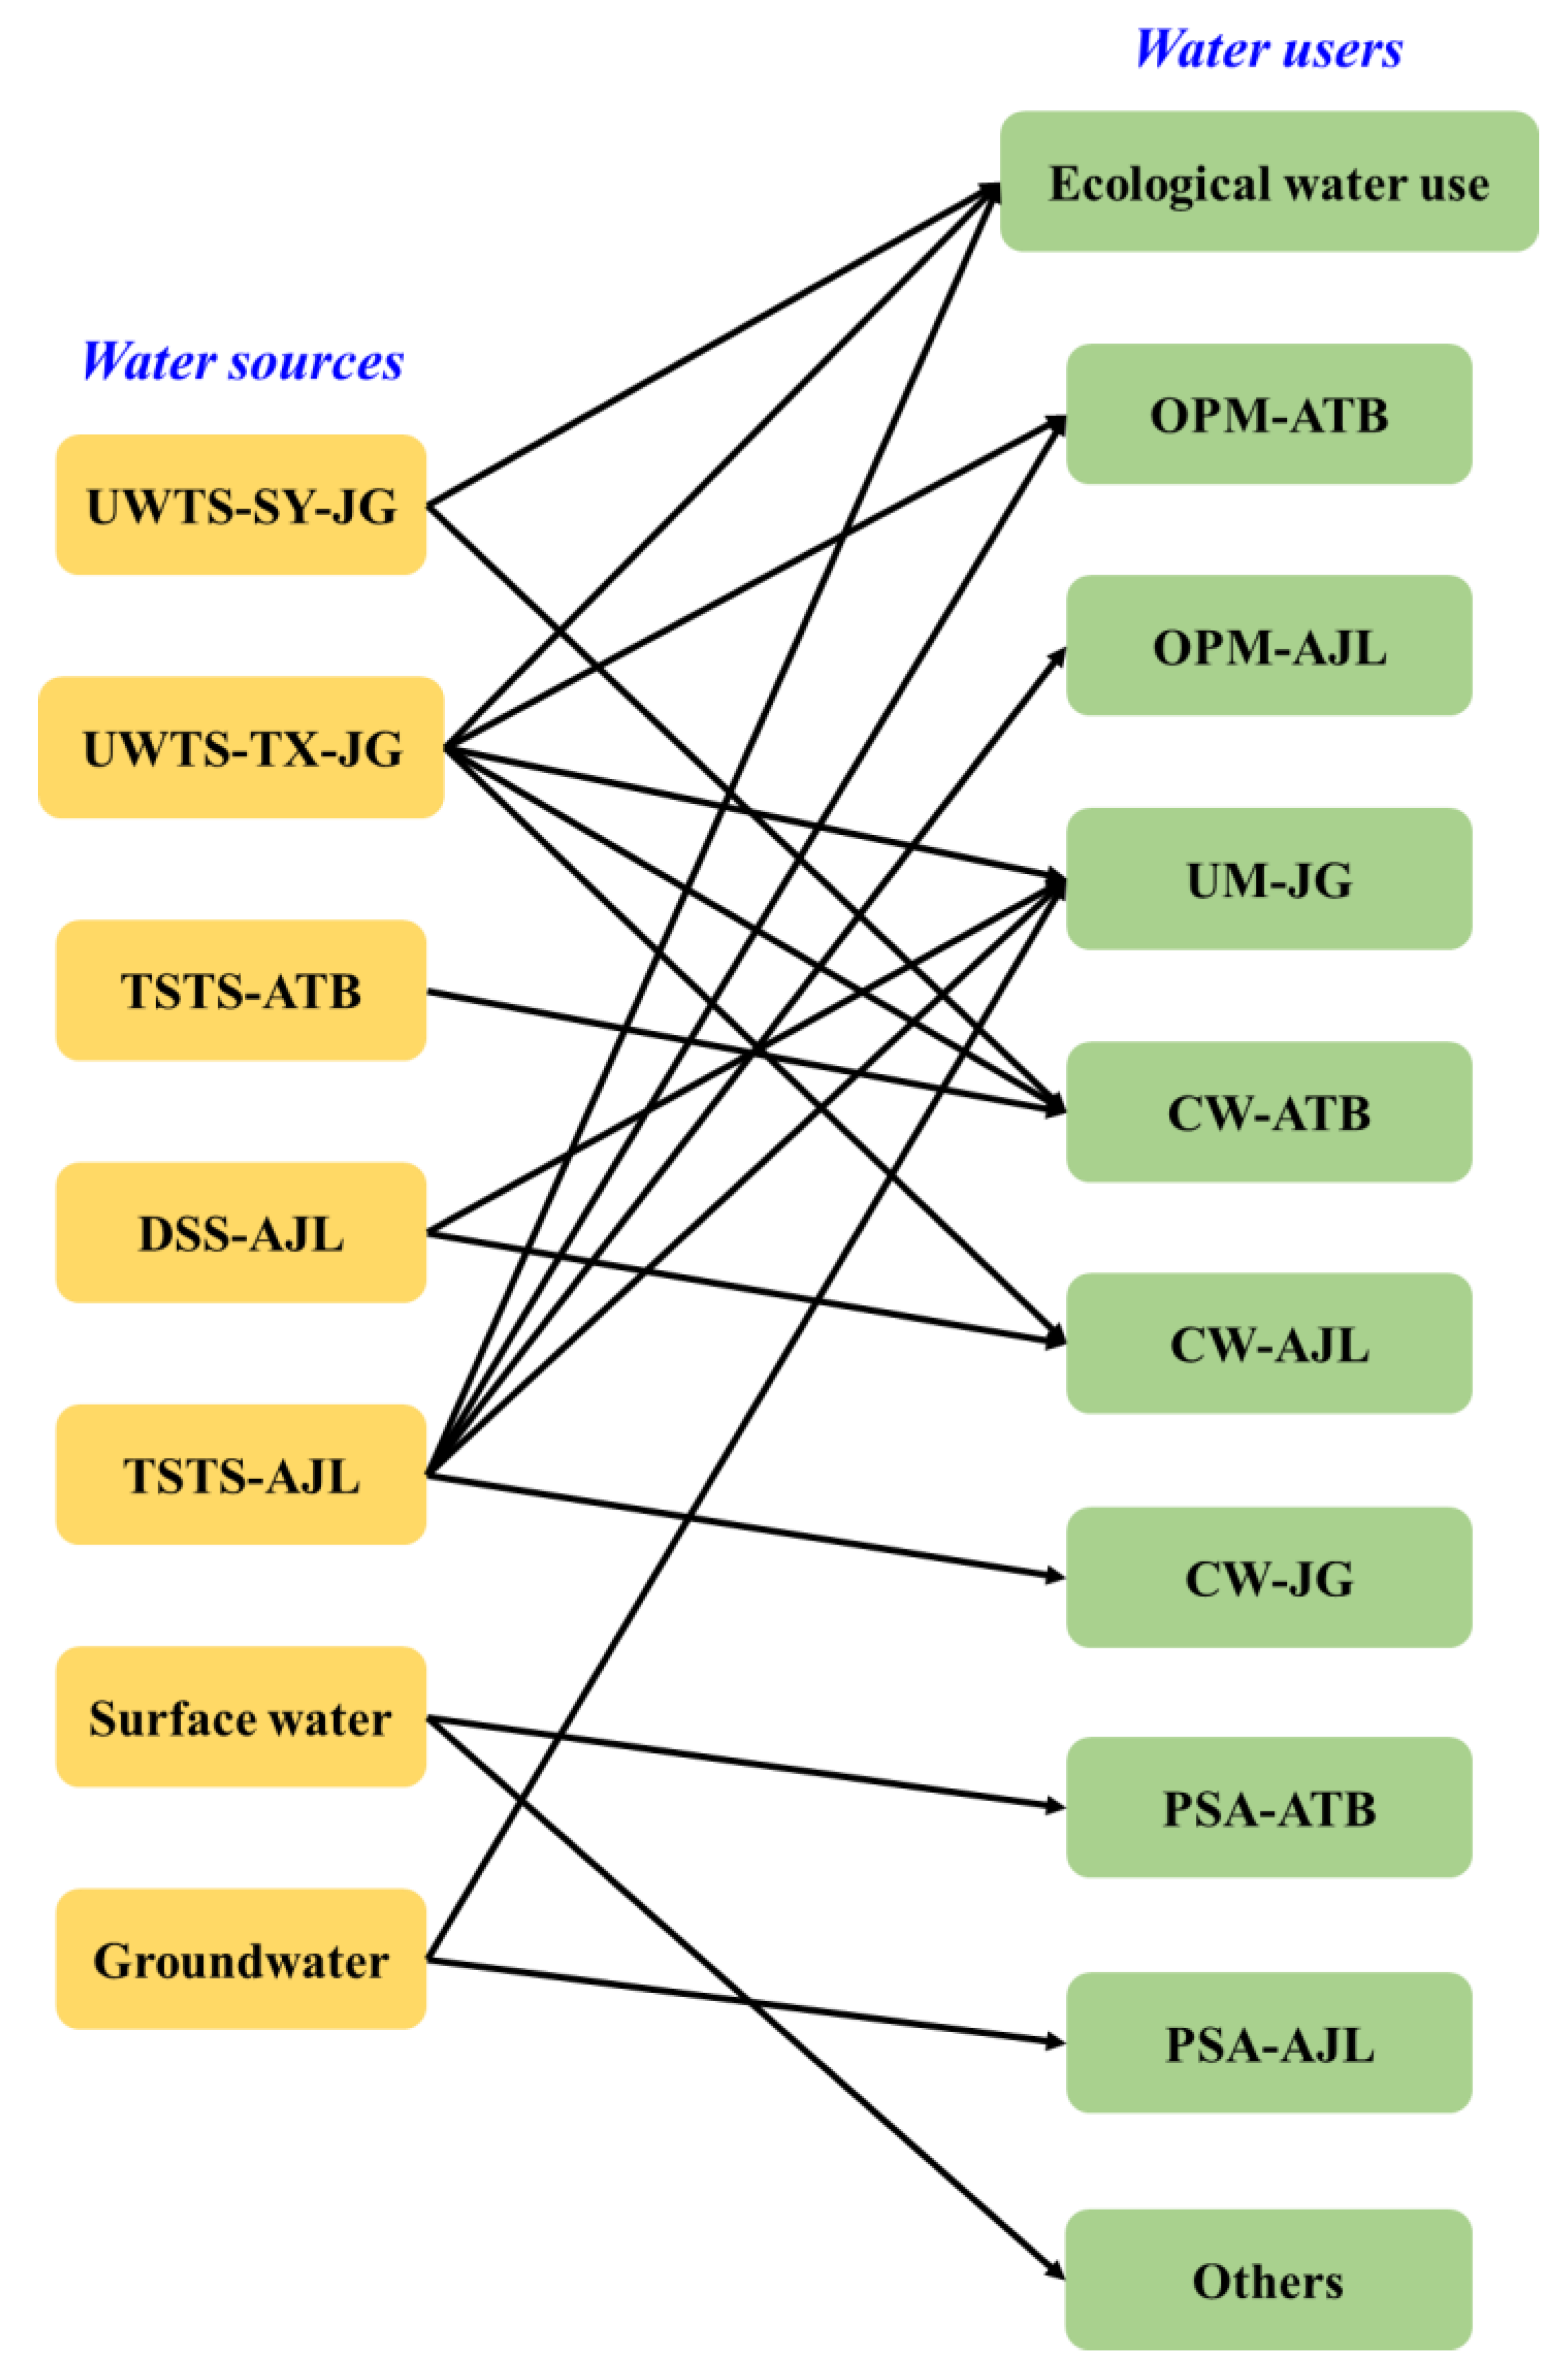
Based on the research of the above optimal allocation of water resources, the efficient water resources utilization mode for the open-well combined mining area is proposed:
(1)
Attention should be paid to the precise water supply between multiple water sources and multiple water users. The study area has various water sources and complex water users. In past production, coal mine water resources were allocated according to the principle of proximity and the relationship between supply and demand instead of using the multi-objective model for optimization. The same water source supplies multiple water users, and the same water user receives water from different water sources, so a precise water supply is not achieved. After optimized allocation, the relationship between the supply and demand of water resources in mining areas is more concise and clearer, as shown in Figure 4.
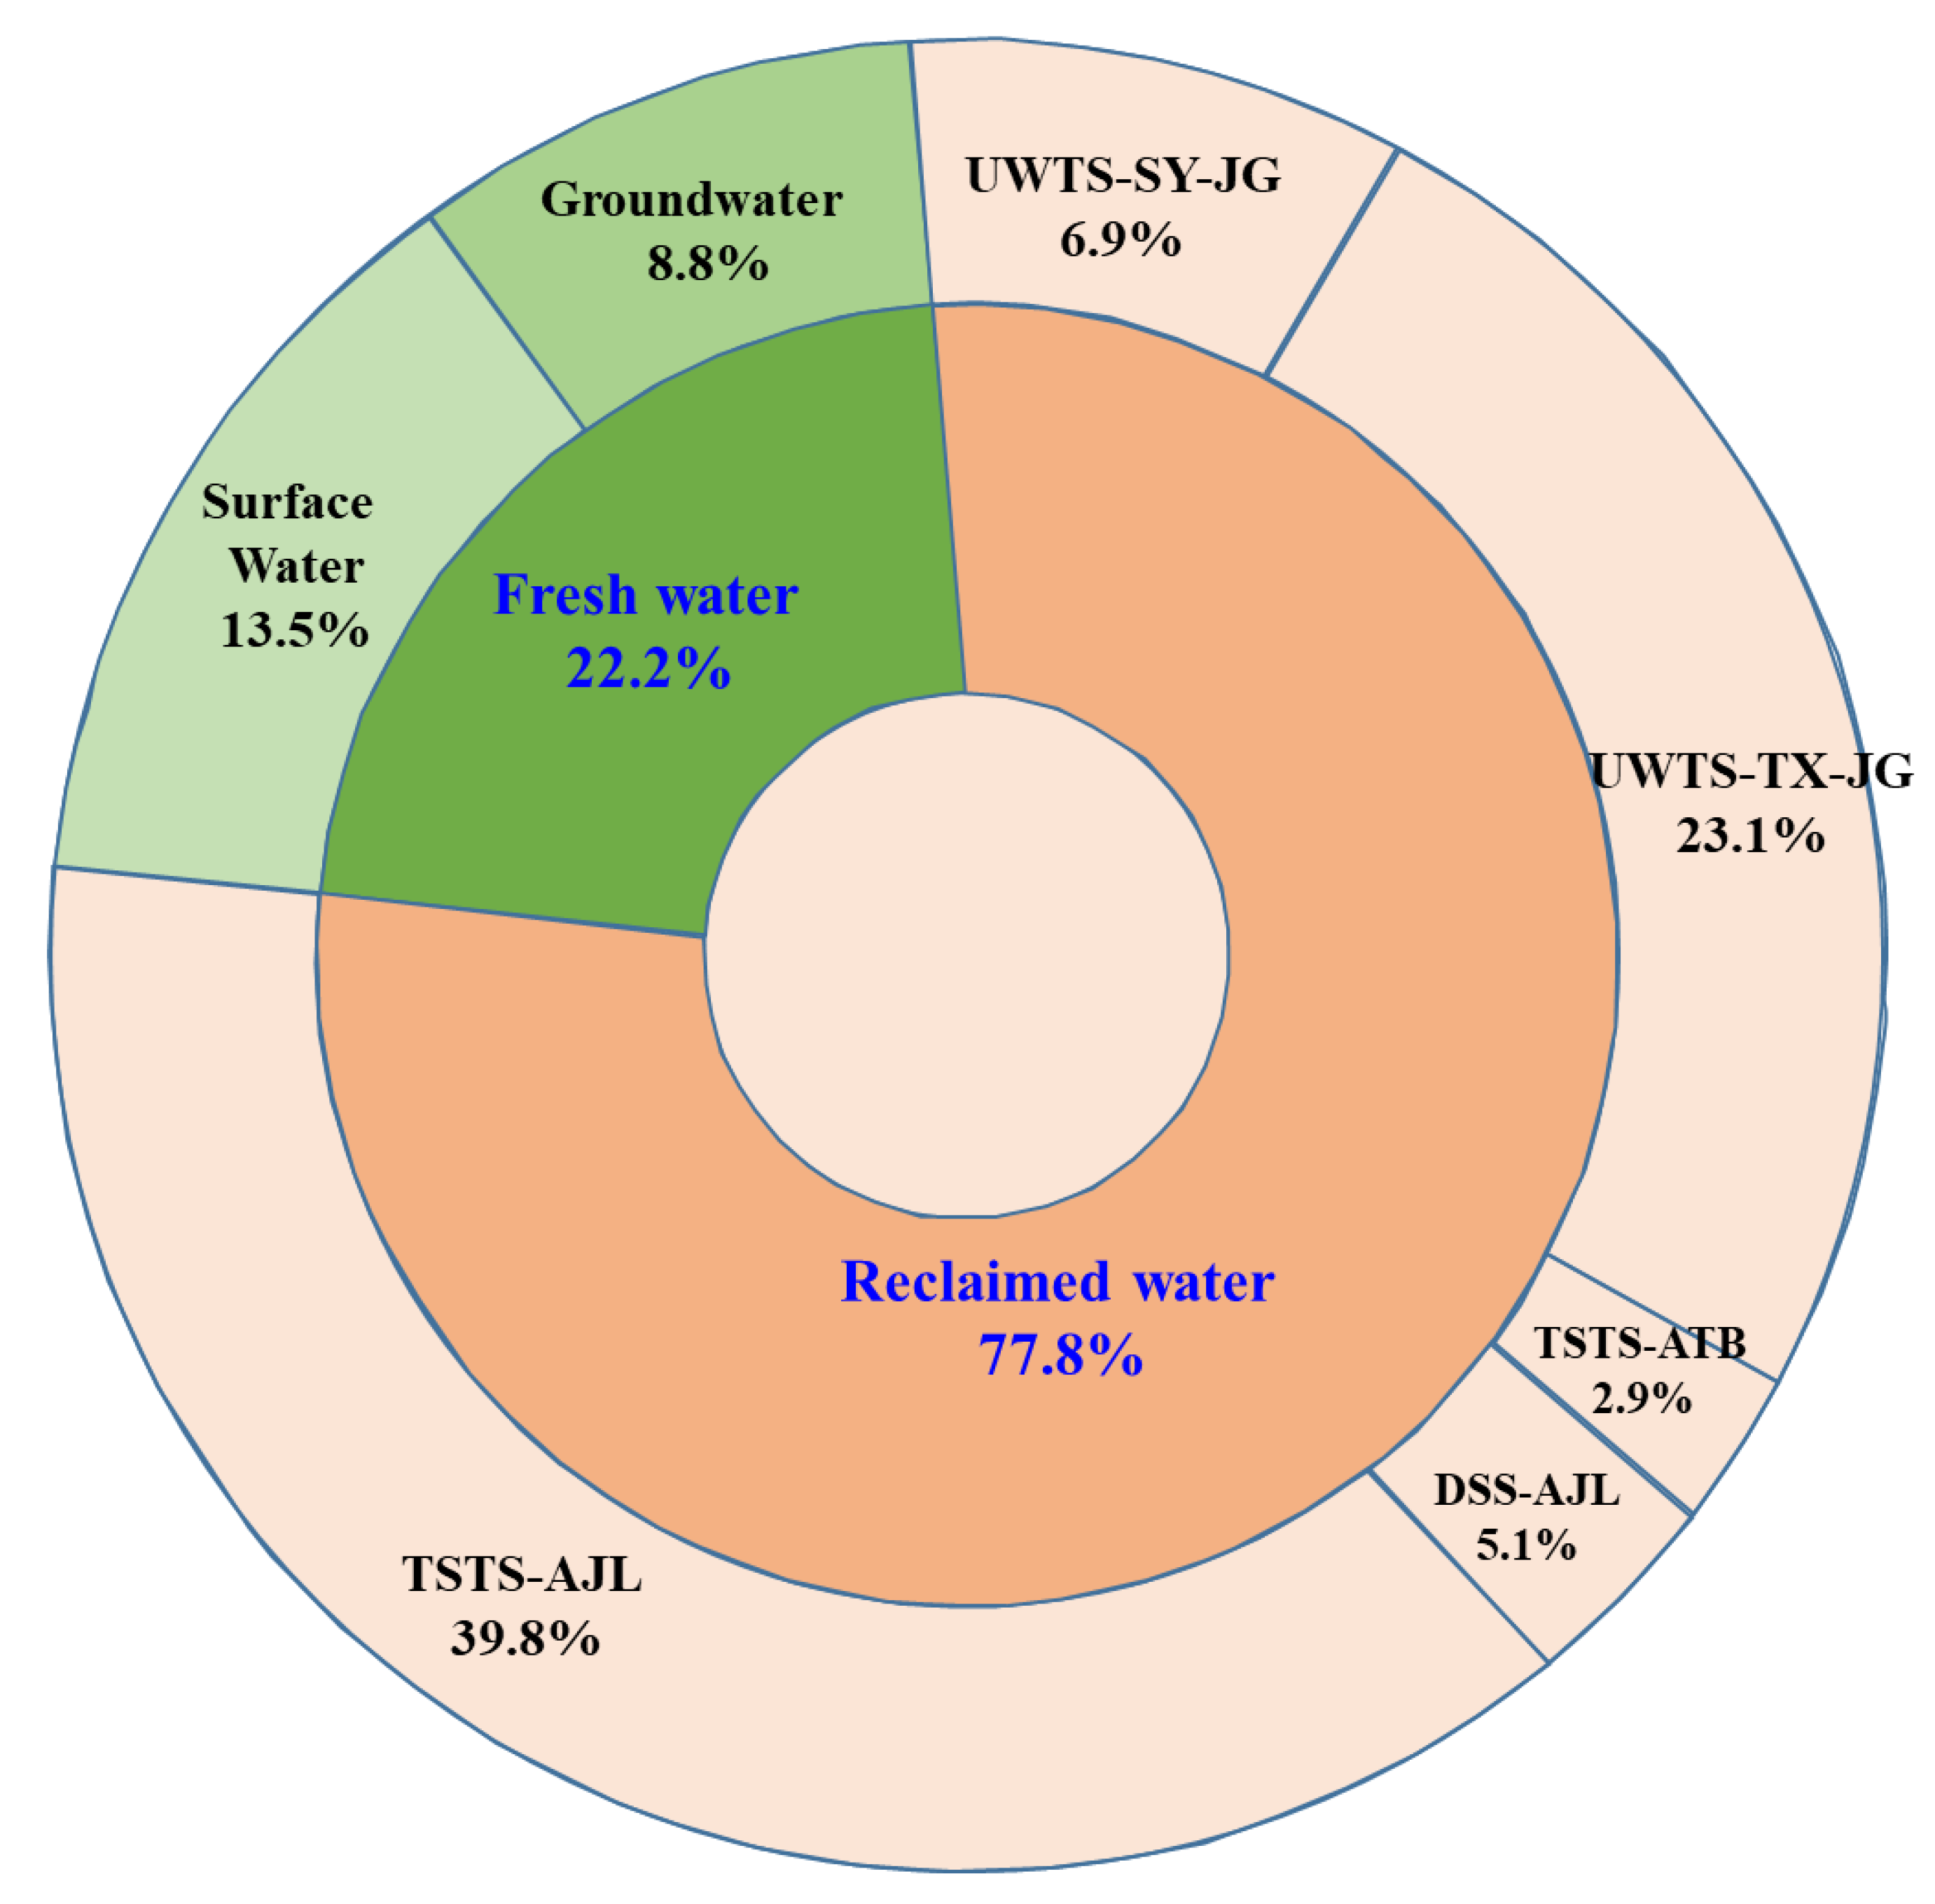
(2)
It is important to optimize the water source structure and give priority to recycled water. Efficient utilization of water resources requires reducing the use of fresh water and increasing the reuse rate of reclaimed water. According to the results of the optimal allocation of water resources, the reclaimed water has been completely reused, the sewage reuse rate has reached nearly 100%, and the proportion of the total water occupied by the reclaimed water has reached 77.8%. The water supply households cover the seven types of water users after the treatment of dimension reduction. The remaining insufficient water is supplemented by surface water and groundwater, which is less water, so the economical utilization of water resources is realized, and the freshwater resources are protected.
(3)
Realize the hierarchical water quality treatment and water supply of wastewater. Different water sources in the study area have different water quality, and water users need different water quality, so the water supply should be based on graded water quality. At the same time, the sewage quality of different types and regions is different, so it is necessary to use different treatment methods to treat the sewage wastewater from different sources for reuse so as to realize the grade treatment of the wastewater according to the quality. A water quality supply and demand matrix should be established according to the water quality requirements of the water supply source and water users.
(4)
Ensure that ecological water supply is given priority. Ecological restoration requires the support of water resources. Only when ecological water is given priority can the smooth progress of mining area greening be guaranteed.
In addition to the above, coal mine management departments should also pay attention to the coordinated development of coal, water and ecology. For the utilization of water resources, the first step is to improve water use efficiency, optimize water resources management mode and optimize water resources allocation. Secondly, water-saving facilities should be adopted, water-saving technology should be innovated, production equipment should be improved, and the industrial structure of the mining area should be adjusted. Thirdly, it is necessary to strengthen the management mode of water resources in mining areas, formulate water resources utilization system and maintain the authority of water resources law. Finally, the consciousness of saving water in mining areas should be set up.

4. Conclusions

In order to make the sustainable and coordinated development of coal mining, water resources and ecology, it is necessary to construct a multi-objective water resources allocation model for mining areas. In this paper, based on the analysis of the current situation of water resource supply and consumption in the open-well combined mining area of Anjialing-Antaibao, a multi-objective model of optimal allocation of water resources was established. The optimal water resource allocation scheme was obtained by using the PSO algorithm. The main conclusions are shown as follows:
(1)
The water supply and consumption in the study area decreased year by year from 2015 to 2020. The water supply is greater than the water consumption, and the water consumption can be satisfied. From 2015 to 2020, the proportion of reclaimed water consumption was 37.7%, 45.5%, 53.6%, 58.7%, 67.7%, and 65.6%, respectively, and the water source structure was tilted toward reclaimed water resources. Among water users, coal mining consumes the most water, while ecological water consumption is the least. There is still a large amount of recycled water that has not been reused, resulting in a waste of water resources.
(2)
The optimal water resources allocation scheme shows that the allocation scheme meets the needs of each water user within the limit of the water supply source. The sewage reuse rate reached nearly 100%, which realized the maximum utilization efficiency of water resources. The utilization rate of fresh water was 29.94%, and the dependence on freshwater resources was reduced. Reclaimed water accounts for 77.8% of the total water consumption. The water source structure has been optimized to realize efficient use of water resources.
(3)
The results show that for the complex water supply and water use structure in an open-well mining area, the optimal allocation scheme of water resources can be obtained by using a multi-objective function and PSO algorithm.
(4)
The model of efficient utilization of water resources is put forward. Attention should be paid to the precise water supply between multiple water sources and multiple water users. The focus should be on optimizing the water source structure, giving priority to recycled water, realizing the hierarchical water quality treatment and water supply of wastewater, and ensuring that the ecological water supply is given priority.
The results of this paper can provide a basis for the optimization of coal mine water resources structure and the coordinated development of coal, water and ecology. In this paper, we use the PSO algorithm to solve the multi-objective model. It should be noted that despite the high efficiency of the algorithm, the convergence conditions are not mature enough, and the randomness of particle initialization is strong. In view of the inherent low convergence accuracy, it is easy to fall into the local-optimal problems of the PSO algorithm. It can be integrated with a genetic algorithm to improve these shortcomings of the PSO algorithm in the future. The complexity of coal mine development requires dynamic control of water resource allocation. This paper only presents a static allocation scheme according to the current mining conditions. Different coal mines need to realize different allocation schemes according to different development situations.

Author Contributions

Conceptualization, L.G. (Liangliang Guo) and X.X.; methodology, L.G. (Liangliang Guo); software, J.Y.; validation, J.Z.; resources, J.Y. and N.A.; writing—original draft preparation, L.G. (Longsheng Gao); writing—review and editing, Y.W.; supervision, Z.W. All authors have read and agreed to the published version of the manuscript.

Funding

This research was funded by Shanxi Basic Research Program Project (202203021211127), China Postdoctoral Science Foundation (Nos. 2019M661053 and 2020T130390).

Data Availability Statement

Some or all of the data and the models generated or used during the study are available from the corresponding author by request.

Conflicts of Interest

The authors declare no conflict of interest.

References

  1. Mathys, N. Runoff and erosion in the Black Marls of the French Alps: Observations and measurements at the plot scale. Catena 2005, 63, 261–281. [Google Scholar] [CrossRef]
  2. Ding, N.; Lu, X.; Yang, J.; Lü, B. Water footprint of coal production. Acta Sci. Circumstantiae 2016, 36, 4228–4233. [Google Scholar]
  3. Chen, J.H.; Jiskani, I.M.; Chen, J.L.; Yan, H. Evaluation and future framework of green mine construction in China based on the DPSIR model. Sustain. Environ. Res. 2020, 30, 13. [Google Scholar] [CrossRef]
  4. Zhang, N.; Wang, D.X.; Li, L.; Jiang, H. Two-way coordinated evaluation of mine water supply and demand in coal base-Empirical Research Based on TOPSIS Method. J. Phys. Conf. Ser. 2019, 1176, 937–943. [Google Scholar] [CrossRef]
  5. Zhong, J. System Build and Evaluation Studies on Ecological Utilization of Mine Water; Shandong University of Science and Technology: Shandong, China, 2012. [Google Scholar]
  6. Wu, W.; Zhou, J.; Niu, J.; Lv, H. Study on coupling between mineral resources exploitation and the mining ecological environment in Shanxi Province. Environ. Dev. Sustain. 2021, 23, 13261–13283. [Google Scholar] [CrossRef]
  7. Zhang, X.Z.; Wang, J.; Han, P.; Ding, Y. Study on Sustainable Utilization of Water Resources in Qingdao Based on SD-MOM Model. J. China Hydrol. 2022, 42, 49–53;60. [Google Scholar]
  8. Chen, W.Y.; Zhang, M.; Zhao, W. Study on multi-objective optimal allocation of water resources system under uncertainties. J. Hydroelectr. Eng. 2021, 40, 12–24. [Google Scholar]
  9. Wu, X.; Wang, Y.; Yao, Y.; Wen, Q.; Wang, Z.; Hu, L. Interval two-phase method-based optimal allocation of urban water resources. Water Resour. Hydropower Eng. 2021, 52, 24–34. [Google Scholar]
  10. Wang, X.J. Optimal Allocation of Water Resources in Qaidam Basin; Changan University: Xian, China, 2019. [Google Scholar]
  11. Wang, L.; Fu, X.Q.; He, Y.; Yang, J.; Wang, X. Study on the water resources simulation and rational allocation in Shiyang River Basin. China Rural Water Hydropower 2021, 8, 94–97. [Google Scholar]
  12. Zhang, Y.P. Study on Optimal Allocation of Water Resources in Tianjin Based on Ecological Water Demand; Tiangong University: Tianjin, China, 2021. [Google Scholar]
  13. Wang, H.; Gao, Z.H.; Sun, C.; Zhang, J.; Li, T. Water Resource Allocation for Irrigation Optimized using the NSGA-II Model: Theory and Application. J. Irrig. Drain. 2021, 40, 118–124. [Google Scholar]
  14. Fang, G.; Wang, X.; Fang, Y.; Zhang, Y. Regional water quantity and water quality joint allocation model based on improved particle swarm optimization algorithm. Water Resour. Prot. 2022, 38, 58–64. [Google Scholar]
  15. Huang, X.F.; Shi, Z.K.; Jin, G.Y.; Fang, G. Optimal regional water resources allocation model based on carbon footprint. Water Resour. Prot. 2020, 36, 47–51. [Google Scholar]
  16. Wang, Y.; Wang, F.; Wang, Z.; Suo, M.; Chen, X.; Dong, G. Multi-objective optimal allocation of water resources based on NSGA-III algorithm in Sixian County, Anhui Province. Yangtze River 2021, 52, 73–77;85. [Google Scholar]
  17. Wang, Y.; Luo, J.; Xue, Q.; Yang, J.; Chen, J.; Yang, K. Optimal Allocation of Water Resources Based on Chaotic Gaussian Perturbation Cuckoo Algorithm. Water Resour. Power 2021, 39, 45–49. [Google Scholar]
  18. Tian, L.G.; Yang, D. Optimal allocation of regional water resources based on whale optimization algorithm. China Rural Water Hydropower 2021, 7, 42. [Google Scholar]
  19. Ji, N.Y.; Yang, K.; Chen, J.; Yang, J. Research on optimal allocation model of regional water resources based on IABC—PSO algorithm. Yangtze River 2021, 52, 49–57;87. [Google Scholar]
  20. Du, B.L.; Zhang, J.F.; Gao, Z.H.; Li, T.; Huang, Z.; Zhang, N. Optimal allocation of water resources based on simulated annealing particle swarm optimization algorithm. J. Drain. Irrig. Mach. Eng. 2021, 39, 292–299. [Google Scholar]
  21. Zeng, M.; Wang, F.; Zhang, Y.; Yu, S. Research on of the optimal allocation of water resources in Guangdong Province Based on fish swarm algorithm. J. Northwest Univ. Nat. Sci. Ed. 2020, 50, 733–741. [Google Scholar]
  22. Bian, Y.; Yang, K.; He, Q.; Yu, Y.; Wu, Y.; Tang, Z. Study on regional water resource allocation model based on improved chicken—Swarm optimization algorithm. Yangtze River 2020, 51, 84–89. [Google Scholar]
  23. He, H.; Song, S.; Wang, X.; Wang, B. An improved GWO for optimal allocation of water resources in Qingyang. J. Northwest AF Univ. Nat. Sci. Ed. 2020, 48, 136–146. [Google Scholar]
  24. Li, C.; Luo, J.; Wu, Y.; Yang, K.; Tang, Z.; Liu, L. Application and research on improved FOA in multi-objective water resource allocation. Yangtze River 2019, 50, 107–112. [Google Scholar]
  25. Zou, L.; Cai, X.; Hao, K.R. Optimized Allocation of Water resources Based on Double Objective Immune Particle Swarm Algorithm. Comput. Simul. 2018, 35, 296–301. [Google Scholar]
  26. Liu, X.; Han, Y.P. Research on Dynamic Allocation Model of Water Resources Based on Training Big Data. Yellow River 2021, 43, 52–57. [Google Scholar]
  27. Wu, X.; Chen, Z.; Wen, Q.; Wang, Z.; Hu, L. Optimal allocation model of unconventional water resources based on reinforcement learning. J. Hydroelectr. Eng. 2021, 40, 23–31. [Google Scholar]
  28. Deng, W.J. The Research on Optimal Allocation of Water Resources Hongshaquan Open-Pit Coal Mine; Anhui University of Science and Technology: Huainan, China, 2020. [Google Scholar]
  29. Duan, S.J. Study on the Dynamic Optimal Allocation Mode of Water Resources for the Coordinated Development of Coal and Water in the Open Pit Combined Mining Area; Taiyuan University of Technology: Taiyuan, China, 2020. [Google Scholar]
  30. Fang, S.Y. Study on the Optimal Allocation and Carrying Capacity of Water Resources of Coal Base in ShanXi; Zhengzhou University: Zhengzhou, China, 2016. [Google Scholar]
  31. Bai, X. Water Resources Planning in Fengfeng Mine Area Based on Ecological Concept; Hebei University of Engineering: Handan, China, 2019. [Google Scholar]
  32. Zhang, Y.B. The Optimal Allocation of Water Resources in Mountain Iron Ore Mining Area in Si Shanling of Benxi; Shenyang Jianzhu University: Shenyang, China, 2016. [Google Scholar]
  33. Yang, J.Y.; Guo, L.L. Dynamic Evaluation of Water Utilization Efficiency in Large Coal Mining Area Based on Life Cycle Sustainability Assessment Theory. Geofluids 2021, 2021, 7793988. [Google Scholar] [CrossRef]
  34. Ni, Q.G. Hybrid Algorithm Based on Particle Swarm Optimization and Genetic Algorithm and Its Application in Function Optimization; South China University of Technology: Guangzhou, China, 2014. [Google Scholar]
  35. Zhao, N.G. A new particle swarm optimization algorithm based on simulated annealing. Comput. Eng. Softw. 2015, 36, 1–4. [Google Scholar]
Figure 1. Coal mine distribution map of the study area.
Water 15 01205 g001
Figure 2. Flow chart of particle swarm optimization algorithm.
Water 15 01205 g002
Figure 3. Water source structure after optimal allocation of water resources in the study area.
Water 15 01205 g003
Figure 4. The relationship between supply and demand of water resources in mining areas after optimized allocation.
Water 15 01205 g004
Table 1. Water supply of the study area from 2015 to 2020. UWTS-SY-JG denotes an underground water treatment station in the Shangyao area of Jinggong No. 1 mine. UWTS-TX-JG denotes an underground water treatment station in the Taixi area of Jinggong No. 1 mine. TSTS-ATB denotes the terminal sewage treatment station of the Antaibao mine. DSS-AJL denotes the domestic sewage station of Anjialing mine. TSTS-AJL denotes the terminal sewage treatment station of Anjialing mine.
Type of Water SourceWater Supply (×104 m3)Year
201520162017201820192020
Fresh waterSurface water500.00500.00500.00500.00500.00500.00
Groundwater401.50401.50401.50401.50401.50401.50
Reclaimed waterUWTS-SY-JG179.5572.8798.3223.7449.9974.47
UWTS-TX-JG197.18214.72253.94339.15342.14333.41
TSTS-ATB39.1146.5238.1245.4126.4715.58
DSS-AJL90.6463.4094.5133.9040.5846.93
TSTS-AJL583.82538.37504.29489.50425.02360.58
Total1991.801837.381890.681833.201785.701732.47
Table 2. Water source in the study area from 2015 to 2020.
Water ConsumptionYear
201520162017201820192020
Surface water (×104 m3)474.09347.28336.04278.25207.31206.06
Groundwater (×104 m3)278.16218.48201.07214.35164156.76
Reclaimed water (×104 m3)454.94472.76621.58699.03776.62691.4
Total (×104 m3)1207.191038.521158.691191.631147.931054.22
Proportion of fresh water (%)62.354.546.441.332.334.4
Proportion of reclaimed water (%)37.745.553.658.767.765.6
Table 3. Water consumption in the study area from 2015 to 2020. OPM-ATB denotes open pit mining of the Antaibao (ATB) mine. OPM-AJL denotes open pit mining of the Anjialing (AJL) mine. UM-JG denotes the underground mining of Jinggong (JG) No. 1 mine. CW denotes coal washing. PSA denotes production support activities.
Water Consumption (×104 m3)Year
201520162017201820192020
Ecological water use0059.2793.7345.0636.98
OPM-ATB161.1983.86135.5169.12239.14205.08
OPM-AJL146.75156.74227.27206.65240.04214.03
UM-JG186.41169.74174.95226.4171.6146.08
CW-ATB39.48102.2398.44127.79139.89138.01
CW-AJL51.0826.5757.9366.2578.4960.83
CW-JG49.3642.9537.0740.9622.4927.63
PSA-ATB118.76137.38146.65124.8695.82106.15
PSA-AJL106.8395.6985.5883.0283.9597.02
Others347.33223.36136.0352.8531.4522.41
Total1207.191038.521158.691191.631147.931054.22
Table 4. Water supply and consumption in the study area from 2015 to 2020. Residual = supply–consumption.
Water SourceValueYear
201520162017201820192020
Fresh waterSupply (×104 m3)901.5901.5901.5901.5901.5901.5
Consumption (×104 m3)752.25565.76537.11492.6371.31362.82
Utilization rate (%)836360554140
Reclaimed waterSupply (×104 m3)1090.30935.88989.18931.70884.20830.97
Consumption (×104 m3)454.94472.76621.58699.03776.62691.4
Utilization rate (%)425163758883
TotalSupply (×104 m3)1991.801837.381890.681833.201785.701732.47
Consumption (×104 m3)1207.191038.521158.691191.631147.931054.22
Utilization rate (%)615761656461
Residual (×104 m3)+784.61+798.86+731.99+641.57+637.77+678.25
Table 5. Water resource supply and consumption in the study area in 2020. Residual = supply–consumption.
Value (×104 m3)Water SourceTotal (×104 m3)
Surface WaterGroundwaterReclaimed Water
Supply500401.5830.971732.47
Consumption202.06156.76691.41054.22
Residual+297.94+244.74+139.57+678.25
Table 6. Water supply forecast in 2030. The meaning of the abbreviations is shown in Table 1.
Type of Water SourceWater Supply Forecast (×104 m3)
Fresh waterSurface water500.00
Groundwater401.50
Reclaimed waterUWTS-SY-JG83.16
UWTS-TX-JG280.09
TSTS-ATB35.20
DSS-AJL61.66
TSTS-AJL483.60
Total1845.21
Table 7. Water demand forecast in 2030. The meaning of the abbreviations is shown in Table 3.
Type of Water UserWater Demand Forecast (×104 m3)
Ecological water use133.83
OPM-ATB165.65
OPM-AJL198.58
UM-JG179.20
CW-ATB107.64
CW-AJL56.86
CW-JG20.78
PSA-ATB121.60
PSA-AJL92.02
Others27.17
Total1103.32
Table 8. Supply order coefficients from different water sources. The meaning of the abbreviations is shown in Table 1.
Sequence NumberType of Water SourceSupply Order Coefficient, λi
1Fresh waterSurface water0.0556
2Groundwater0.1111
3Reclaimed waterUWTS-SY-JG0.1667
4UWTS-TX-JG0.1667
5TSTS-ATB0.1667
6DSS-AJL0.1667
7TSTS-AJL0.1667
Table 9. Parameters of different water users. The meaning of the abbreviations is shown in Table 3.
Sequence NumberType of Water UserWater Use Equity Factor, θjProduction Benefit Coefficient, bj (Yuan/m3)
1Ecological water use0.12550
2OPM-ATB0.1625
3OPM-AJL0.1625
4UM-JG0.1625
5CW-ATB0.1625
6CW-AJL0.1625
7CW-JG0.1625
8PSA-ATB0.1550
9PSA-AJL0.1550
10Others0.08550
Table 10. Water supply-demand relationship matrix in the study area. The value 1 represents that the water supply source and the water user can establish a supply relationship. The value 0 means that the supply relationship cannot be established between the water supply and the water user.
Water UserWater-Supply Source
UWTS-SY-JGUWTS-TX-JGTSTS-ATBDSS-AJLTSTS-AJLSurface WaterGroundwater
Ecological water use1111111
OPM-ATB0111110
OPM-AJL0101101
UM-JG1101101
CW-ATB1111110
CW-AJL1101101
CW-JG1101101
PSA-ATB0000010
PSA-AJL0000001
Others0000011
Table 11. Calculation results of water resources optimal allocation in the study area.
Water User (×104 m3)Water-Supply Source Total
(×104 m3)
UWTS-SY-JGUWTS-TX-JGTSTS-ATBDSS-AJLTSTS-AJLSurface WaterGroundwater
Ecological water use51.1237.610.000.0058.470.000.00147.21
OPM-ATB0.0066.560.000.00115.650.000.00182.21
OPM-AJL0.000.000.000.00218.440.000.00218.44
UM-JG0.0064.570.0059.3068.170.005.07197.11
CW-ATB32.0451.1635.200.000.000.000.00118.40
CW-AJL0.0060.190.002.360.000.000.0062.54
CW-JG0.000.000.000.0022.860.000.0022.86
PSA-ATB0.000.000.000.000.00133.760.00133.76
PSA-AJL0.000.000.000.000.000.00101.22101.22
Others0.000.000.000.000.0029.890.0029.89
Total83.16280.0935.2061.66483.59163.65106.291213.64
Table 12. Supply-demand balance analysis after optimal allocation of water resources in the study area.
Value (×104 m3)Water SourceTotal (×104 m3)
Surface WaterGroundwaterReclaimed Water
Supply500.00401.50943.711845.21
Consumption163.65106.29943.701213.64
Residual+336.35+295.21+0.01+631.57
Disclaimer/Publisher’s Note: The statements, opinions and data contained in all publications are solely those of the individual author(s) and contributor(s) and not of MDPI and/or the editor(s). MDPI and/or the editor(s) disclaim responsibility for any injury to people or property resulting from any ideas, methods, instructions or products referred to in the content.

