Article

Disaster Mechanism and Evolution Characteristics of Landslide–Debris-Flow Geohazard Chain Due to Strong Earthquake—A Case Study of Niumian Gully

1
School of Civil Engineering, Henan Polytechnic University, Jiaozuo 454000, China
2
GongQing Institute of Science and Technology, Gongqing City 332020, China
3
Faculty of Public Safety and Emergency Management, Kunming University of Science and Technology, Kunming 650093, China
4
Key Laboratory of Geological Disaster Risk Prevention and Control and Emergency Disaster Reduction of Ministry of Emergency Management of the People’s Republic of China, Kunming 650093, China
5
Key Laboratory of Early Rapid Identification, Prevention and Control of Geological Disaster in Traffic Corridor of High Intensity Earthquake Mountainous Area of Yunnan Province, Kunming 650093, China
6
Key Laboratory of Lower Yellow River Channel and Estuary Regulation, MWR, Yellow River Institute of Hydraulic Research, YRCC, Zhengzhou 450003, China
*
Authors to whom correspondence should be addressed.
Water 2023, 15(6), 1218; https://doi.org/10.3390/w15061218
Submission received: 21 December 2022 / Revised: 17 March 2023 / Accepted: 17 March 2023 / Published: 20 March 2023
(This article belongs to the Section Soil and Water)

Abstract

:
Taking the Niumian Gully landslide–debris-flow geohazard chain as an example, we analyze the disaster mechanism of the landslide–debris-flow geohazard chain and its evolution process through field investigation as a reference for disaster prevention and risk reduction in areas with strong earthquakes by analyzing the accumulative sliding amount and the critical rainfall for debris flow formed by loose deposits. Due to the 8.0 Ms earthquake in Wenchuan, the cumulative sliding of the slope reached 230.51 m, much greater than the critical sliding in the Longmen Mountain earthquake area. Permanent damage to the slope occurred, resulting in a landslide, which provided the material source for the occurrence of debris flows. When the study area experienced concentrated rainfall (e.g., exceeding 10.31 mm/h or 54.67 mm/d), loose deposits in the basin began to form a debris flow, causing a landslide–debris-flow geohazard chain. During the evolution process of the geohazard chain, the following stages were observed: pre-earthquake gestation, landslide starting during a strong earthquake, landslide blocking a channel and forming a dammed lake, bursting of the dammed lake flood–debris-flow, sliding of loose deposits, and reciprocating loose-deposit sliding and debris flows. Thus, the formation of the Niumian Valley geohazard chain can be attributed to the combined result of strong earthquake activities and rainfall. In addition, under the action of rainfall, the occurrence of the debris flow and unstable sliding of loose deposits also caused the reciprocating occurrence of debris flows, loose-deposit sliding, and flood-induced debris flows in the study area.

1. Introduction

China is located on the circum-Pacific seismic belt and the Alpine–Himalayan seismic belt, leading to frequent moderate–strong earthquakes. Mountain disasters induced by strong earthquakes in western China are quite serious [1,2,3,4]. A strong concentration of collapses and landslides caused by earthquakes is mainly concentrated in the north–south seismic belt, which extends from Zhongning in Ningxia to two sides of Liupan Mountain in Gansu, along the Tianshui–Wudu lines, as well as the western Sichuan and eastern Yunnan near the Yunnan–Vietnam border, with a total extent of more than 1600 km. In this area, numerous earthquakes of high intensity have occurred, and the terrain is complex. Under special topographic and meteorological conditions, the likelihood of the occurrence of mountain disasters such as landslides, collapses, and debris flows is generally high [4,5,6,7,8,9,10]. It is likely that that such mountain disasters will trigger or transform into other types of disasters, forming a geohazard chain characterized by temporal, spatial, and causal (i.e., chain) evolution, leading to serious damage over a wide spatial–temporal range [11]. For example, in May 2008, an earthquake with a magnitude of 8.0 Ms occurred in Wenchuan, killing 100,000 people, injuring 150,000 people, and causing more than 20,000 landslides and collapses. As a result of these landslides, a large amount of sediment was deposited in gullies and riverbeds, while a large number of loose deposits were transformed into debris flows as a result of heavy rainfall. During the rainy season of 2008, 700 debris flows occurred in the center of the earthquake-stricken area, causing 400 deaths and serious damage to buildings and infrastructure [12]. In accordance with the temporal–spatial law of geological disaster activities after strong earthquakes experienced in various countries [13,14], geological disasters in the Wenchuan earthquake area may be active for decades, or even longer [15,16,17,18,19]. During the early stages of the earthquake, collapses and landslides were the predominant disaster types, followed by debris flow [20,21,22].
Several scholars from different countries have conducted detailed research on landslides and debris flows caused by strong earthquakes. Cui Shenghua [23] considered Niumiangou as an example, and found that the sample had a high shear liquefaction ability the indoor ring shear test. The peak acceleration required by the failure of slip zone material is 192 gal, and the Wenchuan earthquake provided a seismic acceleration of 799 gal along the slip zone, which fully met the conditions of slip zone liquefaction. It is speculated that the landslide may have been triggered suddenly at the early stage of the earthquake. Yang [24] conducted field investigation and dynamic analysis of debris flow after the earthquake in the Niumiangou Basin, and found that the debris flow that occurred in the basin was a viscous debris flow induced by heavy rainfall and that it mostly occurred in tributaries with good vegetation. The occurrence time was generally from 11 p.m. to 5 a.m., and the damage degree was higher than that seen in the early stage of the earthquake. Yang Qin [25] found that the occurrence of a coseismic landslide in Wenchuan earthquake was mainly caused by the instability of the slope of the fault hanging wall caused by the strong fault overthrust during the earthquake. At the same time, a large number of loose coseismic landslide materials appeared on the slope after the earthquake, which would provide material sources for the subsequent debris flow or shallow landslide. Xu [26] and Lu [27] found that, under the action of a strong earthquake, terrain would amplify ground motion on sloped surfaces, increasing the earthquake’s power. Masahiro [28] found that the boundary between overlying pervious sandstone and underlying siltstone or along the bedding surface of alternating layers of sandstone and siltstone formed parallel sliding surfaces under the action of earthquake, which was a major factor for the devastating landslide triggered by an earthquake in central Nigta Prefecture in 2004. Bastian [29] established a physical model based on actual events and used this model to simulate the disaster process of landslide and debris flow disaster chain triggered by an earthquake. In addition to causing serious coseismic landslides, strong earthquakes may also aggravate the slope instability for a long time after an earthquake has occurred. After an earthquake, a large number of loose landslide deposits can appear on a slope, providing material sources for debris flows or shallow landslides caused by rainfall [29,30]. Taking Yangtang Gully, Wenchuan County as an example, Qingfeng [31] analyzed the causes and disaster characteristics of debris flows in strong earthquake-disturbed areas. Tang [32] studied loose material sources in the channel after an earthquake and the processes of debris flows under rainfall using laboratory tests. Using physical models and numerical simulation, Huang Xun [33] quantitatively analyzed the dynamic characteristics of the whole process of initiation, circulation, and accumulation of debris flow in a strong earthquake area from three aspects: start-up discrimination, gully-bed erosion, and collapse amplification effect. The mechanical mechanism of the debris flows induced by strong earthquake erosion and collapse was verified in combination with an analysis of various cases. It has also been discovered that geological disasters induced by strong earthquakes tend to show completely different dynamic characteristics than do geological disasters under their natural action [33,34].
Whether considering the impact of an earthquake on a landslide or debris flow activity, researchers have made some achievements in terms of the study of single-type geological disasters induced by earthquake, allowing for clarification of the control mechanisms relevant to earthquakes as single-type disasters. However, there has been little research on the formation process and evolution characteristics of geohazard chains in areas with strong earthquakes. Notably, the development process of landslide–debris-flow geohazard chains is not a single disaster development process. For example, the common “landslide–debris-flow” process occurs under the action of rainfall and gravity; landslide instability provides material sources for the debris flow, following which, under the influence of continuous rainfall and surface runoff, solid loose deposits form the debris flow [35,36]. According to some scholars, the debris flow constantly erodes the foot of both sides of the slope as it moves in the channel, adversely affecting the stability of the slope and facilitating the further occurrence of landslides, resulting in a reciprocating development relationship between landslides and debris flows, thereby forming a landslide–debris-flow geohazard chain [37]. Although scholars have a deep understanding of landslides and debris flow disasters induced by earthquakes, they mostly focus on single-type disasters and do not analyze the relationship between landslides and debris flow disasters from the perspective of chain disasters. Some scholars have realized this, but most of them focus on describing the general characteristics of a disaster chain in a large range. There are few specific and in-depth studies on the disaster mechanism and the evolution characteristics of the disaster chain of a single gully affected by strong earthquakes. Therefore, taking the landslide and debris flow developed in Niumian Gully—the focal area of Wenchuan earthquake—as an example, we analyzed the impact of the Wenchuan earthquake on the stability of the slope in the study area, as well as the critical levels of rainfall for debris flow formed by loose deposits following landslide falls, and ultimately analyzed the disaster mechanism of the landslide–debris-flow geohazard chain in the study area. As a result, the evolutionary characteristics of landslide–debris-flow geohazard chains under the influence of strong earthquakes can be determined, which can provide a scientific basis for landslide–debris-flow disaster prevention and mitigation in areas with strong earthquakes.

2. Study Area

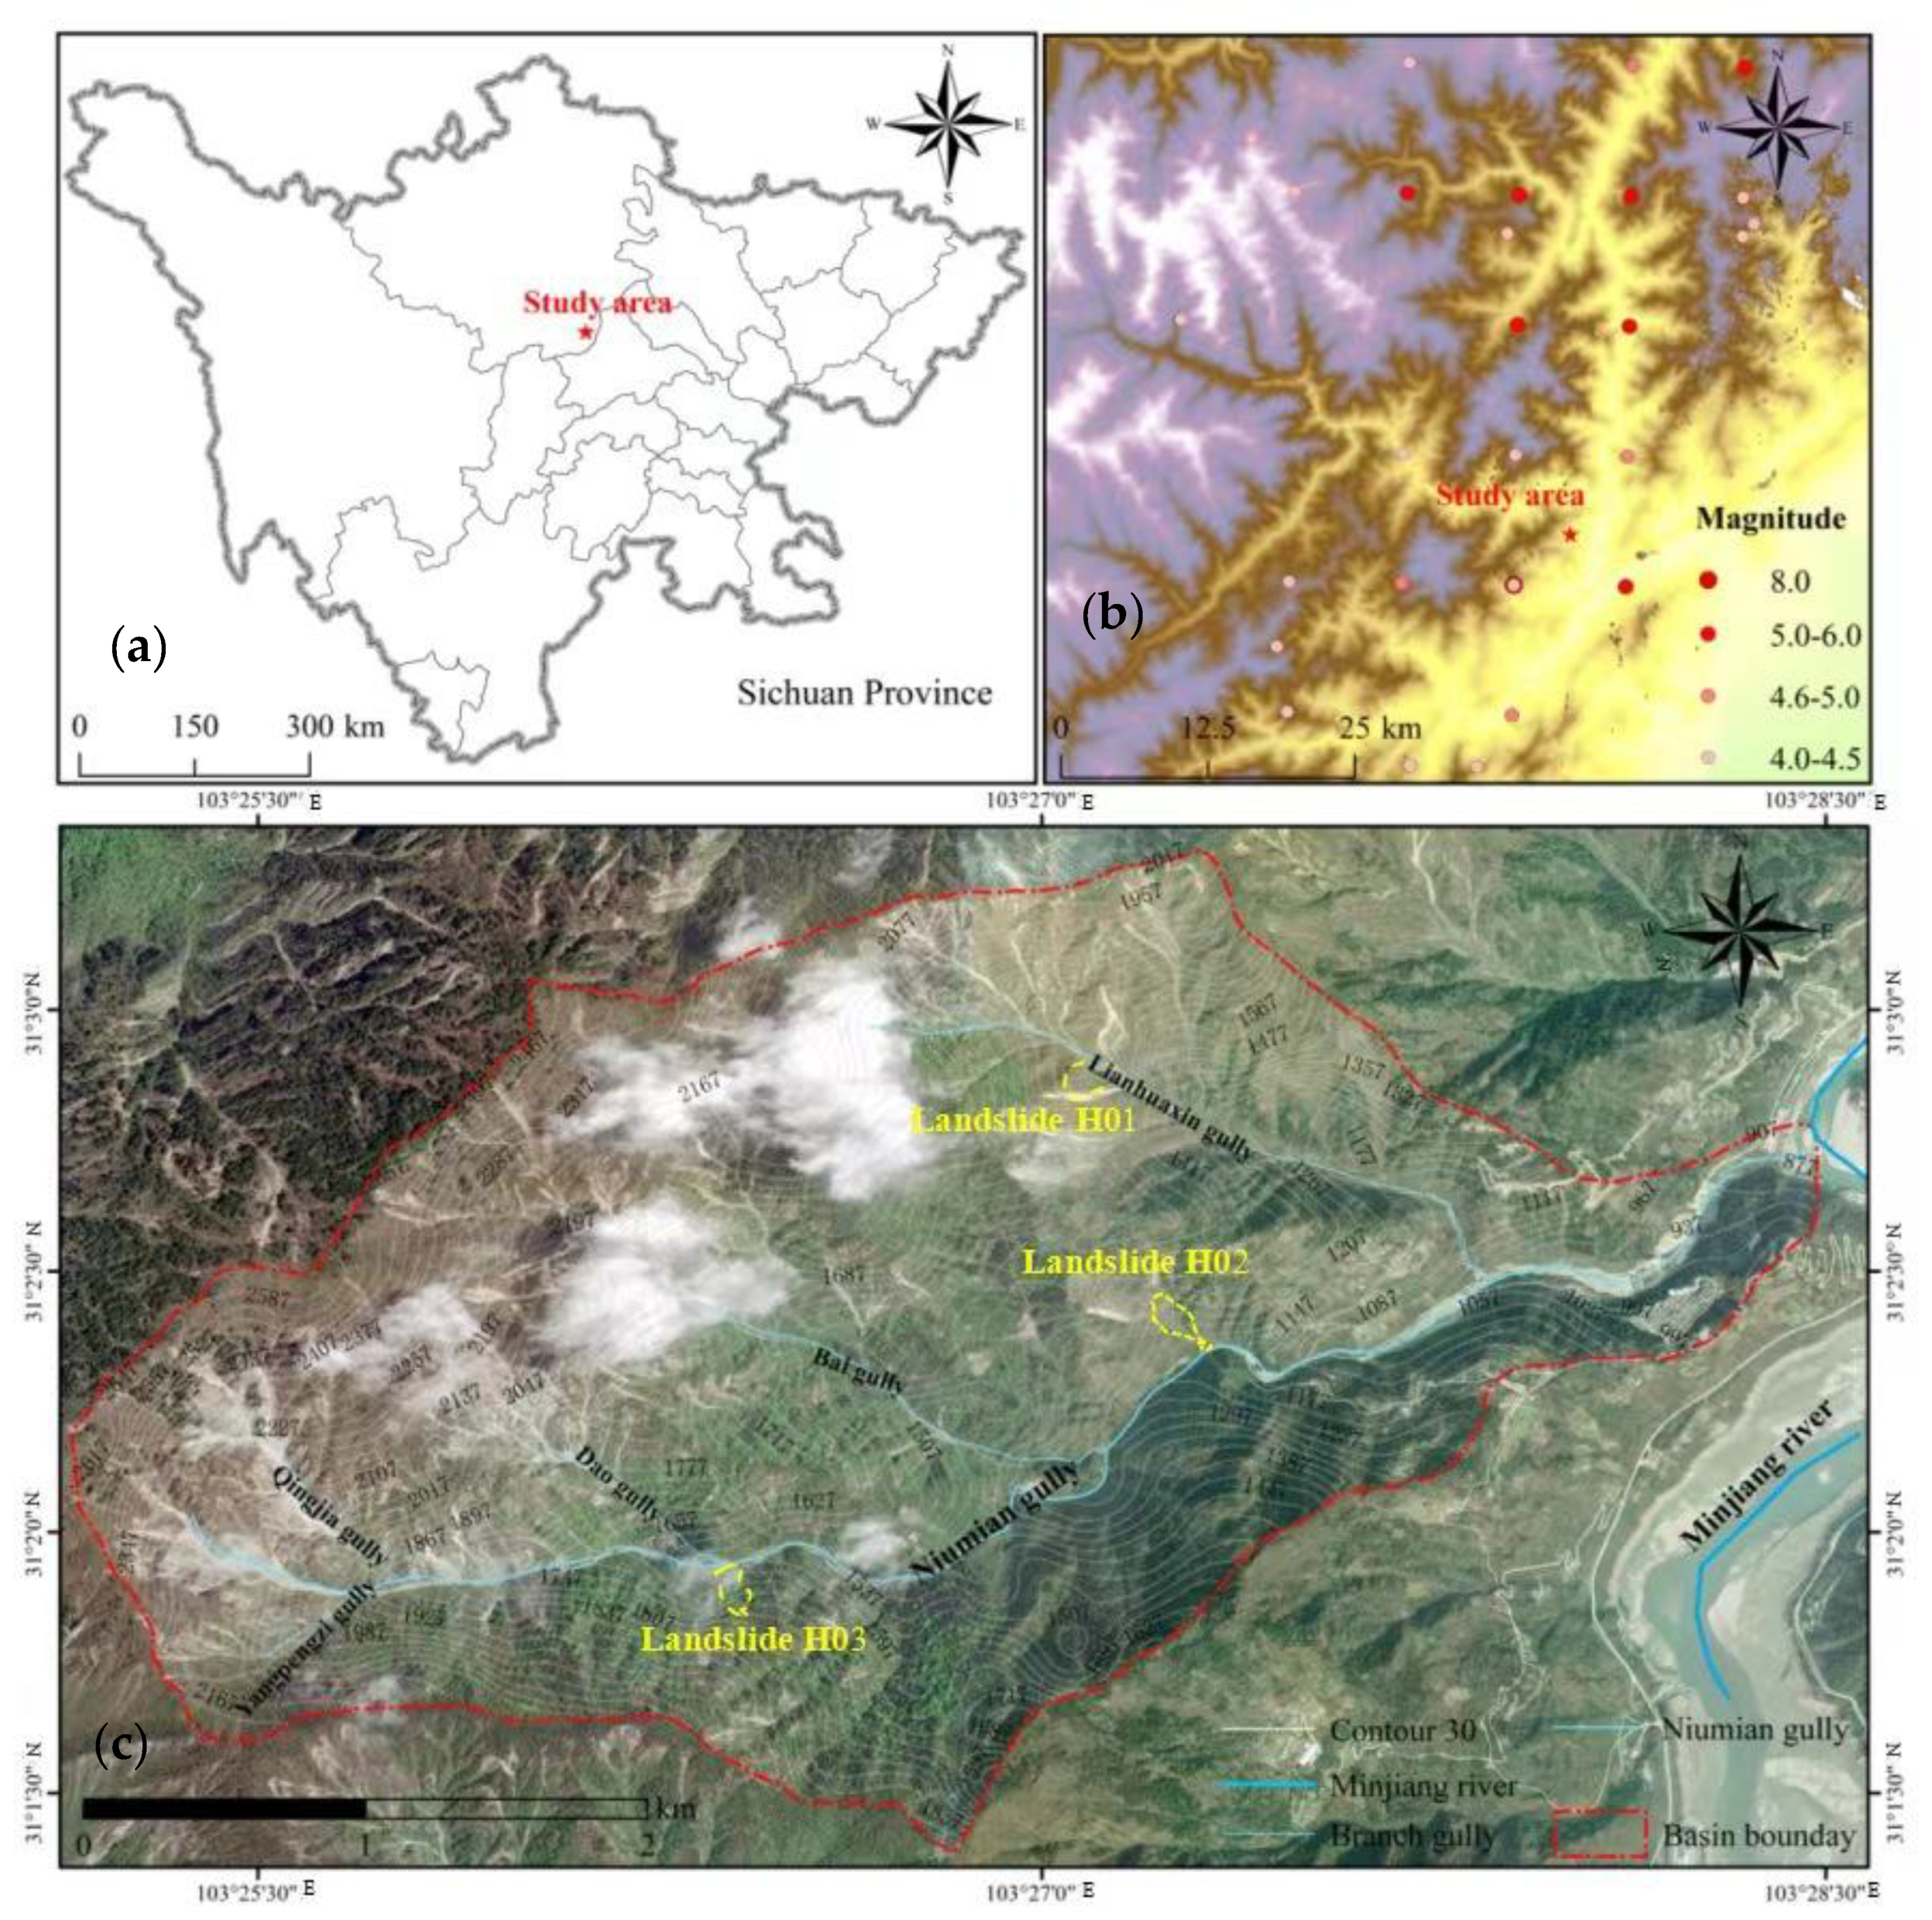
2.1. Topographic Features

Niumian Gully is located on the south side of Yingxiu Town, Wenchuan County, Aba Tibetan and Qiang Autonomous Prefecture, Sichuan Province (Figure 1a). It is a tributary on the right bank of Minjiang River (Figure 1c). The geographical coordinates of the gully are 31°02′44.1″ N, 104°14′8.23″ E. In total, the basin covers an area of 10.7 km2, the main gully extends for 6.12 km, and the average longitudinal slope of the basin is approximately 266%. In the basin, the highest elevation is 2700 m and the lowest elevation is 858 m, which gives an elevation difference of 1842 m. Due to the stratigraphic lithology and geological structure of the basin, the left bank is wide, with branches such as Lianhuaxin Gully, Baigou Gully, and Daogou Gully, while the right bank is narrow, with no branches. The large relative height difference and steep gully bed in the basin are conducive to the accumulation of water and other material sources, thus providing sufficient dynamic potential energy conditions for the outbreak of a debris flow.

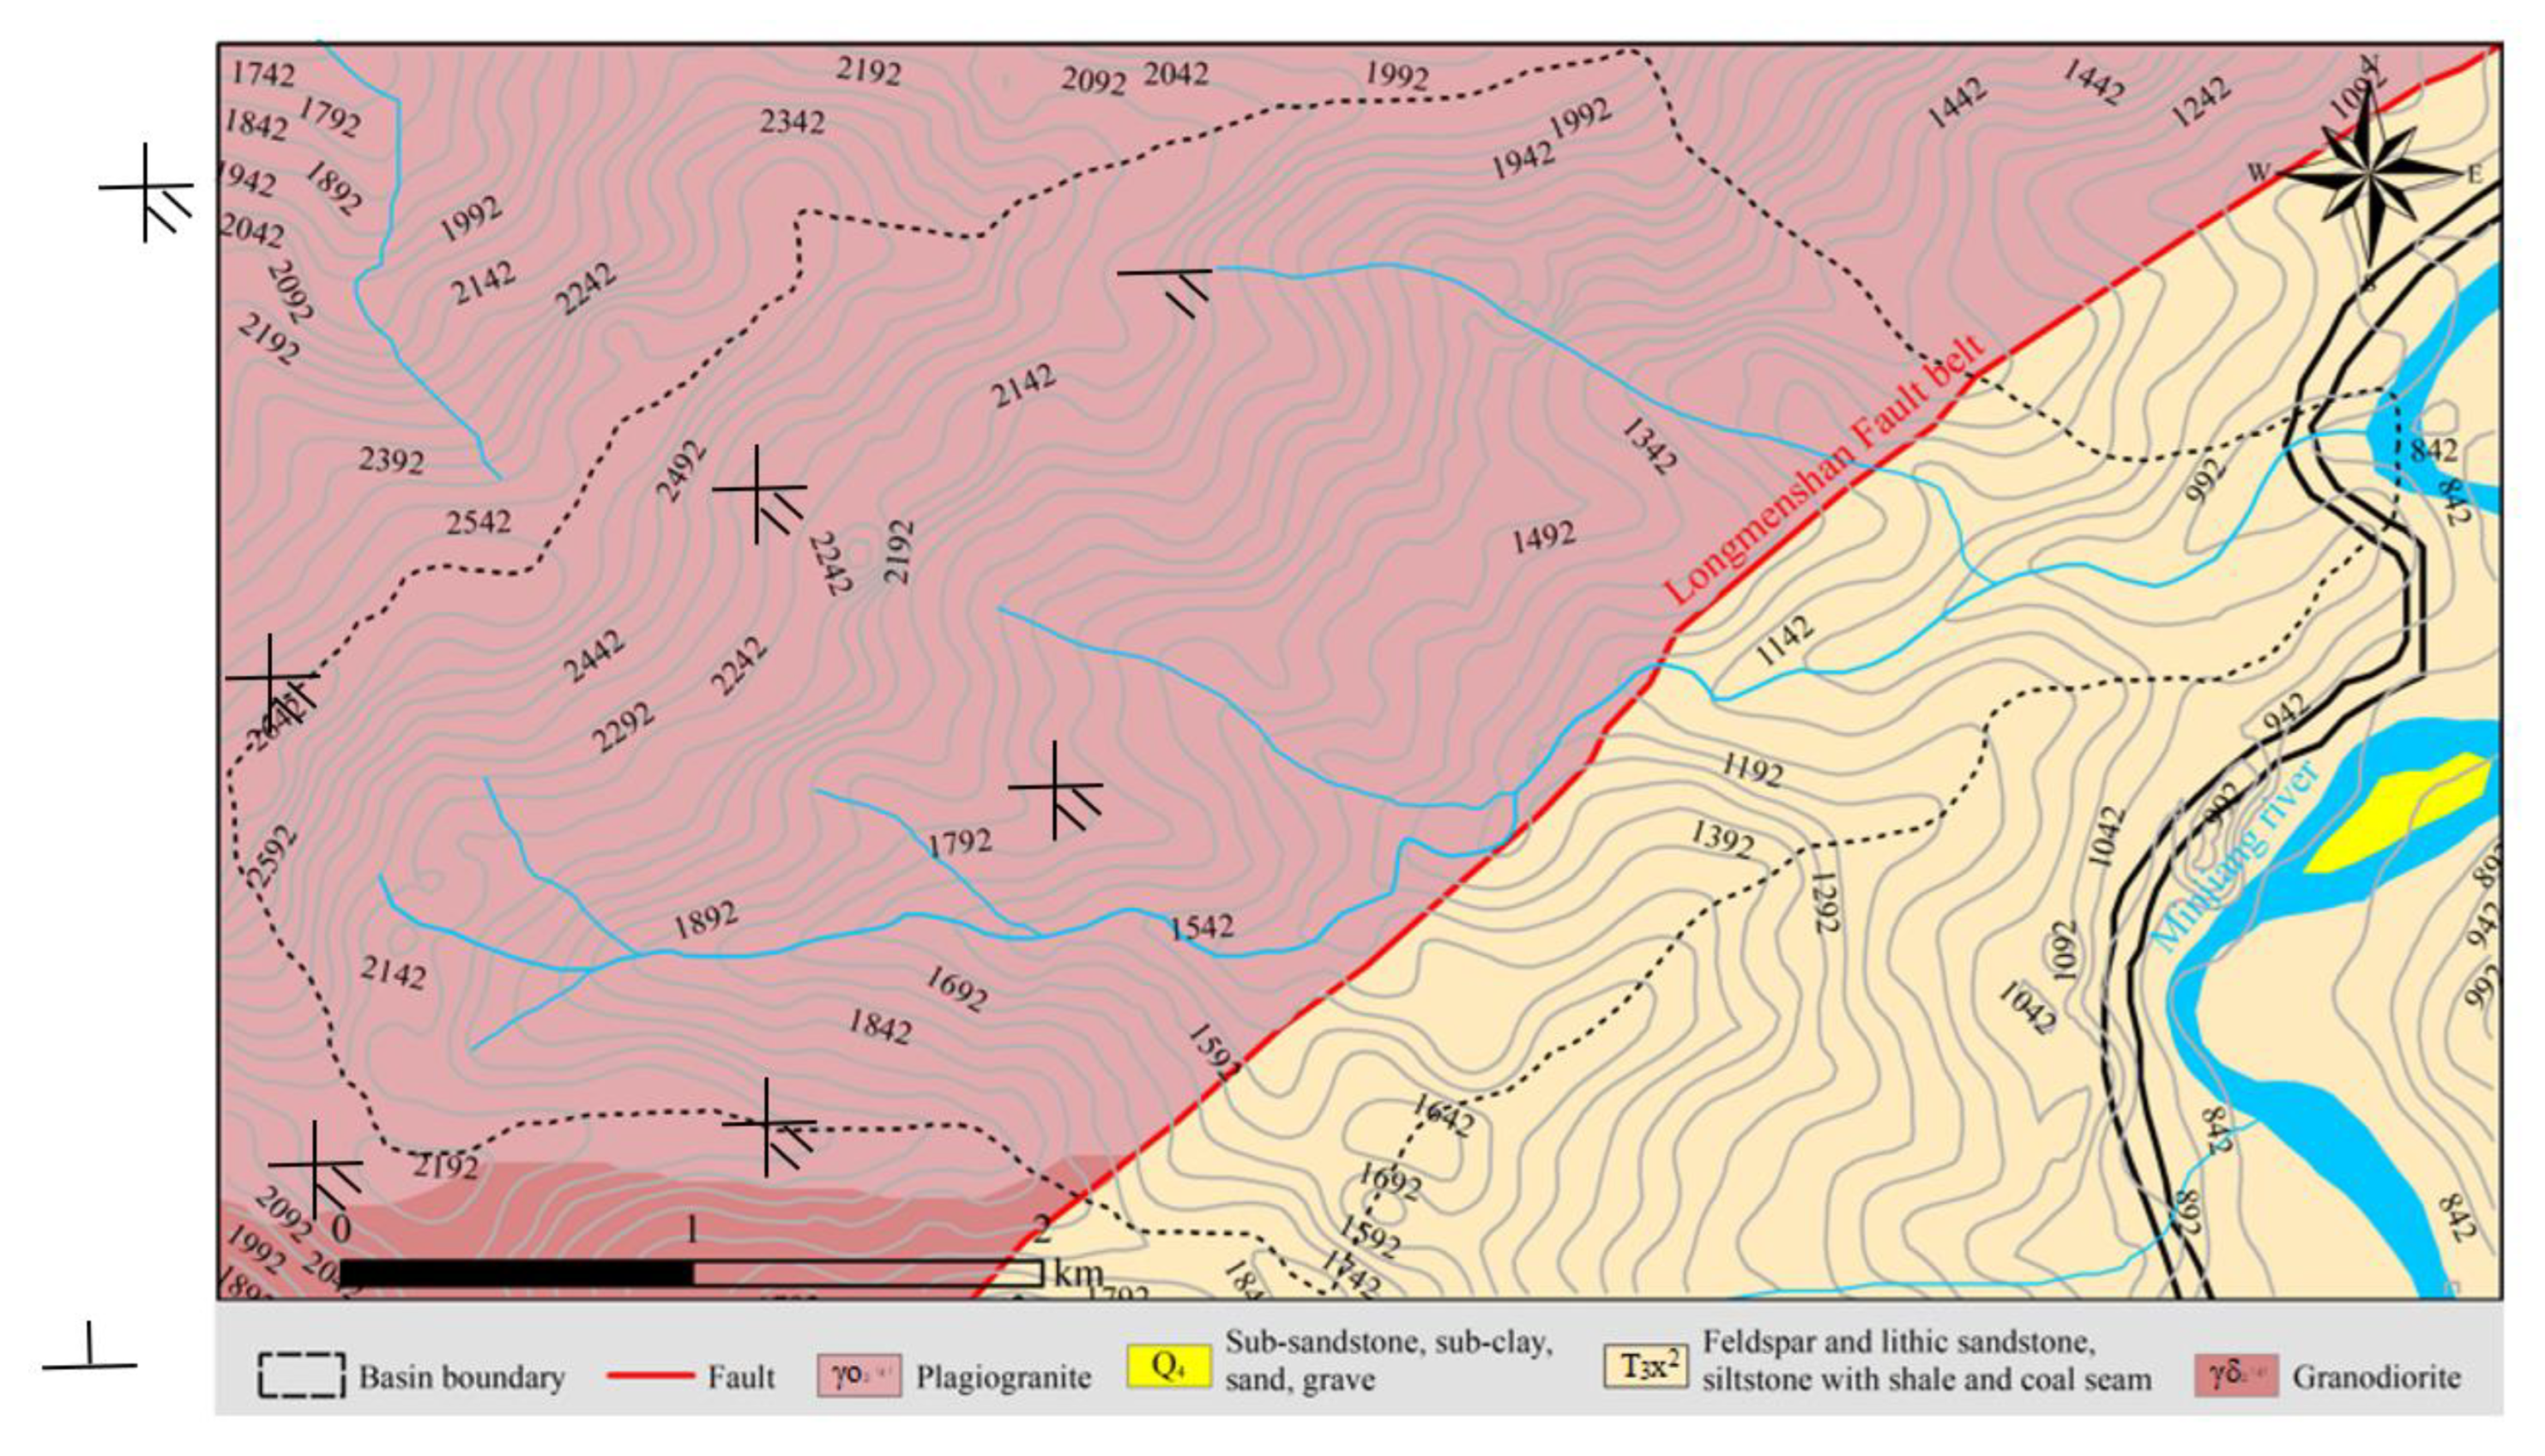
2.2. Geological Background

In the study area, the geological structure is active, with faults and joints developing. The central fault zone of Longmen Mountain runs through this area in a NE–SW direction, Figure 2. The exposed strata in the basin are mainly Mesoproterozoic (Pt) and Triassic (T); the Mesoproterozoic (Pt) strata are composed of granite and diorite, while the Triassic (T) strata are composed of sandstone, mudstone, and slate. The study area is prone to earthquakes. Since 1169, there have been thirteen earthquakes with intensity VI and four earthquakes with intensity VII or above in the Longmen Mountain area [38]. Among them, the most significant impact was caused by the earthquake of magnitude 8.0 Ms in Yingxiu Town, Wenchuan County, on 12 May 2008. There are many cracks in the roads on the west bank of the Minjiang River as a result of the earthquake, and the overall trend of cracks is 40°–50°. The vertical tail wing measured and calculated along the road edge profile is 2.3–2.8 m, and the horizontal shortening is 0.23–0.25 m. The fault dip angle is approximately 86° [39]. Additionally, the earthquake vertically dislocated the ground of Minjiang IV step by approximately 40 m, forming normal faults and grabens on the bending moment fault in the hanging wall of the reverse fault [40].

2.3. Meteorological and Hydrological Characteristics

The study area is located in the sub-tropical humid monsoon climate zone, as part of the rainy center of western Sichuan, an area characterized by frequent rainstorms. In this zone, there are four distinct seasons, including a hot and humid summer and a mild winter, with small temperature differences. Rainstorms occur frequently in the summer, with high intensity and short duration. There is a high incidence period of geological disasters, such as landslides and debris flows during the flood season every year (i.e., from May to September). According to the measured data of Yuzixi Hydrological Station, the average annual precipitation for many years has been 1253.1 mm, the maximum annual precipitation was 1688 mm (in 1964), and the minimum annual precipitation was 836.7 mm (in 1974). The maximum precipitation of 853.2 mm for four consecutive months (June to September) accounts for 68.2% of the annual precipitation, and the maximum daily precipitation is 269.8 mm.

3. General Situation of Landslides and Debris Flows in Niumian Gully
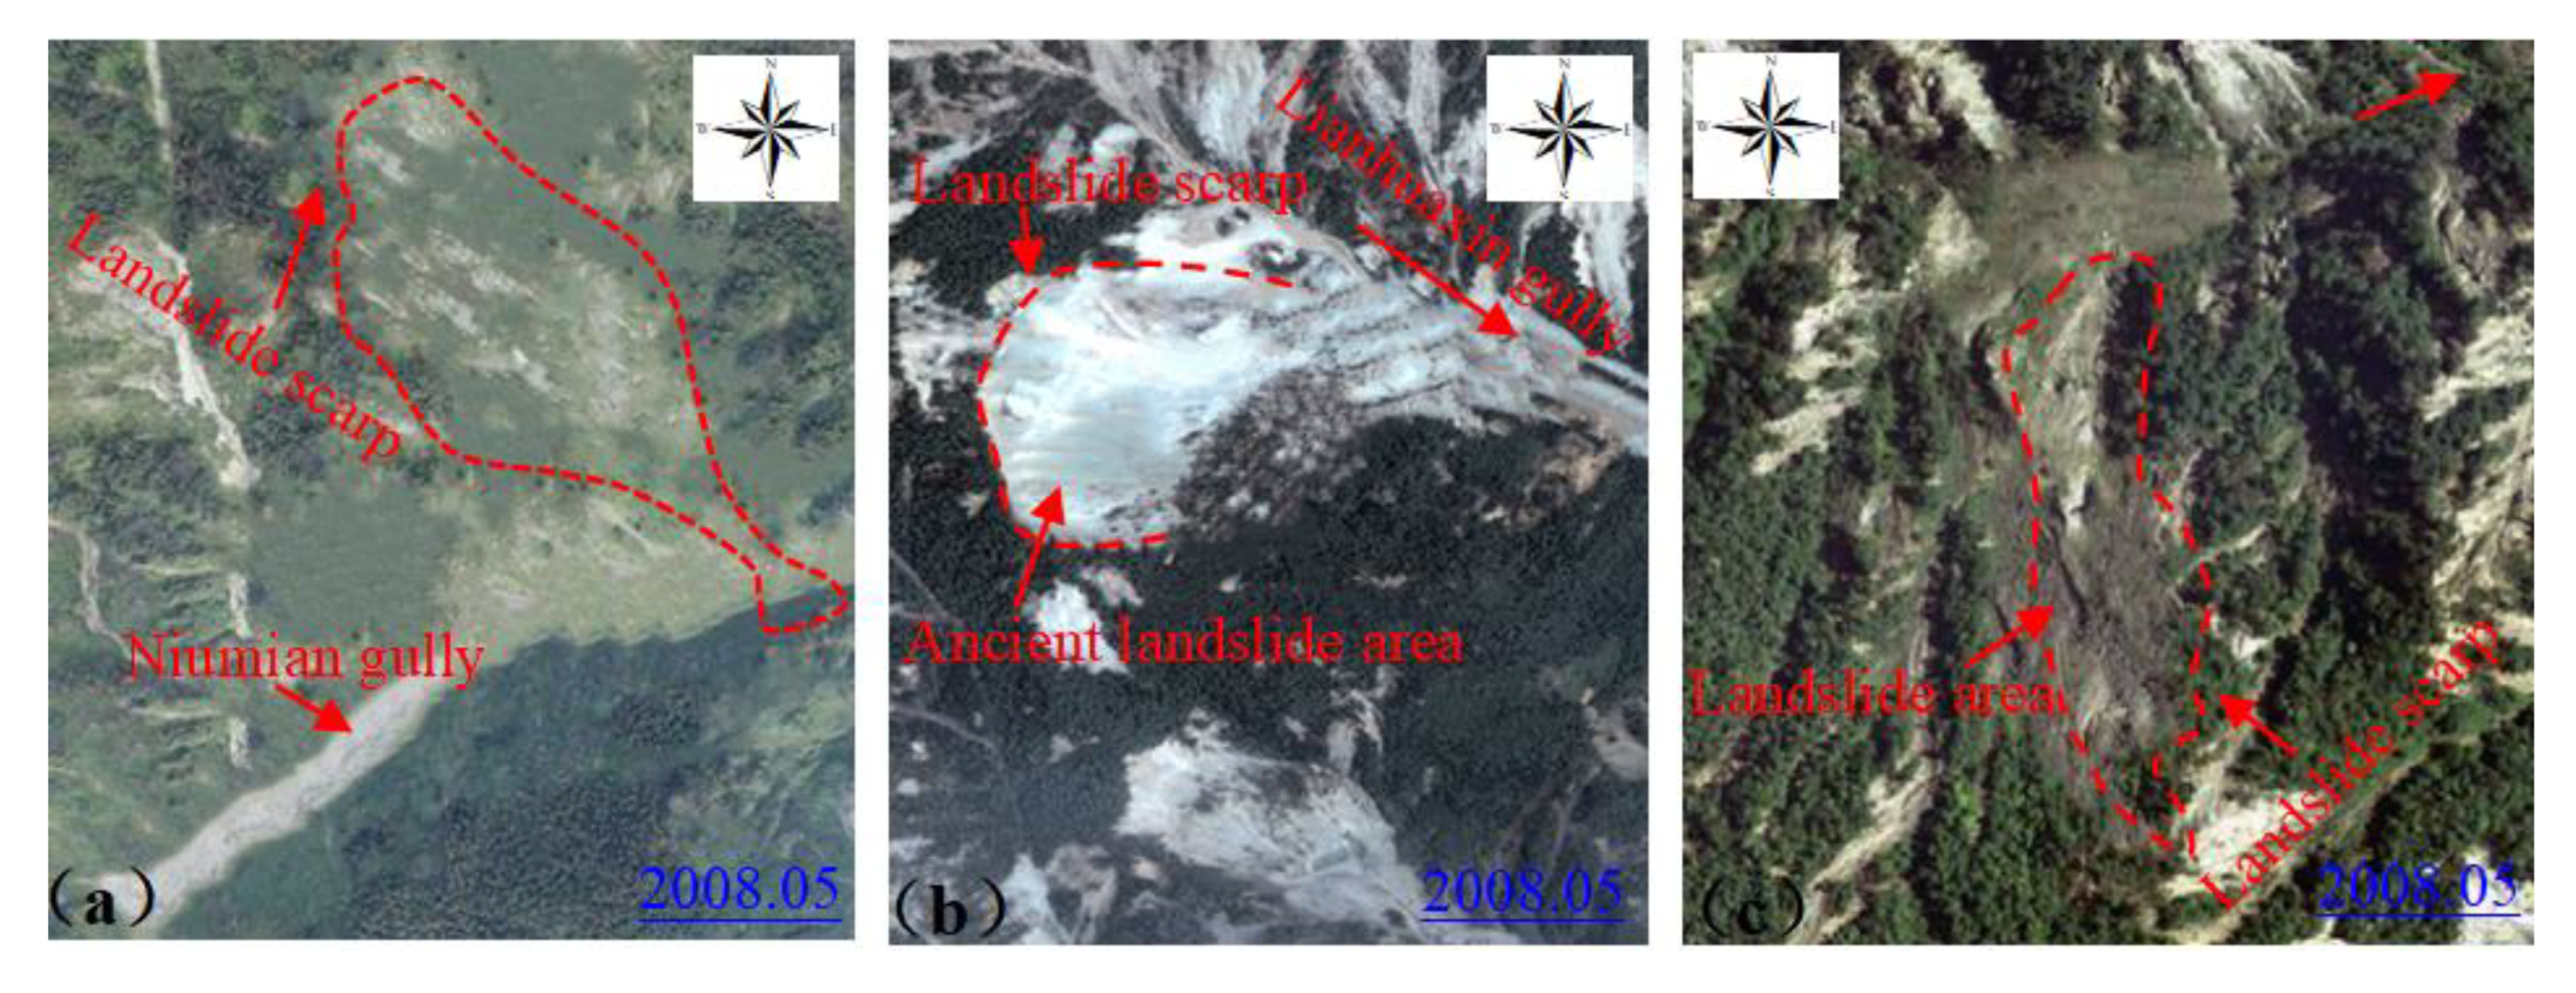
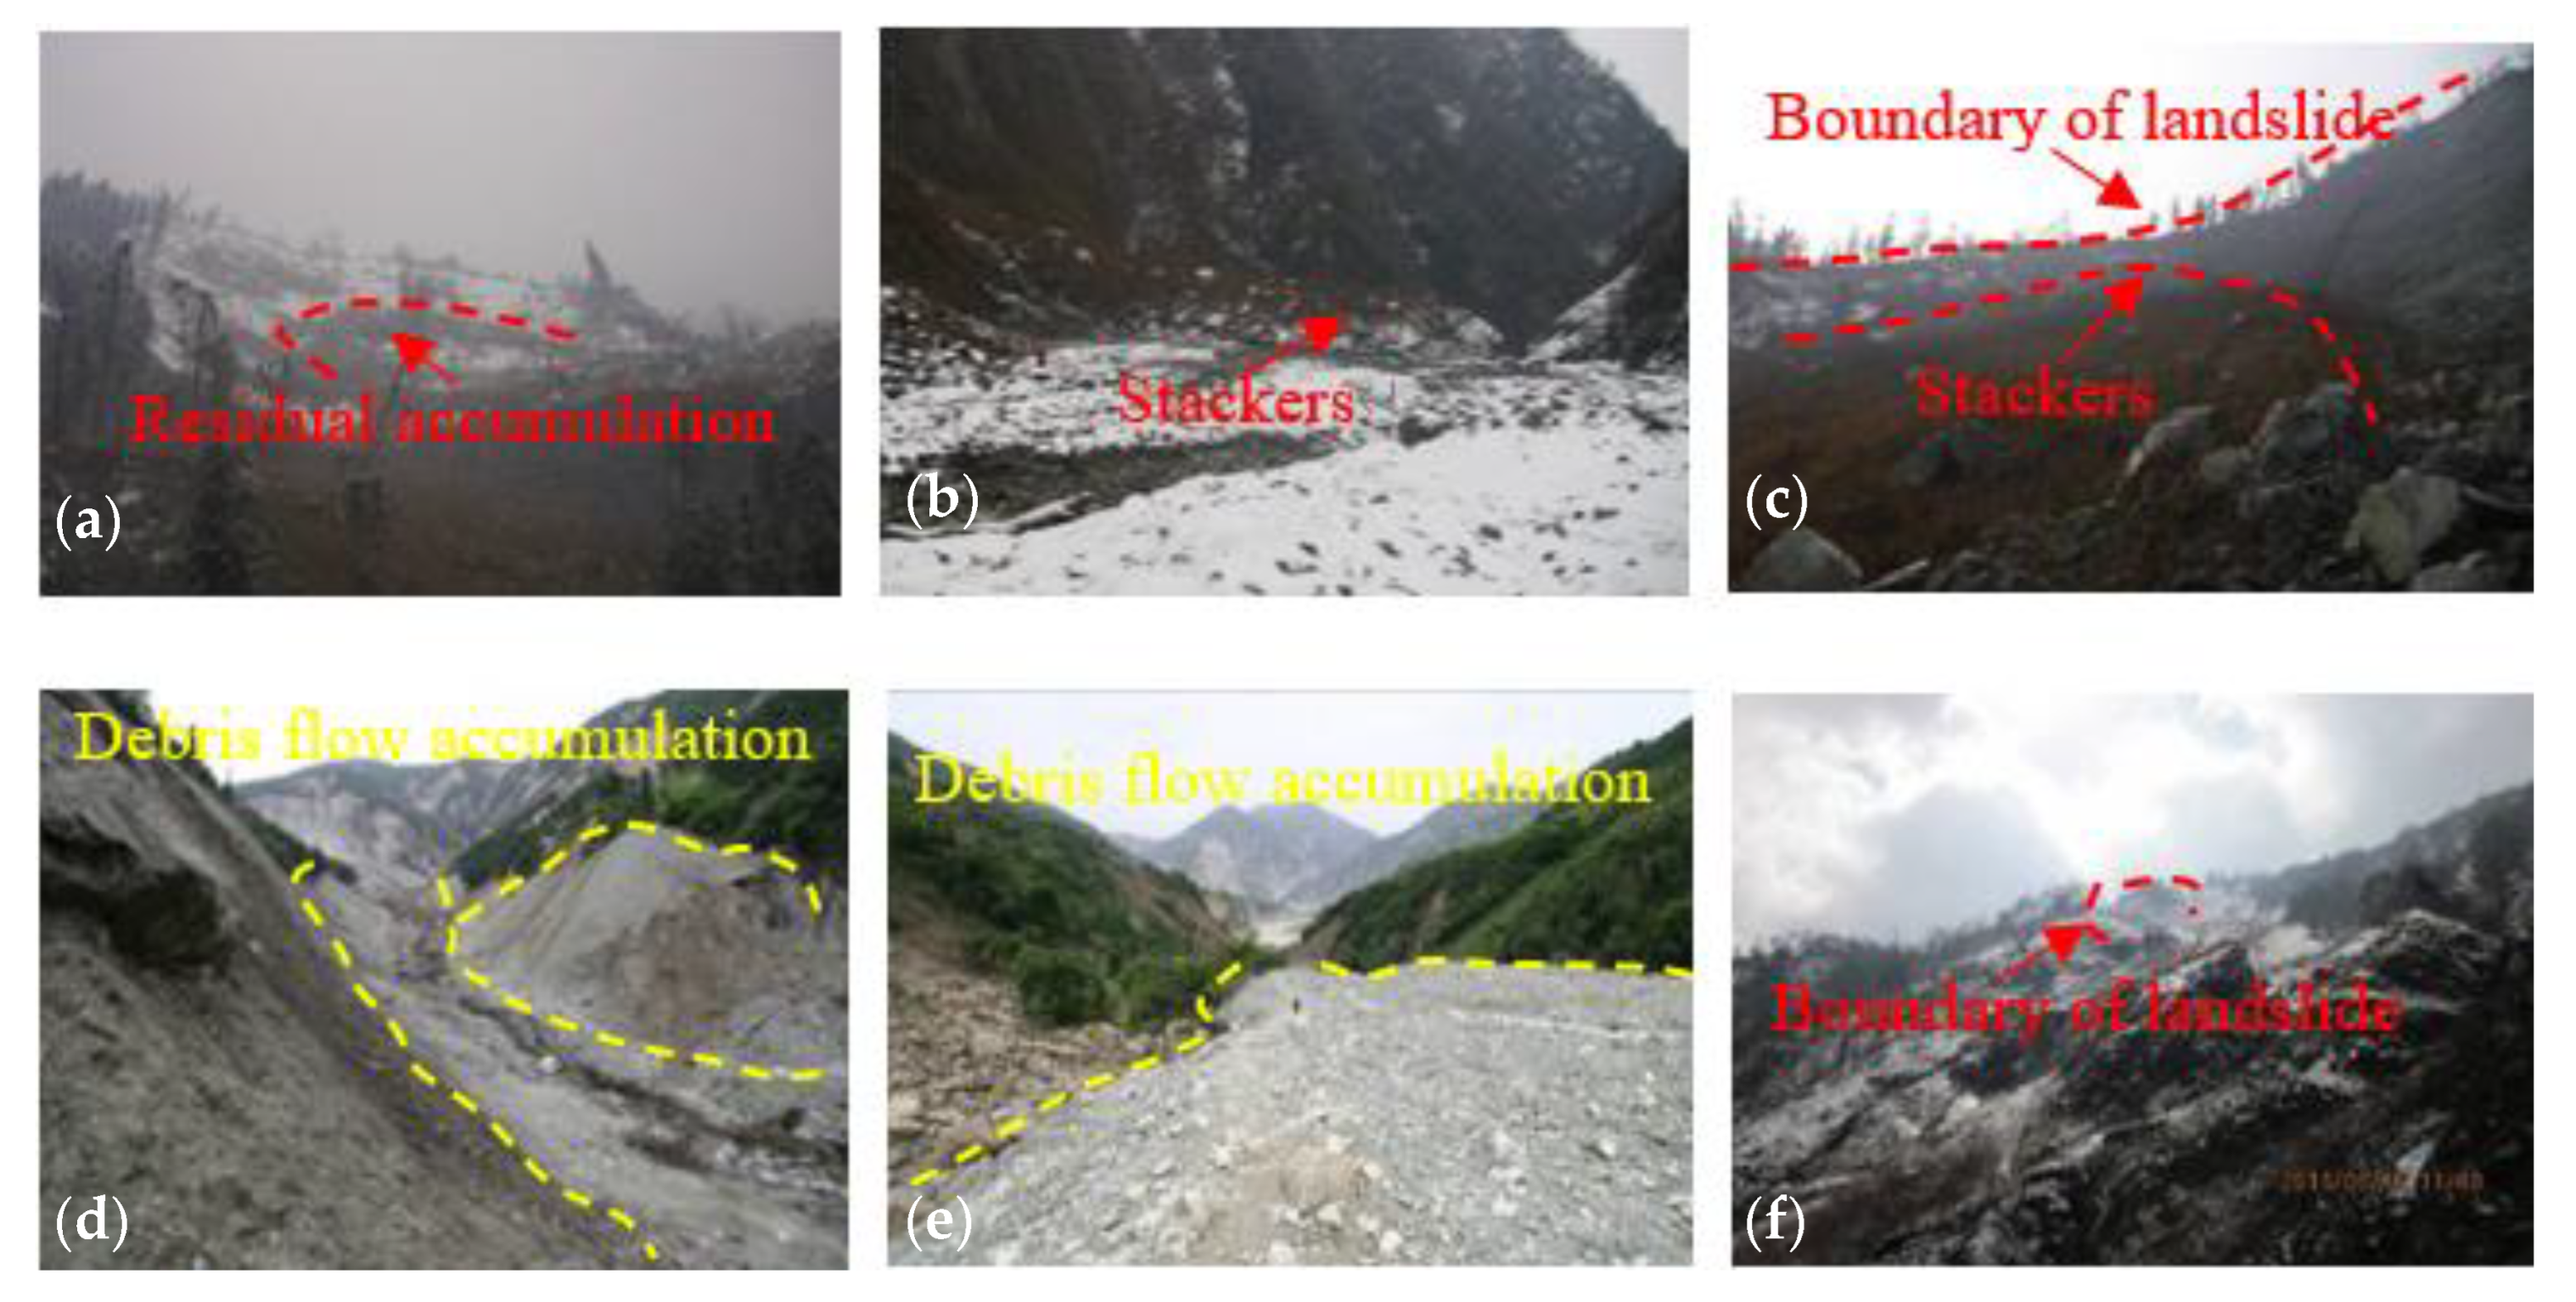
3.1. Landslide

According to the site survey, three new landslides have occurred in the basin since the Wenchuan earthquake (Figure 3). Landslide H01 is located in the middle and upper part of the left bank slope in the middle reaches of the main gully, with an overall aspect of 105°; the upper part of the slope is the loose soil layer and strongly weathered zone of the granite body surface (Figure 3a). Landslide H02, which developed in Lianhuaxin Gully, has an overall aspect of approximately 46°, a longitudinal length of approximately 450 m, a transverse width of about 270 m, an average thickness of about 35 m, a volume of about 4.25 × 10⁶ m3, and it belongs to a large landslide. Generally, the sliding bed consists of a complete granite body, and the sliding surface is the ancient sliding surface or the contact surface between weathered and broken granite body and complete bedrock (Figure 3b). Landslide H03 developed upstream of the main gully, on the right bank of the main gully at the intersection of the inverted gully and the main gully, with an overall aspect of about 347°. The landslide area is approximately 330 m long and 70 m wide, with a loose-deposit thickness of approximately 10 m and a sliding-body volume of about 37.15 × 10⁴ m3, making it a medium-sized landslide (Figure 3c). Complete granodiorite bedrock is exposed in the landslide area, while the slope is mainly Archaean granite diorite.

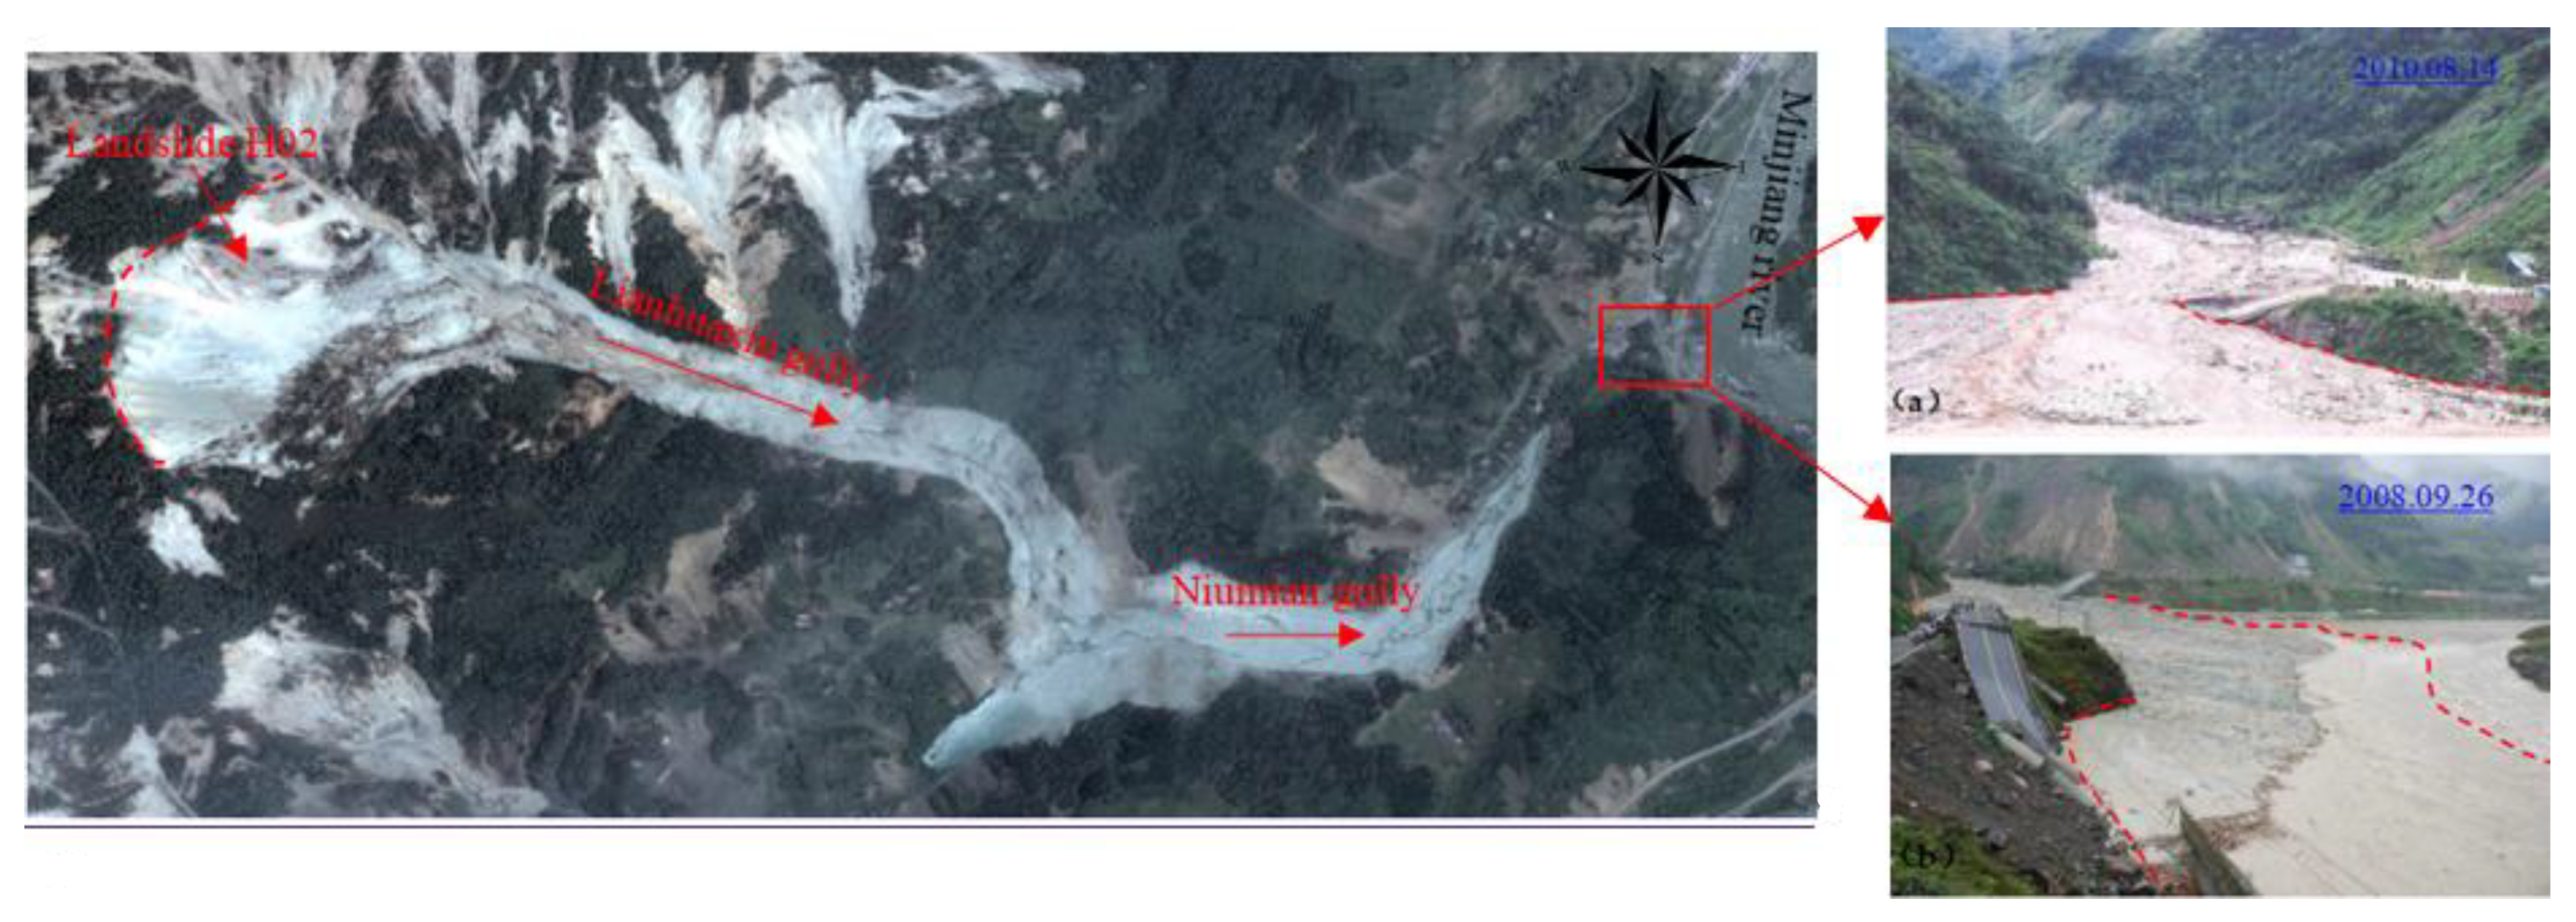
3.2. History of Debris Flow Activities

From 28 June 2008 to 2011, there were more than 10 debris flows in the study area. Among them, there were seven large-scale debris flows [41,42], mainly from September 2008 to August 2010. In 2008, the 26 September debris flow fan formed at the gully mouth, with a width of 200 m, a length of 120 m, and a thickness of 6 m. The accumulation volume was 6.0 × 10⁴ m3, and approximately two-thirds of the riverbed of the Minjiang River was blocked (Figure 4a). In 2010, the 14 August debris flow fan formed at the gully mouth, with a width of approximately 160 m, a length of approximately 100 m, and a thickness of approximately 5 m. The accumulation volume was 4.0 × 10⁴ m3, and about half of the riverbed of the Minjiang River was blocked (Figure 4b). Two large-scale debris flows blocked the old National Highway 213 at the mouth of the gully and squeezed the Minjiang River, causing the river’s course to shift and seriously affect the flood discharge function of the Minjiang River. As a result, Yingxiu Town has been frequently affected by floods.

4. Influence Factors of the Landslide–Debris-Flow Geohazard Chain

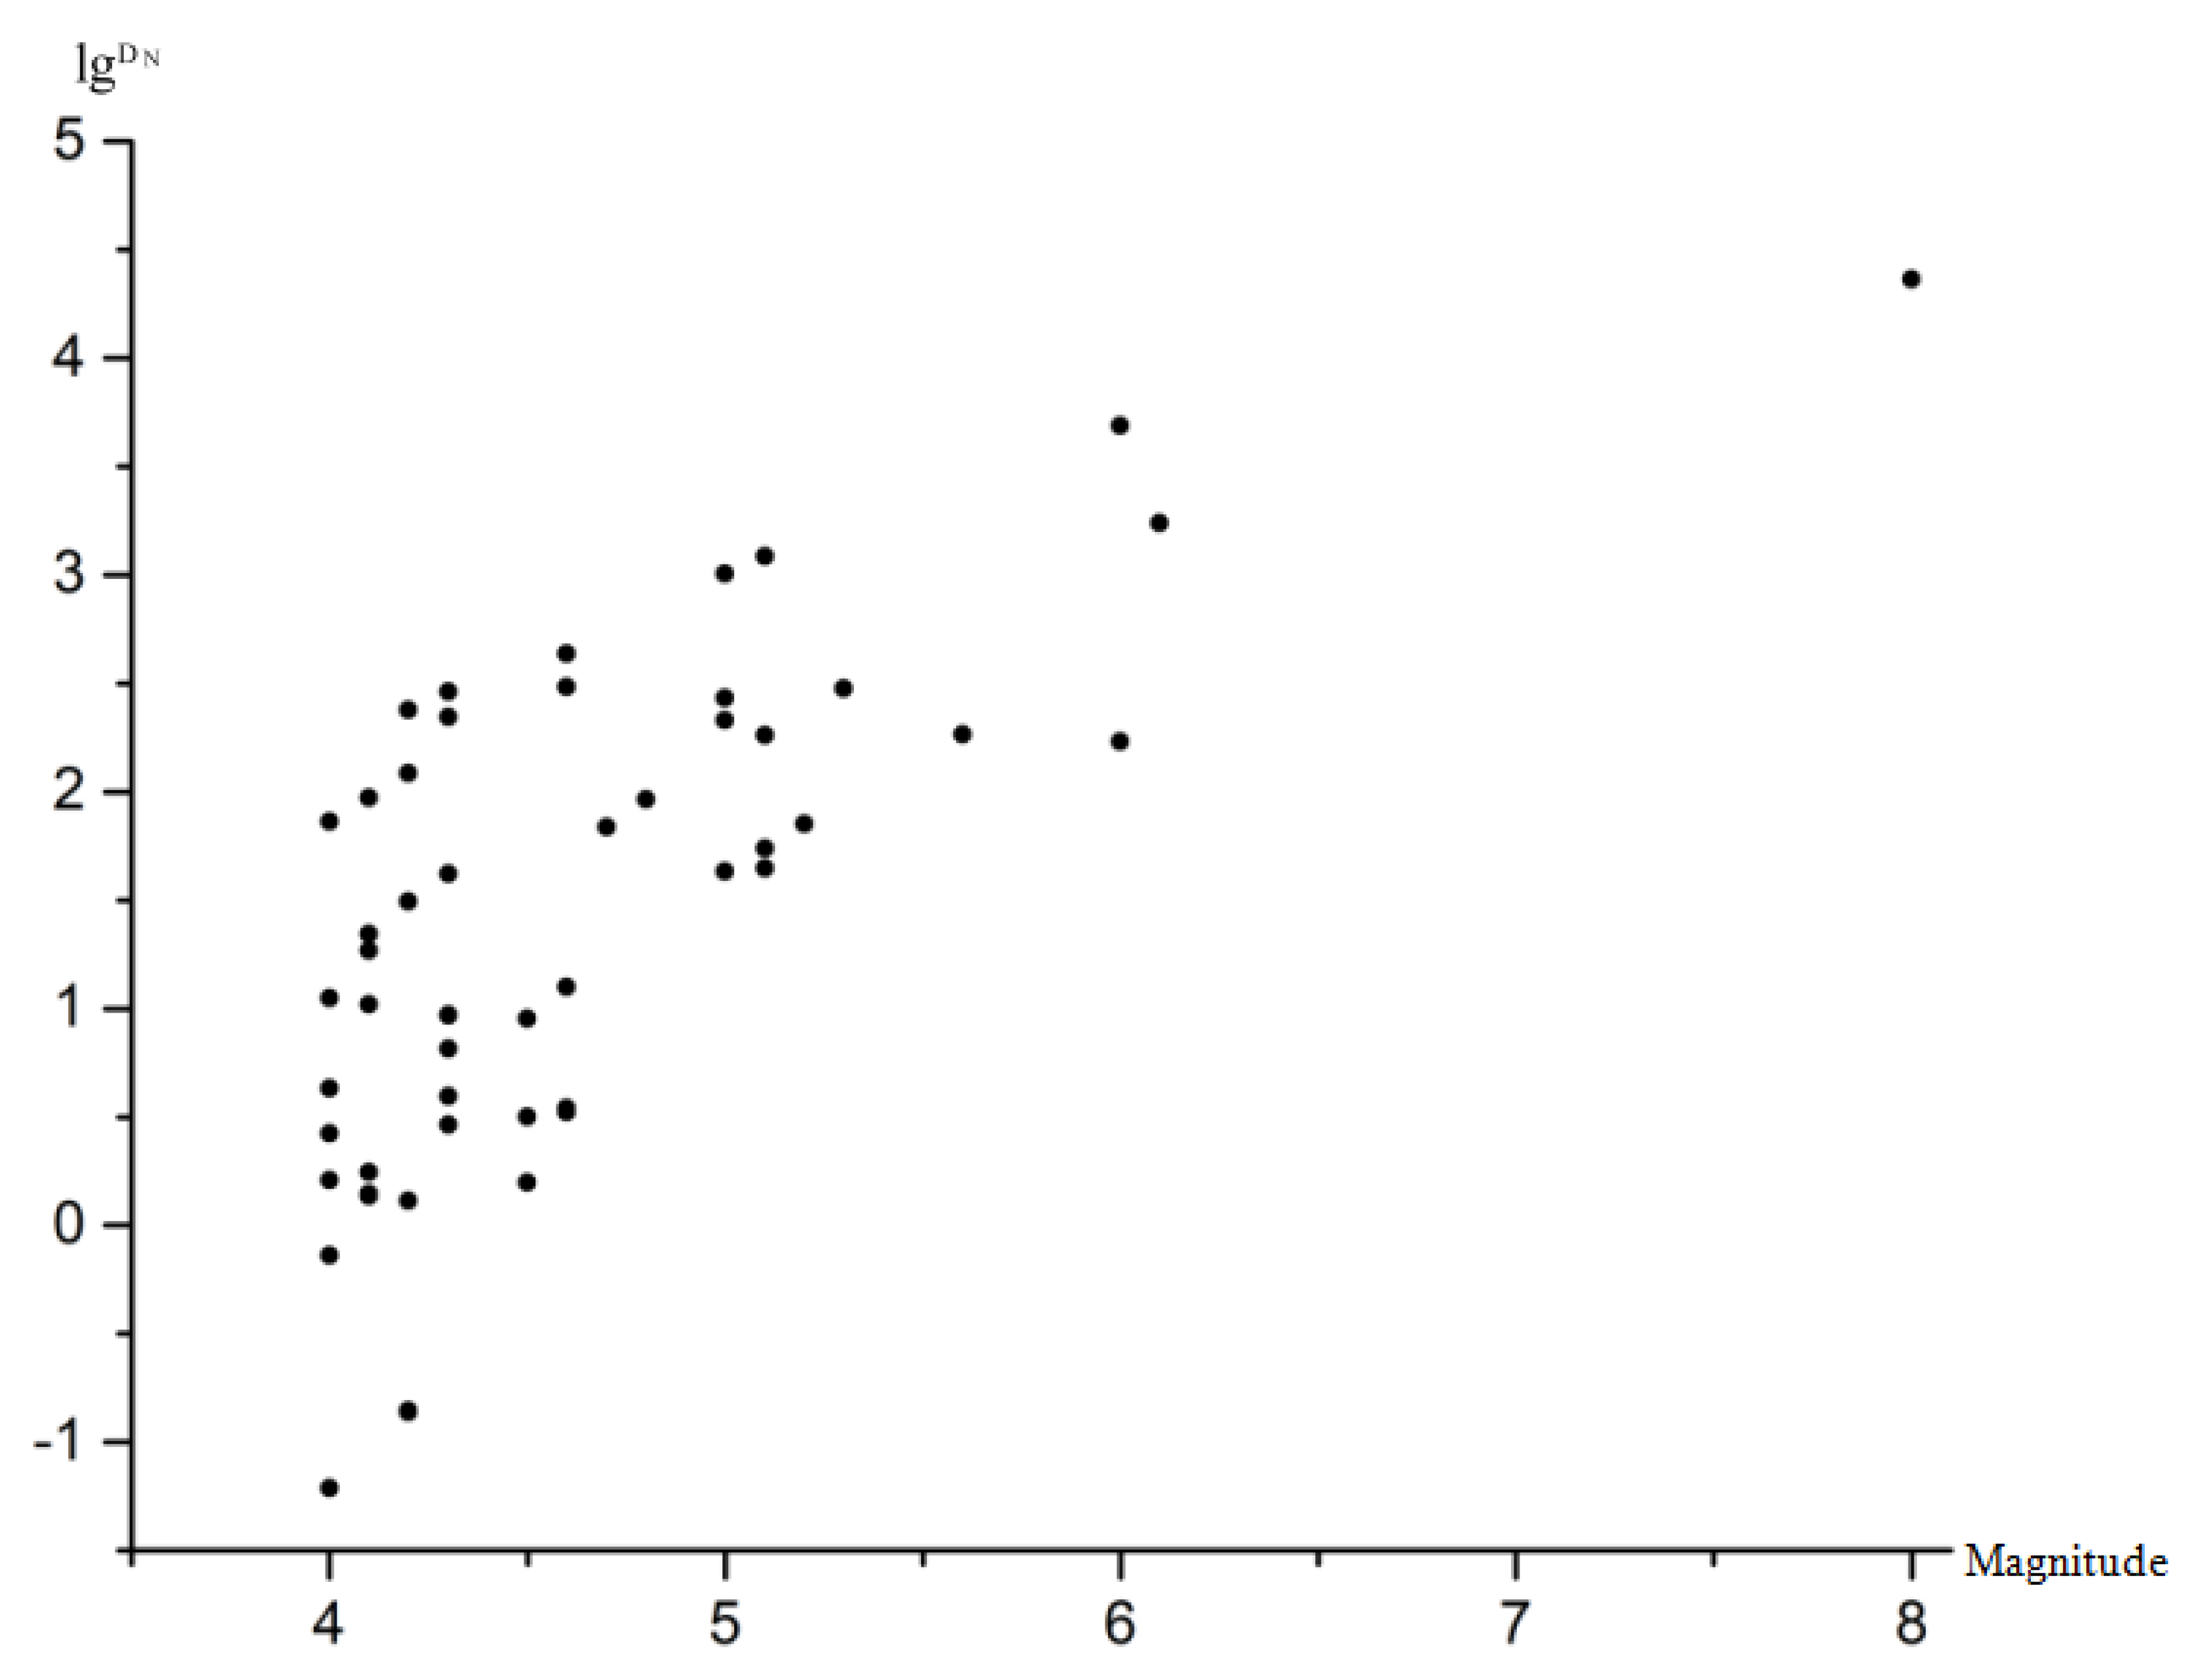
4.1. The Influence of Strong Earthquakes on Landslide Instability

Data on earthquakes with magnitudes greater than 4 in Wenchuan County from 2008 to 2010 were obtained from the National Seismological Science Data Center [43]. On this basis, the relationship between the sensible radius R and the magnitude M can be determined [44]. In particular, the sensible radius R of the earthquake and the distance D between the place where the geohazard chain occurred in the study area and the epicenter were obtained. In the event that R − D ≥ 0, the earthquake event was selected as an earthquake having an influence on geological disasters in the area; on the other hand, if R − D < 0, the effect of earthquake was not considered. Through this model, seismic events affecting the study area were screened, as follows:
R = 10 2.083 + 0.974 M ( M < 5 )
R = 10 0.611 + 0.289 M ( M 5 )
From 2008 to 2010, there were 140 earthquakes in Wenchuan County, including 56 earthquakes of magnitude 4 or above that affected the study area (Figure 1b), Appendix B. In order to discuss the impact of earthquakes on landslide stability, we calculated the accumulative displacement of the slope under the action of earthquakes by obtaining the critical acceleration of the slope and the peak acceleration of ground motion (PGA) in the study area [45]. By comparing the accumulative displacement of the slope with the critical displacement, the stability of the slope under an earthquake can be judged.
By analyzing the relationship between the Wenchuan earthquake (PGA) and the landslides, Wang Xiuying [46,47,48] has found that there was a threshold of 0.2 g peak acceleration in the earthquake area of Longmen Mountain. Therefore, the peak acceleration of 0.2 g was selected as the critical acceleration of the slope in the study area. At the same time, due to a lack of acceleration records for the study area, the PGA was determined using an empirical attenuation relationship for ground motion [49]. The attenuation relation of peak seismic acceleration on the long axis is as follows:
lg a l max = 0.617 + 1.163 M 0.046 M 2 2.207 lg [ D + 1.694 e ( 0.446 M ) ]     σ = 0.232
while the attenuation relationship for the short axis is:
lg a w max = 0.644 + 1.080 M 0.043 M 2 1.626 lg [ D + 0.255 e ( 0.570 M ) ]     σ = 0.232
However, there is some uncertainty regarding the direction of the seismogenic fault and the direction of the long and short axes of the isoseismal line in earthquakes on the Chinese mainland. Therefore, we ignored the relationship between the long and short axes of the isoseismal line and the azimuth of the earthquake-affected points, calculated the peak acceleration of the earthquake on the long and short axes, respectively, and took the geometric average of these values as the reference value for the peak acceleration at the earthquake-affected points:
a max = a l   max × a w   max
σ = a l   max e × a w   max e
On this basis, the earthquake landslide displacement formula established by Xu Guangxing [50] was used to calculate the slope sliding under earthquake action:
lg D N = 0.194 + lg [ ( 1 a c a max ) 2.262 ( a c a max ) 1.754 ] ± 0.371
In Equations (1)–(7), D is the distance from the epicenter; M is the magnitude; R is the sensible radius; a l   m a x  is the seismic peak acceleration on the long axis; a w   m a x is the seismic peak acceleration on the short axis; a c  is the critical acceleration; a max is the seismic peak acceleration; and D N denotes accumulative sliding.
According to the calculation, the Wenchuan 8.0 Ms earthquake had the greatest impact on the study area, with accumulative sliding of 230.51 m, which is consistent with existing investigation results [51]. The slope in the Longmen Mountain seismic area of the Wenchuan earthquake was broken and the geological environment was fragile. The critical sliding standard is 2 cm [52,53]. Comparing the accumulative sliding under strong earthquakes with critical sliding, Figure 5, it has been found that when the accumulative sliding is much greater than the critical sliding, the slope will become permanently damaged, leading to the occurrence of a landslide [54]. As such, strong earthquakes are primary causes leading to landslides.

4.2. Landslides Provides Source Materials for Debris Flows

According to the investigation, there were no debris flow disasters prior to the Wenchuan earthquake and its associated unfavorable geological phenomena (e.g., collapses and landslides) in the basin. Only a small amount of loose deposits had accumulated in the channel. The total amount of loose deposits was approximately 93.97 × 10⁴ m3, and the strength of the deposits was high. In the event of the earthquake, the Longmen Mountain fault zone served as the natural boundary that separated the upper and lower walls of the fault into different stratigraphic units. As a result of the Wenchuan earthquake on 12 May and its aftershocks, the upper wall was squeezed and lifted strongly, resulting in three landslides, two debris flow accumulations, and thirteen collapses, as well as nine new slope source points. It was found that the new material sources resulting from the earthquake came primarily from landslide accumulation sources and landslide residual accumulation sources (Figure 6), Table 1. The H01 residual accumulation (Figure 6a) and landslide accumulation (Figure 6b) were mainly composed of rubble, accounting for 60–65%, with average grain size of 5–100 cm and maximum of 1–2 m. The residual accumulation of the H02 landslide (Figure 6c) and debris flow accumulation (Figure 6d,e) was mainly composed of gravel and soil. The gravel content was about 50–65%. The particle size of the gravel was generally 2–50 cm; however, some were larger than 1 m. The debris flow accumulation of landslide H03 (Figure 6f) was composed of block stone and sand, and the material composition was granodiorite. The block sizes were generally uniform, with diameters of 10–30 cm. The total amount of newly-discovered sources was approximately 695.22 × 10⁴ m3, accounting for 88.10% of the total sources. Some of these newly added solid material sources entered the channel and were converted into loose deposits, aggravating channel blockage. When the hydrodynamic conditions are sufficient, the debris flow susceptibility increases.

4.3. Rainfall-Induced Debris Flows

In order to discuss the impact of rainfall on the material sources accumulated in the gully after landslide sliding, we used the critical rainfall threshold model for debris flow startup in a gully after an earthquake, as proposed by He Siming [8], to calculate the critical rainfall required to transform material sources into debris flow in the study area. Furthermore, we used the model proposed by Yao Lingkan [55], derived from the frequencies of debris flows and rainstorms.
Through calculation (see Appendix A for details), it was found that the critical rainfall of gully debris flow after the earthquake was 54.67 mm/d. It can be seen from Figure 7 that the range of the critical rainfall value for 1 h was 6.64–10.31 mm ( R E = 25   mm ) and 0–3 mm ( R E = 50   mm ). The 10 min critical rainfall values ranged from 2.49–4.02 mm ( R E = 25   mm ) to 0–1.53 mm ( R E = 50   mm ). The rainfall in Niumian Gully started at 4:10 a.m. on 21 September 2008, reaching 28.80 mm at 8 a.m., and a total of 53.30 mm fell from 8 a.m. on 25 September to 8 a.m. on 26 September. The maximum 1 h rainfall was 15 mm, which did not reach the critical level for rainfall for the start-up of debris flow in the valley after the earthquake, but exceeded the required rainfall when calculated by the frequency method—mainly due to the long and heavy rainfall in the early stage—which caused the loose deposits in the basin to become saturated or near-saturated. With the continuous rainfall, it is easier to form surface runoff. Under the scouring of surface runoff, loose solid materials started to form a debris flow. On 12 August 2010, the upper reaches of the Minjiang River experienced heavy rainfall. Between 13 August 2010 and 14 August 2010, the maximum 1 h rainfall in the study area was 32.20 mm and the accumulated 24 h rainfall was 118.80 mm. On the 14th, the maximum rainfall over 1 h was 22.10 mm, and the accumulated rainfall over 24 h was 81.00 mm, exceeding the critical rainfall in the study area. Under the action of the rainfall, the loose deposits started to form a debris flow. it was found that both methods are suitable for calculating the critical rainfall in the study area. However, when applying the critical rainfall model, which is derived from the frequency of debris flow and the frequency of rainstorms, to the critical rainfall analysis of a single gully in the area, there may be some errors involved in determining the critical rainfall threshold, as differences in topography, material source conditions, and geological conditions in the basin are not considered. The threshold model formula of critical rainfall for the start-up of debris flow in valleys after the earthquake only determines one variable in the derivation process, while the actual start-up of debris flow is the result of the coupling of many factors. Thus, there will be some errors in the calculation of the critical rainfall when using the model formula. Therefore, the use of a combination of the two calculation results not only can make up for the shortcomings of the two methods but can also make the critical rainfall value more consistent with the actual situation.

5. Results and Discussion

(1)
Formation mechanism of landslide–debris-flow geohazard chain
Niumian Gully is located on the central fault zone of Longmen Mountain. In the event of a strong earthquake, the central fault zone of Longmen Mountain serves as a natural boundary, dividing the study area into upper and lower walls. The hanging wall is squeezed, and the potential energy increases, providing sufficient potential energy conditions for landslide instability and sliding. As a result of a strong earthquake, the accumulated sliding amount in the study area reached 230.51 m, far greater than the critical sliding amount. The slope was permanently damaged, forming a landslide. After the landslide started, it accelerated downward along the lower slope. The sliding friction or rolling friction between the rock masses during the sliding process of the landslide reduces the friction resistance between the landslide mass and the ground, such that the landslide mass maintains high-speed movement when reaching the trench bottom. The high-speed sliding slope body rushes into the channel and collides with the opposite bank slope body. Consequently, the landslide disintegrates and forms a debris flow. There is then a large accumulation of loose solid materials in the channel as a result of debris flowing upstream, diffusing and blocking the channel by forming a barrier dam.
If the rainfall exceeds 10.31 mm/h or 54.67 mm/d, the water collected in the basin can erode the loose deposits in the gully. If the driving force exceeds the resistance of the deposits, the loose deposits will start to form a debris flow. When a debris flow moves above the dammed lake, due to the obstruction and energy dissipation of the dammed lake, a large number of debris flow solid sources are deposited in the dammed lake. As fluid passes through the dammed dam, the gravity is significantly reduced, the scouring capacity is strengthened, and the fluid rushes out of the groove at the front edge of the dammed body of water. The water in the dammed lake is discharged, and during the discharge process, the loose deposits of the debris flow in the lower channel are significantly exposed and washed, and some debris flow deposits are then washed out of the channel, resulting in a larger-scale debris flow. Meanwhile, the front edge of the loose deposits collapses near the trench due to the erosion and undercutting of the debris flow, again forming a barrier dam. This process starts with the landslide moving down to form a barrier dam in the trench and, eventually, either the loose deposits on both sides of the trench are exhausted, or the bank slope becomes less steep, such that the loose deposits do not slide down any further (Figure 8).
(2)
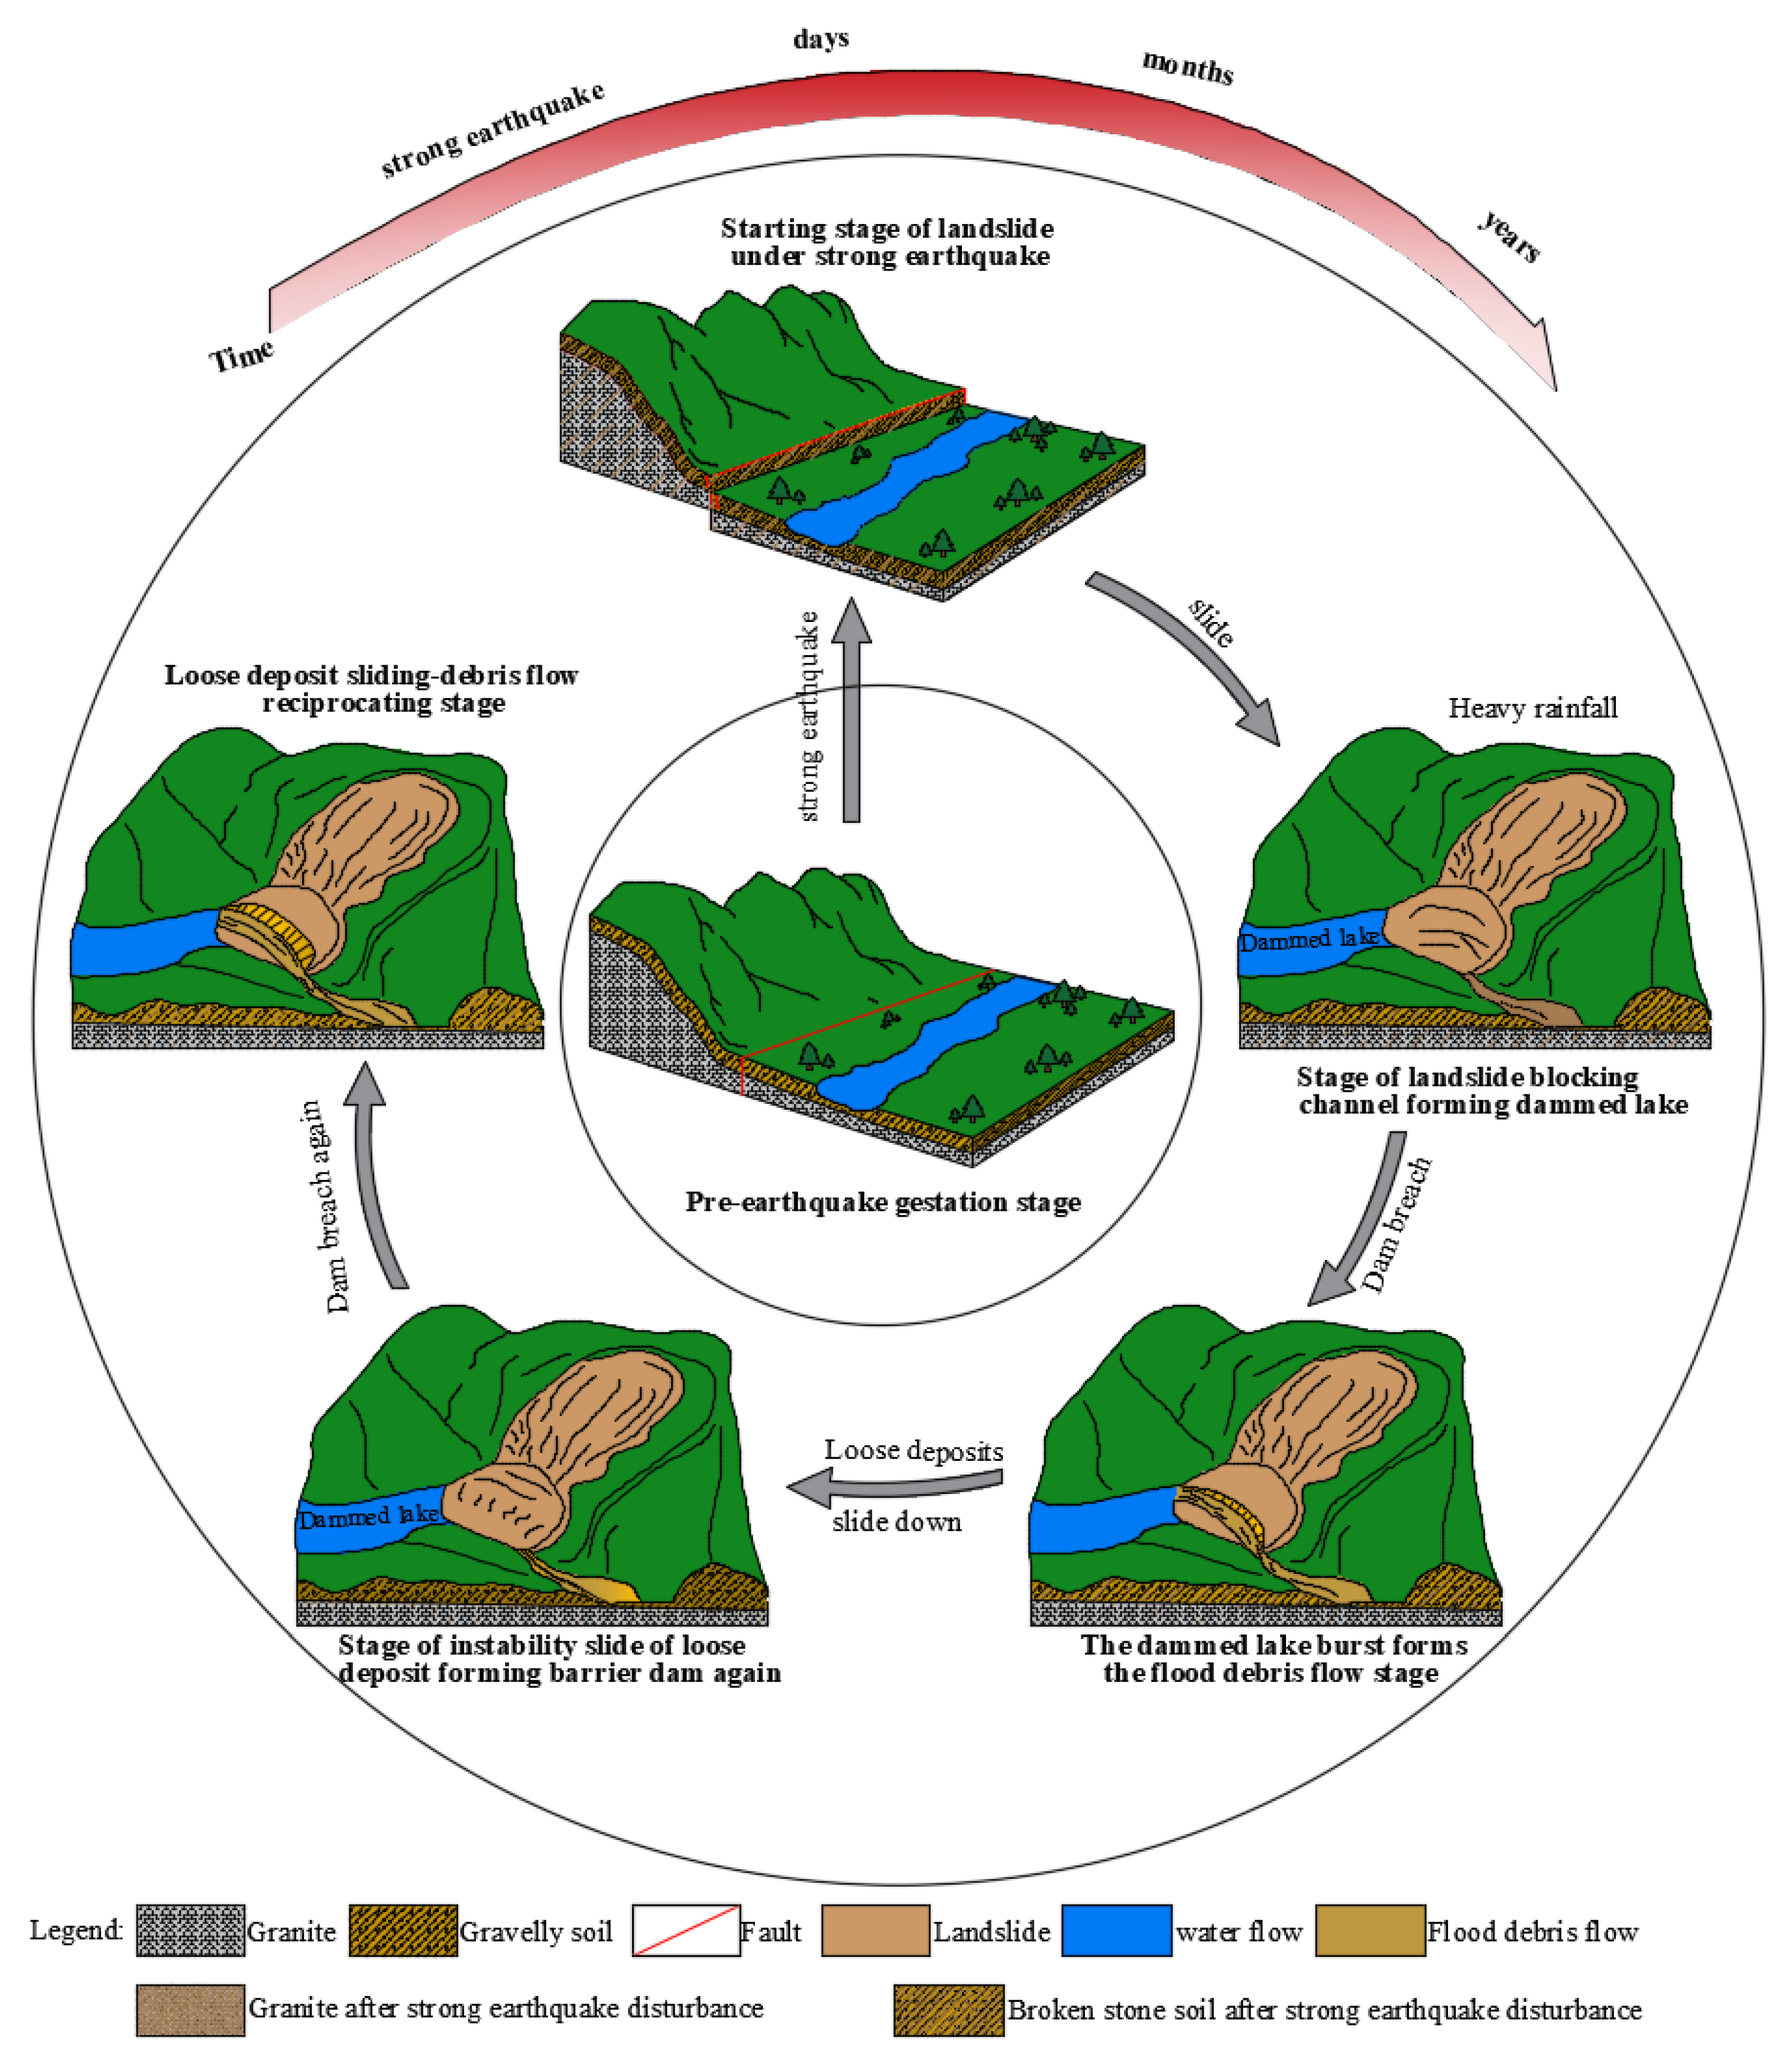
Evolution process of the landslide–debris-flow geohazard chain
According to the earthquake–landslide evolution mechanism and the development history of debris flows in the study area, the formation and development of the landslide–debris-flow geohazard chain in the study area can roughly be divided into the six following stages (Figure 9).
(1)
Pre-earthquake gestation: The Longmen Mountain fault zone had historically never recorded an earthquake with magnitude greater than 7. There had been a relatively long period of safety in this area before the “5.12” earthquake, and some energy had accumulated near the fault zone [56].
(2)
Starting of a landslide under strong earthquake: The landslide area is located in the hanging wall of the Longmen Mountain fault zone. In the event of a strong earthquake, the hanging wall is squeezed and lifted strongly, the potential energy increases, and the slope begins to slide easily. When a strong earthquake occurred, the accumulated sliding in the study area reached 230.51 m, far exceeding the critical sliding in the Longmen Mountain earthquake area. The slope in the study area could not be restored to its original state when the strong earthquake stopped, and the slope lost stability and formed a landslide.
(3)
Landslide blocking the channel and forming a dammed lake: As a result of the strong earthquake, the landslide accelerated downward after starting into motion, and maintained a high-speed sliding state before reaching the bottom of the gully. It collided with the slope on the other bank when it reached the bottom of the gully, resulting in the disintegration of the sliding body and the formation of a debris flow. With the increase in water level at the upstream end of the dam, a dammed lake was formed, as the debris flow blocked the channel, forming a temporary barrier dam.
(4)
Bursting of the dammed lake to form the flood debris flow: After the dammed lake was formed, due to its obstruction and energy dissipation, a large number of debris flow solid sources were deposited in the dammed lake. The gravity of the fluid passing through the dammed dam was severely reduced and the fluid rushed out of the groove at the front edge of the dammed body. As a result of the discharge of water, loose deposits were then washed downstream to form a larger-scale debris flow.
(5)
Unstable sliding of loose deposits: When the debris flow moved downstream, the front edge of loose deposit body was cut and eroded to form a narrow deep groove, and the front edge of landslide accumulation developed near the empty surface. As a result of erosion and undercutting caused by water flow or debris flow, the front edge of the landslide mass near the trench side further collapsed and formed a barrier dam once again.
(6)
Loose deposit sliding–debris flow reciprocating stage: The front edge of the loose deposits slid down, forming a dam to induce a new flood-burst debris-flow. With the decrease in the material source of the gully bank slope, the solid material source of the debris flow silted up, the bank slope gradient gradually decreased, and the development of the debris flow gradually declined until it stopped.
In summary, strong earthquakes cause landslides in the basin to slide down and form debris flows in the process of movement. The debris flow blocks the channel to form a dammed lake and, when the dammed lake breaks, a flood-burst debris-flow disaster occurs. Then, under the influence of erosion and undercutting caused by water or debris flow, the front edge of the loose deposits collapses and deposits accumulate in the channel to produce a new barrier and dam, and the flood-burst debris-flow phenomenon occurs again under the scouring of the upstream water flow. When the loose deposits on both sides of the channel are exhausted or the slope of the bank becomes less steep, the loose deposits no longer slide down, and become a stable debris flow in the gully.

6. Conclusions

(1)
The Niumian Gully landslide–debris-flow geohazard chain was formed by strong earthquakes and rainfalls. As a result of the earthquakes, rock mass breakages, collapses, and landslides were triggered in the earthquake research area, providing abundant material sources for debris flows. The earthquakes also resulted in a significant reduction in the critical level of rainfall required for debris flow initiation in the research area. In the event of heavy rainfall, loose deposits are easily triggered, leading to catastrophic debris flows.
(2)
In Wenchuan County, 145 earthquakes have been recorded, of which the Wenchuan Ms 8.0 earthquake had the greatest impact on the study area. Due to the earthquake, the accumulative sliding of the slope reached 230.51 m—far exceeding the critical sliding—and the slope was permanently damaged, resulting in a landslide.
(3)
Before the Wenchuan earthquake in 2008, Niumian Gully was a clear water gully. Unfavorable geological phenomena such as collapse and landslides in the basin were not obvious, and only a small volume of loose deposits was observed in the gully, with a total amount of approximately 93.97 × 10⁴ m3. After the earthquake, Niumian Gully was transformed into a high-frequency debris-flow gully. Adverse geological disasters such as collapses and landslides in the study area affected by the earthquake subsequently strongly developed, with the material source amount caused by collapse and landslide having been estimated as approximately 695.22 × 10⁴ m3, providing abundant loose solid materials for the occurrence of debris flows.
(4)
The characteristics of the Niumian Gully landslide–debris-flow geohazard chain are landslide instability–debris-flow, flood-burst debris-flow, and reciprocating debris flow models. Moreover, the Niumian Gully landslide–debris-flow geohazard chain development process can be summarized in the following stages: pre-earthquake gestation, starting of landslide under strong earthquake, landslide blocking channel and forming a dammed lake, burst dammed lake forming the flood-burst debris-flow, unstable sliding of loose deposits, and reciprocating loose deposit sliding–debris-flows. It is expected that the evolution of the geohazard chain will continue until the loose deposits on both banks are exhausted or the slope of the bank becomes less steep, at which point the loose deposits will no longer slide.

Author Contributions

Conceptualization, N.H. and X.Q.; methodology, Z.Y.; software, L.X.; validation, N.H. and F.G.; formal analysis, N.H.; investigation, F.G.; resources, Z.Y.; data curation, L.X.; writing—original draft preparation, N.H.; writing—review and editing, F.G.; visualization, Z.Y.; supervision, X.Q. All authors have read and agreed to the published version of the manuscript.

Funding

The authors would like to acknowledge the financial support from the Muhammad Asif Khan academician workstation of Yunnan Province (Grant No. 202105AF150076), the Key R&D Program of Yunnan Province (Grant No. 202003AC100002), and the General Program of basic research plan of Yunnan Province (Grant No. 202001AT070043), the Excellent Youth Foundation of Henan Scientific Committee (222300420013), and the Excellent Young Talents Project of Yellow River Conservancy Commission (HQK-202309).

Institutional Review Board Statement

Not applicable.

Informed Consent Statement

Not applicable.

Data Availability Statement

Not applicable.

Conflicts of Interest

The authors declare no conflict of interest.

Appendix A. Rainfall-Induced Debris Flows

(1)
The critical rainfall model of gully-debris-flow-after-earthquake calculation formula is as follows:
This model uses infinite slope theory to study the balanced relationship between resistance and the driving force of loose solid materials, and establishes the starting model of loose solid materials. According to Darcy’s Law, under a certain rainfall intensity, the subsurface water thickness of the loose accumulation body can be written as:
h = I A T b sin θ D
Then, the resistance expression of the loose solid materials is:
T f = c + tan ϕ × ( ρ s g D cos θ ρ w g h cos θ ρ s a D sin θ )
The driving force is expressed as:
T s = ρ s g D sin θ + ρ s a D cos θ
Based on the limit equilibrium principle, the safety factor can be defined by the ratio between resistance and driving force:
K = T f T s = c ρ s g D sin θ + ρ s a D cos θ + [ ( ρ s g D ρ w g h ) cos θ ρ s s D sin θ ] tan ϕ ρ s g D sin θ + ρ s a D cos θ
For debris flow caused by rainfall after an earthquake, the formula can be simplified as:
K = c + ρ s g D cos θ tan ϕ ρ s g D sin θ I A tan ϕ ρ w g cot θ tan ϕ T b ρ s ( g sin θ + a cos θ )
When k = 1 , the formula of critical rainfall can be written as:
I c r = T ( b A ) sin θ ( ρ s ρ w ) [ ( 1 tan θ tan ϕ ) + c ρ w g D cos θ tan ϕ ]
where I c r denotes the critical rainfall; I is rainfall intensity in the basin; h is the thickness of the underground water layer; a is the horizontal earthquake acceleration; T is the hydraulic conductivity coefficient; A is the catchment area; ρ s is the water density; ρ w is the sediment density; c denotes cohesion; ϕ is the internal friction angle; b is the trench width; θ indicates the slope angle; g is the acceleration due to gravity; and D is the thickness of loose deposits. The channel parameters are detailed in Table A1.
Table A1. Parameters for the study area.
ParameterValue
Catchment area A (km2)10.7
Width of channel b (m)91.5
Slope angle θ (°)25
Sediment density ρ s (kg/m2)2050
Water density ρ w (kg/m2)1000
Thickness of loose deposits D (m)9
Internal friction angle ϕ (°) 28
Cohesion c (kPa)14
Hydraulic conductivity coefficient T (m2/d)60
(2)
Critical rainfall model derived from frequency of debris flows and rainstorms
The calculation is as follows:
K = 0.1 x 1 + 0.073 x 2 + 0.6
where k is the critical rainfall index of debris flow; and x 1 is the frequency of debris flow (values are shown in Table A2; and x 2 is the frequency of rainstorms with annual daily rainfall greater than 50 mm (regional rainstorm frequency)).
Table A2. Scoring of debris flow frequency types.
Frequency TypeStandard of ClassificationScoring Standard
Extremely high frequencyA few to a dozen times a year6
High frequencyOnce or twice to several times a year5
Sub-high frequencyOnce every few years to once or twice a year4
Intermediate frequencyEvery ten years to every few years3
Low frequencyEvery few decades to every ten years2
Extra low frequencyOnce a hundred years to once every few decades1
The formulas for calculating critical rainfall over 1 h and 10 min are provided in Table A3.
Table A3. Formula of critical rainfall for 1 h and 10 min.
Rainfall R E   =   25   mm R E   =   50   mm
1 hLower limit value
/(mm/h)
I 1 hmin = { 1 K 0 . 04 14.8 K 2 + 74.3 K 1 . 4 K > 0.04 I 1 hmin = { 0 K 0 . 15 11.5 K 2 + 76.6 K 11 K > 0.15
Upper limit value
/(mm/h)
I 1 hmax = { 4 K 0 . 04 10.8 K 2 + 83.8 K + 1 . 3 K > 0.04 I 1 hmax = { 8 K 0 . 15 14.2 K 2 + 80.5 K 7 . 3 K > 0.15
10 minLower limit value
/(mm/10min)
I 10 min = I 1 h min H ¯ 1 / 6 H ¯ 1 I 10 min = I 1 h min H 1 / 6 H 1
Upper limit value
/(mm/10min)
I 10 max = I 10 min + 5 K + 1 I 10 max = I 10 min + 5 K + 1
In the formulas given in Table A3, R E denotes the total effective rainfall; I 10 min is the 10 min critical rainfall; I 1 h is the 1 h critical rainfall; H ω 1 / 6 is the mean annual maximum 10 min rainstorm; and H ω 1 is the mean annual maximum rainstorm value. H ω 1 / 6 and H ω 1 were obtained according to the Storm Flood Manual for Small and Medium Basins in Sichuan Province. Based on relevant data, it was determined that the activity history of debris flow was once or twice to several times a year, such that the value of x 1 was 5. According to relevant data, the average number of occurrences of daily rainfall greater than or equal to 50 mm per year in Wenchuan County from 1991 to 2005 was 31, leading to an x 2 value of 0.085. In addition, referring to the Rainstorm Manual of Sichuan Province, H ω 1 = 20   mm and H ω 1 / 6 = 7.5   mm . The calculation results based on the frequency method are given in Table A4.
Table A4. Critical rainfall range for the study area.
x 1 x 2 K H ω 1 / 6 H ω 1 Rainfall R E   =   25   mm R E   =   50   mm
50.0850.1067.5201 h rainfall
(mm/h)
I60min = 6.64I60min = 0
I60max = 10.31I60max = 3
10 min rainfall
(mm/h)
I10min = 2.49I10min = 0
I10max = 4.02I10max = 1.53
Taking the points (25, 6.64) and (50, 0), and the points (25, 10.31) and (50, 3) as the upper and lower limit straight lines intersecting the coordinate axis, respectively, we drew the 1 h critical rainfall map, as shown in Figure 7a. We also took the points (25, 2.49) and (50, 0), and points (25, 4.02) and (50, 1.53) as the upper and lower limit straight lines intersecting the coordinate axis, in order to draw the 10 min critical rainfall map, as shown in Figure 7b. The four extreme points of critical rainfall in Figure 7a constitute the range of 1 h critical rainfall, while the four extreme points of critical rainfall in Figure 7b constitute the range of 10 min critical rainfall.

Appendix B

Table A5. From 2008 to 2010, the Earthquakes of Magnitude 4 or above That Had Influence on the Study Area.
Earthquake Magnitude(Ms)LongitudeLatitudeThe Distance to the Epicenter (km)Earthquake Peak Acceleration (gal)
431.2103.137.12.452384928
431.3103.429.43.55899096
431.27103.3925.874.341358061
430.86103.3123.525.018298566
430.86103.3721.175.871243119
430.9103.416.48.464044712
431.1103.48.2919.9891648
4.131.27103.629.534.142657647
4.131.3103.429.44.171247106
4.130.9103.228.234.442706854
4.131.2103.518.638.23180998
4.131.1103.315.6810.45442023
4.131103.314.7811.31937306
4.131.1103.58.3522.74244336
4.231.34103.1642.822.676954895
4.231.4103.642.772.682091032
4.231.3103.632.914.088871065
4.231103.314.6313.26530827
4.231.1103.58.3526.00558706
4.231.1103.58.3526.00558706
4.231103.45.9136.88251656
4.331.28103.6131.265.171513335
4.331.3103.529.335.704729417
4.330.95103.1925.996.849502941
4.331103.223.717.846395917
4.331103.223.677.86582914
4.331103.314.6815.2235601
4.331103.57.0235.42610896
4.331103.46.0440.91080745
4.531.4103.342.594.303732606
4.531.3103.237.355.302067856
4.531.3103.237.355.302067856
4.531.3103.429.247.724696882
4.631.4103.540.575.401854879
4.631.4103.540.245.472018972
4.631.3103.429.388.867659771
4.631.1103.58.5442.14306413
4.631103.57.0250.94548044
4.731.2103.518.5319.43877454
4.831.2103.418.322.5351409
531.3103.529.3815.412298
531.3103.429.3815.412298
530.9103.415.7534.87637656
531103.314.1539.51027124
531103.56.8181.17318134
5.131.3103.331.8215.68648968
5.131.3103.529.6517.34636402
5.131.2103.518.6632.0587289
5.131103.56.8189.85627985
5.231.3103.529.6519.72306798
5.331.2103.418.2741.65571443
5.631.3103.429.4932.25102228
631.4103.642.3730.98509765
631103.56.81194.8098796
6.130.9103.415.75109.4868574
831103.46.04469.1166735

References

  1. Chai, H.J.; Liu, H.C.; Zhang, Z.Y. The catalog of Chinese landslide dam events. J. Geol. Hazards Environ. Preserv. 1995, 6, 1–9. [Google Scholar]
  2. Yin, G.H.; Li, J.; Zhang, Y.; Yang, Z. Statistical analysis and research of landslides caused by Nileke. Inland Earthq. 2001, 15, 56–63. [Google Scholar]
  3. Wang, J.; Bai, M.; Xiao, S. A study on compound mechanism of earthquake-related sliding displacements on gently inclined loess slope. Chin. J. Geotech. Eng. 2001, 23, 445–449. [Google Scholar]
  4. He, N.; Fu, Q.X.; Zhong, W.; Yang, Z.Q.; Cai, X.Q.; Xu, L.J. Analysis of the formation mechanism of debris flows after earthquakes—A case study of the Legugou debris flow. Front. Ecol. Evol. 2022, 10, 1053687. [Google Scholar] [CrossRef]
  5. Li, Z.S. The state of the art of the research on seismic landslide hazard at home and abroad. J. Catastrophology 2003, 18, 64–70. [Google Scholar]
  6. Sun, C. Developing and distributing characteristics of collapses and landslides during strong historic earthquake in China. J. Nat. Disasters 1997, 6, 25–30. [Google Scholar]
  7. Cui, P.; Zhuang, J.Q.; Chen, X.C.; Zhang, J.Q.; Zhou, X.J. The characteristics of debris flow activities after the Wenchuan earthquake and the countermeasures. J. Sichuan Univ. Eng. Sci. Ed. 2010, 42, 10–19. [Google Scholar]
  8. Liang, Y.F.; Pei, X.J.; Cui, S.H.; Zhu, L.; Gao, H.H.; Dong, Y. Study on the chain effect of geological hazards in Huangdongzigou induced by Wenchuan earthquake and the measures to break the chain. Disaster Sci. 2018, 33, 9. [Google Scholar]
  9. Yang, X.Y. Study on the development background of geological hazards in Ludian. Yunnan People’s Yangtze River 2018, 49, 57–61. [Google Scholar]
  10. Wang, T.; Wang, J.K.; Pan, D. The formation mechanism of Kangjiapo landslide in Hanyuan, Sichuan, and the analysis of landslide dam debris flow disaster chain. Chin. J. Geol. Hazards Prev. 2020, 31, 1–7. [Google Scholar]
  11. Zhong, Y.; Bian, S.Q.; Yang, Y.P.; Jin, J.C.; Huang, F.C.; Chen, G. Disaster model and risk assessment of landslide debris flow disaster chain in mountain and gorge area—Taking Zhouqu Lijiajie as an example. J. Lanzhou Univ. Nat. Sci. Ed. 2022, 58, 372–384. [Google Scholar]
  12. He, S.; Li, D.; Luo, W.Y. Study on the rainfall and aftershock threshold for debris flow of post-earthquake. J. Mt. Sci. 2011, 8, 750–756. [Google Scholar] [CrossRef]
  13. Shou, K.J.; Hong, C.Y.; Wu, C.C. Spatial and temporal analysis of landslides in Central Taiwan after 1999 Chi-Chi earthquake. Eng. Geol. 2011, 123, 122–128. [Google Scholar] [CrossRef]
  14. Lin, C.W.; Liu, S.H.; Lee, S.Y. Impacts of the Chi-Chi earthquake on subsequent rainfall-induced landslides in central Taiwan. Eng. Geol. 2006, 86, 87–101. [Google Scholar] [CrossRef]
  15. Guo, X.; Cui, P.; Li, Y. Intensity–duration threshold of rainfall-triggered debris flows in the Wenchuan earthquake affected area, China. Geomorphology 2016, 253, 208–216. [Google Scholar] [CrossRef]
  16. Qiao, J.P.; Huang, D.; Yang, Z.J.; Meng, H.J. Discussion on macro epicenter of Wenchuan Earthquake Disaster. Science 2013, 28, 1–5. [Google Scholar]
  17. Li, N.; Tang, C.; Bu, X.H.; Li, H.B. Analysis on the characteristics and evolution of debris flow in Wenchuan County after the “5.12” earthquake. J. Eng. Geol. 2020, 28, 1233–1245. [Google Scholar]
  18. Yu, B.; Xie, H.; Wang, S.G.; Zhang, S.C.; Lu, K.; Han, L. The active trend of debris flow gully in Wenchuan County after the “5.12” Wenchuan earthquake. J. Nat. Disasters 2011, 20, 68–73. [Google Scholar]
  19. Tang, C.; Chang, M. Catastrophic debris flows on 13 August 2010 in the Qingping area, southwestern China: The combined effects of a strong earthquake and subsequent rainstorms. Geomorphology 2012, 139, 559–576. [Google Scholar] [CrossRef]
  20. Gao, H.H.; Pei, X.J.; Cui, S.H.; Zhu, L.; Liang, Y.F. Statistical analysis on the development, distribution and evolution characteristics of geological disasters after the Wenchuan earthquake. J. Yangtze River Acad. Sci. 2019, 36, 73. [Google Scholar]
  21. Lan, J.; Chen, X.L. Evolution characteristics of landslide disaster induced by 2008 Ms8.0 Wenchuan earthquake in Yingxiu area. Seismogeology 2020, 42, 125–146. [Google Scholar]
  22. Huang, R.Q. Post effect analysis of Wenchuan earthquake geological disasters. J. Eng. Geol. 2011, 19, 145–151. [Google Scholar]
  23. Cui, S.H.; Pei, X.J.; Wang, G.H. Based on the ring shear test, explored the initiation mechanism of large-scale landslides in the Wenchuan earthquake. J. Geotech. Eng. 2017, 39, 2268–2277. [Google Scholar]
  24. Yang, Z.; Zhao, X.; Chen, M.; Zhang, J.; Yang, Y.; Chen, W.; Bai, X.; Wang, M.; Wu, Q. Characteristics, Dynamic Analyses and Hazard Assessment of Debris Flows in Niumiangou Valley of Wenchuan County. Appl. Sci. 2023, 13, 1161. [Google Scholar] [CrossRef]
  25. Yang, Q.; Fan, X.M.; Xu, Q.; Dai Lan, X.; Ren, J. Research on the deformation history and formation mechanism of Tangjiawan landslide in Beichuan. Hydrogeol. Eng. Geol. 2018, 45, 6–15. [Google Scholar]
  26. Tang, C.; Zhu, J.; Qi, X.; Ding, J. Landslides induced by the Wenchuan earthquake and the subsequent strong rainfall event: A case study in the Beichuan area of China. Eng. Geol. 2011, 122, 22–33. [Google Scholar] [CrossRef]
  27. Lu, Y.X.; Wei, L.; Liu, K.; Li, T.L.; Zheng, H.Z.; Wang, C.Y.; Yang, B. Study on the site effect of ground motion in the landslide concentrated area of the 1920 Haiyuan earthquake. J. Seism. Eng. 2020, 42, 1151–1158. [Google Scholar]
  28. Zhu, Y.X.; Dai, F.C.; Yao, X.; Tu, X.B.; Shi, X.S. Field investigation and numerical simulation of the seismic triggering mechanism of the Tahman landslide in eastern Pamir, Northwest China. Bull. Eng. Geol. Environ. 2019, 78, 5795–5809. [Google Scholar] [CrossRef]
  29. Ghorbanzadeh, O.; Xu, Y.; Zhao, H.; Wang, J.; Zhong, Y.; Zhao, D.; Zang, Q.; Wang, S.; Zhang, F.; Shi, Y.; et al. The Outcome of the 2022 Landslide4Sense Competition: Advanced Landslide Detection From Multisource Satellite Imagery. IEEE J. Sel. Top. Appl. Earth Obs. Remote Sens. 2022, 15, 9927–9942. [Google Scholar] [CrossRef]
  30. Fan, X.; Scaringi, G.; Korup, O. Earthquake-induced chains of geologic hazards: Patterns, mechanisms, and impacts. Rev. Geophys. 2019, 57, 421–503. [Google Scholar] [CrossRef] [Green Version]
  31. Zhou, X.; Cui, P.; Li, Z. Development and application of integrated test equipment for permeability and settlement of gravelly soil in triggering area of debris flow. Chin. J. Rock Mech. Eng. 2012, 31, 1281–1289. [Google Scholar]
  32. Qing, F.; Meng, X.M.; Guo, F.Y.; Zhao, Y. Analysis of the characteristics of the “August 7” debris flow disaster in Wenxian County, the Wenchuan earthquake disturbed area—Taking Yangtang Valley as an example. J. Lanzhou Univ. Nat. Sci. Ed. 2021, 57, 6. [Google Scholar]
  33. Tang, C.; Zhu, J.; Li, W.L.; Liang, J.T. Rainfall-triggered debris flows following the Wenchuan earthquake. Bull. Eng. Geol. Environ. 2009, 68, 187–194. [Google Scholar] [CrossRef]
  34. Huang, X.; Tang, C. Quantitative analysis of dynamic characteristics of erosion collapse debris flow in strong earthquake area. J. Eng. Geol. 2017, 25, 1491–1500. [Google Scholar]
  35. Wang, Y.S.; Zhao, B.; Li, J. Mechanism of the catastrophic June 2017 landslide at Xinmo Village, Songping River, Sichuan Province, China. Landslides 2018, 15, 333–345. [Google Scholar] [CrossRef]
  36. Huang, R.Q.; Xu, Q. Preliminary study on dynamic characteristics of large landslide disaster induced by 5.12 Wenchuan earthquake. J. Eng. Geol. 2008, 16, 721–729. [Google Scholar]
  37. Li, F.; Li, S.M.; Yang, Y.; Li, J.; Yuan, L.W.; Cheng, R.; Mao, J. Study on Development Characteristics of Shawan Dagou Landslide Debris Flow Based on Time Series In SAR. Adv. Geophys. 2023, 3, 1–11. [Google Scholar]
  38. Wang, J.; Cui, Y.; Choi, C.E. The Effect of Climate Change on Alpine Mountain Hazards Chain: A Case Study in Tianmo Ravine, Tibet, China. In Proceedings of the 8th International Congress on Environmental Geotechnics, Hangzhou, China, 28 October–1 November 2018; Volume 3, pp. 461–470. [Google Scholar]
  39. Zhuang, J.Q.; Cui, P.; Ge, Y.G. Risk Assessment of Debris Flow Gullies along Duwen Highway after—“5.12” Earthquake AU Zhuang, Jianqi. J. Sichuan Univ. Eng. Sci. Ed. 2009, 3, 131–139. [Google Scholar]
  40. Pan, J.; Li, H.; Si, J.; Pei, J.; Fu, X.; Chevalier, M.L.; Liu, D. Rupture process of the Wenchuan earthquake (Mw 7.9) from surface ruptures and fault striations characteristics. Tectonophysics 2014, 619, 13–28. [Google Scholar] [CrossRef]
  41. Li, Y.; Zhou, R.J.; Yan, L. Surface Fracture and Deformation Characteristics of Yingxiu Beichuan Fault. J. Geol. 2008, 82, 1688–1706. [Google Scholar]
  42. Yang, Z.Q.; Liao, L.P.; Yang, W.K. Discussion on Formation Conditions, Development Trend and Prevention of Debris Flow in Niumian Valley. Geod. Geodyn. 2011, 31, 71–74. [Google Scholar]
  43. Data Sharing Infrastructure of National Earthquake Data Center. Available online: http://data.earthquake.cn (accessed on 16 March 2023).
  44. Cao, Z.; Wang, Y.; Zhang, H.; Liu, Y.; Liu, S.; Yin, L.; Zheng, W. Study on spatio-temporal characteristics of earthquakes in southwest China based on z-value. Open Geosci. 2022, 14, 185–207. [Google Scholar] [CrossRef]
  45. Liu, J.M.; Wang, T.; Shi, J.S.; Li, Z.T. Sichuan Jiuzhaigou Ms7.0 earthquake landslide emergency quick assessment. J. Geomech. 2017, 23, 639–645. [Google Scholar]
  46. Wang, X.Y.; Nie, G.Z. Preliminary analysis on the characteristics of landslide induced by Ms8.0 Wenchuan earthquake and its corresponding relationship with ground motion parameters. J. Geotech. Eng. 2009, 31, 1378–1383. [Google Scholar]
  47. Wang, X.Y.; Nie, G.Z.; Wang, D.W. Analysis of Wenchuan earthquake induced landslides using strong earthquake records. J. Rock Mech. Eng. 2009, 28, 2369–2376. [Google Scholar]
  48. Wang, X.Y. Research on rapid assessment technology of earthquake landslide disaster and its impact on emergency response International Earthquake. Dynamics 2010, 29, 2159. [Google Scholar]
  49. Yu, Y.X.; Wang, S.Y. Attenuation relationship between peak horizontal bedrock acceleration and response spectrum in the northeastern Qinghai Tibet Plateau. J. Seismol. 2004, 26, 591–600. [Google Scholar]
  50. Xu, G.X.; Yao, L.K.; Li, C.H.; Wang, X.F. Slope permanent displacement prediction model based on strong motion records of Wenchuan earthquake. J. Geotech. Eng. 2012, 34, 1131–1136. [Google Scholar]
  51. Wang, M.; Wang, J.; Wang, Y.M.; Wang, X.G.; Jiang, Y. Analysis of remote sensing dynamic change characteristics of debris flow in Niujuan gully in Wenchuan earthquake area. China Environ. Remote Sens. Appl. Technol. Forum 2014, 11, 286–296. [Google Scholar]
  52. Huang, R.Q.; Li, W.L. Study on the development and distribution of geological disasters triggered by the “5.12” Wenchuan earthquake. J. Rock Mech. Eng. 2008, 27, 2585–2592. [Google Scholar]
  53. Wilson, R. Predicting areal limit of earthquake-induced landsliding, evaluating earthquake hazards in the Los Angeles region-an earth-science perspective. US Geol. Surv. Prof. Pap. 1985, 1360, 317–345. [Google Scholar]
  54. Wang, X.Y.; Nie, G.Z.; Wang, S. Evaluation criteria for ground motion acceleration of landslides induced by Wenchuan earthquake. J. Seismol. 2011, 33, 82–90. [Google Scholar]
  55. Yao, L.K. Discussion on the estimation of critical rainfall from the frequency of debris flow and rainstorm. J. Soil Water Conserv. 1988, 2, 72–77. [Google Scholar]
  56. Li, H.B.; Xu, Z.Q.; Wang, H. Wenchuan earthquake main slip zone (psz): Oblique thrust fault in Yingxiu Beichuan fault zone. Geol. China 2013, 40, 121–139. [Google Scholar]
Figure 1. Overview of the study area: (a) provincial boundary map of Sichuan Province; (b) historical records of earthquakes above 4.0 Ms near the study area from 2008 to 2011; and (c) high-definition remote sensing images of Niumian Gully.
Water 15 01218 g001
Figure 2. Geological map of Niumian Gully.
Water 15 01218 g002
Figure 3. Remote sensing images and aerial photographs of landslide areas: (a) Landslide H01; (b) Landslide H02; and (c) Landslide H03. (See Figure 1c for the specific location).
Water 15 01218 g003
Figure 4. Characteristics of debris flow fans at the gully mouth: (a) “8.14” debris flow fan; and (b) “9.26” debris flow fan. (The arrows on the left show the direction of the slide, and the arrows on the right show an enlarged view of two debris flows in the area).
Water 15 01218 g004
Figure 5. Magnitude vs. accumulative sliding.
Water 15 01218 g005
Figure 6. Landslide residual accumulation and debris flow accumulation: (a) Landslide H01, residual accumulation; (b) Landslide H01, lower accumulation; (c) Landslide H02, residual accumulation; (d,e) Landslide H02, debris flow accumulation; and (f) Landslide H03, debris flow accumulation.
Water 15 01218 g006
Figure 7. Critical rainfall plots for Niumian Gully: (a) 1 h critical rainfall; and (b) 10 min critical rainfall.
Water 15 01218 g007
Figure 8. Chain relationship characterizing landslide–debris-flow disaster in Niumian Gully.
Water 15 01218 g008
Figure 9. Evolution model of landslide–debris-flow geohazard chain in Niumian Gully (modified according to [24]).
Water 15 01218 g009
Table 1. Statistics of newly-added landslide sources.
LandslideSource TypeLength (m)Width (m)Thickness (m)Source Volume (104 m3)
Landslide H01Residual accumulation 270120516.2
Lower accumulation 21054910.2
Landslide H02Residual accumulation 38025017161.5
Landslide–debris-flow accumulation 800151012.0
Landslide–debris-flow accumulation 10209028257.0
Landslide H03Landslide–debris-flow accumulation 1471002435.3
Disclaimer/Publisher’s Note: The statements, opinions and data contained in all publications are solely those of the individual author(s) and contributor(s) and not of MDPI and/or the editor(s). MDPI and/or the editor(s) disclaim responsibility for any injury to people or property resulting from any ideas, methods, instructions or products referred to in the content.

