
Water-Energy Nexus in the Antofagasta Mining District: Options for Municipal Wastewater Reuse from a Nearly Energy-Neutral WWTP

1
DIATI—Department of Environment, Land and Infrastructure Engineering, Politecnico di Torino, 10129 Torino, Italy
2
CleanWaterCenter@PoliTO, Politecnico di Torino, 10129 Torino, Italy
3
Departamento de Ingeniería en Minas, Universidad de Antofagasta, Antofagasta 1240000, Chile
*
Authors to whom correspondence should be addressed.
Water 2023, 15(6), 1221; https://doi.org/10.3390/w15061221
Submission received: 24 February 2023
/
Revised: 17 March 2023
/
Accepted: 19 March 2023
/
Published: 21 March 2023
(This article belongs to the Topic Renewable Energies for Water Treatment and Reuse in Mining Industries)
Abstract
:The region of Antofagasta is the mining hearth of Chile. The water requirement of the local mining sector is 65% of the total water uses, with a water consumption of approx. 9 m3/s in the year 2020. That determines an important pressure onto freshwater, which can only be alleviated by resorting to desalination or reuse of treated wastewater. At present, an amount equal to 90% of the wastewater generated in the city of Antofagasta is discharged into the ocean, after undergoing only preliminary treatments. The wastewater treatment plant (WWTP), which includes a conventional activated sludge (CAS) process, has a very low treatment capacity, insufficient to serve the whole population. A new WWTP will be built with the twofold aim of (i) purifying the totality of the wastewater generated from the city (approx. 320,000 equivalent inhabitants, e.i.), and (ii) allowing the reuse of 100% of the treated wastewater in the local mining sector, in agreement with the goals of the Chilean government. The new Antofagasta WWTP will include preliminary treatments and a conventional activated sludge (CAS) process with a higher treatment capacity. This study integrates a number of modeling tools, namely the Activated Sludge Model n.3 (ASM3), the Takacs model, and some stoichiometric and energy balances, to assess the impact that some changes, possibly introduced into the project of the new WWTP, could determine on its energy and environmental sustainability. Specifically, through an energy-economic-environmental (3-E) analysis, the original scheme of the planned WWTP was compared with three scenarios, of which Scenario 1 introduces anaerobic digestion (AD) of secondary sludge, Scenario 2 concerns primary sedimentation and AD of both primary and secondary sludge, and, finally, Scenario 3, other than primary sedimentation and AD, also includes a pre-denitrification process. The results of the study demonstrated that all the changes introduced by Scenario 3 were of capital importance to promote the transformation of the WWTP into a nearly energy-neutral water resource recovery facility (WRRF). Specifically, the processes/operations introduced with Scenario 3 can reduce the electric energy demand from external sources to only 20% of that of the original scheme, and consequently avoid the emission of 4390 tons CO2-equivalent/y.
1. Introduction
Water scarcity (WS) is one of the most critical risks that threatens social and economic development around the world [1]. WS is related to the ratio between water demand and availability in a given area, and it has been emphasized by the effects of global warming [2]. Some of the most productive regions of Chile, located in the north of the country, are experiencing this problem, because the overexploited water resources are insufficient to cover environmental, domestic, and industrial demand [3].
Among the Chilean Northern Regions, the region of Antofagasta (II RCl) has some unique features that determine an extremely high water-stress. The region holds the driest desert area in the world (i.e., the Atacama Desert) and waters that feed ground and surface basins are scarce because of both very low rainfall, in the order of only 5 mm/y, and high evaporation rate [4]. Furthermore, the water of the main rivers (Río Loa, Salar de Atacama) is not only scarce, but also of poor quality, because of high content of salts, boron, and arsenic [5,6]. At the same time, the region of Antofagasta is known as the “mining hearth of Chile”. It contributes to 51% of the country’s mining gross domestic product [7], and it represents 30% of the total national exports, 55% of total copper exports, and 100% of lithium production, which corresponds to 26% of world production [8]. The weight of the mining sector on the water demand in the region of Antofagasta was estimated at 64% of total water uses, compared to an average of only 7% in the other regions of the country [9]. The mining sector is the main driver of the extremely high water-stress [10].
In 2020, the copper mining industries located in the II RCl used 5.00 m3/s of seawater and 3.87 m3/s of continental water, the latter including surface water, groundwater, water recycled from other industrial sectors, and treated wastewater [11]. According to a provision of the Comisión Chilena del Cobre, a technical agency of the Chilean State, the use of continental water for mining operations in 2032 should be reduced to only 10% of the total water demand, which is estimated to grow to 9.8 m3/s. That action is aimed to reduce the pressure on freshwaters, which should be exclusively intended to human consumption [12]. A broad range of stakeholders is optimistic about the potential for desalination to reduce conflict over water in mining regions. However, desalination of seawater has high energy and environmental costs, which are estimated at 4.0–4.5 kWh electric energy/m3 and 0.08–4.3 kg CO2-equivalent emitted/m3, respectively [13,14,15]. Furthermore, some authors argue that the addition of seawater supplies to mining activities will not reduce the use of freshwater but will determine an expansion of the mining production and its associated local and global impacts [16,17]. Consequently, a partial substitution of desalinated seawater with the wastewater treated in municipal WWTPs could contribute to reduce the impacts of the mining sector not only on the resources (namely water, energy) but also on society [18,19].
Presently, an amount equal to 90% of the wastewater generated in Antofagasta, the main city of the II RCl with approx. 350,000 inhabitants (2017), is discharged into the ocean, after the preliminary treatments of screening and grit removal. The residual amount of wastewater is treated in a WWTP, which uses a conventional activated sludge (CAS) process, with a treatment capacity of 120 L/s. The treated wastewater is subsequently reused for industrial purposes. The existing WWTP is presently managed by Sacyr Agua, a Spanish company. However, the concession which Sacyr Agua obtained by ECONNSA (namely the Empresa Concesionaria de Servicios Sanitarios, a joint-stock company owned by the Chilean State) will end in 2024. In this framework, works for building a new WWTP have been planned, with the aim of both increasing the treatment capacity and improving the quality of the treated wastewater, in order to make 100% of it suitable to be reused for mining activities. ECONNSA invited domestic and foreign companies to an international tender, the call of which was published in June 2021. According to the project put out to tender, the new WWTP will include, other than the preliminary treatments of screening and grit removal, a CAS process for the oxidation of biodegradable organic substances. That kind of treatment was deemed to be sufficient to make the treated wastewater compliant with the Chilean law (D.S. 90/2000) and to guarantee 100% reuse in the local mining district [20].
The reuse of wastewater in mining activities will undeniably represent an important environmental benefit, with respect to the present situation and expected water demand increase in the mining sector in the next years. However, the very conventional train of treatments planned for the new WWTP will not probably be able to achieve the high energy, economic, and environmental performances required by the sustainable development goals [21]. Systems with low operating costs, reuse of the treated wastewater, and nutrient recovery should be implemented in order to increase the sustainability of wastewater treatment processes [22]. In fact, in these last years, the traditional model of WWTPs, intended as facilities aimed to reduce the pollution load in wastewaters for a safe discharge into the environment, has shifted toward the paradigm of the water resource recovery facilities (WRRFs), which are plants that produce clean water, recover nutrients (such as phosphorus and nitrogen), and potentially reduce fossil fuel consumption through the production and use of renewable energy [23,24].
The aim of this study is to use a 3-E (energy, economy, environment) analysis to evaluate the impact that some changes, possibly introduced into the project of the new WWTP of Antofagasta, put out to tender, could determine on its energy and environmental sustainability. The original project of the WWTP already received the environmental approval from the governance authority. However, it can be modified by the tender-awarded company in the view of enhancing the performances and environmental compliance of the WWTP, possibly with the processes/operations proposed and discussed in this paper. The 3-E analysis considers three scenarios that introduce (i) the anaerobic digestion (AD) of the produced sludge for the generation of renewable energy, and the sections of (ii) primary sedimentation and (iii) predenitrification, for the reduction in the organic load entering the CAS section. In fact, to a reduction in the organic load is associated the reduction in the energy demand of one of the more energy-demanding processes, which is the oxidation of the biodegradable organic substance which occurs in the CAS section. This paper contributes to the current literature by proposing a novel methodology that helps to select, based on an integrated energy, economic and environmental analysis, the most appropriate scheme capable of achieving the goals of wastewater reuse, WWTP energy self-sufficiency, and CO2 emission reduction. Specifically, this paper has two important innovative features. Firstly, many studies showing the applicability of Activated Sludge Models (ASMs) to optimize existing WWTPs can be found in the scientific literature. However, few papers report the use of such tools to support the design of new WWTPs, as reviewed by [25]. Secondly, it has to be considered that, over the years, the equations at the basis of the abovementioned models (i.e., ASM3, Takacs) have been implemented into black-box software such as GPS-X, Simba, and others. The approach followed in this study is then aimed to demonstrate that such equations can be written and individually controlled into the commercial Simulink-Matlab software, a graphical, versatile, modeling-oriented programming environment, in order to be used to design a real WWTP.
2. Materials and Methods
2.1. The Existing and Planned WWTP of Antofagasta
The existing CAS-WWTP has a treatment capacity of 120 L/s, capable to treat only approx. 10% of the wastewater generated in the city of Antofagasta. In the future, the municipal wastewater management system will be improved after the construction of a new WWTP. It will be located in the surroundings of the city, which is in the industrial area of Salar del Carmen, which already holds the two facilities for drinking water treatment built in 1970 and 1989 [26].
The new wastewater management system will treat an average flow rate of 900 L/s (minimum 400 L/s, maximum 1300 L/s, for a total of 314,000 equivalent inhabitants, e.i.) and will overall include (i) the existing pretreatments of screening and grit removal, which will be revamped at the new flow rate; (ii) an intermediate storage tank; (iii) the new WWTP; (iv) adduction pipes to connect the pretreatments’ site with the storage tank, the new WWTP and, finally, the sites where the treated wastewater will be reused to support mining activities.
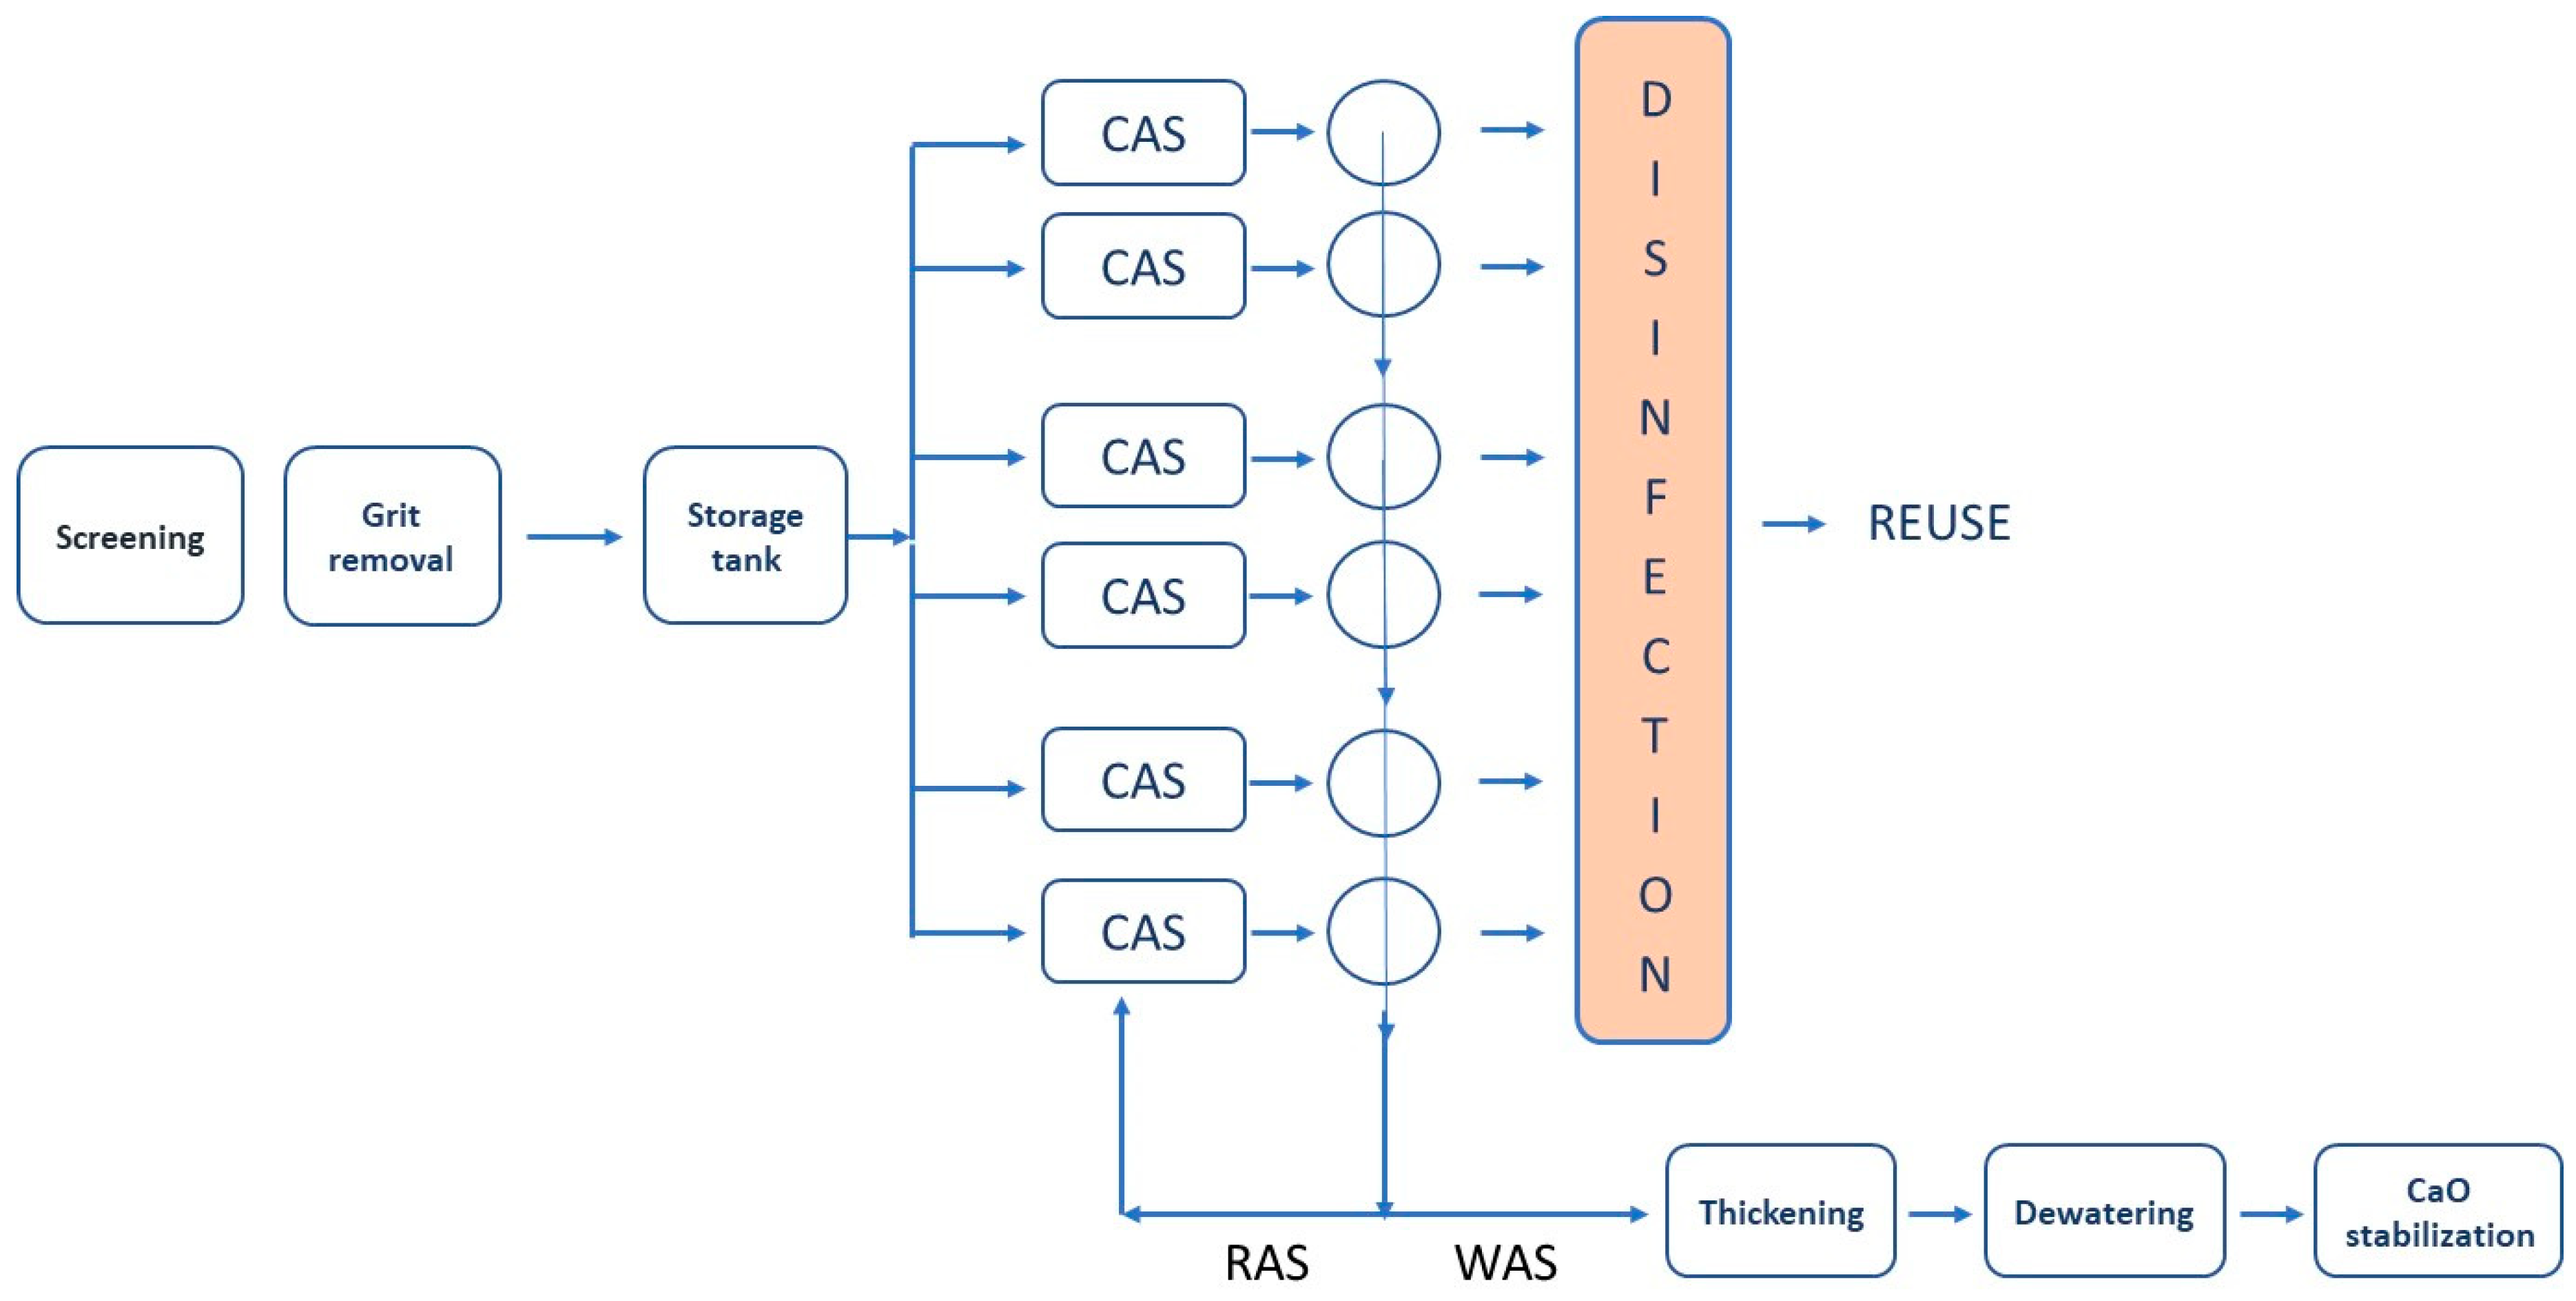
The new WWTP will include three parallel treatment modules, with a treatment capacity of 300 L/s each. As shown in Figure 1, each treatment module will include two parallel CAS tanks followed by secondary settlers and a final disinfection unit. The project does not contemplate a section of primary sedimentation [20].
The characteristics of the wastewater, at the inlet (that is, after the preliminary treatments, screening and grit removal), as a daily average, and at the outlet (that is, the maximum concentrations admitted by D.S. 90/2000) of the planned WWTP, are listed in Table 1. The characteristics of the wastewater after treatment are deemed to be suitable for reuse in mining activities, notwithstanding the high concentration of chloride, in the order of 1000 mg/L, which will not interfere with mining operations [27].
The CAS tanks will have a volume of 6402 m3 each (58.2 m × 22 m × 5 m, L × W × D) and a design solid retention time (SRT) of 7 days. The oxygen requirement of the CAS will be ensured by a grid system of fine-bubble diffusers, with a maximum air requirement in the summer period of 225 m3/min for each module. Three lobe-blowers, with a capacity of 113 m3/min each, will be implemented in a 2 + 1 configuration (2 working, 1 spare) in each module.
Secondary settlers will have a diameter of 26 m each. The recirculation of activated sludge (RAS) and extraction of waste activated sludge (WAS) will be handled by three (2 + 1) and two (1 + 1) pumps, respectively. A final disinfection process, obtained through chlorination (sodium hypochlorite, NaClO, solution, 6 mg/L), will be realized in two parallel, back-and-forth plug-flow reactors for each module. Each reactor will have a volume of 300 m3 and a hydraulic retention time (HRT) of approx. 33 min.
The WAS will be treated in the sludge-treatment line of the WWTP through the operations of thickening, dewatering, and final chemical stabilization with lime (CaO). The project of the sludge-treatment line does not contemplate sludge stabilization/valorization through AD. Thickening will be obtained in six gravity thickeners, two for each module, with a diameter of 11.5 m each. Each thickener can treat a sludge-flow rate of 8.5 L/s (30.6 m3/h) and will generate a flow of thickened sludge up to 24.35 m3/h. Dewatering and chemical stabilization will be carried out in a closed building. Dewatering will be obtained with two screw-presses, with a treatment capacity of 13 m3/h each. Sludge can be conditioned with a polymer before being dewatered, in order to increase the final total solid (TS) content to values of approx. 25%.
2.2. Future Scenarios
The planned Antofagasta WWTP has been conceived to achieve two important environmental benefits, which are purifying the totality of the wastewater generated in the city and reusing 100% of the treated wastewater in the local mining sector. However, the design concept of the WWTP is very traditional and may not be capable of obtaining the high energy, economic, and environmental performances required by the sustainable development goals. For this reason, the planned WWTP (Scenario 0) was compared, through a 3-E analysis, with three scenarios (namely Scenario 1, 2 and 3) that introduce some processes/operations that could improve the energy, economic, and environmental performances of the WWTP. The characteristics of each of the proposed scenarios are shortly described in the following.
Scenario 1. The WAS extracted from the secondary settlers is valorized through a 20-day HRT, mesophilic AD process. Before AD, the WAS is thickened to a final TS content of 5%. After AD, digestate is dewatered to a final TS content of 25% in a screw press. The produced biogas, after being temporarily stored in a gasometer, is burned in a combined heat and power (CHP) unit. A back-up boiler is used to preheat the sludge at the start-up of the process, and a flare stack is used to destroy the biogas when it is not possible to valorized it in the CHP unit.
Scenario 2. A treatment of primary sedimentation is added before the CAS tanks. Both the primary sludge (PS) and WAS are valorized through AD. Before and after AD, the mixture of the two sludge and the resulting digestate are thickened and dewatered, respectively, as in Scenario 1. The produced biogas is burned in the CHP unit of Scenario 1.
Scenario 3. The scenario, other than the addition of the primary sedimentation and AD for the PS and WAS, contemplates the partition of the CAS tanks in two parts, in order to obtain an anoxic-oxic scheme according to the Pre-Anoxic Ludzack–Ettinger process. Volumes of the anoxic and oxic sections are 0.4 and 0.6 times, respectively, of the volume of the original CAS tank.
2.3. Methodology Used for the 3-E Analysis
This section describes the methodology used to carry out the 3-E analysis of the four scenarios introduced in Section 2.2.
Specifically, four simulation models were used to determine the values of the main parameters that characterize a WWTP, namely the concentration of solids into the CAS tanks (i.e., the mixed liquor suspended solids, MLSS), the oxygen demand (OD), the concentration of ammonium nitrogen, NH4-N, and nitrate nitrogen, NO3-N, after the biological treatment and the production of the WAS.
The abovementioned simulation models were the following:
- An ideal zero-dimension removal efficiency model, for the processes of primary sedimentation, thickening, and dewatering;
- The ASM3, for the biological processes that take place into the CAS tanks, under the both only-oxic and anoxic-oxic schemes [30,31]. The biological processes include heterotrophic carbon oxidation, autotrophic nitrogen oxidation, production of new cell materials, endogenous respiration, and carbon oxidation in anoxic conditions where applicable;
- The Takacs one-dimension clarifier model, for secondary sedimentation; that model is a non-reactive flux-based model that considers 10 horizontal layers, the 5th (from the top) of which receives the fed sludge [32];
The utilization of the abovementioned models required a number of hypotheses:
- The surface-loading rate of the primary settlers was fixed equal to 40 m/d [28];
- The efficiency of primary settlers, in both COD and TSS removal, was fixed equal to 50% [35];
- The COD/BOD5 ratio was fixed equal to 2.8 [36];
- The COD partition, required by the ASM3, was assumed equal to that reported in Borzooei et al. [37] and detailed in the Supplementary Materials (Tables S1 and S2);
- All the stoichiometric and kinetic parameters required by the ASM3 were those reported in Henze et al. [31];
- The set of parameters required by the Takacs model for the secondary settlers was that coming from the calibration of Takacs et al. [32];
- The concentration of dissolved oxygen (DO) into the aerobic tanks of the CAS section was assumed equal to 2 mg/L;
The energy assessment required the implementation of an energy balance between the negative (i.e., consumption) and positive (i.e., production or saving) items. The negative items are related to the electricity demand of the processes or pieces of equipment involved in the four scenarios. The electricity demand of all the processes or pieces of equipment, except the blowers used for the aeration of the CAS tanks, was calculated by multiplying the specific electricity consumption (shown in Table 3), that is, the per unit of e.i., obtained from Panepinto et al. [38] and Elshaw et al. [39], for the number of e.i. of the planned WWTP, equal to 314,000. The obtained values of electricity demand are reported in Table 3.
The electricity demand of the blowers used for the aeration of the CAS tanks was calculated by using the approach described in the following. The blowers’ electricity demand depends on the flow rate of the air necessary for the biological processes, which is related to both the OD of the biological processes and the efficiency of the pieces of equipment used for air diffusion. It was assumed that the air diffusers used in the Antofagasta WWTP had the same characteristics of the Sanitaire® Silver Series II fine-bubble diffusers (see Supplementary Materials Table S3) [40]. The overall number of diffusers was arbitrarily fixed equal to 3840, with a consequent diffuser density of 3 diffusers/m2 for Scenarios 0-1-2, and of 5 diffusers/m2 for Scenario 3, in which 2/5 of the volume of the original oxic tank was used for anoxic (i.e., denitrification) reactions. Those diffusers’ density values were in line with the values recommended in [40].
The efficiency values found in the technical sheets (namely the standard oxygen transfer efficiency, SOTE, determined according to European Standard EN 12255-15:2003 [41] or the equivalent ASCE standard [42]) must be corrected by a factor that is the ratio between the standard oxygen transfer rate (SOTR) and the field OTR (OTRf), as in Equation (1) [28].
where τ and ω factors take into account the field temperature (T) and pressure, respectively, α and β factors take into account the presence of TSS and total dissolved solids (TDS), respectively, C*20 is the saturation concentration of DO at 20 °C, C is the concentration of DO in the field condition, and F is the fouling factor. Details concerning Equation (1) and the related parameters can be found in the Supplementary Materials (Equations (S1)–(S3)). The F parameter was conservatively fixed equal to 0.73, on the basis of the results of a recent study that reported a similar value for fine-bubble diffusers after 10 years of operation [43]. The α factor was deemed of importance for the assessment of the SOTR/OTRf ratio, because the TSS layer that accumulates next to the oxygen bubbles locally decreases the gas solubility, thus reducing the oxygen transfer efficiency (OTE) [44]. In this work, the α factor was quantified by using both the Baquero-Rodriguez et al. [44] equation (Equation (2)), in which α has a double exponential dependence on the TSS concentration, and the less recent but most known Rosso et al. [45] equation (Equation (3)).
where u and v are the dimensionless empirical parameters equal to 0.507248767 and 0.1043568988, respectively, as reported in [44]; MLSS is the MLSS concentration [g/L]; a is the area of diffusers [m2]; ND is the total number of diffusers; Z is the diffuser submergence [m]; Qair is the total air flow rate [m3/s].
Calculations of the OTRf factor were carried out by using the most conservative α value returned by Equations (2) and (3).
The positive items in the energy balance included the electric energy produced by the combustion of the biogas, generated in the 20-day HRT mesophilic AD process, in the CHP unit, which had thermal and electric efficiencies equal to 42% and 40%, respectively. Furthermore, savings of electric energy due to the loads of organic substance, which was reduced after primary sedimentation and/or denitrification reactions, to be oxidized into the CAS sections were also accounted.
The economic assessment of the scenarios described in Section 2.2 was aimed to compare the savings of electricity that had to be supplied from sources external to the WWTP, with the costs connected with the implementation of the proposed scenarios. The tool used to perform the economic assessment was the internal rate of return (IRR), a metric used in financial analyses to estimate the profitability of potential investments [46]. The IRR is the discount rate (i) that makes the net present value (NPV) of all cash flows equal to zero in a discounted cash flow analysis.
The ultimate goal of the IRR is to identify the rate of discount (i) that makes the present value of the sum of annual nominal cash inflows (from t = 0 to t = N) equal to the initial net cash outlay for the investment. The IRR calculation excludes some external factors, such as the risk-free rate, inflation, the cost of capital or financial risk.
The financial analysis of the scenarios described in Section 2.2 was performed over a period of 20 years, although the new concession of the wastewater treatment service of the city of Antofagasta will last 35 years. The net cash flow at the time zero (R, t = 0) was fixed equal to the capital expenditure (CAPEX), which is the investment costs for equipment supply and installation. The economic value of the installations at the end of their useful life was set equal to zero. The net cash flows, from the first to the 20th year, were calculated as the sum of in-cash flows and out-cash flows. In-cash flows were assumed to be the amount of money saved from the implementation of the scenarios described in Section 2.2. Out-cash flows were assumed to be the costs for operational expenditure (OPEX).
CAPEXs were assessed by referring to the procured equipment costs (PECs) of the pieces of equipment necessary for the enhancement of the planned WWTP, actualized with the exchange ratio (ER). PECs were assessed with equations found in [47] and reported in Table 4. Those equations correlate the cost of each piece of equipment with a specific characteristic of it. The ER parameter reported in Table 4 was calculated as the ratio between the present (2021) chemical engineering plant cost index (CEPCI) and the CEPCI at a reference year [48]. CEPCIs consider changes in the value of money caused by inflation or deflation. Every year chemical engineering magazines publish actualized CEPCIs [49], in order to allow a quick evaluation of the costs of plants and pieces of equipment of the chemical and process industry.
CAPEX = PEC × ER
The OPEX items include the maintenance of pieces of equipment, electricity consumption, and WAS final management. The annual maintenance costs were fixed equal to 6% of the investment costs [47,50]. The cost for electricity was fixed at 0.129 $/kWhe, which was the price, including the cost of power, distribution, and taxes, paid in Chile in June 2022 [51].

Table 4.
PEC, CEPCI, and ER for the pieces of equipment necessary for the enhancement of the Antofagasta WWTP.
Table 4.
PEC, CEPCI, and ER for the pieces of equipment necessary for the enhancement of the Antofagasta WWTP.
| Piece of Equipment | PEC Correlation ($) | Unit | Year | CEPCI | ER | Ref. |
|---|---|---|---|---|---|---|
| Primary settler | m2 | 1998 | 389.5 | 1.82 | [52] | |
| Anaerobic digester | m3 | 2016 | 541.7 | 1.31 | [47] | |
| Desulfurization | Nm3/h | 2011 | 585.7 | 1.21 | [47] | |
| Demister | $ | 2011 | 585.7 | 1.21 | [47] | |
| Gasometer | m3 | 2012 | 584.6 | 1.21 | [47] | |
| Biogas blower | kWe | 2013 | 567.3 | 1.21 | [47] | |
| Biogas pumps | kWe | 2011 | 585.7 | 1.21 | [47] | |
| CHP unit | kWe | 2015 | 556.8 | 1.27 | [47] | |
| Heat exchanger | m2 | 2005 | 468.2 | 1.51 | [47] | |
| Post-thickener | m3 | 2003 | 402.2 | 1.76 | [47] | |
| Back-up boiler | kWe | 2012 | 584.6 | 1.21 | [47] | |
| Flare stack | m3/h | 2013 | 567.3 | 1.21 | [47] |
Two options for the WAS final management were considered in this work, which are disposal in landfill and recovery in agriculture. Landfilling is the most employed disposal route for sludge in Chile, concerning 55% of the total produced sludge [53]. Biosolids recovered in agriculture or used in other land application are only 9% of the total stabilized sludge, with alkalinization with lime being the practice most commonly used for sludge stabilization in Chile [54]. The cost of landfilling was fixed to 40 $/t of dewatered sludge, in agreement with [55]. According to the World Bank Group, at present farmers can use stabilized sludge in agriculture at no cost [55], Aguas Andinas (which is the water utility of Santiago de Chile) pay the cost of transport, which amounts at 13 $/t of dewatered sludge.
The environmental assessment only considered the avoided emission of anthropogenic CO2 and greenhouse gases (GHGs). CO2 and GHGs are recognized as the principal causes of the global warming. CO2 emission can be limited through two principal strategies, namely the reduction in the energy demand, by using more efficient processes or pieces of equipment, and the production of energy from renewable sources. Avoided CO2 emissions associated with savings of electric energy from sources external to the WWTP were evaluated by using the CO2 emission factor, equal to 0.308 kg CO2-equivalent/kWhe, which characterizes the production of electricity from the Chilean energy mix [56].
All the mathematical models used to perform the 3-E analysis of the four scenarios were implemented into the graphical programming environment Simulink-Matlab® (Simulink 9.2, solver method ode15s).
3. Results and Discussion
The four scenarios presented in Section 2.2 were analyzed according to a 3-E approach, which concerns their energy, economic, and environmental performances. As anticipated in Section 2.1 and Section 2.3, the assessments were carried out for SRT = 7 days, DO concentration = 2 mg/L, TSS content of the PS and WAS after thickening = 5%, and HRT of the AD process equal to 20 days.
Energy, economic, and environmental assessments required the estimation of a number of intermediate parameters necessary to completely characterize the processes and the pieces of equipment included in the four scenarios. In this regard, Table 5 reports the main outputs of the simulation models described in Section 2.3, in terms of concentration of the MLSS in the biological section of the WWTP, OD, nitrogen concentration (as NH4-N and NO3-N) after the treatment, mass flow rates of the WAS extracted from the CAS tank, PS separated from the primary settlers, stabilized sludge (in the case of Scenario 0) or digestate (in the case of Scenarios 1, 2 and 3). The MLSS include active heterotrophic and autotrophic biomass, residues of death cells, non-biodegradable volatile suspended solids (nbVSS), and fixed suspended solids (FSS). Details concerning the outputs of the used simulation models can be found in the Supplementary Materials (Table S4 and Figures S1–S4).
The characteristics of the pieces of equipment necessary to implement the changes introduced by Scenarios 1, 2, and 3 into the WWTP original scheme are detailed in Table 6. Finally, the outputs of the AD process are detailed in Table 7.
As can be seen from Table 5, the concentrations of MLSS in Scenario 0 and Scenario 1, which did not include the primary sedimentation, were at a very high value (approx. 7 kg/m3), higher than the usual values found in the CAS systems (3–4 kg/m3) [28]. High MLSS concentration values depended on the large amount of organic, non-biodegradable substances (nbCOD), under particulate forms (see Table S2), and affected the WAS production, which was equal to 37,177 kg TSS/d in Scenarios 0 and 1. In Scenario 0, the WAS was stabilized with lime and disposed in a landfill.
3.1. Energy Assessment
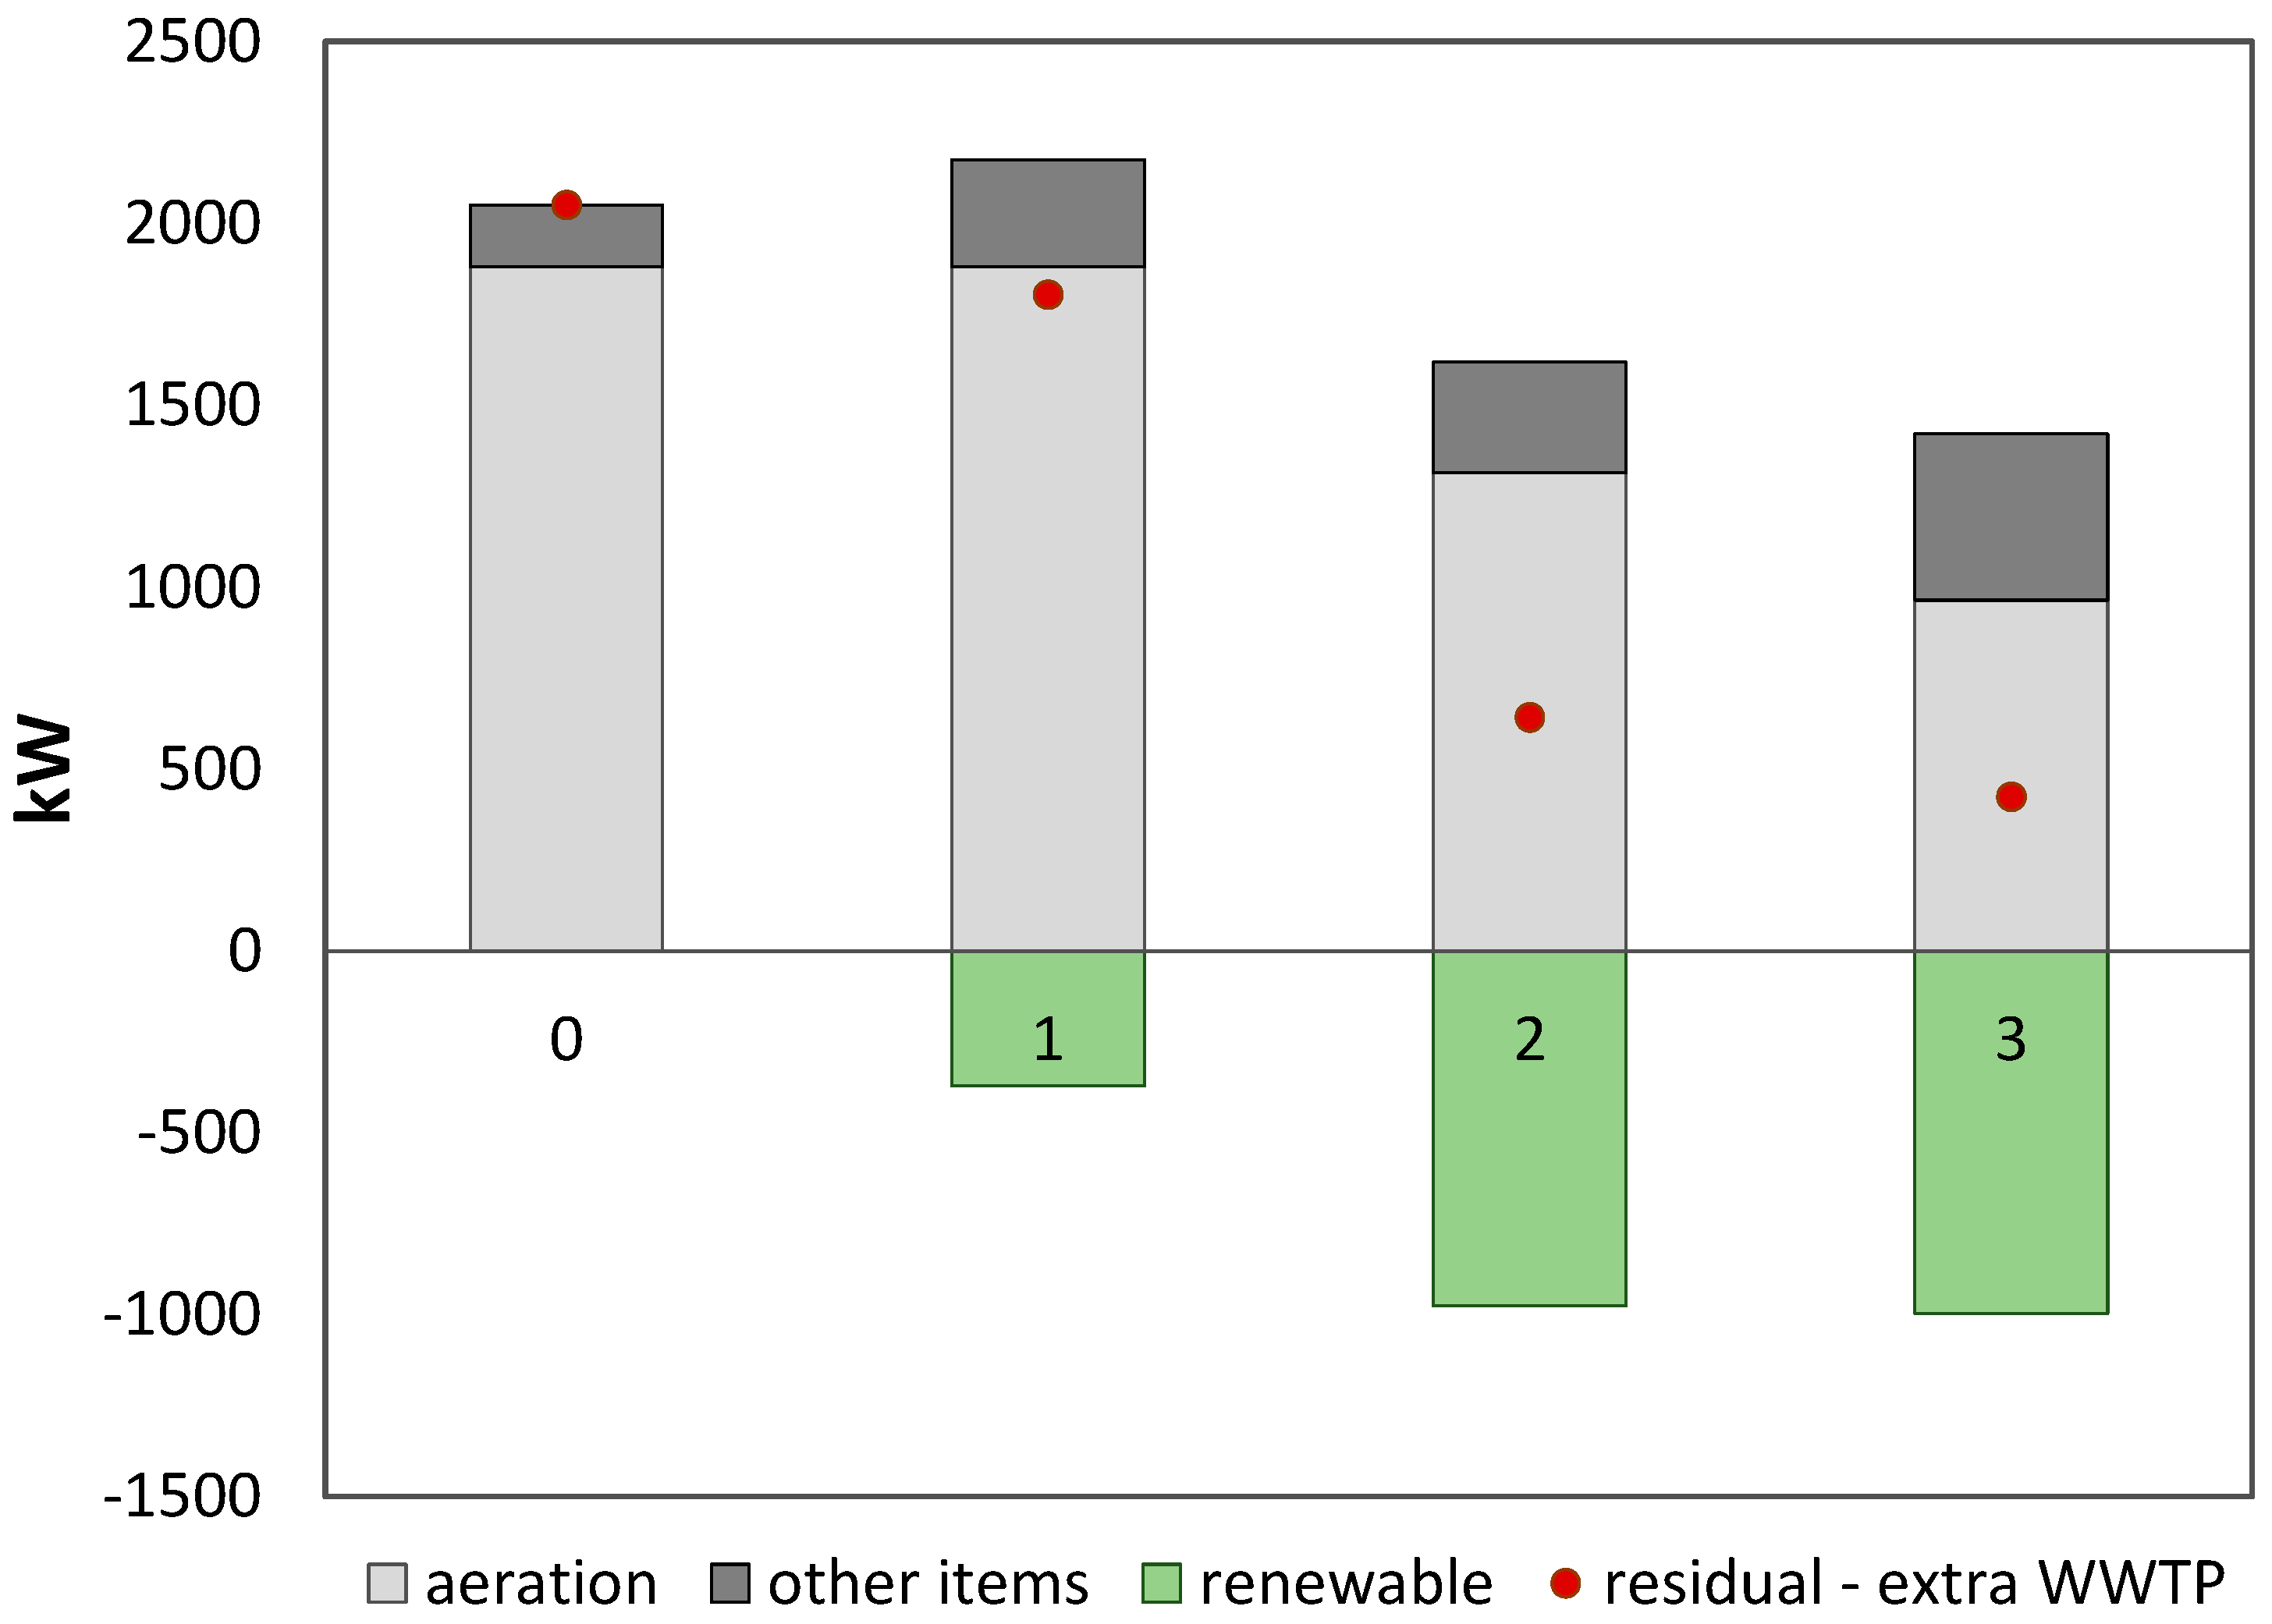
The principal results of the energy assessment carried out on the four scenarios are showed in Figure 3. Specifically, Figure 3 reports the positive and negative items of the energy balance, which is the amount of renewable energy generated by the WWTP (green bars), and the energy demand due to the aeration (light-gray bars) and other processes (dark-gray bars), respectively. Furthermore, Figure 3 shows the results of the balance calculation, which is the residual amount of energy that must be still supplied from external sources for each of the considered scenarios.
As can be seen from Figure 3, the overall energy demand of Scenario 0 was equal to 2051 kW, approx. 92% of which was due to the aeration in the CAS tanks. As reported in previous studies, aeration is the largest energy-consumer in CAS-WWTPs, accounting for 50% to 60% of the total energy consumption in WWTPs [57]. It can be seen that the value coming from the analysis reported in this study was far higher than the abovementioned range. That was due to two main reasons. Firstly, Scenario 0 considered a very simple treatment scheme, where other possible energy-demanding sections, such as AD, were not present. Secondly, organic substances under both particulate and soluble form were all removed in the CAS tank, because of the absence of the primary sedimentation section. That inevitably determined a high organic load, with consequent high energy expenses for organic carbon oxidation. Consequently, minimizing the energy consumption of the aeration unit is one of the principal keys to improve the energy efficiency of the Antofagasta WWTP. No renewable energy was produced in the WWTP under Scenario 0; consequently, the overall amount of electricity necessary for the WWTP must be supplied from renewable or fossil sources external to the WWTP. In Scenario 0, the unit energy cost for wastewater treatment was estimated at 0.63 kWhe/m3. Provided that the treated wastewater will be reused in mining activities, which are presently supplied with desalinated water, this cost has to be considered competitive, because it is in the low range of the costs for the treatment of seawater through reverse osmosis (RO), which are at 0.5–4 kWhe/m3 [14].
Scenario 1 introduces the AD process for the energy valorization of the WAS produced in the biological section of the WWTP. In Scenario 1, the same amount of the WAS produced in Scenario 0, equal to 37,177 kg TSS/d (see Table 5), was digested in digesters with an HRT of 20 days and, consequently, a total volume of approx. 19,000 m3 (see Table 6). The AD of the WAS produced 3538 Nm3/d of biogas with a 63% v/v methane concentration. The combustion in the CHP unit determined the production of 388 kW of heat and 370 kW of electric energy. As can be seen from Figure 3, the overall energy cost of Scenario 1 was 6% higher than that of Scenario 0, because it included the energy demand of the pieces of equipment necessary for the AD process. The aeration of the CAS tanks was the most energy-demanding process also in Scenario 1, where it accounted for 86.4% of the overall energy demand. However, in Scenario 1, an amount equal to 17% of the energy necessary to the WWTP was produced by the AD process. Consequently, the unit energy cost for wastewater treatment due to external sources decreased to 0.56 kWhe/m3.
According to the hypotheses set in Section 2.1 and Section 2.3, the introduction of the primary sedimentation section in Scenario 2 reduced the load of biodegradable organic substances under particulate form by 50%. Consequently, the more organic carbon can be redirected into the primary sludge, the less energy is needed for aeration in secondary treatment and the more methane is produced in anaerobic digesters. Recent experiences even proposed advanced primary treatments, with efficiencies in particulate COD removal up to 70–80%, as an intensification option for current WWTPs in the search for energy positive process [58]. The PS collected from primary settlers was equal to 22,363 kg TSS/d. Because of the reduction in the load of biodegradable organic substances under particulate form, the MLSS concentration in the CAS tank, calculated by the ASM3, decreased to approx. 3.6 kg/m3, a value which was now in line with that of the traditional CAS systems [28].
The reduction in the load of the biodegradable organic substances had a double positive effect on the aeration process in the CAS tank. Firstly, aerobic biological processes require less oxygen and, secondly, oxygen has a high transfer efficiency into the tank. In fact, according to Rosso et al. [45], a decrease in the OD and, consequently, in the air flow rate, determines an increase in the α factor, which affects the ratio between the OTRf and SOTR, making oxygen diffusion into the CAS tank more effective. Furthermore, the approach proposed by Baquero-Rodriguez et al. [44] suggests that increases in the MLSS concentration had a detrimental effect on the α factor, which depends on the MLSS according to a double exponential law. High MLSS amounts necessarily include high amounts of residues of death cells, which contain a number of substances (extracellular polymeric substances, surfactants, …) that accumulate next to the surfaces of oxygen bubbles, thus reducing OTE [44]. Because of the abovementioned reason, it was observed that the energy demand for the aeration process in Scenario 2 decreased by approx. 30%.
The amount of generated WAS was reduced by approx. 50%, but the overall amount of TSS to be valorized with the AD process was approx. of the same order of magnitude (10% more) as that considered in Scenario 1. However, with the introduction of the primary sedimentation section, the biogas production was estimated to experience an increase by a factor of 2.6. In fact, the PS are deemed to be approx. three times more productive than the WAS [59]. It is recognized that approx. 2/3 of the energy content entering the WWTP is captured into the PS [60]. The account of the overall energy consumption items revealed that the WWTP energy demand under Scenario 2 was of 1618 kW (81% due to the aeration). The produced electric energy was 976 kW, thus indicating that the ratio between the energy produced from AD and the energy supplied from external sources was 60:40. Under Scenario 2, the unit energy cost for wastewater treatment due to external sources decreased to only 0.20 kWhe/m3.
In Scenario 3, a denitrification process was introduced into the wastewater treatment train before the oxic tank (predenitrification or Ludzack–Ettinger scheme). The wastewaters originating from the city of Antofagasta and conveyed into the WWTP have an average nitrogen concentration in the order of 50 mg/L (see Table 1). As shown in Table 5, the nitrification process that takes place into the oxic tank, under all the scenarios considered in this work, was capable of reducing the concentration of NH4-N to values of 1 mg/L. However, the discharge of the treated wastewater into the ocean, or the reuse in mining activities, does not require a complete nitrogen removal. For those uses (or final destinations), residual concentrations of total nitrogen of 50 mg/L are accepted. In this view, the introduction of a predenitrification section was deemed not necessary, but the denitrification process could bring some benefits for what concerns the oxygen saving, which was determined by a partial removal of the biodegradable organic substance upstream the oxic tank [61].
The outputs of the ASM3 revealed that, under Scenarios 0 and 1, the concentration of total nitrogen in the treated wastewater was reduced from 50 mg/L to 39 mg/L (see Table 5). Scenario 2 was less efficient in nitrogen removal because the amount of microorganisms necessary for the oxidation of the biodegradable organic substance was lower and, consequently, the aliquot of nitrogen assimilated into the microorganisms, in the order of 12% of the microorganism dry weight, was lower as well. The combination of anoxic and oxic processes could reduce the concentration of total nitrogen at the outlet of the biological section to values of 25 mg/L. However, a more important benefit of the introduction of the denitrification process was the energy demand that resulted from the aeration of the oxic process. It was reduced from the original 1880 kW of Scenario 0 to approx. 50%, which is 964 kW, of Scenario 3. As mentioned before, a reduction in the air flow also determines an increase in the α factor and, consequently, a better OTE, which positively affects the final electricity demand for the aeration process.
The decrease in the energy demand for the aeration process was of 12% and 31%, compared with Scenario 2 and Scenario 0, respectively. According to the output of the ASM3, the amount of the WAS produced under Scenario 3 was similar to that calculated for Scenario 2 (see Table 5). Consequently, also the volumes of produced biogas were the same. The biogas produced in the AD could supply approx. 70% of the WWTP energy demand, thus leaving a residual 30% to energy sources external to the WWTP. The unit energy cost for wastewater treatment due to external sources decreased to only 0.13 kWhe/m3, a fifth of the value calculated for Scenario 0, which is well below the lowest estimate for the RO processes [13,14,15]. Although costs for RO desalination are expected to decrease in the next years after the integration between conventional and emerging membrane technologies [62] and a shift from the current electricity production mix to a predominantly renewable energy production [63], it has to be considered that such costs will remain highly affected by the distance from the source (seawater) to the final user [64]. The abovementioned facts make the reuse of treated wastewater in mining facilities of great importance for a sustainable development of the Chilean copper mining industry, coherently with the circular economy paradigm.
3.2. Environmental Assessment
The energy calculations reported in Section 3.1 demonstrated that the changes introduced into the original scheme could allow the Antofagasta WWTP to become an energy-neutral (or nearly energy-neutral) plant. After the introduction of the sections of primary sedimentation, predenitrification, and AD, the unit energy cost of the treated wastewater due to external sources was reduced by approx. 80%. That had also some evident positive environmental impacts.
The production of electricity from fossil fuels is associated with the emission of anthropogenic CO2 and GHGs, which are recognized as the main causes of the global warming and, consequently, climate change. CO2 emission can be limited through two principal strategies, namely the reduction in the energy demand, by using more efficient processes or pieces of equipment, and the production of energy from renewable sources [57]. The changes to the original scheme of the WWTP introduced by Scenarios 1, 2, and 3 proved to be capable of achieving both these two goals, that is the reduction in the electric energy demand (in Scenario 2 and 3 only) and the production of renewable energy from AD (in all Scenarios), as detailed in Table 8.
In Chile, based on the national energy mix, the average CO2 emission factor associated with the production of electricity is 0.308 kg CO2-equivalent/kWhe [56]. Consequently, the changes introduced in the original WWTP scheme would make it possible to reduce CO2 emissions from approx. 660 tons CO2-equivalent/y, in Scenario 1, to approx. 4400 tons CO2-equivalent/y in the most optimistic scenario, which is Scenario 3.
3.3. Economic Assessment
The sustainability of the changes introduced into the WWTP original scheme with Scenarios 1, 2, and 3 was analyzed also from an economic viewpoint. As detailed in Section 2.3, the cost items considered in the economic assessment were the CAPEX and OPEX, which are the investment costs for the supply and installation of the pieces of equipment, and the costs for operation and management, respectively. The OPEX include maintenance, which was estimated at 6% of the CAPEX, electric energy supply from sources external to the WWTP, and recovery or disposal of stabilized sludge.
The CAPEX cost items are reported in Table 9 and were determined starting from the key parameters of each piece of equipment. The total investment cost for Scenario 0 was calculated at 39,581,000 $. As can be seen from Table 9, the introduction of the AD process determined an increase in the initial investment costs of approx. 15%. Conversely, the introduction of the section of the primary sedimentation and the compartmentation of the CAS tank in the two anoxic-oxic units, in addition to the AD process, increased the initial investment costs by approx. 25%.
The economic benefit was assessed by comparing the IRR values calculated for each scenario. Two destinations for the stabilized sludge, namely the recovery in agriculture and the disposal in landfill, were considered. As anticipated in Section 2.3, the cost for electricity was fixed at 0.129 $/kWhe [51]. The values of the IRR returned by the economic analysis are listed in Table 10.
The results of Table 10 show that, not surprisingly, the recovery in agriculture of sludge after AD was a more profitable solution than disposal in a landfill. In the case of digestate recovery at no costs, the comparison among the three scenarios revealed that Scenario 1 was the most profitable, even if the difference among the three IRR values was not so significant. Scenario 1 had a higher value of IRR because the saved electric energy (see Table 10) was not sufficient to compensate the increased costs due to the implementation of the primary settlers and the compartmentation of the CAS tank. Conversely, if digestate disposal in landfill is considered, Scenarios 2 and 3, where the saved energy was at the highest values, appeared more advantageous than Scenario 1.
However, a more realistic assessment must consider the actual amount of sludge TS that can be recovered with agricultural practices. The yearly amount of dry sludge produced by the Antofagasta WWTP, after AD, will be of approx. 1.1·1010 g (see Table 5). According to the data from Ministerio de Agricultura [65], the agricultural soil area in the region of Antofagasta is in the order of 2400 hectares, 65% of which is dedicated to fodder plants, vegetables, and cereals, which are cultures that can be fertilized with stabilized sludge. Recent studies report the values of the sludge application rates to agricultural soils ranging from 1–4·106 g TS/ha·y [66] up to 20·106 g TS/ha·y [67]. Consequently, under the worst condition, only approx. 1/8 of the sludge produced in the new WWTP of Antofagasta can be accommodated in the agricultural soils of the region. Conversely, under the most optimistic condition, recovery in agriculture can be considered a feasible option for all the produced sludge.
4. Conclusions
This paper presented a case study where the impact of some changes, to be possibly introduced into the original project of a new WWTP, was assessed with the tool of the 3-E analysis. The analysis was performed by integrating some mechanistic models used for WWTP optimization, with energy balances and economic metrics. This holistic approach, applied to a real case, proved to be successful in quantifying the improvements in the energy and environmental performances of the WWTP, with a complementary assessment of the economic feasibility of the operation.
Specifically, this paper analyzed the case of the city of Antofagasta, where, at present, only 10% of the wastewater generated in the city is treated in a WWTP and subsequently reused for industrial purposes. The remaining 90% is discharged into the ocean after the application of only preliminary treatments. In the next years, a new WWTP will increase both the wastewater treatment capacity of the city (from 120 to 900 L/s) and the reuse rate in the local mining sector up to 100% of the reused wastewater. That will achieve an important environmental benefit, compared with the option of using desalinated water or freshwater for mining activities. However, the new WWTP was put out to tender under a very traditional design concept, not fully capable of obtaining high energy, economic, and environmental performances.
The results of the study demonstrated that
- The introduction of an AD process (Scenario 1) to stabilize the sludge before reuse in agriculture or disposal in a landfill could save approx. 12% of the electric energy supplied to the WWTP, with an inherent reduction in CO2 equivalent emission of 660 tons/y;
- The introduction of an AD process and of a section of primary sedimentation (Scenario 2) could reduce the amount of electric energy supplied to the WWTP from external sources to only 30% of the WWTP original scheme (Scenario 0), thus avoiding the emission of 3800 tons CO2 equivalent/y. Such a benefit was made possible because of the significant increase in the produced renewable energy (+260% with respect to Scenario 1) and the decrease in the energy demand due to the aeration process (−30% with respect to Scenarios 0 and 1);
- The implementation of an oxic—anoxic partition of the CAS tank, other than AD and primary sedimentation, (Scenario 3) allowed the WWTP to reduce its electric energy demand from external sources to only 20% of that of Scenario 0, thus avoiding the emission of 4390 tons CO2 equivalent/y. The present requirement on the nitrogen concentration in the wastewater to be discharged or reused for mining activities does not require the presence of nitrification–denitrification processes. However, a nitrification—denitrification scheme makes it possible to consume an aliquot of the residual biodegradable organic substance at no free oxygen expenses, thus saving the corresponding aliquot of electric energy necessary for the aeration process.
Although costs for desalination are expected to decrease in the next years, it has to be considered that such costs will remain highly affected by the distance from the ocean to the final user. The abovementioned facts make (i) the changes, introduced with Scenarios 1, 2 and 3, essential to promote the transformation of a WWTP into a WRRF and (ii) the reuse of treated wastewater in mining facilities strategic for a sustainable development of the Chilean copper mining industry, coherently with the goals fixed by the Chilean State and the circular economy paradigm. Finally, it was demonstrated that the methodology used in this paper could be easily extended to other case studies, thus offering a reliable tool to engineers and plant designers called to perform scenario-analyses.
Supplementary Materials
The following supporting information can be downloaded at: https://www.mdpi.com/article/10.3390/w15061221/s1.
Author Contributions
Conceptualization, G.C.; methodology, G.C.; software, G.C.; validation, G.C. and B.R.; formal analysis, G.C.; investigation, G.C.; resources, A.R. and M.Z.; data curation, G.C. and B.R.; writing—original draft preparation, G.C. and B.R.; writing—review and editing, B.R., A.R. and M.Z.; visualization, B.R. and G.C.; supervision, all; project administration, B.R. and M.Z.; funding acquisition, M.Z. All authors have read and agreed to the published version of the manuscript.
Funding
This research was funded by the European Commission under H2020-MSCA-RISE-2018 program, grant number 823948, through the project “REMIND—Renewable Energies for Water Treatment and Reuse in Mining Industries”.
Institutional Review Board Statement
Not applicable.
Informed Consent Statement
Not applicable.
Data Availability Statement
Not applicable.
Acknowledgments
This study was carried out in the framework of the project “REMIND—Renewable Energies for Water Treatment and Reuse in Mining Industries”. G.C. is grateful to the Departamento de Ingeniería en Minas, Universidad de Antofagasta, Antofagasta (Chile) for providing the research facilities during his visiting period.
Conflicts of Interest
The authors declare no conflict of interest. The funders had no role in the design of the study; in the collection, analyses, or interpretation of data; in the writing of the manuscript; or in the decision to publish the results.
References
- Tzanakakis, V.A.; Paranychianakis, N.V.; Angelakis, A.N. Water Supply and Water Scarcity. Water 2020, 12, 2347. [Google Scholar] [CrossRef]
- He, C.; Liu, Z.; Wu, J.; Pan, X.; Fang, Z.; Li, J.; Bryan, B.A. Future global urban water scarcity and potential solutions. Nat. Commun. 2021, 12, 4667. [Google Scholar] [CrossRef] [PubMed]
- Herrera-León, S.; Cruz, C.; Negrete, M.; Chacana, J.; Cisternas, L.A.; Kraslawski, A. Impact of seawater desalination and wastewater treatment on water stress levels and greenhouse gas emissions: The case of Chile. Sci. Total Environ. 2022, 818, 151853. [Google Scholar] [CrossRef] [PubMed]
- Arcadis. Plan Estratégico para la Gestión de los Recursos Hídricos, Región de Antofagasta, Informe Final. 2016. Available online: https://snia.mop.gob.cl/sad/ADM5702.pdf (accessed on 23 February 2023).
- Pérez-Carrera, A.; Cirelli, A.F. Arsenic and water quality challenges in South America. In Water and Sustainability in Arid Regions; Schneier-Madanes, G., Courel, M.F., Eds.; Springer: Dordrecht, The Netherlands, 2010. [Google Scholar] [CrossRef]
- Tiwari, A.K.; Suozzi, E.; Silva, C.; De Maio, M.; Zanetti, M. Role of Integrated Approaches in Water Resources Management: Antofagasta Region, Chile. Sustainability 2021, 13, 1297. [Google Scholar] [CrossRef]
- Banco Central de Chile, 2022. Boletín Estadístico 90 (1203). Available online: https://www.bcentral.cl/documents/33528/133431/BE20220307.pdf/fb1cd9f3-cfc7-33f3-a3c4-372d7cb7a3f8?t=1646430070440 (accessed on 23 February 2023).
- Prieto, M.; Calderón-Seguel, M.; Fragkou, M.C.; Fuster, R. The (not-so-free) Chilean water model. The case of the Antofagasta Region, Atacama Desert, Chile. Extr. Ind. Soc. 2022, 11, 101081. [Google Scholar] [CrossRef]
- Aitken, D.; Rivera, D.; Godoy-Faúndez, A.; Holzapfel, E. Water Scarcity and the Impact of the Mining and Agricultural Sectors in Chile. Sustainability 2016, 8, 128. [Google Scholar] [CrossRef] [Green Version]
- Jerez, B.; Garcés, I.; Torres, R. Lithium extractivism and water injustices in the Salar de Atacama, Chile: The colonial shadow of green electromobility. Political Geogr. 2021, 87, 102382. [Google Scholar] [CrossRef]
- COCHILCO, Comisión Chilena del Cobre, Ministerio de Minería, Gobierno de Chile. Recursos Hidricos en la Minería del Cobre. Actualizacion 2020. Available online: https://www.cochilco.cl/Listado%20Temtico/Informe%20recursos%20hidricos%20en%20la%20mineria%20del%20cobre%202020.pdf (accessed on 23 February 2023).
- COCHILCO, Comisión Chilena del Cobre, Ministerio de Minería, Gobierno de Chile. Consumo de Agua en Minería del Cobre: Las Proyecciones de Cochilco para 2021–2032. Available online: https://www.cochilco.cl/Listado%20Temtico/Informe%20proyeccion%20consumo%20agua%202020-2032%20rpi.pdf (accessed on 23 February 2023).
- Cornejo, P.K.; Santana, M.V.; Hokanson, D.R.; Mihelcic, J.R.; Zhang, Q. Carbon footprint of water reuse and desalination: A review of greenhouse gas emissions and estimation tools. J. Water Reuse Desalin. 2014, 4, 238–252. [Google Scholar] [CrossRef]
- Herrera-León, S.; Cruz, C.; Kraslawski, A.; Cisternas, L.A. Current situation and major challenges of desalination in Chile. Desalin. Water Treat. 2019, 171, 93–104. [Google Scholar] [CrossRef]
- Alvez, A.; Aitken, D.; Rivera, D.; Vergara, M.; McIntyre, N.; Concha, F. At the crossroads: Can desalination be a suitable public policy solution to address water scarcity in Chile’s mining zones? J. Environ. Manag. 2020, 258, 110039. [Google Scholar] [CrossRef]
- Odell, S.D. Desalination in Chile’s mining regions: Global drivers and local impacts of a technological fix to hydrosocial conflict. J. Clean. Prod. 2021, 323, 129104. [Google Scholar] [CrossRef]
- Campero, C.; Harris, L.M. The Legal Geographies of Water Claims: Seawater Desalination in Mining Regions in Chile. Water 2019, 11, 886. [Google Scholar] [CrossRef] [Green Version]
- Crutchik, D.; Campos, J.L. Municipal Wastewater Reuse: Is it a Competitive Alternative to Seawater Desalination? Sustainability 2021, 13, 6815. [Google Scholar] [CrossRef]
- Ghorbani, Y.; Kuan, S.H. A review of sustainable development in the Chilean mining sector: Past, present and future. Int. J. Min. Reclam. Environ. 2017, 31, 137–165. [Google Scholar] [CrossRef]
- ECONSSA Chile, 2019. Declaración de Impacto Ambiental. Nueva Planta de Tratamiento de Agua Servidas para Reúso de Antofagasta. Available online: https://seia.sea.gob.cl/expediente/ficha/fichaPrincipal.php?modo=ficha&id_expediente=2148885257 (accessed on 23 February 2023).
- Gu, Y.; Li, Y.; Li, X.; Luo, P.; Wang, H.; Robinson, Z.P.; Wang, X.; Wu, J.; Li, F. The feasibility and challenges of energy self-sufficient wastewater treatment plants. Appl. Energy 2017, 204, 1463–1475. [Google Scholar] [CrossRef] [Green Version]
- Mannina, G.; Alduina, R.; Badalucco, L.; Barbara, L.; Capri, F.C.; Cosenza, A.; Di Trapani, D.; Gallo, G.; Laudicina, V.A.; Muscarella, S.M.; et al. Water Resource Recovery Facilities (WRRFs): The Case Study of Palermo University (Italy). Water 2021, 13, 3413. [Google Scholar] [CrossRef]
- Faragò, M.; Damgaard, A.; Madsen, J.A.; Andersen, J.K.; Thornberg, D.; Andersen, M.H.; Rygaard, M. From wastewater treatment to water resource recovery: Environmental and economic impacts of full-scale implementation. Water Res. 2021, 204, 117554. [Google Scholar] [CrossRef]
- Romero-Güiza, M.S.; Flotats, X.; Asiain-Mira, R.; Palatsi, J. Enhancement of sewage sludge thickening and energy self-sufficiency with advanced process control tools in a full-scale wastewater treatment plant. Water Res. 2022, 222, 118924. [Google Scholar] [CrossRef]
- Jafarinejad, S. A framework for the design of the future energy-efficient, cost-effective, reliable, resilient, and sustainable full-scale wastewater treatment plants. Curr. Opin. Environ. Sci. Health 2020, 13, 91–100. [Google Scholar] [CrossRef]
- Ruffino, B.; Campo, G.; Crutchik, D.; Reyes, A.; Zanetti, M. Drinking Water Supply in the Region of Antofagasta (Chile): A Challenge between Past, Present and Future. Int. J. Environ. Res. Public Health 2022, 19, 14406. [Google Scholar] [CrossRef]
- Jeldres, R.I.; Arancibia-Bravo, M.P.; Reyes, A.; Aguirre, C.E.; Cortes, L.; Cisternas, L.A. The impact of seawater with calcium and magnesium removal for the flotation of copper-molybdenum sulphide ores. Miner. Eng. 2017, 109, 10–13. [Google Scholar] [CrossRef]
- Metcalf & Eddy Inc.; Tchobanoglous, G.; Burton, F.L.; Tsuchihashi, R.; Stensel, H.D. Wastewater Engineering: Treatment and Resource Recovery, 5th ed.; McGraw-Hill Professional: New York, NY, USA, 2013; ISBN 10:9780073401188. [Google Scholar]
- Ruffino, B.; Campo, G.; Cerutti, A.; Scibilia, G.; Lorenzi, E.; Zanetti, M. Comparative analysis between a conventional and a temperature-phased anaerobic digestion system: Monitoring of the process, resources transformation and energy balance. Energy Convers. Manag. 2020, 223, 113463. [Google Scholar] [CrossRef]
- Gujer, W.; Henze, M.; Mino, T.; van Loosdrecht, M.C.M. Activated sludge model No. 3. Water Sci. Technol. 1999, 39, 183–193. [Google Scholar] [CrossRef]
- Henze, M.; Gujer, W.; Mino, T.; van Loosdrecht, M.C.M. Activated Sludge Models ASM1, ASM2, ASM2d and ASM3; IWA Publishing: London, UK, 2000. [Google Scholar]
- Takács, I.; Patry, G.G.; Nolasco, D. A dynamic model of the clarification-thickening process. Water Res. 1991, 25, 1263–1271. [Google Scholar] [CrossRef]
- Henze, M.; van Loosdrecht, M.C.; Ekama, G.A.; Brdjanovic, D. Biological Wastewater Treatment; IWA Publishing: London, UK, 2008. [Google Scholar]
- Liu, Y.; Gu, J.; Zhang, M. AB Processes: Towards Energy Self-Sufficient Municipal Wastewater Treatment; IWA Publishing: London, UK, 2019. [Google Scholar]
- GPS-X, version 6.5; GPS-X Technical Reference; Hydromantis Environmental Software Solutions, Inc.: Hamilton, ON, Canada, 2016.
- Pons, M.N.; Spanjers, H.; Baetens, D.; Nowak, O.; Gillot, S.; Nouwen, J.; Schuttin, N. Wastewater characteristics in Europe—A survey. Eur. Water Manag. Online 2004, 4, 10. [Google Scholar]
- Borzooei, S.; Simonetti, M.; Scibilia, G.; Zanetti, M.C. Critical evaluation of respirometric and physicochemical methods for characterization of municipal wastewater during wet-weather events. J. Environ. Chem. Eng. 2021, 9, 105238. [Google Scholar] [CrossRef]
- Panepinto, D.; Fiore, F.; Zappone, M.; Genon, G.; Meucci, L. Evaluation of the energy efficiency of a large wastewater treatment plant in Italy. Appl. Energy 2016, 161, 404–411. [Google Scholar] [CrossRef]
- Elshaw, A.; Hassan, N.M.S.; Khan, M.M.K. Computational Fluid Dynamic Modelling and Optimisation of Wastewater Treatment Plant Bioreactor Mixer. Energies 2018, 11, 3530. [Google Scholar] [CrossRef] [Green Version]
- Available online: https://www.xylem.com/it-it/brands/sanitaire/sanitaire-prodotti/silver-series-ii-lp-membrane-disc-diffusers/documentation/ (accessed on 23 February 2023).
- European Standard: Wastewater Treatment Plants—Part 15: Measurement of the Oxygen Plants—Part 15: Measurement of the Oxygen Aeration Tanks. 2003, pp. 1–16. Available online: https://www.en-standard.eu/bs-en-12255-15-2003-wastewater-treatment-plants-measurement-of-the-oxygen-transfer-in-clean-water-in-aeration-tanks-of-activated-sludge-plants (accessed on 23 February 2023).
- American Society of Civil Engineers. Measurement of Oxygen Transfer in Clean Water ASCE Standard; ASCE/EWRI 2-06; American Society of Civil Engineers: Reston, VA, USA, 2007. [Google Scholar]
- Jiang, L.M.; Chen, L.; Zhou, Z.; Sun, D.; Li, Y.; Zhang, M.; Liu, Y.; Du, S.; Chen, G.; Yao, J. Fouling characterization and aeration performance recovery of fine-pore diffusers operated for 10 years in a full-scale wastewater treatment plant. Bioresour. Technol. 2020, 307, 123197. [Google Scholar] [CrossRef]
- Baquero-Rodríguez, G.A.; Lara-Borrero, J.A.; Nolasco, D.; Rosso, D. A Critical Review of the Factors Affecting Modeling Oxygen Transfer by Fine-Pore Diffusers in Activated Sludge. Water Environ. Res. 2018, 90, 431–441. [Google Scholar] [CrossRef]
- Rosso, D.; Iranpour, R.; Stenstrom, M.K. Fifteen Years of Offgas Transfer Efficiency Measurements on Fine-Pore Aerators: Key Role of Sludge Age and Normalized Air Flux. Water Environ. Res. 2005, 77, 266–273. [Google Scholar] [CrossRef] [PubMed]
- Ćetković, J.; Knežević, M.; Lakić, S.; Žarković, M.; Vujadinović, R.; Živković, A.; Cvijović, J. Financial and Economic Investment Evaluation of Wastewater Treatment Plant. Water 2022, 14, 122. [Google Scholar] [CrossRef]
- Sanaye, S.; Yazdani, M. Energy, exergy, economic and environmental analysis of a running integrated anaerobic digester-combined heat and power system in a municipal wastewater treatment plant. Energy Rep. 2022, 8, 9724–9741. [Google Scholar] [CrossRef]
- Mirmasoumi, S.; Saray, R.K.; Ebrahimi, S. Evaluation of thermal pretreatment and digestion temperature rise in a biogas fueled combined cooling, heat, and power system using exergo-economic analysis. Energy Convers. Manag. 2018, 163, 219–238. [Google Scholar] [CrossRef]
- Available online: https://www.toweringskills.com/financial-analysis/cost-indices (accessed on 23 February 2023).
- Wendland, A.; Ozoguz, Y. Operation Costs of Wastewater Treatment Plants. EMWater E-Learing Course. Ahrensburg, Germany. 2005. Available online: https://cgi.tu-harburg.de/~awwweb/wbt/emwater/documents/lesson_c2.pdf (accessed on 23 February 2023).
- Available online: https://www.globalpetrolprices.com/Chile/electricity_prices/ (accessed on 23 February 2023).
- Gillot, S.; De Clercq, B.; Defour, D.; Simoens, F.; Gernaey, K.; Vanrolleghem, P.A. Optimization of wastewater treatment plant design and operation using simulation and cost analysis. In Proceedings of the 72nd Annual WEF Conference and Exposition, New Orleans, LA, USA, 9–13 October 1999; Available online: https://www.researchgate.net/publication/2304372_Optimization_Of_Wastewater_Treatment_Plant_Design_And_Operation_Using_Simulation_And_Cost_Analysis (accessed on 23 February 2023).
- Neumann, P.; Riquelme, C.; Cartes, J.; Kuschel-Otárola, M.; Hospido, A.; Vidal, G. Relevance of sludge management practices and substance modeling in LCA for decision-making: A case study in Chile. J. Environ. Manag. 2022, 324, 116357. [Google Scholar] [CrossRef]
- Cartes, J.; Neumann, P.; Hospido, A.; Vidal, G. Life cycle assessment of management alternatives for sludge from sewage treatment plants in Chile: Does advanced anaerobic digestion improve environmental performance compared to current practices? J. Mater. Cycles Waste Manag. 2018, 20, 1530–1540. [Google Scholar] [CrossRef]
- Wastewater: From Waste to Resource-The Case of Santiago, Chile. Group. World Bank. 2019. Available online: https://openknowledge.worldbank.org/handle/10986/32744 (accessed on 23 February 2023).
- Available online: http://energiaabierta.cl/visualizaciones/factor-de-emision-sic-sing/ (accessed on 23 February 2023).
- Sarpong, G.; Gude, V.G. Near Future Energy Self-sufficient Wastewater Treatment Schemes. Int. J. Environ. Res. 2020, 14, 479–488. [Google Scholar] [CrossRef]
- Dolejš, P.; Varga, Z.; Luza, B.; Pícha, A.; Jeníček, P.; Jeison, D.; Bartáček, J. Maximizing energy recovery from wastewater via bioflocculation-enhanced primary treatment: A pilot scale study. Environ. Technol. 2021, 42, 2229–2239. [Google Scholar] [CrossRef] [PubMed]
- Ruffino, B.; Cerutti, A.; Campo, G.; Scibilia, G.; Lorenzi, E.; Zanetti, M. Thermophilic vs. mesophilic anaerobic digestion of waste activated sludge: Modelling and energy balance for its applicability at a full scale WWTP. Renew. Energy 2020, 156, 235–248. [Google Scholar] [CrossRef]
- Wan, J.; Gu, J.; Zhao, Q.; Liu, Y. COD capture: A feasible option towards energy self-sufficient domestic wastewater treatment. Sci. Rep. 2016, 6, 25054. [Google Scholar] [CrossRef] [Green Version]
- Rani, A.; Snyder, S.W.; Kim, H.; Lei, Z.; Pan, S.-Y. Pathways to a net-zero-carbon water sector through energy-extracting wastewater technologies. NPJ Clean Water 2022, 5, 49. [Google Scholar] [CrossRef]
- Santoro, S.; Estay, H.; Avci, A.H.; Pugliese, L.; Ruby-Figueroa, R.; Garcia, A.; Aquino, M.; Nasirov, S.; Straface, S.; Curcio, E. Membrane technology for a sustainable copper mining industry: The Chilean paradigm. Clean. Eng. Technol. 2021, 2, 100091. [Google Scholar] [CrossRef]
- Molinos-Senante, M.; González, D. Evaluation of the economics of desalination by integrating greenhouse gas emission costs: An empirical application for Chile. Renew. Energy 2019, 133, 1327–1337. [Google Scholar] [CrossRef]
- Ihle, C.F.; Kracht, W. The relevance of water recirculation in large scale mineral processing plants with a remote water supply. J. Clean. Prod. 2018, 177, 34–51. [Google Scholar] [CrossRef]
- Available online: https://www.minagri.gob.cl/region/ii-region-de-antofagasta/ (accessed on 23 February 2023).
- Kirchmann, H.; Börjesson, G.; Kätterer, T.; Cohen, Y. From agricultural use of sewage sludge to nutrient extraction: A soil science outlook. Ambio 2017, 46, 143–154. [Google Scholar] [CrossRef] [Green Version]
- Melo, W.; Delarica, D.; Guedes, A.; Lavezzo, L.; Donha, R.; de Araújo, A.; de Melo, G.; Macedo, F. Ten years of application of sewage sludge on tropical soil. A balance sheet on agricultural crops and environmental quality. Sci. Total Environ. 2018, 643, 1493–1501. [Google Scholar] [CrossRef] [Green Version]
Figure 1.
Scheme of the new Antofagasta WWTP [20].
Figure 1.
Scheme of the new Antofagasta WWTP [20].

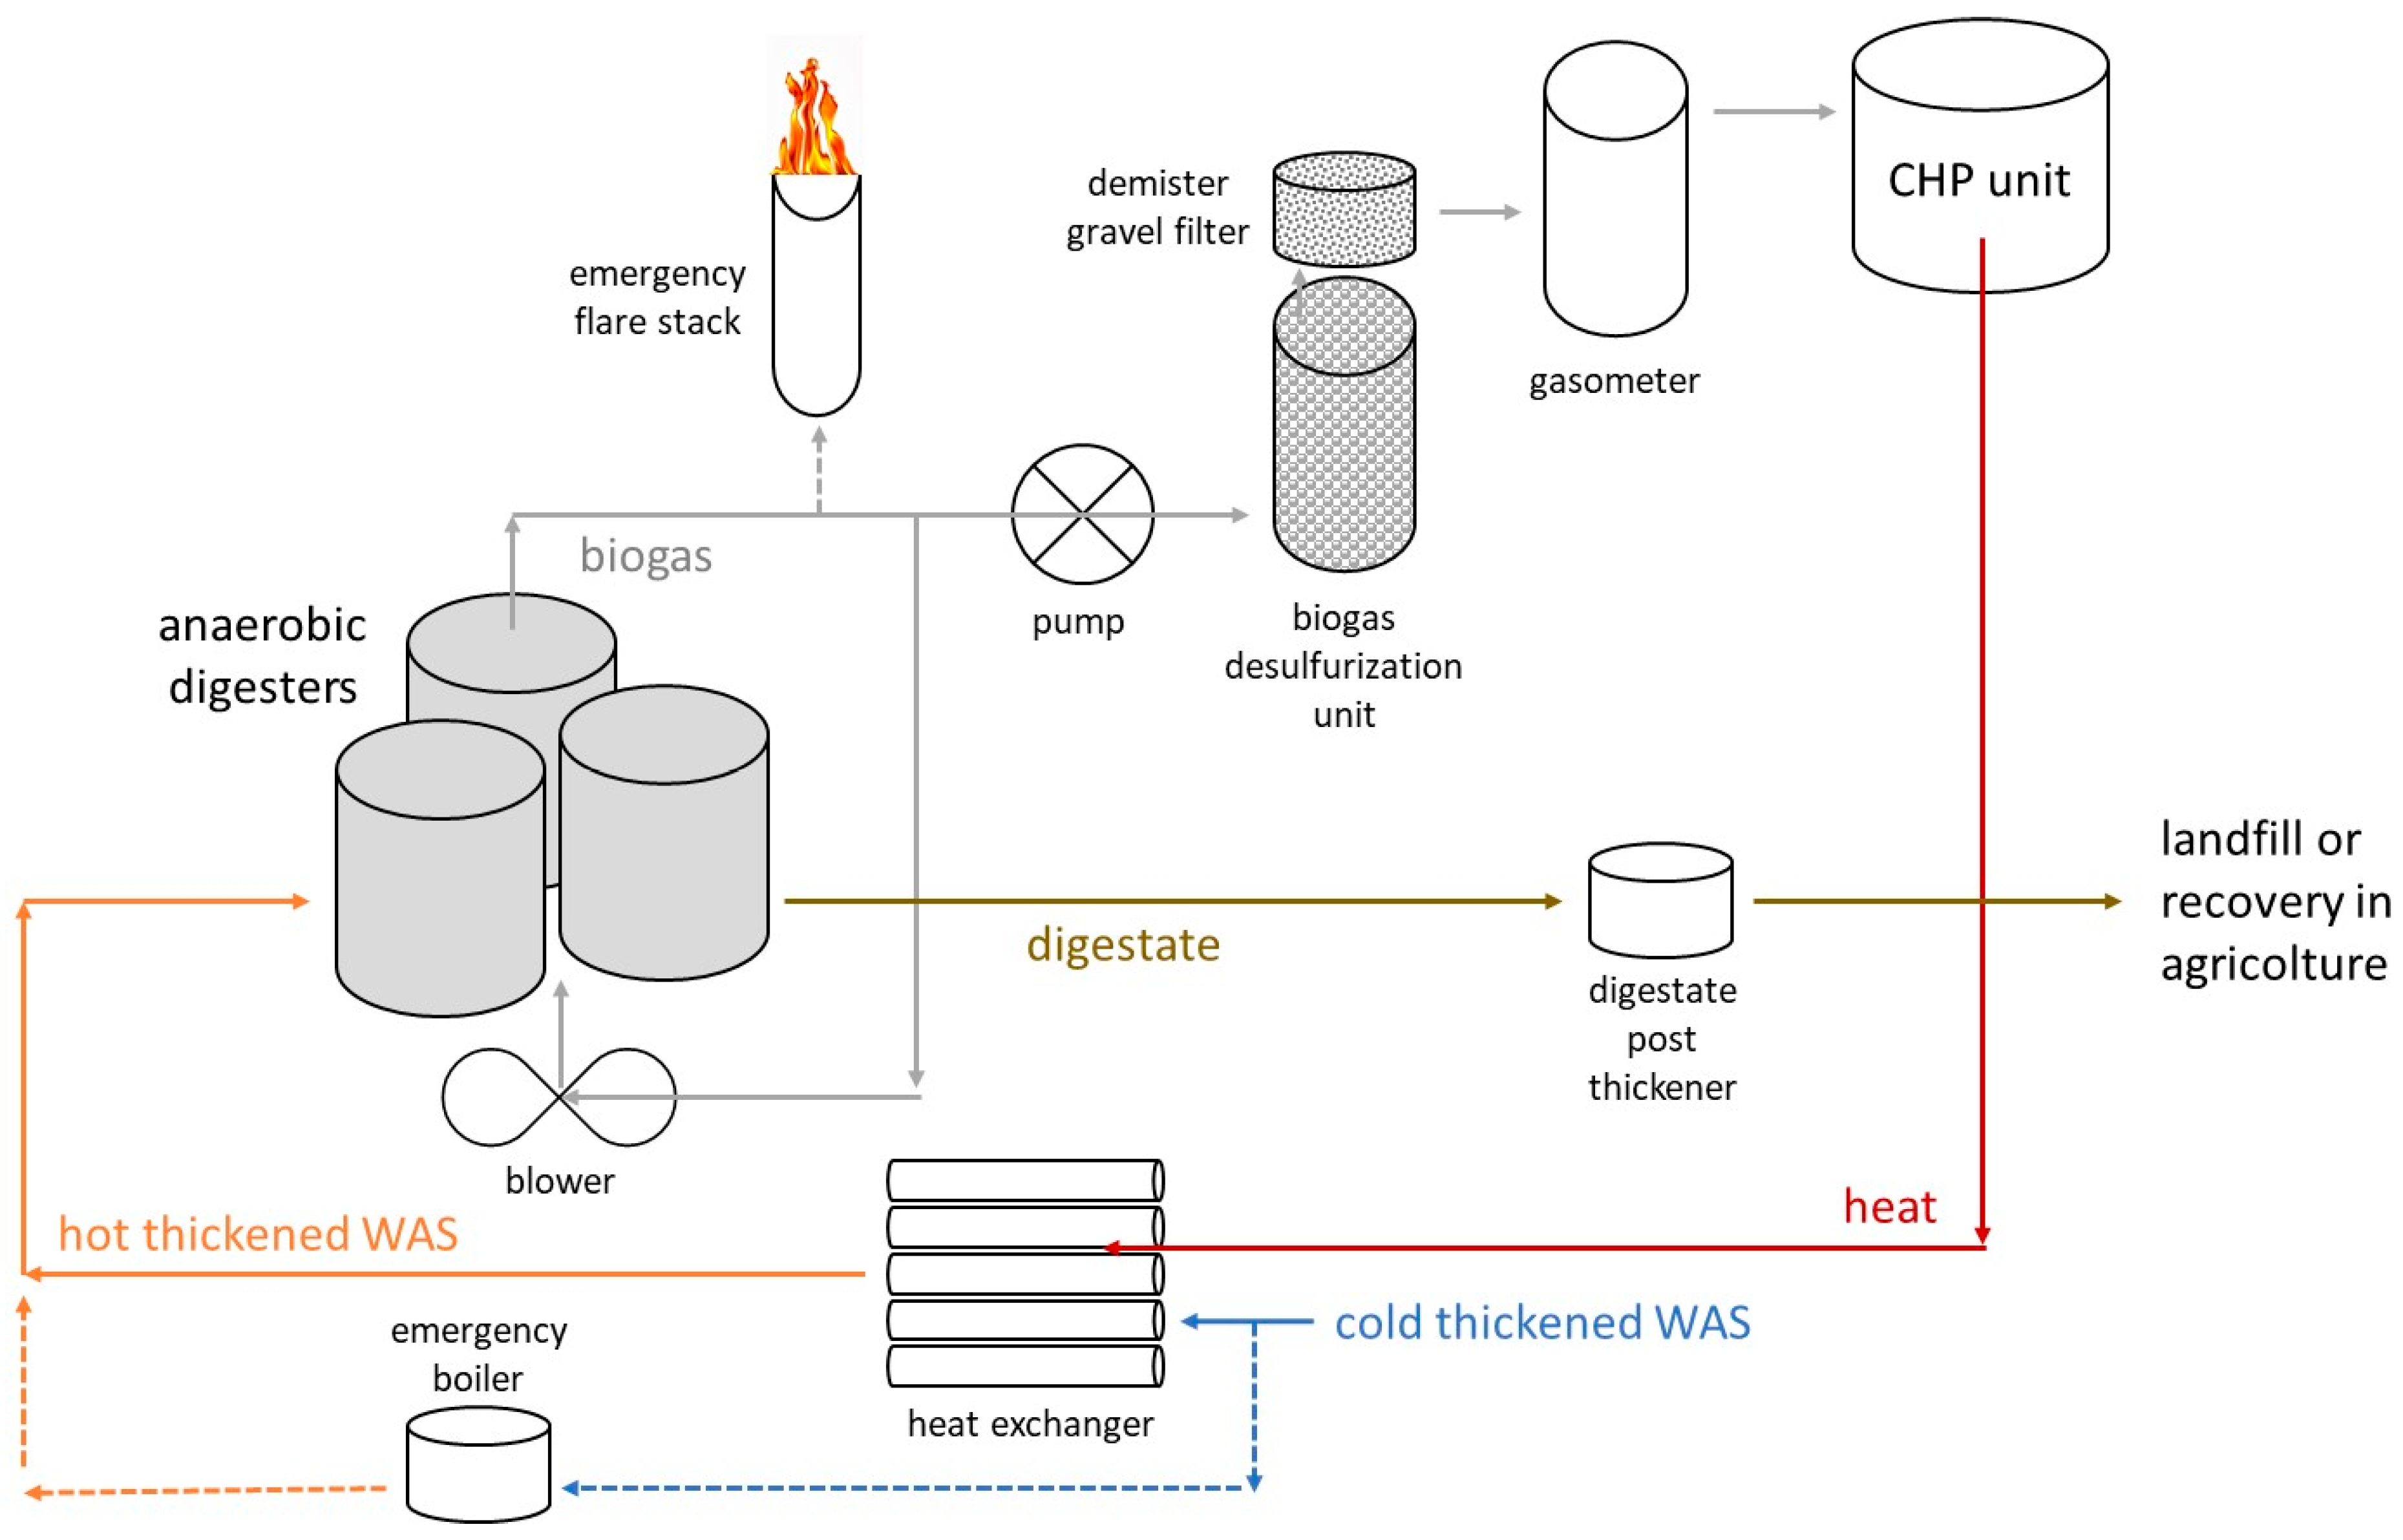
Figure 2.
Pieces of equipment necessary for the implementation of the AD process.

Figure 3.
Energy demand due to the aeration process and to the other processes, together with the amount of renewable energy generated by the WWTP and the residual amount of energy that must be supplied from external sources for each of the considered scenarios.
Figure 3.
Energy demand due to the aeration process and to the other processes, together with the amount of renewable energy generated by the WWTP and the residual amount of energy that must be supplied from external sources for each of the considered scenarios.

Table 1.
Characteristics of the wastewater at the inlet of the planned WWTP [20] and concentration values at the outlet allowed by D.S. 90/2000.
Table 1.
Characteristics of the wastewater at the inlet of the planned WWTP [20] and concentration values at the outlet allowed by D.S. 90/2000.
| Parameter | Unit | After Preliminary Treatments | D.S. 90/2000 Threshold Values (*) |
|---|---|---|---|
| Temperature | °C | >20 | N.A. |
| pH | 7.7 | 6–9 | |
| Fats and oils | mg/L | 75 | 20 |
| TSS | mg/L | 225 | 80 |
| BOD5 | mg/L | 242 | 35 |
| TKN | mg/L | 51 | 50 |
| TP | mg/L | 5 | 10 |
| Chloride | mg/L | 999 | N.A. |
| Alkalinity | mg/L as CaCO3 | 286 | N.A. |
| Total coliforms | CFU/100 mL | N.A. | 1000 |
Notes: TSS, total suspended solids; CFU, colony-forming unit. (*) D.S.90/2000 of MINSEGPRES “Establece norma de emisión para la regulación de contaminantes asociados a las descargas de residuos líquidos a aguas marinas y continentales superficiales”.
Table 2.
List of the pieces of equipment necessary to implement Scenario 1, 2, and 3, key parameters and design criteria.
Table 2.
List of the pieces of equipment necessary to implement Scenario 1, 2, and 3, key parameters and design criteria.
| Unit of Process | Parameter and Design Criteria | Equation | Reference |
|---|---|---|---|
| Primary settlers | Wastewater design flow rate, QWW Surface-loading rate, SLR | Primary settler area | [28] |
| Anaerobic digesters | Sludge average flow rate, Qsludge HRT anaerobic digesters Vwork/Vtot ratio | Digester—working volume Digester—total volume | [29] |
| CHP unit | Methane flowrate, QCH4 Methane LHV, LHVCH4 Electric efficiency, ηel Thermal efficiency, ηth | Electric power Thermal power | [29] |
| Gasometer | Biogas flowrate, Qb HRT gasometer | Gasometer volume | [29] |
| Back-up boiler | CHP unit thermal power, WCHP,th | [28] | |
| Heat exchanger | Max temperature sludge, Ts,max Min temperature sludge, Ts,min Max temperature hot water, Tw,max Min temperature hot water, Tw,min Heat transfer coefficient, U Thermal power to transfer to water to sludge, Wws | Heat exchanger area Logarithmic mean temperature difference, LMTD | [28] |
| Flare stack | Time necessary to burn the total daily production of biogas, t | τ = 1 d | [28] |
| Post-thickener storage tank | Digestate average flow rate, Qdig Digestate average mass flow rate, Mdig HRT post-thickener Solid loading rate, SoLR | Post-thickener total surface Post-thickener total volume | [28] |
Table 3.
Electricity demand of the processes or pieces of equipment involved in the four scenarios.
| Specific Electricity Consumption (Whe/e.i.·d) | Electricity Demand (kW) | ||||
|---|---|---|---|---|---|
| Scenario 0 | Scenario 1 | Scenario 2 | Scenario 3 | ||
| Secondary settlers | 0.19 | 2.5 | 2.5 | 2.5 | 2.5 |
| Pumps for WAS and RAS handling | 5.03 | 65.8 | 65.8 | 65.8 | 65.8 |
| WAS thickening | 1.71 | 22.4 | 22.4 | 22.4 | 22.4 |
| Anaerobic digesters | 9.51 | 0 | 124.3 | 124.3 | 124.3 |
| Post-thickening | 0.02 | 0 | 0.3 | 0.3 | 0.3 |
| Dewatering screw press | 4.03 | 52.7 | 52.7 | 52.7 | 52.7 |
| CHP unit | 0.80 | 0 | 10.5 | 10.5 | 10.5 |
| Primary settlers | 0.62 | 0 | 0 | 8.1 | 8.1 |
| Anoxic tank mixing | 11.75 | 0 | 0 | 0 | 153.6 |
| Total (kW) | - | 140.9 | 276.0 | 284.1 | 437.7 |
Table 5.
Main outputs of the simulation models.
| Parameter | Scenario 0 | Scenario 1 | Scenario 2 | Scenario 3 | |
|---|---|---|---|---|---|
| anoxic | oxic | ||||
| MLSS (mg/L) | 6775 | 6775 | 3600 | 3612 | 3610 |
| OD (kg/d) | 6049 | 6049 | 4675 | 0 | 3951 |
| α factor (dimensionless) | 0.36 | 0.36 | 0.39 | - | 0.41 |
| NH4-N (mg/L) | 1 | 1 | 1 | 25 | 1 |
| NO3-N (mg/L) | 38 | 38 | 43 | 2 | 24 |
| WAS (kg TSS/d) | 37,177 | 37,177 | 19,755 | 19,815 | |
| PS (kg TSS/d) | - | - | 22,363 | 22,363 | |
| Stabilized sludge/digestate (kg TSS/d) | 48,910 * | 33,140 | 30,310 | 30,200 | |
| Stabilized sludge/digestate, 25% TSS (ton/d) | 195.6 | 132.6 | 121.2 | 120.8 | |
Note: * comprehensive of the CaO addition.
Table 6.
Characteristics of the pieces of equipment to be implemented into Scenarios 1, 2, 3.
| Pieces of Equipment | Scenario 1 | Scenario 2 | Scenario 3 |
|---|---|---|---|
| Primary settlers, area (m2) | 0 | 1944 | 1944 |
| Primary settlers, number | 0 | 6 | 6 |
| Primary settlers, diameter (m) | 0 | 20 | 20 |
| Anaerobic digesters, volume (m3) | 18,700 | 21,000 | 21,100 |
| Gasometer, volume (m3) | 660 | 1745 | 1778 |
| Back-up boiler, power (W) | 308 | 818 | 837 |
| Heat exchanger, area (m2) | 17.7 | 20 | 20 |
| Digestate post-thickener, area (m2) | 375 | 420 | 420 |
| Digestate post-thickener, volume (m3) | 750 | 841 | 841 |
Table 7.
Details of the AD outputs.
| Parameter | Scenario 0 | Scenario 1 | Scenario 2 | Scenario 3 |
|---|---|---|---|---|
| Biogas production (Nm3/d) | 0 | 3538 | 9333 | 9535 |
| Methane production (Nm3/d) | 0 | 2229 | 5880 | 6007 |
| Renewable thermal energy (kW) | 0 | 388 | 1025 | 1047 |
| Renewable electric energy (kW) | 0 | 370 | 976 | 997 |
Table 8.
Environmental benefits associated to the scenarios.
| Parameter | Scenario 0 | Δ 0–1 | Δ 0–2 | Δ 0–3 |
|---|---|---|---|---|
| Electric energy demand (kW) | 2051 | +124 | −433 | −630 |
| Produced renewable electric energy (kW) | 0 | 370 | 976 | 997 |
| Energy saved from external sources (kW) | 0 | 246 | 1409 | 1627 |
| Avoided CO2 emissions (ton/y) | 0 | 664 | 3800 | 4390 |
Table 9.
CAPEX cost items of the pieces of equipment to be implemented into Scenarios 1, 2, 3.
| Pieces of Equipment ($) | Scenario 1 | Scenario 2 | Scenario 3 |
|---|---|---|---|
| Anaerobic digesters | 3,988,000 | 4,370,000 | 4,370,000 |
| Biogas desulfurization unit | 14,000 | 18,500 | 18,500 |
| Gravel filter demister | 1400 | 1850 | 1850 |
| Gasometer | 29,000 | 75,600 | 77,000 |
| CHP unit | 1,450,000 | 3,824,000 | 3,906,000 |
| Heat exchanger | 204,000 | 221,000 | 221,000 |
| Flare stack | 58,000 | 105,500 | 106,500 |
| Back-up boiler | 61,000 | 159,500 | 163,000 |
| Digestate post-thickener | 61,500 | 61,500 | 61,500 |
| Primary settlers | 0 | 815,750 | 815,750 |
| Total | 45,447,400 | 49,234,200 | 49,332,100 |
| Increment vs. Scenario 0 | +14.8% | +24.4% | +24.6% |
Table 10.
IRR values for Scenarios 1, 2, and 3.
| Scenario 1 | Scenario 2 | Scenario 3 | |
|---|---|---|---|
| Sludge recovery in agriculture | 0.37 | 0.34 | 0.36 |
| Sludge disposal in a landfill | 0.13 | 0.21 | 0.24 |
Disclaimer/Publisher’s Note: The statements, opinions and data contained in all publications are solely those of the individual author(s) and contributor(s) and not of MDPI and/or the editor(s). MDPI and/or the editor(s) disclaim responsibility for any injury to people or property resulting from any ideas, methods, instructions or products referred to in the content. |
© 2023 by the authors. Licensee MDPI, Basel, Switzerland. This article is an open access article distributed under the terms and conditions of the Creative Commons Attribution (CC BY) license (https://creativecommons.org/licenses/by/4.0/).
Share and Cite
MDPI and ACS Style
Campo, G.; Ruffino, B.; Reyes, A.; Zanetti, M. Water-Energy Nexus in the Antofagasta Mining District: Options for Municipal Wastewater Reuse from a Nearly Energy-Neutral WWTP. Water 2023, 15, 1221. https://doi.org/10.3390/w15061221
AMA Style
Campo G, Ruffino B, Reyes A, Zanetti M. Water-Energy Nexus in the Antofagasta Mining District: Options for Municipal Wastewater Reuse from a Nearly Energy-Neutral WWTP. Water. 2023; 15(6):1221. https://doi.org/10.3390/w15061221
Chicago/Turabian StyleCampo, Giuseppe, Barbara Ruffino, Arturo Reyes, and Mariachiara Zanetti. 2023. "Water-Energy Nexus in the Antofagasta Mining District: Options for Municipal Wastewater Reuse from a Nearly Energy-Neutral WWTP" Water 15, no. 6: 1221. https://doi.org/10.3390/w15061221
Note that from the first issue of 2016, this journal uses article numbers instead of page numbers. See further details here.