
2D Microfluidic Devices for Pore-Scale Phenomena Investigation: A Review
by
 , , , , and
Alice Massimiani
1,*,
Filippo Panini
1,
Simone Luigi Marasso
2,
Matteo Cocuzza
3,
Marzia Quaglio
3,
Candido Fabrizio Pirri
3,4,
Francesca Verga
1 and
Dario Viberti
1 1
Department of Environment, Land and Infrastructure Engineering, Politecnico di Torino, 10129 Torino, Italy
2
Istituto dei Materiali per l’Elettronica ed il Magnetismo–Consiglio Nazionale per le Ricerche, 43124 Parma, Italy
3
Department of Applied Science and Technology, Politecnico di Torino, 10129 Torino, Italy
4
Istituto Italiano di Tecnologia, 16163 Genova, Italy
*
Author to whom correspondence should be addressed.
Water 2023, 15(6), 1222; https://doi.org/10.3390/w15061222
Submission received: 20 February 2023
/
Revised: 13 March 2023
/
Accepted: 17 March 2023
/
Published: 21 March 2023
(This article belongs to the Section Hydrogeology)
Abstract
:Underground porous media are complex multiphase systems, where the behavior at the macro-scale is affected by physical phenomena occurring at the pore(micro)-scale. The understanding of pore-scale fluid flow, transport properties, and chemical reactions is fundamental to reducing the uncertainties associated with the dynamic behavior, volume capacity, and injection/withdrawal efficiency of reservoirs and groundwater systems. Lately, laboratory technologies were found to be growing along with new computational tools, for the analysis and characterization of porous media. In this context, a significant contribution is given by microfluidics, which provides synthetic tools, often referred to as micromodels or microfluidic devices, able to mimic porous media networks and offer direct visualization of fluid dynamics. This work aimed to provide a review of the design, materials, and fabrication techniques of 2D micromodels applied to the investigation of multiphase flow in underground porous media. The first part of the article describes the main aspects related to the geometrical characterization of the porous media that lead to the design of micromodels. Materials and fabrication processes to manufacture microfluidic devices are then described, and relevant applications in the field are presented. In conclusion, the strengths and limitations of this approach are discussed, and future perspectives are suggested.
1. Introduction
Technical complexity arises when considering the multiphase and multiscale nature of underground porous systems. Spatial scales range from micrometers in the rock pores to kilometers when determining the whole volume of an aquifer or reservoir. Pore-scale phenomena are known to influence the reservoir behavior and complex phase interactions affect the reservoir capacity, injection/withdrawal efficiency, pollutant migration in groundwater, and environmental applications. Therefore, recognizing the microscopic picture of the system is fundamental to reducing the uncertainty associated with the macro-scale properties [1]. To this end, research is still ongoing and problems such as unstable displacement phenomena, fluid–rock interactions, and chemical and biochemical reactions remain not fully understood.
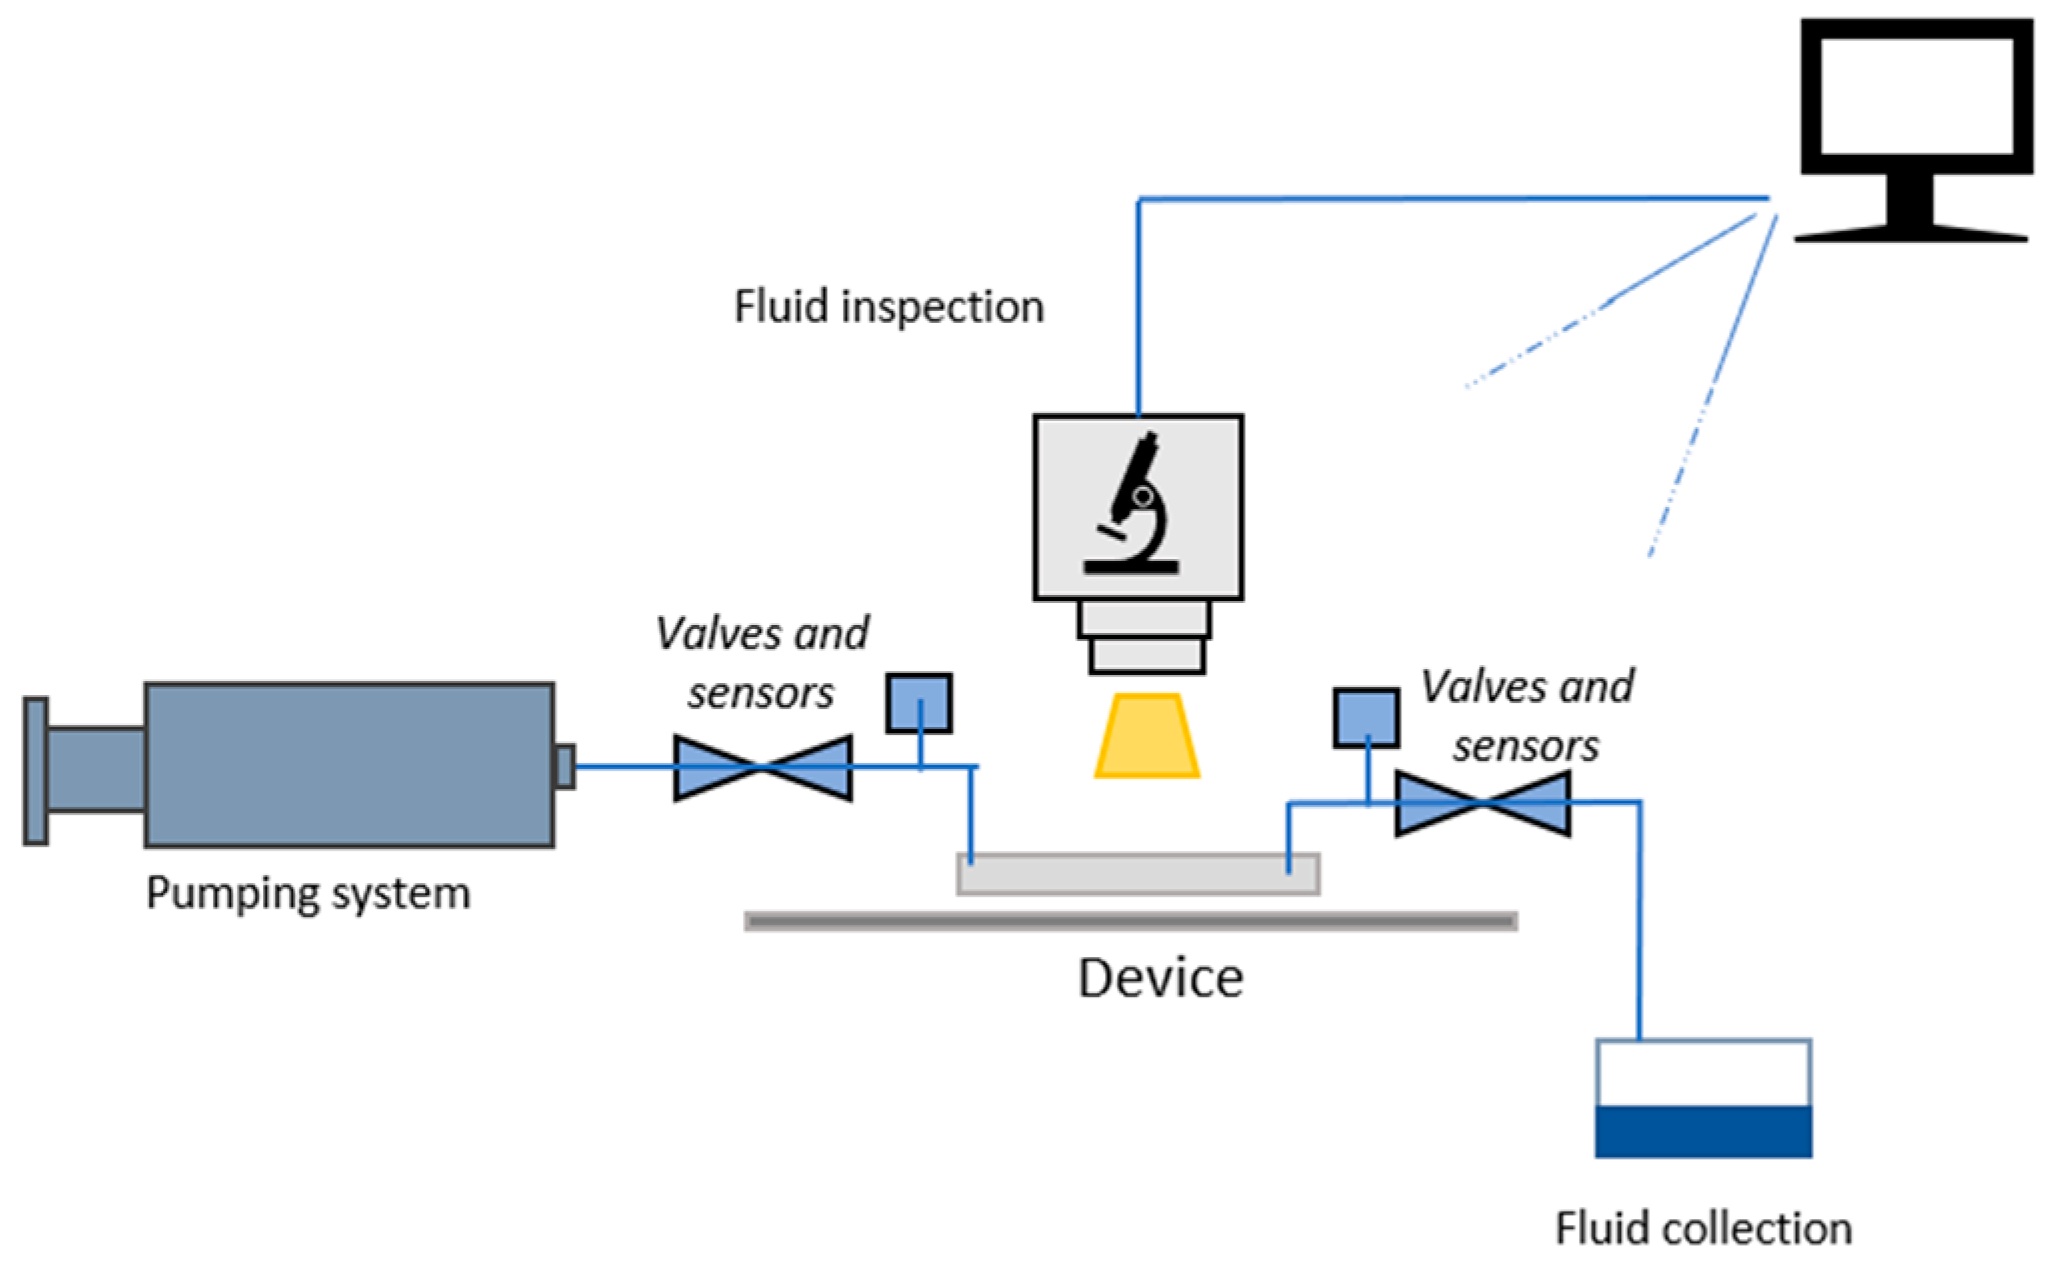
Microfluidic devices can effectively provide transparent and synthetic media for the study of pore-scale fluid phenomena. The fluidic pattern engraved in such devices can replicate the geometrical characteristics and the physical and chemical surface properties of underground porous media at the microscale, where capillary forces become predominant [2]. One of the main advantages of microfluidics is that it is possible to design synthetic flow patterns according to the aim of the investigation. Moreover, the possibility to fabricate sets of identical devices allows for the replicability of experiments and a direct correlation between their results. The main advantages of microfluidics over traditional core analysis are transparency, which allows for the direct visualization of pore-scale phenomena occurring in the micro-channels, and flexibility, in terms of design and replicability of devices and experiments. In this respect, 2D microfluidic devices are excellent yet complementary platforms for the investigation of pore-scale dynamics. In 2D microfluidic devices, which are meant to solve the limitation posed by the visualization of fluid phenomena in 3D complex media, the optical investigation is allowed by the transparent covering layer bonded to the patterned slab [2]. The exigency to directly observe and monitor the fluid phenomena occurring in the porous volume was one of the main reasons why microfluidic devices were developed in the first place. Fluids are injected through inlet ports, percolate through a patterned area, and eventually leave the device from outlet ports (Figure 1). An appropriate set of pumping and monitoring systems control the fluid injection and collection. A microscope and a camera are typically mounted on top of the device (Figure 2). Another advantage of microfluidic devices resides in their small dimensions, which generally imply very little consumption of materials and fluids as well as easy and fast experimental procedures. New fabrication methods, such as additive manufacturing or 3D printing offer the possibility to fabricate complex yet cost-effective synthetic 3D devices [3,4,5,6].
Ongoing research is dedicated to integrating laboratory experiments on microfluidic devices with numerical simulations (computational microfluidics). Microfluidic experiments provide valuable benchmark data sets, validating numerical simulations, and leading to more accurate and robust numerical models. Numerical simulations are complementary to microfluidic experiments, as they provide a high-resolution mapping of fluid and transport properties that are not easily measurable experimentally, such as pressure and velocity profiles, solute concentration, and mineral distribution [7]. For the interested reader, a complete review of numerical simulation in microfluidic devices with application to subsurface porous media was reported in Soulaine et al. [8], and more information on 3D microdevices can be found in the work of Jahanbakhsh et al. [9].
This review explores the current state-of-the-art of design, fabrication, and experimental application of 2D microfluidic devices for the investigation of multiphase flow in underground porous systems. A deeper comprehension of such systems is becoming increasingly important in the new framework of energy transition and environmental protection strategies. Applications of interest range from carbon capture and storage to hydrogen and gas storage, to remediation of polluted soil and groundwater.
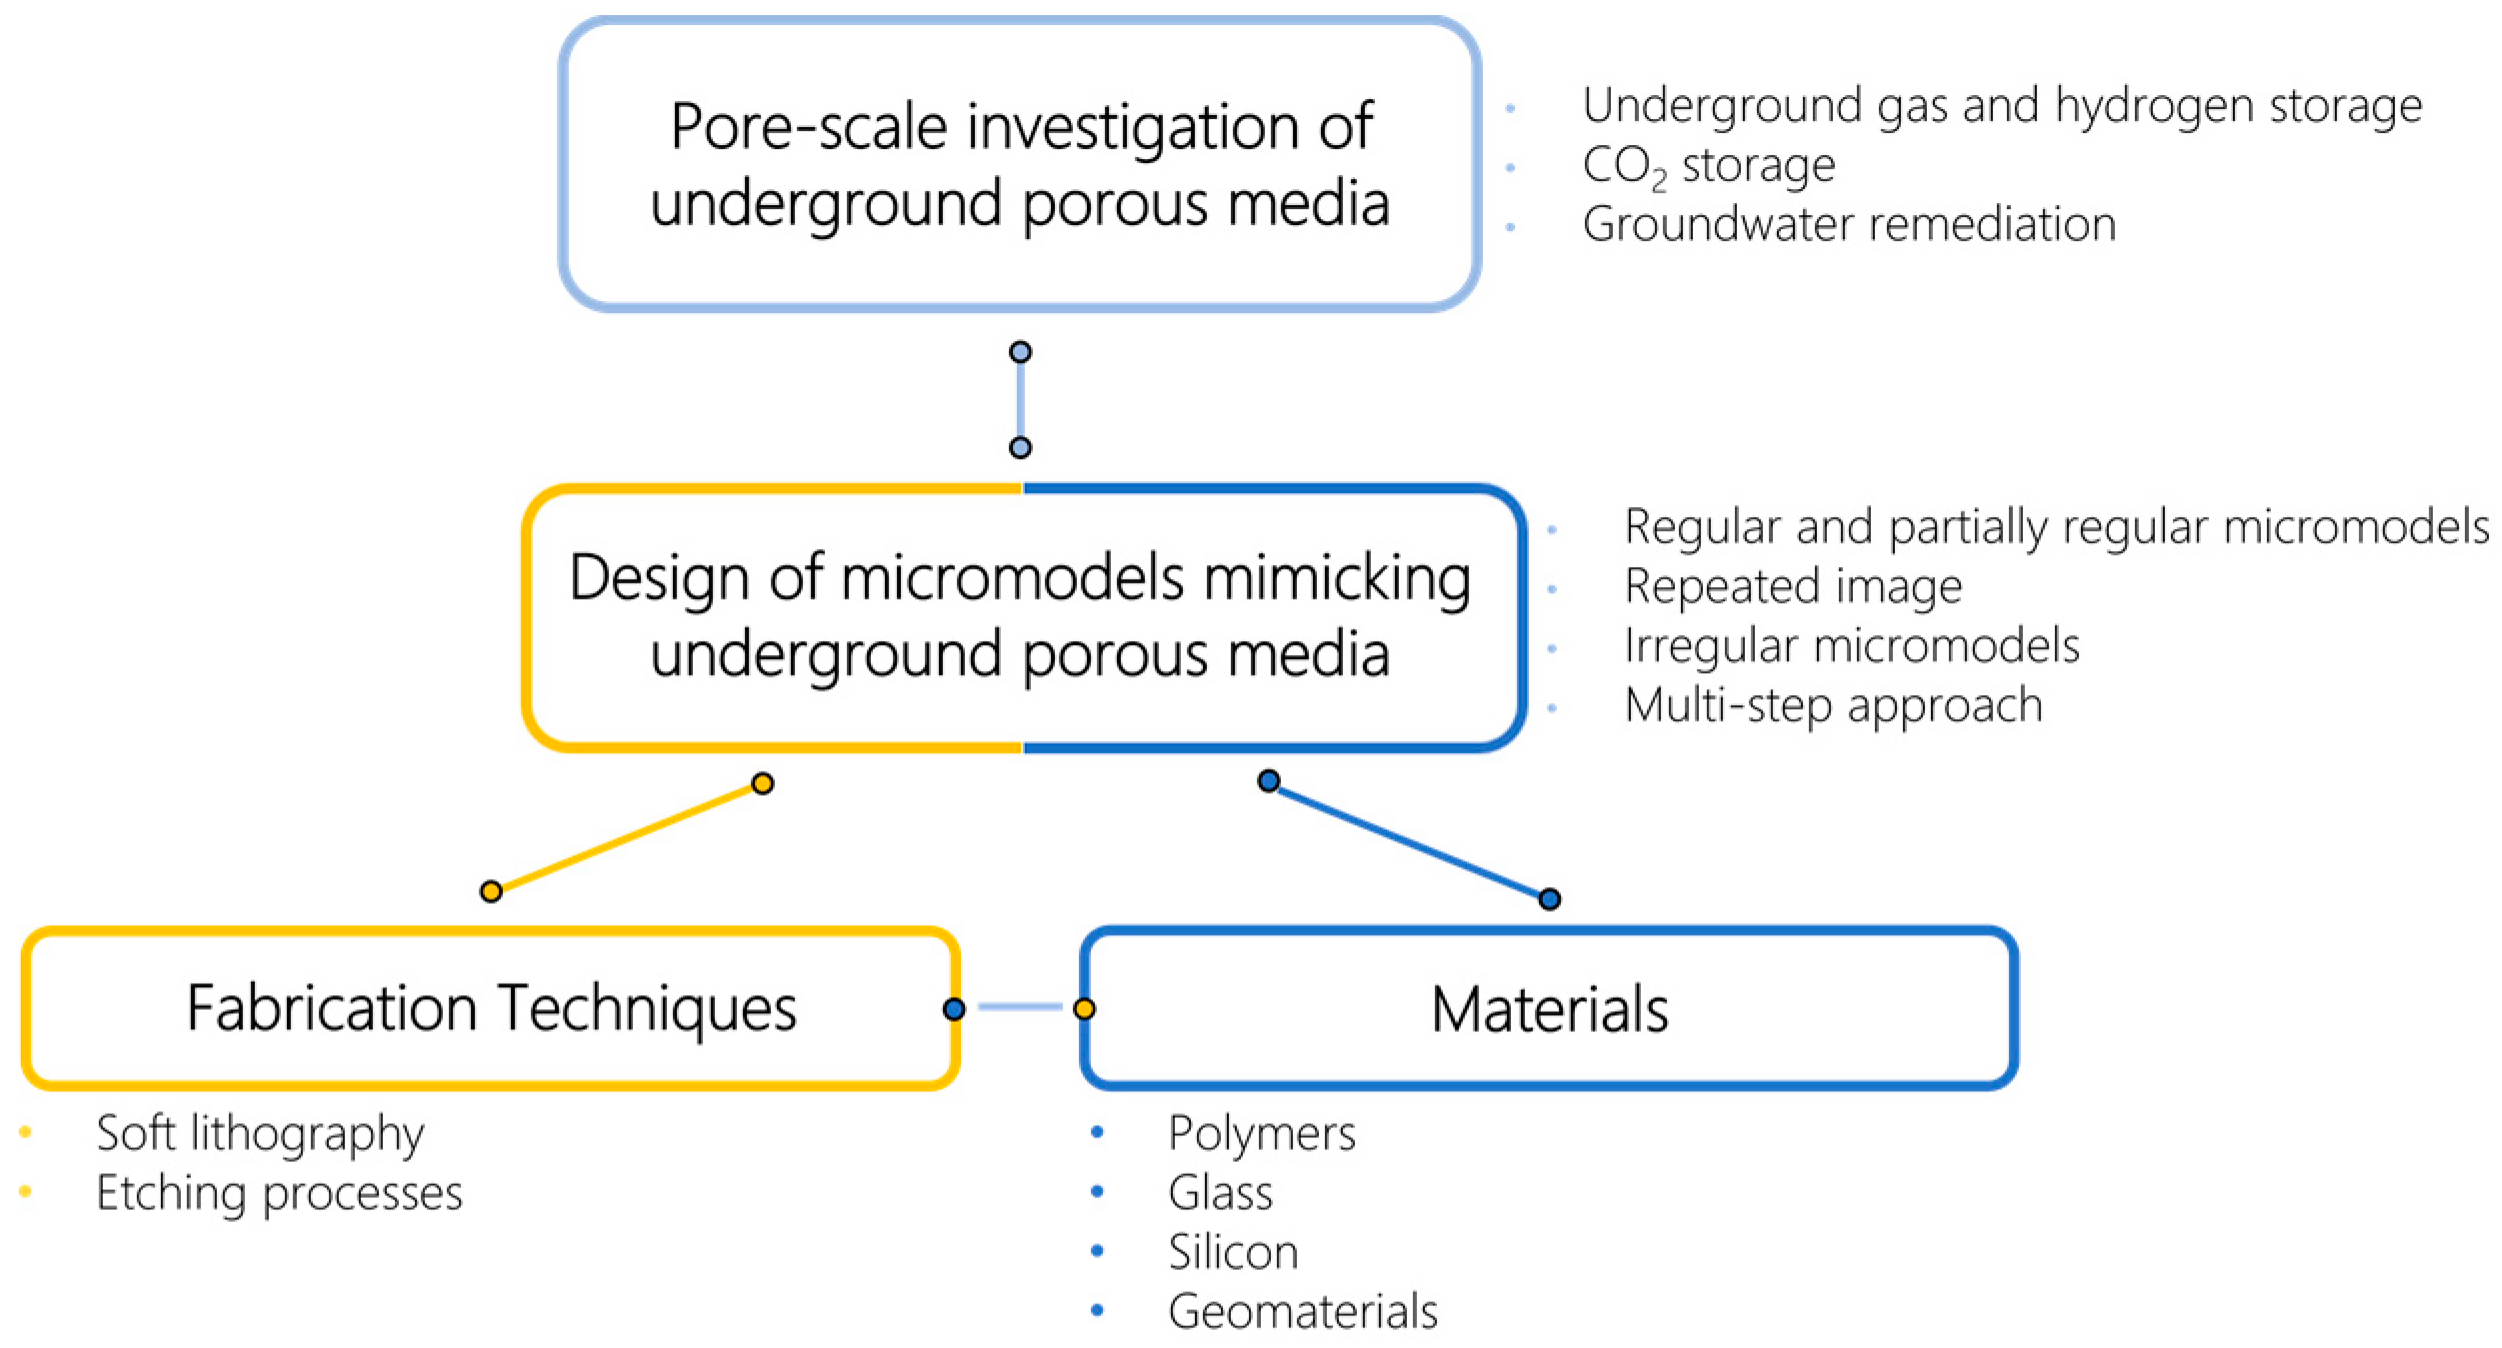
The overall contents of this paper are summarized in Figure 3. In Section 2, an overview of the different types of design approaches is first presented. In Section 3, the most common techniques used for the fabrication of microfluidic devices are presented. The fabrication methods were chosen according to the selected materials and some steps may be common to different materials. In Section 4, the most used materials for porous media representation are described, with a focus on the size, surface properties, and experimental conditions which can be achieved. The experimental conditions lead to the selection of materials and methods, since the device must be able to withstand the chemical and mechanical stresses imposed. Four categories of materials were reported to be used for the fabrication of microfluidic devices mimicking underground porous media: polymers, glass, silicon, and geomaterials. Combinations of different materials were also possible.
2. Design of Micromodels Mimicking Underground Porous Media
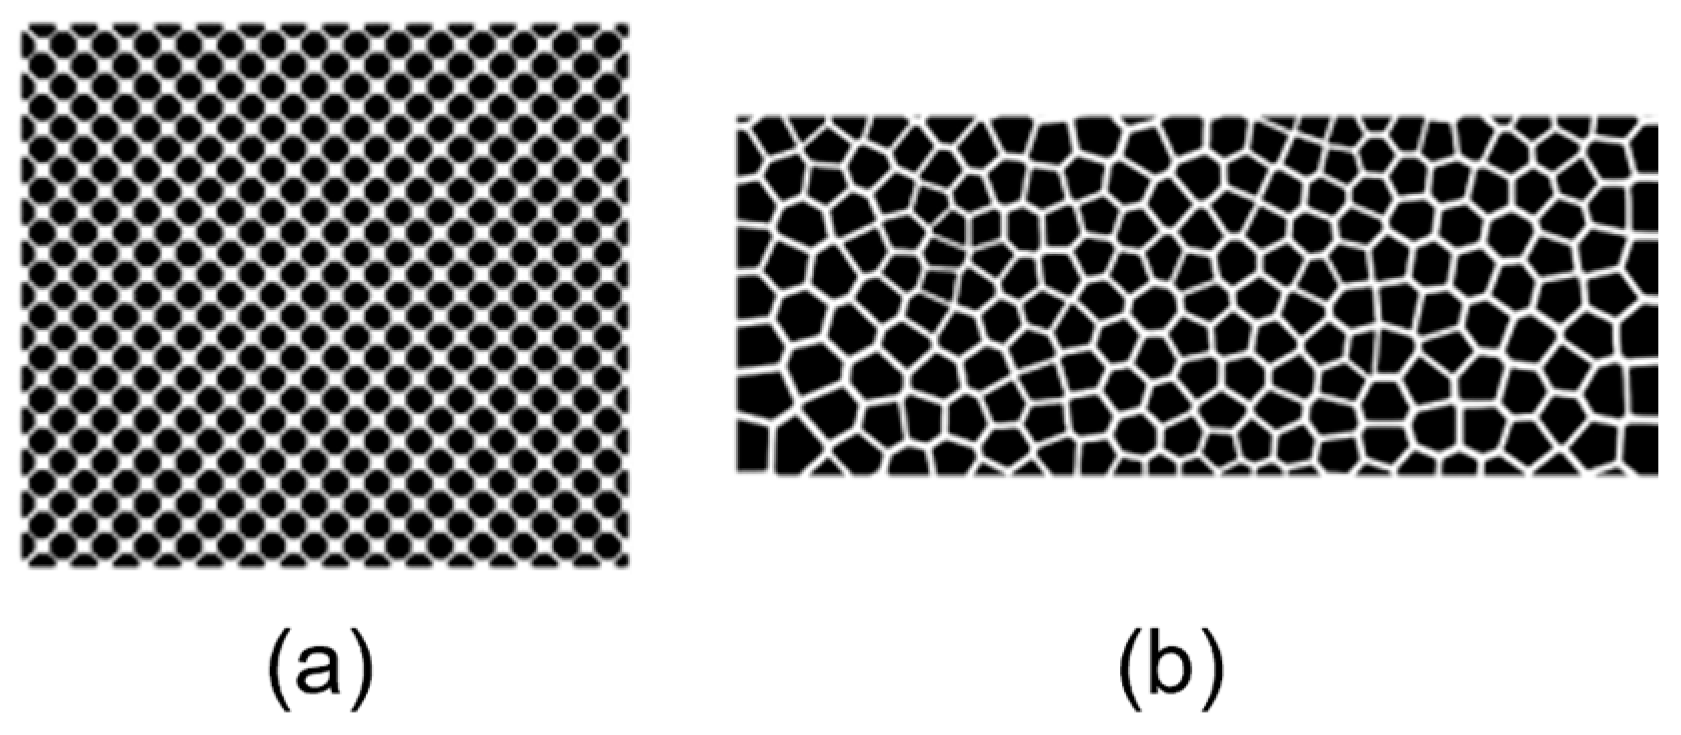
Micromodel patterns can be classified based on geometry and topology into three main categories [10]: (1) perfectly regular models, (2) partially regular models, and (3) irregular patterns. In the first category, the whole network is composed of pores having the same geometry and width, and constant distance between them. In partially regular models, the pores’ dimensions are not constant, but they form a regular pattern; in this case, pore sizes are chosen from a statistical distribution. Eventually, irregular patterns are characterized by the absence of spatial correlation in the geometry: pores have a random location, and their size is chosen from a statistical distribution. For example, Delaunay triangulation and Voronoi tessellation are irregular patterns with properties that correspond to real porous media [11]. In Figure 3, an example of a regular pattern and an irregular pattern based on Voronoi tessellation is shown.
2.1. Regular and Partially Regular Micromodels
A vast amount of literature exists about experimental and numerical studies on regular or partially regular micromodels [12]. These geometries can provide information about the fluid flow behavior; however, the level of complexity is too low to be considered representative of natural porous media. Regular and partially regular patterns can be useful to isolate the influence of specific geometrical properties on local phenomena; for example, by tuning the channel orientation or the pore-throat ratio. On the other hand, they are not representative of the actual pore space and do not reproduce the 3D complex geometry of real porous media, which plays a key role in displacement phenomena in reservoirs. Macroscopic parameters such as fluid saturation, capillary pressure, and relative permeability are strongly related to the pore structure, pore size, and pore connectivity; therefore, a higher level of complexity is necessary to investigate actual flow phenomena occurring in reservoir rocks.
2.2. Repeated Image
Some authors created a micromodel pattern by repeating the image of a thin section of rock. Buchgraber et al. [13] obtained a repeated pattern from a scanned image of a thin section of Berea sandstone. Then, Chen et al. [14] conducted experiments and numerical simulations on a micromodel that mimicked the pore structure of Mt. Simon Sandstone; the pattern consisted of nine identical binary images arranged in a 3 × 3 array. However, although more sophisticated than regular or partially regular patterns, these patterns remained too simplistic and could not reproduce the geometrical and transport properties of the 3D rock, but only of the 2D thin section. The representativeness of 3D properties in 2D models is critical in micromodel design.
2.3. Irregular Micromodels
A different approach involves the application of Voronoi diagrams (Figure 4b) or Delaunay triangulation [11]. These patterns have the number of pore throats connected to a single pore body (i.e., coordination number) equal to 3, which is the average value in natural rocks. Moreover, Voronoi diagrams can be generated to obtain desired heterogeneity, fractures, and channels with different sizes. The Voronoi diagram is a computational geometry algorithm that divides a 2D or 3D domain into many non-overlapping polygons or polyhedrons, starting from a set of randomly distributed points. In two-dimensional Voronoi diagrams, the vertices of the polygons are always connected to three other vertices. The Delaunay triangulation of a set of randomly distributed points corresponds to the dual graph of a Voronoi diagram for the same set of points. Wu et al. [11] created micromodels of homogeneous and heterogeneous networks based on Voronoi diagrams and they introduced heterogeneity into the geometry by removing single grains or groups of grains. Karadimitriou [15] designed a micromodel pattern based on pore network modeling. He generated the pore network topology by using Delaunay triangulation, which was then modified into a collection of pore bodies and throats. On the horizontal plane, the radius of the pore bodies was assigned using a random number generator, employing a log-normal distribution, while the width of pore throats was assigned using the equations reported in Joekar-Niasar et al. [16]. The thickness of the network, including pores and throats, was constant and equal to the mean pore size.
2.4. Multi-Step Approach
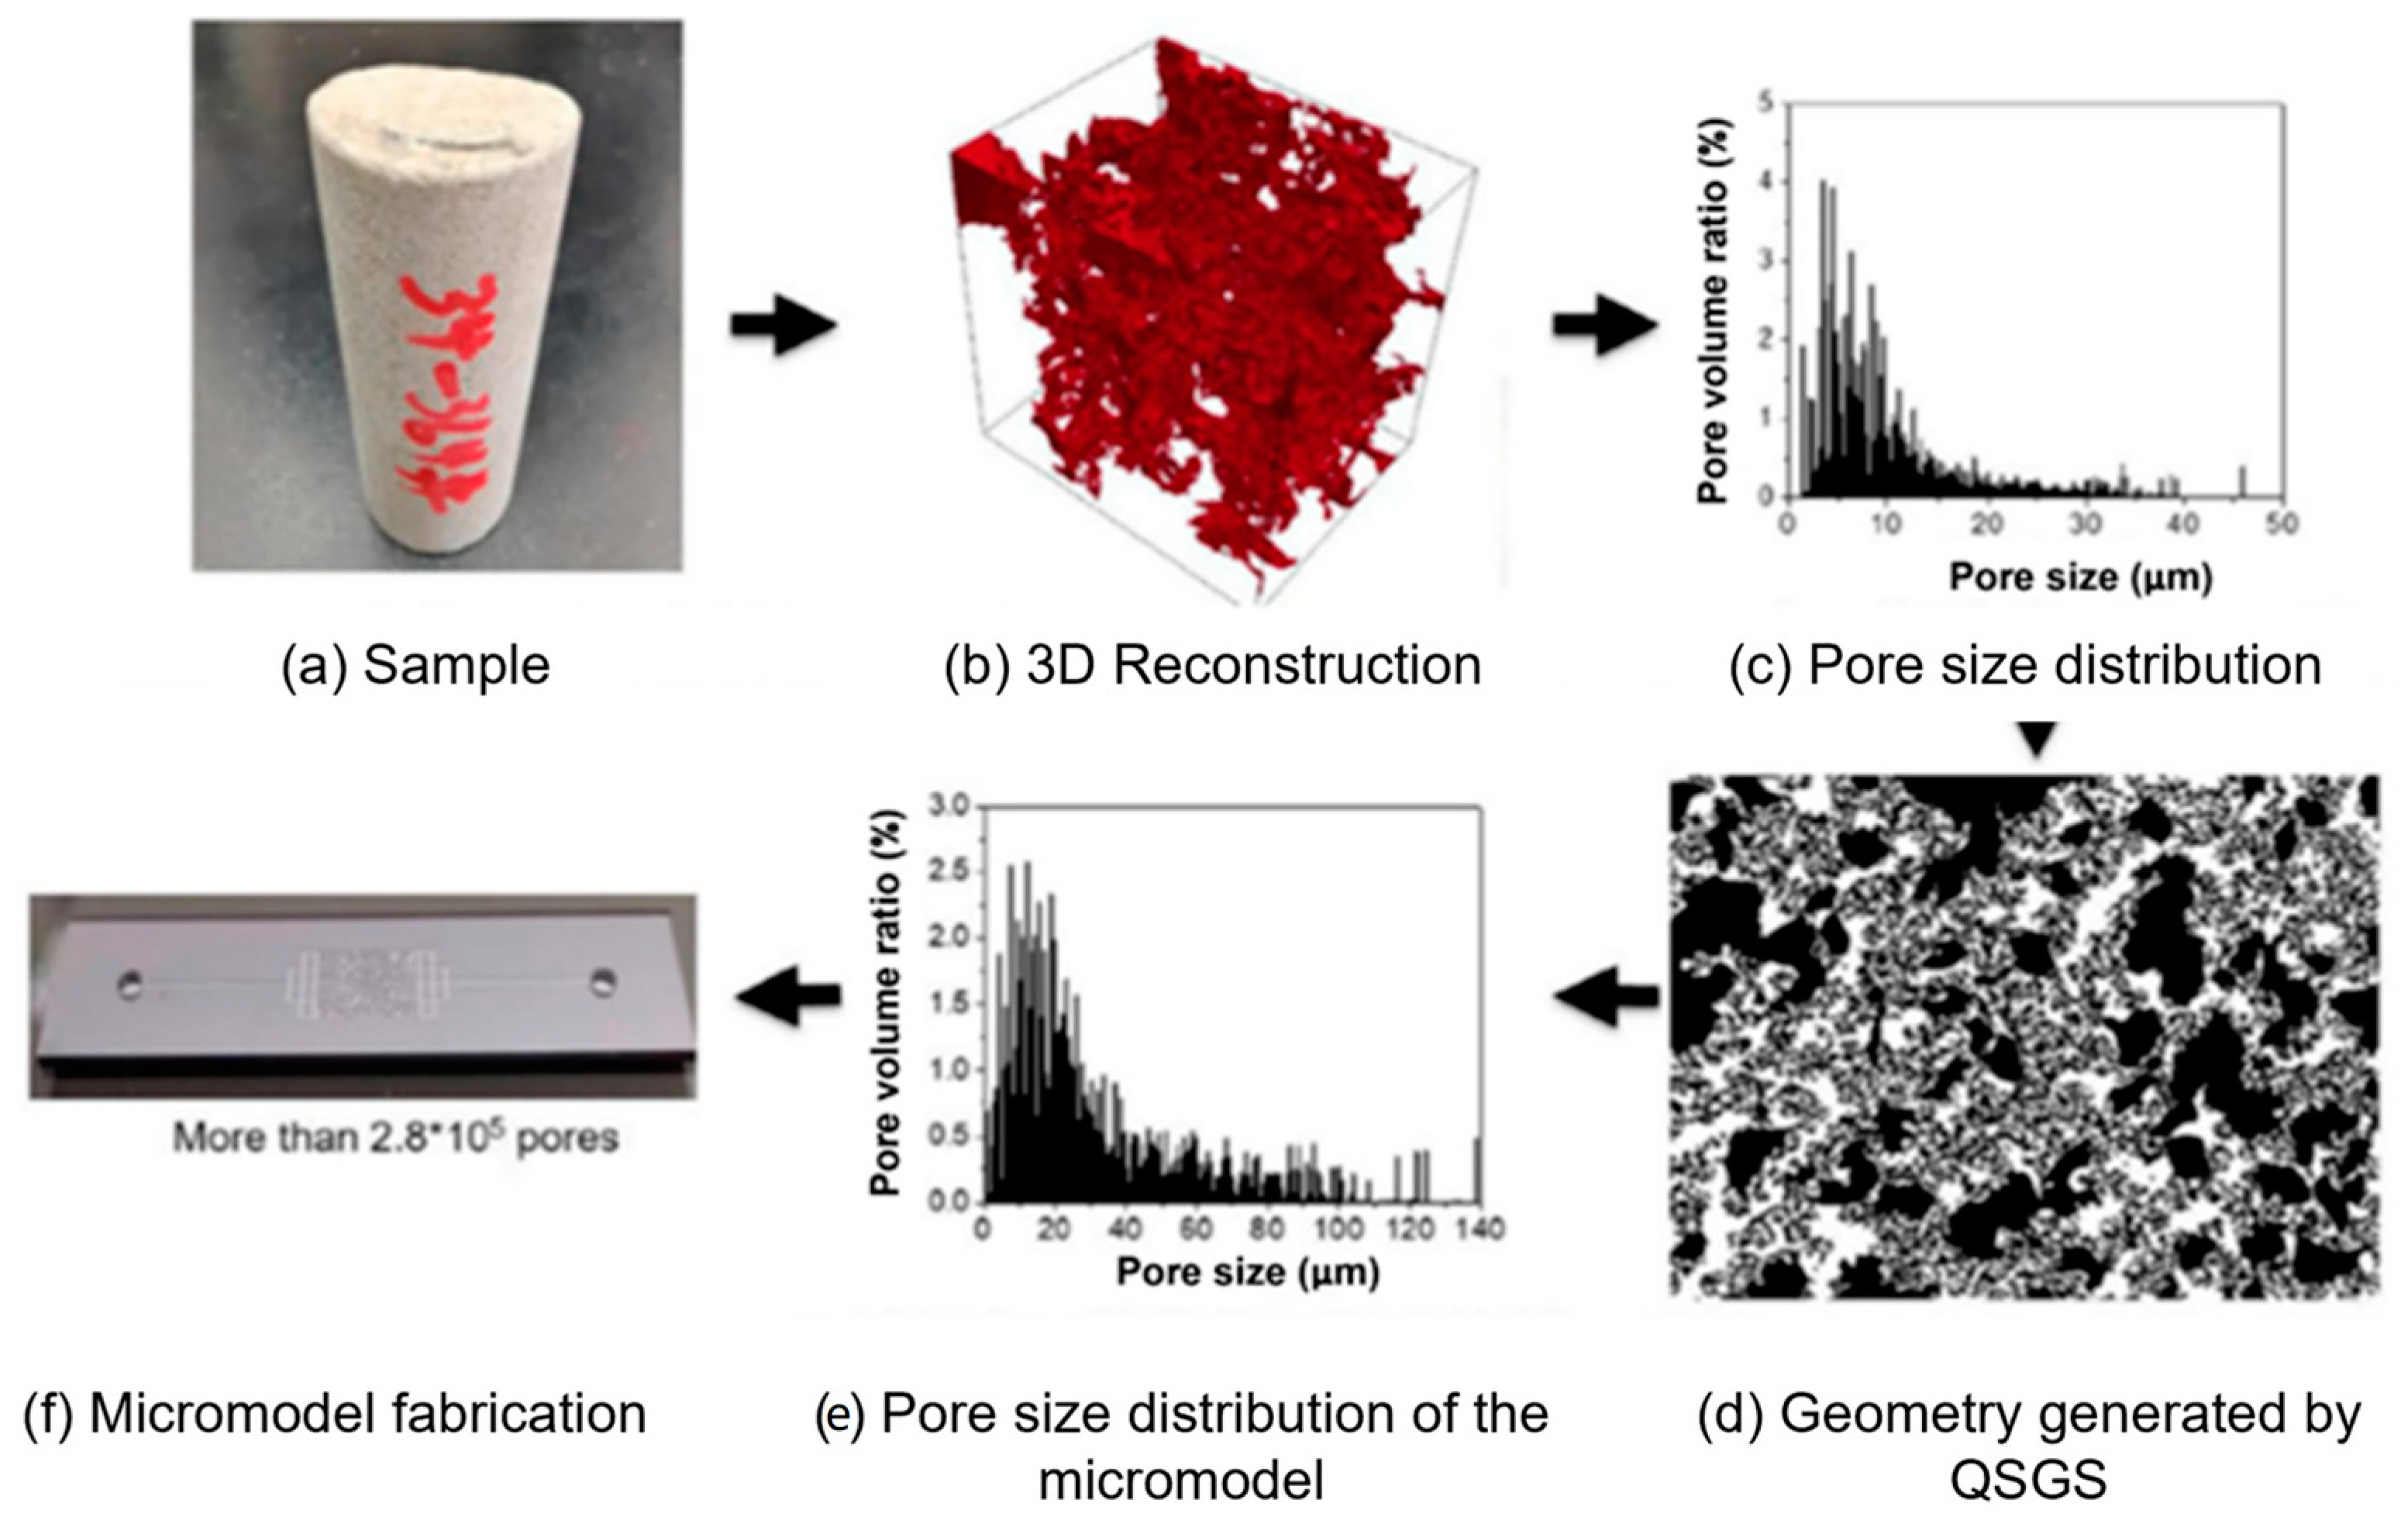
When microstructure information and statistics of 3D rocks are available, multi-step approaches can reproduce more realistic and representative micromodel patterns. For instance, in Gunda et al. [17], the authors extracted the microstructure properties and characterized the pore space starting from electron microscopy and X-ray micro-computed tomography (micro-CT) images. Then, the extracted microstructural information was used to represent the 2D model using a stochastic random network generator or Delaunay triangulation. Porter et al. [18] generated patterns using micro-CT images to better represent the pore space and fracture geometries expected in subsurface formations. They extracted a series of slices from micro-CT data; then, they averaged and segmented the 2D images into a single image that defined the final geometry of the porous medium or the fracture. In order to extract geometrical pore structure properties from rock images, methods based on the medial axis or medial surface [19,20] or methods based on path-finding algorithms [21,22] can be applied. An interesting approach, similar to that of Gunda et al. [17], but based on the quartet structure generation set (QSGS) algorithm [23,24], was introduced by Lei et al. [25]. They proposed a multi-step approach (Figure 5): (1) microstructure characterization of core samples; (2) extraction of statistical information, such as porosity, pore, and grain size distribution and anisotropy; (3) generation of an equivalent geometry by using QSGS algorithm; (4) analysis of the statistical information of the generated porous medium, to determine whether it is close enough to the real one. Eventually, Gaol et al. [26] also proposed a multi-step methodology having 3D micro-CT images as input information: (1) convert raw micro-CT into binary images; (2) generate a grain 2D density map by averaging all the binary values from all the images; (3) generate a pore body map by applying a threshold value that subdivides the density map into grains and pores; (4) perform opening–closing reconstruction operation to create a flatter grain density map; (5) extract a pore throat map using the medial axis algorithm; (6) superimpose the pore body map and the pore throat map to construct the pattern geometry. Using this approach, they matched the rock properties of the micro-CT images and then, they generated homogeneous and heterogeneous patterns, with different permeability regions in the porous media. Given the geometrical complexity of natural porous media, pore structure characterization is essential to simulate real systems.
2.5. Inlet and Outlet
Not only the porous pattern but also the inlet and outlet regions of the device must be carefully designed since they regulate the way the fluid front enters the porous area [26]. Fluids are injected into the microfluidic device and exit the system through circular holes, called ports, positioned in the inlet and outlet regions (Figure 1).
3. Micromodel Fabrication Techniques
The established fabrication techniques used for microfluidic devices derive from that set of technologies that were first developed for the fabrication of micro-structured integrated circuits.
3.1. Soft Lithography
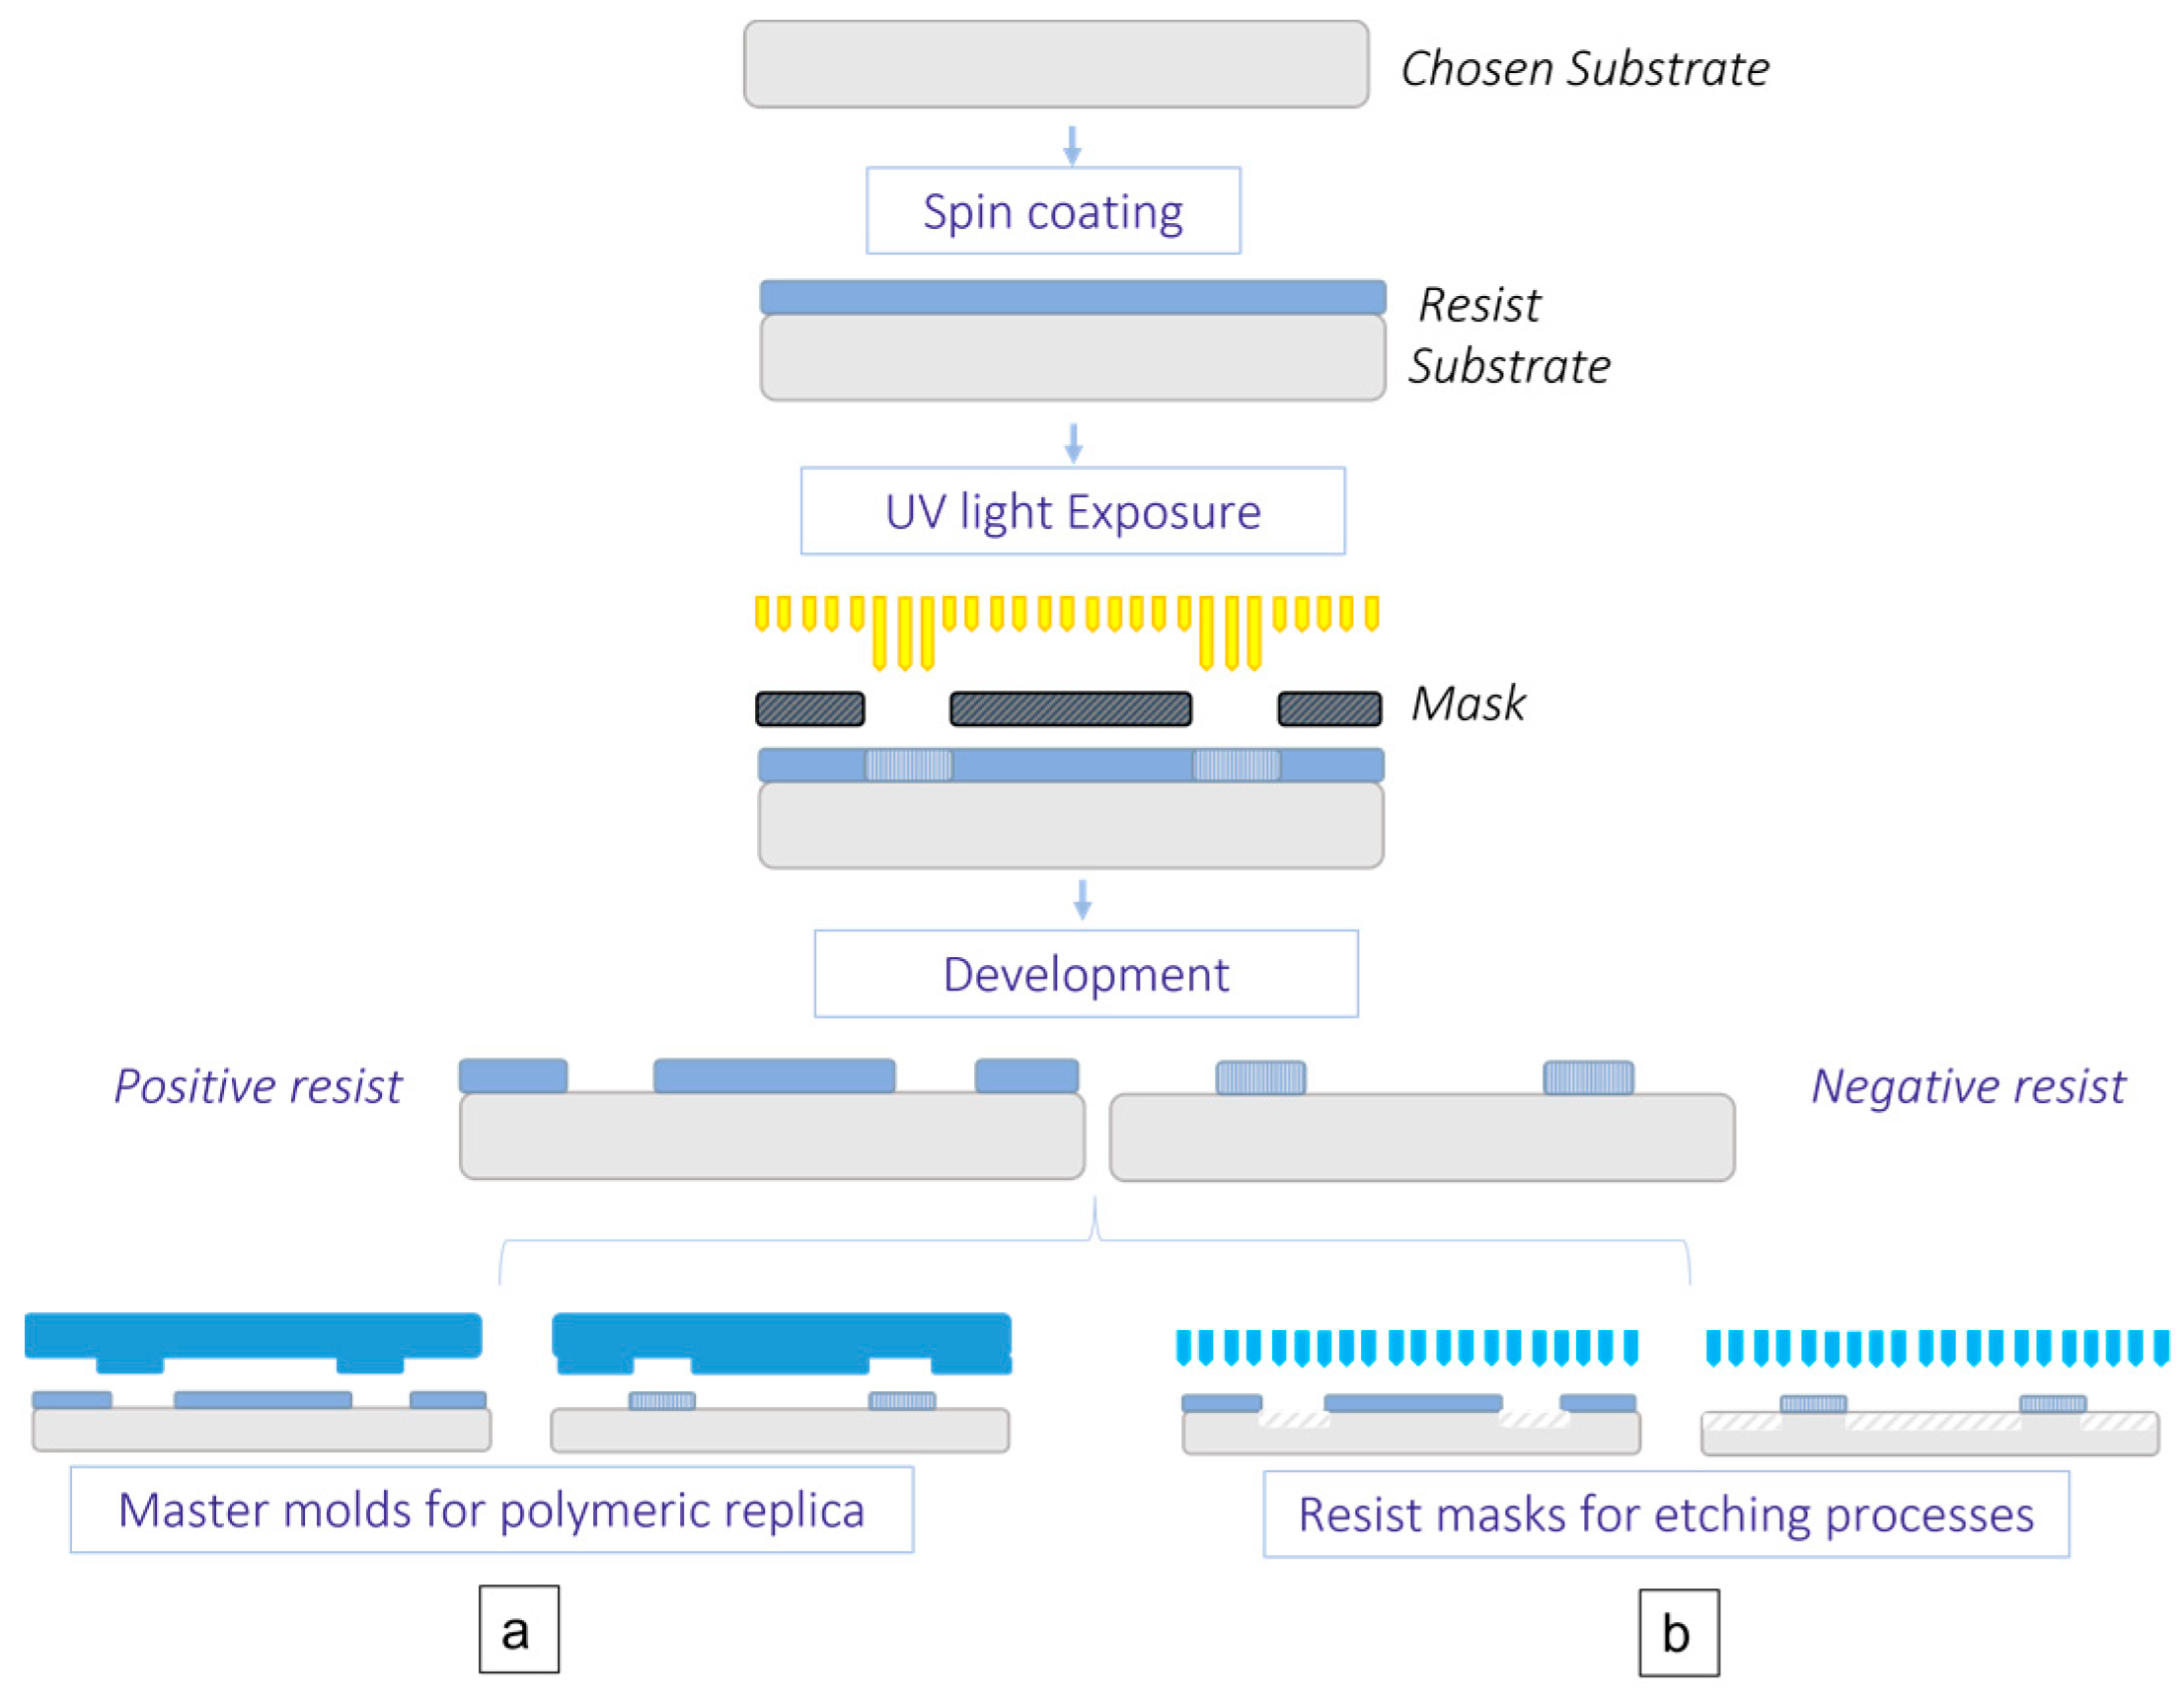
For polymeric devices, the fabrication of a master mold is often required, from which replicas are created using methods such as casting (soft lithography), hot embossing, or injection molding. With stiffer materials such as glass and silicon, and polymers such as PMMA, typically etching processes, direct laser writing, and conventional machining can be chosen, and often combined. Many of these techniques contain a photolithographic step as the first process: with this method, it is possible to directly fabricate the master molds or to prepare the substrate for further processes. In photolithographic techniques, a chosen substrate is coated with a layer of a photo-sensitive polymer (in the range of UV spectrum) called photoresist (or simply resist), whose thickness depends on the material used and the application involved. Photoresists can be either positive or negative, meaning that they, respectively, degrade or cure when exposed to UV light [9,10,15,27]. The resist is exposed to the UV light with the interposition of a patterned mask, to transfer the desired structures onto the polymeric layer. According to the final application and the positive/negative nature of the photoresist, the mask pattern must be appropriately designed. After removing the excess photoresist (uncured or degraded), the remaining structure is typically consolidated through a baking process, and it will, therefore, leave some areas of the substrate exposed while protecting others. This consolidated polymeric structure can directly be used as a mold, which is often the case for the fabrication of polymeric microfluidic devices. As shown in Figure 5, soft polymers, such as polydimethylsiloxane (PDMS), are cast on the mold. Thermoplastic materials undergo hot embossing or injection molding processes. Casting is performed by pouring a mixture of a pre-polymer and its curing agent on the master surface, inducing the cross-linking of the material, and peeling the replica off the master [28,29,30]. In embossing techniques, the structure of a mold is replicated onto a polymeric substrate by application of pressure and temperature [31] by heating both substrates and mold slightly over the corresponding glass transition temperature. In injection molding, raw polymeric pellets are heated up to their melting point and the resulting liquid phase is injected at high pressure into the mold cavity and quickly cooled afterward. The substrate is typically silicon or glass and is less often PMMA. Other methods are also possible, such as the LIGA process, which involves a sequence of three steps: deep (X-ray or UV) lithography, electroplating, and molding [9,32].
3.2. Etching
Etching processes are based on either the chemical reaction of acids, alkaline solutions, or technical solvents, or on the interaction of a plasma with the surface of a chosen material. A first lithographic step is performed as described in Section 3.1 and the photoresist remaining on the substrate has the function of protecting the surface where etching is not required (Figure 6a). The resolution of the mask strongly affects the outcome of the etching process. The thickness and the chemical selectivity, i.e., the ratio between the etch rate of the substrate to the etch rate of the photoresist, will determine the depth of the final network. After the photoresist is exposed and developed, the surface is etched (Figure 6b) [20]. To date, two main etching methods are used, namely wet etching and dry etching. In wet etching, acids or alkaline solutions are typically used as etchants on glass or silicon substrates: the area covered by the photoresist remains unaffected by the etchant. The depth of penetration depends on the etching rate (i.e., the penetration depth per unit time) and the time of exposure to the etchant. Wet etching is a very popular way to produce micromodels; however, this method has some limitations. One shortcoming is that the pore walls are often sloped rather than vertical (isotropic etching). Alternative approaches for etching glass, silicon, or stiff polymers such as PMMA rely on ion-beam milling, dry (plasma-assisted) etching, or electromagnetic radiation (laser micromachining). Typically, a step of photolithography is required, to create a masking layer adherent to the substrate, which allows for the selective removal of material from the uncovered areas only. The reactive ion etching process is one of the most used techniques in the field of microfluidics and operates through a mixed combination of physical and chemical etching. The plasma is typically generated under low pressure by a strong radio frequency (RF) electromagnetic field. The dry etching procedure may be very anisotropic, allowing for less rounded bottoms, independently from the material properties. Dry etching produces narrow and shallow channels with nearly vertical walls (82°–90°). The deep reactive ion etching (DRIE) method improves the slope of the vertical walls (88°–90°) and also allows one to obtain very low surface roughness. Figure 7 schematically shows the results of the anisotropic and isotropic nature of dry and wet etching, respectively. The reactive-ion etching method is a complicated procedure and is the subject of ongoing research, but it remains one of the best ways to produce good-quality micromodels. This is also related to the materials associated with the technique, which are typically glass and silicon, whose physical and chemical stability allow for better performances of microfluidic devices in terms of resistance to pressure, temperature, and to mechanical and chemical stresses.
4. Micromodel Materials
In the following paragraphs, the most common materials used for the fabrication of micromodels mimicking porous media are presented. The first materials presented are transparent polymers, such as poly-di-methyl-siloxane (PDMS), thiolene-based polymers, poly-methyl-methacrylate (PMMA), and cyclic olefin copolymer (COC), that are considered valid options for the fabrication of microfluidic devices, being significantly cheaper than silicon or glass [33,34]. The usage of polymers, and PDMS in particular, relates to the historical development of microfluidics. Polymers are generally versatile, allow for surface modification, and can easily be bonded, or blended with nanostructured materials to provide composites with improved characteristics and performance [35]. However, this also implies that their surface tends to undergo undesired modifications during processing, thus requiring additional stabilization. The main drawbacks of polymers are their reduced chemical and mechanical resistance, which limits their application with solvents and makes them unsuitable to withstand high temperatures and high differential pressures. Photolithography, 3D printing, and/or molding processes are the most common manufacturing techniques [36,37,38]. Glass follows, as one of the most applied materials for the fabrication of microfluidic devices for pore-scale phenomena investigation, and, historically, was the first to be used (together with silicon) in this field. Glass properties of optical transparency, hardness, and chemical and thermal stability are indeed extremely suitable for applications in geology, environment, and petroleum engineering, allowing for experimental conditions involving high temperature and pressure conditions. Silicon wafers are also a suitable platform for microfluidic devices, requiring the same fabrication techniques as glass, but obtaining even smaller features and better resolutions. The patterned silicon substrates must then be bonded to a transparent layer, which is often glass. The usage—or the integrated usage—of geomaterials is the last frontier in the development of microfluidic devices able to intimately reproduce the surface properties of real media, while still preserving the capability of directly visualizing the flow phenomena.
Table 1 summarizes the materials and geometrical features of relevant microfluidic devices presented in this review.
4.1. Thermo- and Photocurable Polymers: PDMS and Thiolene-Based Resin
4.1.1. PDMS
Poly-dimethyl-siloxane, which belongs to the group of silicones, was widely used for the fabrication of microfluidic devices and quickly became a cheaper and easier-to-manage option if compared to the traditional glass or silicon alternatives. It is indeed reported that the surge of PDMS is associated with the flourishing of lab-on-a-chip devices, where it rapidly became one of the preferred candidates for manufacturing cost-effective microdevices [39]. For the fabrication of a synthetic replica of porous media, PDMS is an optimal candidate for the rapid validation of the designed pattern. PDMS is an optically transparent, non-toxic, non-flammable, silicon-based, elastomeric polymer. It can be used to fabricate the entire device, meaning both the patterned plate and the covering one. The PDMS-based porous media models are typically fabricated by soft lithography (also known as casting) [40]. A mixture of the pre-polymer and the curing agent is poured onto the mold, and often moderately heated, to catalyze the curing process. The advantages of this technique are the fast and cost-effective fabrication and the replicability of the structure due to the reusability of the masters. Channels generated in PDMS by casting can have widths of a few micrometers, but it must be considered that defects or roughness of the mold are transferred and enhanced on the PDMS replicas [41]. The most common sealing process is the oxygen plasma surface treatment, which generates silanol groups (Si-OH) on the surface of PDMS, which lead to the formation of stable chemical bonds between the two plates. The covering plate can be alternatively chosen among glass, silicon, quartz, silicon nitride, polyethylene, polystyrene, and glassy carbon. PDMS is hydrophobic in its natural state with a water contact angle > 100° [9,42]. The surface properties can, however, be easily changed and tuned by surface treatments. For instance, the oxygen plasma treatment causes PDMS to become hydrophilic [43], whilst activation of the PDMS surface by corona discharge makes the polymer more hydrophobic than in its natural state. There are, however, methods for recovering and stabilizing the natural PDMS hydrophobicity [15]. Wettability alterations are often performed to achieve a mixed, or heterogeneous wettability, to better represent real media, since the rock is often originally water-wet but can gain oil-wet properties in case of precipitation of oil components. This may be achieved through surface treatments, such as that performed on PDMS devices proposed by Schneider et al. [28]. The high gas permeability of PDMS makes this material also suitable for a variety of biological applications [43], but makes it less applicable in experiments where the flow phenomena to be investigated are those of a gas phase. PDMS is often not compatible with organic solvents, which limits its use to aqueous solutions. Moreover, the low stiffness of PDMS leads to elastic deformations of micro-channels within the microfluidic devices even under very low flow rates and injection pressures (even pressure as low as 0.14 bar can be critical) [15].
4.1.2. Thiolene-Based Resin
New studies on photocurable thiolene-based commercial resins were also performed [29,44] to solve some of the limitations of the PDMS devices, such as poor mechanical and chemical resistance, swelling upon oil contact, and gas permeability. This resin is a single component thiolene-resin that polymerizes upon exposure to a long wavelength (365 nm) UV light. It is impermeable to air and water, stable on surface treatments, shows less swelling upon contact with solvents and its elastic modulus is orders of magnitudes higher when compared to PDMS. Fabrication techniques are molding processes or photolithography [45]. This resin has, by nature, both hydrophilic and lipophilic properties [46]. Wettability can be easily altered: in the work of Kenzhekhanov et al. [47], it was noticed that the polymer tended to acquire the wettability of the fluid it had the first contact with and so, keeping the resin in contact with water or oil first can induce slight hydrophilicity or hydrophobicity, respectively. UV treatment increases the surface energy of the polymer, thus making the surface more water-wet. Oxygen plasma exposure can also improve water-wettability, by creating free radicals able to interact with water. Oxygen plasma is also used to seal the device. However, as further described by Kenzhekhanov et al. [47], a combination of plasma bonding with the half-curing method is preferable to avoid delamination of the device. Alternatively, an oil-wet surface can be created by adding APTES (3-aminopropyl triethoxysilane) to the uncured (liquid) polymer.
4.2. Thermoplastic Polymers: PMMA and COC
4.2.1. PMMA
PMMA is an acrylic thermoplastic material that is stiffer and harder than PDMS. Due to its high transparency, it is often used as a substitute for glass. Pore network structures on PMMA can be generated by either direct laser writing or using a LIGA process (a German acronym for “Lithographie, Galvanoformung, und Abformung”) [10,48]. The first method is preferable for rapid prototyping and manufacture of microfluidic devices in low quantities, while the second is a molding technique, suitable for the production of identical replicas in large quantities. Different laser techniques are available for direct writing on PMMA, each of them showing specific advantages and disadvantages. The most commonly used lasers are KrF excimer lasers [49], CO2 lasers [50,51], and Ti:sapphire femtosecond lasers [52]. The LIGA technique is used when a high reproducibility of microfluidic patterns is required. This fabrication method involves a sequence of three processes: deep (X-ray or UV) lithography, electroplating, and molding [48,50]. To create the first polymeric mold, a metal substrate is covered with liquid polymer (usually a PMMA-based photoresist). In the following step, the designed pore-network pattern is transferred onto the polymer either by X-ray or UV lithography [48] or by direct laser writing using an excimer laser [53]. The X-rays enable the generation of narrow and smooth channels with a high depth-to-width aspect ratio and almost vertical side walls. Customized masks, made of quartz and chrome or Kapton and gold, are required. This patterned polymer is then filled with the chosen metal via electroplating. The plating process proceeds up to the point where the metal layer covers the whole microstructure and is thick enough to be fitted into a molding or embossing tool. The metal mold insert is then separated from the polymer by shock-freezing using liquid nitrogen. Following this process, the insert is cleaned from the residual polymer with organic solvents. Such a prepared metal mold is ready for the replication of pore network patterns on PMMA by either injection molding or hot embossing. The microstructures generated by this process are typically sealed with a second PMMA plate through either thermal bonding or adhesives [53].
4.2.2. COC
Another thermoplastic polymer that was applied in the field of microfluidics for porous media mimicking is the cyclic olefin copolymer (COC). This is a rigid thermoplastic material, characterized by high optical transmission in the UV and visible spectrum range, low water absorption, good resistance to many acids, and exceptionally good resistance to many solvents, including organics (e.g., acetonitrile).
4.3. Glass
Early works of microfluidics for studying the fluid flow in porous media were based on glass-based micromodels. The very first micromodel made by Chatenever and Calhoun in 1952 [54] is an example of a glass-beads-based model. Later, Chuoke et al. [55] used the same technique to investigate the displacement phenomena in porous media. However, these models presented some significant difficulties. The first challenge was that preferential paths could be created along the walls in case the glass beads were not in close contact with the container walls, and fluid will not flow through the center of the device. Other difficulties may arise during the visualization and monitoring of the fluids flow, especially if there are multiple layers of beads, which makes it challenging to find an appropriate depth of focus. An interesting construction of the glass-bead model was presented by Corapcioglu and Fedirchuk [56], who enclosed a single layer of glass beads between two Pyrex plates by creating a recess of a certain depth in both plates, where the glass beads were hosted. The main drawback of this model is that only a limited number of pore network patterns can be achieved with glass beads, making the model unable to realistically replicate the internal irregular structures of real geomaterials.
Architectures obtained with patterned wafers/plates sealed with a second covering plate were, therefore, more frequently mentioned in the literature works. For the realization of flow patterns on glass substrates, reactive ion etching (RIE) or wet chemical etching are typically used. Direct laser writing, selective laser-induced etching (SLE), direct laser writing, and laser micro-welding are less common but very promising for the rapid prototyping of microfluidic devices. For reactive-ion etching, gases such as SF6, C4F8, CF4, and CHF3 are typically used on glass substrates. Additional gases—such as H2, O2, He, and Ar—are often used to improve the etching process, e.g., to increase the etching depth or to reduce the roughness of the etched surfaces. The generated plasma interacts with the sample, where it sputters atoms from the surface by transferring part of its kinetic energy and then, reacts with them, creating new species that are free to leave the surface. This process may be anisotropic, meaning that it enables the generation of channels with almost vertical walls. RIE allows for great control over the depth of the etched structures, with the process being slow (1 μm/min) and easy to stop. The other method commonly used for the generation of microfluidic patterns on glass is wet etching. As already mentioned, in the case of glass (typically amorphous), the wet etching process is isotropic, i.e., the etching rate is equal in all directions. Glass substrates are typically etched by using highly concentrated hydrofluoric acid (HF). Solutions combining HF with other strong acids, such as HCl, HNO3, H2SO4, and H3PO4, are also used, mainly to enhance the etching rate. The etching rate of wet etching is high (approximately 7 μm/min for borosilicate glass) and it also allows for low roughness (even 10 nm) and high selectivity, which can reach up to 30:1. The isotropy, however, poses limitations to the achievable aspect ratios (approximately unity). Channels walls typically show rounded corners and undercuts. More information on this process can be found in the work of Iliescu et al. [57]. Additionally, the chemical and disposal costs can be very high because the etching material must be covered entirely with the etching solution, and in turn, this solution must be often changed to maintain the same nominal etching rate. The masking layers are typically made with photoresists such as SU-8, but can also be of metals (Cu, Cr, Ni) or silicon. The choice of the masking material depends on the required depth and quality of the etched features. A photoresist mask is limited to shallow etching (tens of microns), silicon-based masks enable the generation of deeper features (a few hundred microns), while structures as deep as 500 μm are achievable by using multilayer masks containing a combination of metals and hard-baked photoresist. Pore network patterns generated on glass substrates form rigid microfluidic systems, which are characterized by high transparency, thermal stability, and chemical resistance. These properties must not be changed by the subsequent bonding process. Sealing processes are usually achieved using temperature, adhesives, or electrostatic forces. One way is to use a furnace or a high-temperature oven [58]. Thermal bonding (also called ‘fusion bonding’) is the most common technique used for bonding two glass plates together. The two glass plates must also have identical or at least very similar thermal properties and coefficient of thermal expansion. Fused silica and borosilicate glass work well in this sense and are often the materials of choice. Another method involves placing a thin layer of polymer (a few nanometers thick) between the two glass plates and baking in a UV oven [59]. Glass bonding on silicon can also be achieved, via electric field-assisted or anodic bonding [60]: a gentle heating (∼400 °C) is applied while also applying an electric field across the silicon–glass sandwich. This is not suitable for all glass materials, since it is generally essential for the glass to contain sodium compounds (e.g., borosilicate glass), being the process based on the migration of the Na+ and O− ions [61]. This leads to the formation of a strong and stable bond with the silicon surface that can withstand very high pressures. Among the very many types of Si/glass microfluidics fabrication methods [62,63,64,65,66], micro powder blasting, relying on physical erosion by an abrasive powder jet accelerated towards the substrate, or laser micromachining are also possible, enabling for a cheap, fast, and complex three-dimensional micro-structuring. Borosilicate glass can also be bonded to polymers such as PDMS using oxygen plasma treatment.
4.4. Silicon
Because silicon has different physical properties than glass, the process parameters must be properly adjusted, but the process principles remain the same. Since silicon is opaque in the visible spectrum, direct optical visualization of fluid flow processes inside the pore network structures is possible only at the surface of a silicon wafer bonded to a transparent substrate (typically glass). A silicon-based microdevice may also be a three-layers device, made of a glass-silicon-glass architecture (GSG) if full transparency is required. The main advantage of using silicon over glass substrates is the ability to generate pore network structures with very high (sub-nanometer) resolution and accuracy. The etching techniques that were adapted from the semiconductor (microelectronics) industry enable the generation of pores and throats whose size is comparable to that of pores and throats in real rocks [67]. Both wet and dry etching methods can be applied. The Bosch® process (a specific type of DRIE) is the most common dry etching technique used routinely for the manufacture of microfluidic devices from silicon wafers, although other techniques (e.g., cryogenic plasma etching) are also used. Wet etching methods are also an option for the generation of pore network structures on silicon wafers. Depending on the solution used, the etching can be isotropic or anisotropic. Isotropic etching is obtained by using HNA (hydrofluoric, nitric, and acetic acid) solutions, while it is possible to obtain anisotropic etching by using aqueous KOH (potassium hydroxide) solution, which is less aggressive than the HNA solution.
Anodic bonding is the most common method used for bonding silicon to glass without using adhesives. Silicon-based micromodels were widely used to study transport processes in porous media.
4.5. Geomaterials
Geomaterials should also be mentioned among micromodel materials. Another drawback of 2D microfluidics, other than the information loss in the third dimension, is that devices may not be able to fully replicate the surface properties and the rock–fluid interactions of real porous media. The full modification of the surface chemistry by minerals-based coatings or the direct usage of geomaterials samples to engrave pore networks can improve the performance of microfluidic devices. For example, Gerami et al. [68] fabricated a microfluidic device by etching a fracture pattern on a coal surface by using three-dimensional laser micromachining. The surface roughness of real coal and the etched surface as well as the coal/brine/gas contact angles were compared under static and dynamic conditions, showing that the etched pattern has heterogeneous surface properties, well representative of real media. However, the results are preliminary and further development of such technology would be necessary.
5. Applications
The application of micromodels was very popular to study the behavior of single-phase and two-phase fluids in porous media during imbibition and drainage processes and the influence of wettability properties, and the correlation between numerical simulations and experimental observations [7]. The main applications of microfluidics to underground porous media are related to groundwater remediation [69], dissolution processes [70], water–oil separation [71], underground gas and hydrogen storage [2,72], CO2 storage [73,74,75], enhanced oil recovery [25], and the study of thermodynamic properties such as phase-change, solubility/miscibility, and diffusivity [76]. Recently, Wang et al. [77] designed a dual porosity microfluidic device to simulate a soil-groundwater system and investigate the formation process of a non-aqueous phase liquid (NAPL) contaminated layer. Park et al. [78] used a 2D PDMS-based device to assess the environmental impacts of the infiltration of acid mine drainage into a shallow aquifer. Significant works are summarized in Table 2.
5.1. Polymers
As already mentioned, polymer-based microfluidic devices typically allow for cheaper processes, high flexibility of applications, and cost-effective and relatively simple surface modifications. The application of PDMS micromodels was very popular to study the behavior of single-phase and two-phase fluids in porous media during imbibition and drainage processes and the influence of wettability properties, and the correlation between numerical simulations and experimental observations. Massimiani et al. [2] used PDMS micromodels to study drainage and imbibition phenomena occurring in underground gas storage systems. Xu et al. [43] used PDMS to study the influence of vugs, pore geometry, pore-width distribution, heterogeneity, and coordination numbers on the efficiency of water–oil displacement in low-porosity oil-wet media, by comparing eight different periodic and three random geometries with similar porosity and permeability. Their results showed that higher coordination numbers in periodic networks, pore width heterogeneity, and the presence of vugs in random networks all decreased displacement efficiency. Sun and Santamarina [79] proposed a PDMS microdevice for the visual observation and investigation of Haines jumps occurring during drainage. In the studies of Kunz et al. [30], PDMS microfluidics served as experimental validation of numerical simulations of a drainage process. Many works addressed the wettability issue, trying to develop methods for the alteration and precise control over the wettability of PDMS surfaces. Schneider et al. [28] altered the surface wettability of PDMS micromodels by UV-initiated graft polymerization of poly(acrylic acid) (PAA), to reproduce the wetting heterogeneity that is observed in many hydrocarbon reservoirs and measured the higher level of residual fluid due to wettability heterogeneities. Cottin et al. [42] also used PDMS chips to investigate the influence of wetting properties on the displacement front during drainage, showing how more water-wet conditions favor the predominance of viscous forces over capillary forces, which, in turn, also stabilize the advancing front, reducing fingering effects [65]. As demonstrated by Zhao et al. [80], PDMS can also be used as a cast form to replicate pore network patterns on photocurable polymers, such as Norland Optical Adhesive 81 (NOA81). Wägli et al. [44] also demonstrated that these thiolene-based resins could be applied for fluorescence-based microfluidic applications, which opened the way for further studies. Kenzhekhanov and Yin [47] used surface-modified thiolene-based microfluidic devices to investigate the effect of different temperatures and wettability conditions on water and surfactant flooding displacement in fractured and non-fractured geometries. Tsakiroglou and Avraam [59] developed a LIGA process for the fabrication of identical PMMA replicas of micromodels having a simple porous network with a broad pore depth and width range (10–100 μm), representative of real porous media. Sell et al. [81] used PMMA microdevices as micro-PVT cells for the investigation of CO2 diffusivity in water. Hsu et al. [82] created a COC microarray of channels with a central wider channel to simulate fractures on porous media and perform two-phase-flow experiments to investigate the spatial distribution of oil and groundwater subject to injection and extraction cycles. Gerami et al. [68] engraved a coal sample with a fractures pattern and used PDMS for sealing the etched fractures along the top surface of the geomaterial.
5.2. Glass
Glass-based microfluidic devices were the first to mimic underground porous media networks [54,83,84]: they can withstand very high internal pressures—up to a few tens of MPa (several hundred bars) if they are appropriately designed. Kamari et al. [85] fabricated a glass micromodel with a homogeneous irregular pattern with different fracture geometries to investigate the effect of geometrical characteristics of a single fracture on the breakthrough time during a miscible displacement process (n-Heptane displacing n-Decane). Buchgraber et al. [86] managed to create a two-porosity micromodel from Arab-D images: the resulting carbonate micromodel had an overall porosity of 46%, with some regions having a porosity as low as 11% and some areas having local porosity values as high as 74%. They demonstrated that greater permeability was associated with greater etch depth and that areas of high porosity, and, therefore, low capillary entry pressure, showed greater recovery factors if compared to areas dominated by microporosity with high capillary entry pressures. Khademolhosseini et al. [87] explored the influence of nanosilica and biosurfactants on interfacial tensions to improve oil recovery. More recently, Xu et al. [43] exploited the characteristic trapezoidal shape of channels obtained via wet-etching for the fabrication of 2.5 D micromodels. In commercial glass micromodels with varying channel widths, Van Rooijen et al. [88] measured the hysteresis of contact angles, during both imbibition and drainage, for a hydrogen/brine system, at a pressure of 10 bar.
5.3. Silicon
Gunda et al. [17] were the first to introduce the term “reservoir-on-a-chip” with the fabrication of a silicon-based microfluidic device with a pattern of channels based on the Delaunay triangulation, demonstrating that the dynamics of the fluid phases and the trapping phenomena inside the device produce recovery curves comparable to those of traditional core analysis. Keller et al. [67] used silicon-based micromodels to study the flow of NAPL or oil, water, and air at the pore scale, in a pore network that recreates the photomicrograph of a Berea sandstone. Pore dimensions of 3–30 μm were obtained. Fluid displacement and the influence of wetting layers in the displacement dynamics were observed. Födisch et al. [89] also used etched silicon wafers to perform oil–brine displacement, demonstrating how UV tracers attached to the connate water and the oleic phase allow for close monitoring of the flooding phenomena. Rock et al. [90] used a similar approach for the investigation of the viscoelastic properties of polymers in polymeric solutions for enhanced oil recovery (EOR). Gaol et al. [26] fabricated a glass-silicon-glass micromodel reproducing the pattern of a Bentheimer core plug with different permeability values to investigate how the displacement front proceeds through different regions. One example of polymer flooding for EOR application was also performed, to investigate the sweep efficiency improvement of oil in heterogeneous porous media. The channels created via dry-etching presented a depth of 50 ± 1 μm, with an aspect ratio of 6:1, and vertical walls with angles of 82–90°. The minimum pore size was around 8 μm, which is in good agreement with the micro-CT images, showing a minimum pore size of 5 μm. For the investigation of the trapping dynamics of CO2, Buchgraber et al. [86] also used glass–silicon–glass micromodels, whose homogenous pore space is geometrically and topologically similar to Berea sandstone. The pattern was obtained via DRIE and the average pore size was 25 μm.

Table 1.
Materials and geometrical information of significant works considered in this review.
| Material | Fabrication Techniques | Reference | Pattern Geometry | Pattern Dimensions | Channel Depth | Smallest Channel Width |
|---|---|---|---|---|---|---|
| PDMS | Soft- Lithography | Xu et al. [43] | Voronoi diagrams; Eight periodic networks | - | 14.6 μm | 4 µm |
| Casting on etched silicon | Kunz et al. [30] | Random network of rounded pillars | L = 25 mm, W = 1 mm | - | 160 μm | |
| Soft Lithography | Park et al. [78] | Uniform network | L = 49 mm, W = 30 mm | 50 µm | 120 µm | |
| Thiolene resin | Casting on PDMS mold | Kenzhekhanov S. and Yin X. [47] | Voronoi diagram | L = 5 mm, W = 15 mm | 10 µm | 8 μm |
| PMMA | LIGA process | Tsakiroglou, and Avraam [59] | Uniform squared network | L = 20 mm, W = 15 mm | 17.7 μm | 10 μm |
| Laser ablation | Sell et al. [81] | Serpentine | - | 50 μm | 100 μm | |
| COC | Lithography | Hsu et al. [82] | Uniform network and fracture | L = 30 mm, W = 30 mm | 100 µm | 200 µm |
| Glass | Wet etching | Amarasinghe et al. [74] | Random network | L = 51.2 mm, W = 7 mm | 40 µm | - |
| Wet etching | Van Rooijen et al. [88] | Irregular network | - | 20 µm | 50 µm | |
| Silicon | Reactive Ion Etching | Gunda et al. [17] | Delaunay triangulation | L = 35 mm, W = 5 mm | 41 µm | 25 µm |
| Wet etching | Keller et al. [67] | Real thin section image | L = 5.09 mm W = 5.09 mm | 15 µm | 3 µm | |
| Deep Reactive Ion Etching | Lysyy et al. [72] | Real thin section image | L = 28 mm, W = 22 mm | 30 µm | 10 µm | |
| Geomaterial | Laser etching | Gerami et al. [68] | Coal cleat structure | - | 112 µm–381 µm | 10 µm |
Table 2.
Applications and experimental thermodynamic conditions of significant microfluidic works considered in this review.
Table 2.
Applications and experimental thermodynamic conditions of significant microfluidic works considered in this review.
| Material | Reference | Application | Pressure | Temperature |
|---|---|---|---|---|
| PDMS | Xu et al. [43] | Investigation of the effects of pore geometry and interfacial tension on two-phase flow | 0.28–1.38 bar | 25 °C |
| Kunz et al. [30] | Comparison of numerical simulations with micromodel experiments | 1 bar | - | |
| Park et al. [78] | Pore-scale mixing and reactions between an iron sulfate solution and simulated groundwaters | Atmospheric pressure | 22 °C | |
| Thiolene resin | Kenzhekhanov S. and Yin X. [47] | Water and surfactant flooding displacement efficiencies in water-wet and oil-wet micromodels | 1 bar | 22 °C |
| PMMA | Sell et al. [81] | Measurement of the diffusion coefficient of carbon dioxide in water and brine | 5−50 bar | 26 °C |
| COC | Hsu et al. [82] | Drainage/Imbibition test in a fractured porous medium | 85 bar | 45 °C |
| Glass | Amarasinghe et al. [74] | Pore-scale CO2 convective mixing analysis in water and oil/water systems | 100 bar | 50 °C |
| Van Rooijen et al. [88] | Hydrogen-brine contact angle measurement for underground hydrogen storage | 10 bar | Ambient Temperature | |
| Silicon | Keller et al. [67] | Observation NAPL flow in water and air at the pore scale | Atmospheric pressure | Ambient Temperature |
| Lysyy et al. [72] | Description of pore-scale multiphase hydrogen flow in an aquifer storage scenario | 5 bar | 20 °C | |
| Geomaterial | Gerami et al. [68] | Contact angle measurements in coal fractures | up to 64 bar | 20 °C |
6. Conclusions
Microfluidics can be used as a powerful tool for the investigation of fluid flow phenomena occurring in underground porous media. Microfluidics allows for direct visualization of physical and chemical processes, and experiments can be repeated on the same geometrical pattern. Moreover, it offers the possibility to tune the material and the surface properties in a controlled way to replicate diverse rock–fluid interactions.
Limitations of microfluidics are mainly related to the simplifications that characterize synthetic replica that only mimic a natural system. In particular, the absence of the third dimension affects pore-scale phenomena. The relation between 2D and 3D rock properties, and 2D and 3D fluid behavior, is not yet clear and must be further investigated [91,92]. Approaches based on 2.5D or 3D printed devices were pursued to overcome this limitation [43,93]. Moreover, with traditional fabrication techniques, it is extremely difficult to achieve channel sizes smaller than a few microns, excluding the possibility of representing sub-micrometric pores. Another limitation of micromodels is that surface properties are not as complex as those of natural porous media. As already mentioned, researchers focused on wettability alteration and mineral coatings, and similar approaches may be addressed in new investigations.
As well documented by the technical literature, the parallel growth of technological strategies for the development of adequate devices on one side and the implementation of computational tools on the other side appears as a promising route for mimicking porous media and investigating the phenomena occurring during single or multiphase fluid flow, even in the presence of interactions with the solid matrix. Reported examples of applications to underground engineering are very encouraging and seem to open new perspectives for enhancing our ability to understand and manage processes involving key environmental issues such as gas and hydrogen storage, CO2 geological storage, and groundwater and soil remediation.
Author Contributions
Conceptualization, A.M., F.P. and D.V.; writing—original draft preparation, A.M. and F.P.; writing—review and editing, D.V., F.V., M.C. and M.Q.; visualization, A.M. and F.P.; supervision, D.V. and S.L.M.; project administration, D.V., F.V. and C.F.P.; funding acquisition, F.V. and C.F.P. All authors have read and agreed to the published version of the manuscript.
Funding
This research received no external funding.
Data Availability Statement
The data presented in this study are available in the article.
Conflicts of Interest
The authors declare no conflict of interest.
Abbreviations
| COC | Cyclic Olefin Copolymer |
| DRIE | Deep Reactive Ion Etching |
| EOR | Enhanced Oil Recovery |
| Micro-CT | Micro-Computed Tomography |
| NAPL | Non-Aqueous Phase Liquid |
| PDMS | Poly-Di-Methyl-Siloxane |
| PMMA | Poly-Methyl-Meth-Acrylate |
| RIE | Reactive Ion Etching |
| QSGS | Quartet Structure Generation Set |
References
- Konangi, S.; Palakurthi, N.K.; Karadimitriou, N.K.; Comer, K.; Ghia, U. Comparison of pore-scale capillary pressure to macroscale capillary pressure using direct numerical simulations of drainage under dynamic and quasi-static conditions. Adv. Water Resour. 2021, 147, 103792. [Google Scholar] [CrossRef]
- Massimiani, A.; Panini, F.; Marasso, S.L.; Vasile, N.; Quaglio, M.; Coti, C.; Barbieri, D.; Verga, F.; Pirri, C.F.; Viberti, D. Design, Fabrication, and Experimental Validation of Microfluidic Devices for the Investigation of Pore-Scale Phenomena in Underground Gas Storage Systems. Micromachines 2023, 14, 308. [Google Scholar] [CrossRef] [PubMed]
- Anderson, T. Applications of additive manufacturing to rock analogue fabrication. In Proceedings of the SPE Annual Technical Conference and Exhibition, Dubai, United Arab Emirates, 26–28 September 2016. [Google Scholar]
- Kong, L.; Ostadhassan, M.; Zamiran, S.; Liu, B.; Li, C.; Marino, G.G. Geomechanical upscaling methods: Comparison and verification via 3D printing. Energies 2019, 12, 382. [Google Scholar] [CrossRef] [Green Version]
- Suzuki, A.; Watanabe, N.; Li, K.; Horne, R.N. Fracture network created by 3-D printer and its validation using CT images. Water Resour. Res. 2017, 53, 6330–6339. [Google Scholar] [CrossRef]
- Ahkami, M.; Roesgen, T.; Saar, M.O.; Kong, X.-Z. High-resolution temporo-ensemble PIV to resolve pore-scale flow in 3D-printed fractured Porous Media. Transp. Porous Media 2019, 129, 467–483. [Google Scholar] [CrossRef]
- Yiotis, A.; Karadimitriou, N.K.; Zarikos, I.; Steeb, H. Pore-scale effects during the transition from capillary- to viscosity-dominated flow dynamics within microfluidic porous-like domains. Sci. Rep. 2021, 11, 3891. [Google Scholar] [CrossRef]
- Soulaine, C.; Maes, J.; Roman, S. Computational microfluidics for geosciences. Front. Water 2021, 3, 643714. [Google Scholar] [CrossRef]
- Jahanbakhsh, A.; Wlodarczyk, K.L.; Hand, D.P.; Maier, R.R.J.; Maroto-Valer, M.M. Review of Microfluidic Devices and Imaging Techniques for Fluid Flow Study in Porous Geomaterials. Sensors 2020, 20, 4030. [Google Scholar] [CrossRef]
- Karadimitriou, N.K.; Hassanizadeh, S.M. A review of micromodels and their use in two-phase flow studies. Vadose Zone J. 2012, 11, vzj2011.0072. [Google Scholar] [CrossRef] [Green Version]
- Wu, M.; Xiao, F.; Johnson-Paben, R.M.; Retterer, S.T.; Yin, X.; Neeves, K.B. Single- and two-phase flow in microfluidic porous media analogs based on Voronoi tessellation. Lab Chip 2012, 12, 253–261. [Google Scholar] [CrossRef]
- Heidari, S.; Ahmadi, M.; Esmaeilzadeh, F.; Mowla, D. Oil recovery from fractured reservoirs using in situ and preformed particle gels in micromodel structures. J. Pet. Explor. Prod. Technol. 2019, 9, 2309–2317. [Google Scholar] [CrossRef] [Green Version]
- Buchgraber, M.; Clemens, T.; Castanier, L.M.; Kovscek, A.R. A microvisual study of the displacement of viscous oil by polymer solutions. SPE Reserv. Eval. Eng. 2011, 14, 269–280. [Google Scholar] [CrossRef]
- Chen, Y.; Li, Y.; Valocchi, A.J.; Christensen, K.T. Lattice Boltzmann simulations of liquid CO2 displacing water in a 2D heterogeneous micromodel at reservoir pressure conditions. J. Contam. Hydrol. 2018, 212, 14–27. [Google Scholar] [CrossRef] [PubMed]
- Karadimitriou, N.K. Two-Phase Flow Experimental Studies in Micro-Models. Ph.D. Thesis, Utrecht University, Utrecht, The Netherlands, 2013. [Google Scholar]
- Joekar-Niasar, V.; Hassanizadeh, S.M.; Dahle, H.K. Non-equilibrium effects in capillarity and interfacial area in two-phase flow: Dynamic pore-network modelling. J. Fluid Mech. 2010, 655, 38–71. [Google Scholar] [CrossRef]
- Gunda, N.S.K.; Bera, B.; Karadimitriou, N.K.; Mitra, S.K.; Hassanizadeh, S.M. Reservoir-on-a-Chip (ROC): A new paradigm in reservoir engineering. Lab Chip 2011, 11, 3785–3792. [Google Scholar] [CrossRef] [Green Version]
- Porter, M.L.; Jiménez-Martínez, J.; Martinez, R.; McCulloch, Q.; Carey, J.W.; Viswanathan, H.S. Geo-material microfluidics at reservoir conditions for subsurface energy resource applications. Lab Chip 2015, 15, 4044–4053. [Google Scholar] [CrossRef]
- Lindquist, W.B.; Lee, S.-M.; Coker, D.A.; Jones, K.W.; Spanne, P. Medial axis analysis of void structure in three-dimensional tomographic images of porous media. J. Geophys. Res. Solid Earth 1996, 101, 8297–8310. [Google Scholar] [CrossRef] [Green Version]
- Raeini, A.Q.; Bijeljic, B.; Blunt, M.J. Generalized network modeling: Network extraction as a coarse-scale discretization of the void space of porous media. Phys. Rev. E 2017, 96, 013312. [Google Scholar] [CrossRef] [PubMed] [Green Version]
- Viberti, D.; Peter, C.; Borello, E.S.; Panini, F. Pore structure characterization through path-finding and lattice Boltzmann simulation. Adv. Water Resour. 2020, 141, 103609. [Google Scholar] [CrossRef]
- Panini, F.; Salina Borello, E.; Peter, C.; Viberti, D. Application of a* Algorithm for Tortuosity and Effective Porosity Estimation of 2D Rock Images. In Advanced Problem in Mechanics II: Proceedings of the XLVIII International Summer School-Conference “Advanced Problems in Mechanics”, 2020, St. Petersburg, Russia; Springer International Publishing: Cham, The Netherlands, 2020; pp. 519–530. [Google Scholar]
- Wang, M.; Wang, J.; Pan, N.; Chen, S. Mesoscopic predictions of the effective thermal conductivity for microscale random porous media. Phys. Rev. E 2007, 75, 036702. [Google Scholar] [CrossRef] [Green Version]
- Borello, E.S.; Peter, C.; Panini, F.; Viberti, D. Application of A∗ algorithm for microstructure and transport properties characterization from 3D rock images. Energy 2022, 239, 122151. [Google Scholar] [CrossRef]
- Lei, W.; Liu, T.; Xie, C.; Yang, H.; Wu, T.; Wang, M. Enhanced oil recovery mechanism and recovery performance of micro-gel particle suspensions by microfluidic experiments. Energy Sci. Eng. 2020, 8, 986–998. [Google Scholar] [CrossRef] [Green Version]
- Gaol, C.L.; Wegner, J.; Ganzer, L. Real structure micromodels based on reservoir rocks for enhanced oil recovery (EOR) applications. Lab Chip 2020, 20, 2197–2208. [Google Scholar] [CrossRef] [PubMed]
- Anbari, A.; Chien, H.; Datta, S.S.; Deng, W.; Weitz, D.A.; Fan, J. Microfluidic model porous media: Fabrication and applications. Small 2018, 14, e1703575. [Google Scholar] [CrossRef] [PubMed]
- Schneider, M.H.; Tabeling, P. Lab-on-chip methodology in the energy industry: Wettability patterns and their impact on fluid displacement in oil reservoir models. Am. J. Appl. Sci. 2011, 8, 927–932. [Google Scholar] [CrossRef]
- Bartolo, D.; Degré, G.; Nghe, P.; Studer, V. Microfluidic stickers. Lab Chip 2007, 8, 274–279. [Google Scholar] [CrossRef]
- Kunz, P.; Zarikos, I.M.; Karadimitriou, N.K.; Huber, M.; Nieken, U.; Hassanizadeh, S.M. Study of multi-phase flow in porous media: Comparison of SPH simulations with micro-model experiments. Transp. Porous Media 2015, 114, 581–600. [Google Scholar] [CrossRef] [Green Version]
- Deshmukh, S.S.; Goswami, A. Recent developments in hot embossing—A review. Mater. Manuf. Process. 2021, 36, 501–543. [Google Scholar] [CrossRef]
- Schomburg, W.K.; Vollmer, J.; Bustgens, B.; Fahrenberg, J.; Hein, H.; Menz, W. Microfluidic components in LIGA technique. J. Micromech. Microeng. 1994, 4, 186–191. [Google Scholar] [CrossRef]
- Marasso, S.L.; Mombello, D.; Cocuzza, M.; Casalena, D.; Ferrante, I.; Nesca, A.; Poiklik, P.; Rekker, K.; Aaspollu, A.; Ferrero, S.; et al. A polymer Lab-on-a-Chip for genetic analysis using the arrayed primer extension on microarray chips. Biomed. Microdevices 2014, 16, 661–670. [Google Scholar] [CrossRef]
- Tsao, C.-W. Polymer microfluidics: Simple, Low-cost fabrication process bridging academic lab research to commercialized production. Micromachines 2016, 7, 225. [Google Scholar] [CrossRef] [Green Version]
- Quaglio, M.; Bianco, S.; Castagna, R.; Cocuzza, M.; Pirri, C. Elastomeric nanocomposite based on carbon nanotubes for Polymerase Chain Reaction device. Microelectron. Eng. 2011, 88, 1860–1863. [Google Scholar] [CrossRef]
- Vitale, A.; Quaglio, M.; Marasso, S.L.; Chiodoni, A.; Cocuzza, M.; Bongiovanni, R. Direct photolithography of perfluoropolyethers for solvent-resistant microfluidics. Langmuir 2013, 29, 15711–15718. [Google Scholar] [CrossRef] [PubMed]
- Vitale, A.; Quaglio, M.; Chiodoni, A.; Bejtka, K.; Cocuzza, M.; Pirri, C.F.; Bongiovanni, R. Oxygen-Inhibition Lithography for the Fabrication of Multipolymeric Structures. Adv. Mater. 2015, 27, 4560–4565. [Google Scholar] [CrossRef] [PubMed]
- Bertana, V.; Potrich, C.; Scordo, G.; Scaltrito, L.; Ferrero, S.; Lamberti, A.; Perrucci, F.; Pirri, C.F.; Pederzolli, C.; Cocuzza, M.; et al. 3D-printed microfluidics on thin poly(methyl methacrylate) substrates for genetic applications. J. Vac. Sci. Technol. B 2018, 36, 01A106. [Google Scholar] [CrossRef]
- Raj, M.K.; Chakraborty, S. PDMS microfluidics: A mini review. J. Appl. Polym. Sci. 2020, 137, 48958. [Google Scholar] [CrossRef]
- Xia, Y.; Whitesides, G.M. Soft lithography. Angew. Chem. Int. Ed. 1998, 37, 550–575. [Google Scholar] [CrossRef]
- McDonald, J.C.; Duffy, D.C.; Anderson, J.R.; Chiu, D.T.; Wu, H.; Schueller, O.J.A.; Whitesides, G.M. Fabrication of microfluidic systems in poly(dimethylsiloxane). Electrophor. Int. J. 2000, 21, 27–40. [Google Scholar] [CrossRef]
- Cottin, C.; Bodiguel, H.; Colin, A. Influence of wetting conditions on drainage in porous media: A microfluidic study. Phys. Rev. E 2011, 84, 026311. [Google Scholar] [CrossRef]
- Xu, W.; Ok, J.T.; Xiao, F.; Neeves, K.B.; Yin, X. Effect of pore geometry and interfacial tension on water-oil displacement efficiency in oil-wet microfluidic porous media analogs. Phys. Fluids 2014, 26, 093102. [Google Scholar] [CrossRef]
- Wägli, P.; Homsy, A.; de Rooij, N. Norland optical adhesive (NOA81) microchannels with adjustable wetting behavior and high chemical resistance against a range of mid-infrared-transparent organic solvents. Sens. Actuators B Chem. 2011, 156, 994–1001. [Google Scholar] [CrossRef]
- Li, R.; Lv, X.; Deng, Y. NOA 81 fabricated microfluidic chip for SH-SY5Y cell culture. In Proceedings of the 2015 IEEE International Conference on Mechatronics and Automation (ICMA), Beijing, China, 2–5 August 2015; pp. 994–998. [Google Scholar]
- Wägli, P.; Guélat, B.; Homsy, A.; De Rooij, N. Microfluidic devices made of UV-curable glue (NOA81) for fluorescence detection based applications. In Proceedings of the 14th International Conference on Miniaturized Systems for Chemistry and Life Sciences, Groningen, The Netherlands, 3–7 October 2010; pp. 3–7. [Google Scholar]
- Kenzhekhanov, S. Chemical EOR Process Visualization Using NOA81 Micromodels; Colorado School of Mines: Golden, CO, USA, 2016. [Google Scholar]
- Becker, H.; Locascio, L.E. Polymer microfluidic devices. Talanta 2002, 56, 267–287. [Google Scholar] [CrossRef] [PubMed]
- Heng, Q.; Tao, C.; Tie-Chuan, Z. Surface roughness analysis and improvement of micro-fluidic channel with excimer laser. Microfluid. Nanofluid. 2006, 2, 357–360. [Google Scholar] [CrossRef]
- Fiorini, G.S.; Chiu, D.T. Disposable microfluidic devices: Fabrication, function, and application. Biotechniques 2005, 38, 429–446. [Google Scholar] [CrossRef] [PubMed] [Green Version]
- Hong, T.-F.; Ju, W.-J.; Wu, M.-C.; Tai, C.-H.; Tsai, C.-H.; Fu, L.-M. Rapid prototyping of PMMA microfluidic chips utilizing a CO2 laser. Microfluid. Nanofluid. 2010, 9, 1125–1133. [Google Scholar] [CrossRef]
- Gomez, D.; Goenaga, I.; Lizuain, I.; Ozaita, M. Femtosecond laser ablation for microfluidics. Opt. Eng. 2005, 44, 051105. [Google Scholar]
- Arnold, J.; Dasbach, U.; Ehrfeld, W.; Hesch, K.; Löwe, H. Combination of excimer laser micromachining and replication processes suited for large scale production. Appl. Surf. Sci. 1995, 86, 251–258. [Google Scholar] [CrossRef]
- Chatenever, A.; Calhoun, J.C.J. Visual examinations of fluid behavior in porous media—Part I. J. Pet. Technol. 1952, 4, 149–156. [Google Scholar] [CrossRef]
- Chuoke, R.L.; Van Meurs, P.; Van Der Poel, C. The instability of slow, immiscible, viscous liquid-liquid displacements in permeable media. Trans. AIME 1959, 216, 188–194. [Google Scholar] [CrossRef]
- Corapcioglu, M.Y.; Fedirchuk, P. Glass bead micromodel study of solute transport. J. Contam. Hydrol. 1999, 36, 209–230. [Google Scholar] [CrossRef]
- Iliescu, C.; Chen, B.; Miao, J. On the wet etching of Pyrex glass. Sens. Actuators A Phys. 2008, 143, 154–161. [Google Scholar] [CrossRef]
- Avraam, D.G.; Kolonis, G.B.; Roumeliotis, T.C.; Constantinides, G.; Payatakes, A.C. Steady-state two-phase flow through planar and nonplanar model porous media. Transp. Porous Media 1994, 16, 75–101. [Google Scholar] [CrossRef]
- Tsakiroglou, C.D.; Avraam, D. Fabrication of a new class of porous media models for visualization studies of multiphase flow processes. J. Mater. Sci. 2002, 37, 353–363. [Google Scholar] [CrossRef]
- Giordano, N.; Cheng, J. Microfluid mechanics: Progress and opportunities. J. Phys. Condens. Matter 2001, 13, R271–R295. [Google Scholar] [CrossRef] [Green Version]
- Knowles, K.; Van Helvoort, A. Anodic bonding. Int. Mater. Rev. 2006, 51, 273–311. [Google Scholar] [CrossRef]
- Park, D.S.; Cho, M.W.; Lee, H.; Cho, W.S. Micro-grooving of glass using micro-abrasive jet machining. J. Mater. Process. Technol. 2004, 146, 234–240. [Google Scholar] [CrossRef]
- Marasso, S.; Canavese, G.; Cocuzza, M.; Ferrarini, A.; Giuri, E.; Bartolo, S.L.; Mantero, G.; Perrone, D.; Quaglio, M.; Vallini, I. APEX protocol implementation on a lab-on-a-chip for SNPs detection. Microelectron. Eng. 2008, 85, 1326–1329. [Google Scholar] [CrossRef]
- Marasso, S.L.; Giuri, E.; Canavese, G.; Castagna, R.; Quaglio, M.; Ferrante, I.; Perrone, D.; Cocuzza, M. A multilevel Lab on chip platform for DNA analysis. Biomed. Microdevices 2011, 13, 19–27. [Google Scholar] [CrossRef]
- Henley, W.H.; Dennis, P.J.; Ramsey, J.M. Fabrication of microfluidic devices containing patterned microwell arrays. Anal. Chem. 2012, 84, 1776–1780. [Google Scholar] [CrossRef]
- Ku, X.; Zhang, Z.; Liu, X.; Chen, L.; Li, G. Low-cost rapid prototyping of glass microfluidic devices using a micromilling technique. Microfluid. Nanofluid. 2018, 22, 82. [Google Scholar] [CrossRef]
- Keller, A.A.; Blunt, M.J.; Roberts, A.P.V. Micromodel observation of the role of oil layers in three-phase flow. Transp. Porous Media 1997, 26, 277–297. [Google Scholar] [CrossRef]
- Gerami, A.; Armstrong, R.T.; Johnston, B.; Warkiani, M.E.; Mosavat, N.; Mostaghimi, P. Coal-on-a-chip: Visualizing flow in coal fractures. Energy Fuels 2017, 31, 10393–10403. [Google Scholar] [CrossRef]
- Browne, C.A.; Shih, A.; Datta, S.S. Pore-scale flow characterization of polymer solutions in microfluidic porous media. Small 2019, 16, e1903944. [Google Scholar] [CrossRef] [Green Version]
- Poonoosamy, J.; Soulaine, C.; Burmeister, A.; Deissmann, G.; Bosbach, D.; Roman, S. Microfluidic flow-through reactor and 3D Raman imaging for in situ assessment of mineral reactivity in porous and fractured porous media. Lab Chip 2020, 20, 2562–2571. [Google Scholar] [CrossRef]
- Quaglio, M.; Frascella, F.; Marasso, S.L.; Cocuzza, M.; Viberti, D.; Amendola, A.; Carminati, S.; Pirri, C.F. Design and Characterization of Microfluidic Devices for Water/Oil Separation. In Proceedings of the Offshore Mediterranean Conference and Exhibition, Ravenna, Italy, 27–29 March 2019. [Google Scholar]
- Lysyy, M.; Ersland, G.; Fernø, M. Pore-scale dynamics for underground porous media hydrogen storage. Adv. Water Resour. 2022, 163, 104167. [Google Scholar] [CrossRef]
- Tian, J.; Chen, Q.; Qin, C.; Kang, Y.; Jia, N.; Xi, Z. Pore-scale systematic study on the disconnection of bulk gas phase during water imbibition using visualized micromodels. Phys. Fluids 2022, 34, 062015. [Google Scholar] [CrossRef]
- Amarasinghe, W.; Farzaneh, S.; Fjelde, I.; Sohrabi, M.; Guo, Y. A Visual Investigation of CO2 Convective Mixing in Water and Oil at the Pore Scale Using a Micromodel Apparatus at Reservoir Conditions. Gases 2021, 1, 53–67. [Google Scholar] [CrossRef]
- Datta, S.S.; Battiato, I.; Fernø, M.A.; Juanes, R.; Parsa, S.; Prigiobbe, V.; Santanach-Carreras, E.; Song, W.; Biswal, S.L.; Sinton, D. Lab on a chip for a low-carbon future. Lab Chip 2023, 23, 1358–1375. [Google Scholar] [CrossRef] [PubMed]
- Molla, S.; Mostowfi, F. Novel Microfluidic Device for Dew Point Pressure Measurement of Retrograde Gas Condensates Using a Microfluidic Device. Energy Fuels 2021, 35, 11154–11161. [Google Scholar] [CrossRef]
- Wang, X.; Wang, X.; He, T.; Li, Y.; Hou, L. The mechanism of NAPL layer formation in a microfluidic device with dual-permeability: Experiments and numerical simulation. IOP Conf. Ser. Earth Environ. Sci. 2021, 675, 012175. [Google Scholar] [CrossRef]
- Park, S.; Anggraini, T.M.; Chung, J.; Kang, P.K.; Lee, S. Microfluidic pore model study of precipitates induced by the pore-scale mixing of an iron sulfate solution with simulated groundwater. Chemosphere 2021, 271, 129857. [Google Scholar] [CrossRef]
- Sun, Z.; Santamarina, J.C. Haines jumps: Pore scale mechanisms. Phys. Rev. E 2019, 100, 023115. [Google Scholar] [CrossRef] [Green Version]
- Zhao, J.; Yao, G.; Wen, D. Pore-scale simulation of water/oil displacement in a water-wet channel. Front. Chem. Sci. Eng. 2019, 13, 803–814. [Google Scholar] [CrossRef] [Green Version]
- Sell, A.; Fadaei, H.; Kim, M.; Sinton, D. Measurement of CO2 diffusivity for carbon sequestration: A microfluidic approach for reservoir-specific analysis. Environ. Sci. Technol. 2013, 47, 71–78. [Google Scholar] [CrossRef]
- Hsu, S.-Y.; Zhang, Z.-Y.; Tsao, C.-W. Thermoplastic micromodel investigation of two-phase flows in a fractured porous medium. Micromachines 2017, 8, 38. [Google Scholar] [CrossRef] [Green Version]
- Campbell, B.T.; Orr, F.M. Flow visualization for CO2/crude-oil displacements. Soc. Pet. Eng. J. 1985, 25, 665–678. [Google Scholar] [CrossRef]
- Lenormand, R.; Touboul, E.; Zarcone, C. Numerical models and experiments on immiscible displacements in porous media. J. Fluid Mech. 1988, 189, 165–187. [Google Scholar] [CrossRef]
- Kamari, E.; Rashtchian, D.; Shadizadeh, S.R. Micro-model experimental study of fracture geometrical effect on breakthrough time in miscible displacement process. Iran. J. Chem. Chem. Eng. 2011, 30, 1–7. [Google Scholar]
- Buchgraber, M.; Al-Dossary, M.; Ross, C.; Kovscek, A.R. Creation of a dual-porosity micromodel for pore-level visualization of multiphase flow. J. Pet. Sci. Eng. 2012, 86–87, 27–38. [Google Scholar] [CrossRef]
- Khademolhosseini, R.; Jafari, A.; Shabani, M.H. Micro scale investigation of enhanced oil recovery using nano/bio materials. Procedia Mater. Sci. 2015, 11, 171–175. [Google Scholar] [CrossRef] [Green Version]
- Van Rooijen, W. Dynamic Contact Angle Measurement Using Microfluidic Experiments Relevant for Hydrogen Subsurface Storage. Master’s Thesis, Delft University of Technology, Delft, The Netherlands, 2021. [Google Scholar]
- Födisch, H.; Hincapie, R.; Wegner, J.; Ganzer, L. Visualization of connate water replacement during flooding experiments using Glass-Silicon-Glass micromodels. In Proceedings of the 77th EAGE Conference and Exhibition 2015, Madrid, Spain, 1–4 June 2015; European Association of Geoscientists & Engineers: Utrecht, The Netherlands, 2015; pp. 1–3. [Google Scholar]
- Rock, A.; Hincapie, R.; Wegner, J.; Födisch, H.; Ganzer, L. Pore-scale Visualization of Polymer Viscoelasticity using Particle Tracing in Glass-silicon-glass Micromodels. In Proceedings of the 78th EAGE Conference and Exhibition 2016, Online, 30 May –2 June 2016; European Association of Geoscientists & Engineers: Utrecht, The Netherlands, 2016; pp. 1–3. [Google Scholar]
- Saxena, N.; Mavko, G.; Hofmann, R.; Srisutthiyakorn, N. Estimating permeability from thin sections without reconstruction: Digital rock study of 3D properties from 2D images. Comput. Geosci. 2017, 102, 79–99. [Google Scholar] [CrossRef] [Green Version]
- Hussaini, S.R.; Dvorkin, J. Permeability in the thin section. J. Pet. Sci. Eng. 2022, 218, 110959. [Google Scholar] [CrossRef]
- Ishutov, S. Establishing framework for 3D printing porous rock models in curable resins. Transp. Porous Media 2019, 129, 431–448. [Google Scholar] [CrossRef]
Figure 1.
Simplified sandwich structure of a microfluidic device, showing the two bonded layers. The patterned layer reproduces the designed geometric features; the covering layer confines the fluid. Inlet and outlet ports can be hosted in either the patterned or the bonding layer.
Figure 1.
Simplified sandwich structure of a microfluidic device, showing the two bonded layers. The patterned layer reproduces the designed geometric features; the covering layer confines the fluid. Inlet and outlet ports can be hosted in either the patterned or the bonding layer.

Figure 2.
Sketch of a typical experimental set-up for microfluidic tests. Fluids are pumped into the device and collected at the outlet. The fluid dynamics occurring inside the device is monitored with appropriate imaging techniques and sensors.
Figure 2.
Sketch of a typical experimental set-up for microfluidic tests. Fluids are pumped into the device and collected at the outlet. The fluid dynamics occurring inside the device is monitored with appropriate imaging techniques and sensors.

Figure 3.
Design and fabrication workflow of micromodels for the investigation of pore-scale phenomena.
Figure 3.
Design and fabrication workflow of micromodels for the investigation of pore-scale phenomena.

Figure 4.
Examples of patterns: (a) regular pattern; (b) irregular pattern based on Voronoi diagrams.
Figure 4.
Examples of patterns: (a) regular pattern; (b) irregular pattern based on Voronoi diagrams.

Figure 5.
Example of a micromodel design using a multi-step approach [25].
Figure 5.
Example of a micromodel design using a multi-step approach [25].

Figure 6.
Scheme of the photolithographic approach. The photoresist is spin-coated on the chosen substrate and exposed to UV light with the interposition of a patterned mask. Positive photoresists degrade when exposed to radiation, and negative photoresists cure. The final structure can be either directly used as a master mold (soft lithography) (a) or serve as a mask for further processes (etching) (b).

Figure 7.
The isotropic and anisotropic behavior of wet- and dry-etching.

Disclaimer/Publisher’s Note: The statements, opinions and data contained in all publications are solely those of the individual author(s) and contributor(s) and not of MDPI and/or the editor(s). MDPI and/or the editor(s) disclaim responsibility for any injury to people or property resulting from any ideas, methods, instructions or products referred to in the content. |
© 2023 by the authors. Licensee MDPI, Basel, Switzerland. This article is an open access article distributed under the terms and conditions of the Creative Commons Attribution (CC BY) license (https://creativecommons.org/licenses/by/4.0/).
Share and Cite
MDPI and ACS Style
Massimiani, A.; Panini, F.; Marasso, S.L.; Cocuzza, M.; Quaglio, M.; Pirri, C.F.; Verga, F.; Viberti, D. 2D Microfluidic Devices for Pore-Scale Phenomena Investigation: A Review. Water 2023, 15, 1222. https://doi.org/10.3390/w15061222
AMA Style
Massimiani A, Panini F, Marasso SL, Cocuzza M, Quaglio M, Pirri CF, Verga F, Viberti D. 2D Microfluidic Devices for Pore-Scale Phenomena Investigation: A Review. Water. 2023; 15(6):1222. https://doi.org/10.3390/w15061222
Chicago/Turabian StyleMassimiani, Alice, Filippo Panini, Simone Luigi Marasso, Matteo Cocuzza, Marzia Quaglio, Candido Fabrizio Pirri, Francesca Verga, and Dario Viberti. 2023. "2D Microfluidic Devices for Pore-Scale Phenomena Investigation: A Review" Water 15, no. 6: 1222. https://doi.org/10.3390/w15061222
Note that from the first issue of 2016, this journal uses article numbers instead of page numbers. See further details here.