
Design for the Prediction of Peak Outflow of Embankment Breaching Due to Overtopping by Regression Technique and Modelling
 , , , and
Abstract
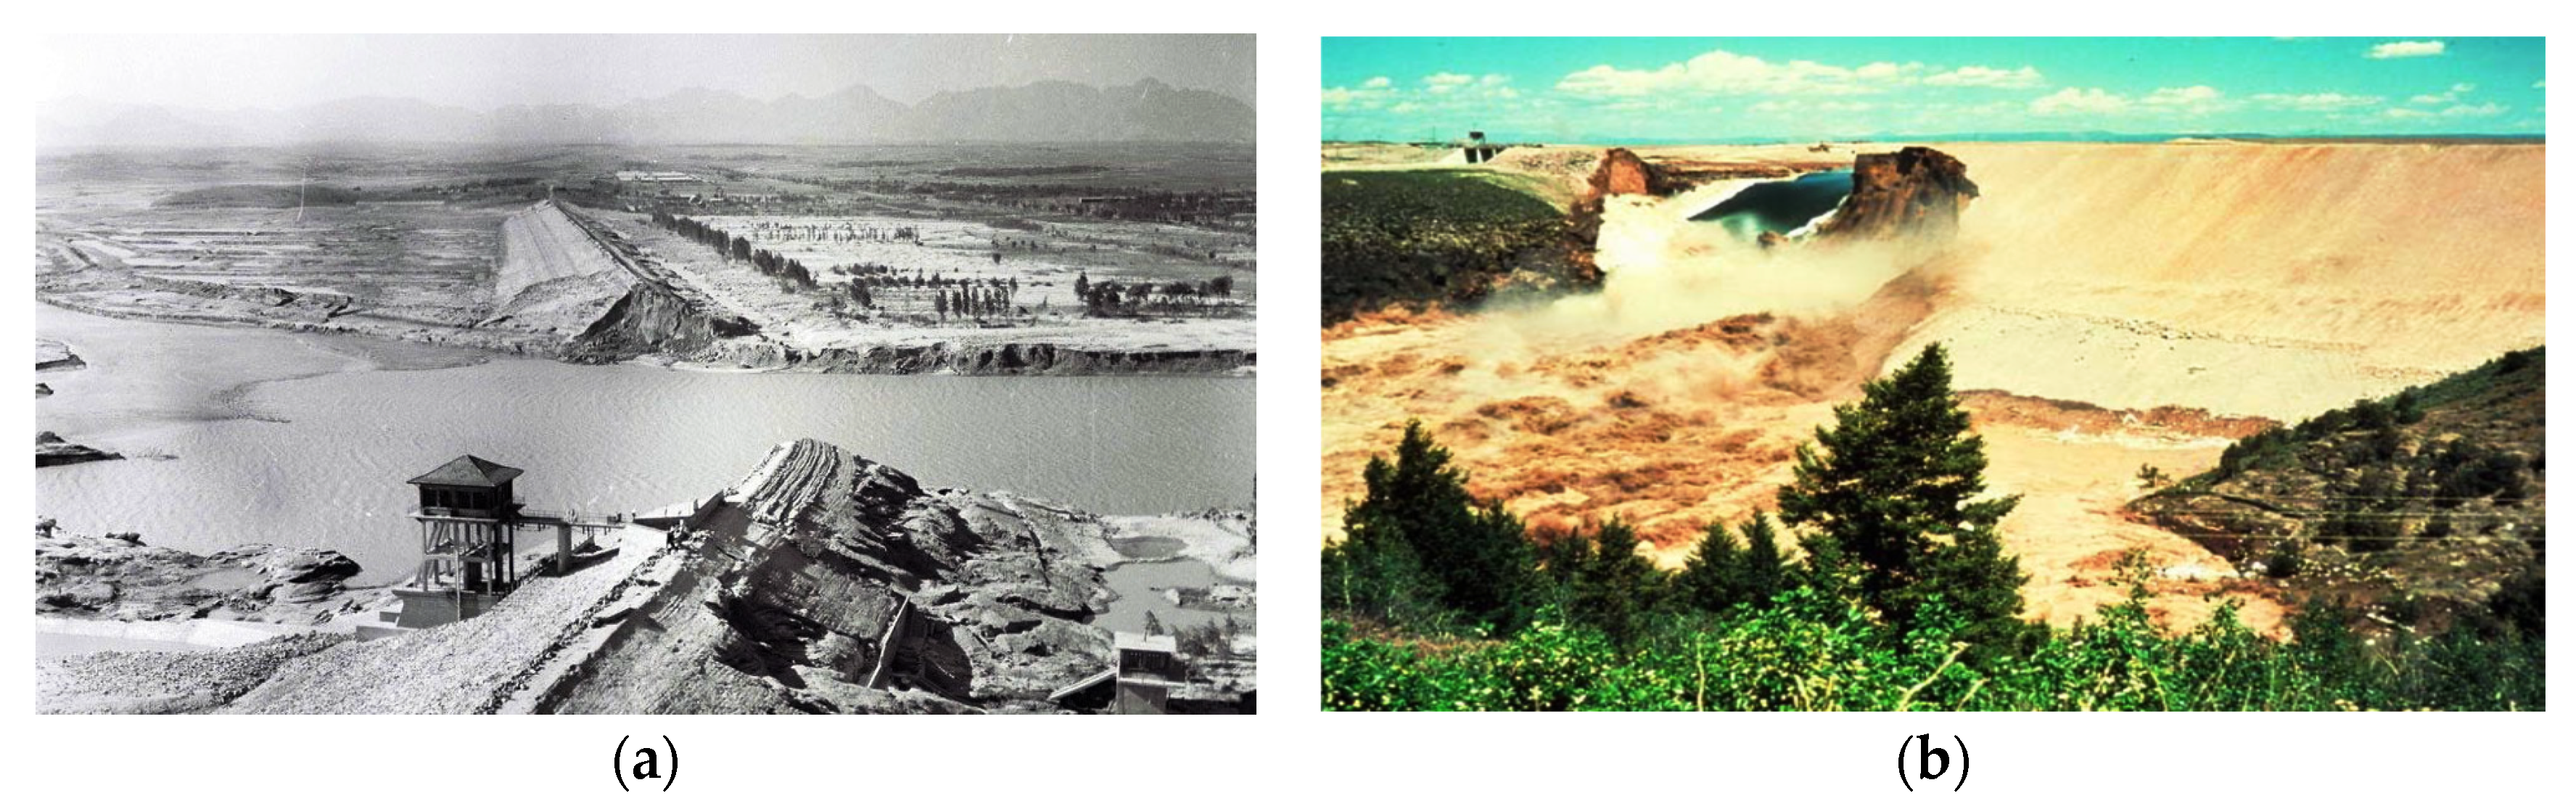
:1. Introduction
2. Breach Formation Models
3. Design Parameter for the Embankment Models
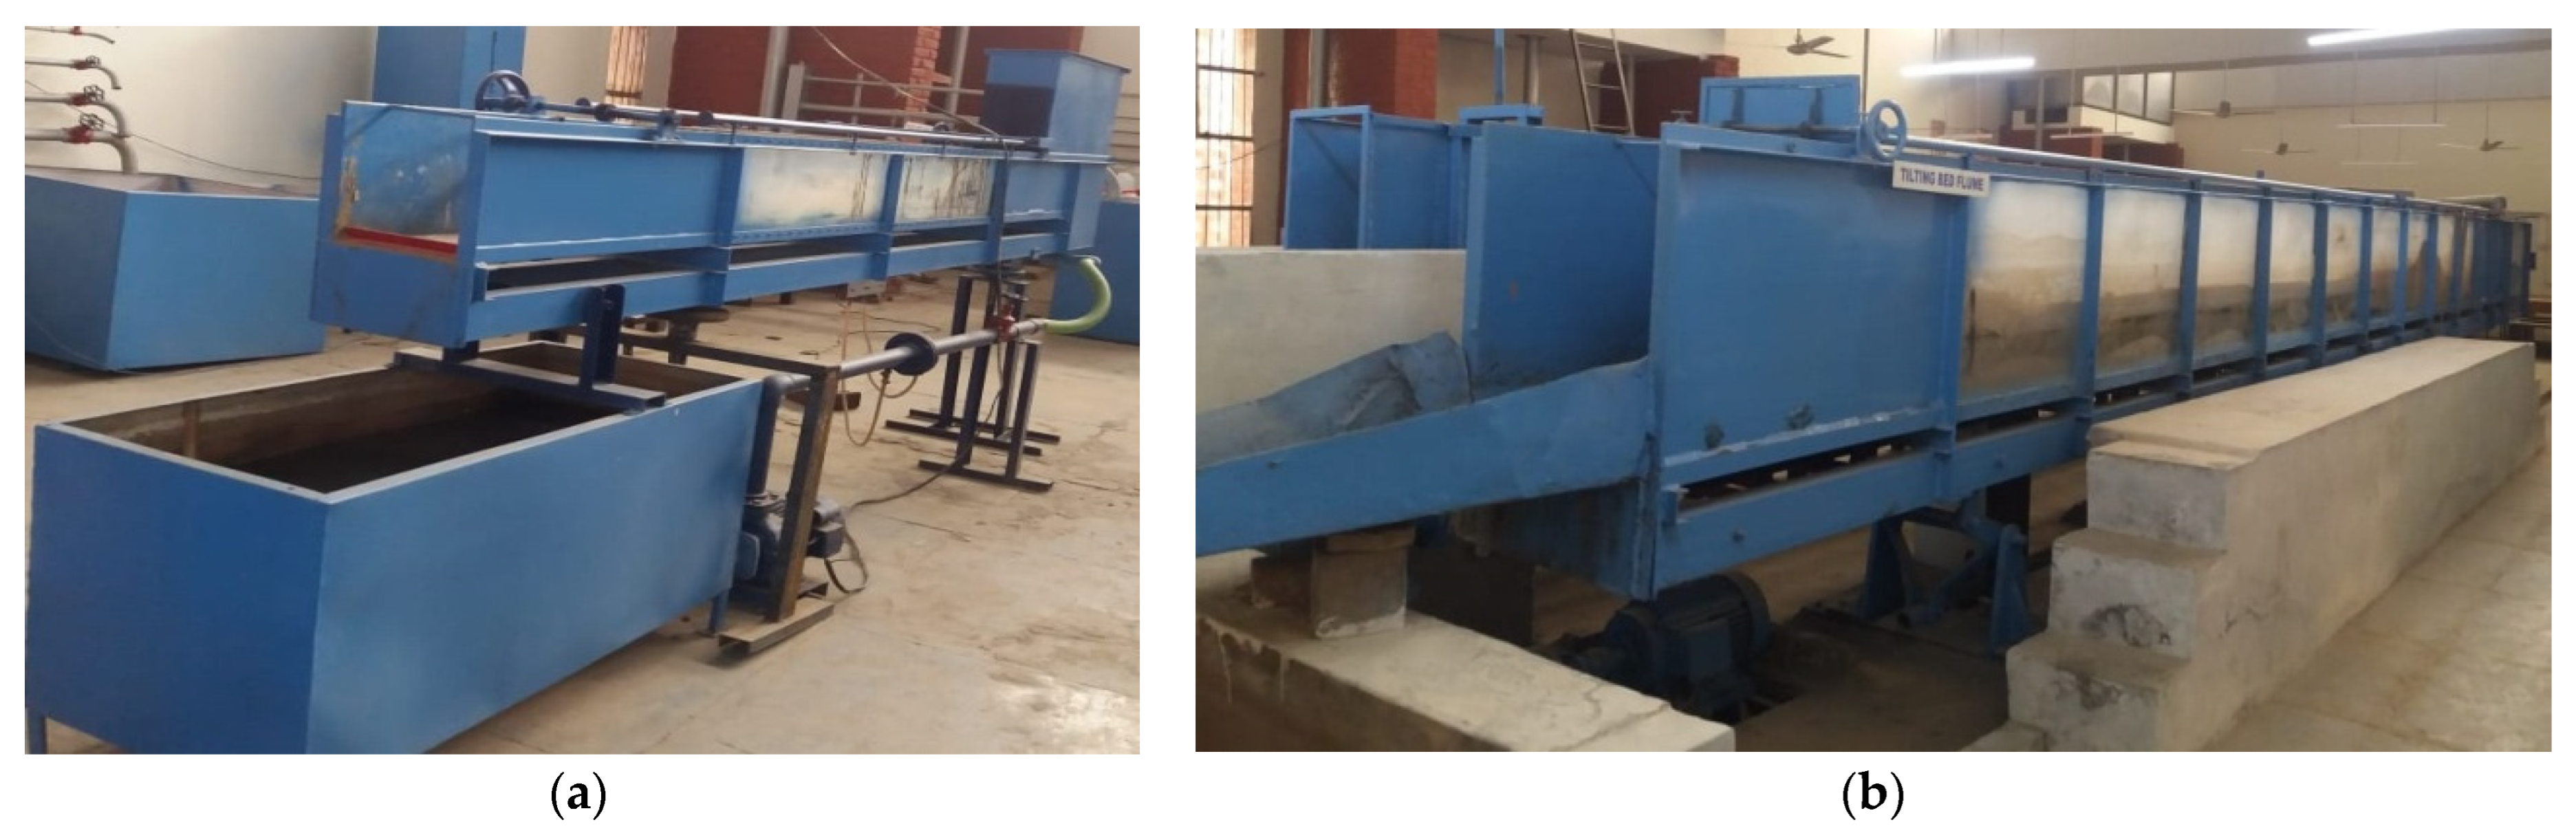
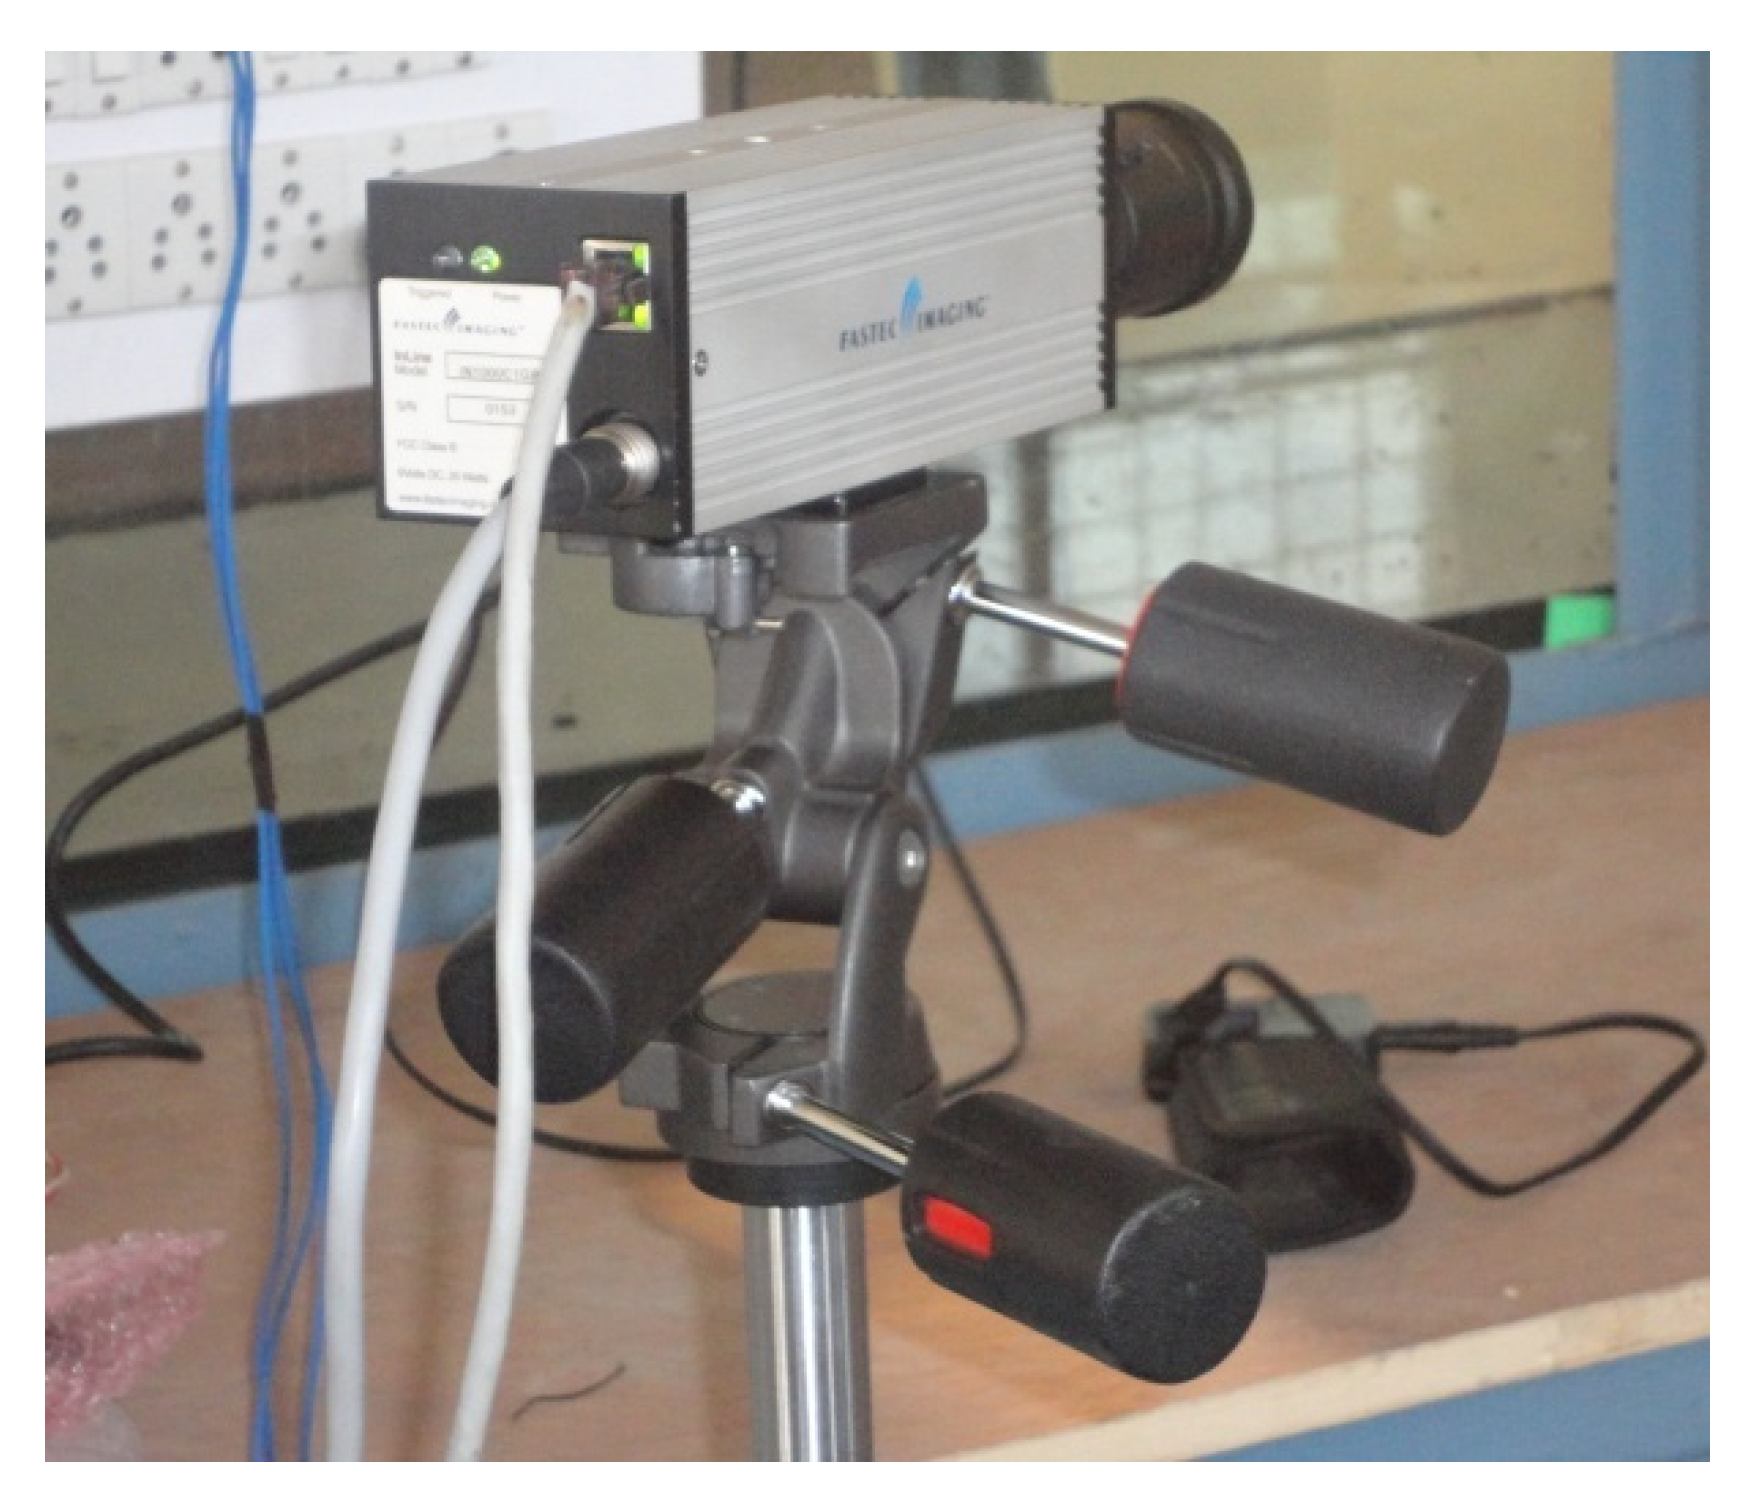
3.1. Layout of Hydraulic Channel
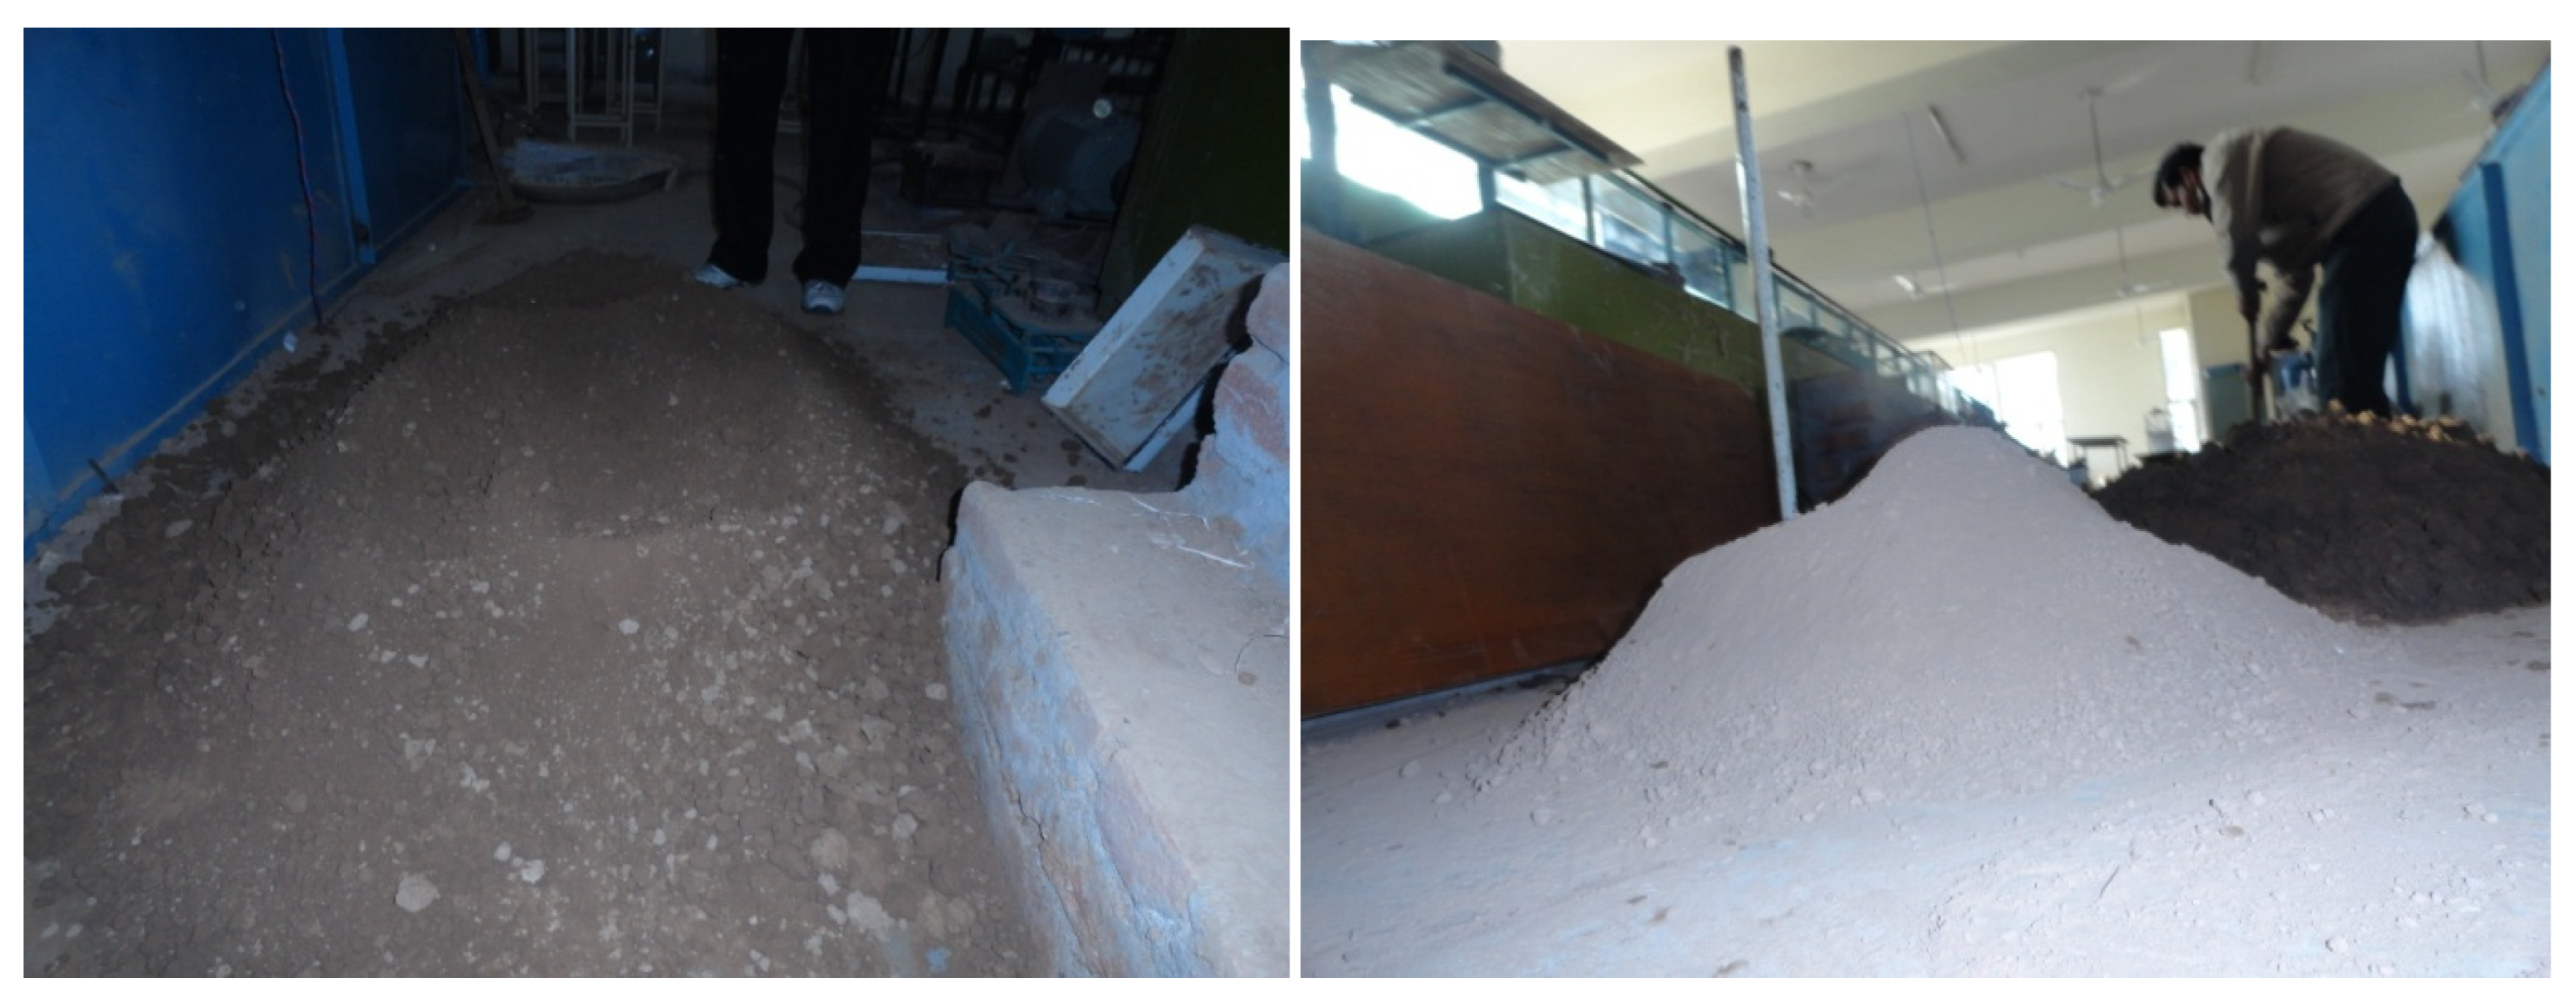
3.2. Material Characteristics Used in Modeling
4. Design and Modeling Procedure
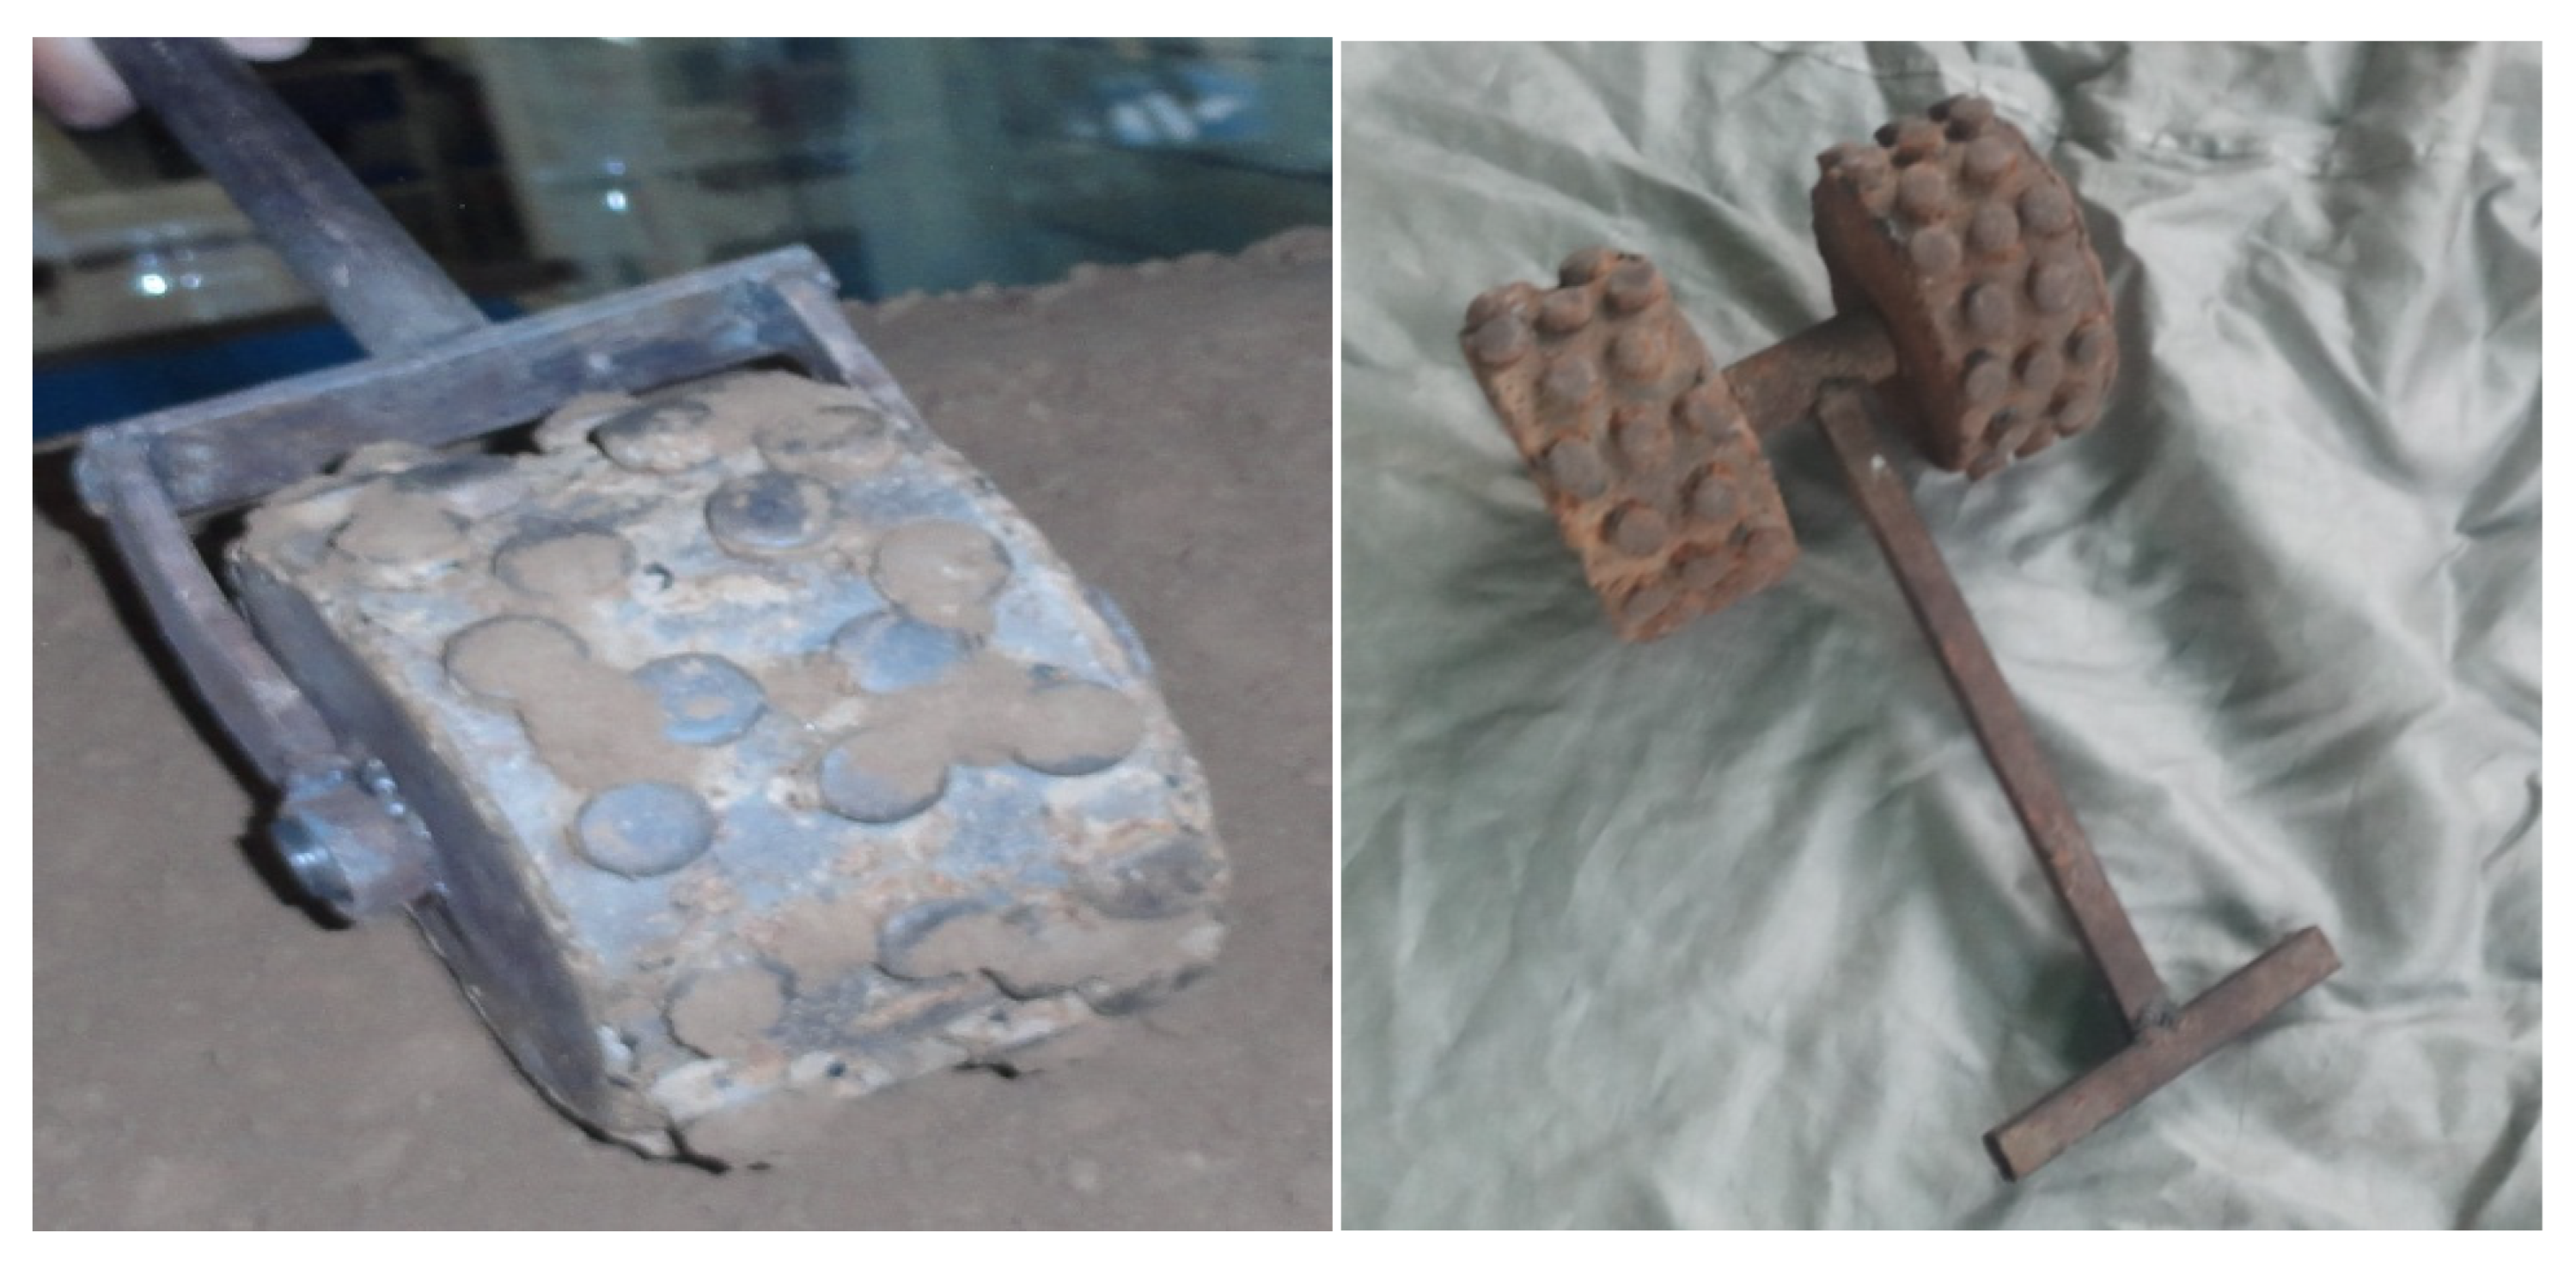
4.1. Design of Embankment Models
4.2. Breach Process and Flow Parameters
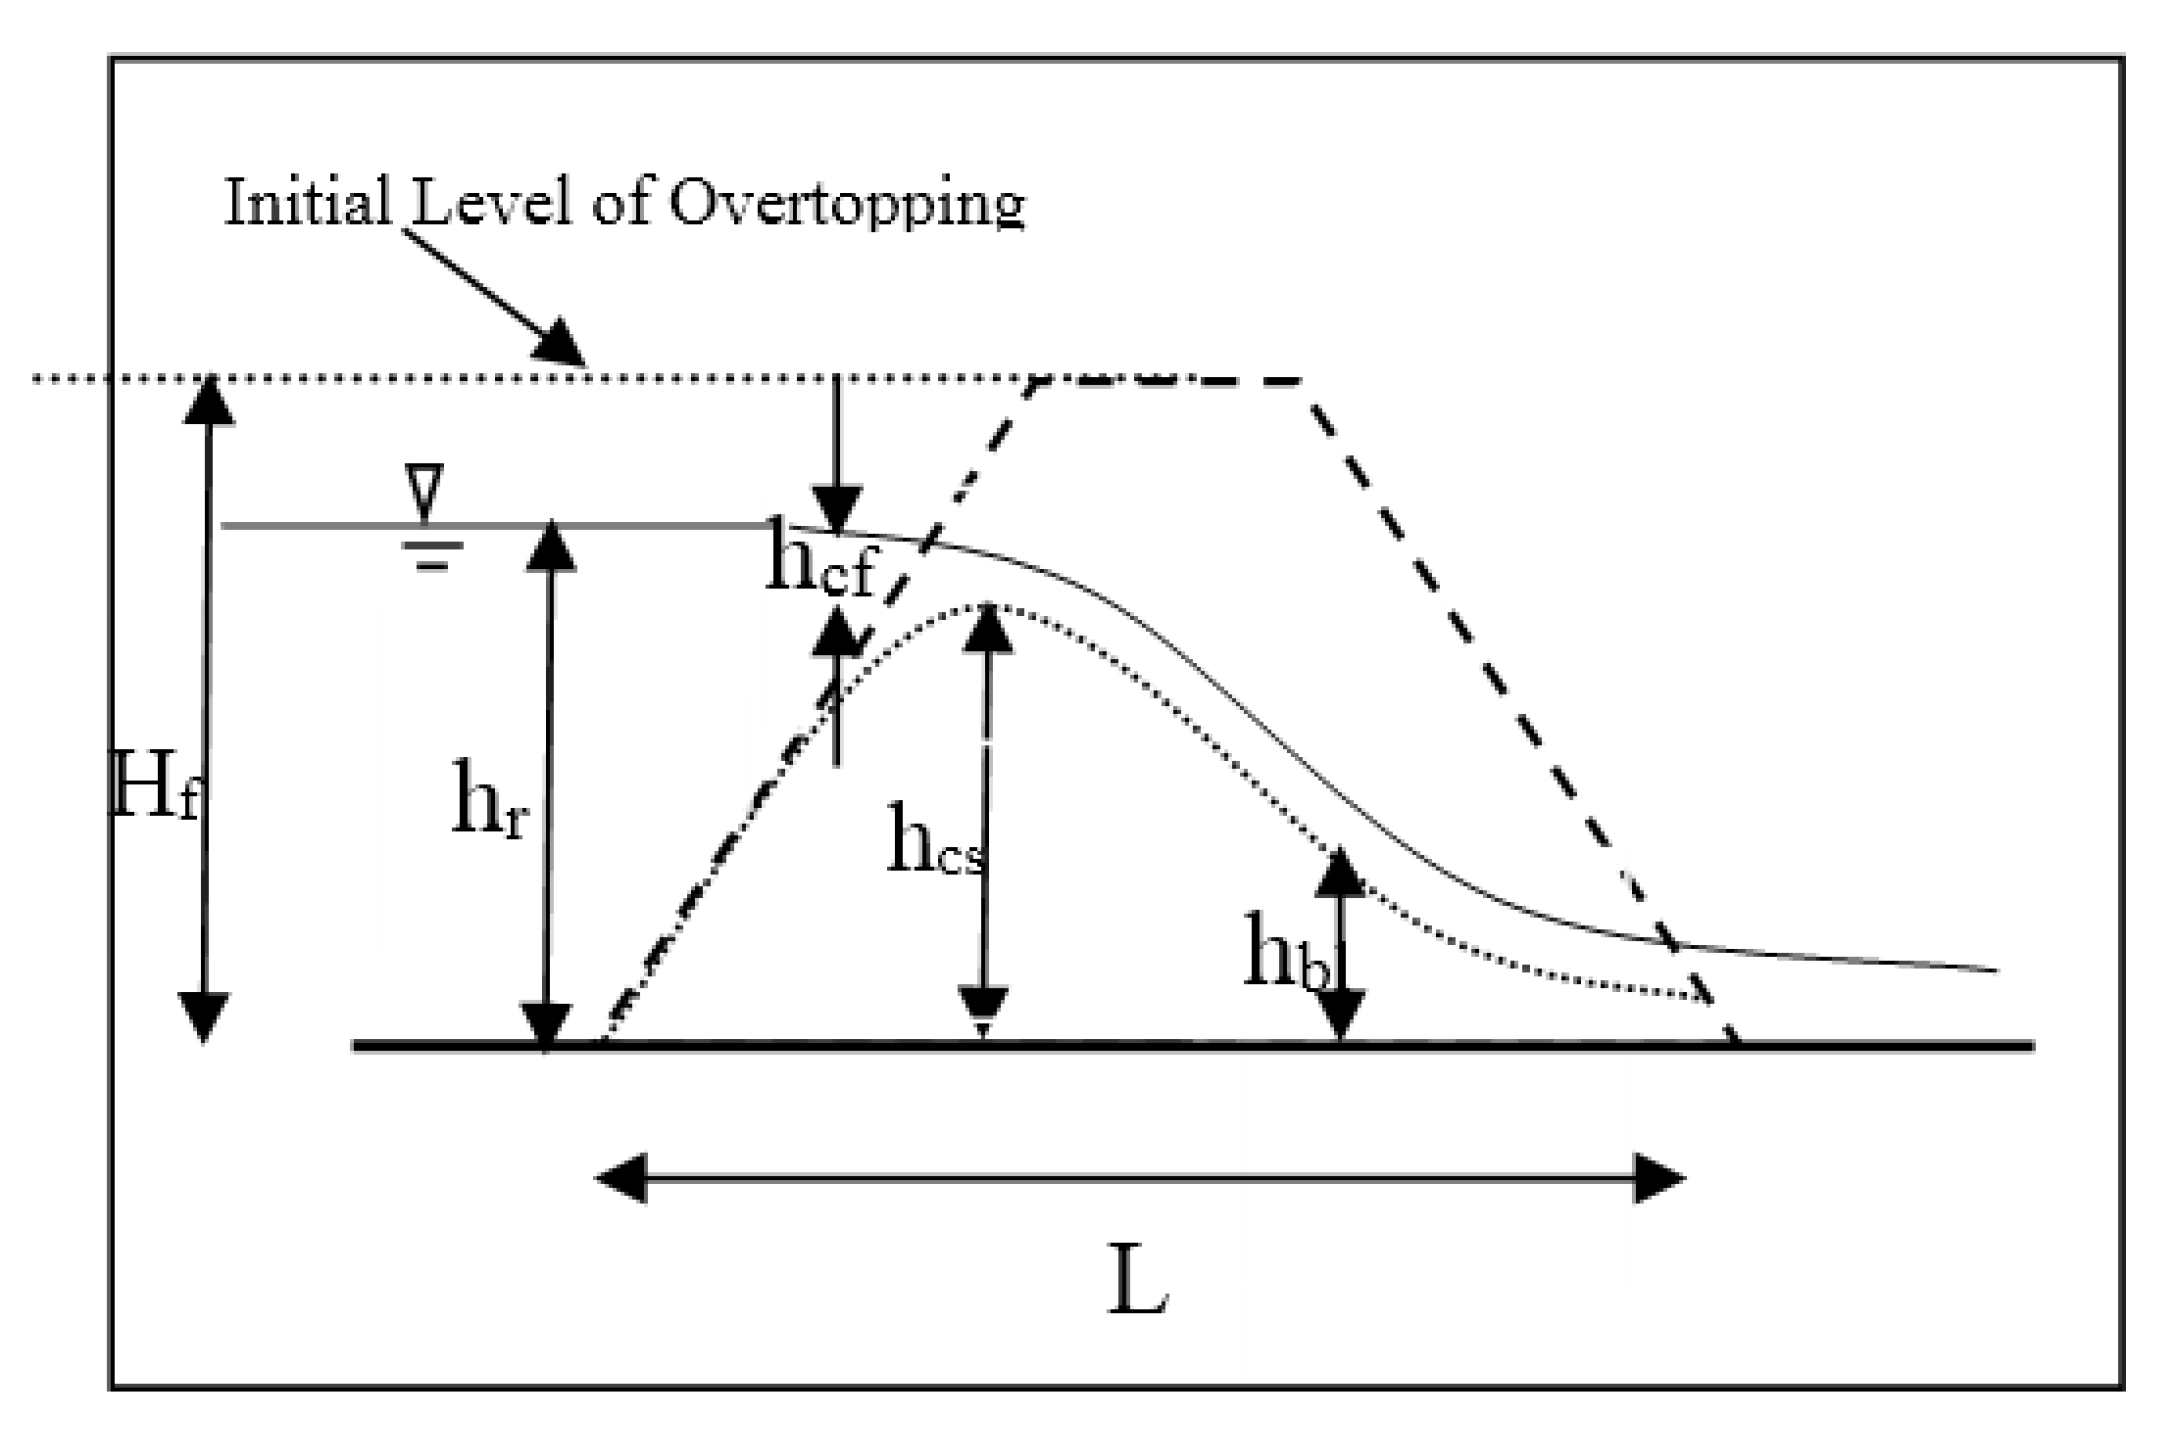
4.2.1. Breach Flow Parameters
4.2.2. Breach Process
- Qp is the peak outflow at the time of failure (cm3/s);
- Vw is the reservoir volume at the time of failure (cm3);
- dw is the depth of water above the crest or sill of breach (cm);
- D50 is the median particle size of embankment fills material (mm);
- C is the cohesion of fill material (kg/cm2);
- Z is the side slope of the embankment model (tan θ);
- G is the acceleration due to gravity (m/s2).
5. Results and Discussion
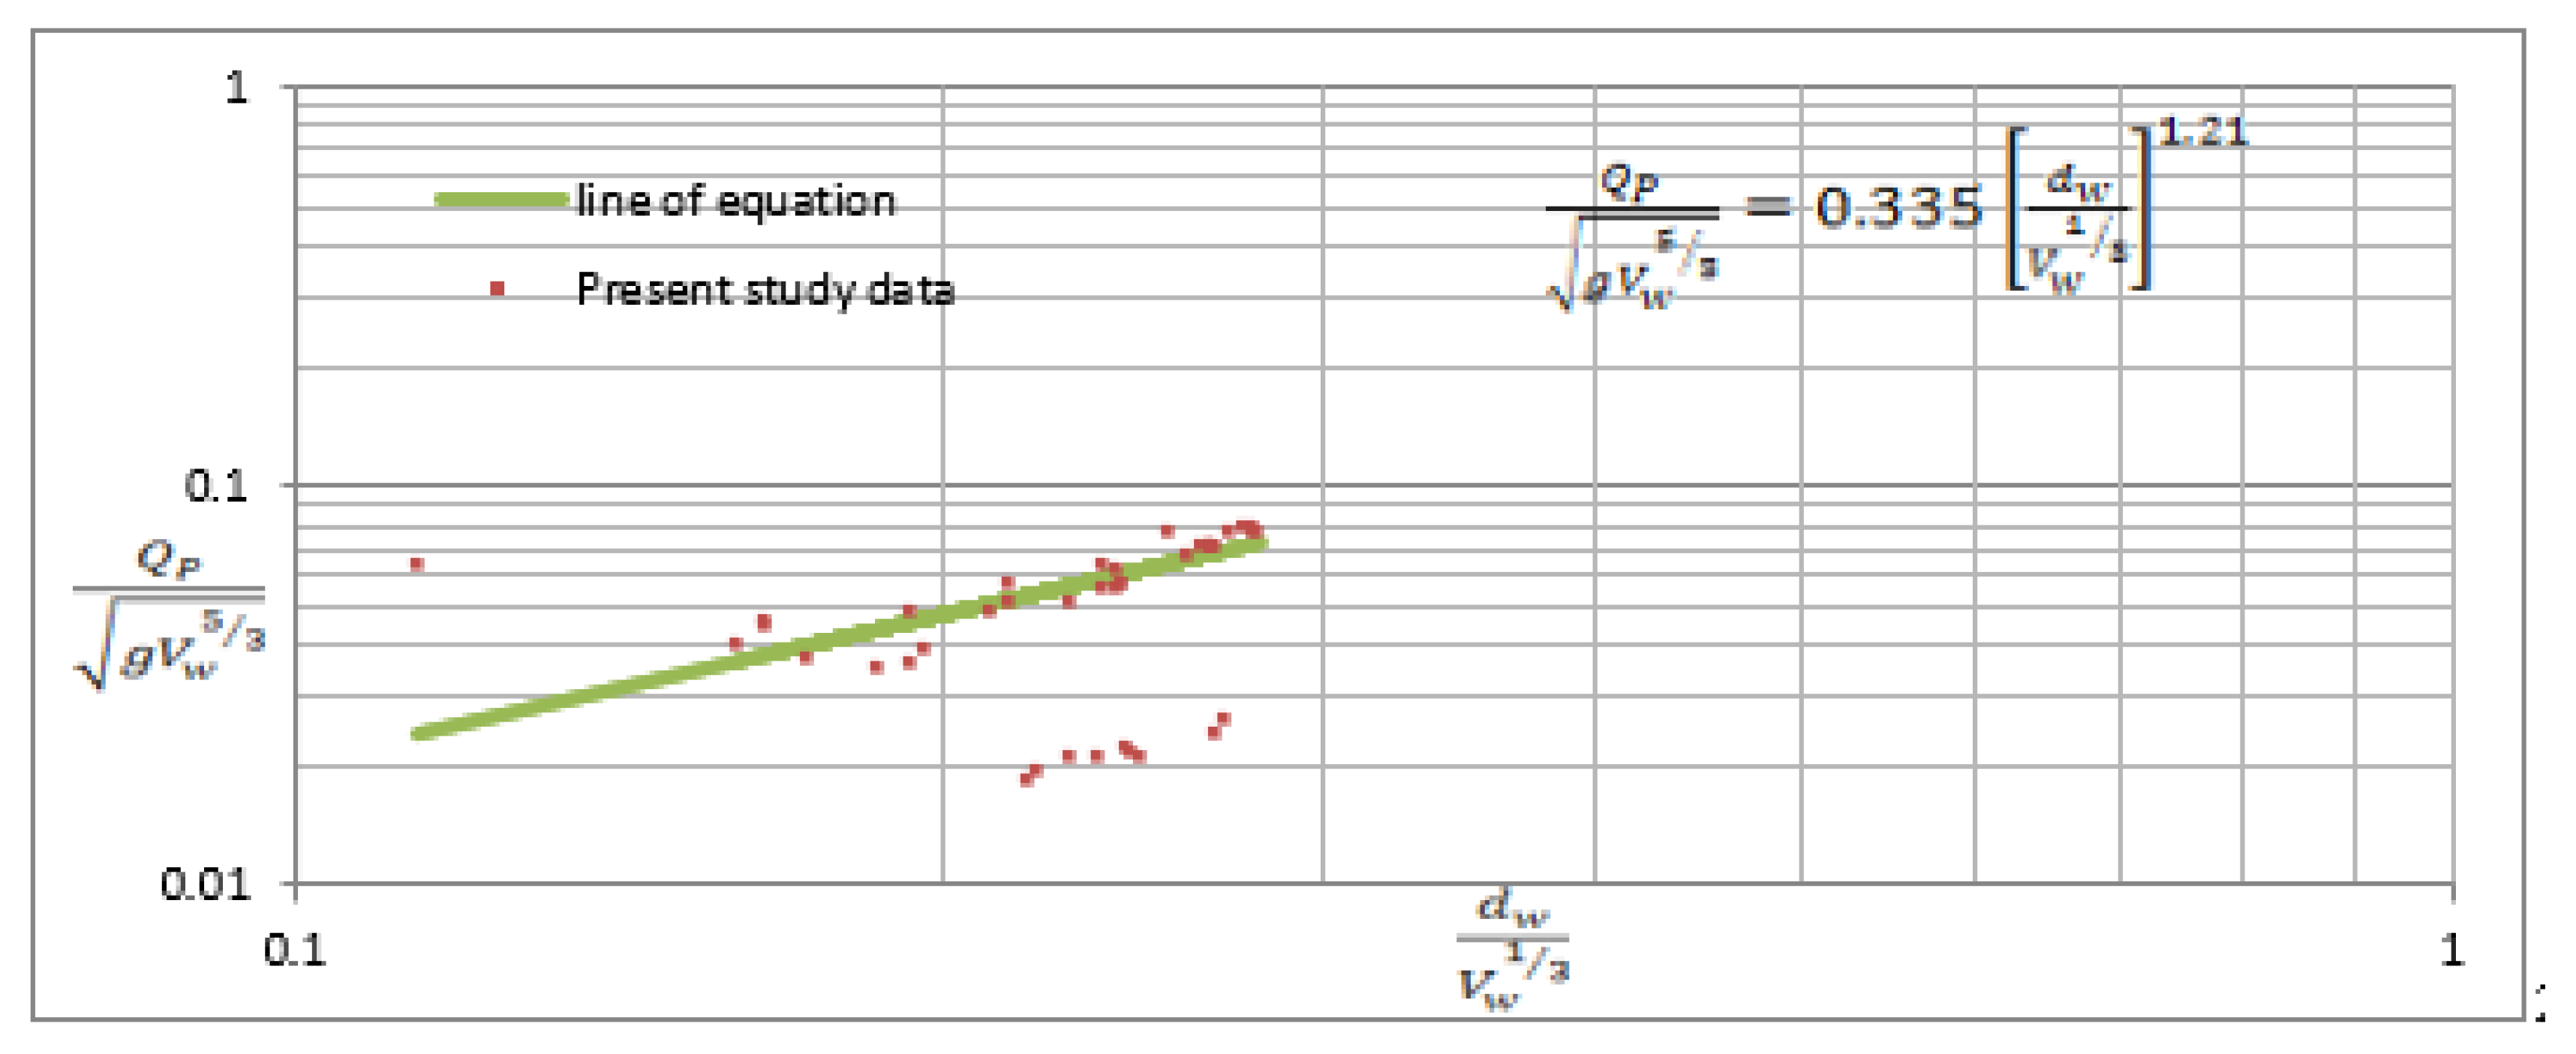
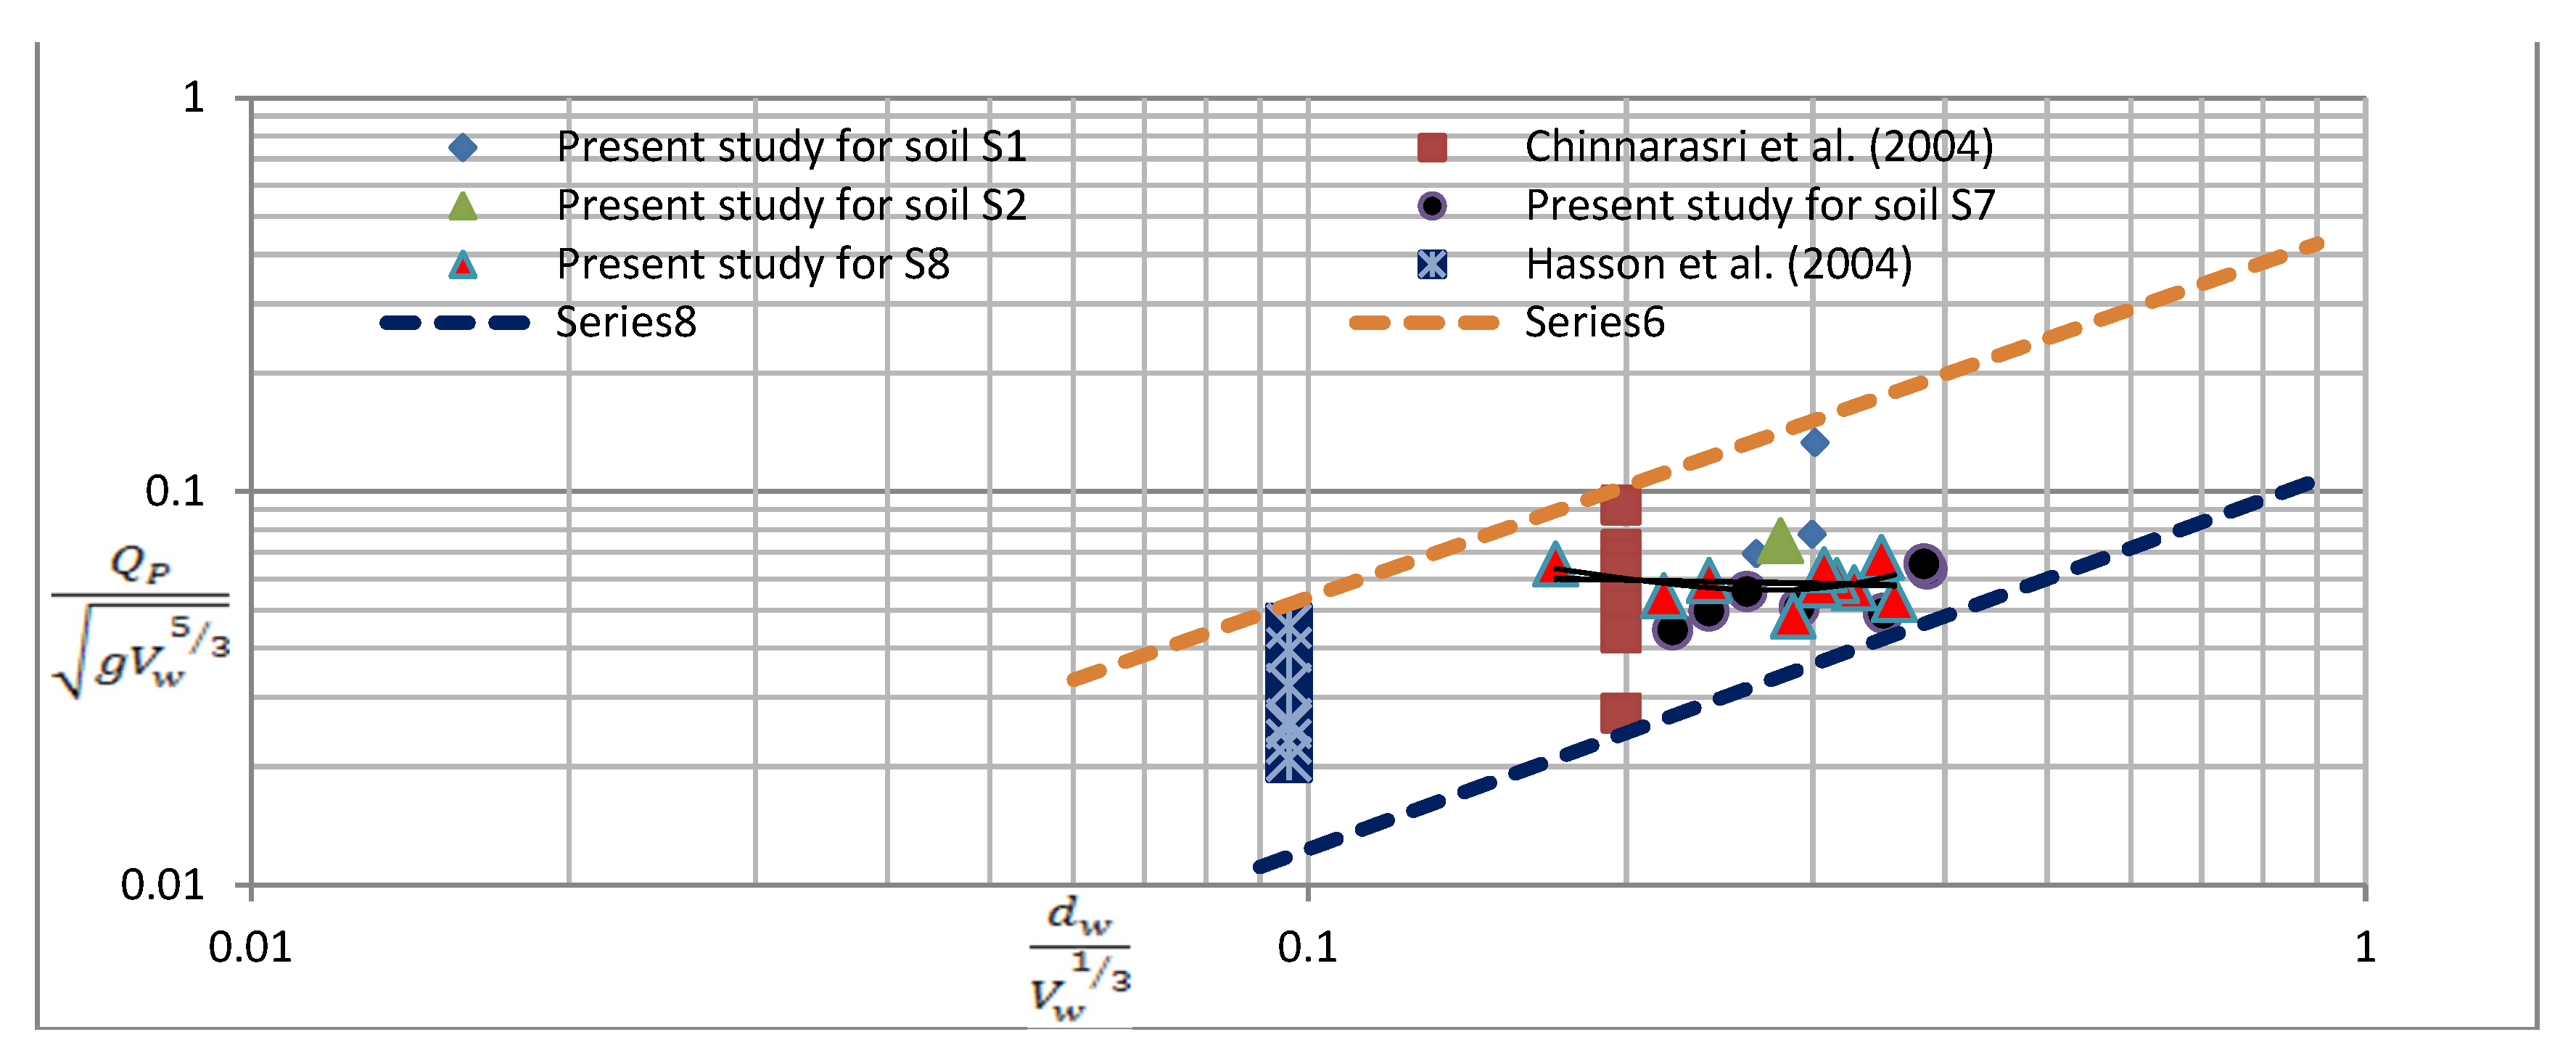
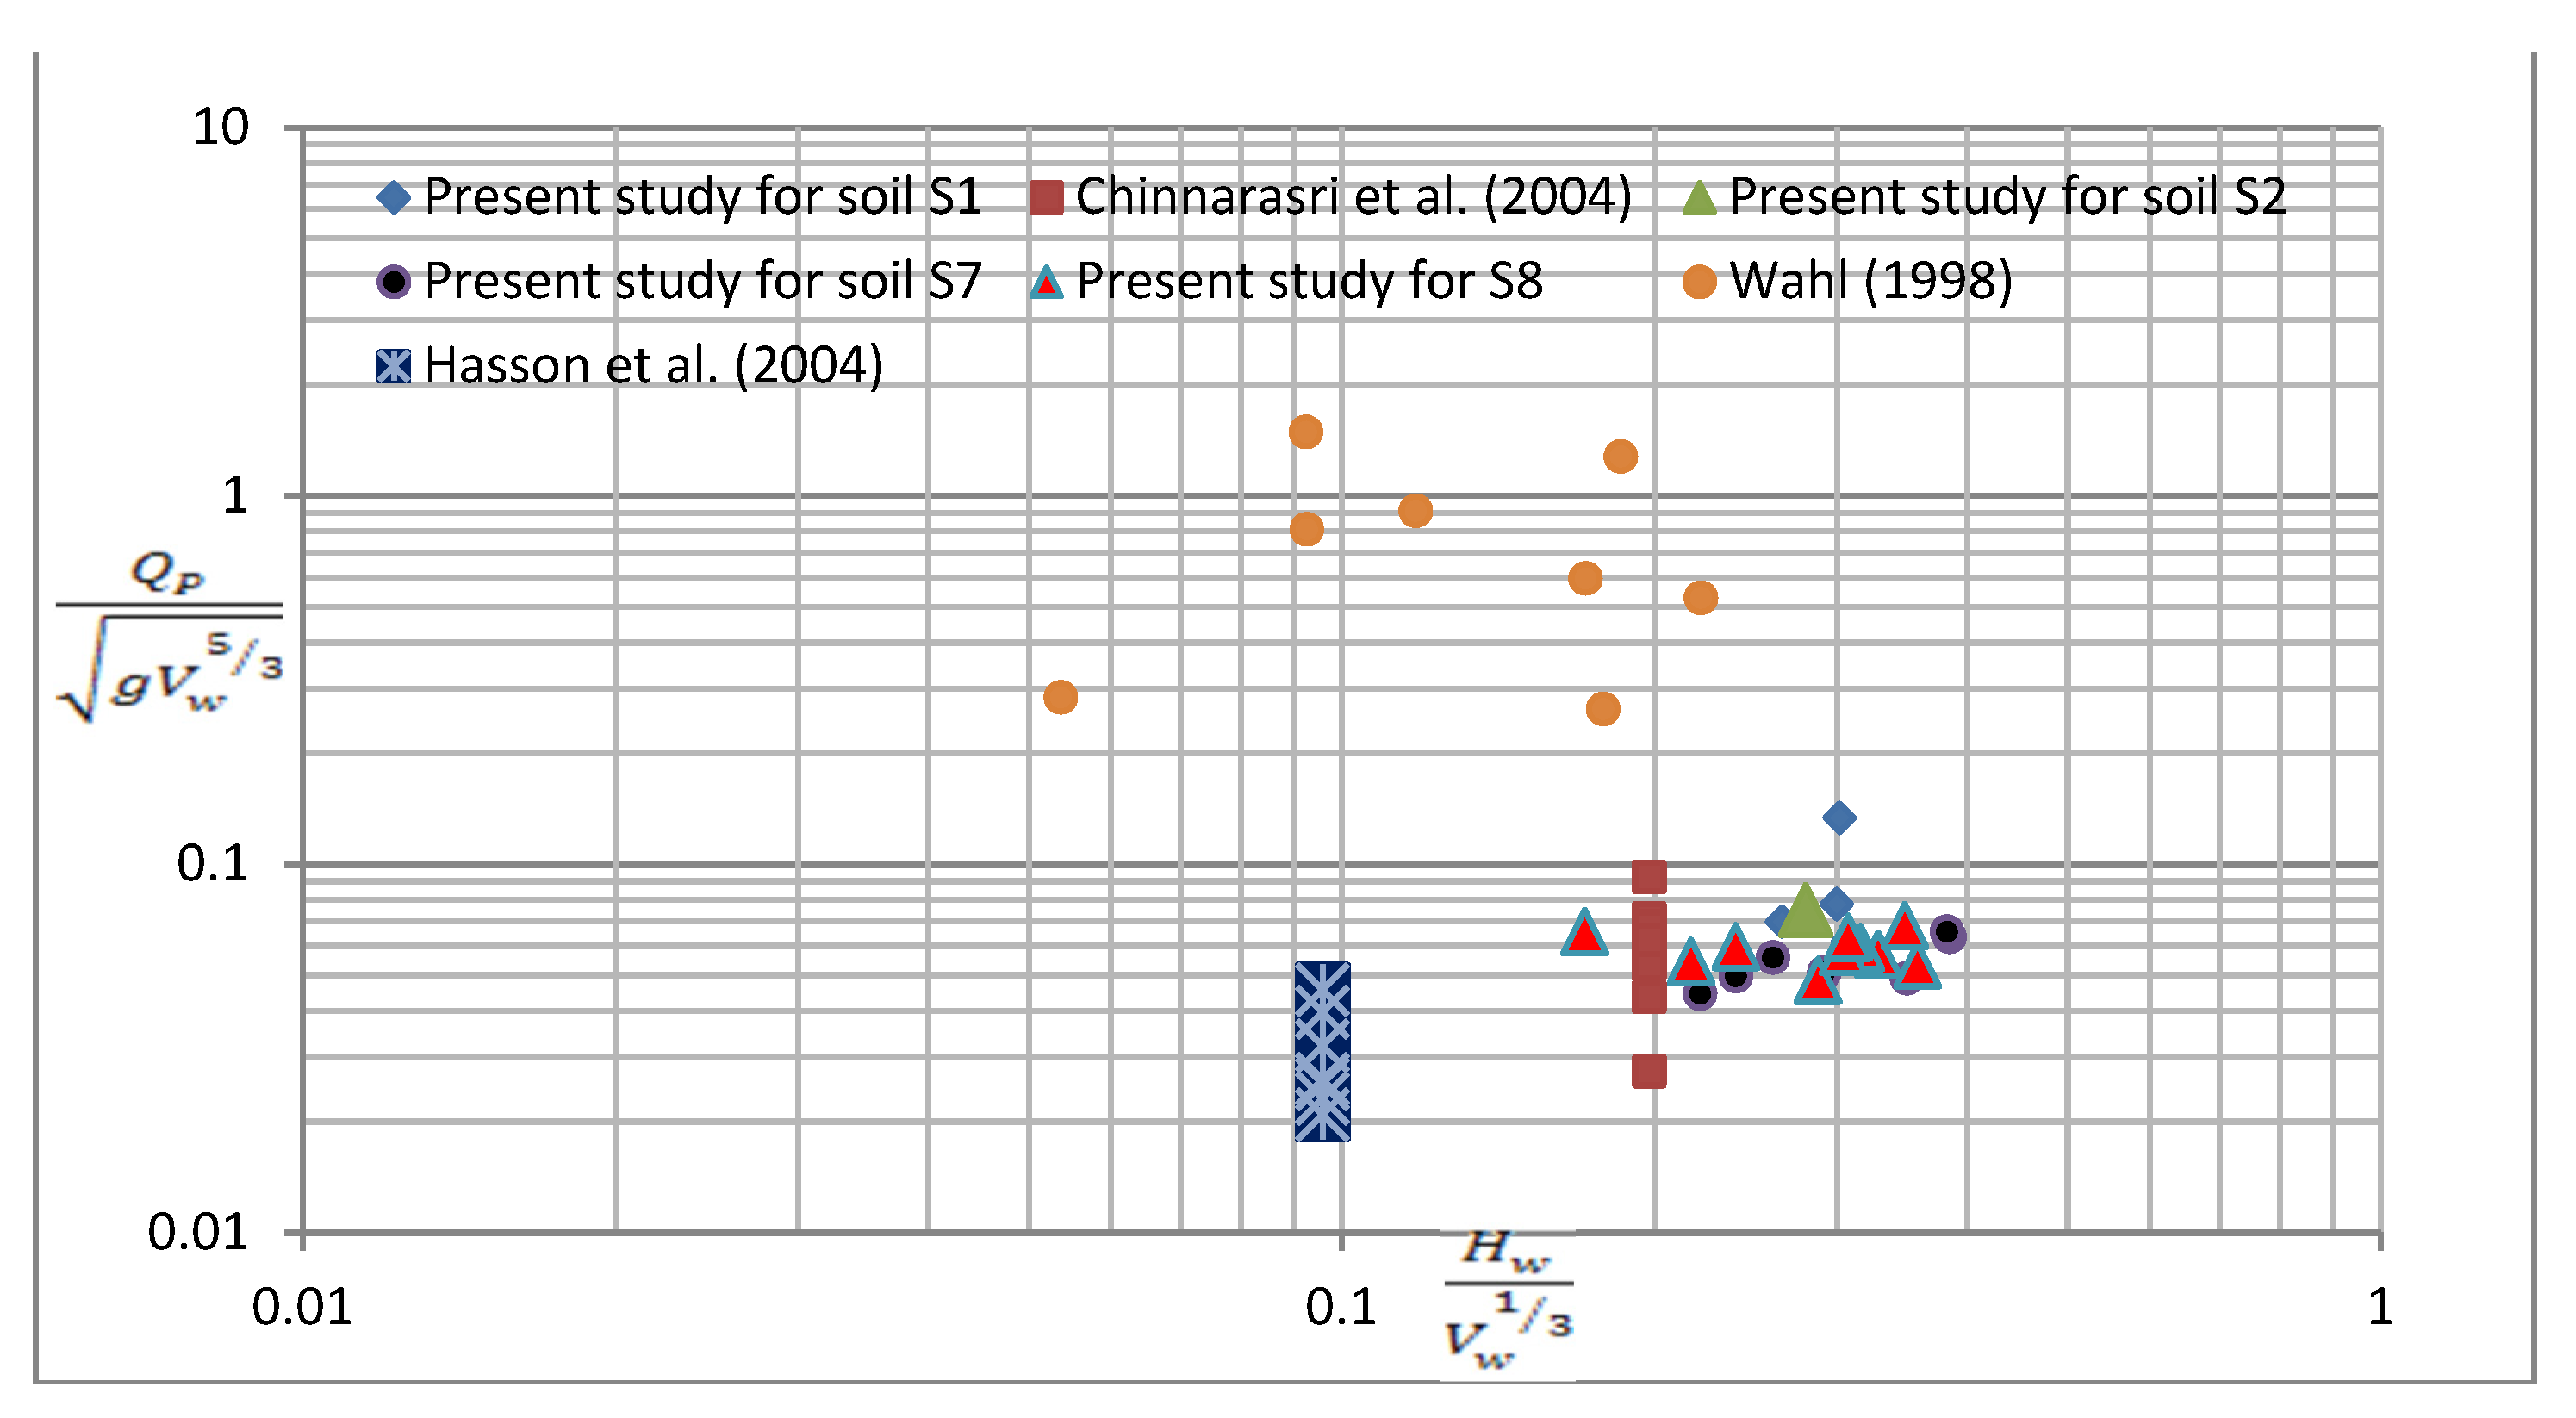
5.1. Relation for Peak Outflow
5.2. Validation of Relation
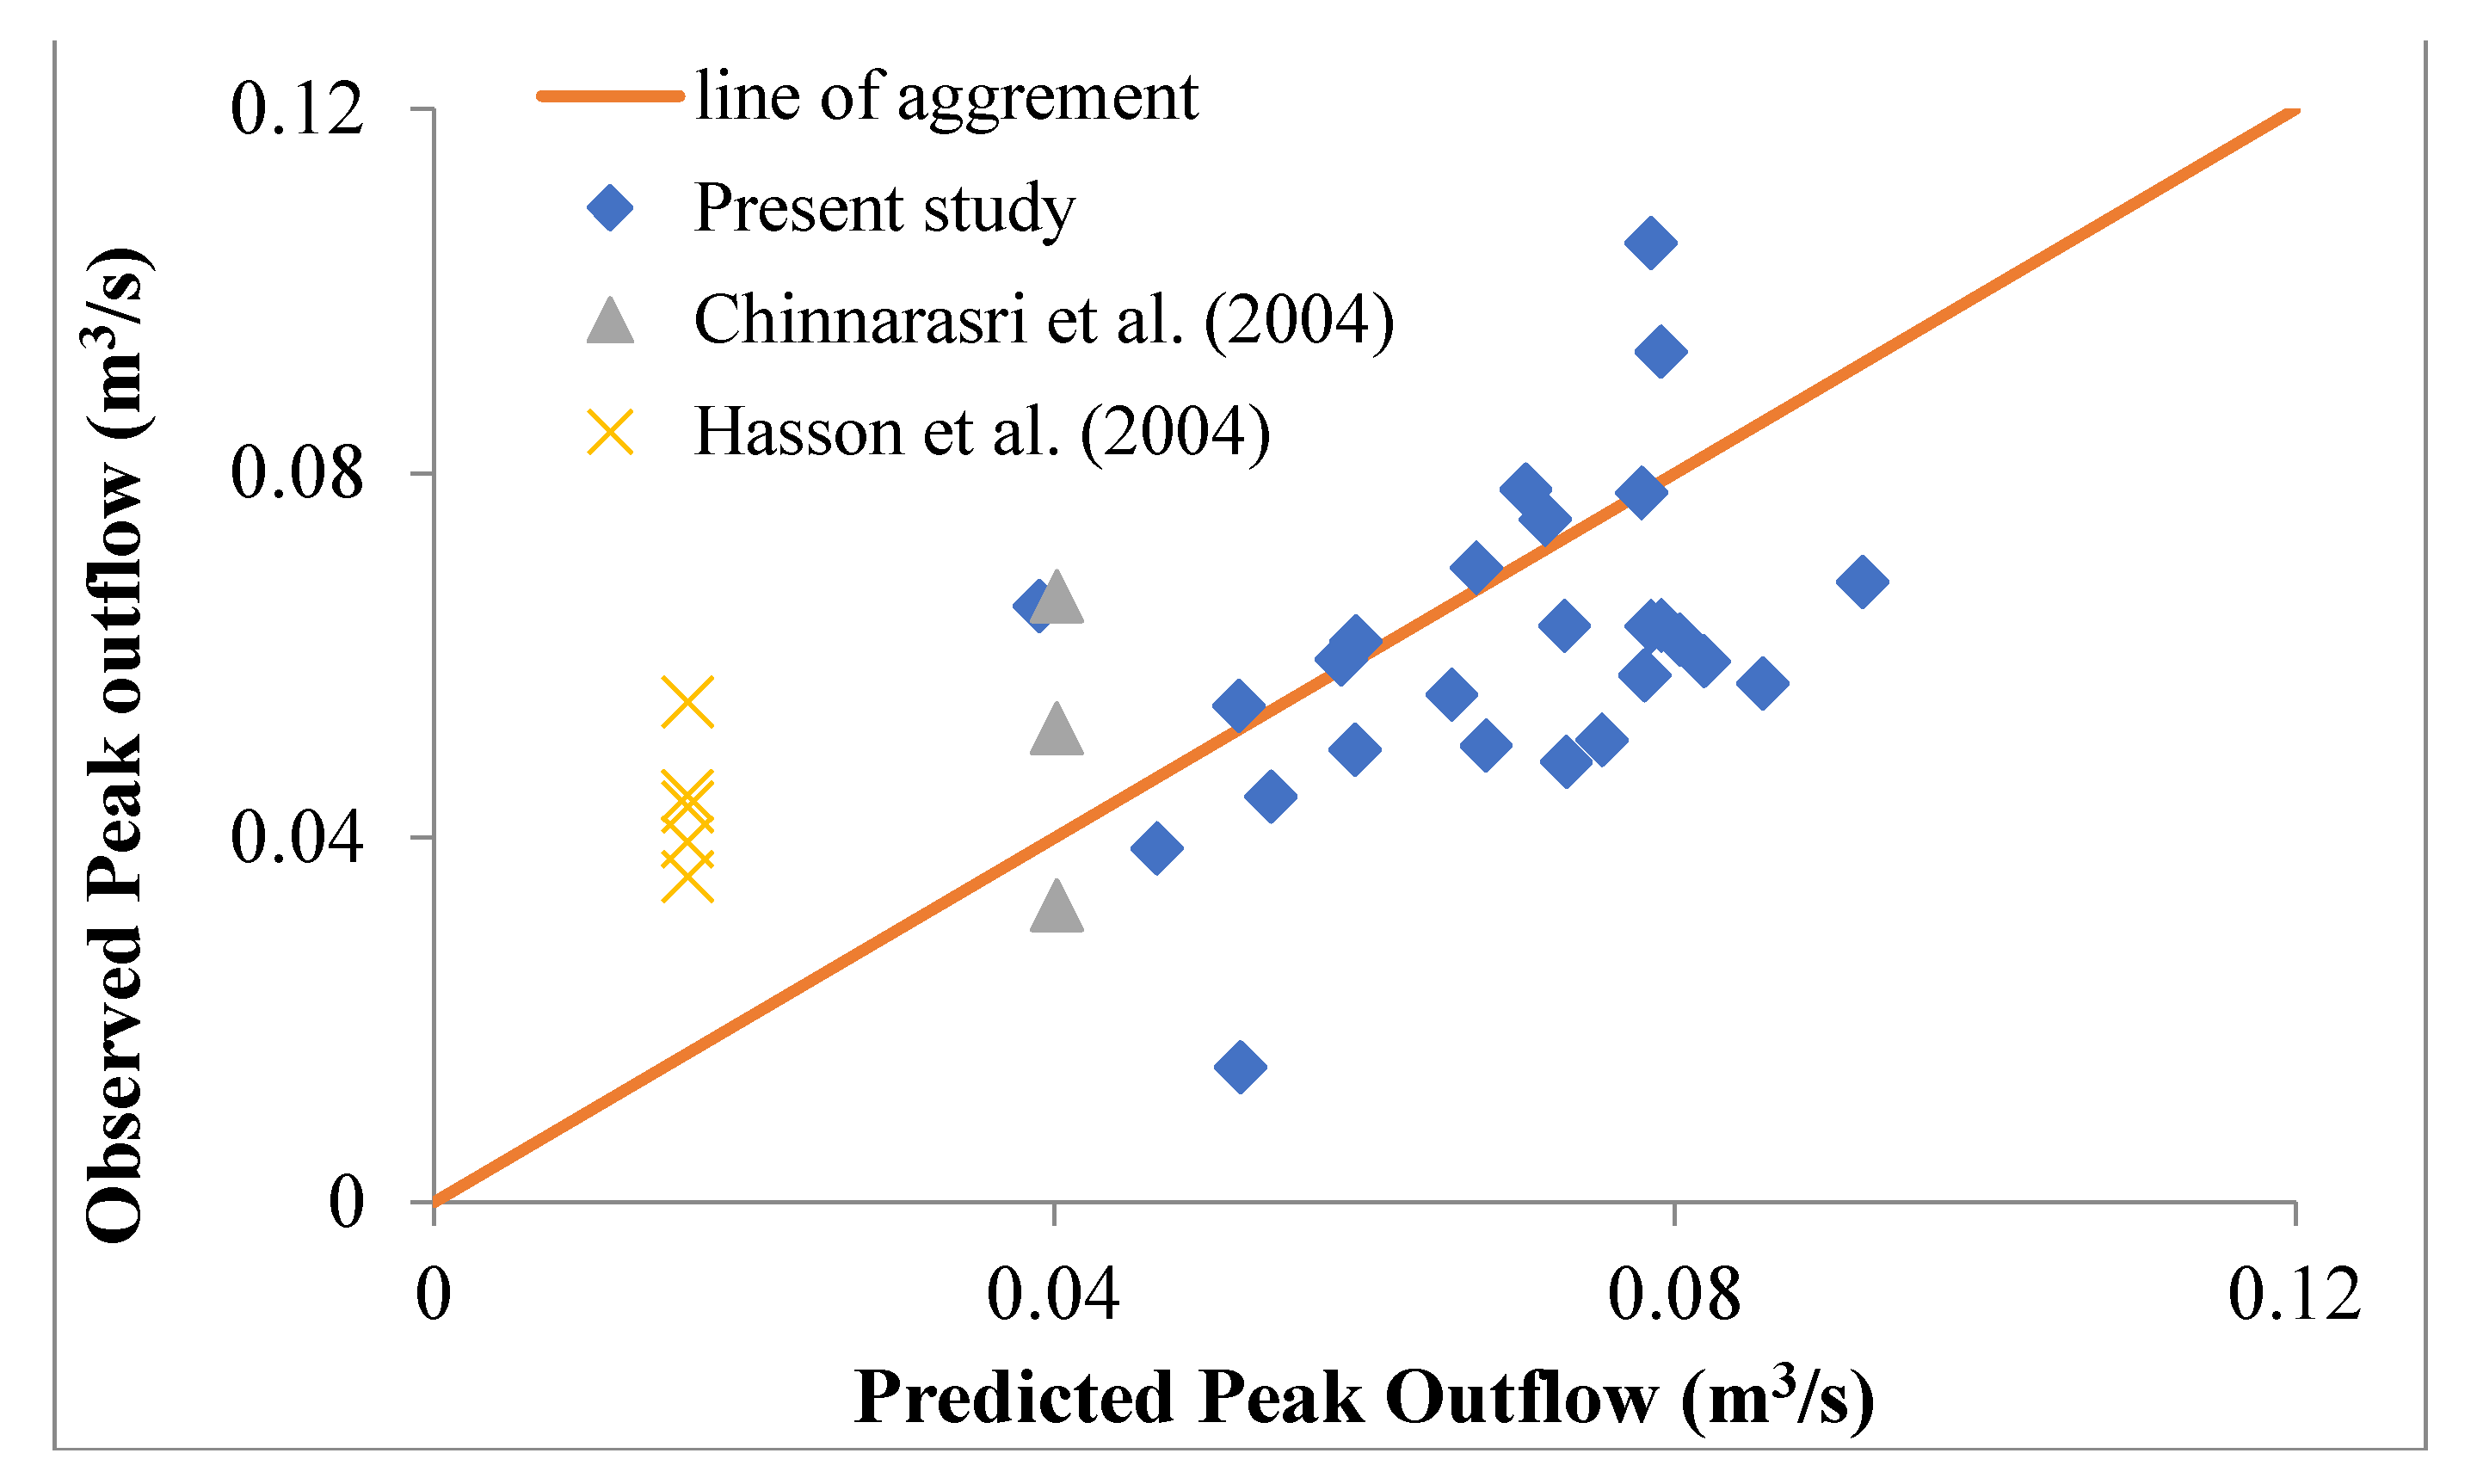
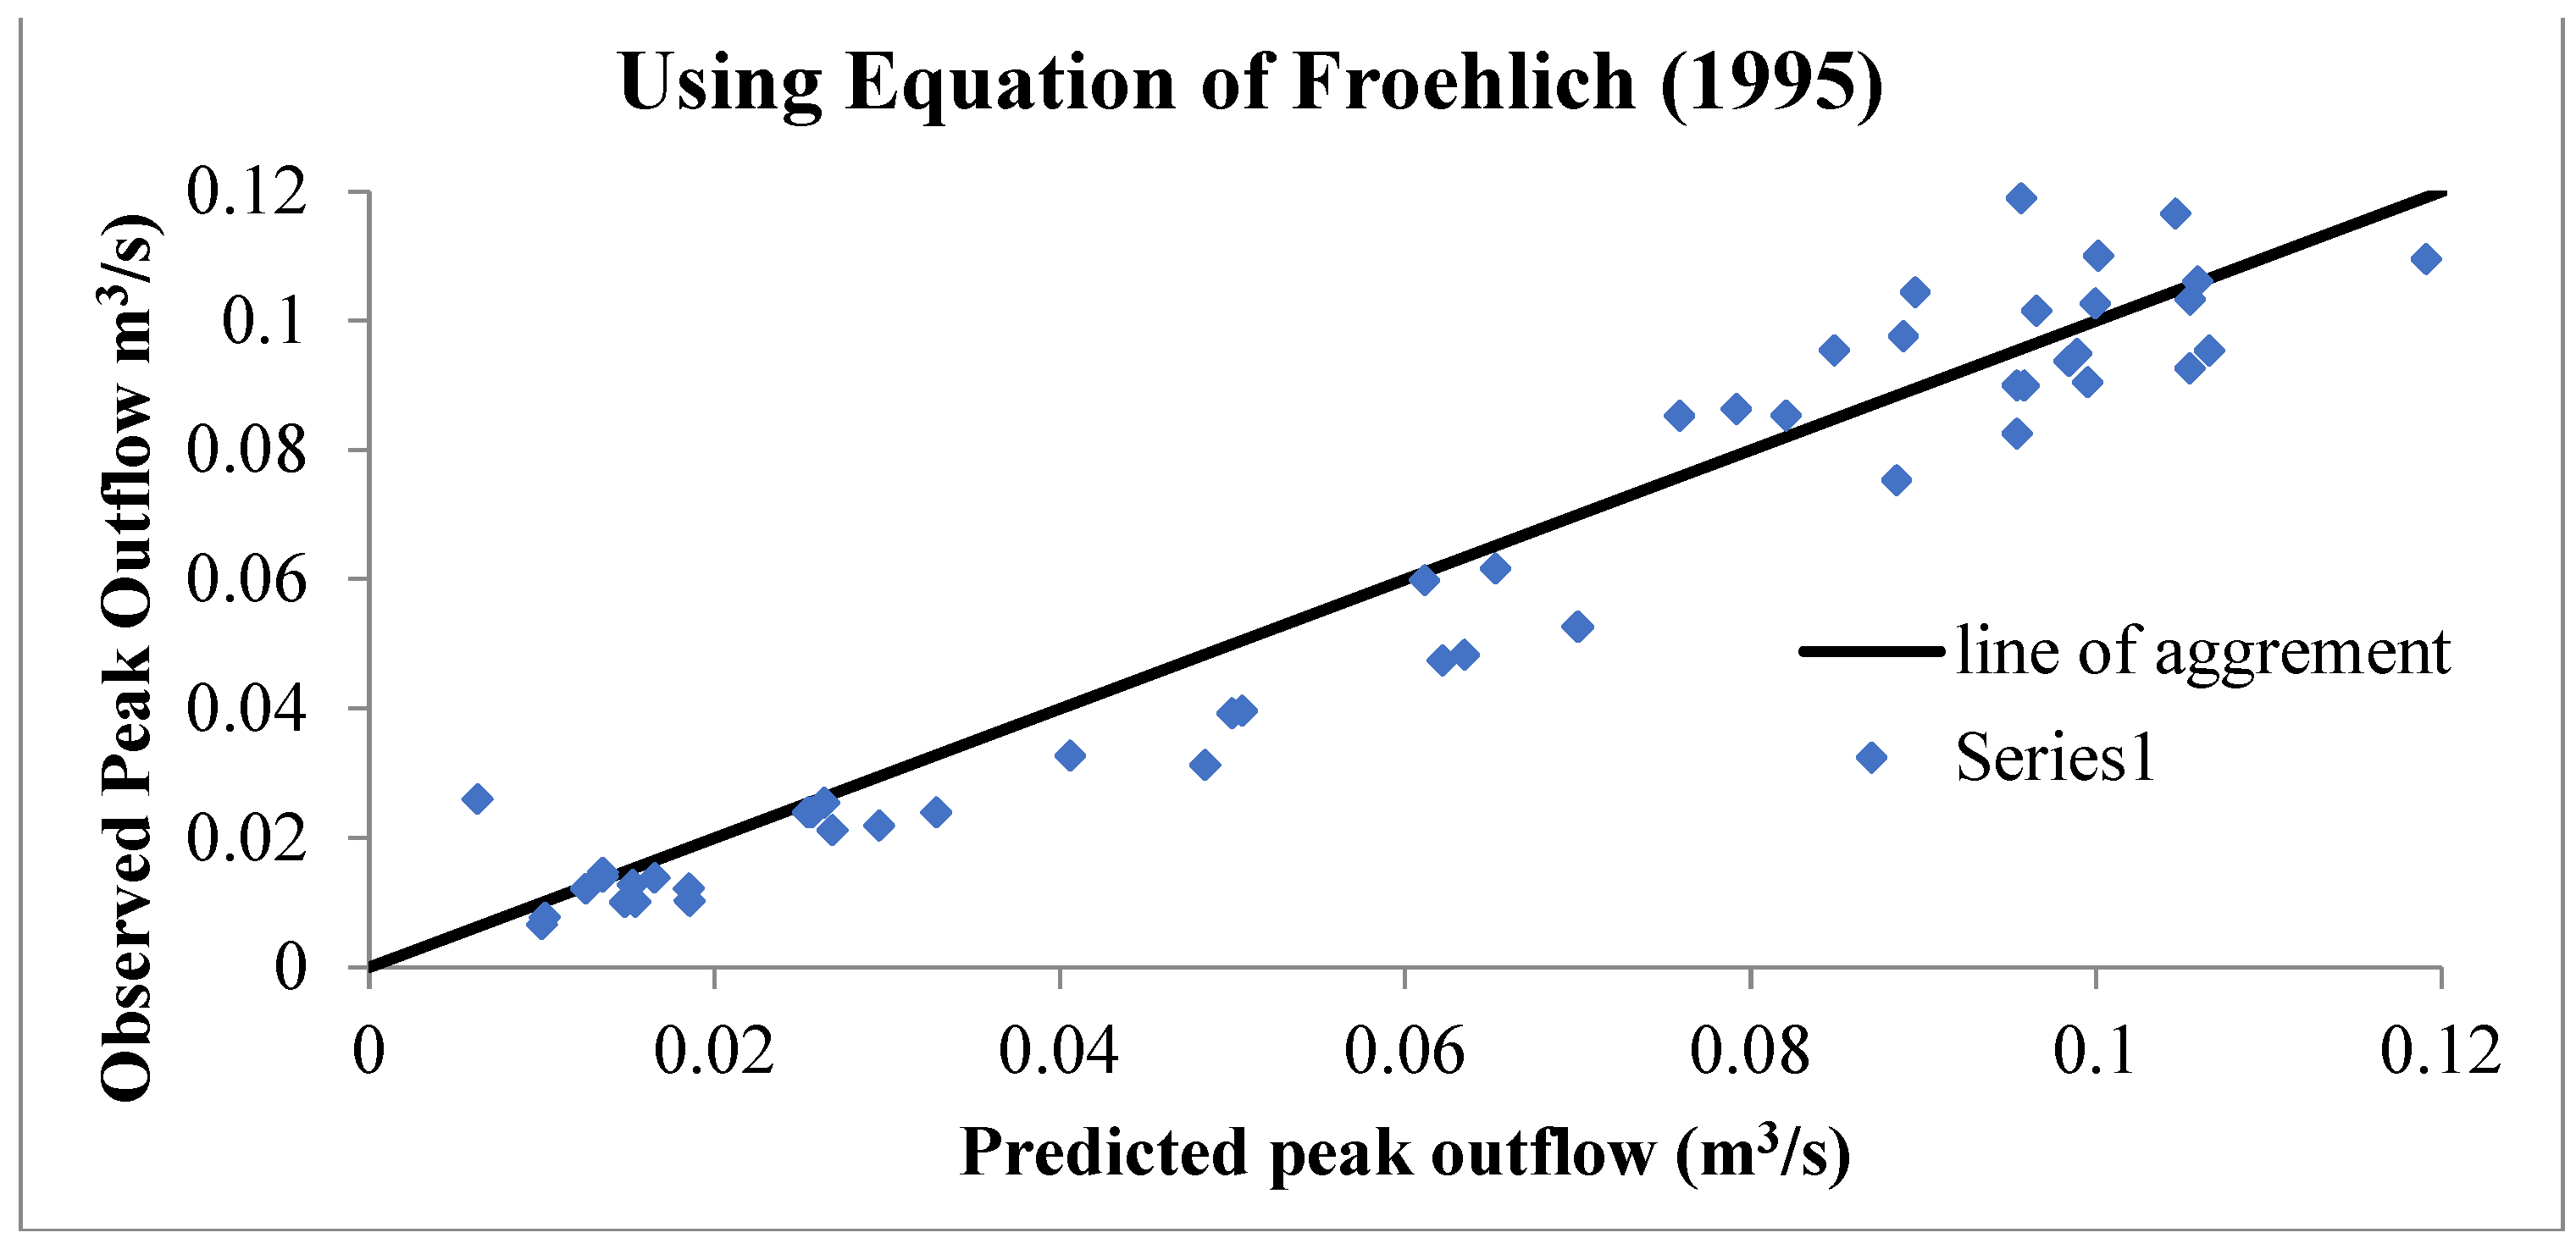
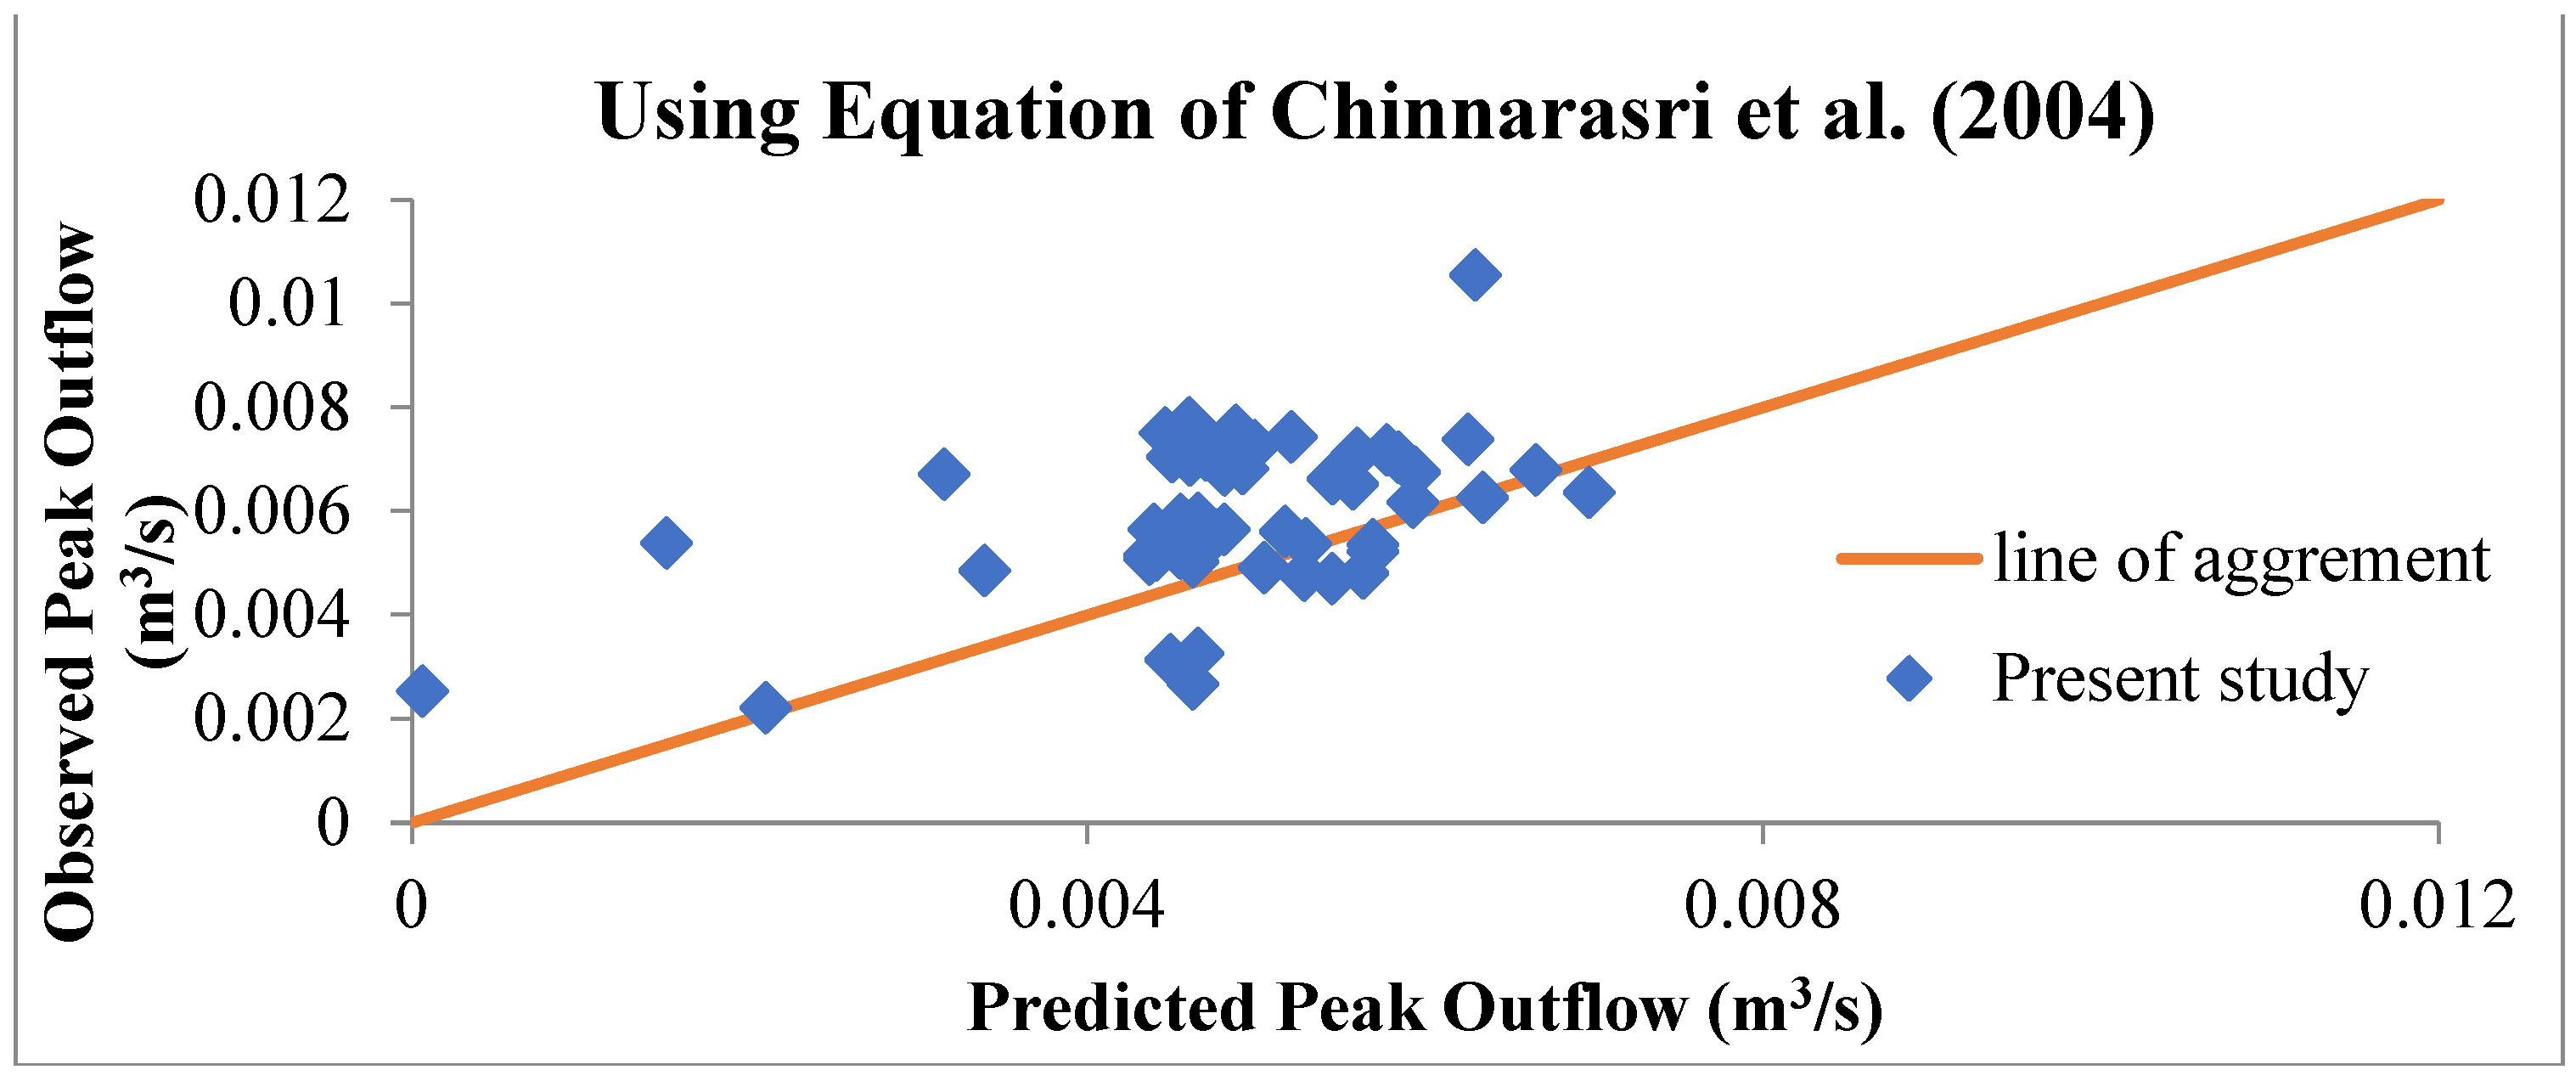
5.3. Comparison with Other Researchers
- (a)
- (b)
- Chinnarasri et al. [26]
6. Conclusions
- Buckingham Pi theorem was used to obtain a relationship for non-dimensional peak outflow (Qp) corresponding to depth of water (dw) and volume of water (Vw). Through a combination of present data and laboratory as well as field data of other investigators, upper and lower envelope lines were defined for developing a universal relationship (Equation (3)).
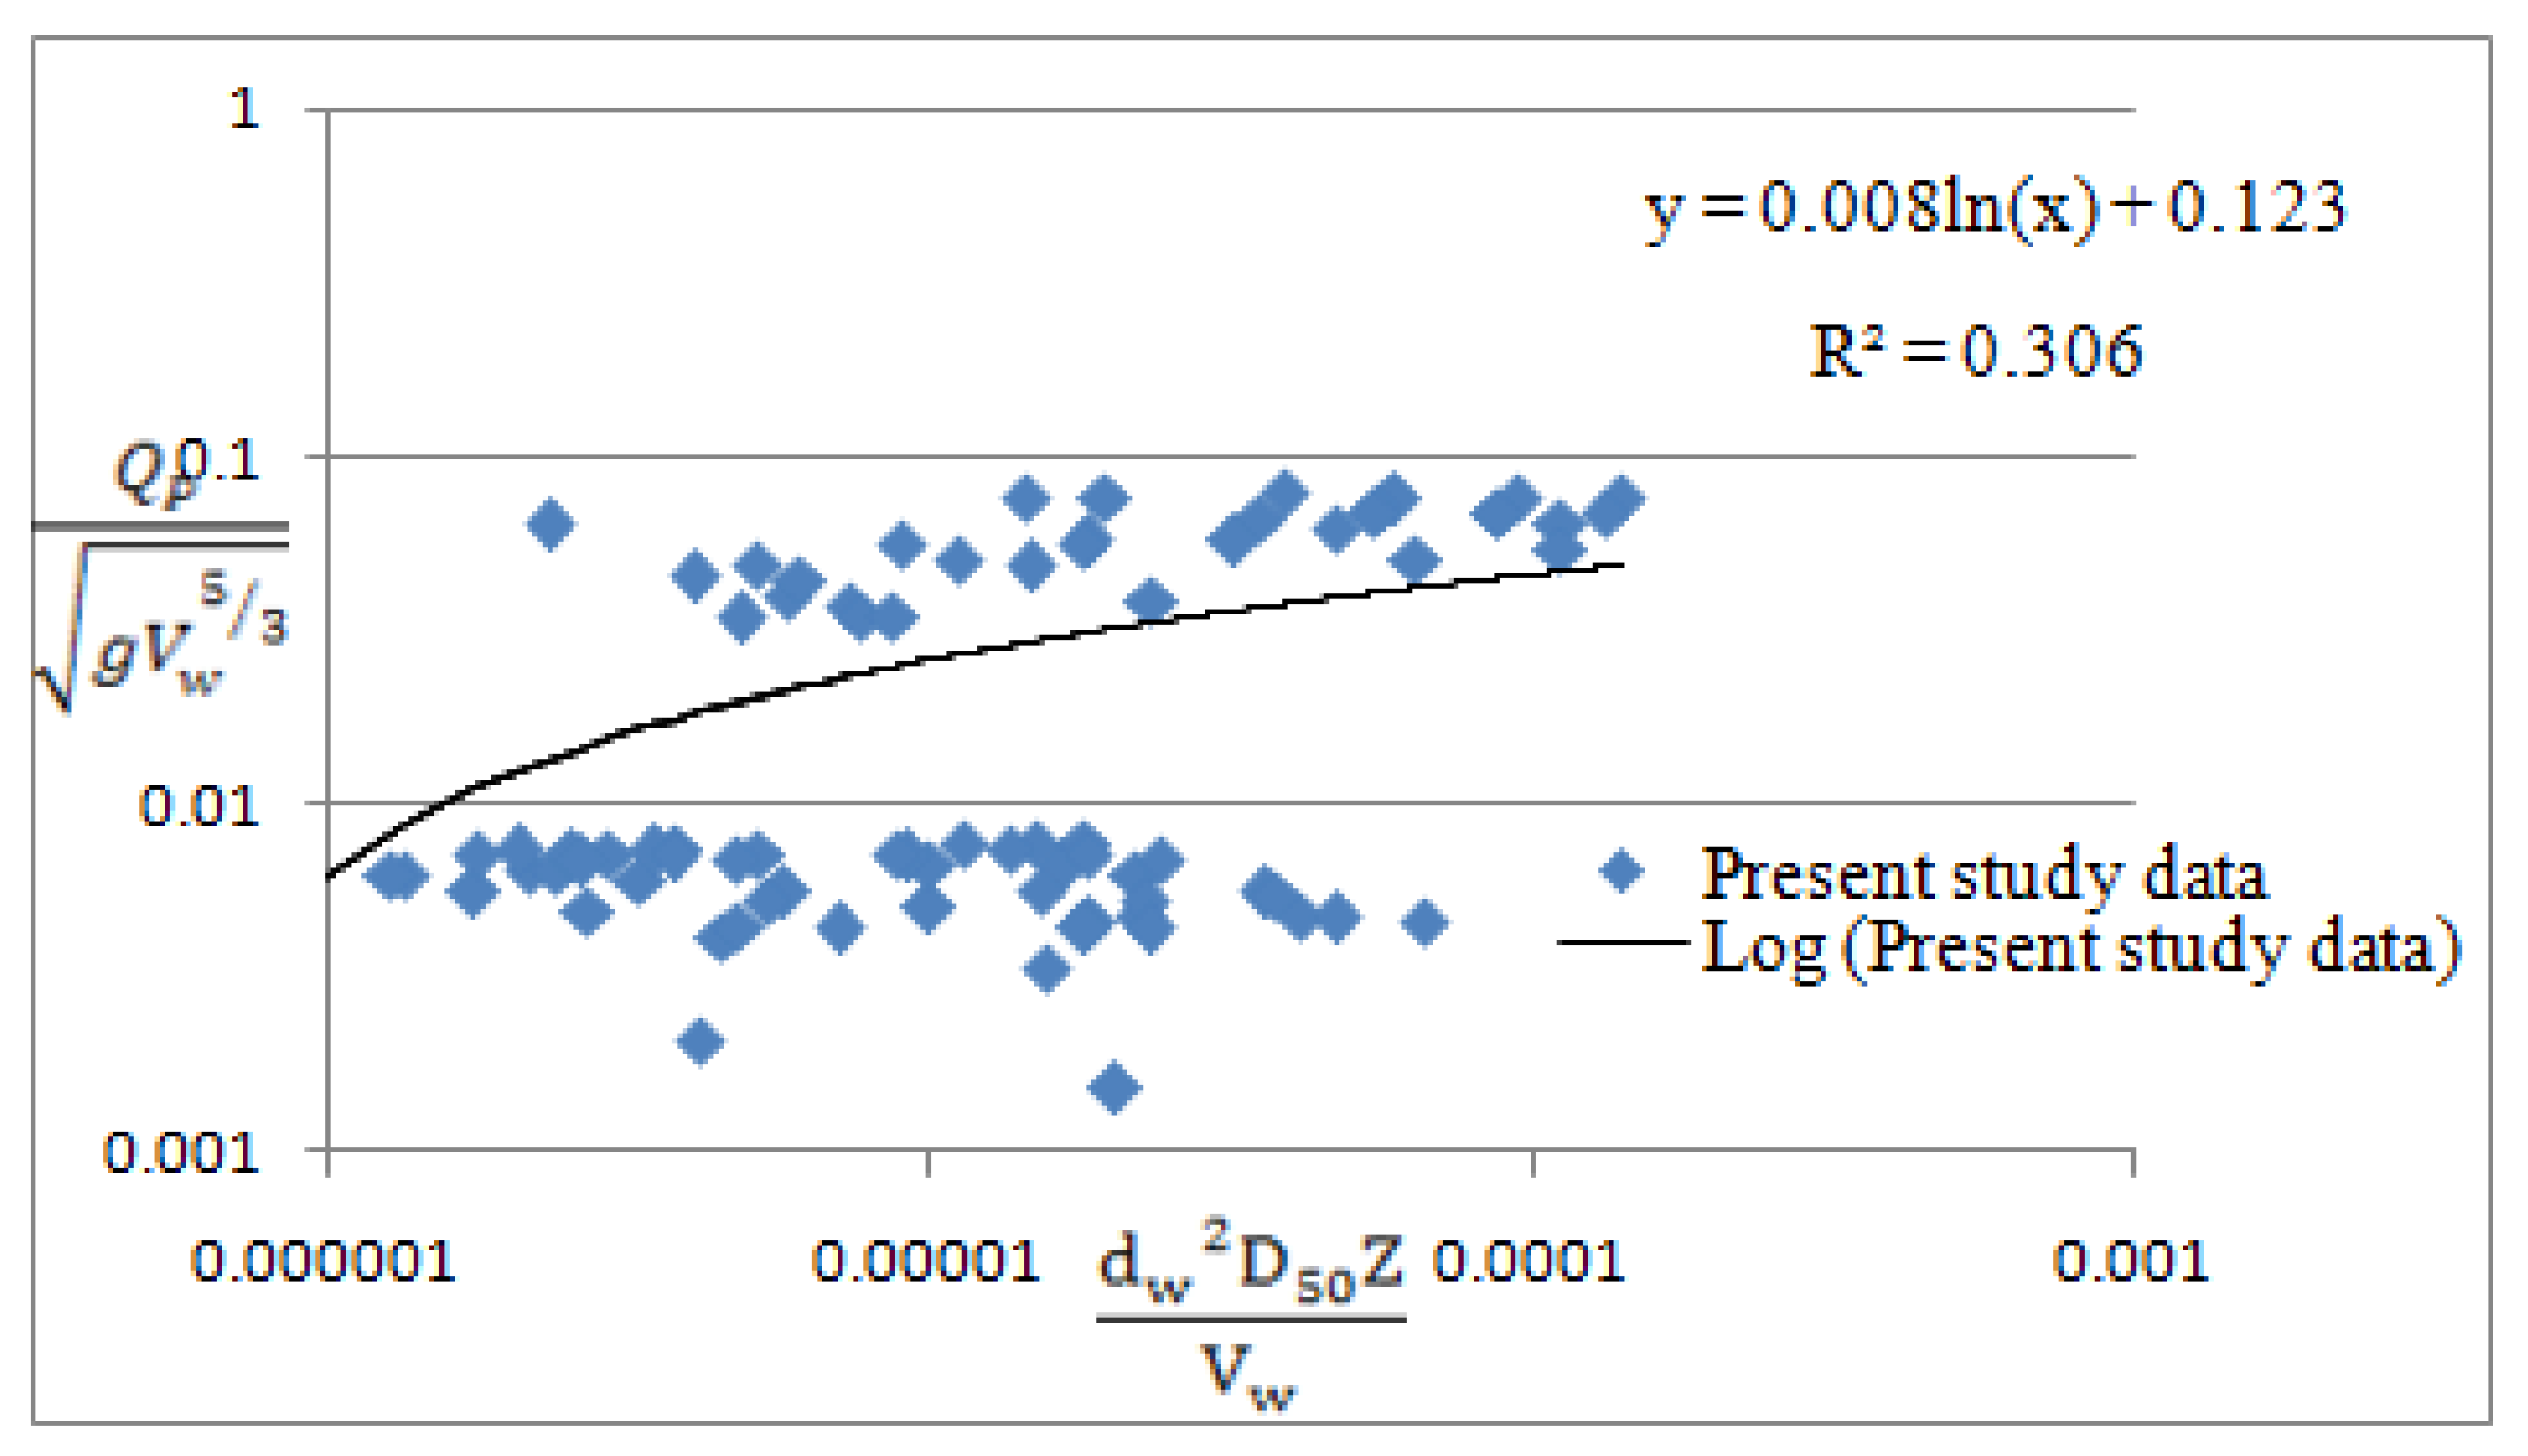
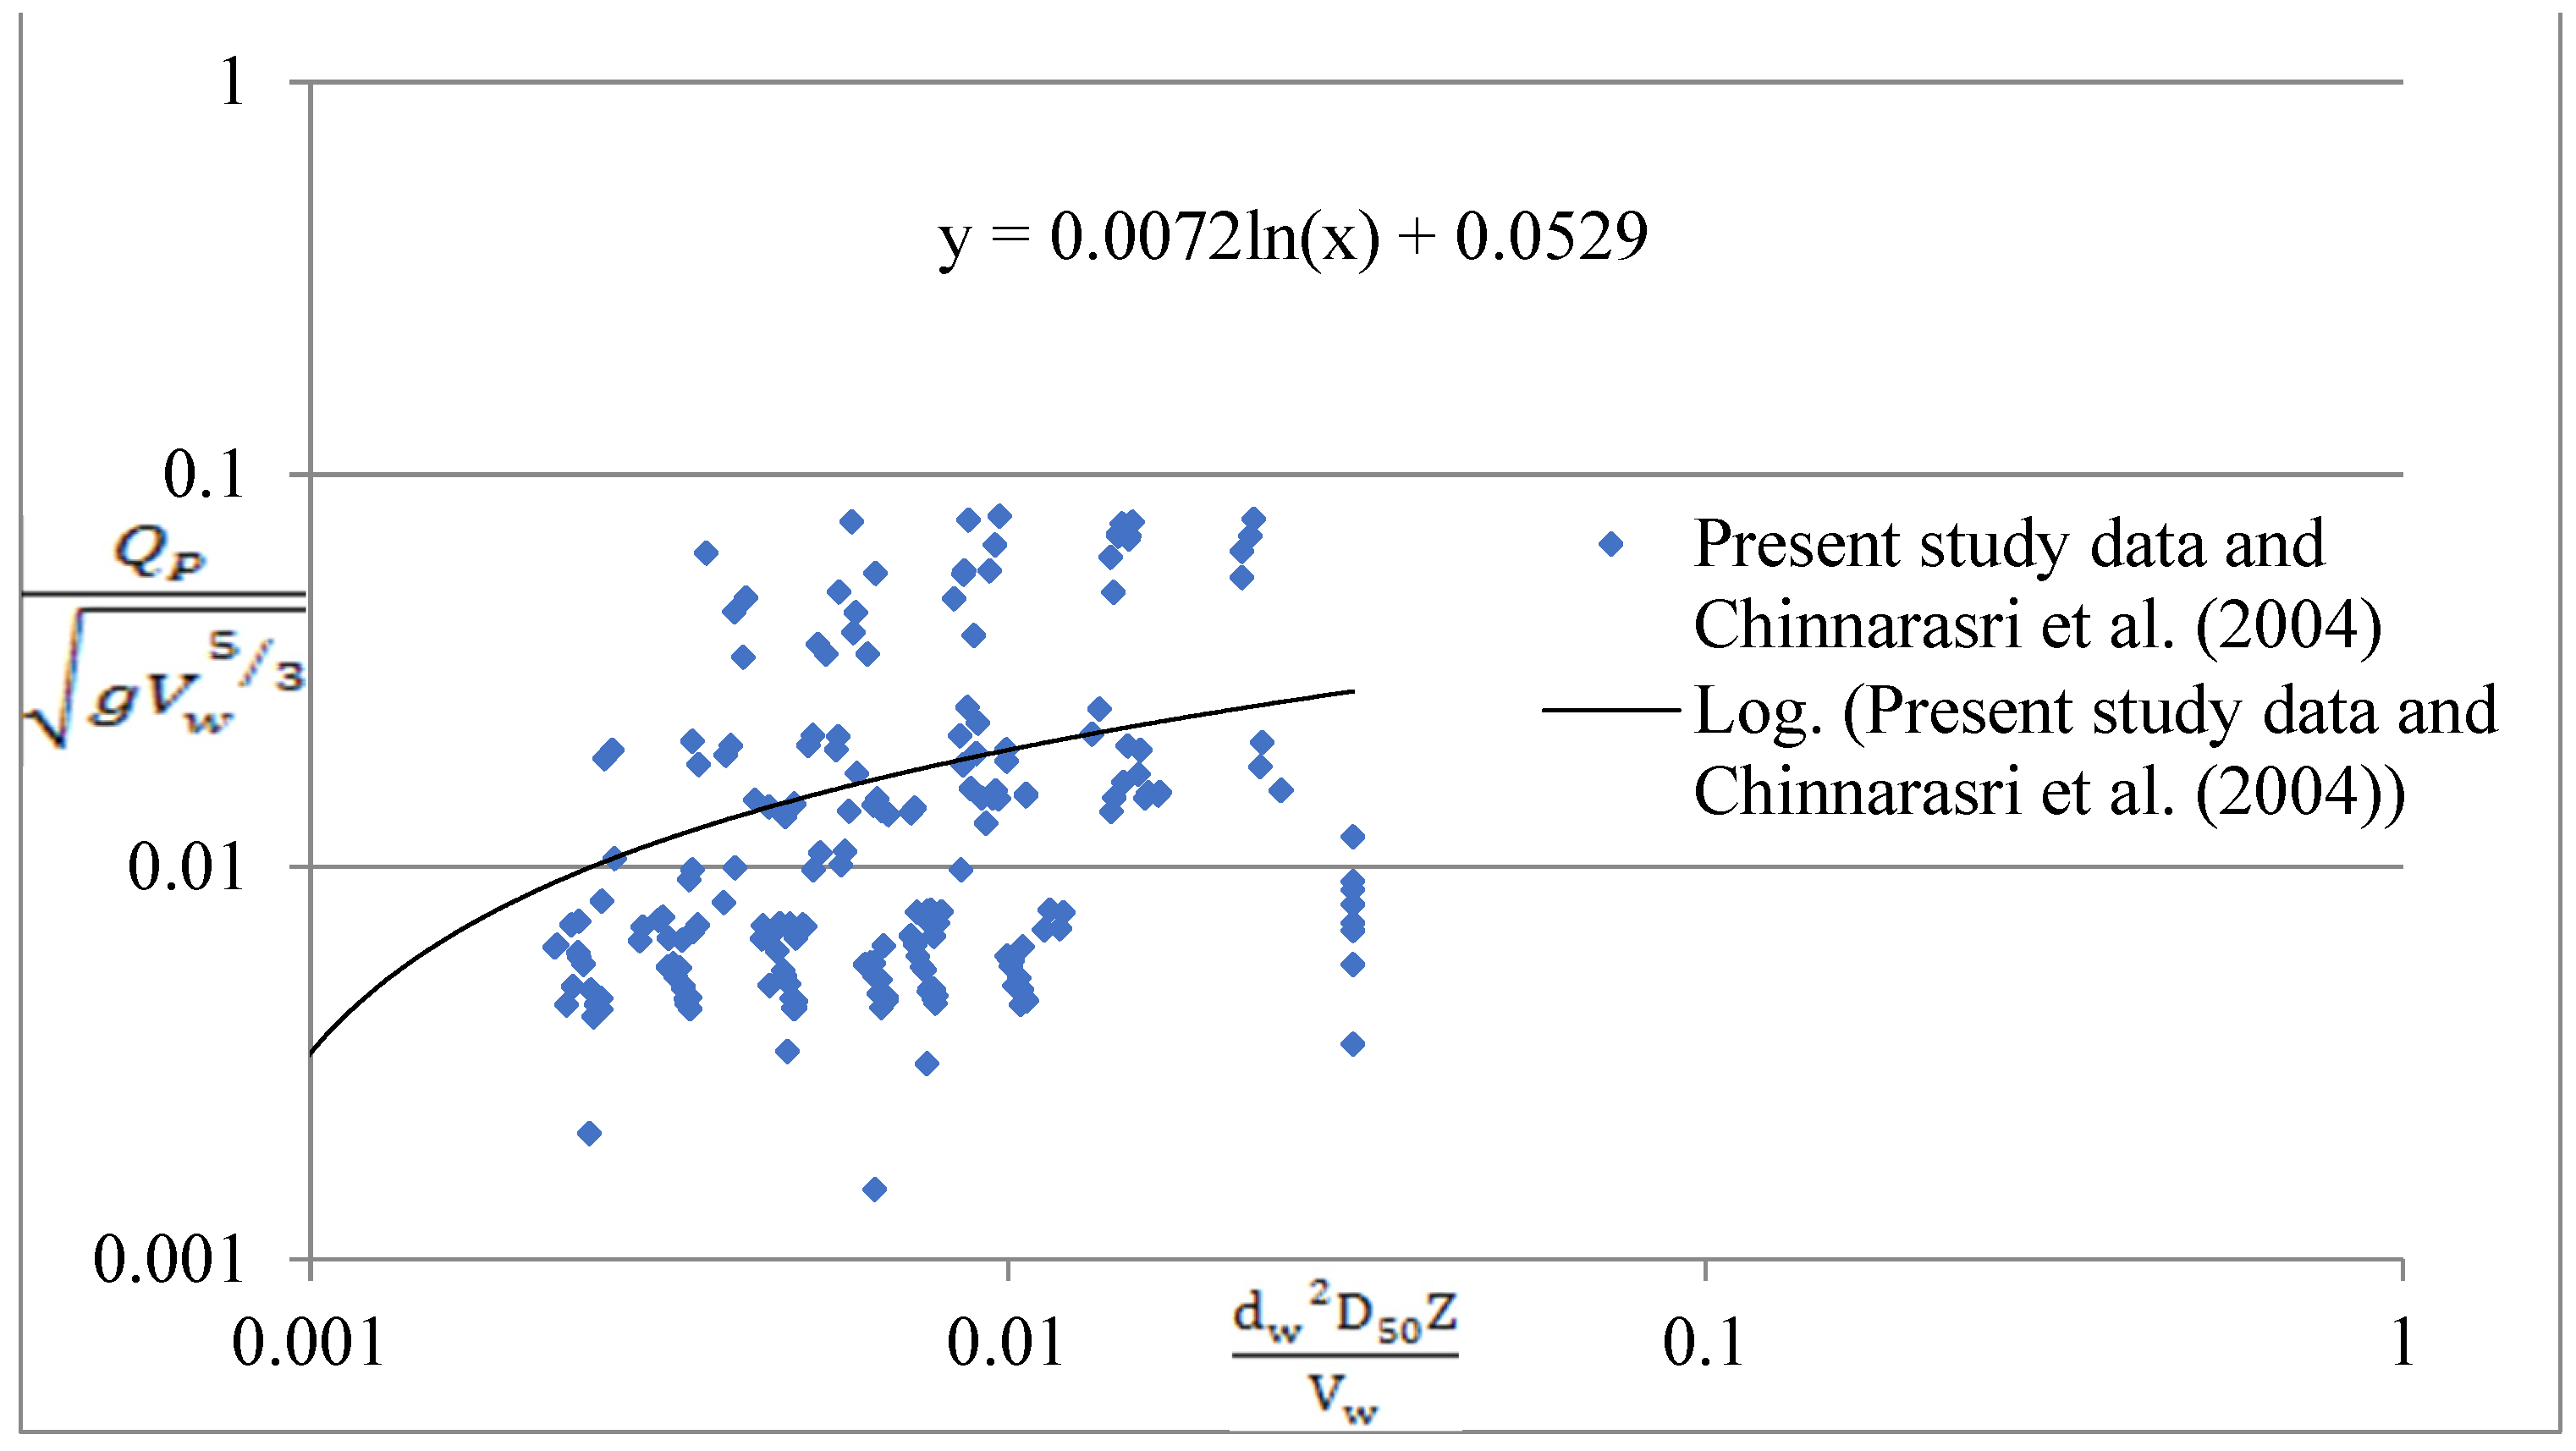
- A relationship was developed for determining peak outflow using depth of water, median particle size, side slope, and downstream slope (Equation (6)). From the graph, it is concluded that all data lie in a common cluster with coefficient of correlation as 0.9086.
- Furthermore, for the validation of present data, the experimental data were compared with two different equations (Equations (7) and (8)) developed by other investigators for predicting peak outflow. It is concluded that predicted values yield results that are closer to those of the present data, which validates the present data.
- Relationships developed in the present work are likely to be valuable for correlating other parameters.
Author Contributions
Funding
Data Availability Statement
Acknowledgments
Conflicts of Interest
References
- Ge, W.; Wang, X.; Li, Z.; Zhang, H.; Guo, X.; Wang, T.; Gao, W.; Lin, C.; van Gelder, P. Interval Analysis of the Loss of Life Caused by Dam Failure. J. Water Resour. Plan. Manag. 2021, 147, 04020098. [Google Scholar] [CrossRef]
- Hatje, V.; Pedreira, R.M.A.; de Rezende, C.E.; Schettini, C.A.F.; De Souza, G.C.; Marin, D.C.; Hackspacher, P.C. The environmental impacts of one of the largest tailing dam failures worldwide. Sci. Rep. 2017, 7, 10706. [Google Scholar] [CrossRef] [PubMed] [Green Version]
- Adamo, N.N.; Al-Ansari, N.; Sissakian, V.; Laue, J.; Knutsson, S. Dam Safety Problems Related to Seepage. J. Earth Sci. Geotech. Eng. 2020, 10, 191–239. [Google Scholar]
- International Commission on large dams (ICOLD). In Lessons from Dam Incidents; ICOLD: Paris, France, 1978.
- Viseu, T.; de Almeida, A.B. Dam-break risk management and hazard mitigation. State Art Sci. Eng. 2009, 36, 211–239. [Google Scholar]
- Ge, W.; Li, Z.; Liang, R.Y.; Li, W.; Cai, Y. Methodology for Establishing Risk Criteria for Dams in Developing Countries, Case Study of China. Water Resour. Manag. 2017, 31, 4063–4074. [Google Scholar] [CrossRef]
- Wu, M.; Ge, W.; Li, Z.; Wu, Z.; Zhang, H.; Li, J.; Pan, Y. Improved Set Pair Analysis and Its Application to Environmental Impact Evaluation of Dam Break. Water 2019, 11, 821. [Google Scholar] [CrossRef] [Green Version]
- Cui, P.; Zhou, G.G.; Zhu, X.; Zhang, J. Scale amplification of natural debris flows caused by cascading landslide dam failures. Geomorphology 2013, 182, 173–189. [Google Scholar] [CrossRef]
- Psomiadis, E.; Tomanis, L.; Kavvadias, A.; Soulis, K.; Charizopoulos, N.; Michas, S. Potential Dam Breach Analysis and Flood Wave Risk Assessment Using HEC-RAS and Remote Sensing Data: A Multicriteria Approach. Water 2021, 13, 364. [Google Scholar] [CrossRef]
- Wu, W. Earthen Embankment Breaching. J. Hydraul. Eng. 2011, 137, 1549–1564. [Google Scholar] [CrossRef]
- Gaagai, A.; Aouissi, H.A.; Krauklis, A.E.; Burlakovs, J.; Athamena, A.; Zekker, I.; Boudoukha, A.; Benaabidate, L.; Chenchouni, H. Modeling and Risk Analysis of Dam-Break Flooding in a Semi-Arid Montane Watershed: A Case Study of the Yabous Dam, Northeastern Algeria. Water 2022, 14, 767. [Google Scholar] [CrossRef]
- Gaagai, A.; Boudoukha, A.; Benaabidate, L. Failure simulation of Babar dam—Algeria and its impact on the valley downstream section. J. Water Land Dev. 2020, 44, 75–89. [Google Scholar] [CrossRef]
- MacDonald, T.C. and Langridge-Monopolis, J. Breaching Characteristics of Dam Failures. J. Hydraul. Eng. 1989, 110, 567–586. [Google Scholar] [CrossRef]
- Von Thun, J.L.; Gillette, D.R. Guidance on Breach Parameters, Unpublished Internal Document; U.S. Bureau of Reclamation: Denver, CO, USA, 1990; p. 17.
- Froehlich, D.C. Embankment-Dam Breach Parameters. In Proceedings of the 1987 ASCE National Conference on Hydraulic Engineering, Williamsburg, VA, USA, 3–7 August 1987; pp. 570–575. [Google Scholar]
- Froehlich, D.C. Peak Outflow from Breached Embankment Dam. J. Water Resour. Plan. Manag. 1995, 121, 90–97. [Google Scholar] [CrossRef]
- Froehlich, D.C. Embankment Dam Breach Parameters Revisited. In Proceedings of the 1995 ASCE Conference on Water Resources Engineering, San Antonio, TX, USA, 14–18 August 1995; pp. 887–891. [Google Scholar]
- Kirkpatrick, G.W. Evaluation Guidelines for Spillway Adequacy. In Proceedings of the Evaluation of Dam Safety, Engineering Foundation Conference, Pacific Grove, CA, USA; ASCE: Reston, VA, USA, 1976; pp. 395–414. [Google Scholar]
- Pierce, M.W.; Thornton, C.I.; Abt, S.R. Predicting Peak Outflow from Breached Embankment Dams. J. Hydrol. Eng. 2010, 15, 338–349. [Google Scholar] [CrossRef] [Green Version]
- Wahl, T.L. Predicting of Embankment Dam Breach Parameters: A Needs Assessment; USBR, Water Resources Research Laboratory, PAP-735: Denver, CO, USA, 2007.
- Zhao, G. Breach Growth in Cohesive Embankments due to Overtopping. Ph. D. Thesis, Delft University of Technology, Delft, The Netherlands, 2016. [Google Scholar]
- Verma, D.; Setia, B.; Arora, V.K. Mechanism of embankment dam breach. In Proceedings of the International Conference on Fluvial Hydraulics, Lausanne, Switzerland, 3–5 September 2014; pp. 1655–1659. [Google Scholar]
- Vanani, H.R.; Ostad-Ali-Askari, K. Correct path to use flumes in water resources management. Appl. Water Sci. 2022, 12, 187. [Google Scholar] [CrossRef]
- Verma, D.; Setia, B.; Arora, V.K. Experimental study on breaching of embankments. In Proceedings of the 9th International Conference on Scour and Erosion, ICSE, Taipei, Taiwan, 5–8 November 2018; pp. 255–261. [Google Scholar]
- Verma, D.K.; Setia, B. Two dimensional unsteady dam breach analysis using fuse plug models. Disaster Adv. 2021, 14, 74–82. [Google Scholar]
- Chinnarasri, C.; Jirakitlerd, S.; Wongwises, S. Embankment dam breach and its outflow characteristics. Civ. Eng. Environ. Syst. 2004, 21, 247–264. [Google Scholar] [CrossRef]
- Wahl, T.L. Uncertainty of Predictions of Embankment Dam Breach Parameters. J. Hydraul. Eng. 2004, 130, 389–397. [Google Scholar] [CrossRef]
- Alhasan, Z.; Jandora, J.; Říha, J. Study of Dam-break Due to Overtopping of Four Small Dams in the Czech Republic. Acta Univ. Agric. Silvic. Mendel. Brun. 2015, 63, 717–729. [Google Scholar] [CrossRef] [Green Version]
- Verma, D.K.; Setia, B.; Arora, V.K. Experimental Study of Breaching of an Earthen Dam using a Fuse Plug Model. Int. J. Eng. Trans. A Basics 2017, 30, 479–485. [Google Scholar]
- Hasson, M.; Morris, M.; Hanson, G.; Lakhal, K. Breach Formation: Laboratory and Numerical Modeling of Breach Formation; Association of State Dam Safety Officials: Phoenix, AZ, USA, 2004. [Google Scholar]
- Kruse, E.; Eslamian, S.; Ostad-Ali-Askari, K.; Hosseini-Teshnizi, S.H. Borehole Investigations. In Encyclopedia of Engineering Geology, Encyclopedia of Earth Sciences Series; Bobrowsky, P., Marker, B., Eds.; Springer: Cham, Switzerland, 2018. [Google Scholar] [CrossRef]
- Ashraf, M.; Soliman, A.H.; El-Ghorab, E.; El Zawahry, A. Assessment of embankment dams breaching using large scale physical modeling and statistical methods. Water Sci. 2018, 32, 362–379. [Google Scholar] [CrossRef] [Green Version]
- Wang, B.; Chen, Y.; Wu, C.; Peng, Y.; Song, J.; Liu, W.; Liu, X. Empirical and semi-analytical models for predicting peak outflows caused by embankment dam failures. J. Hydrol. 2018, 562, 692–702. [Google Scholar] [CrossRef]
- Tabrizi, A.A.; Elalfy, E.; Elkholy, M.; Chaudhry, M.H.; Imran, J. Effects of compaction on embankment breach due to overtopping. J. Hydraul. Res. 2016, 55, 236–247. [Google Scholar] [CrossRef]
- Pickert, G.; Weitbrecht, V.; Bieberstein, A. Breaching of overtopped river embankments controlled by apparent cohesion. J. Hydraul. Res. 2011, 49, 143–156. [Google Scholar] [CrossRef]
- Dhiman, S.; Patra, K.C. Studies of dam disaster in India and equations for breach parameter. Nat. Hazards 2019, 98, 783–807. [Google Scholar] [CrossRef]
- Aamir, M.; Khan, M.A.; Ahmad, Z. Soft-computing approach to scour depth prediction under wall jets. In Current Directions in Water Scarcity Research; Elsevier: Amsterdam, The Netherlands, 2022; Volume 7, pp. 71–82. [Google Scholar]
- Aamir, M.; Ahmad, Z.; Pandey, M.; Khan, M.A.; Aldrees, A.; Mohamed, A. The Effect of Rough Rigid Apron on Scour Downstream of Sluice Gates. Water 2022, 14, 2223. [Google Scholar] [CrossRef]
- Pandey, M.; Pu, J.H.; Pourshahbaz, H.; Khan, M.A. Reduction of scour around circular piers using collars. J. Flood Risk Manag. 2022, 15, e12812. [Google Scholar] [CrossRef]
- Pu, J.; Wallwork, J.; Khan, A.; Pandey, M.; Pourshahbaz, H.; Satyanaga, A.; Hanmaiahgari, P.; Gough, T. Flood Suspended Sediment Transport: Combined Modelling from Dilute to Hyper-Concentrated Flow. Water 2021, 13, 379. [Google Scholar] [CrossRef]


| Fill Material (S) | Median Size, D50 (mm) | OMC (%) | Dry Density (gm/cc) | Cohesion, C (kg/cm2) | Angle of Shearing Resistance, Φ (degree) | Type of Soil |
|---|---|---|---|---|---|---|
| S1 | 0.600 | 9.8 | 1.76 | 0.062 | 25.5° | Poorly graded sand (SP) |
| S2 | 0.250 | 10.7 | 1.82 | 0.055 | 26° | Well-graded sand (SW) |
| S7 | 0.095 | 15.2 | 1.81 | 0.025 | 27° | Silty sand (SM) |
| S8 | 0.056 | 16.8 | 1.64 | 0.385 | 15° | Clay with low compressibility (CL) |
| Expt. No. | Soil | Flow Chart at Time of Breach | |||
|---|---|---|---|---|---|
| Side Slope, Z (tan θ) | Fill Size, D50 (mm) | Depth of Water, dw (cm) | Volume of Water, Vw (cm3) | Peak Outflow, Qp (cm3/s) | |
| 1 | 1 | 0.6 | 9.1 | 35,262.5 | 14,854 |
| 2 | 1 | 0.095 | 8 | 31,000 | 13,254 |
| 3 | 1 | 0.056 | 6.2 | 24,025 | 7853 |
| 4 | 0.67 | 0.6 | 9.1 | 35,262.5 | 14,586 |
| 5 | 0.67 | 0.095 | 8.8 | 34,100 | 14,232 |
| 6 | 0.67 | 0.056 | 5.3 | 20,537.5 | 5956 |
| 7 | 1 | 0.6 | 7.2 | 27,900 | 10,125 |
| 8 | 1 | 0.095 | 6 | 23,250 | 6585 |
| 9 | 1 | 0.056 | 4 | 15,500 | 3852 |
| 10 | 0.67 | 0.25 | 5.4 | 20,925 | 4852 |
| 11 | 0.67 | 0.095 | 4.5 | 17,437.5 | 3958 |
| 12 | 0.67 | 0.056 | 5 | 19,375 | 4015 |
| 13 | 1 | 0.6 | 8.5 | 32,937.5 | 12,692 |
| 14 | 1 | 0.095 | 7.4 | 28,675 | 9228 |
| 15 | 1 | 0.056 | 5.3 | 20,537.5 | 4282 |
| 16 | 0.67 | 0.25 | 8.2 | 31,775 | 11,685 |
| 17 | 0.67 | 0.056 | 4.2 | 16,275 | 4521 |
| 18 | 1 | 0.6 | 7.2 | 27,900 | 8664 |
| 19 | 1 | 0.095 | 7.3 | 28,287.5 | 8954 |
| 20 | 1 | 0.056 | 4.2 | 16,275 | 4508 |
| 21 | 0.67 | 0.6 | 8.4 | 32,550 | 12,351 |
| 22 | 0.67 | 0.25 | 7.4 | 28,675 | 9227 |
| 23 | 0.67 | 0.056 | 2.4 | 9300 | 4012 |
| 24 | 0.67 | 0.6 | 6.2 | 24,025 | 7021 |
| 25 | 0.67 | 0.095 | 6.8 | 26,350 | 7597 |
| 26 | 1 | 0.25 | 9.2 | 35,650 | 14,586 |
| 27 | 0.67 | 0.25 | 9 | 34,875 | 14,952 |
| 28 | 1 | 0.25 | 7.3 | 28,287.5 | 9885 |
| 29 | 1 | 0.25 | 8.6 | 33,325 | 13,038 |
| 30 | 0.67 | 0.6 | 8.5 | 32,937.5 | 12,692 |
| 31 | 1 | 0.25 | 8.5 | 32,937.5 | 12,692 |
| 32 | 1 | 0.25 | 23.8 | 685,440 | 58,321 |
| 33 | 1 | 0.095 | 20.4 | 587,520 | 43,545 |
| 34 | 1 | 0.056 | 19.5 | 561,600 | 39,546 |
| 35 | 0.67 | 0.6 | 23.5 | 676,800 | 52,654 |
| 36 | 1 | 0.25 | 20.5 | 590,400 | 43,584 |
| 37 | 1 | 0.095 | 18.5 | 532,800 | 37,852 |
| 38 | 1 | 0.056 | 17.6 | 506,880 | 34,215 |
| 39 | 0.67 | 0.6 | 17.4 | 501,120 | 32,012 |
| 40 | 0.67 | 0.095 | 20.7 | 596,160 | 42,541 |
| Author (s) | Enveloping Curve | Values of Coefficient (a) and Power Index (b) | |
|---|---|---|---|
| A | b | ||
| Present study | Upper | 0.43 | 0.91 |
| Lower | 0.15 | 1.08 | |
| Chinnarasri et al. [19] | Upper | 0.209 | 1.6 |
| Lower | 0.02 | 1.714 | |
Disclaimer/Publisher’s Note: The statements, opinions and data contained in all publications are solely those of the individual author(s) and contributor(s) and not of MDPI and/or the editor(s). MDPI and/or the editor(s) disclaim responsibility for any injury to people or property resulting from any ideas, methods, instructions or products referred to in the content. |
© 2023 by the authors. Licensee MDPI, Basel, Switzerland. This article is an open access article distributed under the terms and conditions of the Creative Commons Attribution (CC BY) license (https://creativecommons.org/licenses/by/4.0/).
Share and Cite
Verma, D.; Berwal, P.; Khan, M.A.; Alharbi, R.S.; Alfaisal, F.M.; Rathnayake, U. Design for the Prediction of Peak Outflow of Embankment Breaching Due to Overtopping by Regression Technique and Modelling. Water 2023, 15, 1224. https://doi.org/10.3390/w15061224
Verma D, Berwal P, Khan MA, Alharbi RS, Alfaisal FM, Rathnayake U. Design for the Prediction of Peak Outflow of Embankment Breaching Due to Overtopping by Regression Technique and Modelling. Water. 2023; 15(6):1224. https://doi.org/10.3390/w15061224
Chicago/Turabian StyleVerma, Deepak, Parveen Berwal, Mohammad Amir Khan, Raied Saad Alharbi, Faisal M. Alfaisal, and Upaka Rathnayake. 2023. "Design for the Prediction of Peak Outflow of Embankment Breaching Due to Overtopping by Regression Technique and Modelling" Water 15, no. 6: 1224. https://doi.org/10.3390/w15061224