Article

Evidence for Groundwater Salinity Origin Based on Hydrogeochemical and Isotopic (2H, 18O, 37Cl, 3H, 13C, 14C) Approaches: Sousse, Eastern Tunisia

by
Farah Nefzaoui
1,
Mohamed Fethi Ben Hamouda
1,2,*,
Paula Maria Carreira
3,
José Manuel Marques
4 and
Hans G. M. Eggenkamp
5
1
LRSTE Laboratory of Water Science and Technology, National Agronomic Institute of Tunisia, 43, Avenue, Charles Nicolle, Tunis 1082, Tunisia
2
LBTN Laboratoire de Biotechnologie et Technologies Nucléaires, Centre National des Sciences et Technologies Nucléaires, Technopark of Sidi Thabet, Sidi Thabet 2020, Tunisia
3
Centro de Ciências e Tecnologias Nucleares (C2TN), 2695-066 Bobadela, Portugal
4
Instituto Superior Técnico, 1049-001 Lisbon, Portugal
5
Onderzoek en Beleving, 1402 VT Bussum, The Netherlands
*
Author to whom correspondence should be addressed.
Water 2023, 15(6), 1242; https://doi.org/10.3390/w15061242
Submission received: 23 January 2023 / Revised: 13 March 2023 / Accepted: 17 March 2023 / Published: 22 March 2023
(This article belongs to the Section Hydrogeology)

Abstract

:
The key processes responsible for the rise in groundwater salinization in the Mio–Pliocene aquifer system of Sousse (Tunisia, eastern coastline) were identified through a multidisciplinary approach based on the use of geochemical, stable (2H, 13C, 18O and 37Cl) and radioactive (3H and 14C) isotope methods. In the study region, the mineralization of groundwaters is related to water–rock interaction ascribed to the dissolution of minerals in evaporite rocks, as well as to saltwater intrusion. Both processes explain the development of groundwaters in which Cl and Na dominantly determine the groundwater quality deterioration state. The isotopic and geochemical signatures of the studied groundwaters are clearly explained by the (i) occurrence of saline basins (sebkhas adjacent to the study region), (ii) type of rocks found below the ground surface, and (iii) cation exchange between clays and groundwaters.

1. Introduction

Salinization of water resources is one of the most prevalent processes that reduces water quality and threatens further water abstraction. This issue is worsened in coastal aquifers, particularly in dry and semi-arid areas where freshwater is threatened by seawater intrusion. The cause of rising groundwater salinity may be natural or anthropogenic, such as water–rock interaction (WRI), which involves the direct dissolving of evaporites by fresh groundwater, concentration of dissolved salt by evaporation, and infiltration of saline surface water.
Additionally, human activities can accelerate water quality deterioration because of pollution and sources of saline solutions (industrial liquid or solid waste, salt mining activities, or agricultural backflow) [1].
Once different salinization mechanisms are identified, it is possible to retrace the origin of groundwater, follow its evolution, and predict its future change [2].
The 1300 km of Tunisian coastline has a coastal width of 20 to 60 km and a total surface area of around 40,000 km2 [3].
Along the northeast coastal zone of the Tunisian Sahel, the preservation of water quantity and quality are major concerns.
Environmental isotope tracers and age indicators have been used in arid regions, such as North Africa, for assessing groundwater systems, particularly in terms of residence time and characterization of groundwater movement [4]. In fact, the use of stable and radioactive isotopes is considered an essential approach for identifying the cause of salinization in coastal aquifers in Tunisia [2,5,6,7,8,9].
Many geochemical tools, including Br/Cl and Na/Cl ratios, have been employed to understand the origin of the salinity sources of aquifers [10]. Chloride and bromide ions are often regarded as conservative tracers, and as a result they may be used as tracers for water sources and rock interactions [11].
Seawater and evaporites are generally considered to be the principal sources of Cl and Br ions in groundwaters [12]. Additionally, the water origin can be determined using the stable isotopes of water δ18O and δ2H [13]. Evaporation [14] and water–rock interactions [15] both modify the isotopic content of these isotopes.
Most often, chlorine isotopes (δ37Cl) are utilized to distinguish salinity sources, water–rock interactions, and mixing between different waters [16,17]. For example, in the shallow coastal aquifers of the lower Valley of Wadi Medjerda (LVWM), Ferchichi et al. [18,19] used geochemical and statistical methods (Principal Components Analysis), to identify the causes and mechanisms of groundwater salinization, while Bouchaou et al. [20] and Vespasiano et al. [21,22] used different isotopic and geochemical tracers to identify and characterize the main processes causing salinization of groundwater in the coastal aquifer of Souss-Massa (southwest of Morocco) and in the Sibari and Gioia coastal plains (southern Italy), respectively.
Regarding the identification of the most important processes responsible for the increase in groundwater mineralization, groundwater stable isotope data (δ2H, δ18O and δ37Cl) and geochemical signatures (Na+, Ca2+, Mg2+, Br, Cl and SO42−) have been linked to groundwater hydrodynamics [2]. In this study, a network monitoring tool built by the Water Resources General directorate of the Ministry of Agriculture (Tunisia) from 1980 to 1989 in the Sahel of Sousse was used for monitoring shallow groundwater quality.
The coastal aquifer system of Oued Laya studied here is no exception (Figure 1). Only a few hydrological studies have been carried out on the Oued Laya aquifer, the most important of which are those of Ben Hamouda et al. [5,23], Dridi et al. [24], and El Amri et al. [25]. Compared to nearby aquifers, the Oued Laya coastal aquifer is characterized mostly by low groundwater quality with significant salinity.
Being the second largest touristic city in Tunisia (25% of the country’s visitors), and being responsible for 13% of the country’s olive oil production, the Sousse region is in continuous and increasing need of drinking water and irrigation whose supply is mainly provided by groundwater. That is why it has become urgent to analyze and understand the groundwater’s salinity sources and evaluate its availability.
The purpose of this work is to define the geochemistry of the Oued Laya aquifer, to clarify the geochemical processes involved in groundwater mineralization, and to correlate the findings with hydrodynamic data from the coastal region.
Ion ratios, such as Na/Cl, Ca/Mg, Ca/SO4, and Br/Cl, and stable and radioactive isotope variations (δ18O, δ2H, 3H, δ13C, 14C, and δ37Cl) were applied in this work to the Oued Laya aquifer system and utilized for the identification of the various sources of salinity in coastal zones [10,11,13,26,27].

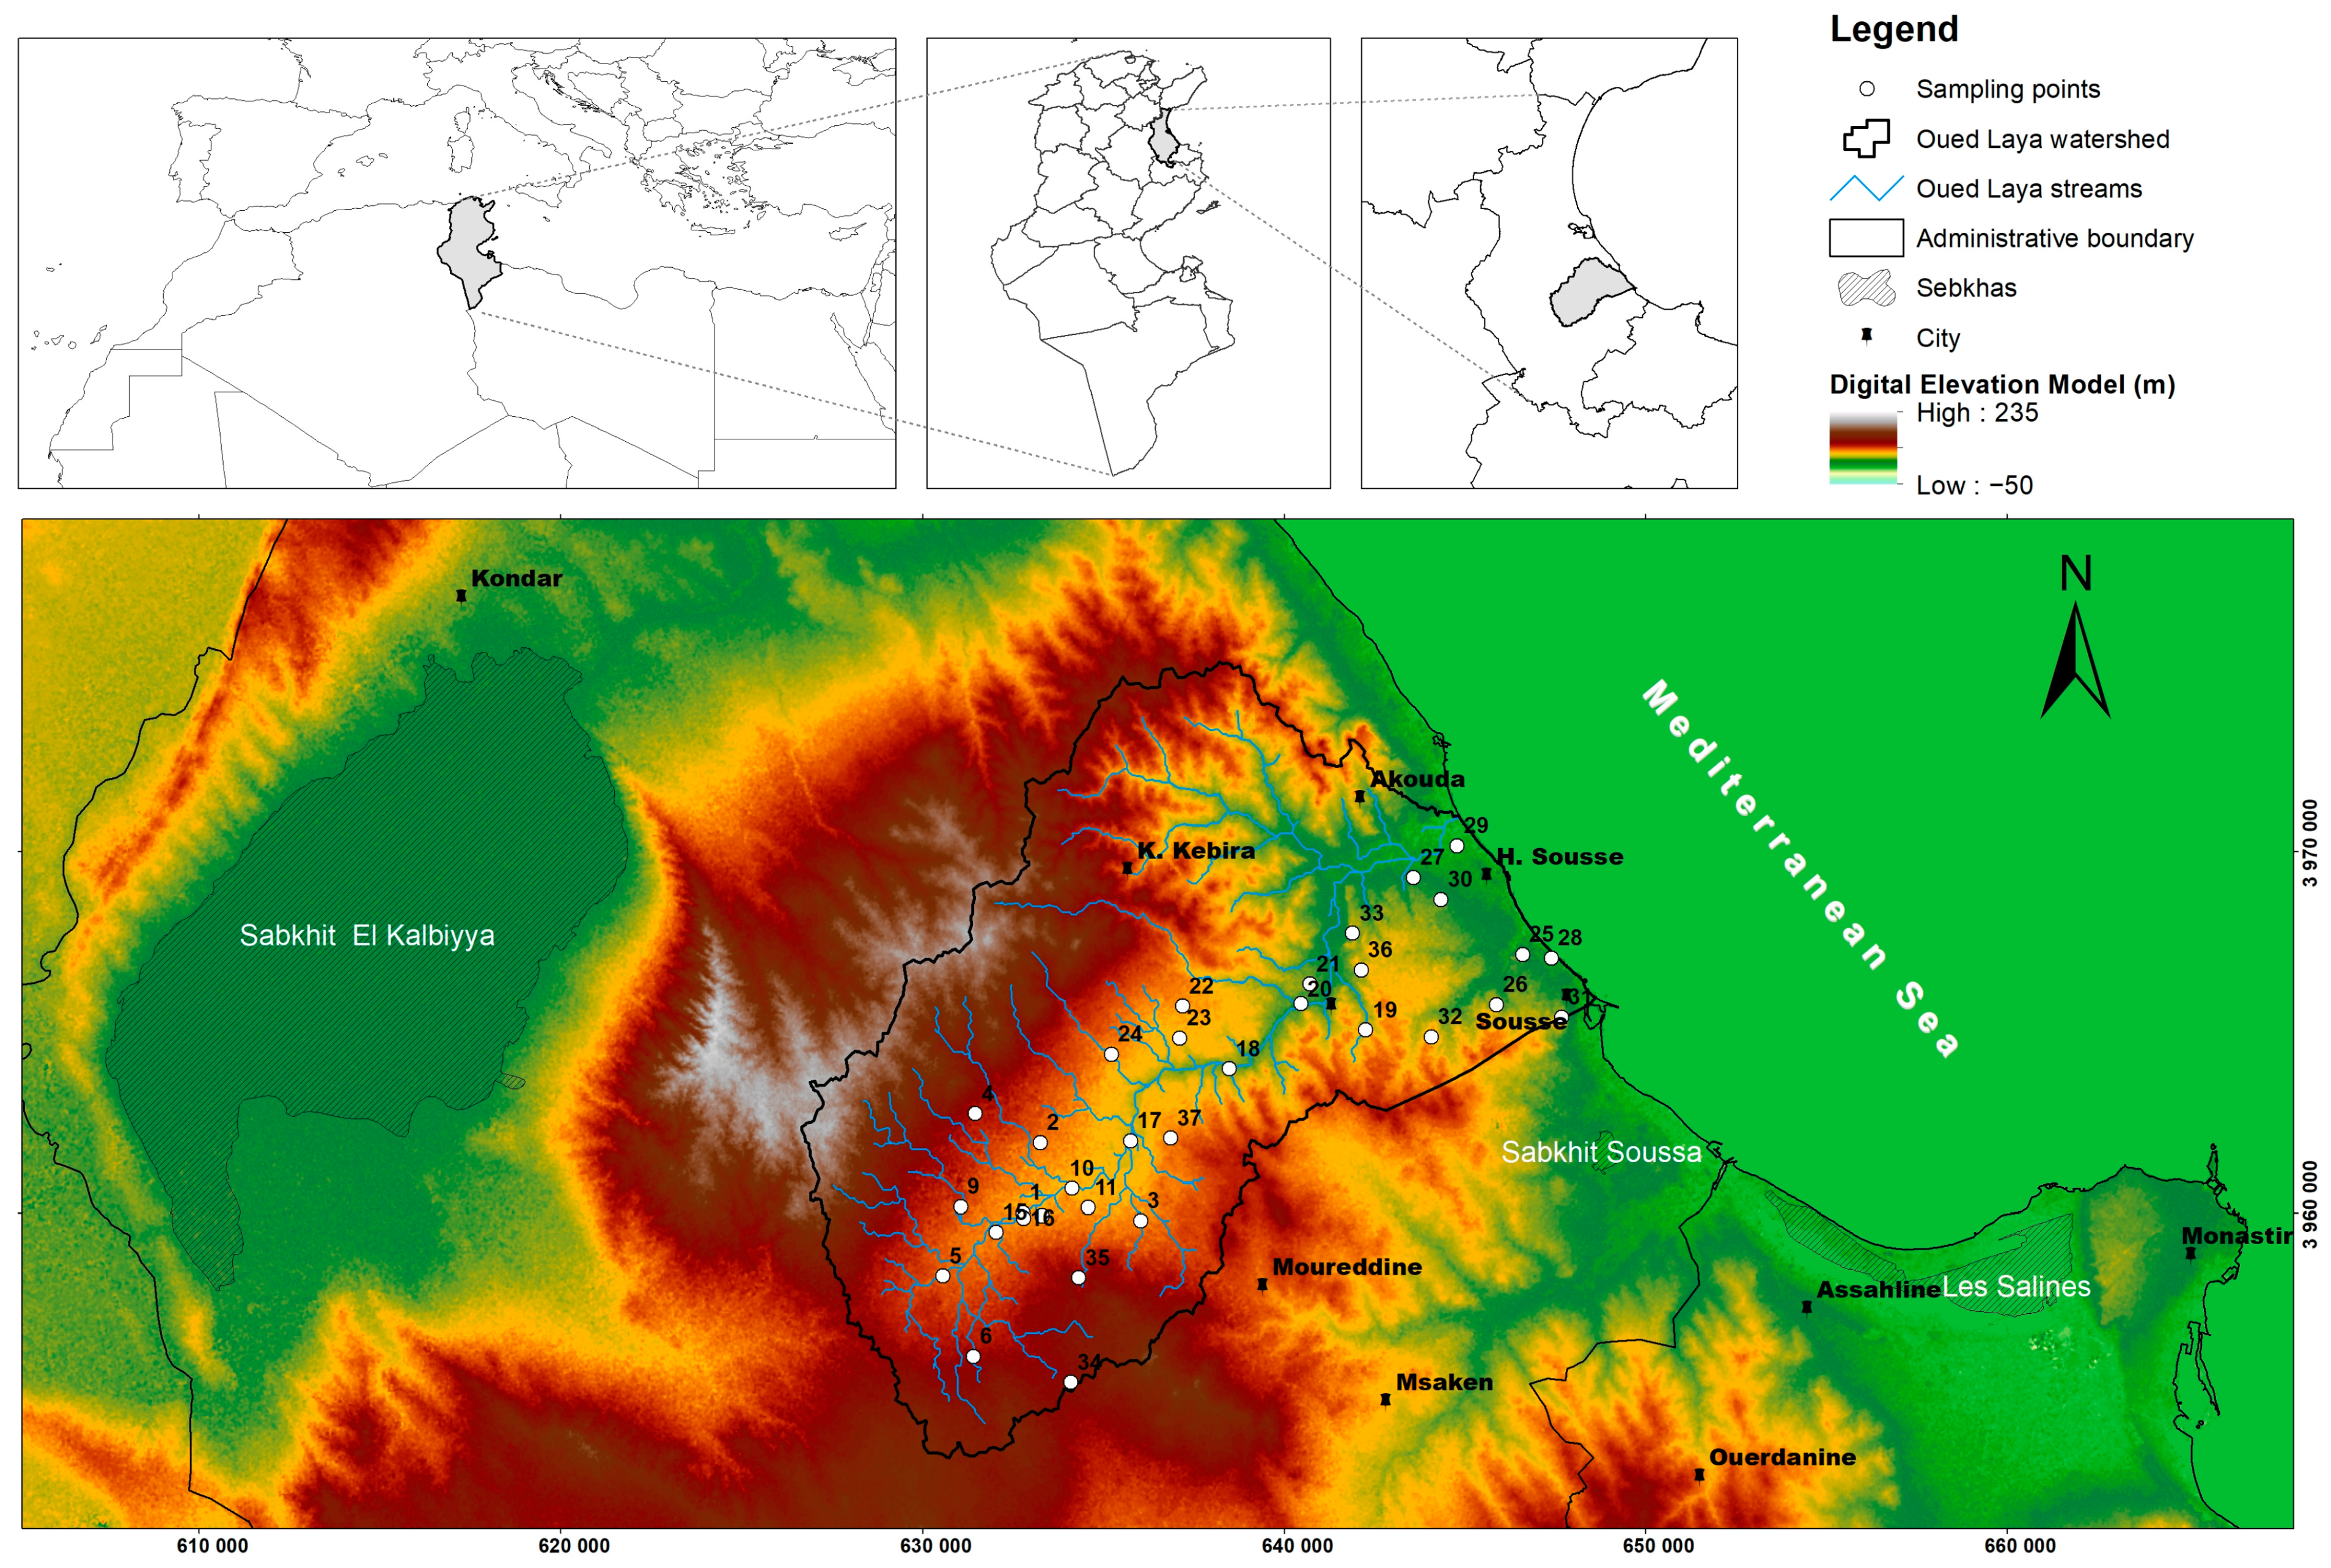
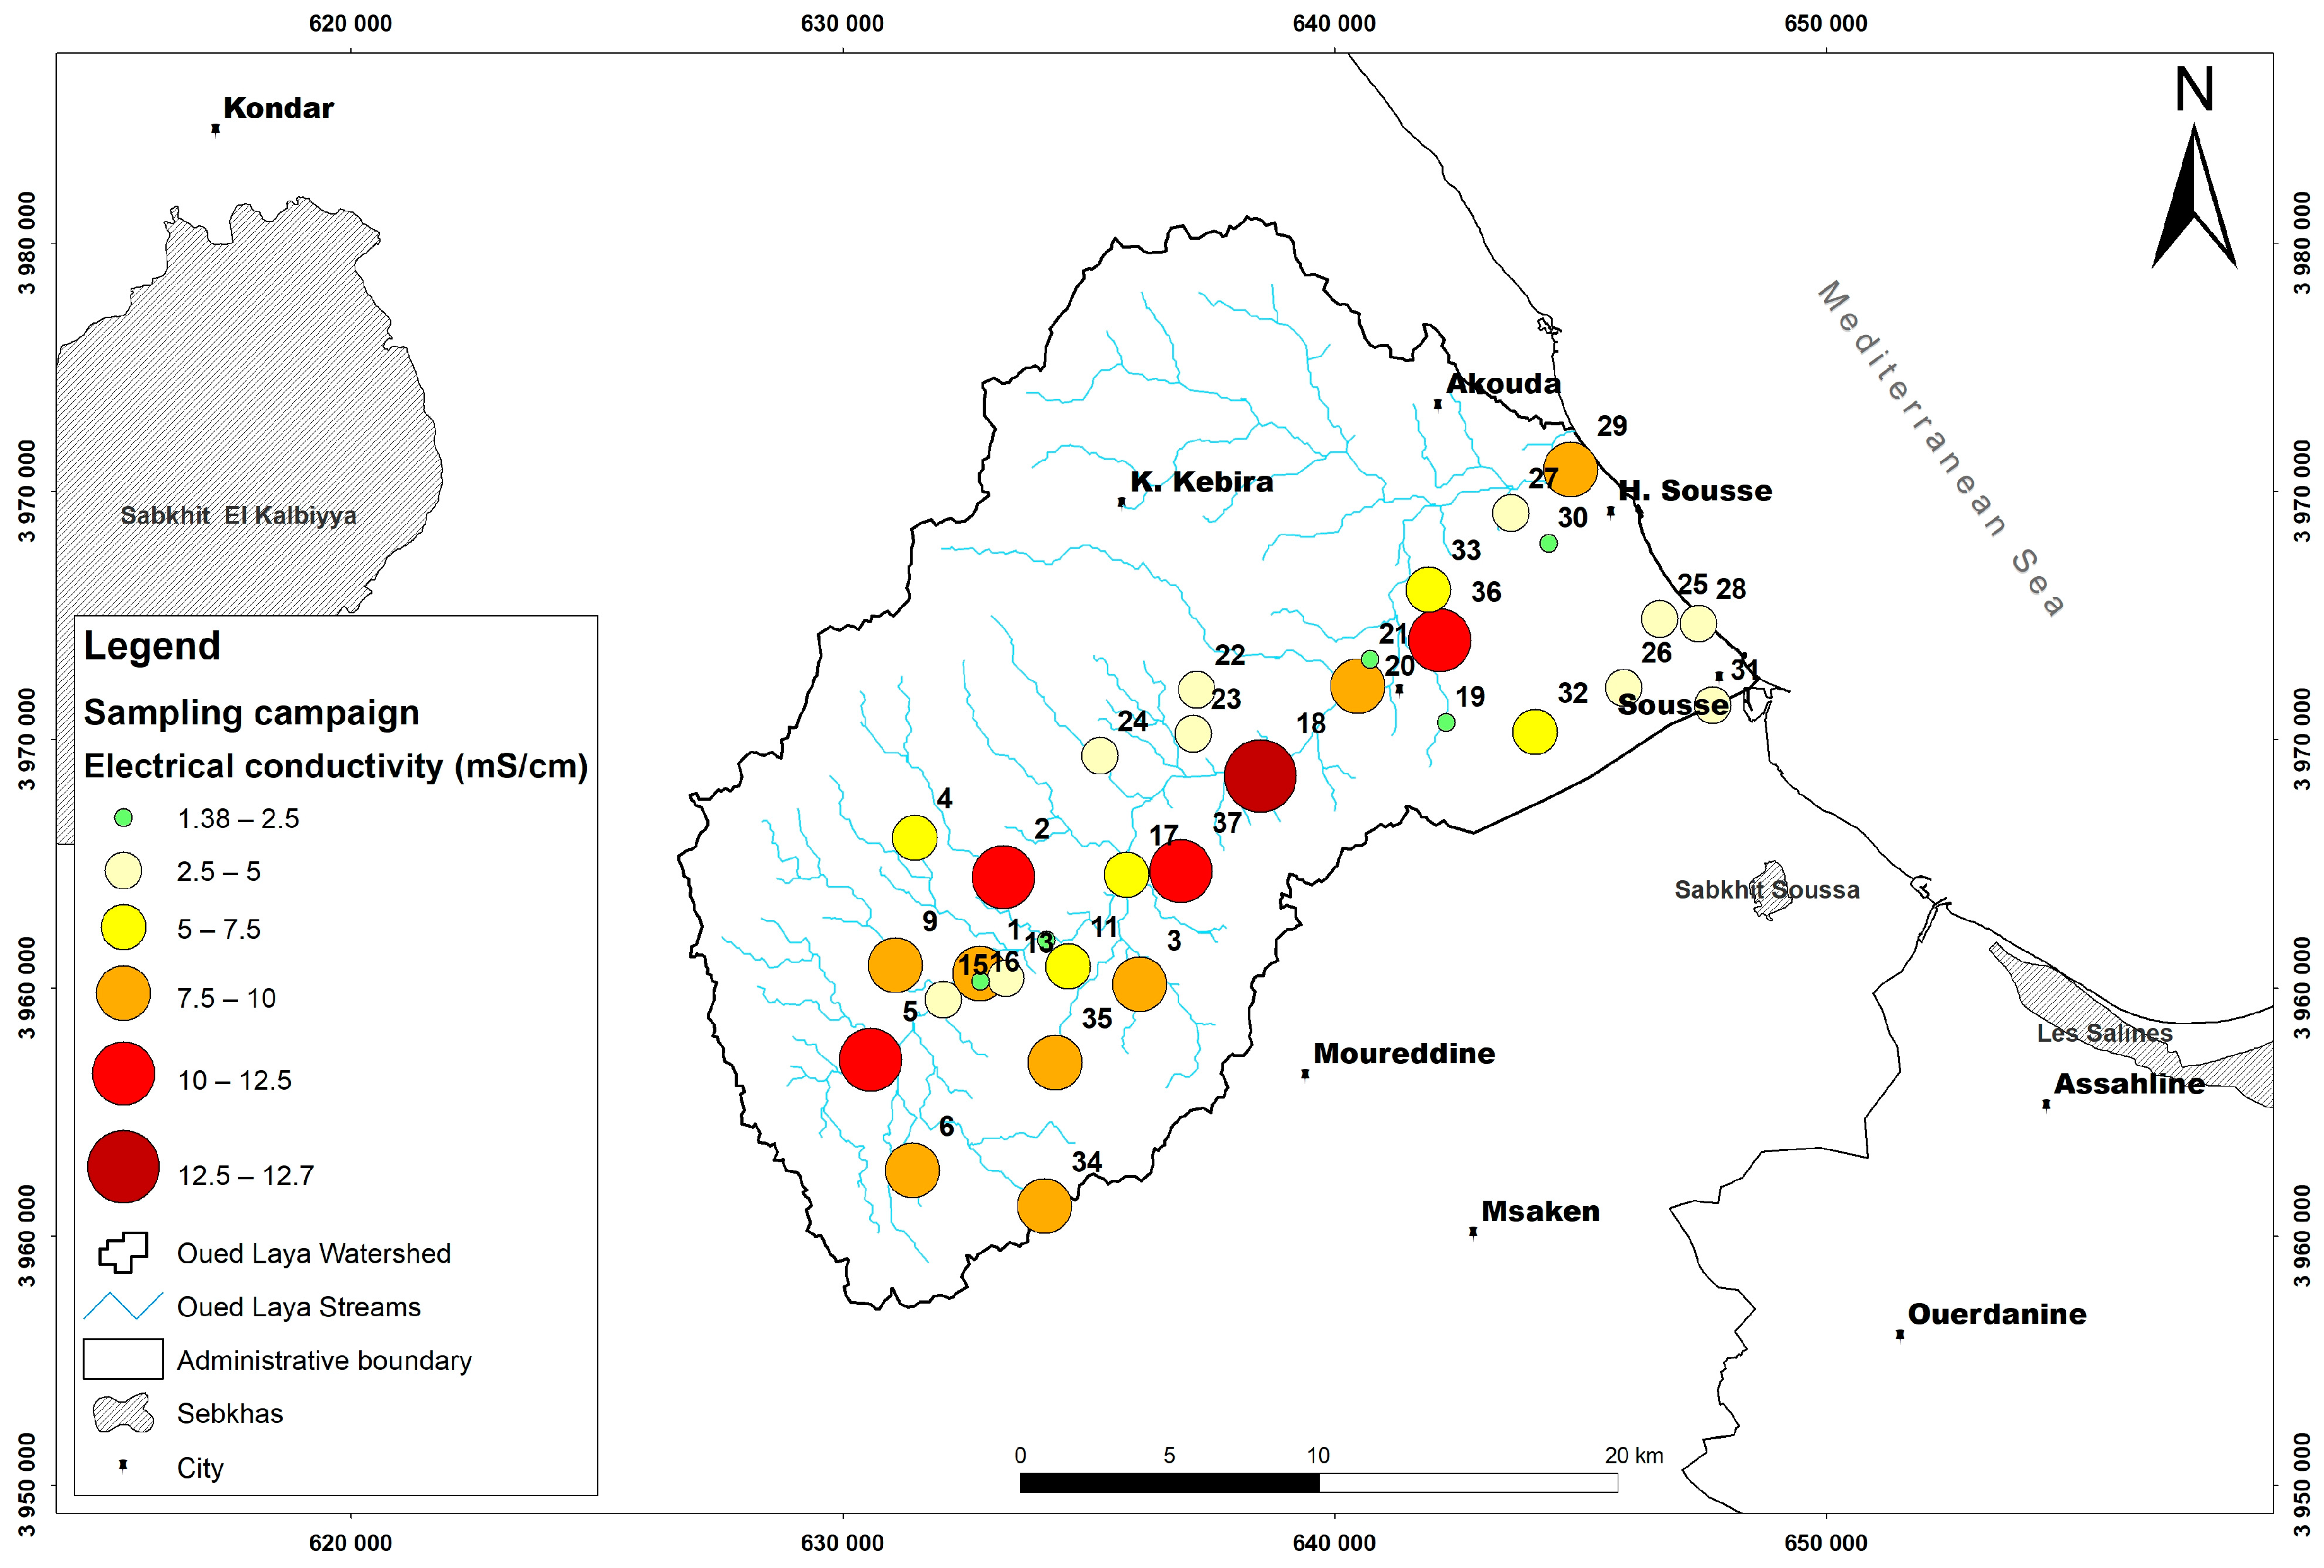
2. Main Features of the Study Area

The Oued Laya aquifer is situated in the Tunisian Sahel about 140 km south of the city of Tunis, and is close to the city of Sousse, one of Tunisia’s most important seaside resort towns (Figure 1). It is near the coast at the end of the littoral zone of the Gulf of Hammamet in the southwestern part of the Mediterranean Sea. The landscape is a coastal plain that gradually slopes (2%) in the direction of the coast. It extends 15 km from north to south between Zaouia Sousse and Kalaa Kebira, and 25 km in width from the sea to the south west. At its highest point the altitude is about 100 m [23]. The topography of the Sousse region is composed of plains and hills, including the anticline of Kalaa Kebira and Mouredine. The plain is low and flat and has a sandy coastline along the Mediterranean Sea [23].
The region of Sousse is characterized by a semi-arid climate. The annual average rainfall is 350 mm with significant variations; between 1901 and 2020, the extremes recorded were 110 and 700 mm in 2004 and 1969, respectively. This climate prevails in the Mediterranean regions with a mean temperature of 19 °C. September through February are the wettest months, while July and August are the driest [24,25].
The evapo-transpiration (ETP) is estimated to be higher than 1750 mm/year by the Riou approach [28]. The region is economically characterized by important agriculture, commerce, and tourist activity. The number of inhabitants increases considerably during the summer period, with a population approaching 300,000.
The groundwater in the Oued Laya aquifer is divided into two distinct aquifers. The first is a shallow aquifer that extends to about 60 m in depth and has a reservoir primarily composed by Mio–Pliocene sediments (with a few gypsum lenses scattered throughout the geological formations), covering a surface of about 217 km2 and varying in thickness from 10 to 40 m. The second is a deep aquifer that lies between 90 and 250 m in the sandstone deposits of the Miocene. In this area, there are no perennial streams due to the climatic specificity of the region (semi-arid) and geological features. During severe flooding and intense storms, a large number of minor streams (Oueds) may transport water. The main Oued that reaches the Tunisian city of Sousse’s shore is Oued Laya [23,24,25].
According to official yearly data from 2020, the region’s renewable water resources are predicted to be 3.3 × 10⁶ m3/year with an annual abstraction of about 3.133 × 10⁶ m3. The number of wells has almost doubled from 400 to 795 wells between 1980 and 2010. [29].
The agricultural, touristic, and industrial sectors place the most significant demands on the Oued Laya aquifer. Groundwater abstraction from the aquifer is mainly through a relatively large number of shallow wells and boreholes with a depth ranging from 10 to 60 m [29].

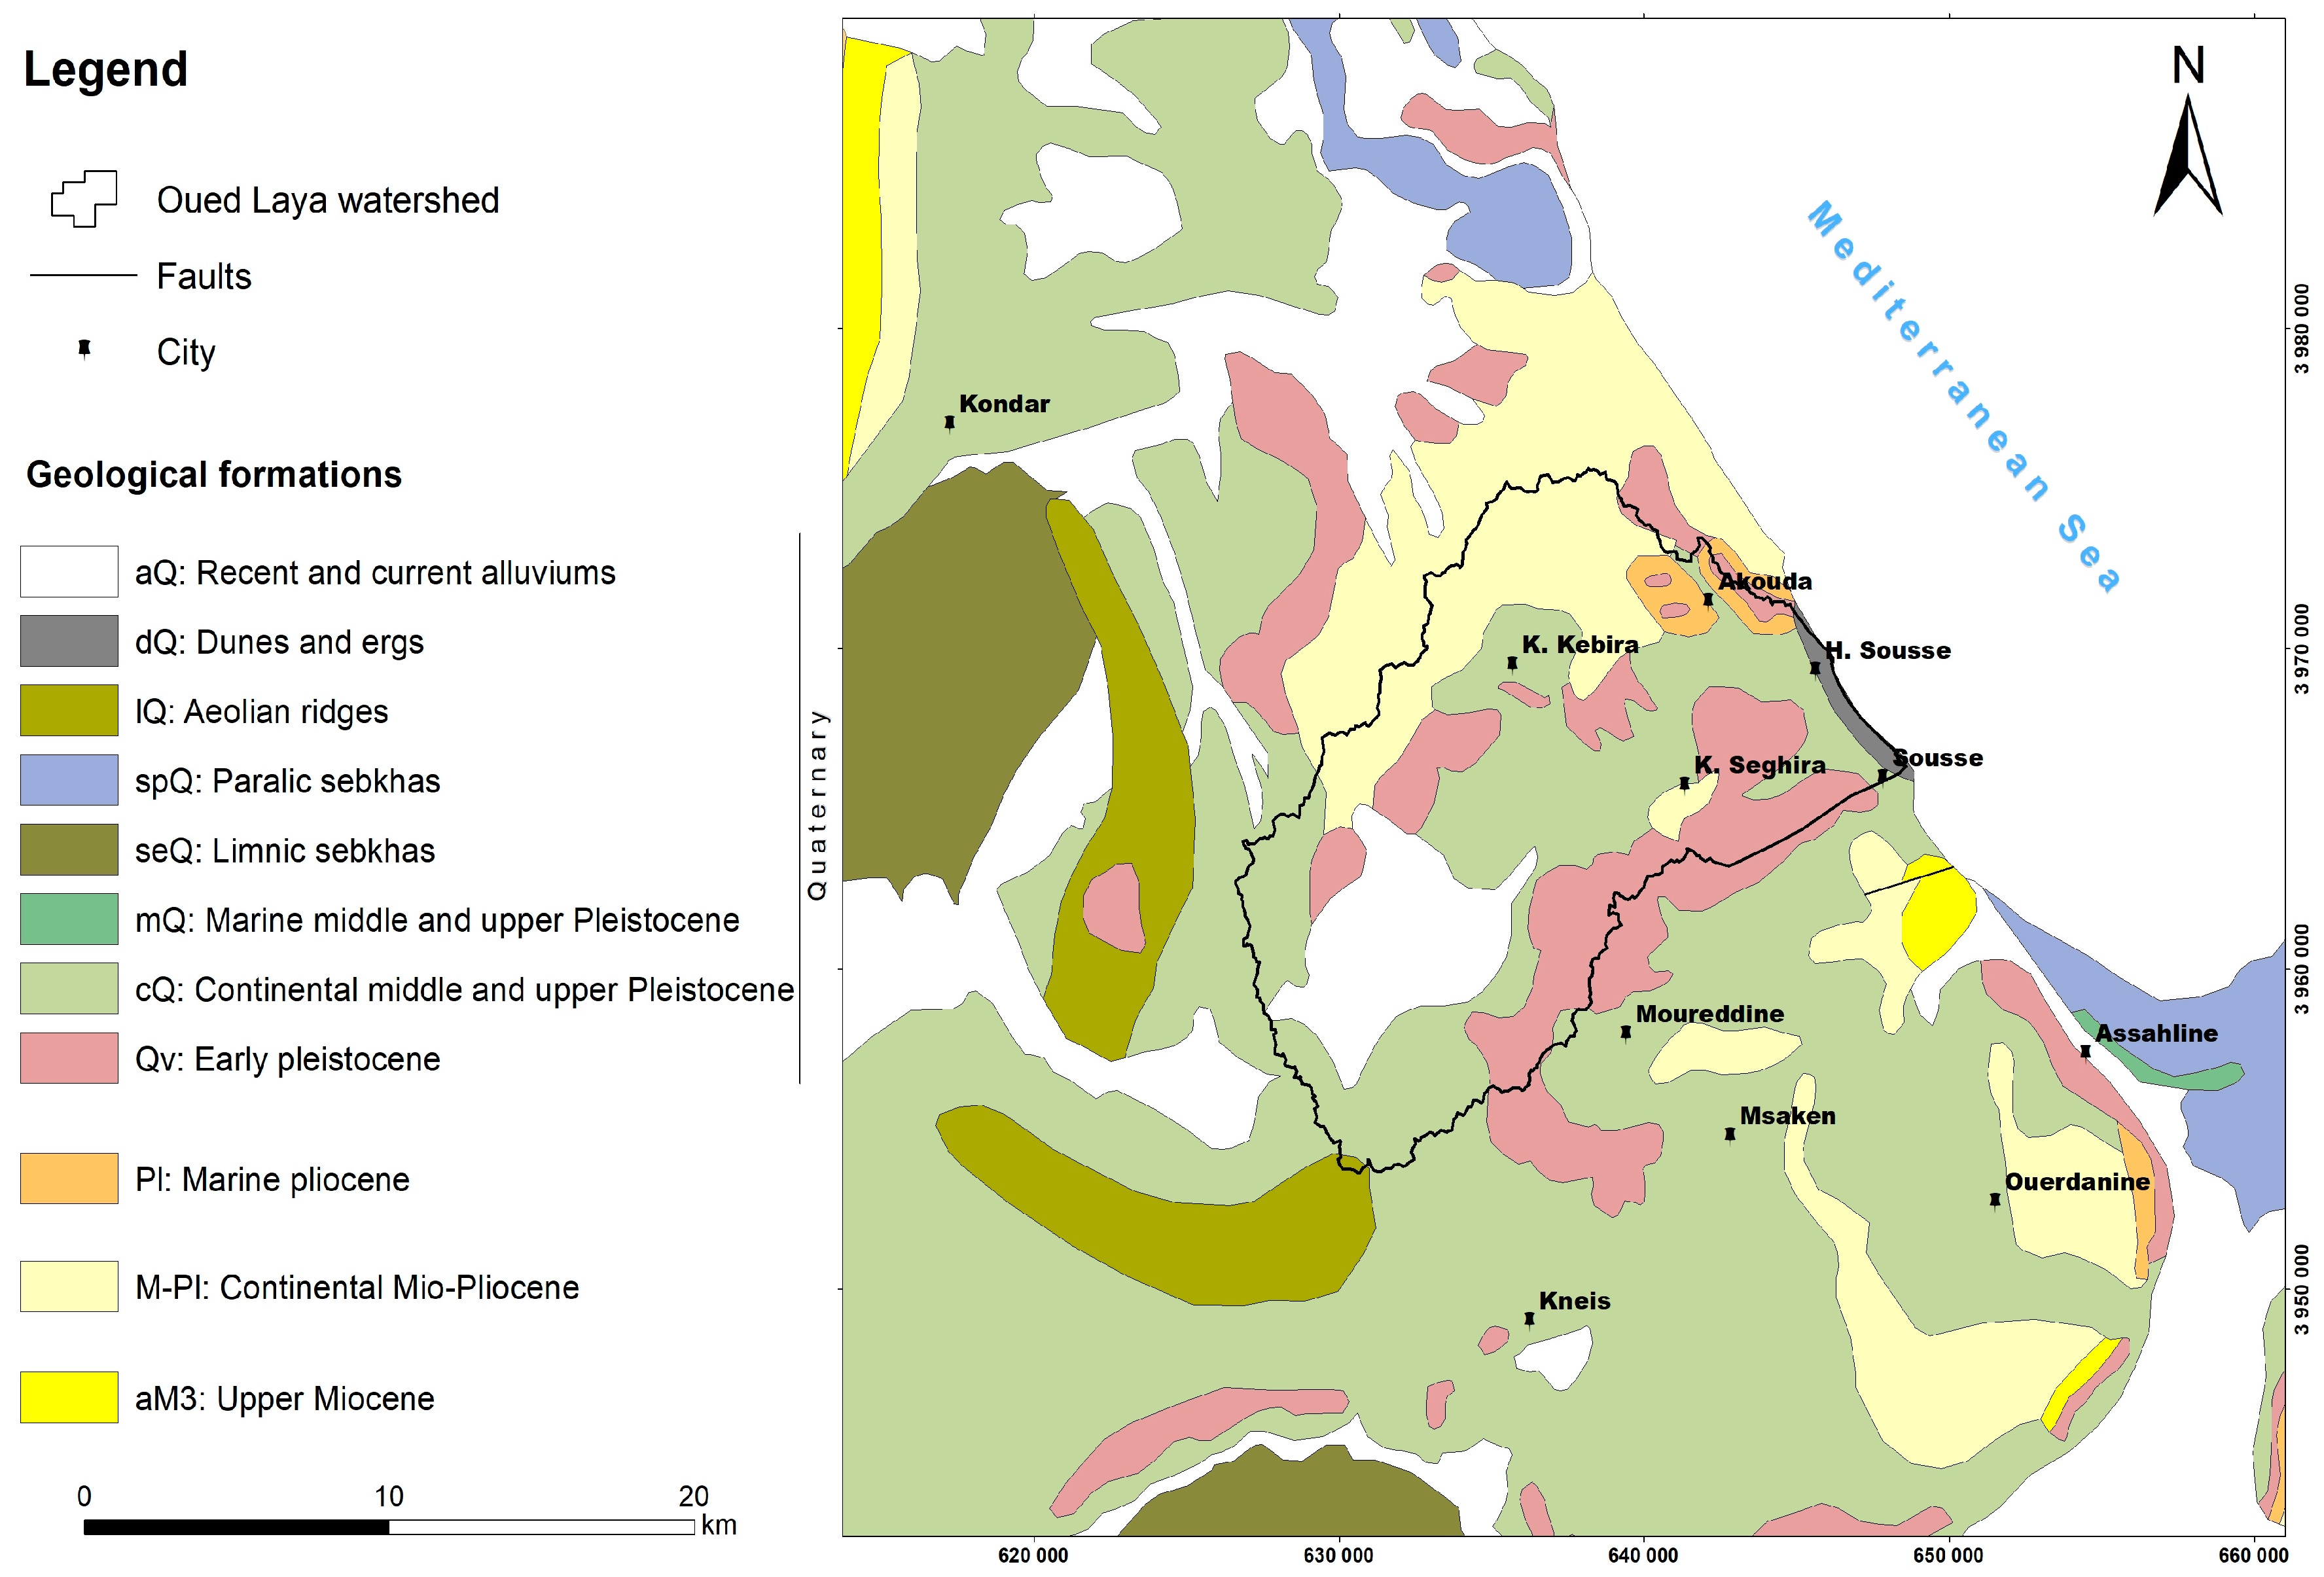
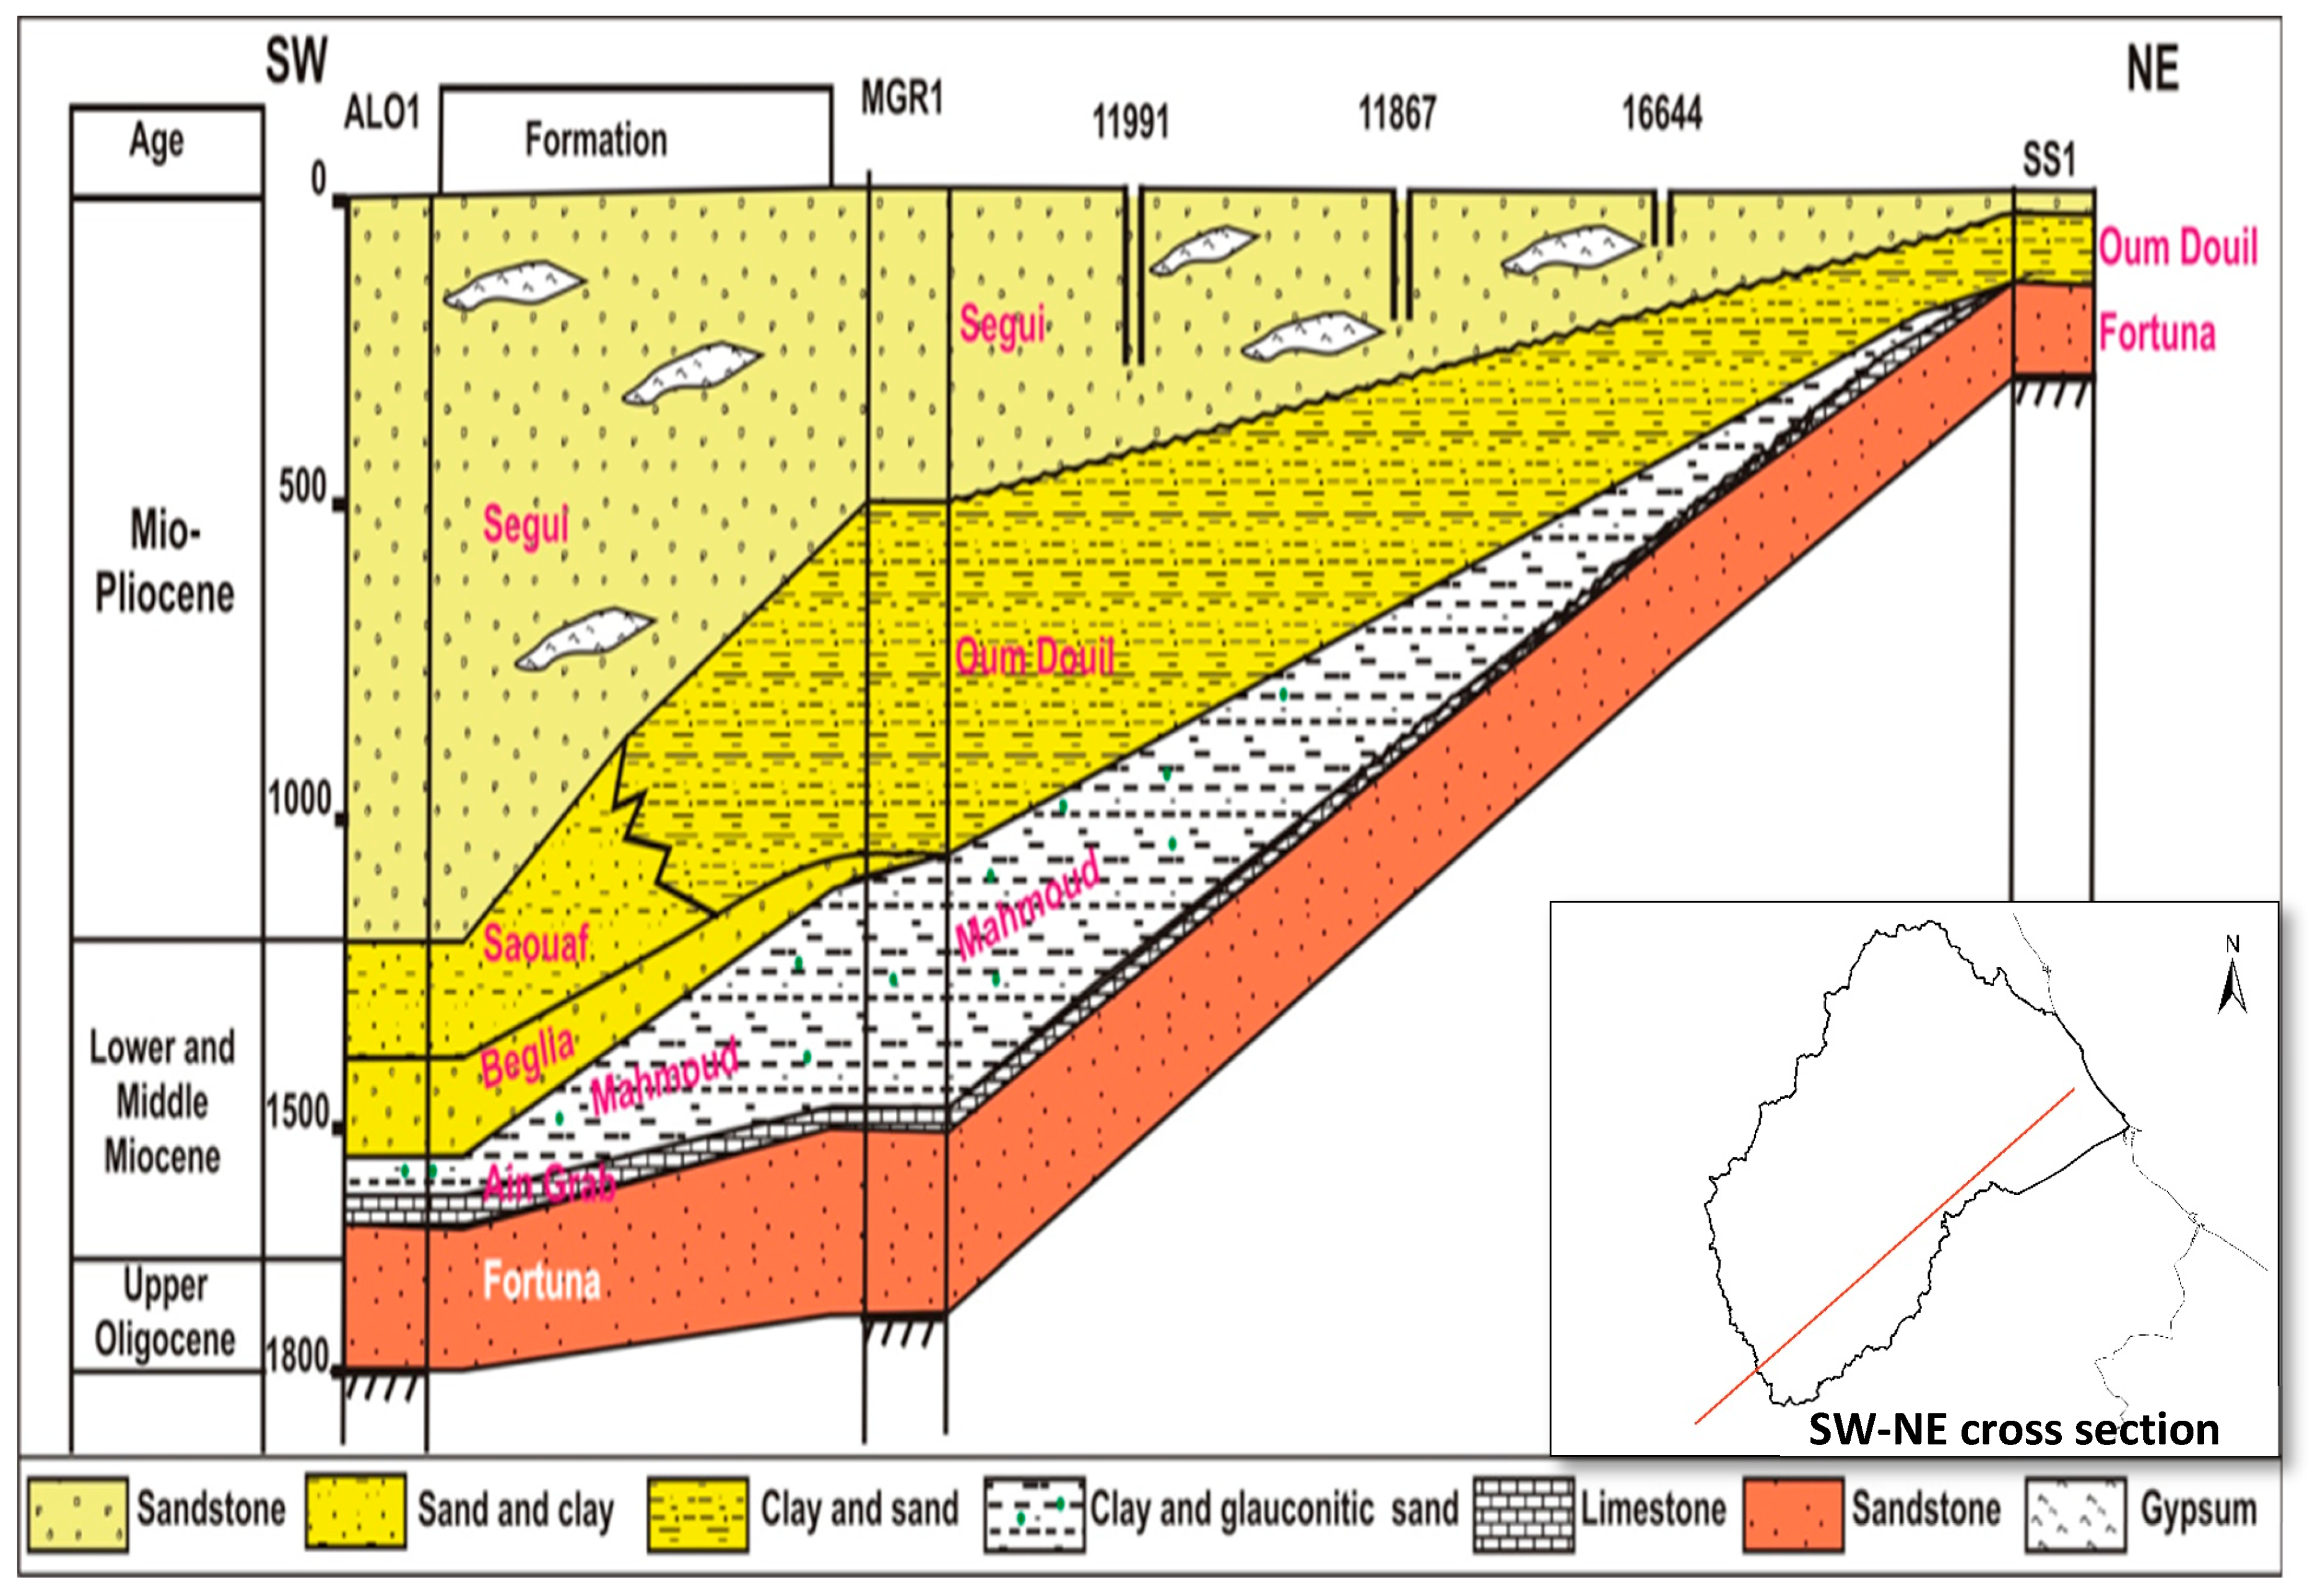
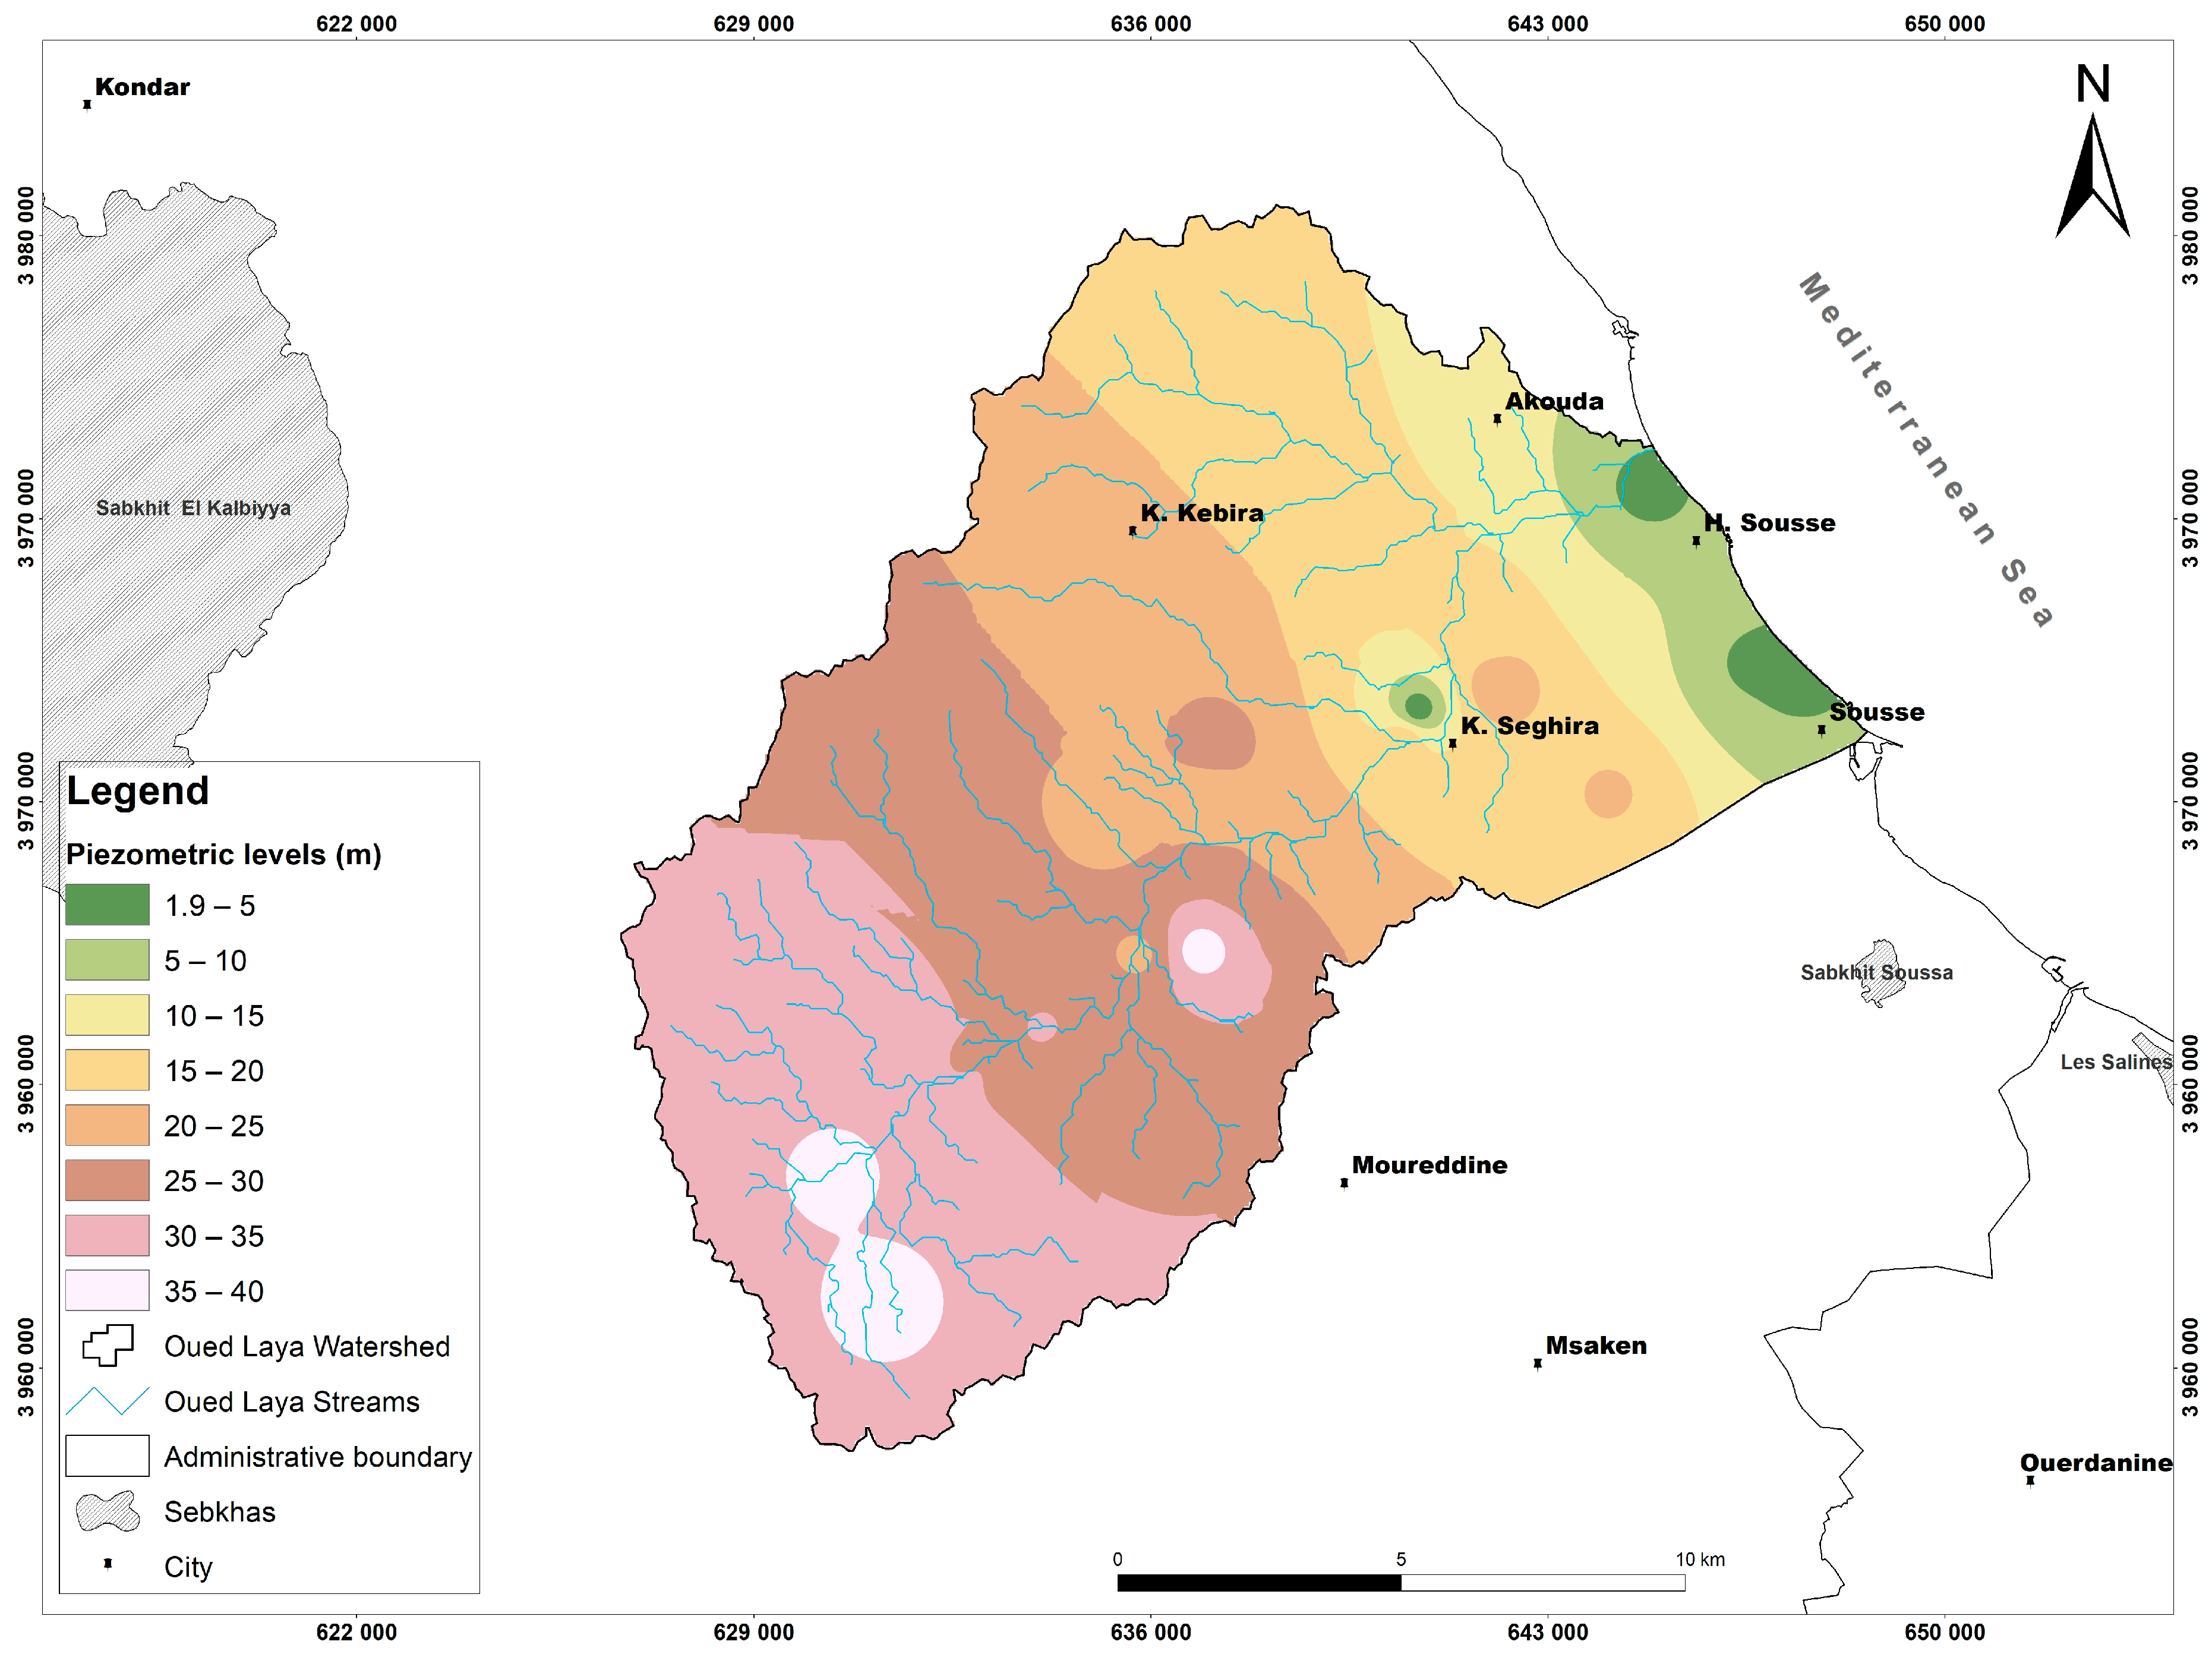
3. Geological and Hydrogeological Setting

In eastern Tunisia, the north–south axis separates the Atlasic area from the Sahel domain. [30,31]. According to the geological map, and due to the architectural characteristic of this domain sealed by Mio–Plio–Quaternary deposits, the research area looks like a weak tectonic area and is less affected on the surface (Figure 2).
The outcropping formations in the Oued Laya watershed include: the Quaternary, composed by aQ, dQ, cQ, and Qv; the Pliocene (Pl), located in the region of Akouda composed by marl and sandstone; and the Mio–Pliocene, in the Kalaa Kebira anticline formed by conglomerates, sand, and clay.
However, there is significant geologic complexity in the subsurface linked to Triassic halokinesis along a major fault system and severe volcanic activity from about the Aptian to Late Cretaceous [30].
Along with all the significant geodynamic events of the Atlas Mountains, almost 8000 m of post-Permian deposits have been recorded in the basin, indicating a weak tectonic region sinking since the Jurassic. The El Hdadja fault and the Kairouan–Sousse fault serve as basin boundaries To the north and south, respectively [30].
The research area’s geological formations range from the Cretaceous to the Quaternary [32,33,34].
The aquifer system of Oued Laya is composed by a shallow aquifer with Mio–Pliocene sandstone deposits in the Segui formation, which has a thickness varying between 10 and 40 m, and a sandy confined aquifer located in the Oum Douil formation, which has a thickness varying from 90 to 250 m [5].
A layer of clay about 30 to 40 m thick that is sufficiently continuous and impermeable to provide a hydraulic head for the deep aquifer separates the Miocene aquifer from the Mio–Pliocene aquifer (Figure 3). This aquifer is located between two anticlines of Kalaa Kebira to the north and that of Moureddine to the south. The density of the wells is variable. It is very strong in areas near Oued Laya, Oued el Kharroub, and Oued El Kebir where the water is of fairly good quality.
According the results of pumping tests performed in boreholes, the transmissivity of the aquifer varies from 3 × 10⁻⁶ m2/s to 1.8 × 10⁻⁴ m2/s [32].
The shallow aquifer is recharged by rain and runoff. The Mediterranean Sea constitutes its natural outlets as shown in the piezometric map (Figure 4). In the Miocene deep aquifer, water also flows from SW to NE. The shallow groundwater near the coastline has a higher salinity. Previous hydrogeological studies [5,32,33,34,35] indicate that there is no hydraulic connection between the shallow unconfined and the confined aquifer.

4. Material and Methods

The geographical position and the groundwater table below ground level were recorded at 37 sampling points in the study area (Figure 1). The pH and electric conductivity were measured at each sample location with a WTW multi-Parameter field meter (Accuracy ±1% of reading or ±1 µS/cm whichever is greater) which was calibrated in the laboratory with 3 standard solutions (84 µS/cm, 1413 µS/cm and 12.88 mS/cm).
Field campaigns were carried out between 2009 and 2013 (Table 1) and the groundwater sampling procedures followed those recommended by the Isotope Hydrology Section of the International Atomic Energy Agency (IAEA) [36].
The chemical composition of the groundwater does not fluctuate remarkably during the different seasons (dry/wet). Samples were collected in order to measure major elements and stable and radioactive isotopes (δ2H, δ18O, δ13C, δ37Cl, 3H and 14C) (Table 1).
The water samples taken from the shallow aquifer (boreholes and dug wells) (Table 1) were directly collected, while samples from deep wells (water points 4, 7, 8, 12, 14, 34 and 35, Table 1) were collected after purging the boreholes.
Chemical analyses of the water samples were performed at the Isotope Hydrology and Geochemistry Unit at the Centre National des Sciences et Technologies Nucléaires, Tunis, Tunisia (CNSTN). Ca, Mg, Na, and K (the major cations) were determined from filtered samples by atomic absorption spectrometry, and Cl, SO4, and NO3 (the major anions) were determined in filtered samples by ion chromatography on a Dionex DX 120 equipped with AG14 and AS14 Ion Pac columns and an AS-40 auto-sampler. In most samples the electric charge balance between major anions and major cations is better than ±5%.
δ18O and δ2H of the filtered water samples were measured at the Laboratoire des Sciences du Climat et de l’Environnement, Commissariat à l’Energie Atomique (LSCE), Gif sur Yvette, France. δ18O and δ2H were measured by Continuous Flow Isotope Ratio Mass Spectrometry (CF-IRMS) coupled to a gas bench. Oxygen isotope ratios were determined on CO2 gas that was formed after equilibration with CO2 with a known oxygen isotope composition for 24 h at 25 °C [37]. Hydrogen isotope ratios were determined on H2 gas that was formed after reduction of the water sample with Cr at 850 °C [38]. δ18O and δ2H were measured relative to internal water standards that were calibrated using IAEA Vienna Standard Mean Ocean Water (VSMOW). Data were normalized following [39] and are reported relative to V-SMOW. Samples were measured at least in duplicate, and the analytical precision is ±0.1‰ for δ18O and ±1‰ for δ2H. The data are reported as δ18O and δ2H, where δ = ((Rsample/Rstandard) − 1) × 1000.
Tritium ratios (3H) were determined at the C2TN—former ITN, Lisbon, Portugal. Tritium content was measured after electrolytic enrichment with liquid scintillation spectrometry using a Liquid Scintillation Counter (LSC, PACKARD Tri-Carb 2000 CA/LL) [40,41]. Tritium ratios are reported in Tritium Units (TU). One TU is defined by the isotope ratio 3H/1H = 10−18.
δ13C and 14C were measured for 23 samples. The analyses were carried out on the Total Dissolved Inorganic Carbon (TDIC) of the groundwater. This was collected in the field through precipitation of BaCO3 at a pH above 8.3. 14C was determined at the Isotope Hydrology and Geochemistry Unit of the CNSTN, Tunis, Tunisia. It was determined after synthesis of benzene from the BaCO3 and subsequent liquid scintillation spectrometry [42] using a PACKARD Tri-Carb 2750 TR/LL. 14C concentrations are expressed as percentage of modern carbon (pmC). Corrected ages of the water samples were defined following the IAEA models and are expressed in years. The δ13C values are reported in ‰ vs. V-PDB, with accuracy of ±0.1%, and were analyzed by isotope ratio mass spectrometry at the C2TN—former ITN, Lisbon, Portugal.
δ37Cl was measured to Standard Mean Oceanic Chloride (SMOC) at Utrecht University (Department of Geochemistry) according to the method that was developed by Eggenkamp [20]. δ37Cl is determined on methyl chloride (CH3Cl) gas by Isotope Ratio Mass Spectrometry (IRMS). In this case, the ratio between the masses 50 and 52 is determined. CH3Cl was produced using the following method: KNO3 was added to a water sample, as ionic strength adjustment buffer, together with citric acid and Na2HPO4 to obtain buffered low and stable pH. This high ionic strength is important to obtain small AgCl crystals and a low pH is important to avoid the formation of (black) Ag2O after the addition of silver ions (in the form of AgNO3) that will prohibit the formation of CH3Cl. The buffered solution was heated to a temperature of about 80 °C. Then, a solution of 0.2 M AgNO3 was added so that AgCl precipitated from the mixture. This AgCl suspension was filtered over a Whatman GF/F glass microfiber filter. This filter was dried at 80 °C for one night and the next day the filter was put into a glass reaction tube. Above the filter a restriction was made. Then, methyl iodide (CH3I) was added to the reaction tube. Thereafter, the tube was attached to a vacuum line. The CH3I was frozen on the filter with liquid N2 and the reaction tube was evacuated. The reaction tube was then closed at the restriction resulting in an ampoule that only contains CH3I and AgCl. The ampoule was placed, for two days, in an oven at 80 °C. After this time, all AgCl will have been reacted to CH3Cl. Then, the ampoule was put into a break seal connected to a gas chromatograph. With the use of a helium flow, the CH3Cl was separated from the remaining CH3I over a Porapak-Q 80–100 mesh-packed column. Pure CH3Cl was then collected in a gas tube and its Cl isotope ratio was measured on a VG ISOGAS SIRA 24 stable isotope ratio mass spectrometer. The chlorine isotope ratio is reported versus a sample of ocean water that was taken near Madeira (Portugal). The chlorine isotope composition of this ocean water sample was proven to be equal to the chlorine isotope composition of average ocean water and for that reason it could be taken as representative for Standard Mean Oceanic Chloride (SMOC) [43]. The precision (2σ) of chlorine isotope measurements was ±0.1‰.

5. Results and Discussion
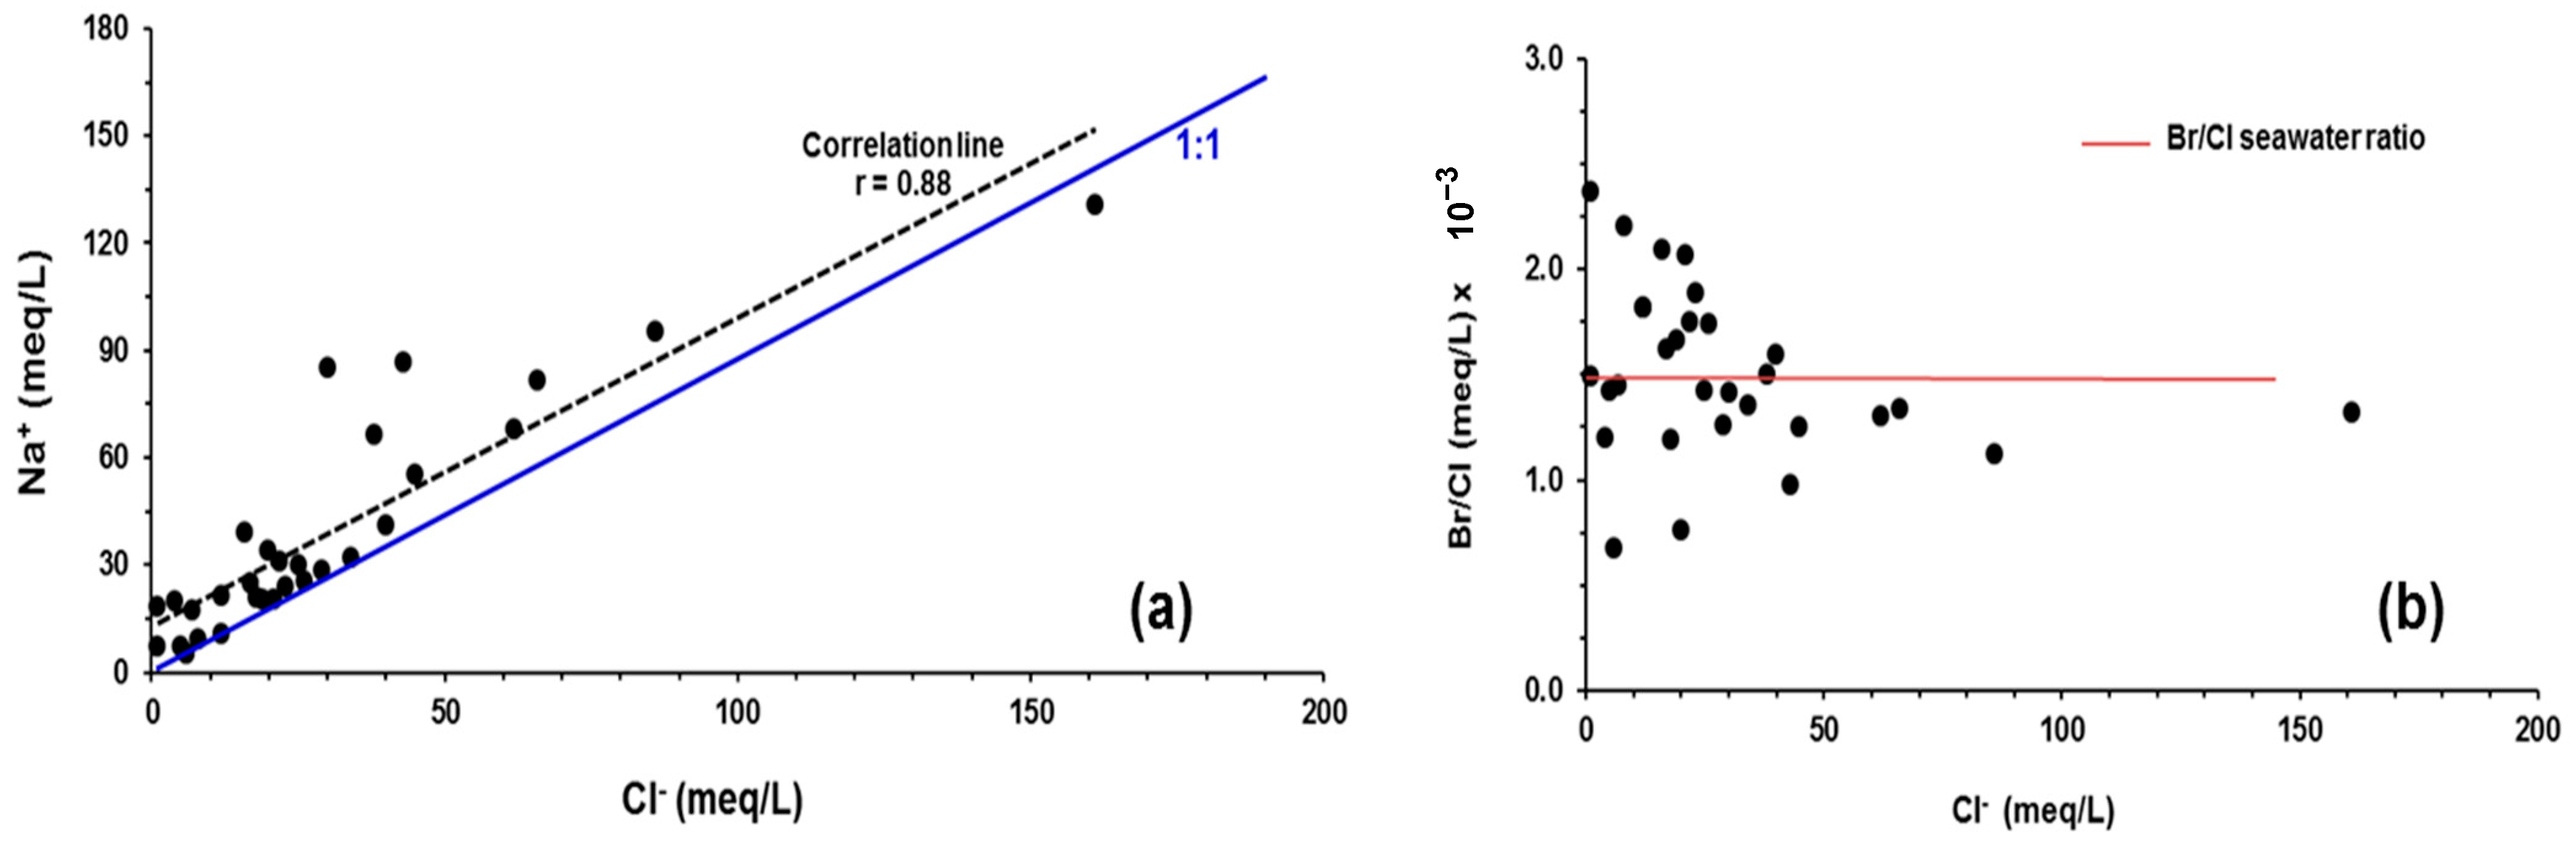
Between 2009 and 2013, fieldwork campaigns were undertaken at 37 sampling sites (including boreholes and dug wells), in order to improve knowledge on the (i) source of groundwater salinity, (ii) hydrodynamics, and (iii) flow patterns. The shallow groundwater (surficial aquifer) is characterized by a dry residue mean value of 4420 mg/L. In this shallow unconfined aquifer system, the electrical conductivity (EC) data were measured during the sampling campaign. They show high values increasing from (1.38 mS/cm) to (12.7 mS/cm). The highest EC values are ascribed to sampling sites located near the central part of the study region, whereas the lower EC values are mostly found away from the central axis that follows the Oued (Figure 5). On the other hand, in the deeper (confined) aquifer systems groundwater mineralization rises, achieving salinity values that make such groundwaters unsuitable for drinking, agriculture, or industrial uses (average EC values varying from 7.7 to 9.2 mS/cm).
The presentation of geochemical data in the form of graphical charts such as a Piper diagram [44] is helpful for recognizing and differentiating various water facies. The major ions of the water analyses are depicted in the Piper diagram (Figure 6). The chemical composition of groundwater plotted in a Piper trilinear equivalence diagram (Figure 6) shows a trend of water classified under a Na Cl SO4 Ca water type.

5.1. Na+/Cl Correlation

In coastal areas, a strong correlation between Na-Cl content in groundwater systems is often observed, which can be due to first air masses condensation (water vapor), sometimes associated with the dissolution of marine aerosols deposited in the soil in coastal regions during recharge [45], or when seawater intrusion mechanisms occur.
In the Mio–Pliocene groundwater samples, a similar positive relation was found, i.e., the correlation coefficient Na/Cl was equal to 0.88 (n = 37). However, when the molar ratio between these two ions was calculated for the sampled water, the value obtained was almost 1, pointing to halite dissolution as the main source of Mio–Pliocene groundwater mineralization (Figure 7a). Assuming, by hypothesis, that seawater intrusion mechanism is the main process responsible for the salt content in the Mio–Pliocene fresh waters, the Na-Cl molar ratio should be smaller or equal to the 0.86 value of Mediterranean water composition [11].
Considering that both hypotheses can occur in the research region, i.e., seawater intrusion and salts dissolution, the excess of sodium concentration must also be explained. In fact, the excess of Na is observed in some water samples, either with high or low mineralization, which can be ascribed to cation exchange mechanisms [26,46,47], often found in sedimentary basins, during seawater mixing processes, and also in deltaic regions with high amount of organic matter and clay minerals.

5.2. Br/Cl Relationship

Likewise, the Br/Cl ratio allows us to obtain unique information to identify possible seawater mixing processes within coastal aquifers, where the main origin of salts in the groundwater (seawater intrusion vs. evaporate dissolution) is unknown or doubtful. Due to the long residence time of the ocean water masses, combined with a relative stable Br-Cl ratio around 1.5 × 10⁻³ [10], such a ratio can also be applied as a criterion in the characterization of the main origin of salt in groundwater systems. In our research area, the Br/Cl ratio of the sampled groundwater was plotted versus the Cl content (Figure 7b). Apart of a small group of samples, the graphic distribution does not point to a clear origin of the salts. This dispersion is most probably ascribed to the mixture of fresh water and seawater and/or to the dissolution of marine aerosols dissolved by precipitation during aquifer recharge.
Nonetheless, it is important to mention that most of the points plotted far from the Br/Cl seawater ratio line are away from the coastline and off of the most probable seawater intrusion area.

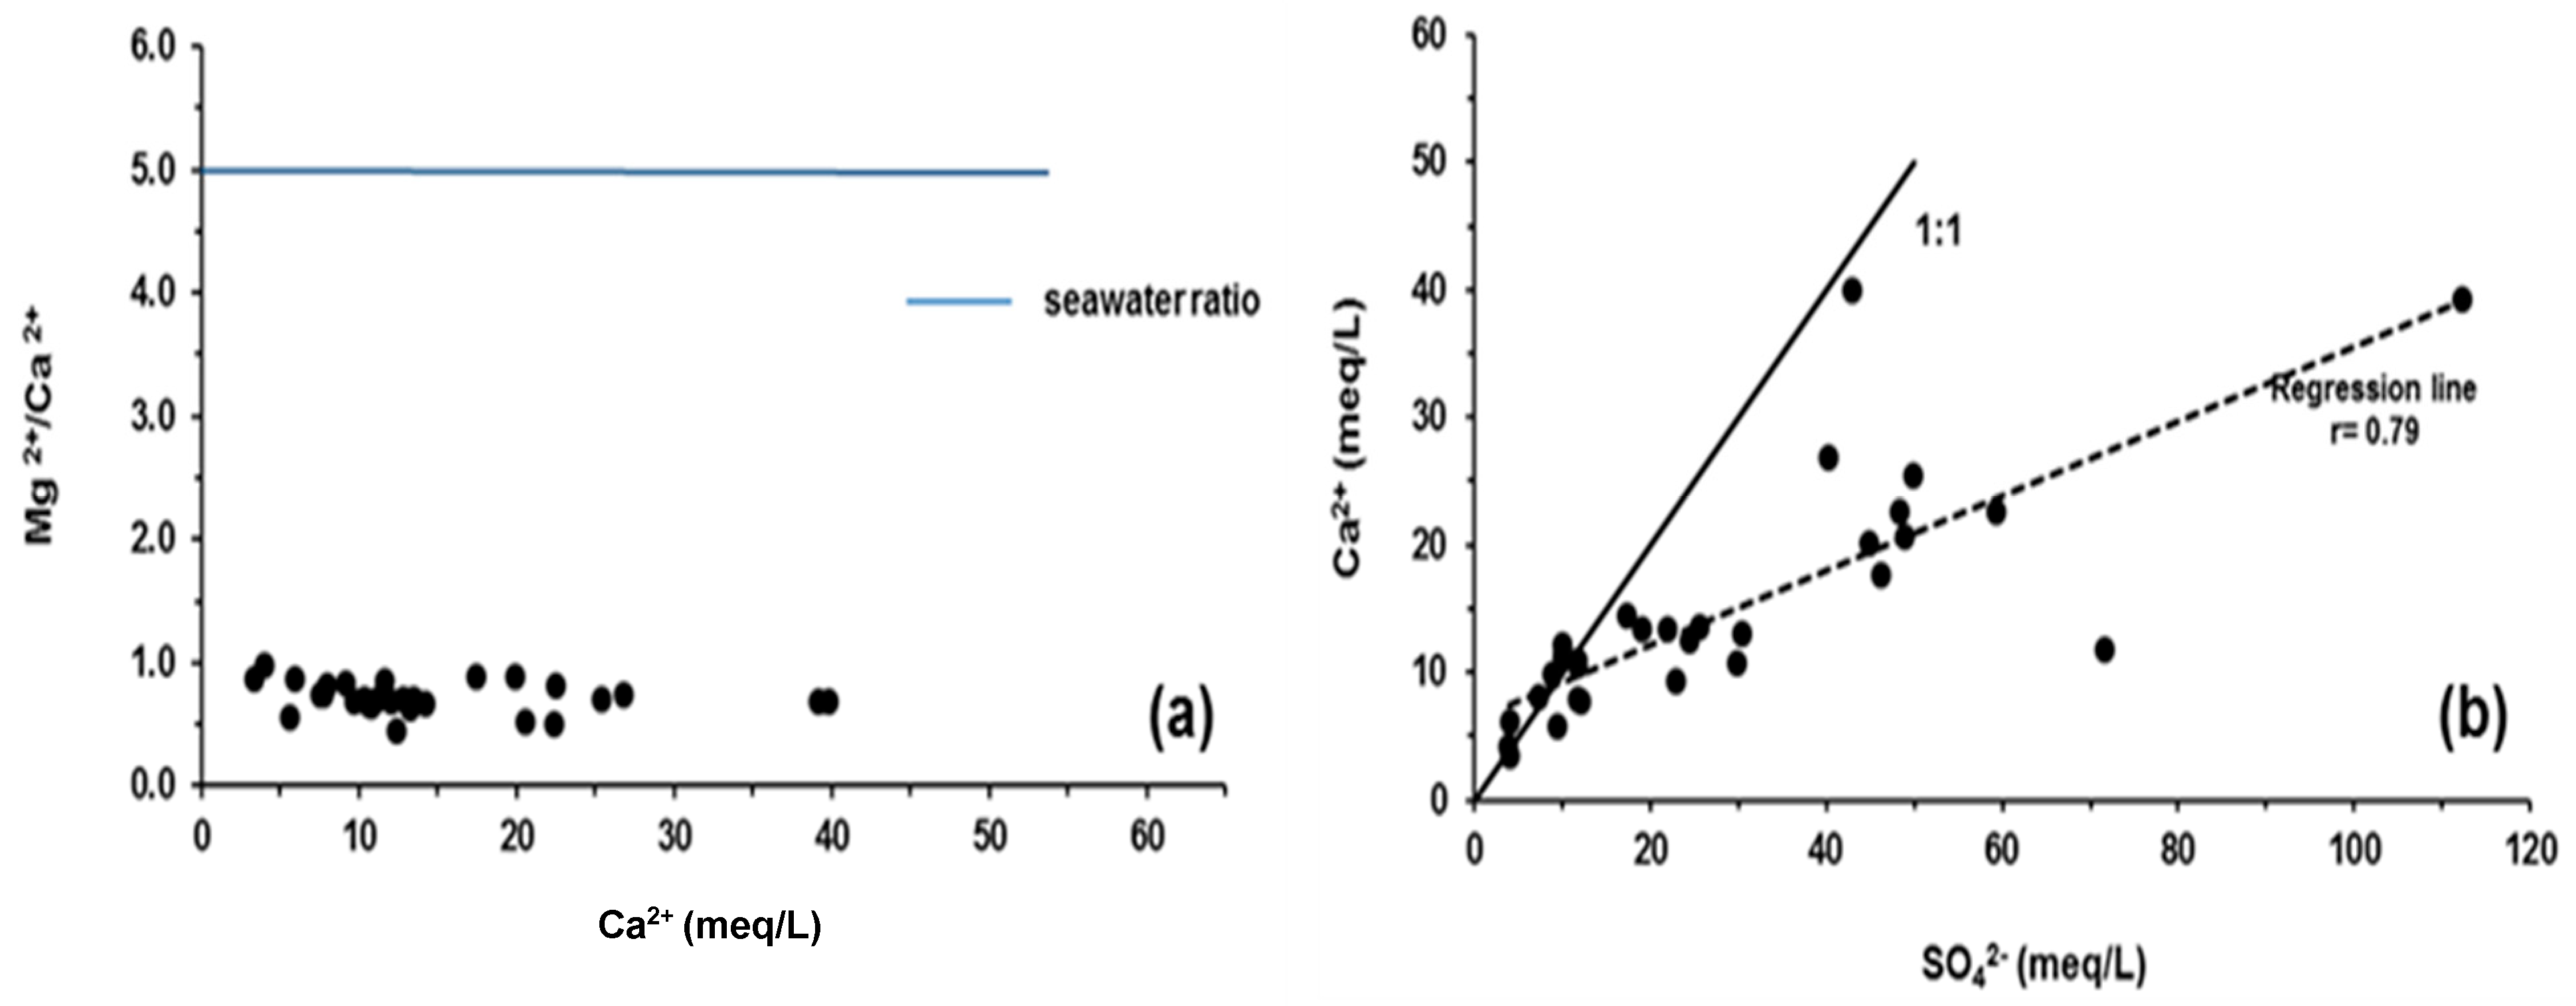
5.3. Ca2+/Mg2+ Relationship

The concentration of Ca2+ and Mg2+ in the shallow groundwaters varies widely, although in most situations, Ca2+ predominates over Mg2+ (Figure 8a). Groundwater samples with a Ca/Mg ratio greater than 1 may not have been mixed with saltwater (marine ratio = 0.2) [6], and mineralization from another source of Ca should be considered. Dispersed layers of gypsum exist in the subsurface geology of the reference area and these can be regarded as a possible “external” calcium supply for the aquifer. The Ca–Mg correlation observed in the groundwater samples reflects gypsum dissolution and indicates that the gypsum layers are a likely source of calcium for the system. Nevertheless, ion exchange within the aquifer system is also a possible mechanism in this system since it can explain the increase in sodium (Na/Ca = 2) in addition to the decrease in calcium in the groundwater content, as calcium may be exchanged on clay surfaces with sodium.

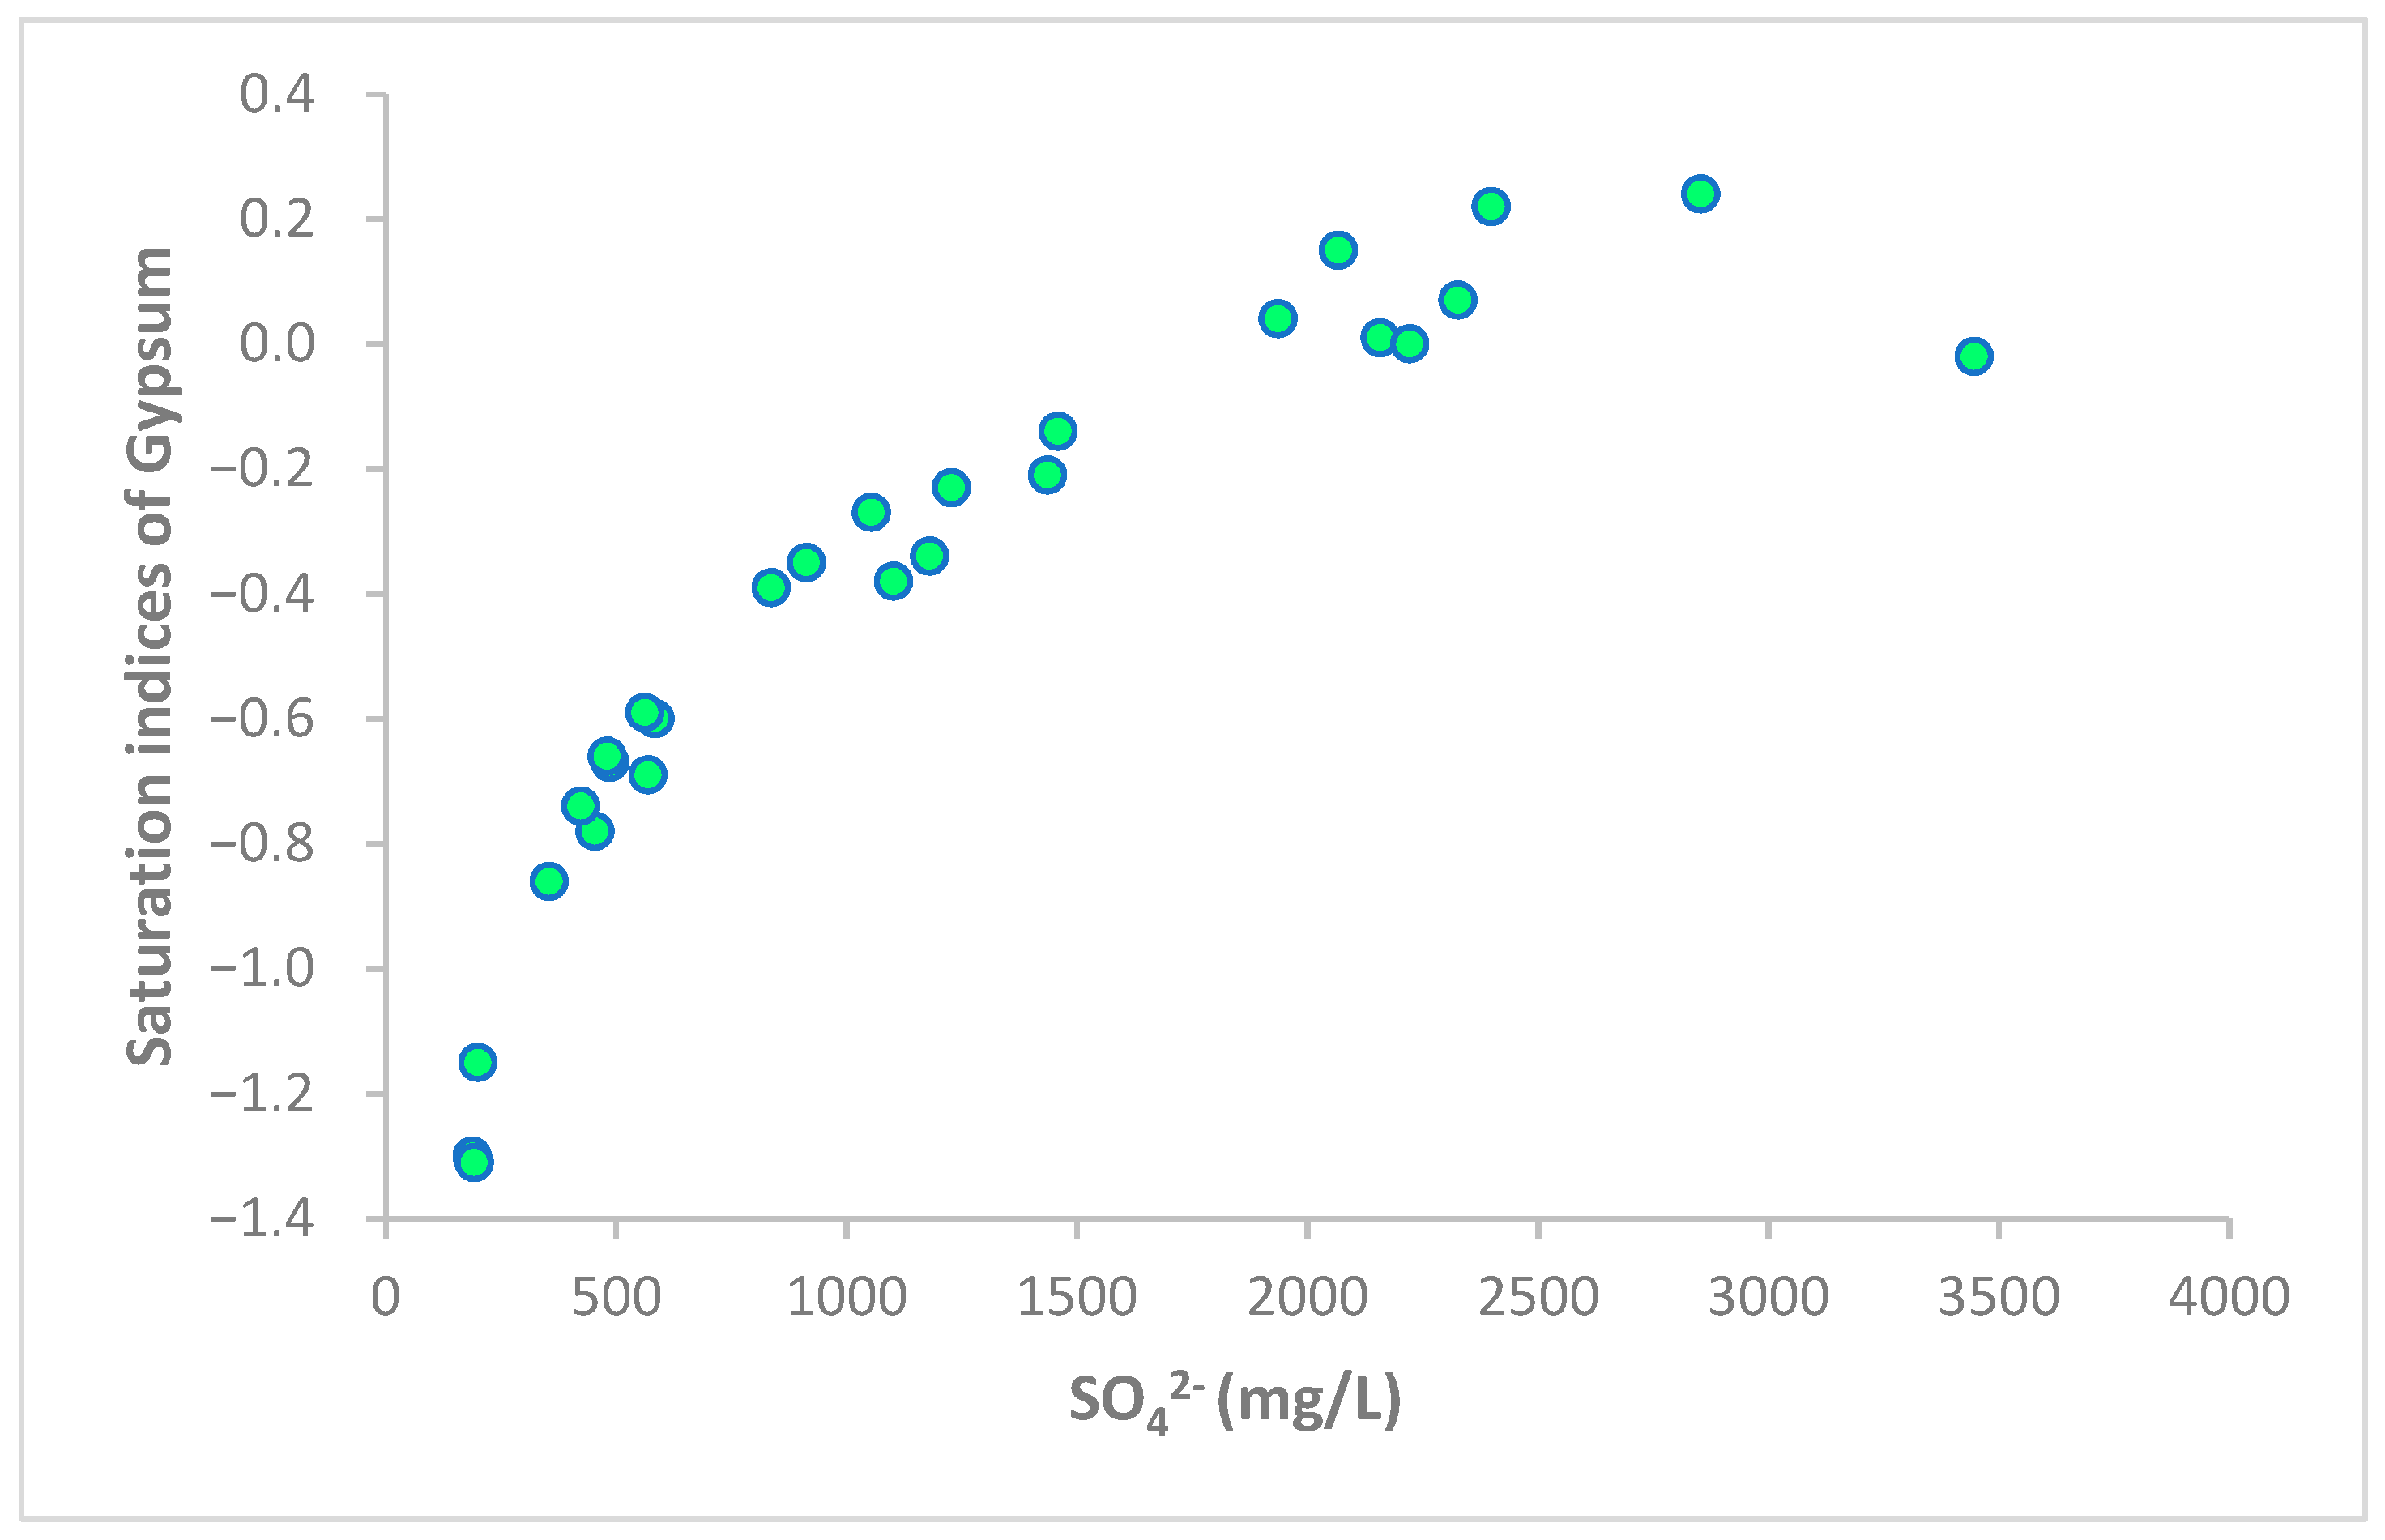
5.4. Ca2+/SO42− Relationship

In line with the previous hypothesis, the reduction in Ca2+ concentrations in comparison to SO42− in the more sulphate-rich sampled shallow groundwaters, as shown in (Figure 8b), is possibly the result of cation exchange reactions attributed to the presence of a fraction of clay and organic matter within the aquifer matrix as Na+ is released, here resulting in calcium concentration as is present here. If we consider the gypsum lenses as an additional potential Ca2+ source for groundwater mineralization, Ca2+ might be removed by Na+ exchange, but dissolved SO42− content would remain constant. Consequently, ion exchange and the dissolution of gypsum support the hypothesis of their contribution to the high salinity of groundwater.

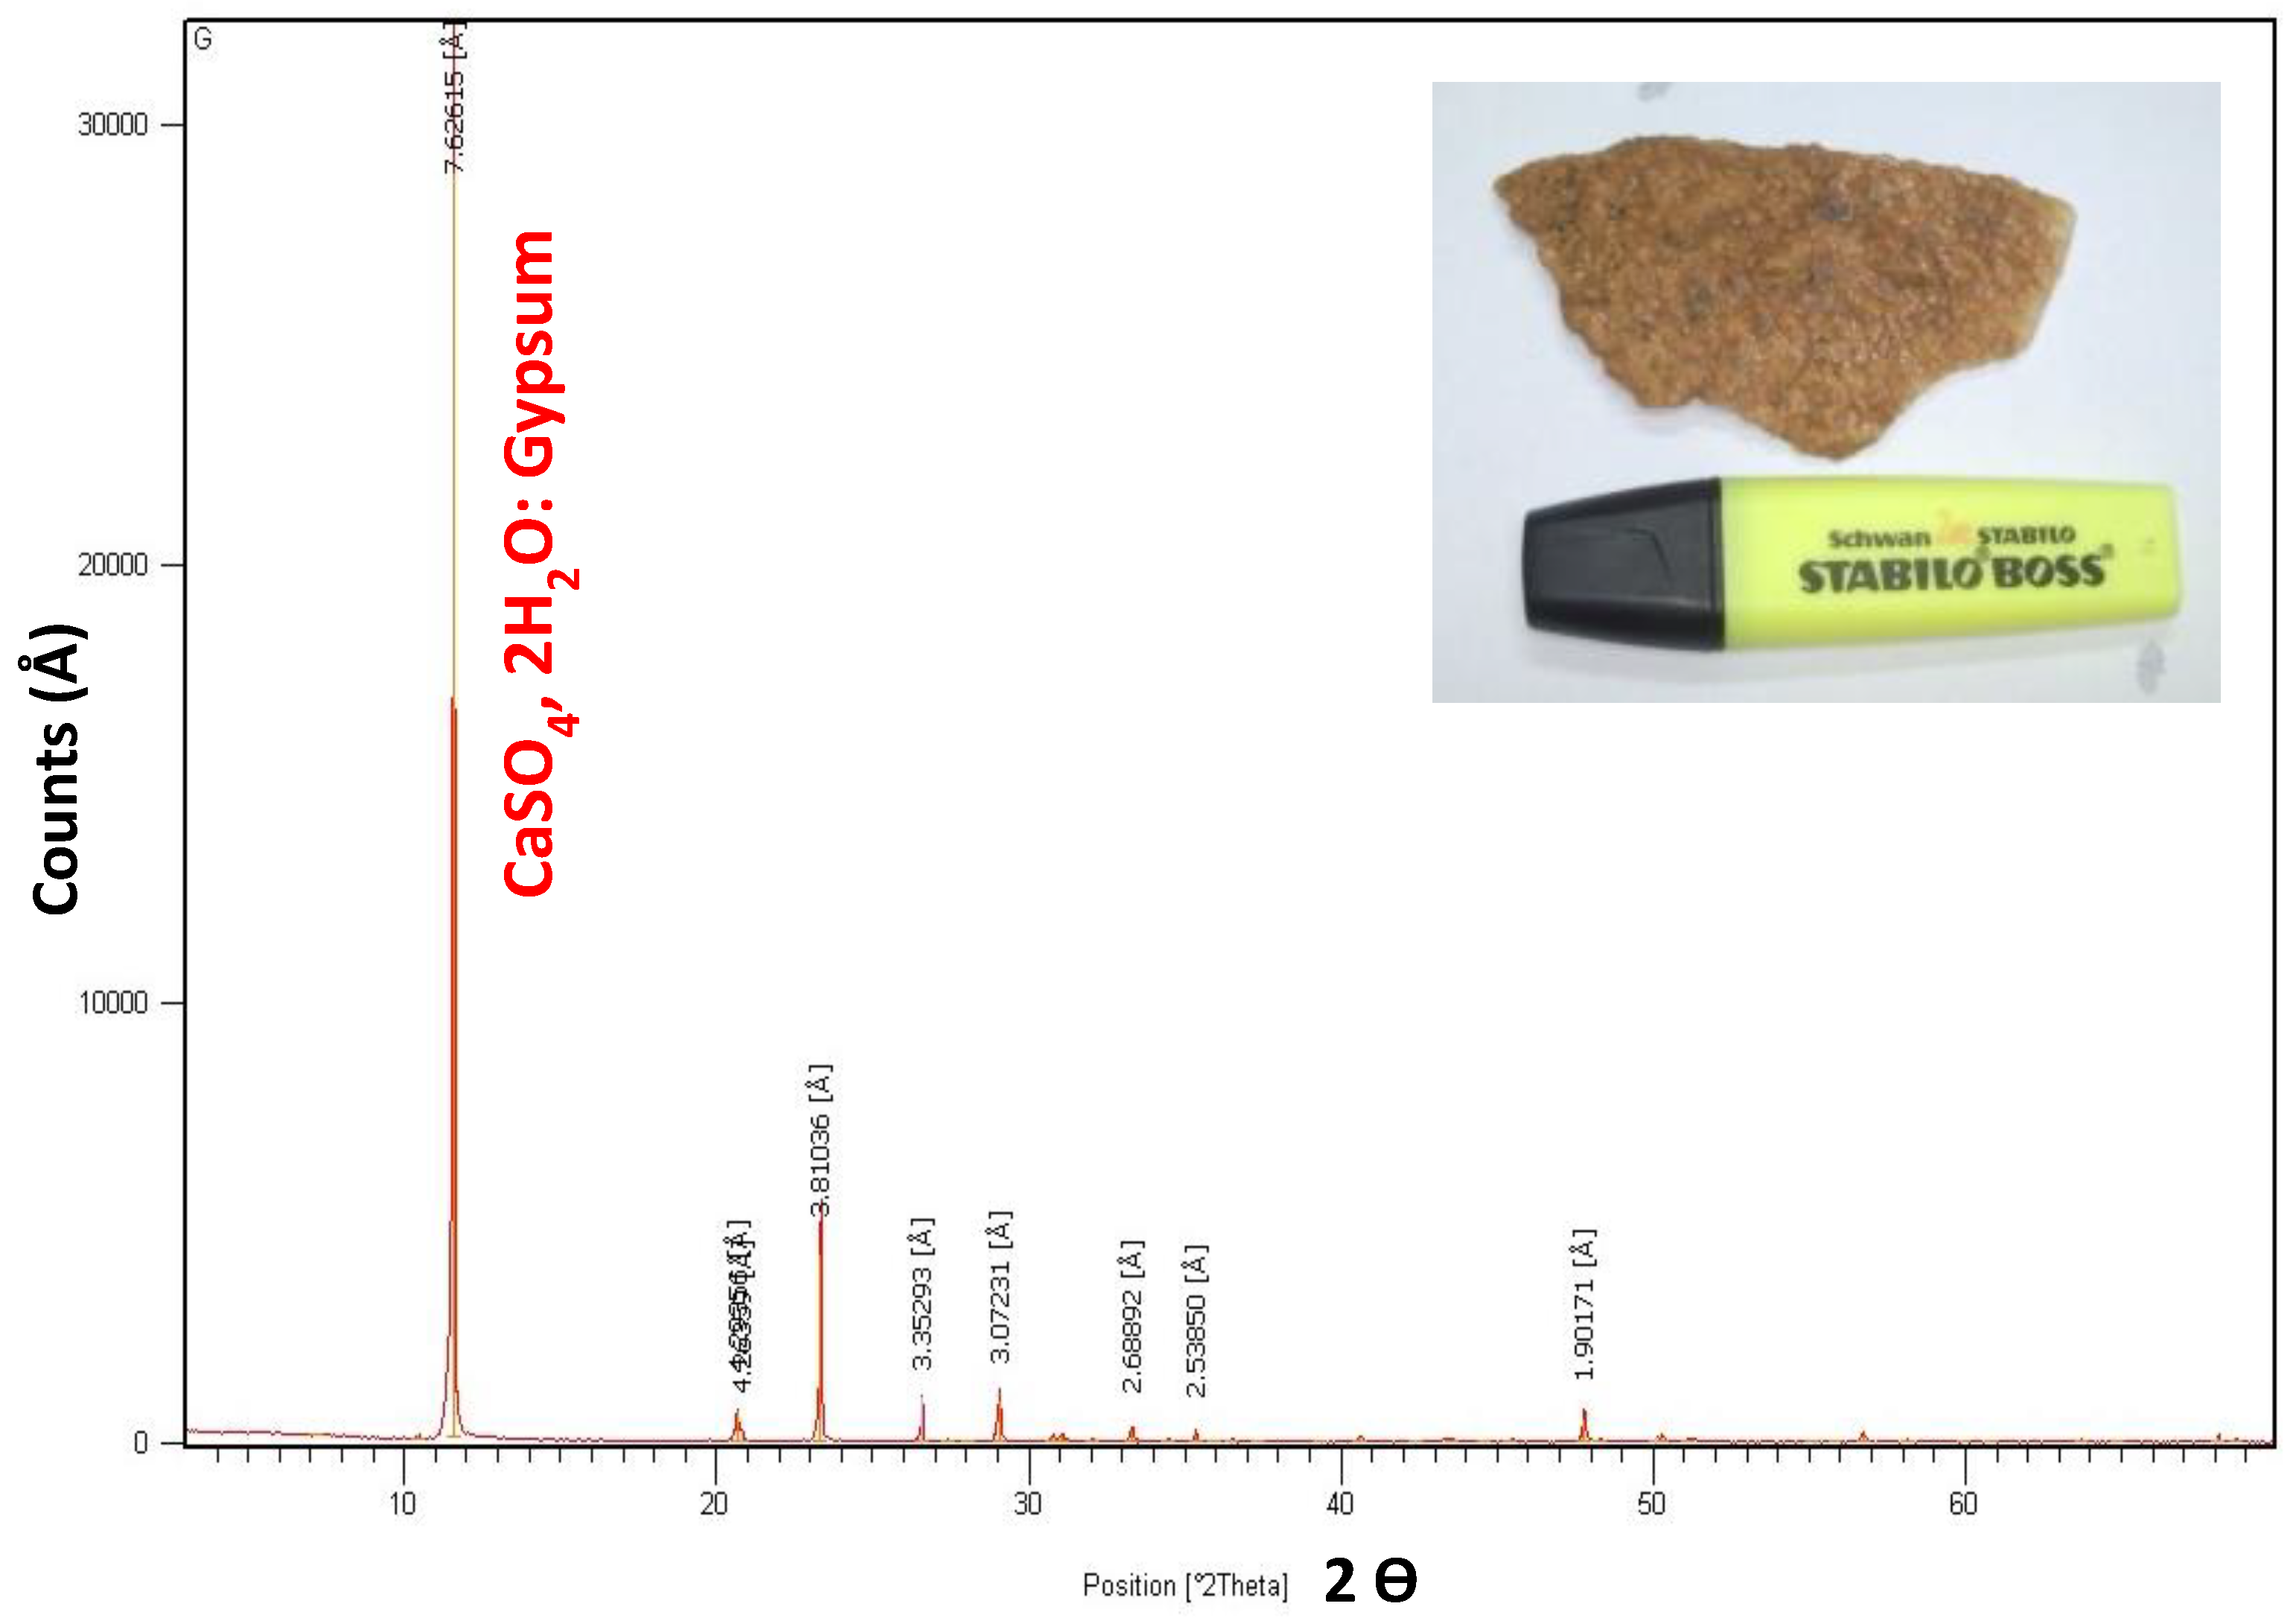
5.5. Saturation Indices (SI)

Within the studied aquifer, the processes of ion exchange, precipitation, and dissolution are all actively occurring. According to the findings, the majority of the shallow aquifer samples are unsaturated regarding gypsum and anhydrite. It is assumed that unsaturated mineral phases (SI ≤ 0.1) tend to dissolve, whereas oversaturated mineral phases (SI ≥ 0.1) have a tendency to precipitate.
The program used to calculate the saturation indices (SI) was “Diagramme” [48]. The results reveal that SO42− concentrations rise when gypsum gradually becomes saturated (Figure 9). This strong relationship appears to be connected to the geology of the research area, where we can witness dispersed gypsum deposits in the clay formations (see Figure 3 and Figure 10). The presence of organic matter suggests that it may play a crucial function in the ion exchange processes, particularly in deltaic regions [49]. Additionally, neither the groundwater flow direction nor the piezometric map of the unconfined aquifer indicates any probability of seawater intrusion (Figure 4). In some geological formations, the lithostratigraphic investigation reveals the dissolution of existent evaporates [30]. This supposition was primarily tested by geochemical data, which recommended water–rock interactions as a significant source of salinity in shallow groundwaters. This was further supported by the interpretation of the salinity map (Figure 5) and chemical diagrams that show the interactions between the major elements.

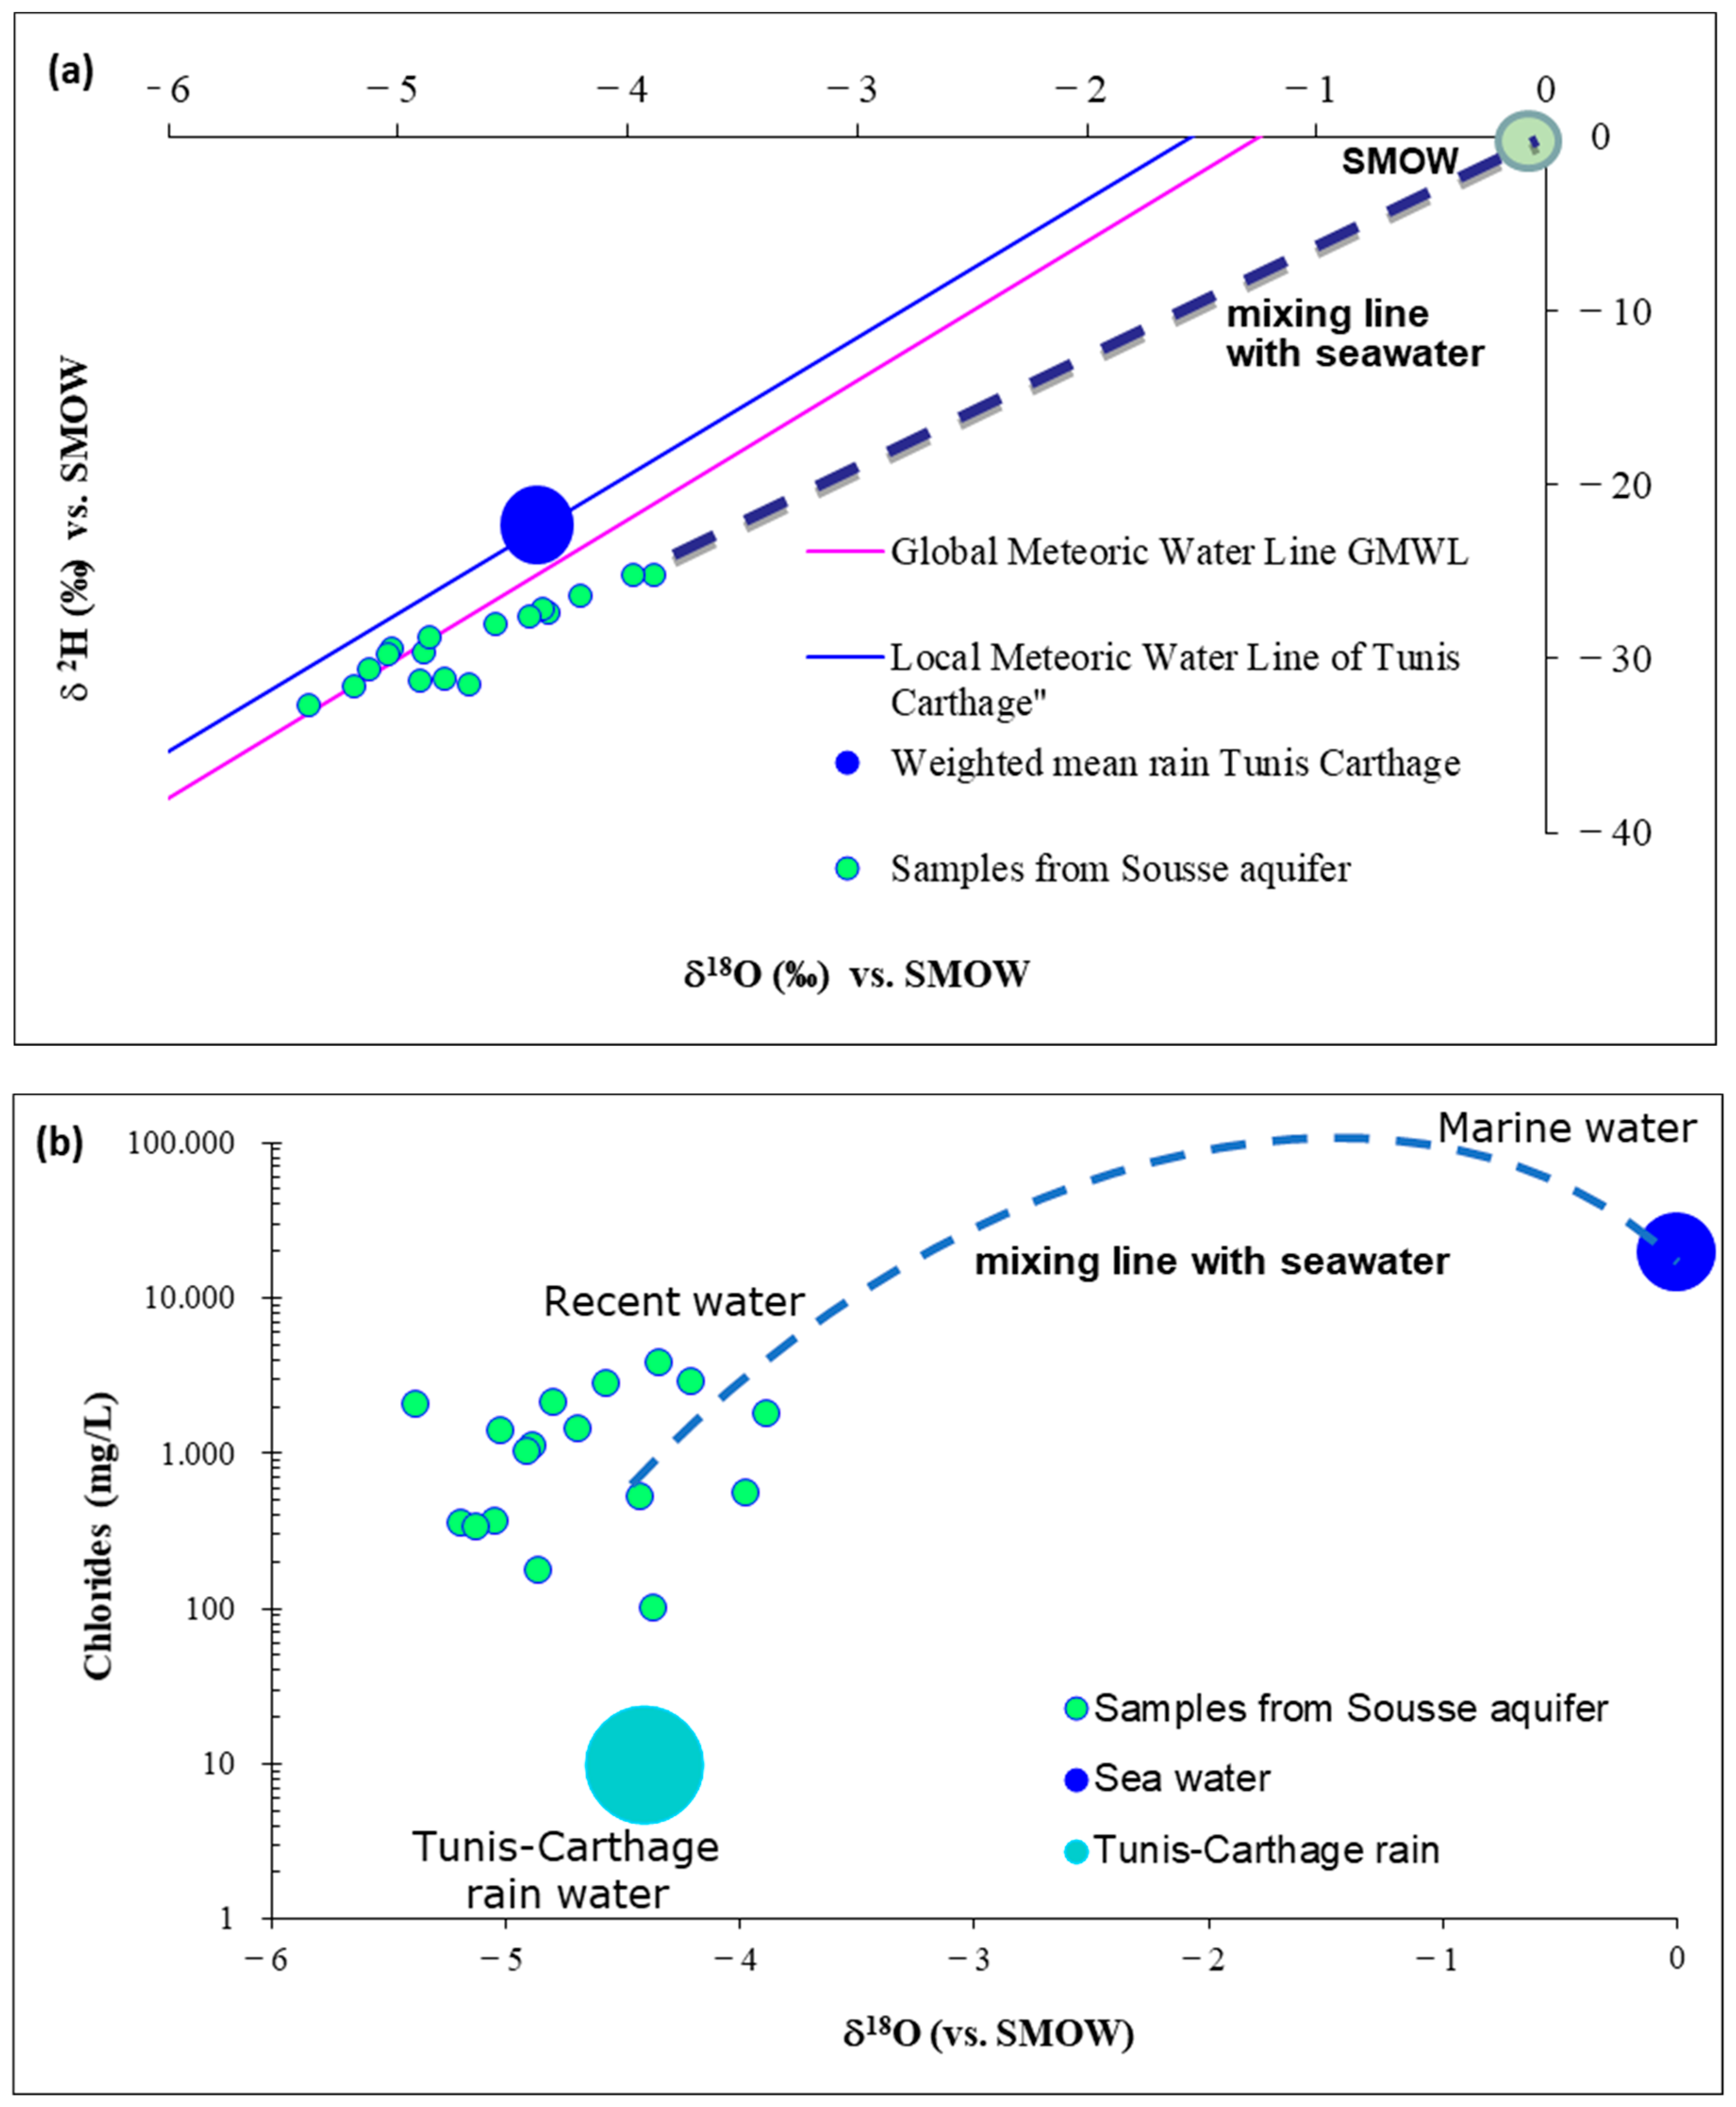
5.6. Stable Isotopes (δ2H, δ18O)

In the Sousse region, the Mio–Pliocene aquifer recharge results from precipitation infiltration or can be associated with the infiltration of water used in agriculture activities with an isotopic enrichment due to evaporation (recycled water) or by the called irrigation return flow [50]. Assuming that no isotopic fractionation occurred (e.g., evaporation) the sampled groundwaters should have an isotopic composition similar to the weighted mean isotopic composition of the regional precipitation.
The isotopic composition of groundwater (δ2H, δ18O) should remain conservative during the groundwater flow [51], and for this reason isotopes (18O and 2H) are often used as tracers in hydrogeological investigations. In coastal areas dealing with salinization issues [51,52,53], the previous assumption will be extremely important to separate seawater intrusion processes from salt dissolution mechanisms. Several hydrogeological studies performed in coastal areas have demonstrated how isotopes can give unique information regarding groundwater mixing. Several authors have mentioned and used the isotopic composition together with physico-chemical parameters [2,5,26,46,51,54,55].
In our case study, the groundwater isotopic composition was plotted in an orthogonal diagram (Figure 11a), and varied between −5.40 to −3.90‰ in oxygen-18 and from −32.7 to −25.1‰ in deuterium. In Figure 10a, three lines are also plotted, representing the Global Meteoric Water Line (G-MWL) defined by Craig (1961), the Local Meteoric Water Line (Tunis–Carthage data [56]) and the fresh water–seawater mixing line. Analyzing the groundwater sample distribution, two different isotopic evolution trends can be noticed, i.e., a group composed of the most enriched waters, towards the seawater composition, suggesting mixing between fresh and sea water. The second group is composed by the samples plotted between the G-MWL and the regional precipitation (Tunis–Carthage Meteoric Water Line), with a more depleted composition, and with concentrations rather apart from the long term weighted means [56] of Tunis–Carthage precipitation (δ18O = −4.38 ± 0.92‰ and δ2H = −25.4 ± 6.5‰). An isotopic difference of around 1‰ in oxygen-18 values (mean value) is observed between the Mio–Pliocene waters and modern regional precipitation. The isotopic gap (depletion found in the second group) is not understood and is still in need of an explanation.
Within the environmental behavior of isotopes in precipitation, the isotopic depletion can be associated with different preferential recharge altitudes or with different environmental climatic conditions as in colder periods [57,58,59,60]. Topographic and geographic changes of the studied area do not seem to have a feasible explanation for the observed depletion. Similar isotopic differences have been reported in studies carried out in Western and Central Europe and the United Kingdom, in old groundwater systems recharged during the Last Glacial Maximum (±20,000 years ago). In these areas, a depletion between the groundwater systems and modern precipitation was also noticed [57,58,61,62,63,64]. Considering these case studies, one possible hypothesis can be formulated to explain the isotopic depletion found in part of the water samples from Sousse Mio–Pliocene aquifer: these waters were infiltrated under different a climatic environment; a colder period, probably during the Last Glacial Maximum (LGM). A difference of 5 °C between LGM and nowadays corroborates the hypothesis that the isotopic depletion found in the groundwater, when compared with modern regional precipitation, was induced by different climatic condition during colder period of recharge [65]. To support the characterization/origin of the salt content in the groundwater, the δ18O values were plotted vs. the Cl content (Figure 11b). A clear trend could not be identified; the samples are dispersed, creating a group. Nevertheless, although dispersed, the hypothesis of mixing with seawater should be considered to explain the isotopic enrichment and salinization. The samples that are low in mineralization and isotopically enriched can be due to evaporation during the sampling or even water evaporation within the borehole.

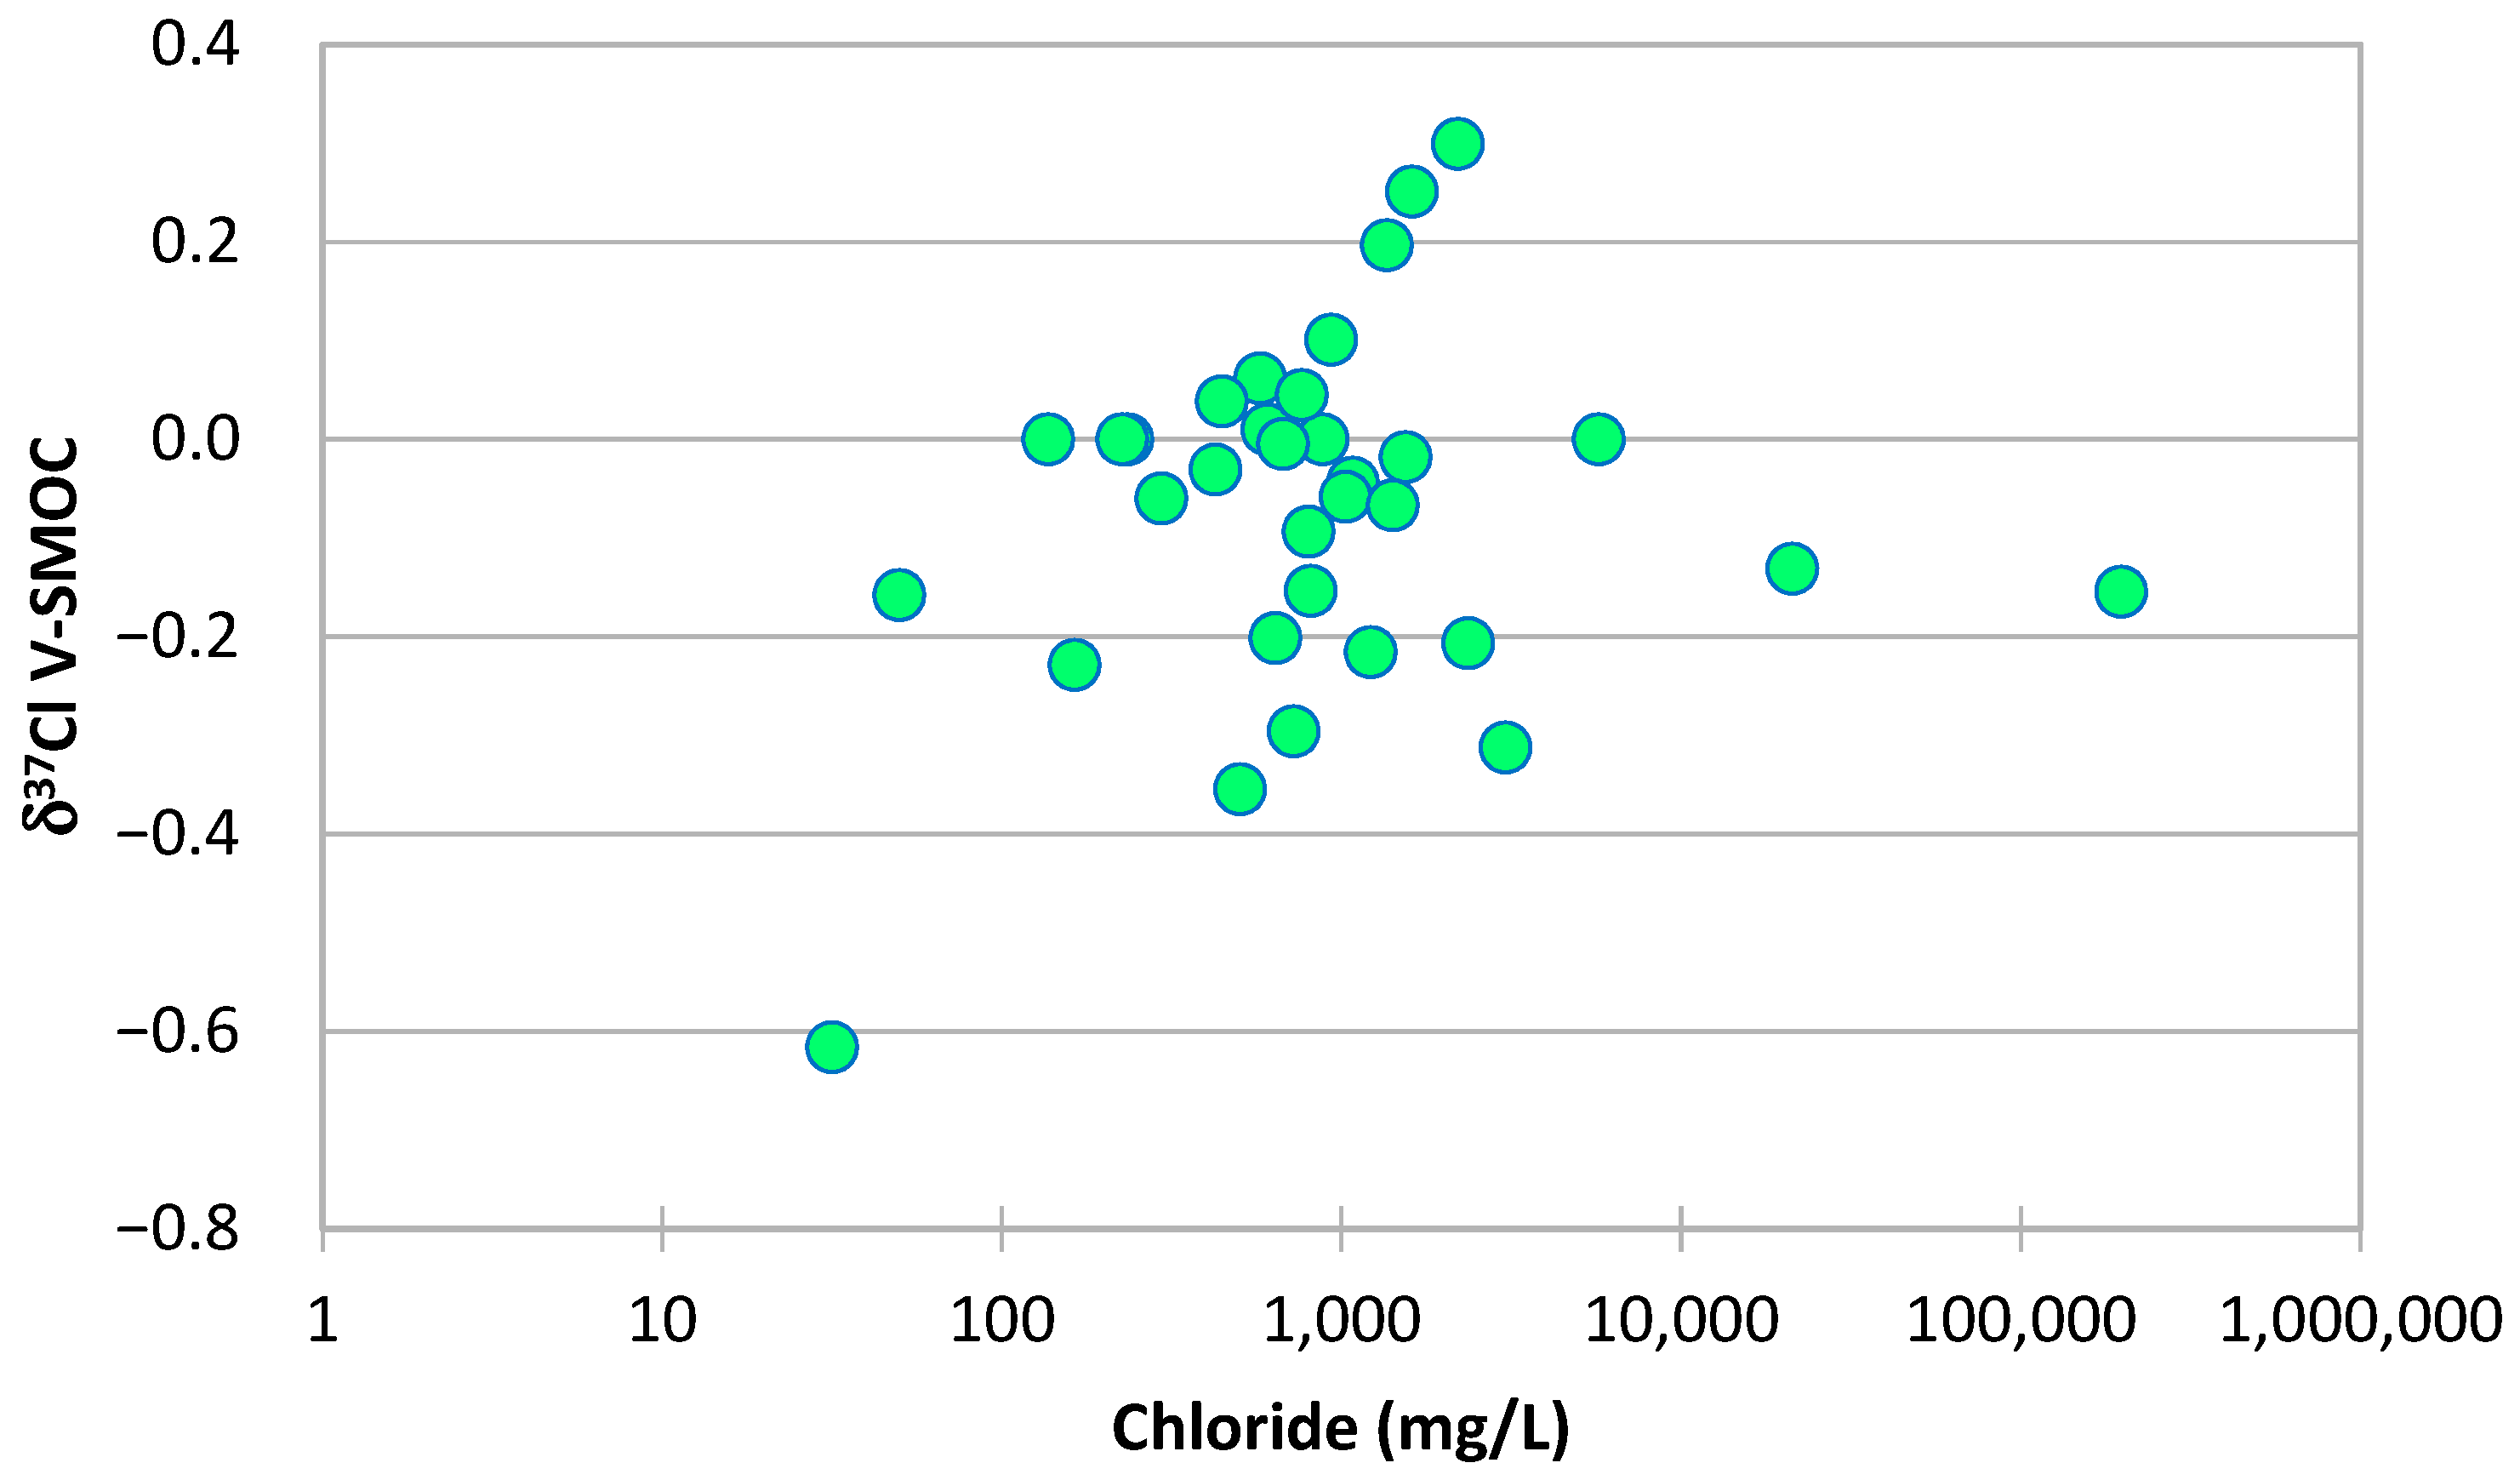
5.7. Chlorine Isotope

δ37Cl has been used regularly to understand the sources of the salinity in natural water samples. δ37Cl values of seawater and of water affected by dissolution of halite varies between −0.9‰ and +0.5‰ [16]. More recently, a study on δ37Cl values from a large set of primary halite samples showed that the δ37Cl of halite can be defined more specifically between −0.24‰ and +0.33‰. It also showed that the δ37Cl of ocean water has always been close to 0‰ (for the last 2 Ga) [66].
δ37Cl variations in the aquifer of Sousse (Figure 12 and Table 1) are large, with δ37Cl values ranging from −0.6 to +0.3‰ vs. SMOC. However, most samples show δ37Cl values that are within the range of primary halite. δ37Cl variations in the study area depend largely on the well location. Only a limited δ37Cl range is found in the eastern section of the field area with values between −0.3 and 0‰. More inland δ37Cl values have a much larger range. Here, the δ37Cl variability is about equal to the full range that has been measured in this study. The data suggests that the δ37Cl of groundwater in the vicinity of the coastline is in part influenced by the presence of seawater, while more inland the δ37Cl values reflect chemical and physical processes of which ion-exchange and diffusion [67].

5.8. Groundwater Residence Time
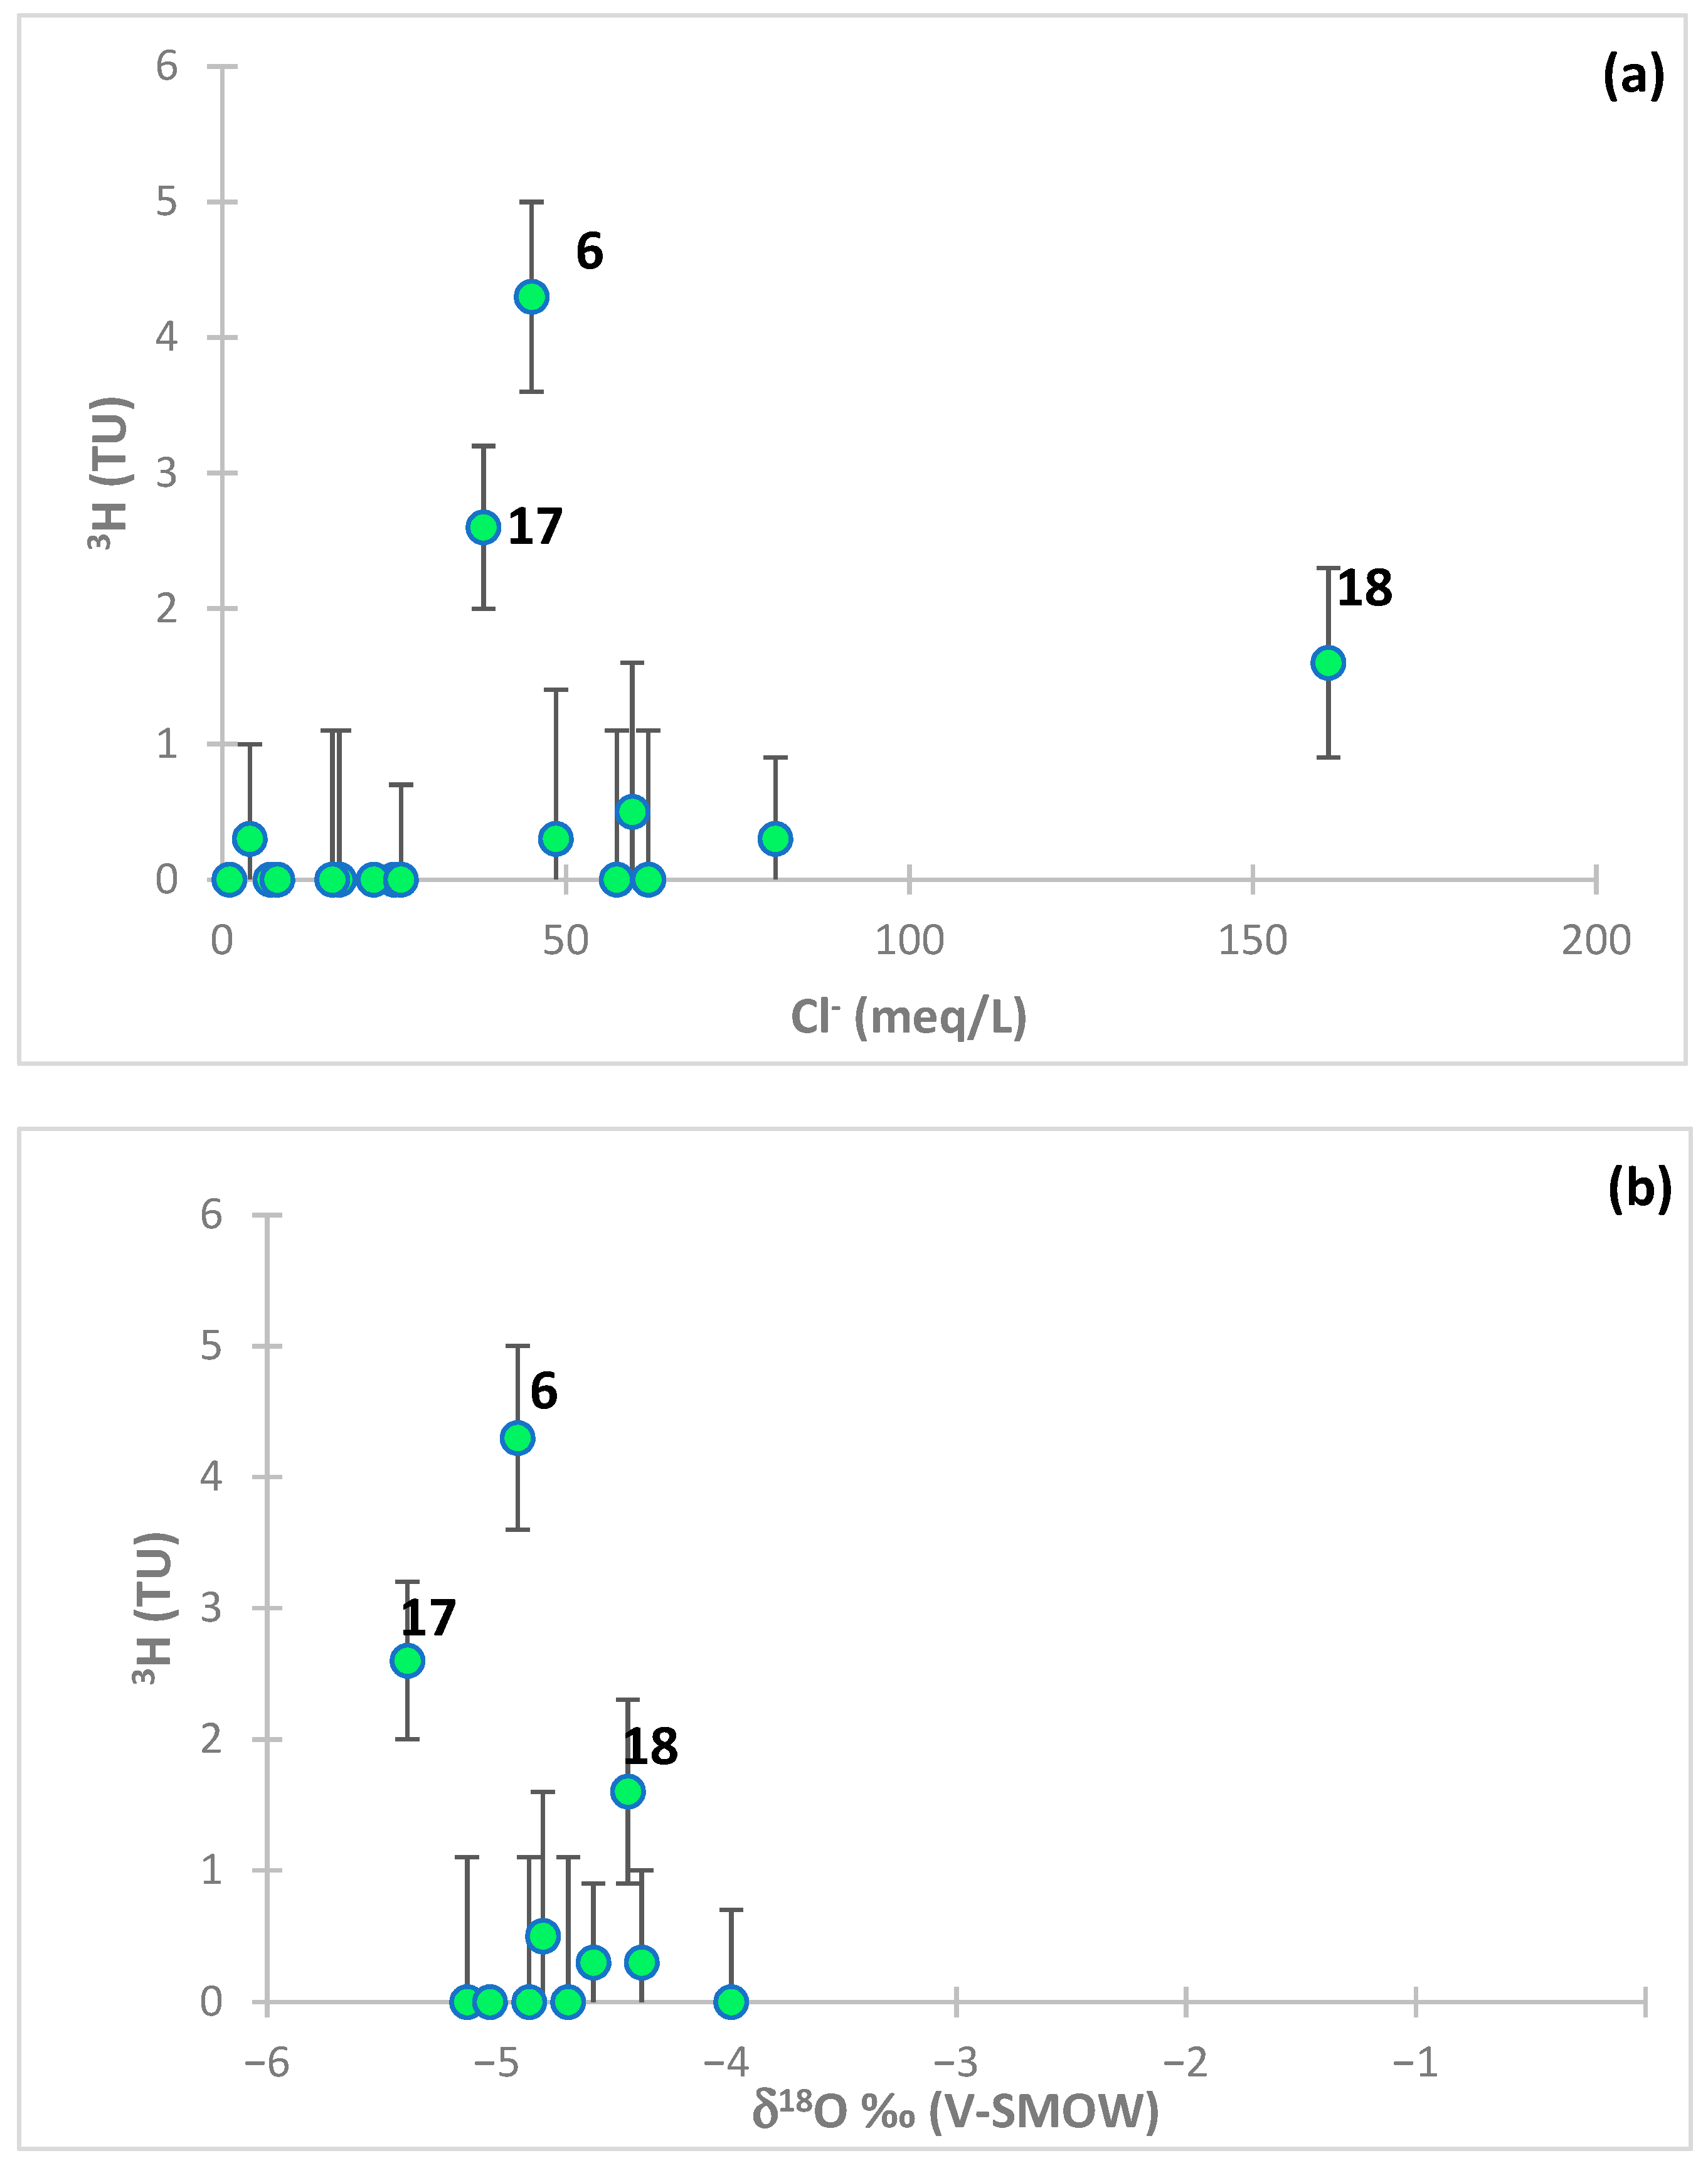
5.8.1. Tritium

Tritium distribution in precipitation is logged from the closest stations of the IAEA/WMO network at the Global Network of Isotopes in Precipitation (GNIP) [56]. For practical purposes, it is possible to make an estimation of the 3H rain-out at any location by reference to the data (monthly average data for 1968–1997 available from Tunis–Carthage rain station, about 140 km from the study area, and for 1992–2022 from Sfax rain station, located 90 km from the Oued Laya region and at almost the same altitude) [6,56]. Tritium, as a radioactive isotope, is one of the best tools for the estimation of modern groundwater recharge.
In the Sousse region, salinization is likely not from the present-day, since most water samples have 3H compositions near zero as well as fairly variable chloride contents.
Due to the presence of a clay fraction in the aquifer matrix and the fact that most samples have low tritium contents, we understand that the residence time of the recharge water is rather relevant and favorable to ion exchange process and dissolution of evaporite minerals.
The correlation between 3H-Cl and 3H–18O demonstrates that recent saltwater intrusion is the cause of the increased mineralization (Figure 13a,b), but sample No. 18 in the diagram 3H vs. δ18O does not corroborate this hypothesis (isotopic depletion δ18O = −4.43‰).
Consolidating the evaluation of these three variables enabled us to develop the hypothesis that the fundamental process causing the increase in salinization in the groundwater system is the dissolution of evaporite minerals. The stable isotope content in the shallow well No. 6 is indicative of recent water mineralization and of an isotopic enrichment higher than that of seawater (Table 1 and Figure 13b).

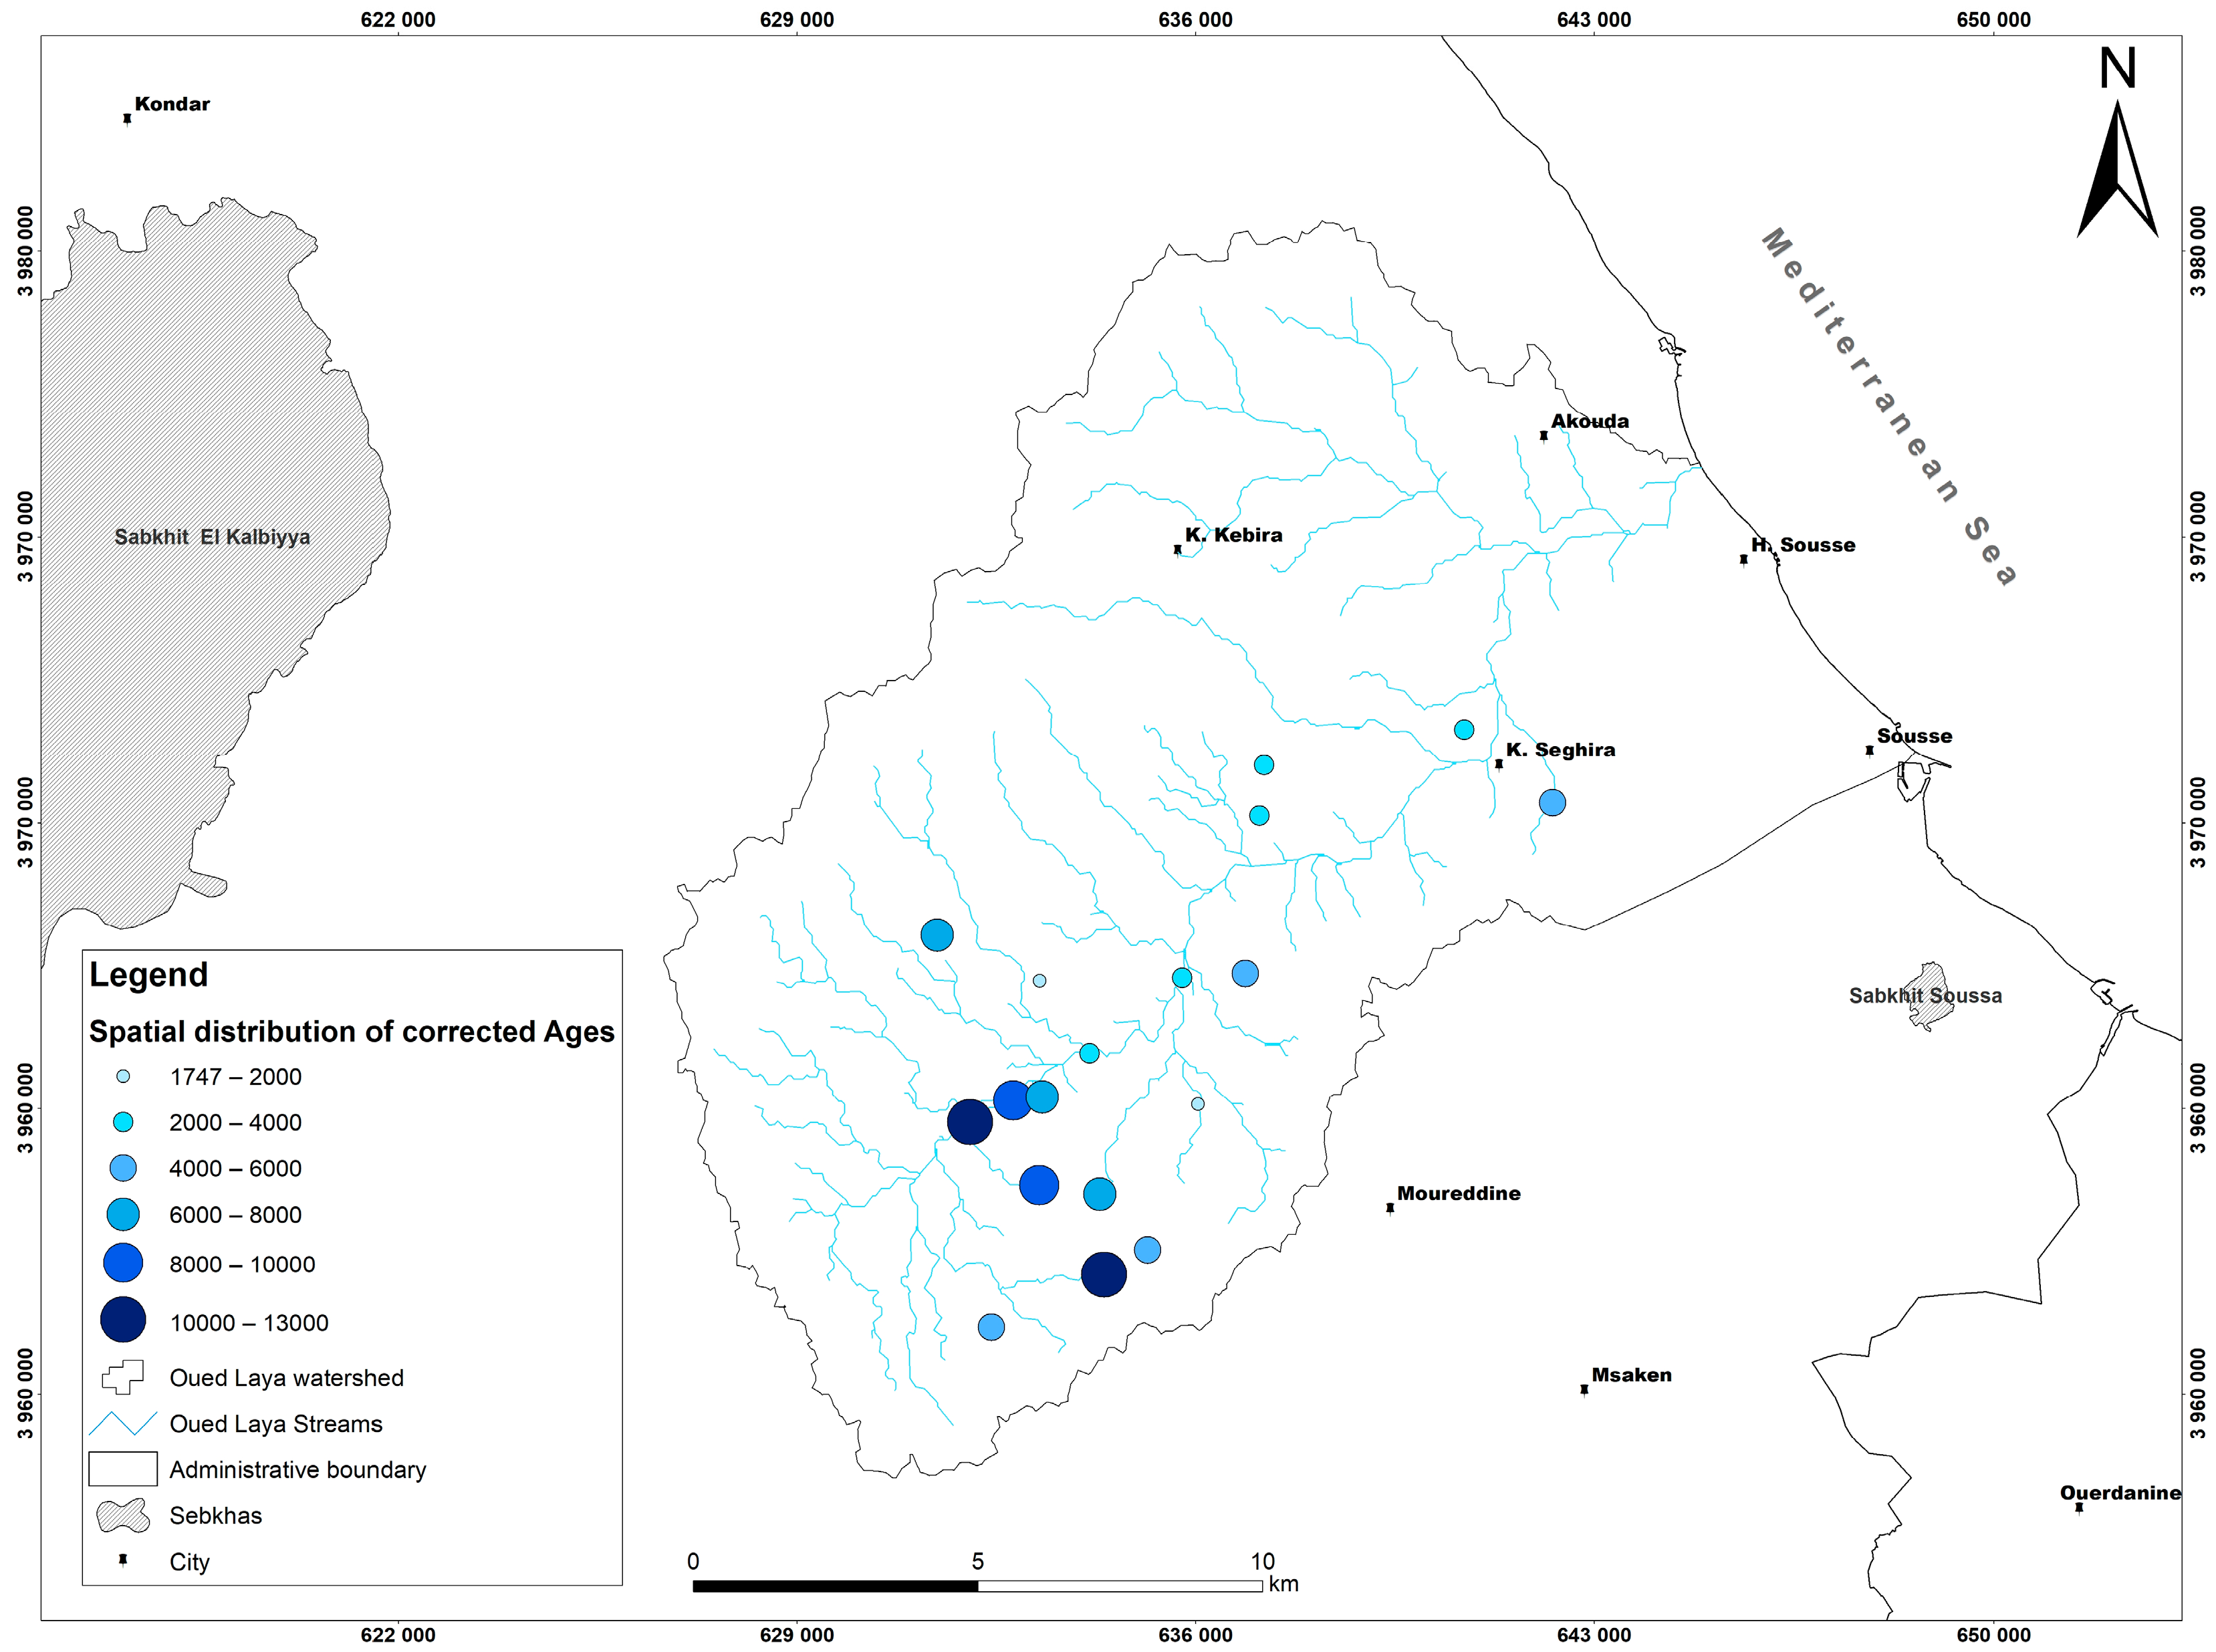
5.8.2. Carbon 14 and δ13C

Carbon-14 (14C) is known as an excellent natural tracer of groundwater flow in aquifers. For this aquifer, 23 dug wells and boreholes were sampled for 14C and δ13C. The results are shown in Table 1 and expressed in percent modern carbon (pmC). 14C activities in the groundwater of Oued Laya vary between 9 and 56 pmC in the deep aquifer and between 20 and 99 pmC in shallow aquifer.
The δ13C values vary between −10.02‰ and −14.6‰ with an average of −11.44‰.
The estimation of the “real” groundwater residence times with 14C consists of calculating the initial activity A0, corrected after the evaluation of the contribution of different carbon sources and isotopic exchange process [68,69,70].
The difficulty with 14C dating lies in determining the initial activity A0 of the carbon. Several authors have proposed correction models for the initial activity A0, most of which are based on the different mixing processes and on the fact that the Dissolved Inorganic Carbon (DIC) of the waters originates from two carbon sources: CO2 gas and solid carbonates. Groundwater ages have been calculated and compared using eight correction models: Tammers [71], Ingerson and Pearson [72], Mook [73], Fontes and Garnier equilibrium [74], IAEA [75], Evans [76], and Eichinger [77]. The isotopic composition of different carbon used in the calculations are:
(1) δ13C content of the soil gas: δ13C = −21‰ vs. PDB, the average value in δ13C obtained allowing measurements carried out on samples of plants in C3 and C4 [78], A14C 100 pmC; (2) δ13C content in solid carbonates: δ13C 0‰ vs. PDB, A14C activity of rock carbonates (dead carbon): A 14C = 0 pmC [79].
The results of the different models have shown that: Tammers, Evans, Pearson, Fontes and Garnier and Eichinger models give negative initial activity. Values lower than the measured activities result in negative ages. However, both Mook and Fontes and Garnier equilibrium models do not differ too much from the Fontes and Garnier model and give logical results. Unfortunately, they present several negative corrected age values. The “IAEA” model presents much more logical results which agree with the other isotope data, and this model was adopted for the correction of the “14C ages”. The corrected 14C ages obtained using all models are shown in Table 2.
The respective 14C ages in aquifers could be used for the estimation of groundwater recharge rate (R). Vogel [80] and Cook and Herczeg [81] provided summaries of this approach. Presuming that an aquifer with uniform thickness has a constant replenishment in its unconfined area and has a restriction to not receive any recharge in its confined part of the aquifer, the Vogel model [80] may be used to calculate the recharge rate R from the groundwater ages.
The recharge estimation equation is:
R = H . ε t l n ( H H Z )
where H is the aquifer’s overall thickness and ε is its mean porosity. Sample depth Z is the distance from the water table. The age of the groundwater at depth Z is given by t.
The mean aquifer thickness used in the calculation of the recharge rate was 30 m for the Mio–Pliocene aquifer. A mean aquifer porosity of 0.12 was used as a representative value for the porosity. Applying the aforementioned equation to the data revealed the recharge estimated to be between 2 and 12 mm/a.
The youngest ages were observed in the coastal areas, according to the geographical distribution of 14C corrected ages, confirming the presence of recent recharge of this aquifer (Figure 13). This map help to clarify conditions of recharge of the aquifer (current location of recharge areas and its evolution vs. time) as well as the general characteristics of groundwater flow (direction and flow velocity) (Figure 14). The relatively young ages argue for a current significant recharge of rainwater to the water table through the Oued Laya.
In the southeast, the 14C activities decreased sharply. This is especially true for samples 4, 15, and 8 (Figure 14), where the 14C activities of the water decreased to very low values presumably reflecting a reserve of old water. These low 14C activities are not accompanied by changes in the chemical composition of water, confirming the limit of water recharge from precipitation at these sites. The same 14C results are in good agreement with conclusions reached from stable isotopes and tritium, which strongly suggested that the recharge of Oued Laya is recent and renewed through rainwater. Finally, this map shows that the coastal zone is a new and renewable water area while the Southwest area consists of older waters and their ages exceed 5000 years.

6. Conclusions

In most aquifer systems located in the coastline of the Mediterranean region, the increase in the groundwater’s salinity is usually mainly ascribed to overexploitation. However, this seems not to be the case for the studied groundwaters in the Oued Laya aquifer, based on the results obtained through the multidisciplinary (isotopic and geochemical) approach used in this study. Contrariwise, the dissolution of evaporitic minerals such as halite and gypsum can explain the water salinity of the studied aquifer systems, although the groundwater mineralization is also strongly controlled by cation exchange mechanisms between clays and groundwaters. The hypothesis of mixing between the shallow groundwaters of the Mio–Pliocene aquifer system with seawater (contributing to the groundwater contamination) seems to be supported by stable isotopic data. However, correlations between Cl vs. δ18O (or vs. δ2H) are not considerable, excluding the hypothesis of seawater intrusion as the most important cause of groundwater salinity. The above-mentioned rather low correlations are usually explained by water–rock interaction processes leading to evaporite mineral (mainly halite and gypsum) dissolution, corroborated by higher Na+ and Ca2+ concentrations in groundwaters. In the study region, such processes are related to the presence of saline basins (“sebkhas”) and to the type of rocks found below the ground surface, namely interbedded gypsum lenses in the sandstone geological formations. It seems that the recharge water’s residence time is rather high, considering (i) the low 3H concentration in most groundwater samples, (ii) aquifer matrix clay fraction, fostering the dissolution of minerals in evaporite rocks and cation exchange between clays and groundwaters. This research confirms the importance of a multidisciplinary approach to the study of groundwaters in shallow aquifers in semi-arid areas. The decrease in groundwater quality is usually ascribed to seawater intrusion. However, that was not the case in the study area. This indicates that measures to improve the groundwater quality in the case of the Oued Laya aquifers must be different from the measures that are needed in other areas where, for example, seawater intrusion is a major cause of groundwater deterioration. This does not only indicate that studies need to be separately done in each area, but also that measures to improve groundwater quality in a region need to be tailored to the needs of each specific situation.

Author Contributions

Conceptualization, M.F.B.H., P.M.C. and F.N.; methodology, F.N., M.F.B.H., P.M.C., J.M.M. and H.G.M.E.; software, F.N.; validation, M.F.B.H., P.M.C., J.M.M. and H.G.M.E.; investigation, F.N., M.F.B.H., P.M.C., J.M.M. and H.G.M.E.; writing—original draft preparation, F.N., M.F.B.H., P.M.C., J.M.M. and H.G.M.E.; writing—review and editing, F.N., M.F.B.H., P.M.C., J.M.M. and H.G.M.E.; visualization, M.F.B.H.; supervision, M.F.B.H.; project administration, M.F.B.H. and P.M.C.; funding acquisition, M.F.B.H. and P.M.C. All authors have read and agreed to the published version of the manuscript.

Funding

This work was developed in the scope of project funded by Fundação para a Ciência e Tecnologia (FCT) and the Ministry of Scientific Research, Technology and Competency Development of Tunisia (Groundwater Resources Assessment and Evaluation of Marine Intrusion, Northern Tunisia, Using Geochemical, Geophysical and Isotope Techniques).

Data Availability Statement

Not appliable.

Acknowledgments

The author from C2TN/IST acknowledges FCT support through the strategic project FCT-UIDB/04349/2020. CERENA/|IST author acknowledges the FCT support through FCT-UIDB/04028/2020 project. The author from CNSTN acknowledges the Ministry of Higher education and Scientific Research for the financial support.

Conflicts of Interest

The authors declare no conflict of interest.

References

  1. Kloppmann, W.; Bourhane, A.; Schomburgk, S. Groundwater Salinization in France. Procedia Earth Planet. Sci. 2013, 7, 440–443. [Google Scholar] [CrossRef] [Green Version]
  2. Ben Hamouda, M.F.; Tarhouni, J.; Leduc, C.; Zouari, K. Understanding the Origin of Salinization of the Plio-Quaternary Eastern Coastal Aquifer of Cap Bon (Tunisia) Using Geochemical and Isotope Investigations. Environ. Earth Sci. 2011, 63, 889–901. [Google Scholar] [CrossRef]
  3. Gaaloul, N.; Cheng, A. Hydrogeological and Hydrochemical Investigation of Coastal Aquifers in Tunisia-Crisis in Overex-ploitation and Salinization. In Proceedings of the 2nd International Conference on Saltwater Intrusion and Coastal Aquifers: Montoring, Modelling, and Management, Merida, Mexico, 30 March–2 April 2003; p. 13. [Google Scholar]
  4. Fontes, J.-C. Les Isotopes Du Milieu Dans Les Eaux Naturelles. La Houille Blanche 1976, 62, 205–221. [Google Scholar] [CrossRef] [Green Version]
  5. Hamouda, M.F.B.; Carreira, P.; Marques, J.M.; Egenkamp, H. Geochemical and Isotopic Investigations to Study the Origin of Mineralization of the Coastal Aquifer of Sousse, Tunisia. Procedia Earth Planet. Sci. 2013, 7, 61–64. [Google Scholar] [CrossRef] [Green Version]
  6. Ben Hamouda, M.F. Hydrogeological, Geochemical and Isotopic Approach of the Coastal Aquifers Systems of Cap Bon: Case of the Eastern Coastal and El Haouaria Aquifer, Tunisia. Ph.D. Thesis, National Agronomic Institute of Tunisia, Tunis, Tunisia, 2008. [Google Scholar]
  7. Hamouda, M.F.B.; Kondash, A.J.; Lauer, N.; Mejri, L.; Tarhouni, J.; Vengosh, A. Assessment of Groundwater Salinity Mech-anisms in the Coastal Aquifer of El Haouaria, Northern Tunisia. Procedia Earth Planet. Sci. 2015, 13, 194–198. [Google Scholar] [CrossRef] [Green Version]
  8. Tarhouni, J.; Hamouda, M.F.B.; Kondash, A.J.; Mejri, L.; Vengosh, A. Modeling the Recharge and the Renewal Rate Based on 3H and 14C Isotopes in the Coastal Aquifer of El Haouaria, Northern Tunisia. Procedia Earth Planet. Sci. 2015, 13, 199–202. [Google Scholar] [CrossRef] [Green Version]
  9. Ben Hamouda, M.F. Study of the Groundwater Salinity and Modeling the Recharge and the Renewal Rate Based on Stable and Radioactive Isotopes in El Haouaria Aquifer, Tunisia. Arab. J. Geosci. 2021, 14, 2246. [Google Scholar] [CrossRef]
  10. Jones, B.F.; Vengosh, A.; Rosenthal, E.; Yechieli, Y. Geochemical Investigations. In Seawater Intrusion in Coastal Aquifers—Concepts, Methods and Practices; Bear, J., Cheng, A.H.-D., Sorek, S., Ouazar, D., Herrera, I., Eds.; Theory and Applications of Transport in Porous Media; Springer: Dordrecht, The Netherlands, 1999; Volume 14, pp. 51–71. ISBN 978-90-481-5172-1. [Google Scholar]
  11. Vengosh, A. 11.9—Salinization and Saline Environments. In Treatise on Geochemistry, 2nd ed.; Holland, H.D., Turekian, K.K., Eds.; Elsevier: Oxford, UK, 2014; pp. 325–378. ISBN 978-0-08-098300-4. [Google Scholar]
  12. Stotler, R.L.; Frape, S.K.; Shouakar-Stash, O. An Isotopic Survey of Δ81Br and Δ37Cl of Dissolved Halides in the Canadian and Fennoscandian Shields. Chem. Geol. 2010, 274, 38–55. [Google Scholar] [CrossRef]
  13. Aggarwal, P.K.; Froehlich, K.; Gonfiantini, R. Contributions of the International Atomic Energy Agency to the Development and Practice of Isotope Hydrology. Hydrogeol. J. 2011, 19, 5–8. [Google Scholar] [CrossRef]
  14. Holser, W.T.; Kaplan, I.R.; Sakai, H.; Zak, I. Isotope Geochemistry of Oxygen in the Sedimentary Sulfate Cycle. Chem. Geol. 1979, 25, 1–17. [Google Scholar] [CrossRef]
  15. Clayton, R.N.; Friedman, I.; Graf, D.L.; Mayeda, T.K.; Meents, W.F.; Shimp, N.F. The Origin of Saline Formation Waters: 1. Isotopic Composition. J. Geophys. Res. 1966, 71, 3869–3882. [Google Scholar] [CrossRef]
  16. Eggenkamp, H.G.M. δ37Cl: The Geochemistry of Chlorine Isotopes. Ph.D. Thesis, Faculteit Aardwetenschappen, Utrecht, The Netherlands, 1994. [Google Scholar]
  17. Eggenkamp, H.G.M.; Coleman, M.L. Heterogeneity of Formation Waters within and between Oil Fields by Halogen Isotopes. In Proceedings of the 9th International Sympsium on Water-Rock Interaction, WRI 9, Taupo, New Zealand, 30 March–3 April 1998; Volume 9, pp. 309–312. [Google Scholar]
  18. Ferchichi, H.; Farhat, B.; Ben-Hamouda, M.F.; Ben-Mammou, A. Understanding Groundwater Chemistry in Mediterranean Semi-Arid System Using Multivariate Statistics Techniques and GIS Methods: Case of Manouba Aquifer (Northeastern Tuni-sia). Arab. J. Geosci. 2017, 10, 530. [Google Scholar] [CrossRef]
  19. Ferchichi, H.; Ben Hamouda, M.F.; Farhat, B.; Ben Mammou, A. Assessment of Groundwater Salinity Using GIS and Multi-variate Statistics in a Coastal Mediterranean Aquifer. Int. J. Environ. Sci. Technol. 2018, 15, 2473–2492. [Google Scholar] [CrossRef]
  20. Bouchaou, L.; Michelot, J.L.; Vengosh, A.; Hsissou, Y.; Qurtobi, M.; Gaye, C.B.; Bullen, T.D.; Zuppi, G.M. Application of Mul-tiple Isotopic and Geochemical Tracers for Investigation of Recharge, Salinization, and Residence Time of Water in the Souss–Massa Aquifer, Southwest of Morocco. J. Hydrol. 2008, 352, 267–287. [Google Scholar] [CrossRef]
  21. Vespasiano, G.; Cianflone, G.; Marini, L.; De Rosa, R.; Polemio, M.; Walraevens, K.; Vaselli, O.; Pizzino, L.; Cinti, D.; Capec-chiacci, F.; et al. Hydrogeochemical and Isotopic Characterization of the Gioia Tauro Coastal Plain (Calabria-Southern Italy): A Multidisciplinary Approach for a Focused Management of Vulnerable Strategic Systems. Sci. Total Environ. 2023, 862, 160694. [Google Scholar] [CrossRef]
  22. Vespasiano, G.; Cianflone, G.; Romanazzi, A.; Apollaro, C.; Dominici, R.; Polemio, M.; De Rosa, R. A Multidisciplinary Ap-proach for Sustainable Management of a Complex Coastal Plain: The Case of Sibari Plain (Southern Italy). Mar. Pet. Geol. 2019, 109, 740–759. [Google Scholar] [CrossRef]
  23. Ben Hamouda, M.F.; Carreira, P.M.; Marques, J.M.; Eggenkamp, H. Multi-Isotope Approach to Study the Problem of Salinity in the Coastal Aquifer of Oued Laya, Tunisia. In Advances in Sustainable and Environmental Hydrology, Hydrogeology, Hydrochemistry and Water Resources; Chaminé, H.I., Barbieri, M., Kisi, O., Chen, M., Merkel, B.J., Eds.; Advances in Science, Technology & Innovation; Springer International Publishing: Cham, Switzerland, 2019; pp. 203–206. ISBN 978-3-030-01571-8. [Google Scholar]
  24. Dridi, L.; Majdoub, R.; Ghorbel, F.; Ben Hlima, M. Characterization of Water and Sediment Quality of Oued Laya (Sousse/Tunisia). J. Mater Environ. Sci 2014, 5, 1500–1504. [Google Scholar]
  25. El Amrı, A.; Anane, M.; Drıdı, L.; Srasra, M.; Majdoub, R. A GIS Based DRASTIC, Pesticide DRASTIC and SI Methods to Assess Groundwater Vulnerability to Pollution: Case Study of Oued Laya (Central Tunisia). In Environmental Remote Sensing and GIS in Tunisia; Khebour Allouche, F., Negm, A.M., Eds.; Springer Water; Springer International Publishing: Cham, Switzerland, 2021; pp. 143–163. ISBN 978-3-030-63667-8. [Google Scholar]
  26. Carreira, P.M.; Bahir, M.; Salah, O.; Galego Fernandes, P.; Nunes, D. Tracing Salinization Processes in Coastal Aquifers Using an Isotopic and Geochemical Approach: Comparative Studies in Western Morocco and Southwest Portugal. Hydrogeol. J. 2018, 26, 2595–2615. [Google Scholar] [CrossRef]
  27. Eggenkamp, H. Theoretical and Experimental Fractionation Studies of Chloride and Bromide Isotopes. In The Geochemistry of Stable Chlorine and Bromine Isotopes; Advances in Isotope Geochemistry; Springer: Berlin/Heidelberg, Germany, 2014; pp. 75–93. ISBN 978-3-642-28505-9. [Google Scholar]
  28. Riou, C. A simple empiric formula for estimating potential evapotranspiration in Tunisia. Cah. ORSTOM Ser. Hydrol. 1980, 2, 129–137. [Google Scholar]
  29. DGRE “General Directorate of Water Resources, Tunisia”. In Directory of Groundwater Quality in Tunisia; Ministry of Agriculture, Water Resources and Fisheries: Tunis, Tunisia, 2004; p. 385. (In French)
  30. Khomsi, S.; Bédir, M.; Ben Jemia, M.G.; Zouari, H. Discovery of a new thrust front in the oriental Atlas of Tunisia using seis-mic reflection data. Structural context and role of salt intrusions. C. R. Geosci. 2004, 336, 1401–1408. [Google Scholar] [CrossRef]
  31. Khomsi, S.; Echihi, O.; Slimani, N. Structural Control on the Deep Hydrogeological and Geothermal Aquifers Related to the Fractured Campanian-Miocene Reservoirs of North-Eastern Tunisia Foreland Constrained by Subsurface Data. C. R. Geosci. 2012, 344, 247–265. [Google Scholar] [CrossRef]
  32. Manaa, M. Groundwater Resources in the Gouvernorate of Sousse and Hydric Pollution; Ministry of Agriculture, DGRE: Tunis, Tunisia, 1994; p. 53. [Google Scholar]
  33. Amri, R. Note on Implementation of a Drilling Well in Oued Laya, Sousse; Ministry of Agriculture, DGRE: Tunis, Tunisia, 1995. [Google Scholar]
  34. Khammasi, M. Contribution of Isotope Geochemistry to Study the Oued Laya Aquifer, Sousse. Master’s Thesis, Jendouba University, Tunis, Tunisia, 2013. [Google Scholar]
  35. Batti, D.; Mansour, H.; Alayet, H. Map of Water Resources in Tunisia, Region of Sousse and El Jem in 1/200,000; Ministry of Agriculture, DGRE: Tunis, Tunisia, 1976. [Google Scholar]
  36. IAEA Sampling Procedures for Isotope Hydrology. Available online: https://www-naweb.iaea.org/napc/ih/documents/other/Sampling%20booklet%20web.pdf (accessed on 15 November 2022).
  37. Epstein, S.; Mayeda, T. Variation of O18 Content of Waters from Natural Sources. Geochim. Cosmochim. Acta 1953, 4, 213–224. [Google Scholar] [CrossRef]
  38. Coleman, M.L.; Shepherd, T.J.; Durham, J.J.; Rouse, J.E.; Moore, G.R. Reduction of Water with Zinc for Hydrogen Isotope Analysis. Anal. Chem. 1982, 54, 993–995. [Google Scholar] [CrossRef]
  39. Coplen, T.B. Normalization of Oxygen and Hydrogen Isotope Data. Chem. Geol. Isot. Geosci. Sect. 1988, 72, 293–297. [Google Scholar] [CrossRef]
  40. Taylor, C.B. Tritium Enrichment of Environmental Waters by Electrolysis: Development of Cathodes Exhibiting High Isotopic Separation and Precise Measurement of Tritium Enrichment Factors; International Atomic Energy Agency (IAEA): Vienna, Austria, 1976; pp. 32–42. [Google Scholar]
  41. Taylor, C.B.; Schwarz, P. Deionization Procedure for Large Quantities of Tritium-Free Water Using an Ion-Exchange Column. Int. J. Appl. Radiat. Isot. 1977, 28, 605–606. [Google Scholar] [CrossRef]
  42. Fontes, J.-C. A Unit Intended for the Measurement of the Activity of Natural Radiocarbon by Liquid Scintillation. Rev. Geogr. Phys. Geol. Dyn. 1971, 13, 67–86. [Google Scholar]
  43. Godon, A.; Jendrzejewski, N.; Eggenkamp, H.G.M.; Banks, D.A.; Ader, M.; Coleman, M.L.; Pineau, F. A Cross-Calibration of Chlorine Isotopic Measurements and Suitability of Seawater as the International Reference Material. Chem. Geol. 2004, 207, 1–12. [Google Scholar] [CrossRef]
  44. Piper, A.M. A Graphic Procedure in the Geochemical Interpretation of Water-Analyses. Trans. AGU 1944, 25, 914. [Google Scholar] [CrossRef]
  45. Appelo, C.A.J.; Postma, D. Geochemistry, Groundwater and Pollution; Appelo, C.A.J., Postma, D., Eds.; Balkema: Rotterdam, The Netherlands, 1994. [Google Scholar]
  46. Re, V.; Sacchi, E.; Mas-Pla, J.; Menció, A.; El Amrani, N. Identifying the Effects of Human Pressure on Groundwater. Quality to Support Water Management Strategies in Coastal Regions: A Multi-Tracer and Statistical Approach (Bouareg Region, Morocco). Sci. Total Environ. 2014, 500–501, 211–223. [Google Scholar] [CrossRef] [Green Version]
  47. Carreira, P.M.; Lobo de Pina, A.; da Mota Gomes, A.; Marques, J.M.; Monteiro Santos, F. Radiocarbon Dating and Stable Isotopes Content in the Assessment of Groundwater Recharge at Santiago Island, Republic of Cape Verde. Water 2022, 14, 2339. [Google Scholar] [CrossRef]
  48. Simler, R. Diagrammes: Free Distribution Multi-Language Hydrochemistry Software; Hydrogeology Laboratory of Avignon, Avignon University: Avignon, France, 2009. [Google Scholar]
  49. Rashad, M.; Dultz, S.; Guggenberger, G. Dissolved Organic Matter Release and Retention in an Alkaline Soil from the Nile River Delta in Relation to Surface Charge and Electrolyte Type. Geoderma 2010, 158, 385–391. [Google Scholar] [CrossRef]
  50. Abdulameer, A.; Thabit, J.M.; Kanoua, W.; Wiche, O.; Merkel, B. Possible Sources of Salinity in the Upper Dibdibba Aquifer, Basrah, Iraq. Water 2021, 13, 578. [Google Scholar] [CrossRef]
  51. Yurtsever, Y. Role of Environmental Isotopes in Studies Related to Salinization Processes and Salt Water Intrusion Dynamics. In Proceedings of the 13th Saltwater Intrusion Meeting, Cagliari, Italy, 5–10 June 1994; pp. 177–185. [Google Scholar]
  52. Modibo Sidibé, A.; Lin, X.; Koné, S. Assessing Groundwater Mineralization Process, Quality, and Isotopic Recharge Origin in the Sahel Region in Africa. Water 2019, 11, 789. [Google Scholar] [CrossRef] [Green Version]
  53. Sankoh, A.A.; Derkyi, N.S.A.; Frazer-williams, R.A.D.; Laar, C.; Kamara, I. A Review on the Application of Isotopic Techniques to Trace Groundwater Pollution Sources within Developing Countries. Water 2022, 14, 35. [Google Scholar] [CrossRef]
  54. Carreira, P.M.; Marques, J.M.; Nunes, D. Source of Groundwater Salinity in Coastline Aquifers Based on Environmental Isotopes (Portugal): Natural vs. Human Interference. A Review and Reinterpretation. Appl. Geochem. 2014, 41, 163–175. [Google Scholar] [CrossRef]
  55. Kammoun, S.; Re, V.; Trabelsi, R.; Zouari, K.; Daniele, S. Assessing seasonal variations and aquifer vulnerability in coastal aquifers of semi-arid regions using a multi-tracer isotopic approach: The case of Grombalia (Tunisia). Hydro Geol. J. 2018, 26, 2575–2594. [Google Scholar] [CrossRef]
  56. GNIP. 2023. Available online: https://nucleus.iaea.org/wiser/index.aspx (accessed on 1 October 2022).
  57. Bath, A.H. Stable Isotopic Evidence for Palaeo-Recharge Conditions of Groundwater; International Atomic Energy Agency (IAEA): Vienna, Austria, 1983; ISBN 978-92-0-141083-2. [Google Scholar]
  58. Rozanski, K. Deuterium and Oxygen-18 in European Groundwaters—Links to Atmospheric Circulation in the Past. Chem. Geol. Isot. Geosci. Sect. 1985, 52, 349–363. [Google Scholar] [CrossRef]
  59. Négrel, P.; Petelet-Giraud, E. Isotopes in Groundwater as Indicators of Climate Changes. TrAC Trends Anal. Chem. 2011, 30, 1279–1290. [Google Scholar] [CrossRef] [Green Version]
  60. Rozanski, K.; Araguás-Araguás, L.; Gonfiantini, R. Relation Between Long-Term Trends of Oxygen-18 Isotope Composition of Precipitation and Climate. Science 1992, 258, 981–985. [Google Scholar] [CrossRef]
  61. Blavoux, B.; Dray, M.; Fehri, A.; Olive, P.; Groening, M.; Sonntag, C.; Hauquin, J.P.; Pelissier, G.; Pouchan, P. Paleoclimatic and hydrodynamic approach to the Aquitaine Basin deep aquifer (France) by means of environmental isotopes and noble gases. In Isotope Techniques in the Study of Past and Current Environmental Changes in the Hydrosphere and the Atmosphere; International Atomic Energy Agency: Vienna, Austria, 1993; pp. 293–305. [Google Scholar]
  62. Edmunds, W.M. Palaeowaters in Coastal Europe: Evolution of Groundwater Since the Late Pleistocene; Milne, C.J., Ed.; Geological Society of London: London, UK, 2001; ISBN 978-1-86239-086-7. [Google Scholar]
  63. Stute, M.; Deak, J. Environmental isotope study (14C, 13C, 18O, 2H, noble gases) on deep groundwater circulation systems in Hungary with reference to palaeoclimate. Radiocarbon 1989, 31, 902–918. [Google Scholar] [CrossRef] [Green Version]
  64. Stute, M.; Clark, J.F.; Schlosser, P.; Broecker, W.S.; Bonani, G. A 30,000 Yr Continental Paleotemperature Record Derived from Noble Gases Dissolved in Groundwater from the San Juan Basin, New Mexico. Quat. Res. 1995, 43, 209–220. [Google Scholar] [CrossRef]
  65. Stute, M.; Forster, M.; Frischkorn, H.; Serejo, A.; Clark, J.F.; Schlosser, P.; Broecker, W.S.; Bonani, G. Cooling of Tropical Bra-zil (5°C) During the Last Glacial Maximum. Science 1995, 269, 379–383. [Google Scholar] [CrossRef] [PubMed]
  66. Eggenkamp, H.G.M.; Louvat, P.; Agrinier, P.; Bonifacie, M.; Bekker, A.; Krupenik, V.; Griffioen, J.; Horita, J.; Brocks, J.J.; Bagheri, R. The Bromine and Chlorine Isotope Composition of Primary Halite Deposits and Their Significance for the Secular Isotope Composition of Seawater. Geochim. Cosmochim. Acta 2019, 264, 13–29. [Google Scholar] [CrossRef]
  67. Bagheri, R.; Nadri, A.; Raeisi, E.; Eggenkamp, H.G.M.; Kazemi, G.A.; Montaseri, A. Hydrochemical and Isotopic (Δ18O, Δ2H, 87Sr/86Sr, Δ37Cl and Δ81Br) Evidence for the Origin of Saline Formation Water in a Gas Reservoir. Chem. Geol. 2014, 384, 62–75. [Google Scholar] [CrossRef]
  68. Fontes, J.-C. Dating of Groundwater. In Guidebook on Nuclear Techniques in Hydrology; Technical Report Series No. 91; IAEA: Vienna, Austria, 1983; pp. 285–317. [Google Scholar]
  69. Fontes, J.-C. Chemical and Isotopic Constraints on 14C Dating of Groundwater. In Radiocarbon After Four Decades; Taylor, R.E., Long, A., Kra, R.S., Eds.; Springer: New York, NY, USA, 1992; pp. 242–261. ISBN 978-1-4757-4251-0. [Google Scholar]
  70. Zouari, K.; Trabelsi, R.; Chkir, N. Using Geochemical Indicators to Investigate Groundwater Mixing and Residence Time in the Aquifer System of Djeffara of Medenine (Southeastern Tunisia). Hydrogeol. J. 2011, 19, 209–219. [Google Scholar] [CrossRef]
  71. Tamers, M.A. Validity of Radiocarbon Dates on Ground Water. Geophys. Surv. 1975, 2, 217–239. [Google Scholar] [CrossRef]
  72. Ingerson, E.; Pearson, F. Estimation of Age and Rate of Motion of Groundwater by the 14C Method. In Recent Researches in the Fields of Hydrosphere, Atmosphere and Nuclear Geochemistry; Miyake, Y., Koyama, T., Eds.; Maruzen: Tokyo, Japan, 1964; pp. 263–283. [Google Scholar]
  73. Mook, W.G. Carbon-14 in hydrogeological studies. In The Terrestrial Environment; Elsevier: Amsterdam, The Netherlands, 1980; pp. 49–74. ISBN 978-0-444-41780-0. [Google Scholar]
  74. Fontes, J.-C.; Garnier, J.-M. Determination of the Initial 14C Activity of the Total Dissolved Carbon: A Review of the Existing Models and a New Approach. Water Resour. Res. 1979, 15, 399–413. [Google Scholar] [CrossRef]
  75. Salem, O.; Visser, J.H.; Dray, M.; Gonfiantini, R. Groundwater Flow Patterns in the Western Libyan Arab Jamahiriya Evalu-ated from Isotopic Data. In Arid Zone Hydrology. Investigations with Isotope Techniques; International Atomic Energy Agency: Vienna, Austria, 1980; pp. 165–179. ISBN 978-92-0-141180-8. [Google Scholar]
  76. Evans, G.V.; Otlet, R.L.; Downing, R.A.; Monkhouse, R.A.; Rae, G. Some Problems in the Interpretation of Isotope Measurements in United Kingdom Aquifers; International Atomic Energy Agency (IAEA): Vienna, Austria, 1979; ISBN 978-92-0-040179-4. [Google Scholar]
  77. Eichinger, L. A Contribution to the Interpretation of 14 C Groundwater Ages Considering the Example of a Partially Con-fined Sandstone Aquifer. Radiocarbon 1983, 25, 347–356. [Google Scholar] [CrossRef] [Green Version]
  78. Lassoued, S. Hydrogeology and Isotopic Geochemistry of the Plain of El Haouaria (Northern Tunisia). Ph.D. Thesis, University of South Paris, Paris, France, 1982. (In French). [Google Scholar]
  79. Daoud, D. Geochemical and Isotopic Characterization of Groundwater and Estimation of the Evaporation Rate in the Chott-Chergui Basin (Semiarid Zone, Algeria). Ph.D. Thesis, University of Paris 11, Paris, France, 1995. [Google Scholar]
  80. Vogel, J.C. Investigation of Groundwater Flow with Radiocarbon. In Proceeding of the Symposium on Isotopes in Hydrology, Vienna, Austria, 14–18 November 1966; IAEA: Vienna, Austria, 1966; pp. 355–369. [Google Scholar]
  81. Cook, P.G.; Herczeg, A.L. Environmental Tracers in Subsurface Hydrology; Springer: Boston, MA, USA, 2000; pp. 111–144. ISBN 978-1-4613-7057-4. [Google Scholar]
Figure 1. Location of the study area in Tunisia, in the governorate of Sousse and the sampled points.
Water 15 01242 g001
Figure 2. The outcropping geological formations in the Oued Laya watershed, Sousse.
Water 15 01242 g002
Figure 3. Hydrogeologic cross section SW–NE of the study region.
Water 15 01242 g003
Figure 4. Piezometric map of the shallow aquifer.
Water 15 01242 g004
Figure 5. Electrical conductivity distribution map of the studied area.
Water 15 01242 g005
Figure 6. Piper diagram drawn for shallow and deep aquifer.
Water 15 01242 g006
Figure 7. Na vs. Cl (a) and Br/Cl vs. Cl (b) diagrams for groundwater (Mio–Pliocene aquifer) of the study region.
Water 15 01242 g007
Figure 8. Mg/Ca vs. Ca (a) and Ca vs. SO42− (b) diagrams for groundwater (Mio–Pliocene aquifer) of the study region.
Water 15 01242 g008
Figure 9. Saturation index of Gypsum Vs SO4.
Water 15 01242 g009
Figure 10. XRD Spectrum of gypsum found in the geologic formations.
Water 15 01242 g010
Figure 11. (a) δ2H –δ18O diagram of the sampled waters [23]. (b) Plot of Cl vs. δ18O ‰ (V-SMOW) [23].
Water 15 01242 g011
Figure 12. Plot of δ37Cl ‰ (SMOC) vs. Cl [23].
Water 15 01242 g012
Figure 13. 3H vs. Cl (a) and 3H vs. δ 18O (b) diagrams for groundwaters [23].
Water 15 01242 g013
Figure 14. Spatial distribution of Carbon 14 corrected ages.
Water 15 01242 g014
Table 1. Chemical and isotope (2H, 18O, 13C, 37Cl, 3H and 14C) data in Oued Laya aquifer.
WPTPL (m)pHEC mS/cmCaMgNaKSO4ClNO3HCO3BrSI
Gypsum
δ18O δ2H 3H δ37Cl δ13C14C
mg/L‰ V-SMOWTU‰ SMOC‰ PDBPMC
1DW28.87.97.89273.2129.84666.713.2941152.01070.668.2129.930.48
2DW29.727.710.141401801809.35.8652112.01655.511.78567.31.38
3DW27.97.78.9322.4141.361459.94.6921680.01721.143.4434.930.67 0.3
4B 7.35.98240112.8823.02.737912.01198.969.44292.80.78
5DW37.467.310.914402161517.35.8651680.02268.822.94264.131.46
6DW36.98.97.8524863.841269.077.0271180.81595.34.96274.54.49−0.34−4.91−31.234.30.25−0.211.72
7B 7.94.7270.4111.6687.46.6471227.8886.348.36223.872.84−0.23 0 −100.51
8B 76.72399.2209.281565.67.0382157.62197.934.72276.336.450.01 00.30−11.420.01
9DW33.558.27.56234117.841951.942.6193446.41063.50.62268.43.39−0.02 −0.04
10DW30.47.61.8715267.2158.61.955584.6177.344.02134.20.57−0.6−5.05−29.77 −0.23−12.371.5
11DW27.97.35.69508210712.75.4742399.0779.9124211.673.070.22 0−0.49
12B 7.44.34266100.32570.25.0831053.6602.7213.28278.772.20−0.27−5.13−30.5700.01
13DW28.957.73.12258107.28395.44.3011459.2248.220.46254.980.81−0.14 0−0.35−11.537.71
14B 7.35.64448.4132.24896.628.5432853.6567.245.88168.972.670.24−4.86−28.710 −11.555.61
15DW31.637.62.6211.283.28457.53.1281436.6141.836.58128.10.38−0.21−4.37−27.160.3 −13.230.65
16DW31.258.11.58113.636.72165.55.083454.635.59.3258.030.19−0.78−5.03−29.40−0.16−14.241.67
17DW23.676.5350.4182.881521.94.6922222.41347.187.42349.534.540−5.39−32.662.60.20−13.379.64
18DW24.597.112.7796325.923002.593.0582067.85707.517.98195.216.930.15−4.43−27.571.6
19DW19.057.42.3612062.4250.63.128200.2425.424.8295.241.74−1.15−4.21−26.34 −0.03−14.663.22
20DW18.357.39.67536237.62193.286.021936.33048.7814.68189.17.720.04−5.2−31.61 −0.31
21DW1.697.52.188046.56206.91.173187.7283.634.1204.351.41−1.3 0−0.17−13.472.3
22DW27.227.23.4716076.8462.13.91355.2744.551.46207.43.46−0.86−4.89−29.59 0.05−11.869.97
23DW23.37.34.0821681.6586.21.955562.6921.725.42196.423.62−0.59−3.98−25.1400.04−12.574.81
24DW21.697.83.818491.2492.05.4741102.6425.411.16283.041.74−0.38 −0.02
25DW4.157.14.119479.56542.63.128423.8815.4246.14198.863.46−0.74 −0.15
26DW 7.34.52224.692.28731.17.038487.21205.3169.26210.453.68−0.67 −0.22
27B 74.75241.897.68784.034.799481.0709.01190.4250.11.21−0.66 −0.30
28DW2.727.53.3815668.16475.923.069569.3638.1138.88262.31.71−0.69 −0.20
29DW2.877.28.18449.8214.81873.739.12326.62339.754.56346.487.030.07 −0.21
30DW107.61.386834.8121.88.602192.5212.76.2126.880.32−1.31
31B 7.24.48265.2104.4650.610.166913.41028.1182.9234.242.90−0.35 −0.06
32DW20.867.45.29285.6113.52938.04.692836.61418.040.92277.555.09−0.39 −0.07
33DW187.27.21396301.21115.020.7231766.41800.947.74531.920.72 −3.89−25.17
34B 7.37.97428224.41220.89.3841824.02034.868.2220.820.68 −4.69−31.420
35B 7.47.94490225.61135.710.1661536.02114.991.76227.530.85 −4.8−31.180.5
36DW257.412.01708423.122643.964.5153600.03885.353.32313.541.31 −4.35−27.36
37DW37.77.410.63576.4182.161584.021.5051536.02853.765.1254.980.85 −4.58−27.990.3
WPT: Water Point Type; PL: Piezometric Level; DW: Dug Well; B: Borehole. Water 15 01242 i001 Shallow aquifer; Water 15 01242 i002 Deep aquifer.
Table 2. Corrected 14C ages expressed in years with different models.
Sample NoAge
Ao = 100
Age
Tamers
Age PearsonAge
Mook
Age
F. & G.
Age
F. &G. eq
Age
AIEA
Age
Evans
Age Eichinger
Years
22876−2157−2560−4576−257311671747−2807−1972
32271−2607−2494−2017−241711361821−2698−2171
4904637743479210734697417775732164037
711,62065125512−55354759208974651976434
813,302805082239059834512,35212,70380398409
102773−2713−16351997−96326012717−1813−1831
13806228833098385232356846723928403498
144851−637−163164514840374160−380−20
1597754421593110,572683510,07010,28357825492
16723619563973894750707898814238263359
171882−3635−19012820−91322592341−2065−2383
193791−12567865875190245694977656123
212681−2746−10144084331863338−1156−1574
222952−2766−18071515−120226202546−2003−1923
232399−2769−1923835−140019402319−2118−1930
35764722803198598337497157736729803211
374416−457−39161923836444313−21999
Ages in bold represent the AIEA model chosen for the corrected 14C ages calculation.
Disclaimer/Publisher’s Note: The statements, opinions and data contained in all publications are solely those of the individual author(s) and contributor(s) and not of MDPI and/or the editor(s). MDPI and/or the editor(s) disclaim responsibility for any injury to people or property resulting from any ideas, methods, instructions or products referred to in the content.

