
Analysis of the Driving Mechanism of Water Environment Evolution and Algal Bloom Warning Signals in Tai Lake
1
College of Resources and Environment, China Agricultural University, Beijing 100193, China
2
Anrong Credit Rating Co., Ltd., Beijing 100032, China
3
Guangzhou Institute of Geochemistry, Chinese Academy of Sciences, Guangzhou 510640, China
4
State Key Laboratory of Environmental Criteria and Risk Assessment, Chinese Research Academy of Environmental Sciences, Beijing 100012, China
5
Beijing Key Laboratory of Biodiversity and Organic Agriculture, Beijing 102208, China
*
Author to whom correspondence should be addressed.
Water 2023, 15(6), 1245; https://doi.org/10.3390/w15061245
Submission received: 6 January 2023
/
Revised: 3 March 2023
/
Accepted: 7 March 2023
/
Published: 22 March 2023
(This article belongs to the Special Issue Water Environment Pollution and Control)
Abstract
:Understanding the evolution characteristics and driving mechanisms of eutrophic lake ecosystems, especially over long time scales, remains a challenge. Little research on lake ecosystem mutation has been conducted using long-term time series data. In this study, long-term water quality indicators, as well as ecological indexes, natural meteorological factors, and socio-economic indexes, were collected for Tai Lake to enable us to study the environmental evolution of the lake ecosystem. The key time nodes and early warning signals of the steady-state transformation of Tai Lake were also identified, which could provide a theoretical basis for early indication of the transformation of lake ecosystems. Furthermore, the characteristics and driving mechanism of the lake’s ecosystem evolution were analyzed based on the physical and chemical indexes of its sediments and its long-term water quality indexes. The results show that the early warning signals (variance, autocorrelation, and skewness) of ecosystem mutation included abnormal changes 10 years before the steady-state change, and the evolution of Tai Lake was driven by the complex nonlinear effects of biological, physical, chemical, and socio-economic factors in the lake basin. These results have important theoretical and practical value for pollution control and the management of eutrophic lakes.
1. Introduction
Lake ecosystems have a variety of ecological functions and have provided ecosystem services for humans for thousands of years. However, most lakes are experiencing serious ecosystem degradation, which directly leads to a loss of biodiversity and an imbalance in the ecosystem structure and function [1,2]. With the changing climate and increasingly intensive nature of human activity, multiple driving forces interacting with each other have exerted serious damage upon the global natural ecosystem. Therefore, it is important to predict sudden and nonlinear changes in the system [3,4,5,6]. Ecologists have long recognized that ecosystems can exist in one steady state and operate within a predictable range for a long period of time and then suddenly switch to another state [7,8,9,10]. For example, the desertification of grassland, the expansion of shrubs in the Arctic region, the eutrophication of lakes, the acidification of seawater, and the degradation of coral reefs are all real or potential ecosystem mutations that are indicated by tipping points or system thresholds and driven by one or more external driving forces, as well as the internal control variables of the system. This leads to changes in the structure, function, and dynamics of the system [11]. Many scientific studies have shown that the Earth’s system is currently developing along an unsustainable trajectory [12], with shallow lake ecosystems being relatively fragile. The lakes’ low pollution loading capacity and the vulnerability of their water–soil interfaces to external disturbances result in strong material exchange and instability. In addition, in shallow lakes located in areas with intense human activity, it is difficult to fundamentally control external discharge. When the cycle characteristics of the nutrients in lake sediments, the food web structure, and the aquatic environment in the lower layer of a lake are destroyed, changes in the hydrodynamic conditions and the physical and chemical properties of the surface sediments will form a harmful positive feedback loop, thus hindering the process of ecological restoration in the lake [13].
Many studies have been conducted on the basic principles, driving mechanisms, statistical methods, and early indicators of steady-state transition in shallow lakes. Crawford S Holling (1973) studied the ability of ecosystems to respond to stress and proposed the term “resilience” to clarify the nonlinear characteristics of ecosystems to external stress [10]. Robert M May (1977) proposed the multistable state and threshold theory of ecosystems, pointing out that persistent external stress will weaken the resilience of an ecosystem and trigger a homeostatic transition [14]. Carpenter (2011) confirmed that methods such as experimental observation, statistical analysis, and model simulation can be used to identify the driving factors of the steady-state transition of lake ecosystems [15]. Wang Rong (2012) took Erhai Lake in Yunnan Province as an example to discuss the early warning signals of lake ecosystem mutation and revealed that under the strong interference of environmental change, the ecosystem state fluctuated frequently before the occurrence of steady-state transition; he termed this the “flickering” phenomenon [16]. However, due to the relatively scattered nature of the quantitative and long-term observation and research data, and the use of different research scales, key areas, research directions or starting points, and methods, his research conclusions were not completely consistent. Therefore, there is an urgent need for a long-term comprehensive analysis based on a large number of monitoring data. This paper takes the large, shallow Tai Lake as the key research object. We collected long-term ecological data and data on natural meteorological factors and the social economy, as well as other physical, chemical, biological, and comprehensive data, to explore the driving mechanism of water environment evolution.
The continuous monitoring of the water environment in Tai Lake began in the 1980s when it first entered a eutrophication state. Therefore, in order to study the characteristics of ecosystem mutation in Tai Lake, monitoring data from before the 1980s are needed for analysis. There is insufficient research on the evolution characteristics of the lake water environment before the 1980s due to the lack of water quality monitoring data in the 1970s. However, based on the “amplification effect” of environmental information on lake sediments and the orderliness of time records, physical, chemical, and biological information from different historical periods can be obtained by studying lake sediments; moreover, the historical process of ecological environment changes in lakes can be indirectly obtained by analyzing this information. Among a series of lacustrine sediment indicators, paleoecological indicators have been widely used in the study of lake eco-environmental evolution, among which diatoms in sediments are especially suitable for the study of high-resolution environmental change events because of their short life cycle, rapid reproduction, extreme sensitivity to environmental changes in water, and easy preservation in strata [17].
Therefore, in this paper, the evolution of diatom community structure in Tai Lake sediments was used to characterize the evolution process of Tai Lake and identify the key time nodes of steady-state transition. Furthermore, the characteristics of structural transformation and the driving mechanism during the steady-state transition were analyzed in order to provide a scientific basis for determining the steady-state transformation of large shallow lake ecosystems and management of the lake water environment [18,19,20].
2. Materials and Methods
2.1. Study Area
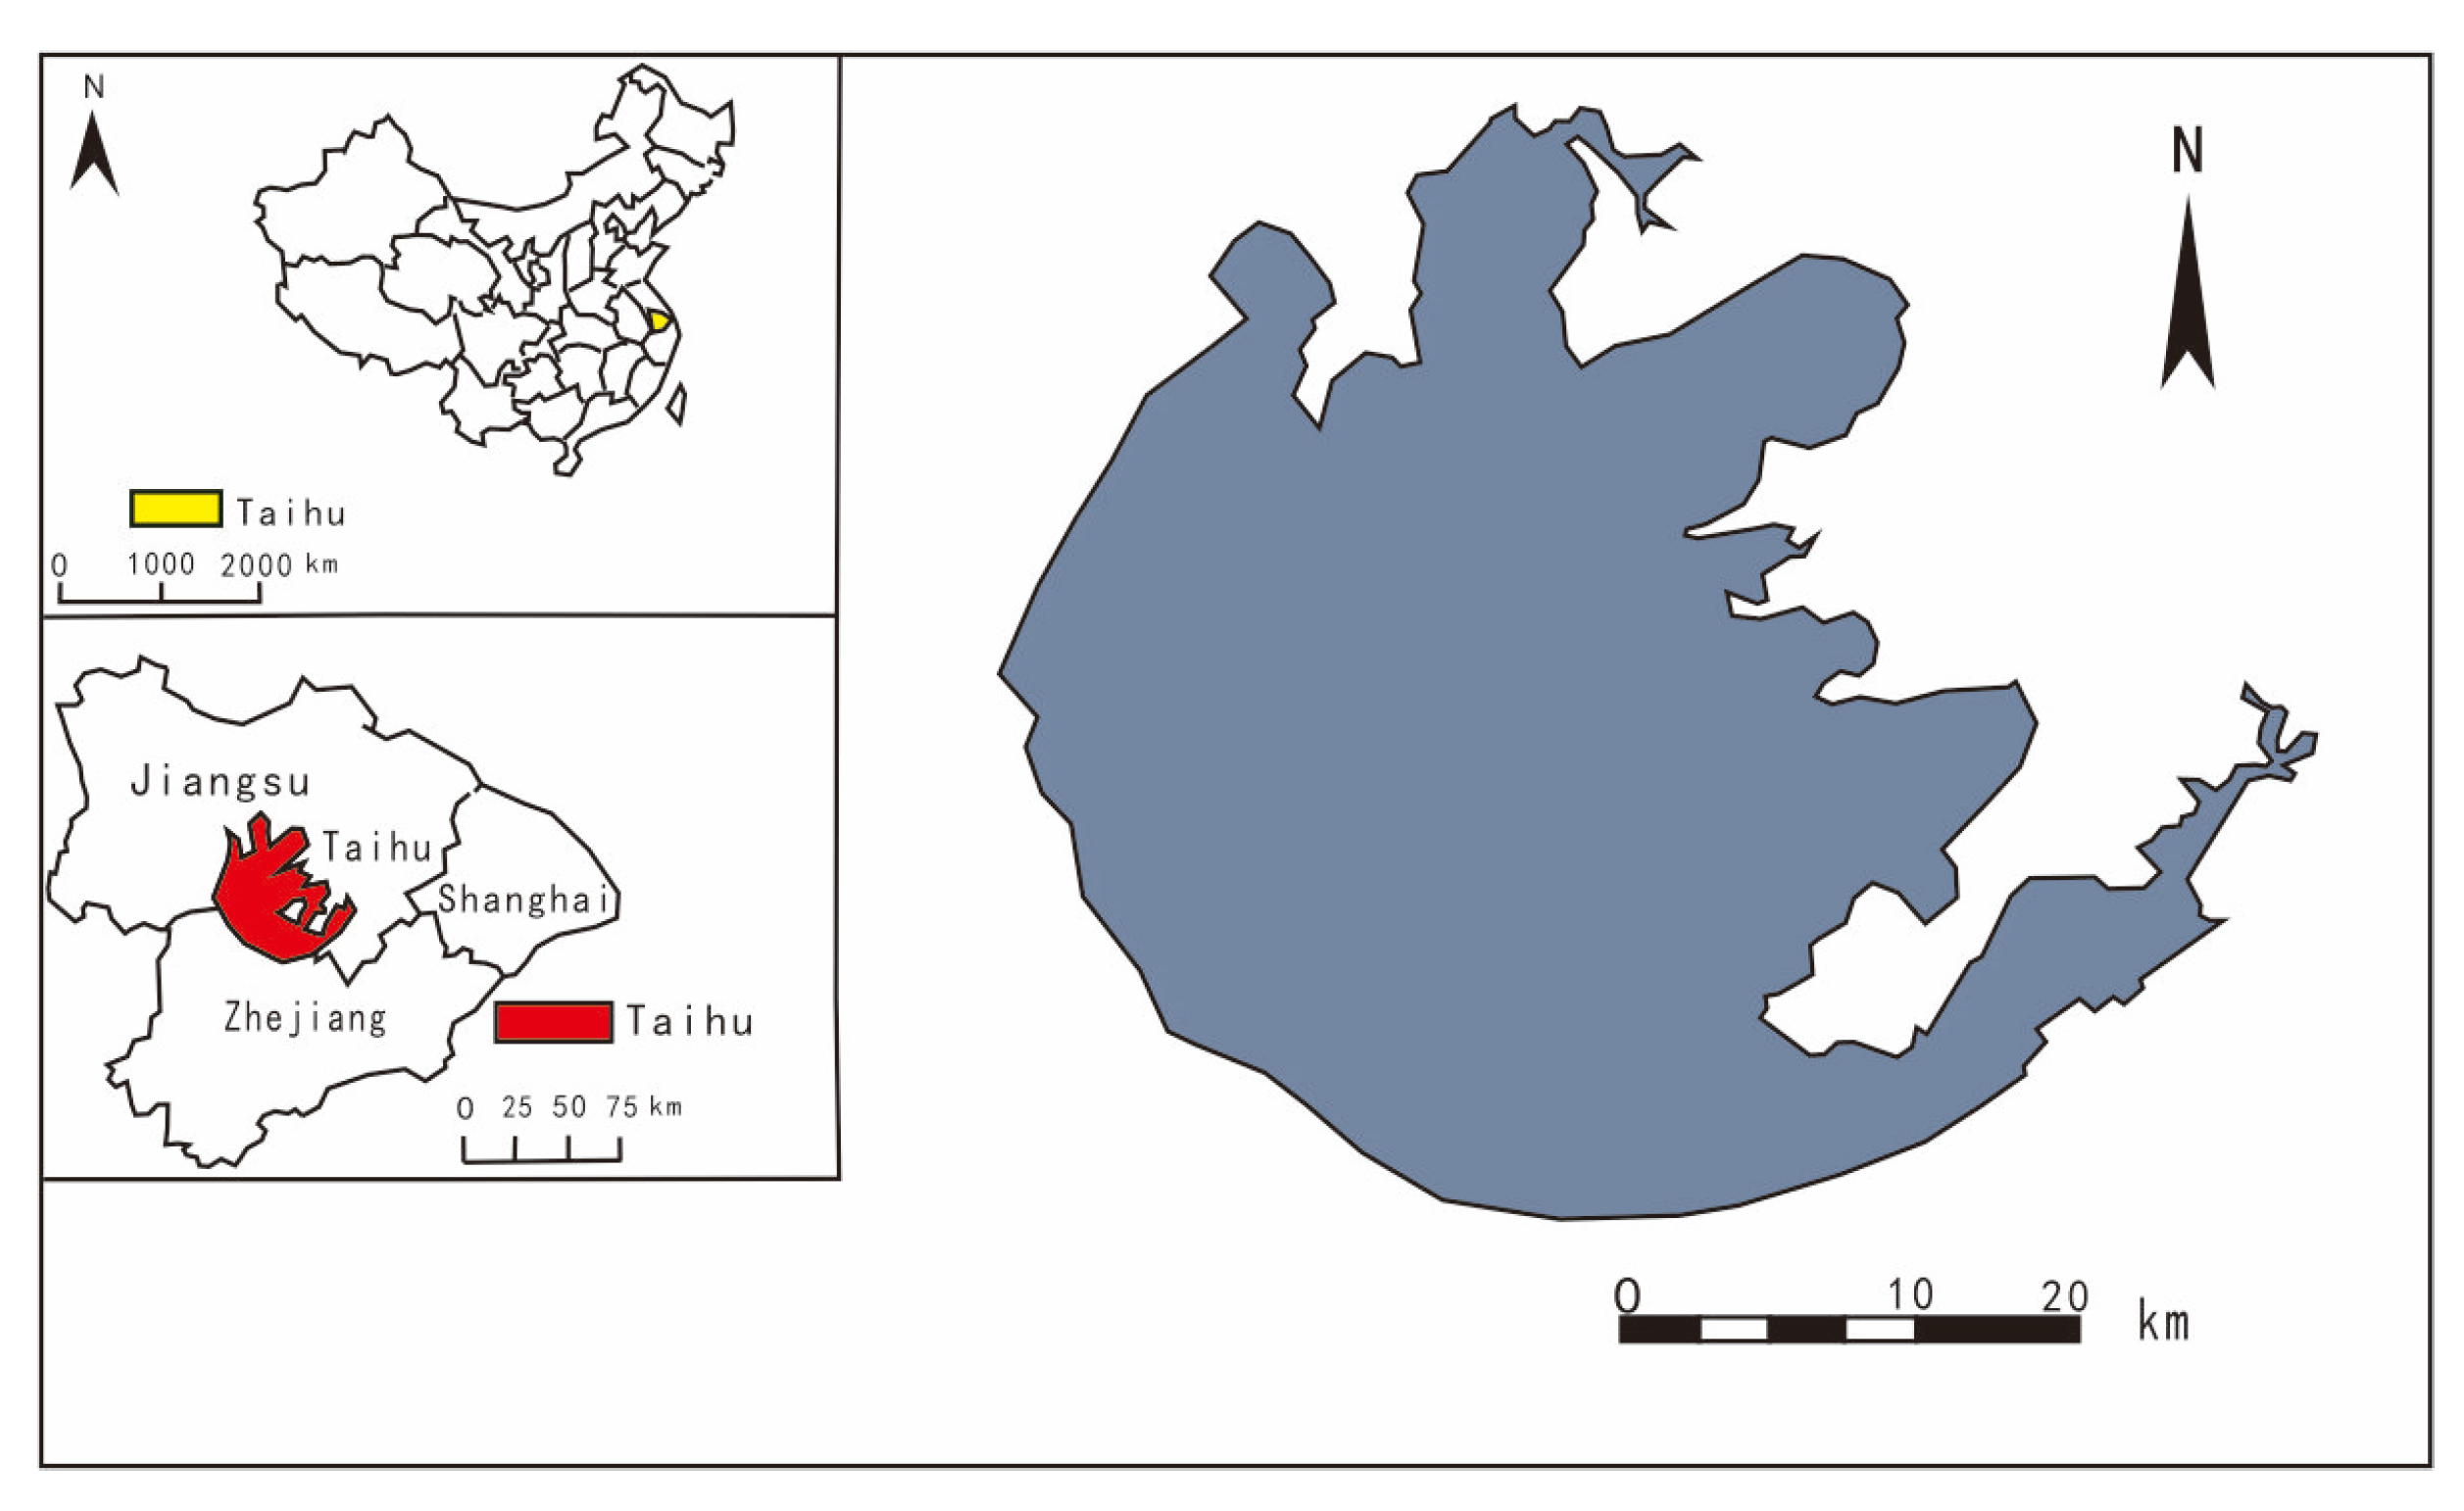
Tai Lake is the third largest freshwater lake in China [21] and is located near the Yangtze River Delta in a subtropical monsoon zone (Figure 1). The catchment area is 36,500 km2, and the lake shoreline is 393.2 km long [22]. The average annual temperature and precipitation are between 16.0 and 18.0 °C and 1100 and 1150 mm, respectively. The lake supplies humans with vital ecosystem services such as agricultural grain production, flood control, fish, tourist tours, shipping, etc. In addition, Tai Lake also acts as a repository for a large quantity of industrial and domestic sewage discharge from nearby cities, villages, and industries due to the rapidly growing economy [23].
2.2. Data Source
2.2.1. Physical and Chemical Indicators of the Water Environment
In this study, water quality indexes such as total phosphorus [TP], total nitrogen [TN], ammonia nitrogen [NH3-N], chlorophyll [Chl-a], 5-day BOD [BOD5], chemical oxygen demand [COD], dissolved oxygen [DO], pH, water temperature [WT], and transparency [SD] were collected from Tai Lake from 1980 to 2012 and sorted. Among them, water quality index data from 1980 to 2000 were obtained from water environmental monitoring data (GEMS/Water) collected by the Global and Regional Environmental Monitoring Coordination Center under the United Nations Environment Program. Data from 2000 to 2012 were collected from the National Ecosystem Observation and Research Network (CNERN). Water quality monitoring data from 2012 to 2017 were obtained from literature published in related fields [24,25], China’s Environmental Status Bulletin of the Ministry of Environmental Protection, and the Tai Lake Health Report of the Taihu Basin Administration of the Ministry of Water Resources.
2.2.2. Aquatic Ecological Indexes
The aquatic ecological indicators were collected from the National Ecosystem Observation and Research Network (CNERN: http://www.cnern.org.cn/data/iitDRsearch?classcode=SYC_A01 (access on 20 October 2022); it is important to note that the time range of the data may change over time) and the Tai Lake Health Report of the Tai Lake Network. The aquatic ecological indicators of Tai Lake in this study mainly include phytoplankton, zooplankton, benthic animals, macro-aquatic plants, and bacteria. The first principle component analysis (PCA1) results on the presence of algae in Tai Lake sediments were obtained from the literature [26]; the TOC (%), TN (%), and C/N data on sediments were obtained from the literature [27]; and data on the abundance of Bosimina spp were obtained from the literature [28].
2.2.3. Meteorological Factors
Meteorological element data were collected from the National Ecosystem Observation and Research Network (CNERN) and provided by the Meteorological Data Room of the National Meteorological Information Center, China Meteorological Administration. These data included rainfall, wind speed, and temperature indicators.
2.2.4. Hydrological Data
The data on hydrological elements (which mainly refer to water level) were collected from the National Ecosystem Observation and Research Network (CNERN), and daily water level data were recorded at five water stations in the Tai Lake area: Wangting, Dapukou, Jiapu, Xiaomeikou, and Dongting, Xishan.
2.2.5. Socio-Economic Indicators
Data on China’s annual grain production and fertilizer use from 1960 to 2013 were downloaded from: http://www.earthpolicy.org/data_center/C24.html (access on 20 October 2022).
2.3. Data Analysis and Processing
In this paper, STARS (Sequential T-test Algorithm for Analyzing), proposed by Rodionov [29], was used to analyze the statistical mutation of the mean level and amplitude of fluctuation of the evolution of the diatom community structure PCA1, and the abundance of the clean-tolerant species Bosmina, using a 10-year cutoff length (p < 0.01). The abundance of PCA1 and Bosmina spp in the sediments was calculated using Z-scores, which further supported the detection results regarding the mutation point of the lake ecosystem. Gaussian kernel density estimation of the PCA1 time series was conducted using R software to obtain a bimodal curve, which confirmed the existence of bistability in the ecosystem. Furthermore, an Autoregressive Integrated Moving Average (ARIMA (p, d, q)) model of the time series before PCA1 mutation was fitted using R software using the Stats program package, which was downloaded from http://www.r-project.org/ (access on 20 October 2022). Based on the minimum value of the Akaike Information Criterion (AIC), the optimal model was selected to predict the evolution process of the PCA1 time series from 1850 to 1960, and the predicted values were compared with the actual observed values. In addition, single exponential smoothing was conducted using Minitab software to detrend the PCA1 time series and lake sediments before the mutation. Then, the first-order lag autocorrelation coefficient, standard deviation, and skewness were calculated based on the detrended residuals with a 4-year moving window to assess changes in the elasticity of the lake ecosystem. Furthermore, SPSS statistical software was used to create a simple regression model and a multiple linear regression model and to verify the hypothesis that non-stationary driving factors lead to changes in the ecosystem.
3. Results and Discussion
3.1. Historical Records of Response Variables and Environmental Driving Factors in the Sediment of the Tai Lake Ecosystem
Continuous monitoring of the water environment in Tai Lake began in the 1980s, and during this time, the understanding of water environment evolution was insufficient. In view of the “amplification” effect of environmental information on sediments, spatial statistical representativeness, and chronological orderliness, this paper analyzes the evolution processes of the sedimentary environment and anthropogenic pollution in Tai Lake by combining geochemical records of sedimentary cores with dating data. Based on this analysis, we were able to reconstruct and analyze the historical evolution of the water environment in Tai Lake. The time series of the abundance of the diatom community PCA1 showed a downward trend from around 1960, with a sharp decline in 1970 (Figure 2a). The abundance of Bosmina spp increased 1.3-fold from the 1950s to the 1970s and began to decrease rapidly in the 1970s; following this, the abundance of Bosmina spp in the sediments decreased sharply and nearly disappeared in the 2000s, which indicates that the water environment of Tai Lake deteriorated quickly from the 1970s (Figure 2b). Furthermore, the amount of TOC in the sediments of Tai Lake increased rapidly from 1970 to 2000 and nearly doubled. Meanwhile, the content of TN increased slowly from 1950 to 1970 and then decreased by 5% from 1970 to 1979, followed by a rapid increase of 10% from 1979 to 2000 (Figure 2c); this is consistent with the strengthening of agricultural economic activity in the Tai Lake basin and indicates that the extensive application of farmland fertilizers is an important contributor to the total nitrogen in lake sediments [22]. Since the 1970s, the nutrient contents in the sediments of Tai Lake have increased rapidly, and the quality of the water environment has deteriorated remarkably. In addition, since 1970, the C/N ratio in the sediment has also increased significantly (Figure 2d); combined with the variation in TOC and TN, this indicates that before the 1970s, the carbon and nitrogen cycles were in a balanced state, and occurred mainly in the internal cycle of the system. During this time, the trophic status of the lake was still within the threshold before the occurrence of its mutation. After the 1970s, with the significant increase in the proportion of exogenous organic matter in the lake sediments, the balance of carbon and nitrogen was disturbed, and Tai Lake gradually became eutrophic.
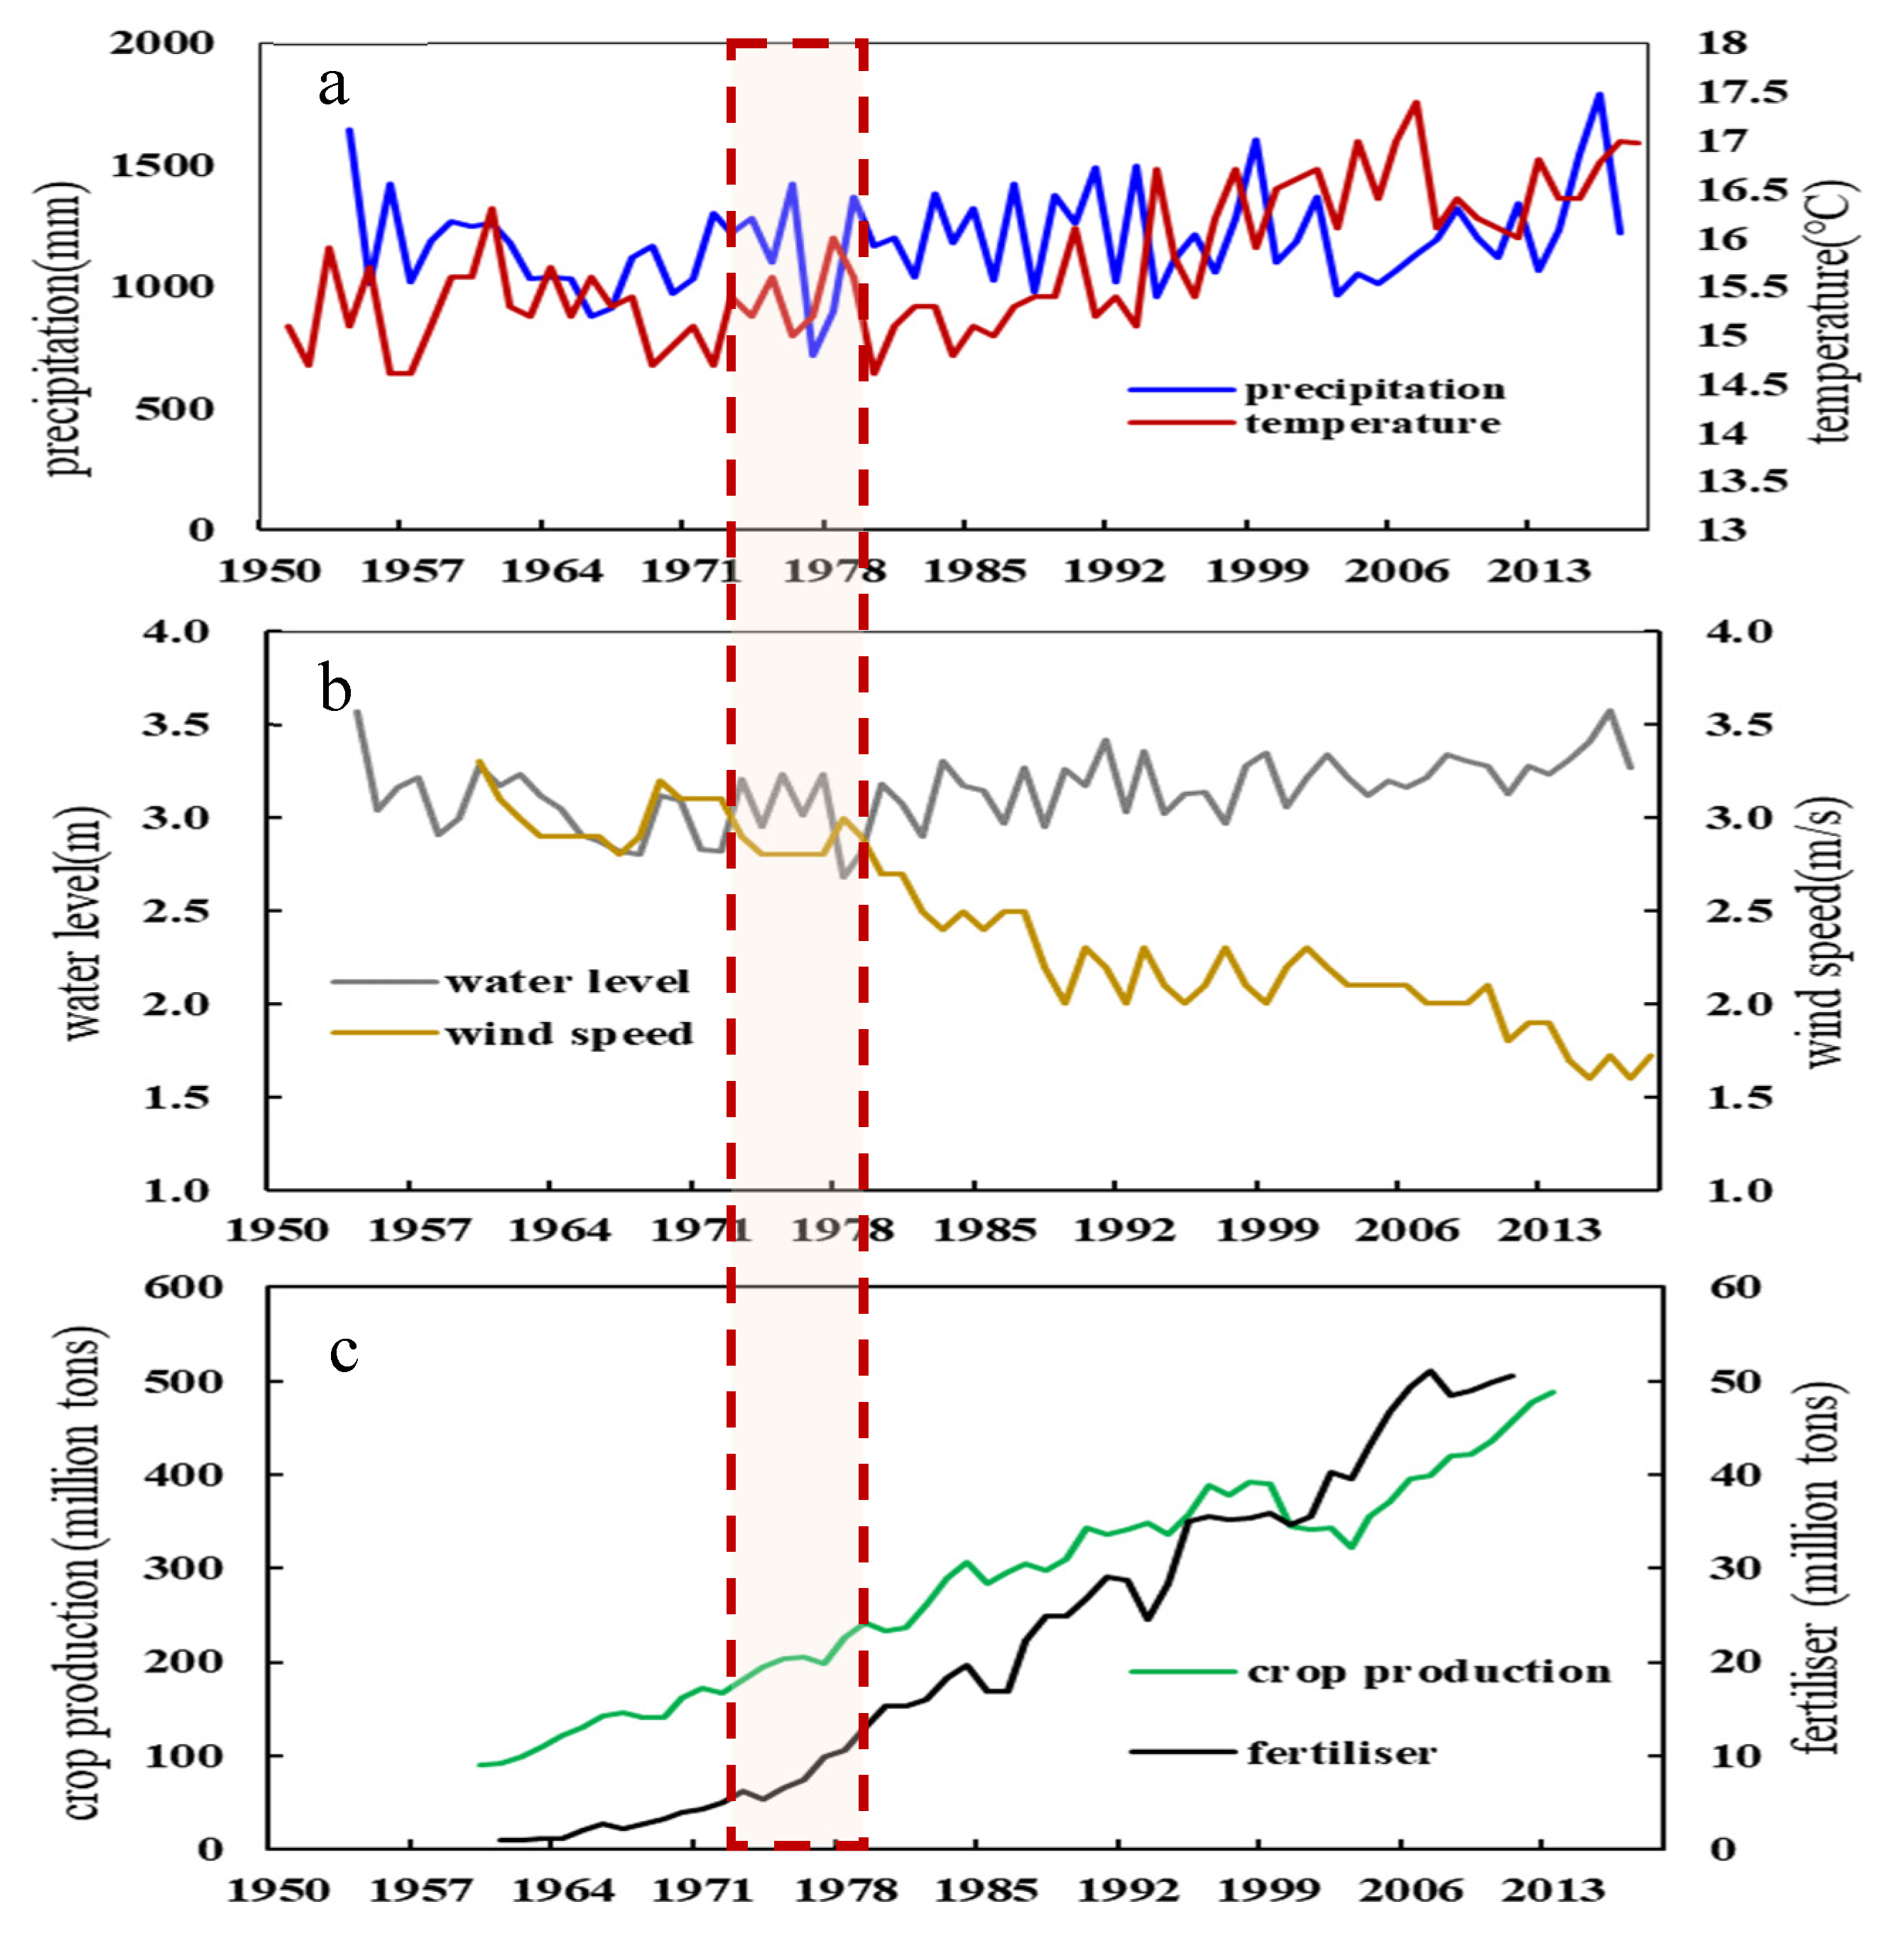
From 1951 to 1970, historical records of natural driving factors in the Tai Lake basin show that the temperature and rainfall decreased from 15.1 °C and 1650 mm to 14.9 °C and 970 mm, respectively (Figure 3a), while from 1970 to 2017, the temperature and rainfall increased significantly (p < 0.01). Since 1970, the 2-min average wind speed, which can affect the chemical and biological processes in Tai Lake, has decreased year by year (from 3.1 m/s to 1.72 m/s in 2018) (Figure 3b). With wind speed gradually decreasing, vertical disturbance in the lake has gradually weakened, which has slowed the increase in nutrients in the water body, thus alleviating the eutrophication process. In addition, the lake water level decreased from 3.58 m in 1954 to 3.1 m in 1970 and then gradually increased (Figure 3b) to 3.58 m in 2016. Furthermore, the annual average grain output and fertilizer use in China has increased rapidly since 1970. By 2011, fertilizer use had increased 49.5-fold (Figure 3c), and by 2013, grain output had increased 4.42-fold. The intensive development of agriculture has led to the discharge of a large number of nutrients into the lake, thus causing continuous deterioration of its environment.
3.2. Detection and Evidence of Mutation in the Tai Lake Ecosystem
Based on the comprehensive analysis of sediment data, water level, meteorology, and other natural factors in the Tai Lake basin (Figure 2 and Figure 3), we can deduce that the algal community structure changed significantly after the 1970s. The exogenously driven historical record (the 1950s) shows that the structural evolution of the algal community, which began in the 1960s, has changed in line with the nutrient loading of the lake due to agricultural intensification, which is a slow-driving variable that takes effect over decades (Figure 3c). In addition, the rapid driving variables, comprising the short-term regulation of lake water levels and short-term water volume changes caused by low rainfall from 1950 to 1970, have jointly triggered the transformation of the Tai Lake ecosystem. With an increased nutrient concentration in the lake (Figure 2c), its productivity is increased, and the dissolved oxygen in the water body is decreased; this results in the release of bioavailable phosphorus into the water body of Tai Lake from its upper sediments, which further aggravates eutrophication [30]. Although the water level of Tai Lake increased in 1980 (Figure 3b), the diatom community did not show signs of recovery until 1998 due to the occurrence of positive feedback in the eutrophication process.
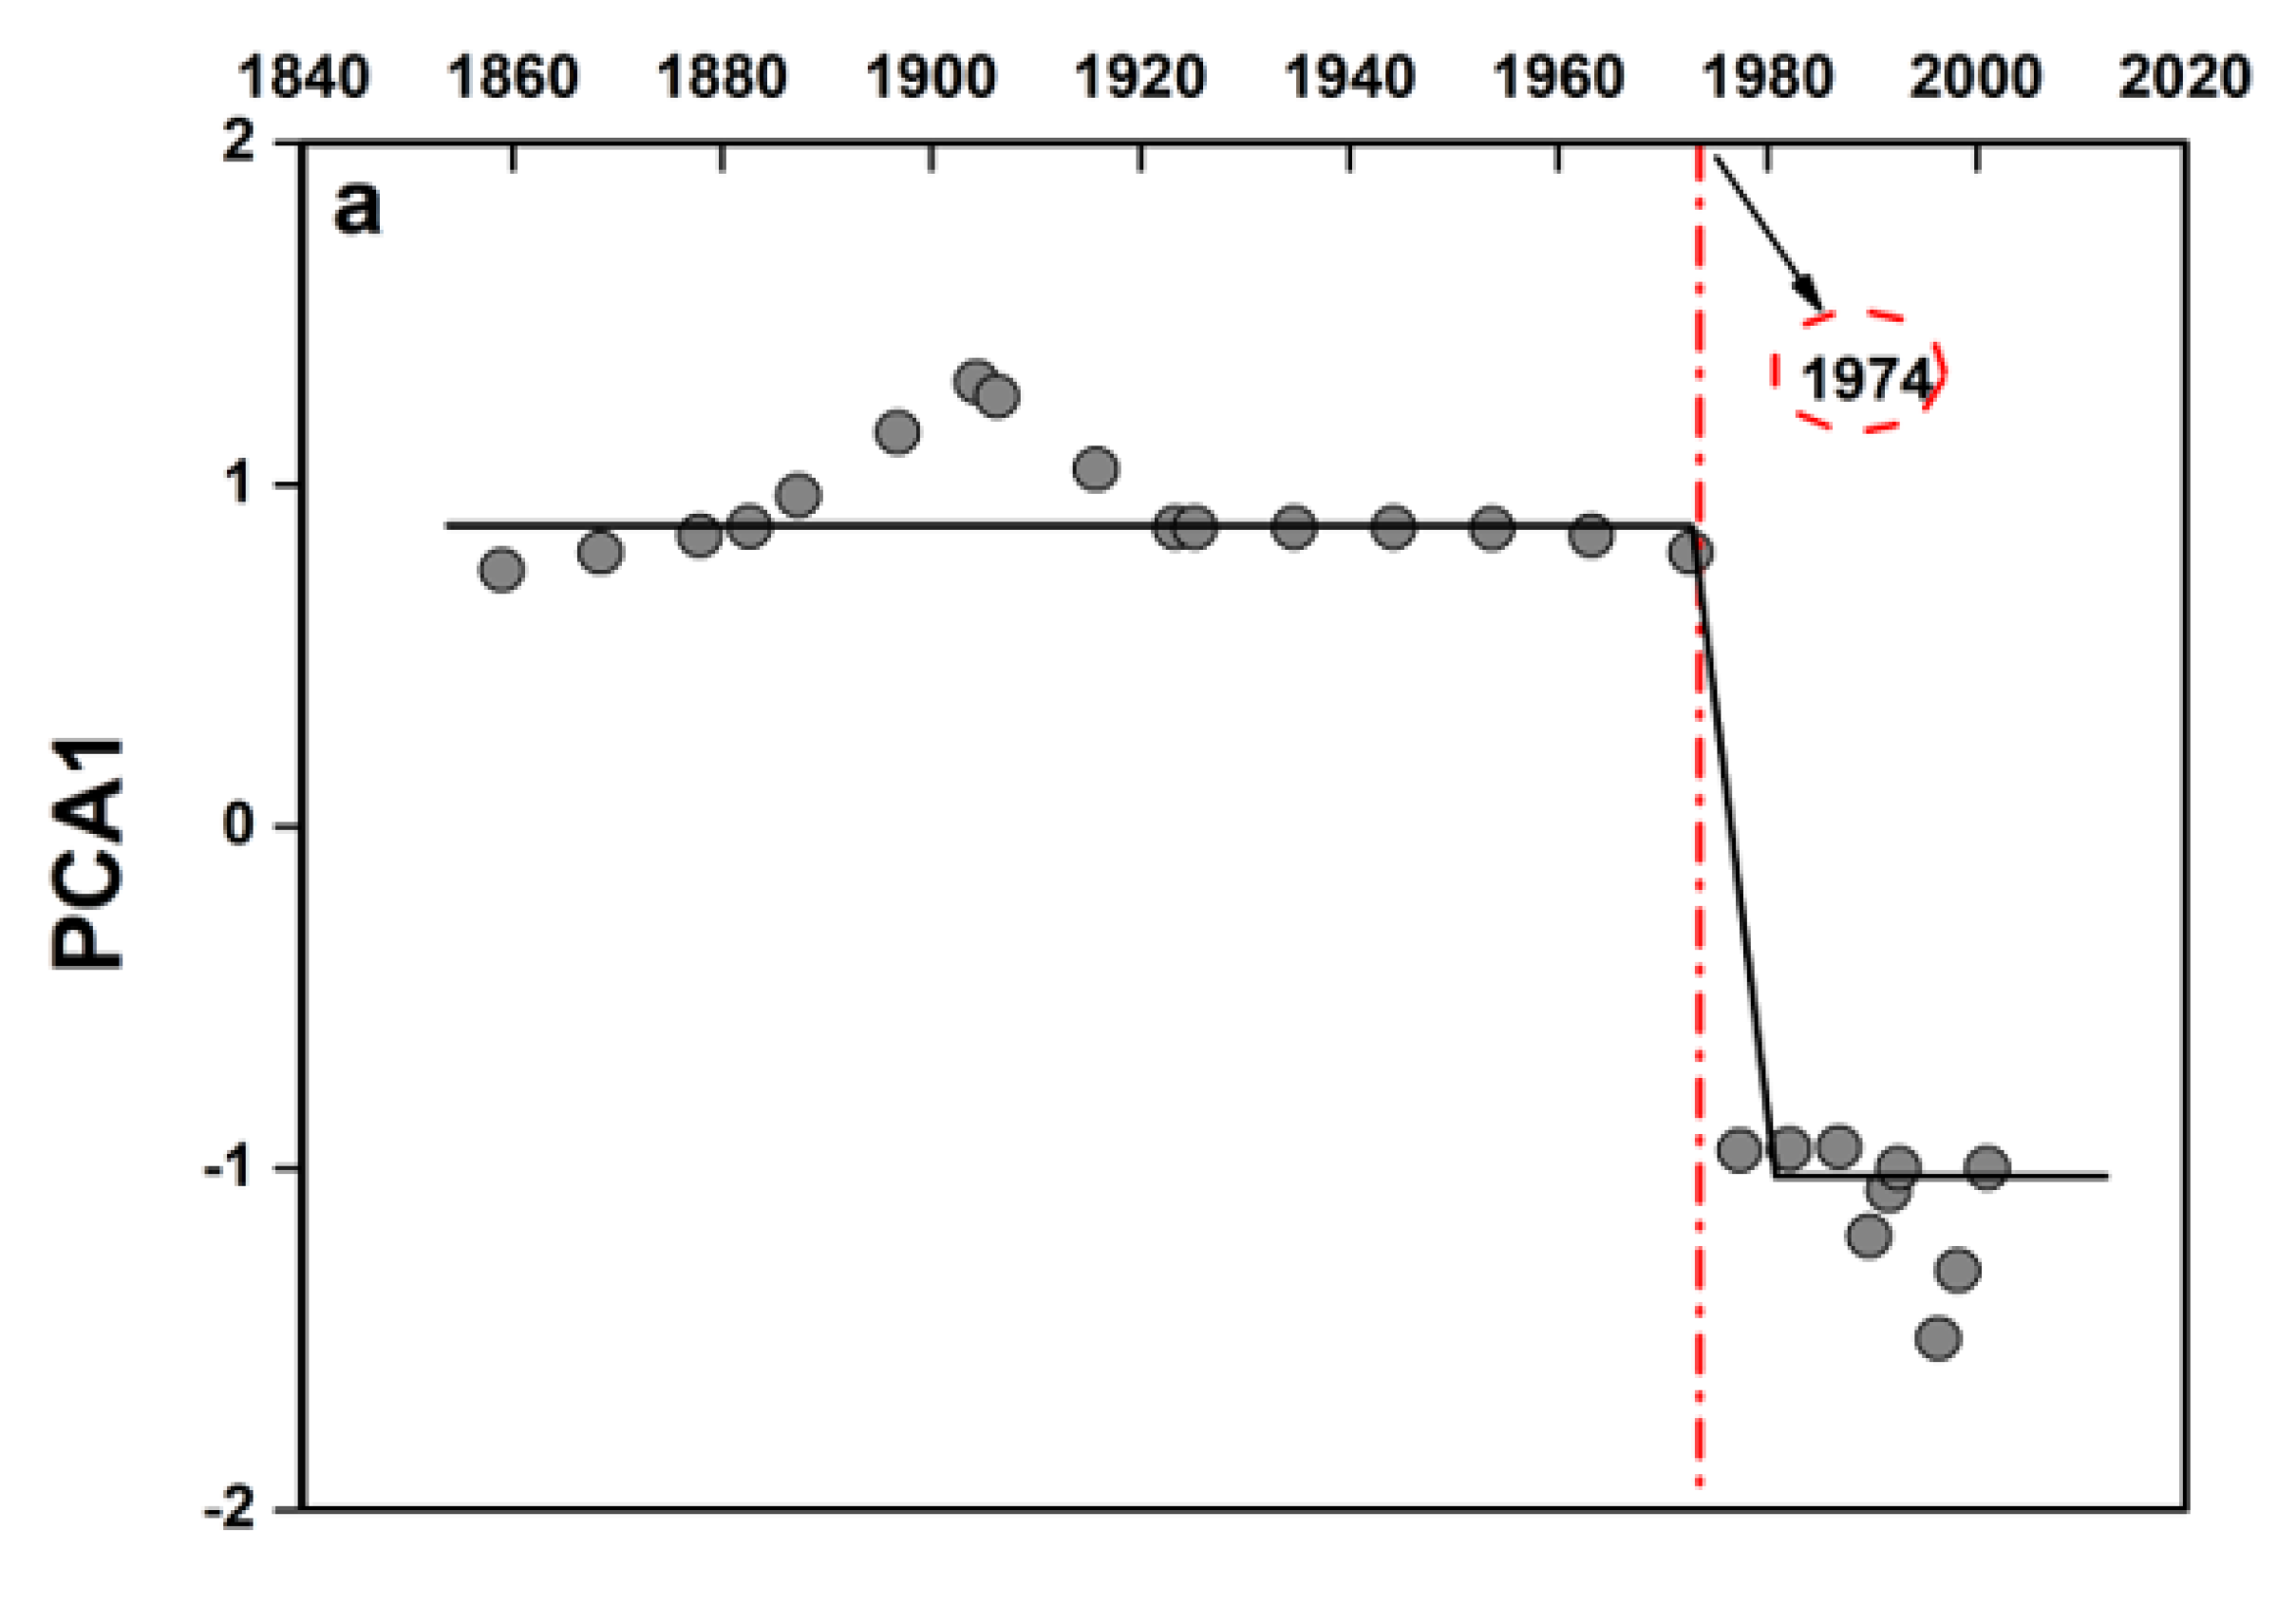
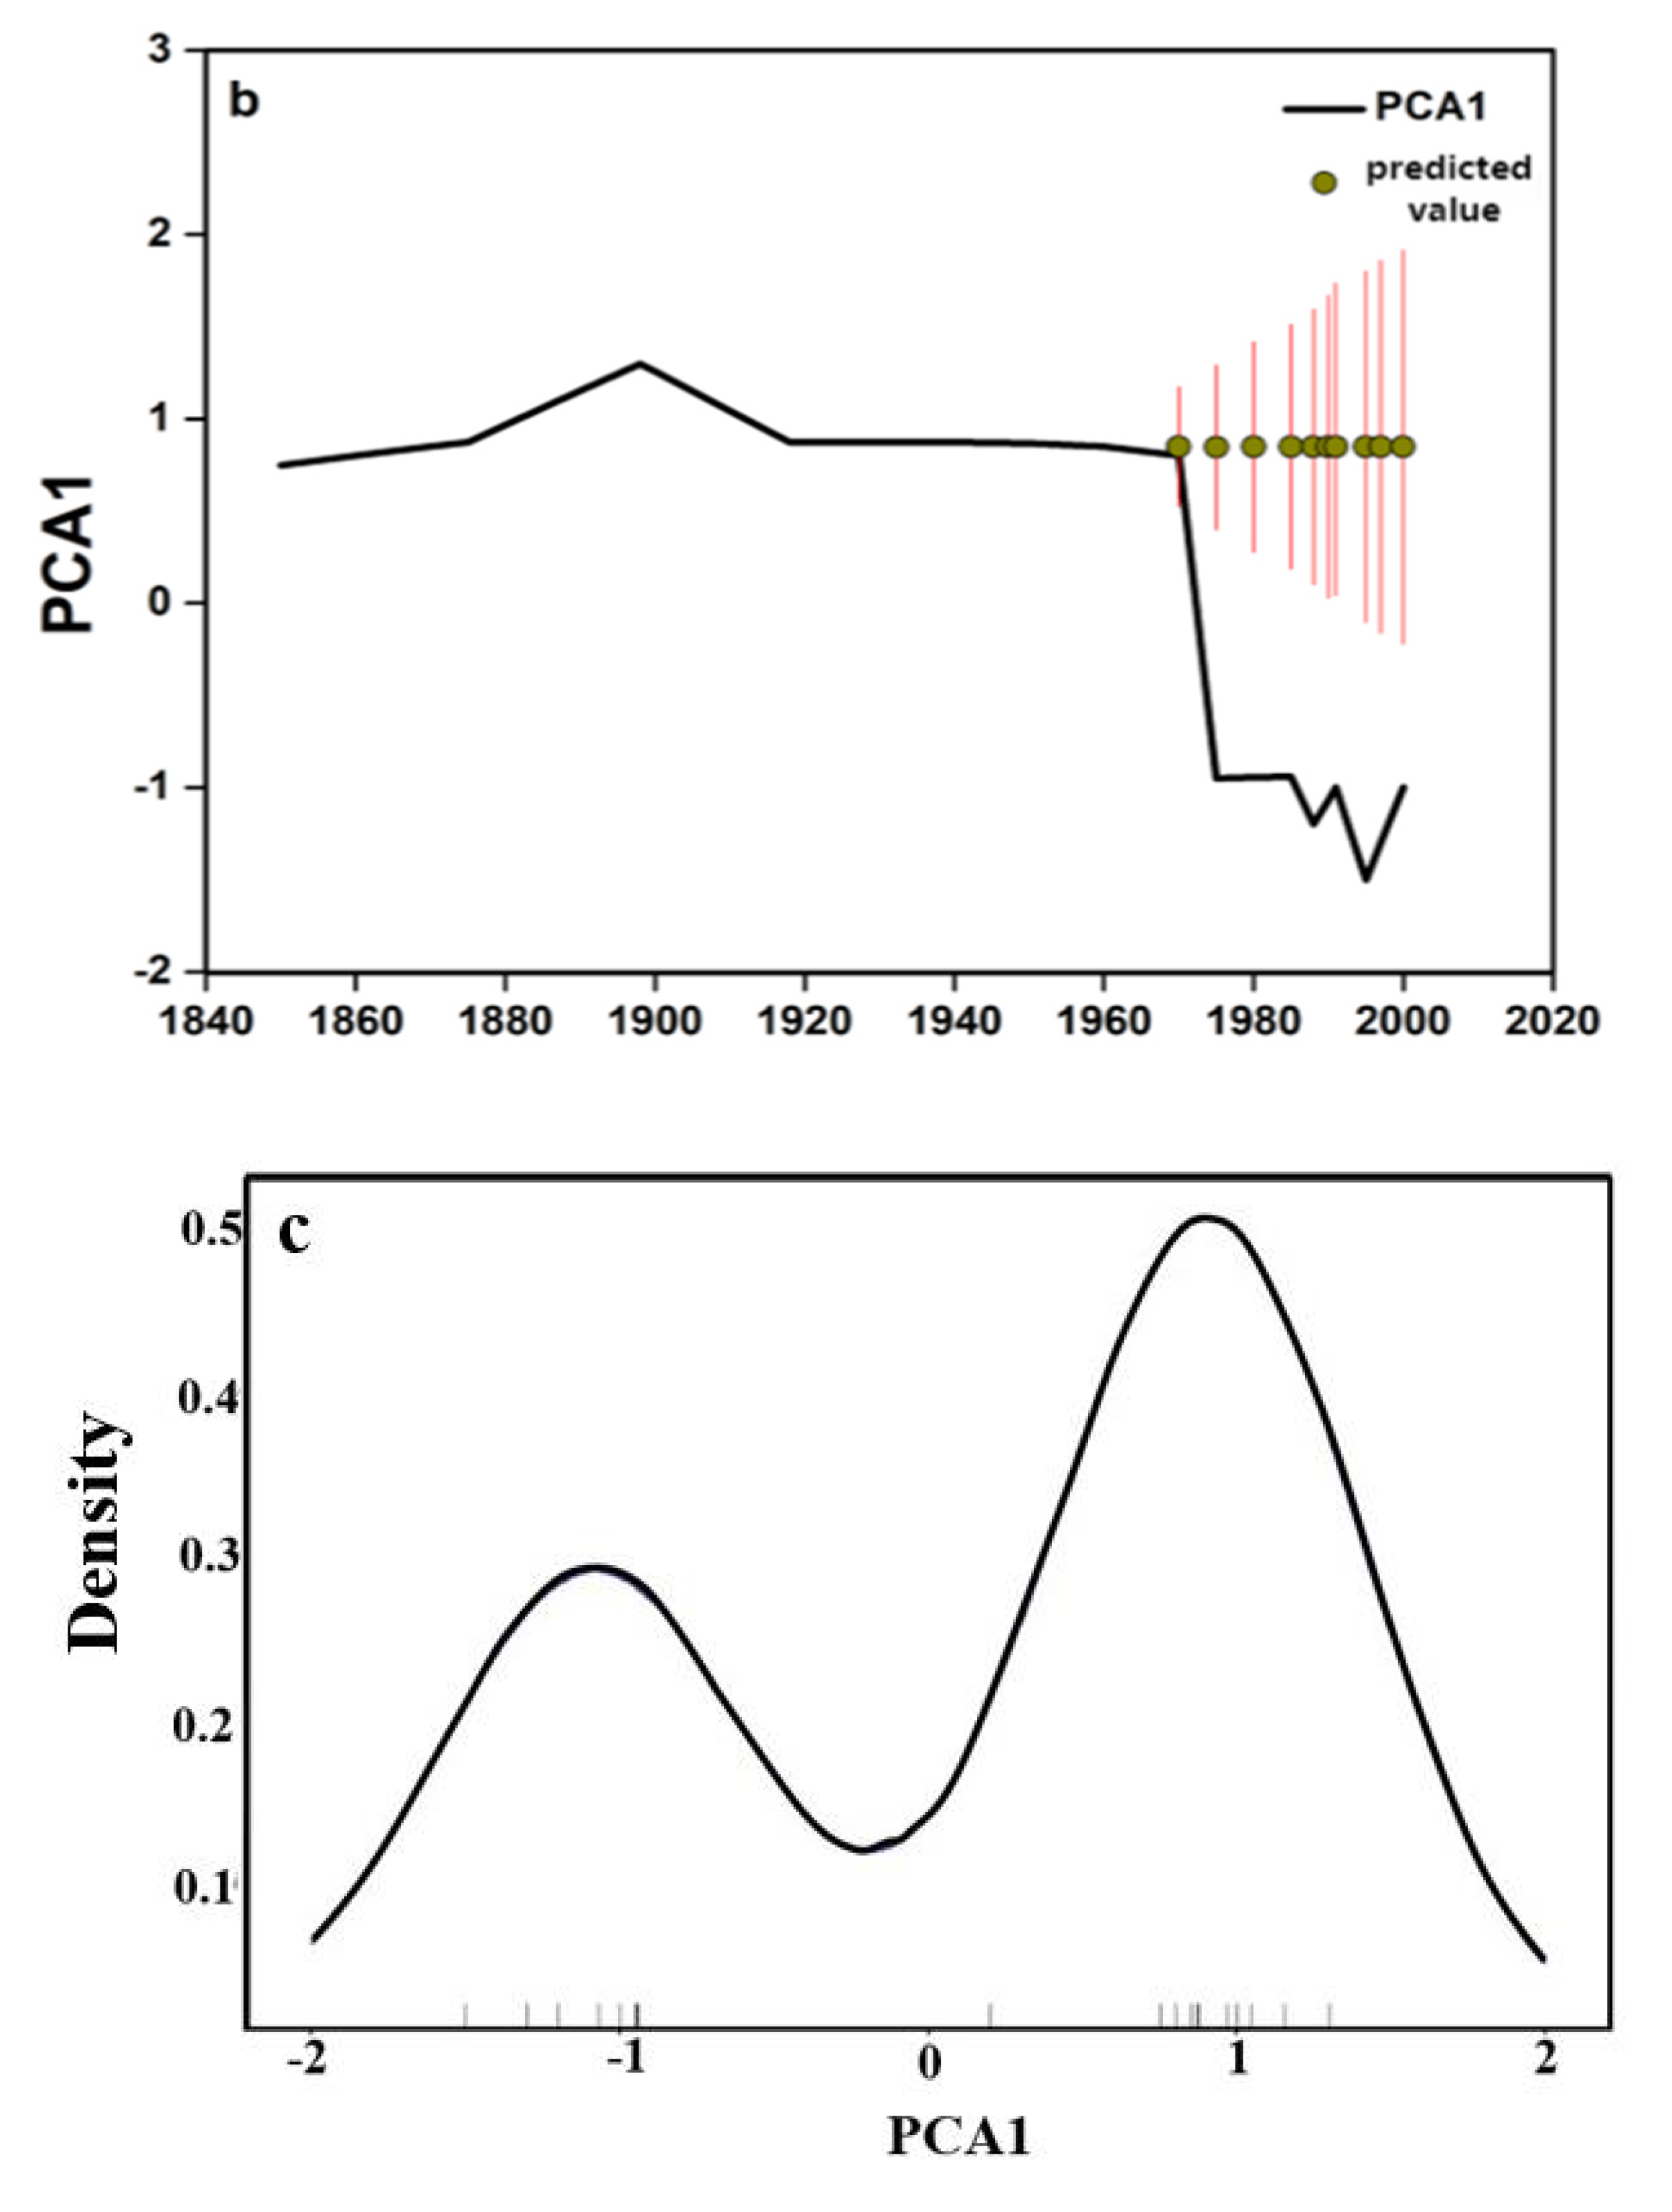
The results of STARS mutation detection show that there was a downward mutation in the PCA1 time series in 1974 (Figure 4a). In order to further prove the existence of the mutation point, a set of autoregressive integrated moving average (ARIMA (p, d, q)) models were fitted using the Stats package of R software, where p is the autoregressive (AR) order, q is the moving average (MA) order, and d is the differential part of the 1850–1960 PCA1 time series. Based on the minimum Akaike information criterion (AIC), the evolution process of the PCA1 time series from 1970 to 2000 was predicted, and ARIMA (1,1,2) was selected as the optimal model for the PCA1 time series (Table 1). The predicted values for 1970–2000 (red lines represent 95% confidence intervals), observed values (solid black lines), and predicted values (circles) are significantly different within the 95% probability level (Figure 4b); this indicates that the abrupt change observed in the 1970s cannot be predicted by a linear model, further proving the existence of an ecosystem break point. Furthermore, the value of PCA1 decreases dramatically from about 0.9 to −0.9 (Figure 4a). Compared with Figure 4b, it can be seen that in the absence of strong external interference, the value should have been within the predicted range instead of the mutation range. In addition, the probability density function (Gaussian kernel density estimate) from 1850 to 2000 indicates the existence of bistability in the ecosystem, with short vertical bars indicating the density of individual points (Figure 4b). This indicates that the ecosystem of Tai Lake has undergone dramatic mutation in the past 150 years, with a significant increase in eutrophic planktonic diatoms in its sediments [26] and a rapid decrease in the clean-tolerant species Bosmina spp. (Figure 4c). Overall, these results indicate that the ecosystem of Tai Lake underwent large-scale mutation and rapid reorganization in the 1970s.
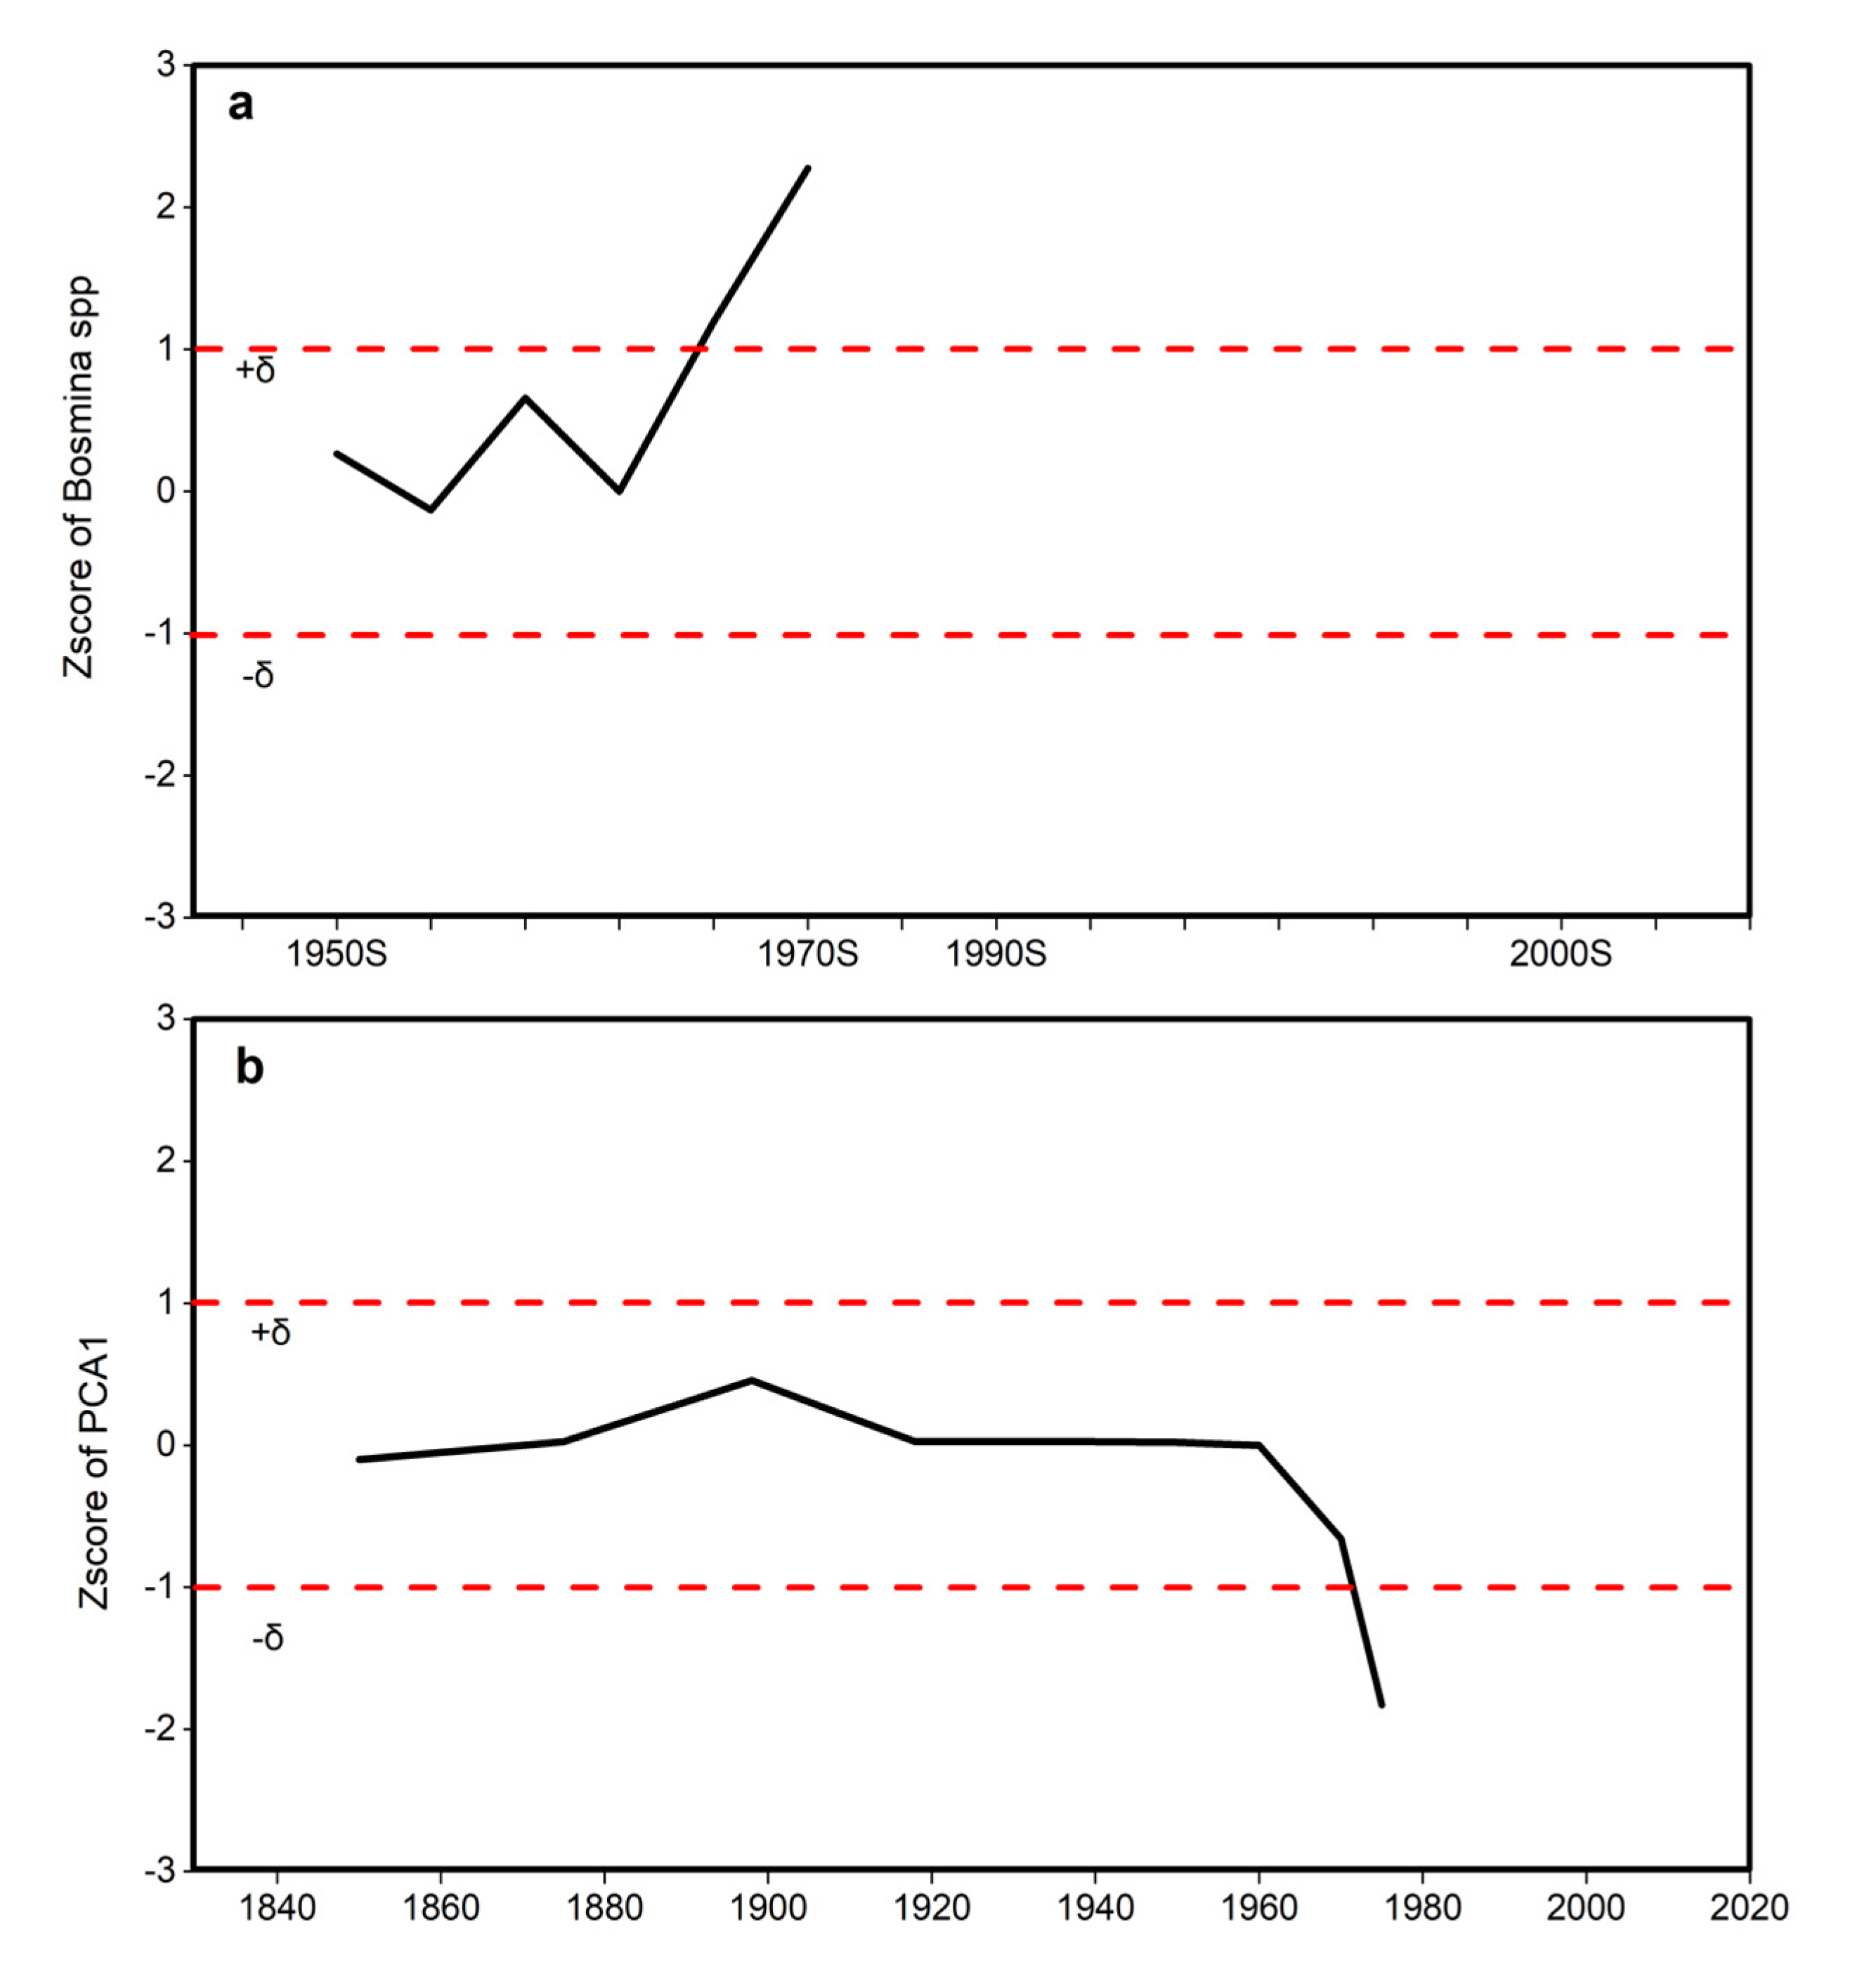
In addition, the PCA1 and Bosmina spp. data were normalized based on their means and standard deviation using the function Z-score (X) in MATLAB software. The obtained Z-score values indicate the variability of the PCA1 and Bosmina spp. time series data. Before the 1970s, the Z-score value fluctuates within a relatively low range of one standard deviation, and a sudden jump occurs in the 1970s, exceeding the range of one standard deviation, indicating that the state of the Tai Lake ecosystem suddenly changed in the 1970s (Figure 5).
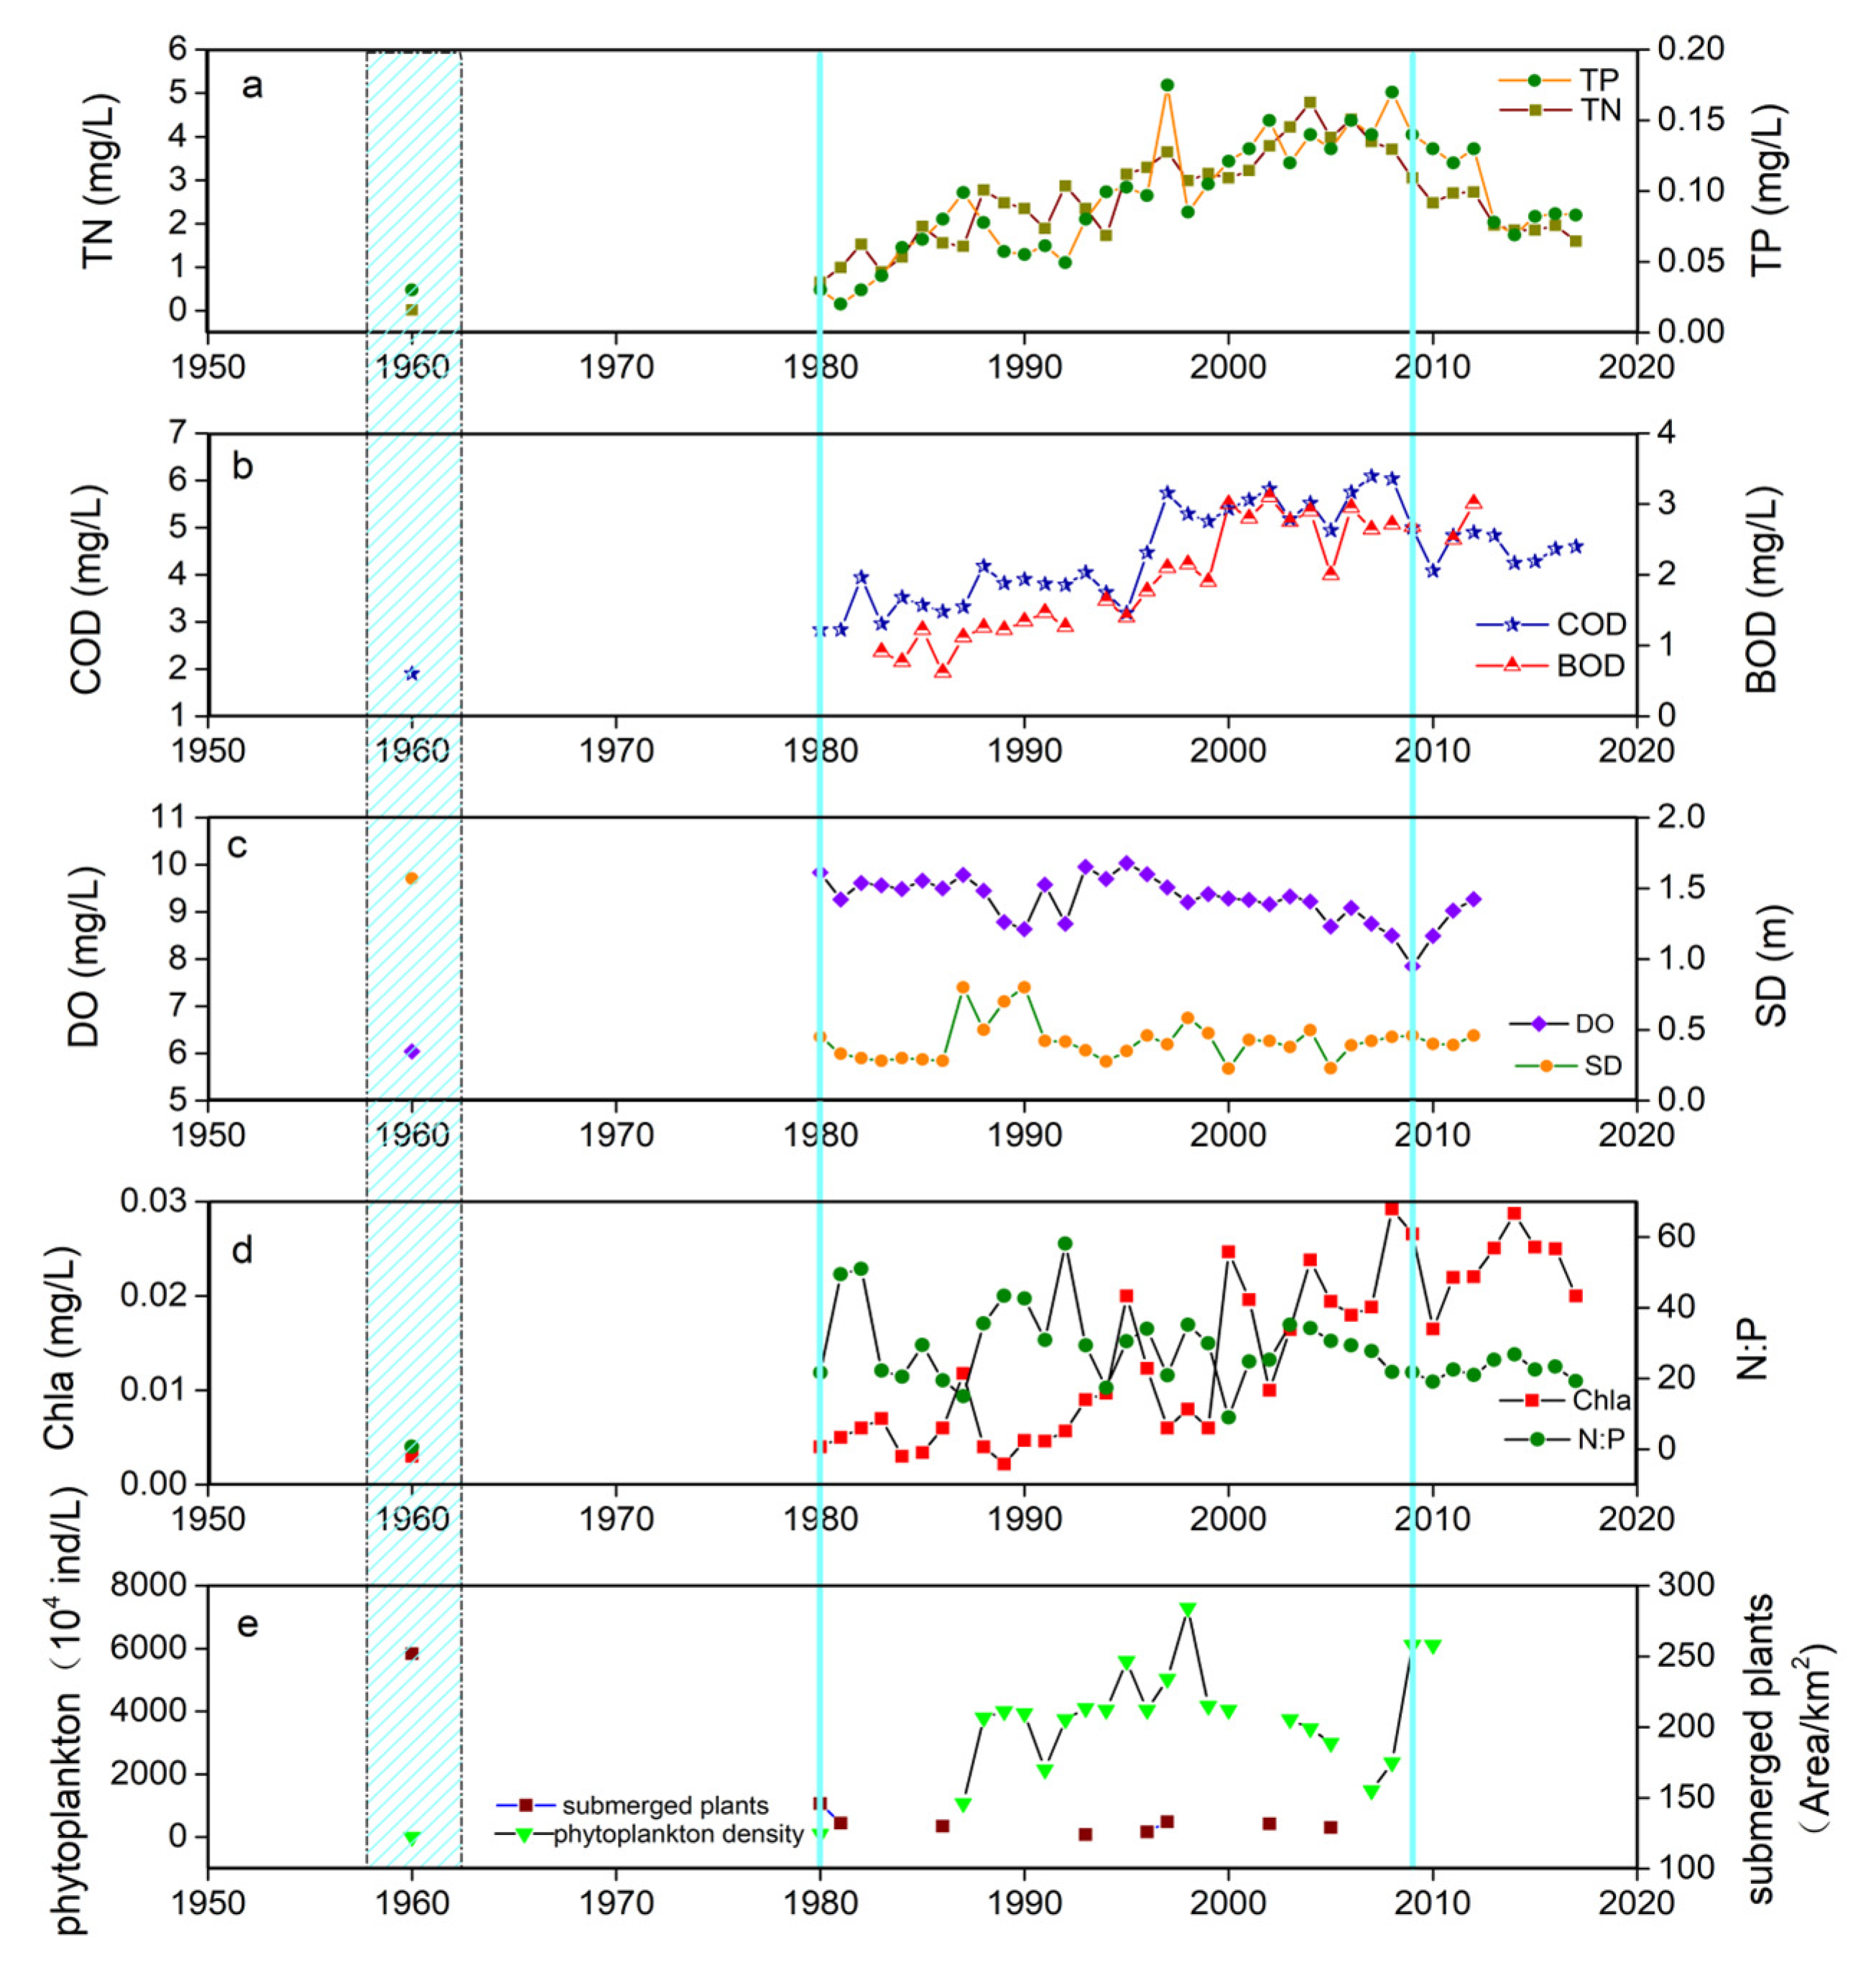
In 1960, the transparency of Tai Lake was 1.57 m, which decreased to 0.45 m in 1980. At the same time, the area covered by submerged macrophytes decreased from 252 km2 to 146 km2, while the chlorophyll concentration increased from 0.003 mg/L to 0.004 mg/L. Meanwhile, COD content increased from 1.9 mg/L to 2.83 mg/L. This shows that in 1960, the water quality of Tai Lake was good, the ecological environment was not affected by large-scale external stress, and the water environment was still undergoing natural evolution. By 1980, water quality monitoring results showed that Tai Lake had entered a stable state of eutrophication (Figure 6). This indicates that the water environment of Tai Lake underwent a steady-state transition during the 1970s, changing from a natural evolution state to a disordered state. By 1980, the ecosystem of Tai Lake had completed its steady-state transition (Figure 6).
In order to further exclude the possibility of PCA1 time series mutation caused by non-stationary external stress, a regression model was used to test our hypothesis. The results of the multiple linear regression analysis for 1950–2000 (including the potential mutation point of the 1970s) (Table 2) show that rainfall, temperature, wind speed, fertilizer, water level, and grain yield do not provide a clear explanation for the changes in linear relationships with the PCA1 time series (none were significant at a probability level of p ≤ 0.05). In our simple linear regression model (Table 2), only wind speed, fertilizer, and grain yield showed significant statistical significance, but the relationship between wind speed and PCA1 was a counterintuitive negative correlation, which was difficult to explain using a simple causal relationship. Therefore, the mutation of the Tai Lake ecosystem could be a critical transition phenomenon caused by a series of complex nonlinear interactions, internal and external feedback of the ecosystem, and internal threshold crossing.
3.3. Extraction of Potential Early Warning Signals of Ecosystem Mutation
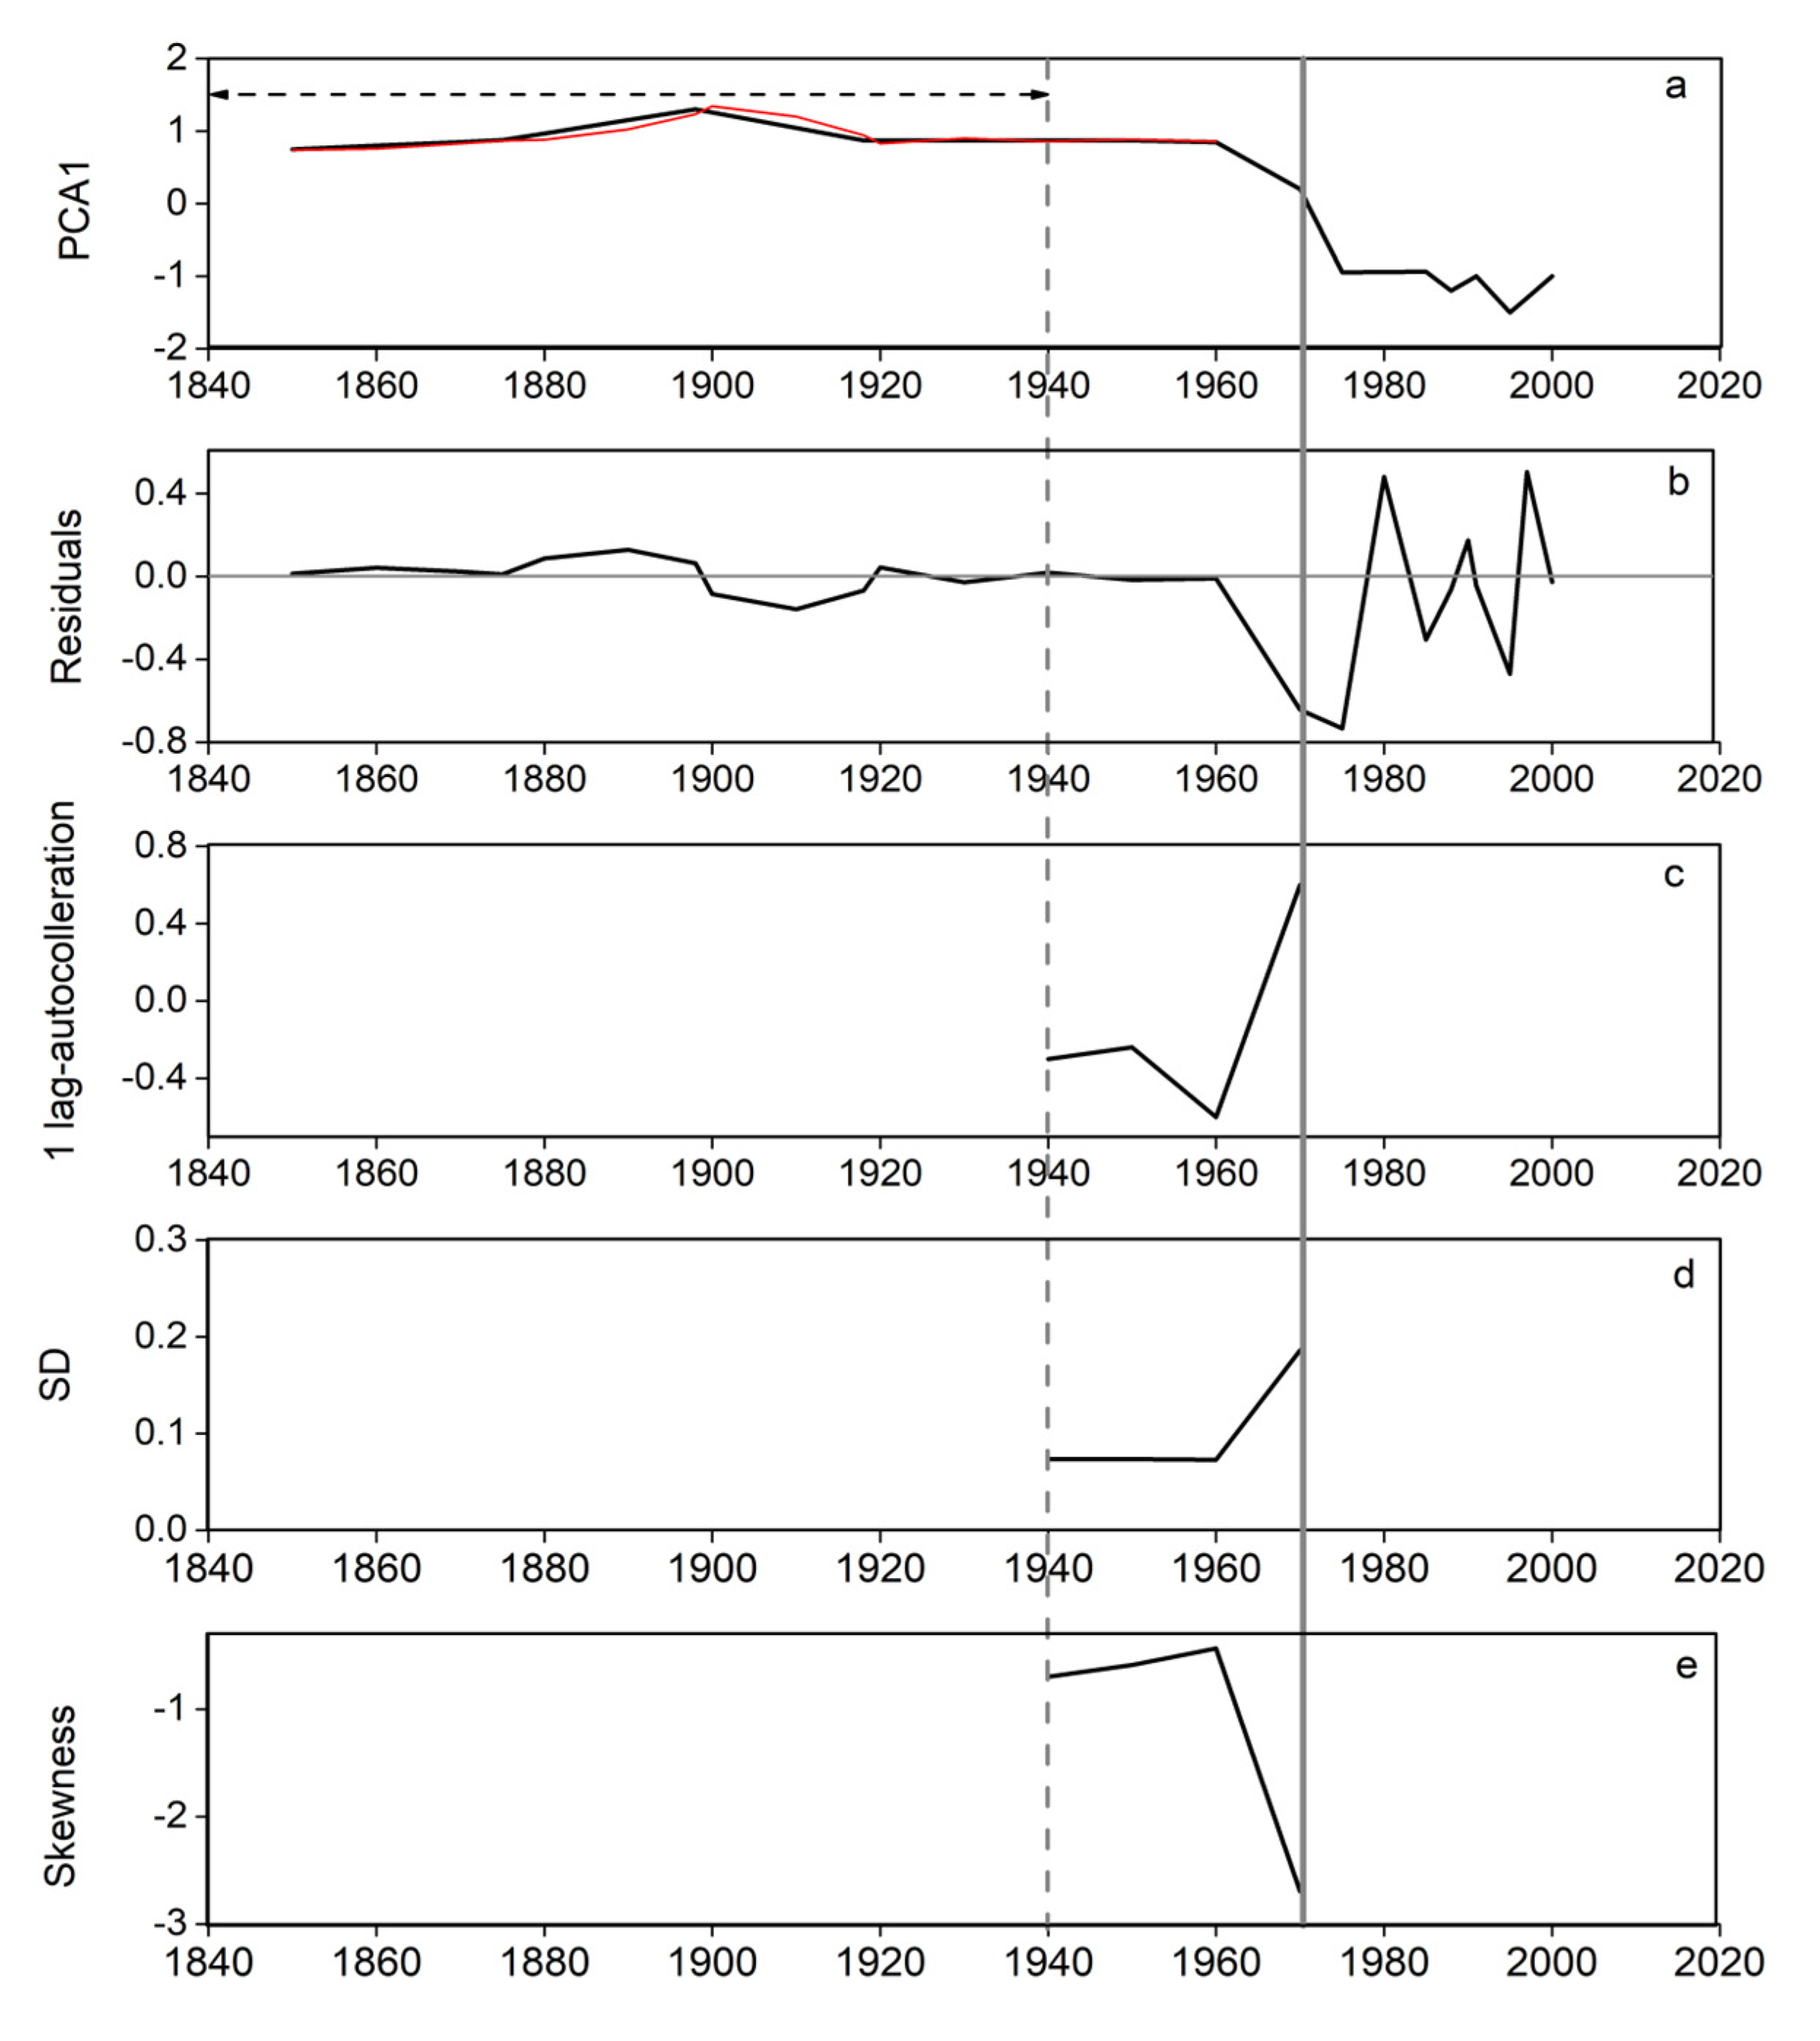
R software and Minitab software were adopted to perform Gaussian kernel density estimation and trend decomposition to obtain the residuals of the PCA1 time series (Figure 7b), and the red line represents the smooth curve fitted after the time series before the mutation point was detrended (Figure 7a). The first-order autocorrelation coefficient (lag1-autocorrelation), standard deviation (SD), and skewness (skew) of the residuals were calculated using a semi-time series sliding window, and the early warning signal of ecosystem mutation was extracted. The results show that the first-order autocorrelation coefficient and standard deviation of the PCA1 time series residuals have increased significantly since 1960, and the skewness has decreased since 1960. Compared with the mutation that occurred in the 1970s, the change in the trend of warning signals occurred about 10 years earlier, in 1960. Previous studies have found that the responses of shallow lake ecosystems to stress drivers will change suddenly with changes or increases in disturbance intensity, which will lead to a series of changes in the structure or function of the ecosystem, that is, the homeostatic transition of the ecosystem [7,31]. The results of the PCA1 long-time series analysis of the diatom community structure in the sediments of Tai Lake show that the standard deviation, autocorrelation coefficient, and skewness of the Tai Lake ecosystem increased significantly about 10 years before the threshold point of steady-state transition in the 1970s. Previous studies have shown that when driven or stressed by the external environment, the rate of change of a dynamic system will slow down when the tipping point is approached, and in an ecosystem, the autocorrelation of the system will increase in the short term [31,32]. Scheffer et al. studied changes in the characteristics of the variable autocorrelation coefficient in the transition of a lake from an oligotrophic state to a eutrophic state and found that the autocorrelation of variables was significantly enhanced before the steady-state transition of the lake ecosystem [31]. Owing to the increasing intensity of external stress factors, the number of species showed an obvious downward trend. In this process, the autocorrelation of statistics that indicate the number of species was significantly enhanced, suggesting that the enhancement of the autocorrelation of a large number of statistics can be used for early indication of the steady-state transition of ecosystems [31,33]. This is consistent with this study’s conclusion that the system autocorrelation of Tai Lake was enhanced 10 years before the tipping point in the 1970s. This indicates that the change rate of the ecosystem in Tai Lake gradually slowed down 10 years before the threshold mutation occurred under the influence of external interference. Therefore, the long-term monitoring data of Tai Lake can be used for analysis; moreover, the autocorrelation coefficient of the system state residual can be extracted so as to provide an early indication of the threshold mutation of the ecosystem and determine the time node of steady-state transition.
Secondly, the early warning signals extracted in this study also include an increase in the standard deviation of the residuals. Carpenter (2011) successfully obtained advanced warning of a sudden change in the food web of an ecosystem by introducing competitive predators to destroy the food web of the aquatic ecosystem and analyzing significant changes in statistical data, such as a sudden increase in standard deviation or a sudden decrease in recovery rate. It was proven that a regular change in long-term time series data can be used to judge the occurrence of steady-state transition in an ecosystem [15]. When Scheffer (2007) studied the community structure of aquatic plants in shallow lakes, he simulated a “large aquatic plant quantity model” over a long time scale and analyzed the change of the systems upon approaching the mutation point of a multi-stable curve and found that the variance increased significantly [34]. The above results are consistent with those of the Tai Lake ecosystem in this paper, which show a significant increase in variance 10 years before approaching the threshold point of the multistable system. As a result of the strong evidence of exogenous driving forces (Figure 2 and Figure 3), we can reject the hypothesis that the increase in variance is explained by internal noise generated only by internal changes in the ecosystem. Thus, the rising variance is most likely indicative of a phenomenon caused by multiple exogenously driven interactions and transitions across thresholds within the ecosystem that amplify the system response.
In addition, in the field of ecosystem steady-state transitions, sudden changes in the skewness of statistical data can be used to accurately indicate whether the symmetry of the target long-term time series data has changed [35]. It has been confirmed that when the system is close to the threshold point where the mutation is about to occur, the nonlinear influence of a large number of external stress factors is gradually strengthened, which leads to an increasing trend of asymmetry in the statistical data density distribution. Therefore, the gradual strengthening of the law of asymmetry of statistical data can be used to identify the occurrence of steady-state transition in the system. Thus, through the research and analysis of long-term time series data of an ecosystem, if it is confirmed that the skewness of the statistical data curve has a sudden change, it can be predicted that the system will cross the mutation point of the steady-state transition, and then, transform to other steady states. Guttal (2008) regarded the oligotrophic and eutrophic states of a lake as two stable states of an ecosystem [36]. Our research results show that in the process of the system approaching the threshold point of the multistable curve, with the increasing intensity of external interference, the symmetry of the curve describing the system state variables decreased significantly, and the skewness value of statistical data changed abruptly. This trend appeared 10 years before the steady-state transition of the lake ecosystem, which confirmed that the sudden change in skewness could be used as an important early indicator of lake eutrophication. The results of this study show that the skewness of residuals has become increasingly left-aligned since 1960 (the absolute value of the negative number has become increasingly larger), and this appeared 10 years before the steady-state transition of the Tai Lake ecosystem; this is consistent with Guttal’s results [36]. Therefore, the feasibility of developing an early warning system for lake ecosystem eutrophication based on the increased skewness of statistical data is further verified.
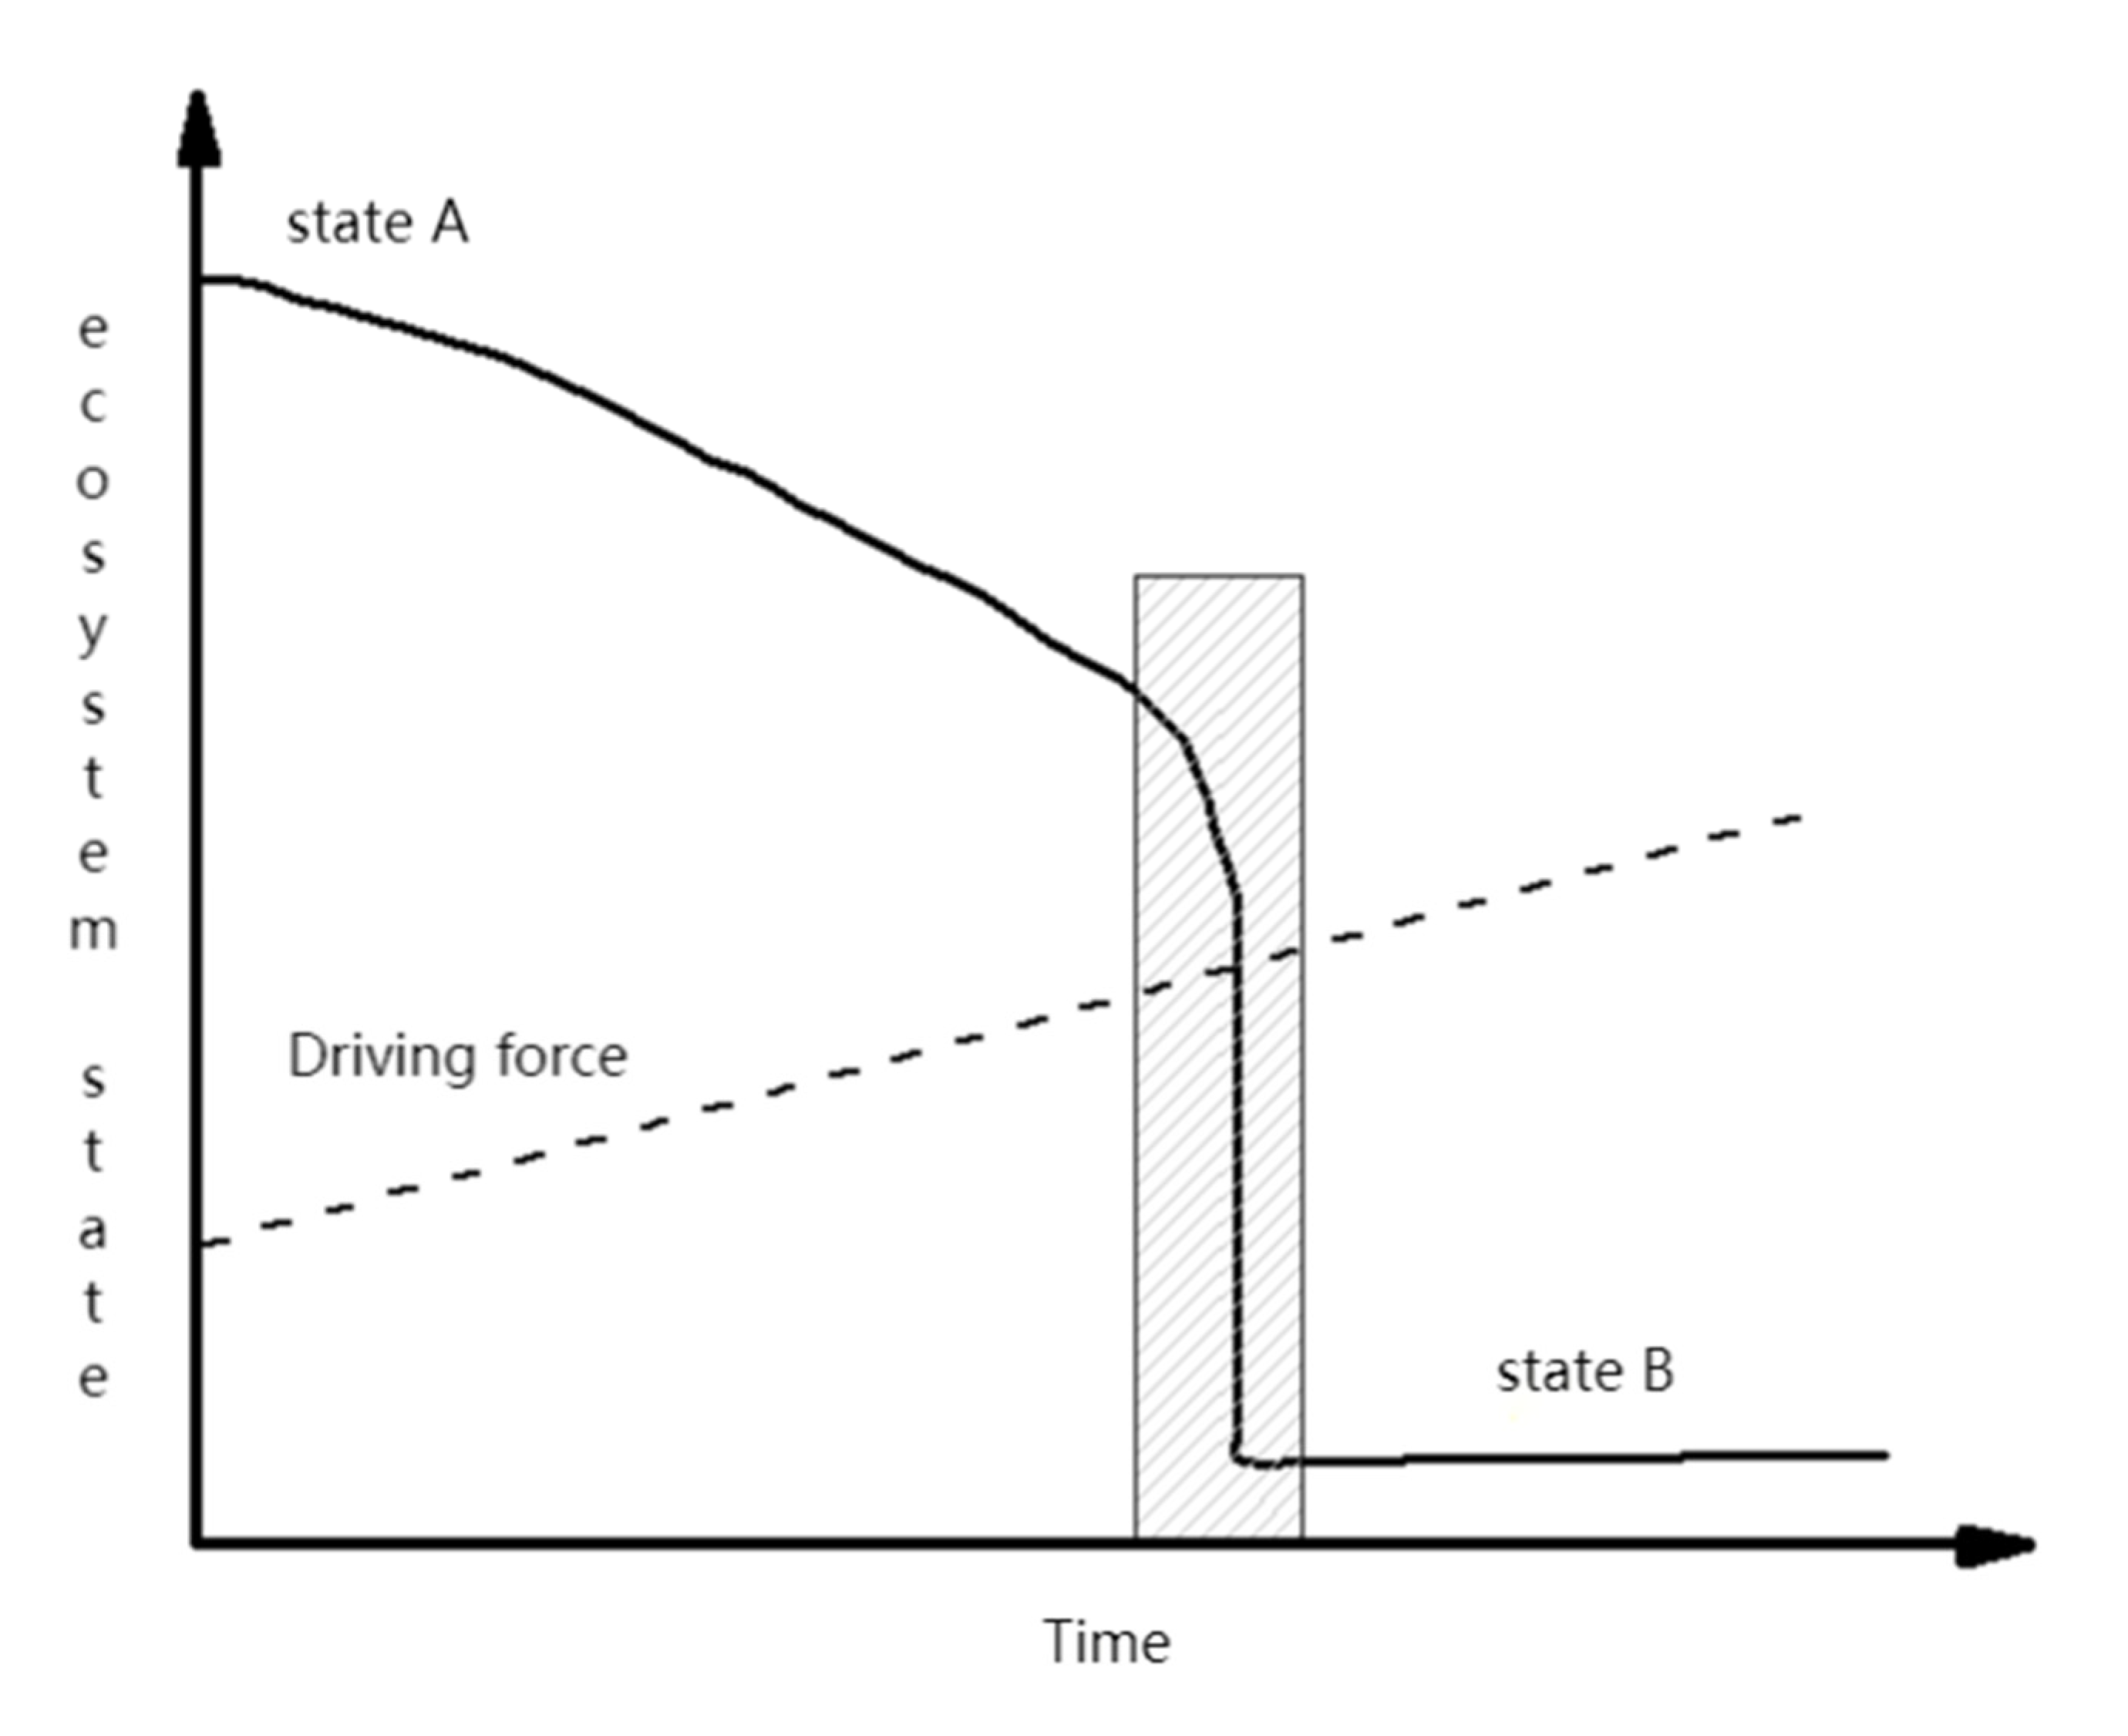
At present, the driving mechanisms for the steady-state transition of lake ecosystems are mainly divided into six types [37], and the characteristics of external force and the nature of random disturbance in the ecosystem determine the type of steady-state transition and whether it can be identified [38]. Whether or not the warning factor for steady-state transition is effective can determine the type of mechanism that drives steady-state transition. In our study, external environmental driving forces, such as climate and nutrient load, slowly pushed the ecosystem to the threshold of steady-state transition, which represents a typical slow environmental driving mechanism (Figure 8). Therefore, the potential early warning signals (variance, first-order, autocorrelation, and skewness) extracted in this paper were generated by the slow environmental driving mechanism and the reorganization and feedback of the lake’s internal system [39]. These factors can be identified and used for the early identification of water bloom in Tai Lake, with an early warning time scale of as long as 10 years.
3.4. Dynamic Change Process of the Socio-Lake System
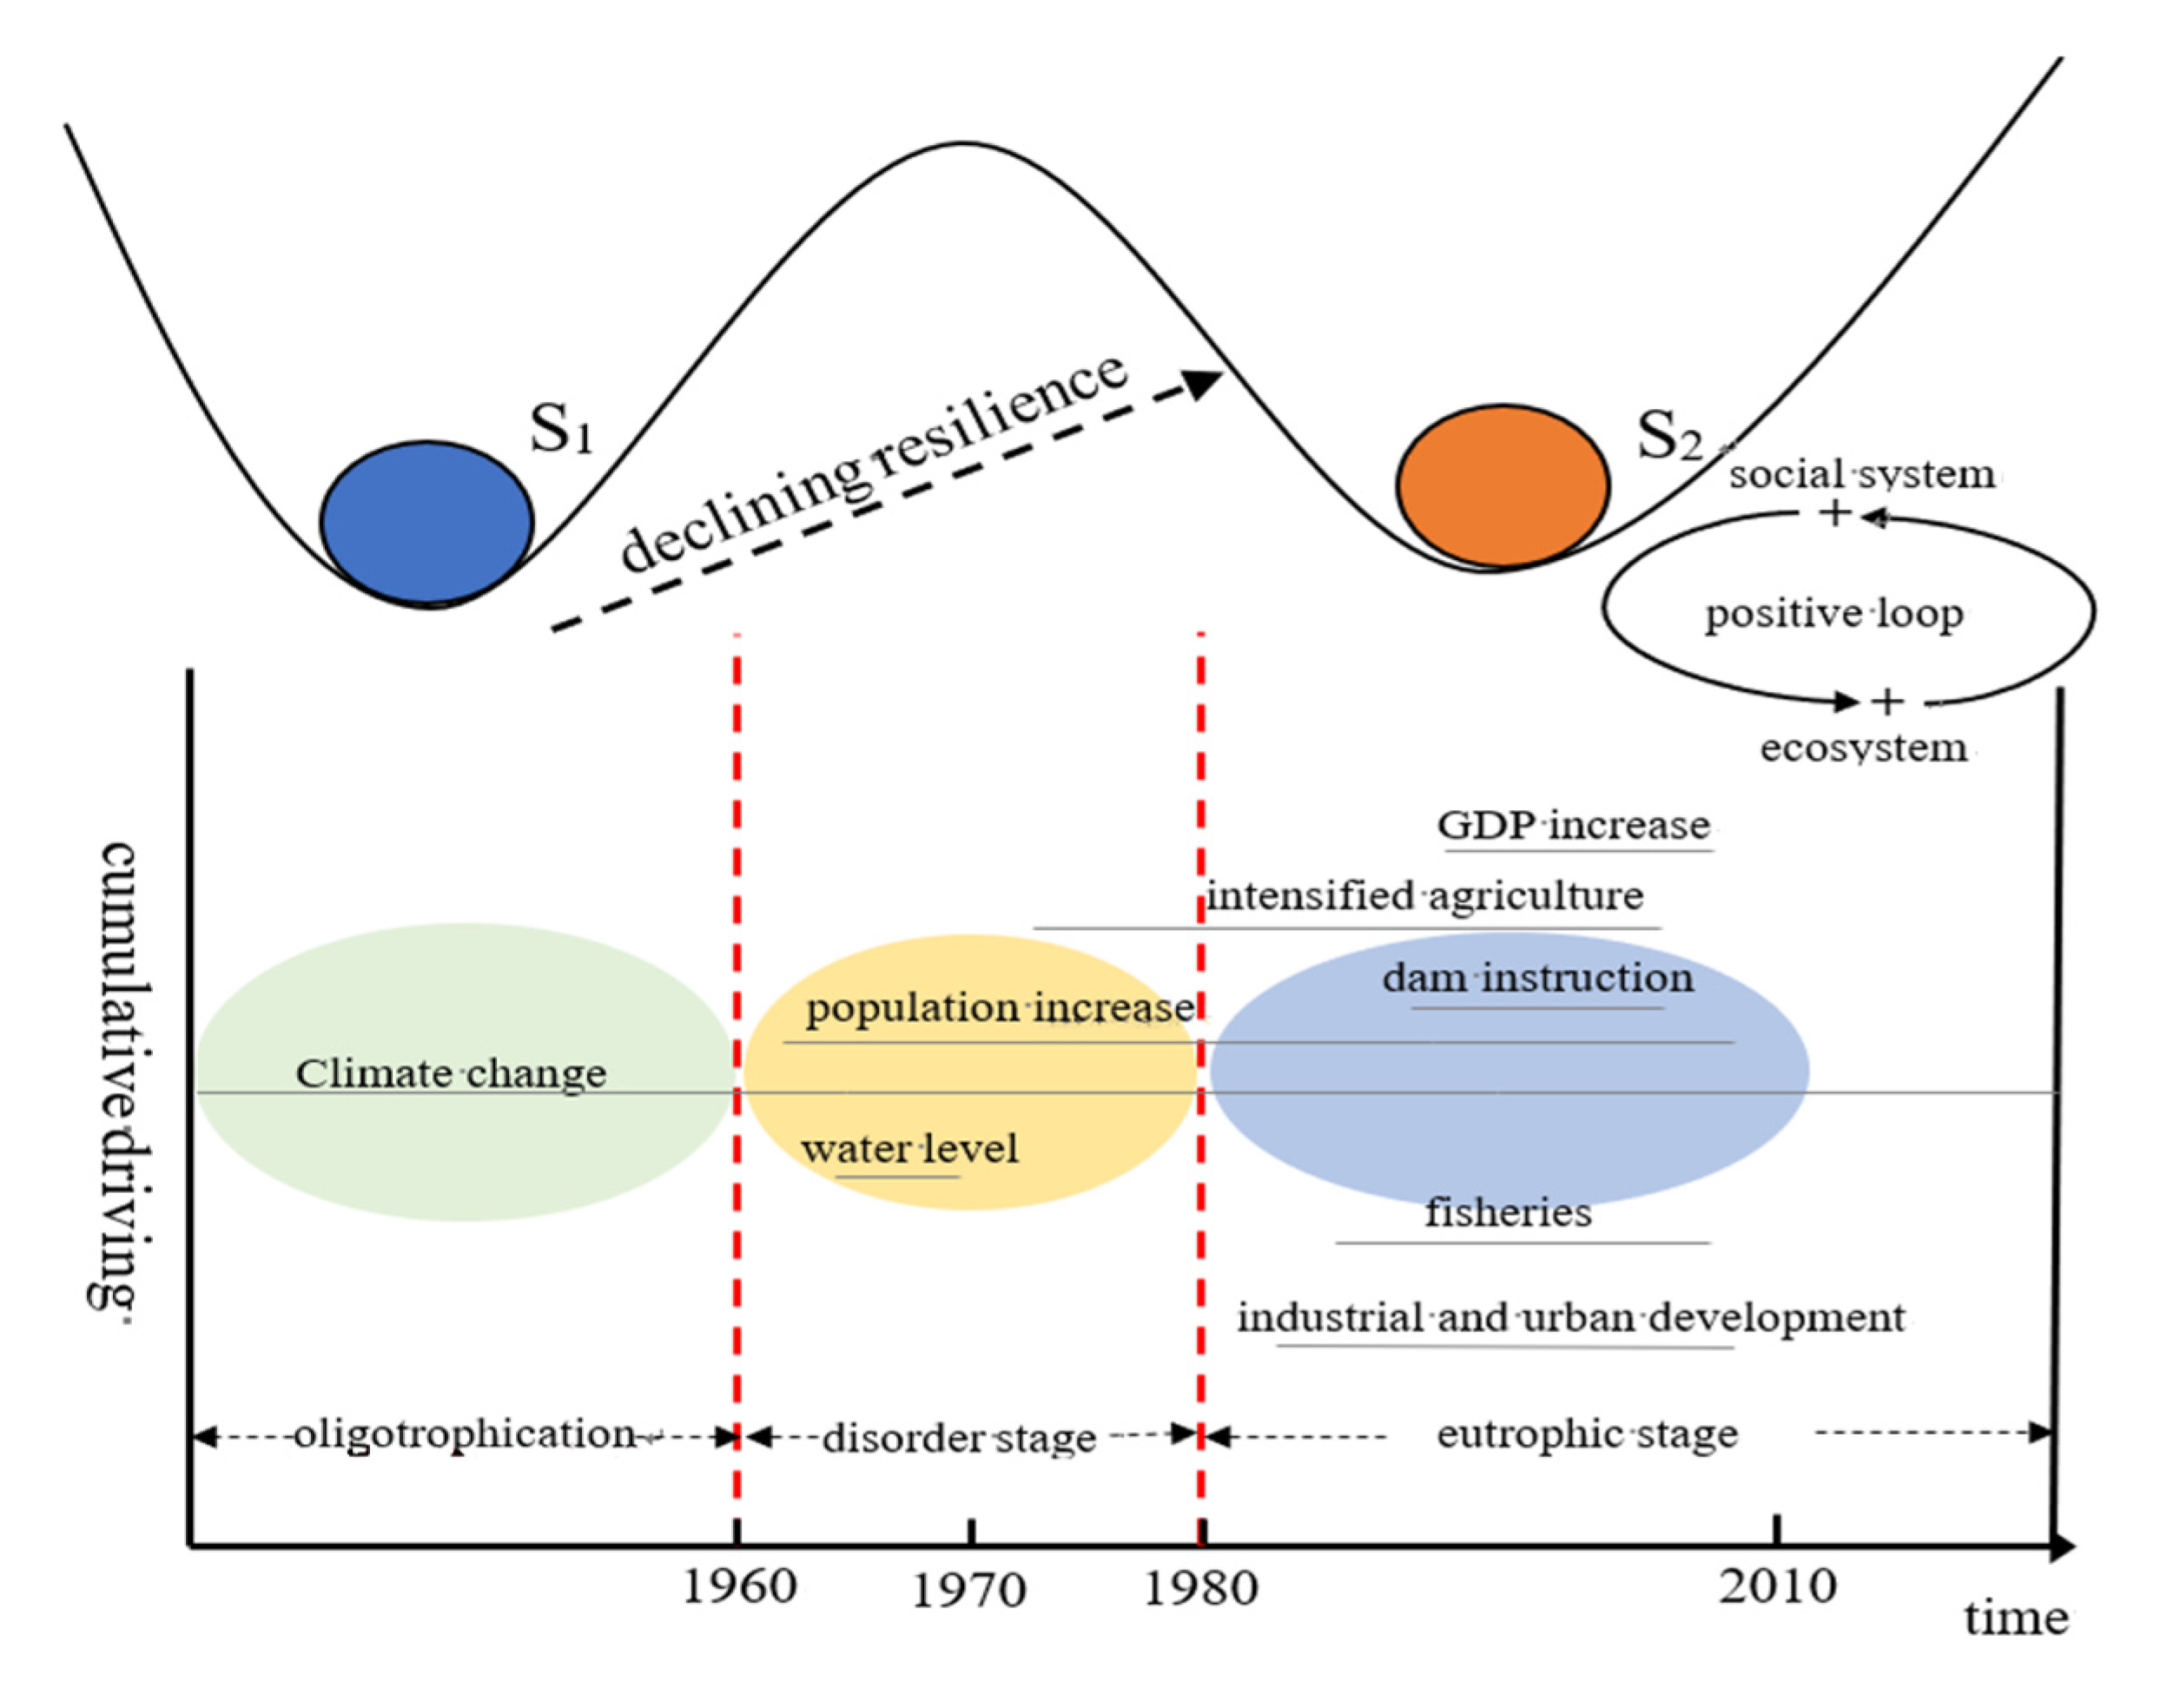
Ecosystems can be driven by sudden environmental events or by slowly changing environmental variables that cause internal reorganization and feedback [30,40,41]. The research in this paper shows that the degradation of the Tai Lake ecosystem has experienced three different stages corresponding to different climate–socioeconomic regimes in the last two centuries (Figure 9). Before the 1960s, the ecosystem of Tai Lake was in an oligotrophic state (Figure 6), and the lake ecosystem maintained a relatively stable state, which can be seen from the relatively stable natural variability of the PCA1 time series (Figure 5). Although human beings began long-term reclamation and development of the Tai Lake basin thousands of years ago, due to the limitations of farming technology and the sparse population density [42], this reclamation was limited to a local area of the Tai Lake basin; thus, the impact of human activity was much smaller than that of modern society. Therefore, during this period, the ecosystem maintained a high recovery capacity after external disturbance, that is, it had high system elasticity (upper part of Figure 9), which enabled the maintenance of an ecological balance between the lake ecosystem and human disturbance.
However, after 1960, the balance between the ecosystem of Tai Lake and the social system surrounding the basin has gradually been broken. The pressure of population growth and the increasing demand for food has led to an increase in the intensity of agricultural activity in the Tai Lake basin, such as the Great Leap Forward in 1958–1961 and the People’s Commune Movement in 1958–1982 [40], which were marked by large-scale wetland reclamation and a campaign to build farmland around the lake. As a result, the lake area has shrunk, and nutrients have been discharged into the lake. At the same time, the water level of Tai Lake declined from 1965 to 1970, which further aggravated the degradation of the ecological environment. In the 1970s, fluctuation in the environmental, chemical, and physical processes of Tai Lake led to significant changes in its species composition (Figure 7a) and food web structure. The system elasticity continuously decreased, and steady-state mutation of the ecosystem from an oligotrophic state to a eutrophic state occurred (upper part of Figure 9).
Since the 1980s, with the deepening of the reform and opening-up policy, the impact of human activity on the ecosystem of Tai Lake has increased exponentially. In 2010, the urbanization rate of the Tai Lake basin in Jiangsu Province reached 67.9% [42]. Large-scale and high-intensity human socio-economic activity has greatly accelerated the eutrophication process of Tai Lake [43,44]. With the development of society, people obtain increasing amounts of natural resources from lakes, which leads to problems such as overfishing, the extensive use of chemical fertilizers and pesticides, and the excessive excavation of sediment. Meanwhile, the temperature of the Tai Lake basin keeps rising (Figure 3), which further aggravates the ecological and environmental effects of pollution and overfishing, such as the outbreak of cyanobacteria in Tai Lake in 2007 and the “black water mass” event in 2008, both of which were extreme ecological disasters caused by the synergistic effects of external driving factors. Under these conditions, the response of the Tai Lake ecosystem has been much greater than if it were under the influence of a single external driving force. In addition, there is a positive feedback loop of interaction and mutual reinforcement between the development of the Tai Lake ecosystem and its social system, which further accelerates the lack of elastic resilience of the Tai Lake ecosystem. For example, a decline in the fishing rate in Tai Lake would lead to the strengthening of fishing activity, and a long-term decline in fishing would stimulate the economic value of rare goods, which would lead to a further increase in fishing activity. Under the strong influence of social activity [45] and the positive feedback loop of the ecosystem, we believe that after the 1980s, the external stress exerted on the Tai Lake ecosystem exceeded the elastic adjustment ability of the system itself, which has led to great changes in the composition, structure, and function of its species (Figure 10).
4. Conclusions
Our study offers new insight into research on lake ecosystems. In this research, the sediment environmental index and water quality monitoring data were used to analyze the abrupt change in the Tai Lake ecosystem, which successfully fills the research gap caused by the lack of environmental monitoring records for Tai Lake in the 1970s.
In order to further understand the evolutionary process and driving mechanism of the Tai Lake ecosystem, we considered the evolutionary process of diatom community structure in the sediments to represent the evolutionary process of Tai Lake. Time series with long time scales were used for inversion, and early indications (variance, autocorrelation, and skewness) of ecosystem mutation showed the occurrence of abnormal changes ten years before the steady-state transition; moreover, we found that the evolution of the Tai Lake ecosystem is driven by complex nonlinear interactions between biophysical, ecological and socio-economic factors.
In addition, this study also shows that the evolution of the ecological structure of the diatom community in the Tai Lake ecosystem is driven by complex interactions between biophysics, ecology, and the social economy. Therefore, in the processes of protecting and restoring a lake’s ecological environments, the tipping point and threshold of ecosystem mutation should be included in their management; moreover, on this basis, the driving forces of the further collapse of lake ecosystems should be studied in depth.
Author Contributions
Conceptualization, W.W. and C.L.; methodology, C.L.; software, C.L.; validation, W.W.; formal analysis, C.L.; investigation, C.L.; data curation, C.L.; writing—original draft preparation, C.L.; writing—review and editing, C.L.; visualization, C.L.; supervision, W.W.; project administration, W.W.; funding acquisition, W.W. All authors have read and agreed to the published version of the manuscript.
Funding
This research was funded by [Soil carbon sequestration potential of typical land use under climate change] grant number [31170489].
Data Availability Statement
Not applicable.
Acknowledgments
This research was supported by National Natural Science Foundation of China, International Cooperation Project of Land Use Change and its Control in the Context of Climate Change.
Conflicts of Interest
The authors declare no conflict of interest.
References
- Xu, X.; Zhang, Y.B.; Chen, Q.; Li, N.; Shi, K.; Zhang, Y.L. Regime shifts in shallow lakes observed by remote sensing and the implications for management. Ecol. Indic. 2020, 113, 2–9. [Google Scholar] [CrossRef]
- Petrescu, A.M.R.; Lohila, A.; Tuovinen, J.-P.; Baldocchi, D.D.; Desai, A.R.; Roulet, N.T.; Vesala, T.; Dolman, A.J.; Oechel, W.C.; Marcolla, B.; et al. The uncertain climate footprint of wetlands under human pressure. Proc. Natl. Acad. Sci. USA 2015, 112, 4594–4599. [Google Scholar] [CrossRef] [PubMed] [Green Version]
- Kuiper, J.J.; van Altena, C.; de Ruiter, P.C.; van Gerven, J.H.; Janse, J.H.; Mooij, W.M. Food-web stability signals critical transitions in temperate shallow lakes. Nat. Commun. 2015, 6, 7727. [Google Scholar] [CrossRef] [PubMed] [Green Version]
- Carpenter, S.R.; Mooney, H.A.; Agard, J.; Capistrano, D.; Defries, R.S.; Díaz, S.; Dietz, T.; Duraiappah, A.K.; Oteng-Yeboah, A.; Pereira, H.M.; et al. Science for managing ecosystem services: Beyond the Millennium Ecosystem Assessment. Proc. Natl. Acad. Sci. USA 2009, 106, 1305–1312. [Google Scholar] [CrossRef] [Green Version]
- Rockström, J.; Steffen, W.; Noone, K.; Persson, A.; Chapin, F.S., III; Lambin, E.F.; Lenton, T.M.; Scheffer, M.; Folke, C.; Schellnhuber, H.J.; et al. A safe operating space for humanity. Nature 2009, 461, 472–475. [Google Scholar] [CrossRef]
- Lenton, T.M.; Held, H.; Kriegler, E.; Hall, J.W.; Lucht, W.; Rahmstorf, S. Tipping elements in the Earth’s climate system. Proc. Natl. Acad. Sci. USA 2008, 105, 1786–1793. [Google Scholar] [CrossRef] [Green Version]
- Hastings, A.; Wysham, D.B. Regime shifts in ecological systems can occur with no Warning. Ecol. Lett. 2010, 13, 464–472. [Google Scholar] [CrossRef]
- Andersen, T.; Carstensen, J.; Hernández-García, E.; Duarte, C.M. Ecological thresholds and regime shifts: Approaches to identification. Trends Ecol. Evol. 2009, 24, 49–57. [Google Scholar] [CrossRef] [Green Version]
- Scheffer, M.; Carpenter, S.R. Catastrophic regime shifts in ecosystems: Linking theory to observations. Trends Ecol. Evol. 2003, 18, 648–656. [Google Scholar] [CrossRef]
- Holling, C.S. Resilience and stability of ecological systems. Annu. Rev. Ecol. Syst. 1973, 4, 1–23. [Google Scholar] [CrossRef] [Green Version]
- Hoegh-Guldberg, O.; Mumby, P.J.; Hooten, A.J.; Steneck, R.S.; Greenfield, P. Coral reefs under rapid climate change and ocean acidification. Science 2007, 318, 1737–1742. [Google Scholar] [CrossRef] [Green Version]
- Wu, J. Landscape sustainability science: Ecosystem services and human well-being in changing landscapes. Landsc. Ecol. 2013, 28, 999–1023. [Google Scholar] [CrossRef]
- Batt, R.D.; Carpenter, S.R.; Cole, J.J.; Pace, M.L.; Johnson, R.A. Changes in ecosystem resilience detected in automated measures of ecosystem metabolism during a whole-lake manipulation. Proc. Natl. Acad. Sci. USA 2013, 110, 17398–17403. [Google Scholar] [CrossRef] [Green Version]
- Robert, M.M. Thresholds and breakpoints in ecosystems with a multiplicity of stable states. Nature 1977, 269, 471–477. [Google Scholar] [CrossRef]
- Carpenter, S.R.; Cole, J.J.; Pace, M.L.; Batt, R.; Brock, W.A.; Cline, T.; Coloso, J.; Hodgson, J.R.; Kitchell, J.F.; Seekell, D.A.; et al. Early Warnings of Regime Shifts: A Whole-Ecosystem Experiment. Science 2011, 332, 1079–1082. [Google Scholar] [CrossRef] [Green Version]
- Wang, R.; Dearing, J.A.; Landon, P.G.; Zhang, E.L.; Yang, X.D.; Dakos, V.; Scheffer, M. Flickering gives early warning signals of a critical transition to a eutrophic lake state. Nature 2012, 492, 419–422. [Google Scholar] [CrossRef]
- Fan, X.; Cheng, F.J.; Yu, Z.M.; Song, X.X. The environmental implication of diatom fossils in the surface sediment of the Changjiang River estuary (CRE) and its adjacent area. J. Oceanol. Limnol. 2019, 37, 552–567. [Google Scholar] [CrossRef]
- Feng, W.Y.; Wang, T.K.; Zhu, Y.R.; Sun, F.H.; Giesy, J.P.; Wu, F.C. Chemical composition, sources, and ecological effect of organic phosphorus in water ecosystems: A review. Carbon Res. 2023. [Google Scholar] [CrossRef]
- Feng, W.Y.; Yang, F.; Zhang, C.; Liu, J.; Song, F.H.; Chen, H.Y.; Zhu, Y.R.; Liu, S.S.; Giesy, J.P. Composition characterization and biotransformation of dissolved, particulate and algae organic phosphorus in eutrophic lakes. Environ. Pollut. 2020, 265, 114838. [Google Scholar] [CrossRef]
- Wang, X.R.; Liang, D.Y.; Wang, Y.; Peijnenburg, W.J.; Monikh, F.A.; Zhao, X.L.; Dong, Z.M.; Fan, W.H. A critical review on the biological impact of natural organic matter on nanomaterials in the aquatic environment. Carbon Res. 2022, 1, 13. [Google Scholar] [CrossRef]
- Li, C.C.; Feng, W.Y.; Chen, H.Y.; Li, X.F.; Song, F.H.; Guo, W.J.; Giesy, J.P.; Sun, F.H. Temporal variation in zooplankton and phytoplankton community species composition and the affecting factors in Lake Taihu—A large freshwater lake in China. Environ. Pollut. 2019, 245, 1050–1057. [Google Scholar] [CrossRef] [PubMed]
- Qin, B.Q.; Hu, W.M.; Chen, W.M. Water Environment Evolution Process and Mechanism of Tai Lake; Science Press: Beijing, China, 2004; ISBN 9787030124081. (In Chinese) [Google Scholar]
- Li, C.C.; Feng, W.Y.; Song, F.H.; He, Z.Q.; Wu, F.C.; Zhu, Y.R.; Giesy, J.P.; Bai, Y.C. Three decades of changes in water environment of a large freshwater Lake and its relationship with socio-economic indicators. J. Environ. Sci. 2019, 77, 156–166. [Google Scholar] [CrossRef] [PubMed]
- Zhu, G.W.; Qin, B.Q.; Zhang, Y.L.; Xu, H.; Zhu, M.Y.; Yang, H.W.; LI, K.Y.; Min, S.; Shen, R.J.; Zhong, C.N. Changes of chlorophyll a and nutrient salts in northern Taihu Lake and their influencing factors from 2005 to 2017. J. Lake Sci. 2018, 30, 279–295. (In Chinese) [Google Scholar] [CrossRef] [Green Version]
- Dai, X.L.; Qian, P.Q.; Ye, L.; Song, T. Evolution trend of nitrogen and phosphorus concentrations in Taihu from 1985 to 2015. J. Lake Sci. 2016, 28, 935–943. (In Chinese) [Google Scholar] [CrossRef] [Green Version]
- Zhang, K.; Dong, X.H.; Yang, X.D.; Kattel, G.; Zhao, Y.J.; Wang, R. Ecological shift and resilience in China’s lake systems during the last two centuries. Glob. Planet Chang. 2018, 165, 147–159. [Google Scholar] [CrossRef]
- Liu, E.F.; Shen, J.; Zhu, Y.X. Geochemical records and comparative study of sediment pollution in western Tai Lake. Sci. Geogr. Sin. 2005, 25, 102–107. (In Chinese) [Google Scholar]
- Liu, G.M.; Chen, F.J.; Liu, Z.W. A preliminary study on cladoceran microfossils from Tai Lake. J. Lake Sci. 2008, 20, 470–476. (In Chinese) [Google Scholar] [CrossRef]
- Rodionov, S.N. Use of prewhitening in climate regime shift detection. Geophys. Res. Lett. 2006, 33, L12707. [Google Scholar] [CrossRef] [Green Version]
- Dong, X.H.; Yang, X.D.; Chen, X.; Liu, Q.; Yao, M.; Wang, R.; Xu, M. Using sedimentary diatoms to identify reference conditions and historical variability in shallow lake ecosystems in the Yangtze floodplain. Mar. Freshw. Res. 2016, 67, 803–815. [Google Scholar] [CrossRef]
- Ives, A.R. Measuring resilience in stochastic-systems. Ecol. Monogr. 1995, 65, 217–233. [Google Scholar] [CrossRef]
- Seekell, D.A.; Carpenter, S.R.; Pace, M.L. Conditional heteroscedasticity as a leading indicator of ecological regime shifts. Am. Nat. 2011, 178, 1–11. [Google Scholar] [CrossRef] [Green Version]
- Liu, Y.; Evans, M.A.; Scavia, D. Gulf of mexico hypoxia: Exploring increasing sensitivity to nitrogen loads. Environ. Sci. Technol. 2010, 44, 5836–5841. [Google Scholar] [CrossRef]
- Scheffer, M.; van Nes, E.H. Shallow lakes theory revisited:various alternative regimes driven by climate, nutrients, depth and lake size. Hydrobiologia 2007, 584, 455–466. [Google Scholar] [CrossRef] [Green Version]
- Yu, R.H.; Zhang, X.X.; Liu, T.X.; Hao, Y.L. Forewarned is forewarmed:Limitations and prospects of early warning indicators of regime shifts in shallow lakes. Acta Ecol. Sin. 2017, 37, 3619–3627. [Google Scholar] [CrossRef] [Green Version]
- Guttal, V.; Jayaprakash, C. Changing skewness-an early warning signal of regime shifts in ecosystems. Ecol. Lett. 2008, 11, 450–460. [Google Scholar] [CrossRef] [Green Version]
- Drake, J.M.; Griffen, B.D. Early warning signals of extinction in deteriorating environments. Nature 2010, 467, 456–459. [Google Scholar] [CrossRef]
- Seddon, A.W.R.; Froyd, C.A.; Witkowski, A.; Willis, K.J. A quantitative framework for analysis of regime shifts in a Galápagos coastal lagoon. Ecology 2014, 95, 3046–3055. [Google Scholar] [CrossRef] [Green Version]
- Zhao, Y.J.; Wang, R.; Yang, X.D.; Dong, X.H.; Xu, M. Regime shifts revealed by paleoecological records in Lake Taibai’s ecosystem in the middle and lower Yangtze River Basin during the last century. J. Lake Sci. 2016, 28, 1381–1390. (In Chinese) [Google Scholar] [CrossRef] [Green Version]
- Scheffer, M.; Bascompte, J.; Brock, W.A.; Brovkin, V.; Carpenter, S.R.; Dakos, V.; Held, H.; van Nes, E.H.; Rieterk, M.; Sugihara, G. Early-warning signals for critical transitions. Nature 2009, 461, 53–59. [Google Scholar] [CrossRef]
- Wang, H.D. Lakes of China; Commercial Press: Beijing, China, 1995; ISBN 9787100014847. (In Chinese) [Google Scholar]
- Su, W.Z.; Chen, W.X.; Guo, W.; Ru, J.J. A preliminary study on the spatial occupation mechanism of river network by urban-rural land expansion in Tai Lake Basin. J. Nat. Resour. 2016, 31, 128–1301. (In Chinese) [Google Scholar] [CrossRef]
- Yang, X.J. China’s rapid urbanization. Science 2013, 342, 310. [Google Scholar] [CrossRef] [PubMed]
- Liu, J.; Mooney, H.; Hull, V.; Davis, S.J.; Gaskell, J.; Hertel, T.; Lubchenco, J.; Seto, K.C.; Gleick, P.; Kremen, C.; et al. Systems integration for global sustainability. Science 2015, 347, 125883. [Google Scholar] [CrossRef] [PubMed] [Green Version]
- Wu, F.; Li, F.; Zhao, X.; Bolan, N.S.; Fu, P.; Lam, S.S.; Mašek, O.; Ong, H.; Pan, B.; Qiu, X.; et al. Meet the challenges in the “Carbon Age”. Carbon Res. 2022, 1, 1–2. [Google Scholar] [CrossRef]
Figure 1.
Location of Tai Lake in China.

Figure 2.
Historical records of lake sediment-based aquatic system response variables (The dotted box represents tipping points of the lake sediment-based aquatic system response variables). (a) Silicon alga composition in sediment; (b) density of Bosmina spp. species in sediment; (c) TN and TOC in sediment(%); (d) C/N in sediment.

Figure 3.
Historical records of environmental drivers during the period 1840–2017 (The dotted box represents tipping points of the lake sediment-based aquatic system response variables). (a) Temperature; (b) water level and wind speed; (c) grain production and fertilizer.
Figure 3.
Historical records of environmental drivers during the period 1840–2017 (The dotted box represents tipping points of the lake sediment-based aquatic system response variables). (a) Temperature; (b) water level and wind speed; (c) grain production and fertilizer.

Figure 4.
Evidence of bistability and regime shift in time series of PCA1.


Figure 5.
Z-scores of Bosmina spp. species and PCA1. (a) Z-score of Bosmina spp.; (b) Z-score of PCA1.
Figure 5.
Z-scores of Bosmina spp. species and PCA1. (a) Z-score of Bosmina spp.; (b) Z-score of PCA1.

Figure 6.
Time series of water quality indicators between 1960 and 2011~2017 in Tai Lake (The dotted box was used to highlight 1960, and the blue and green lines were used to mark time nodes of water environment change). (a) Total nitrogen and total phosphorous; (b) chemical oxygen demand and biological oxygen demand; (c) dissolved oxygen and transparency; (d) chla, ratio of nitrogen to phosphorous; (e) phytoplankton and submerged plants.

Figure 7.
Potential early warning signals of a regime shift in the lake’s trophic state for PCA time series. (a) PCA1 scores of sediment diatom composition (derived from Figure 2) (The red line is the Minitab curve after filtering out the slow trend, and the arrow indicates the width of the moving window used to calculate the warning signal); (b) residuals of PCA1 (the gray line indicates zero); (c) lag-autocorrelation of (b); (d) SD of (b); (e) skewness of (b) (the solid gray vertical line indicates the 1970s).

Figure 8.
The mechanism of driving forces for regime shift in Tai Lake (the dotted line represents the time range of ecosystem mutation).
Figure 8.
The mechanism of driving forces for regime shift in Tai Lake (the dotted line represents the time range of ecosystem mutation).

Figure 9.
A time axis of multiple cumulative driving factors in the Tai Lake basin (the bottom figure) over the past 60 years, which have led to degradation of the ecosystem and reduced its resilience (the top figure). The three ellipses of different colors represent the different development stages of the Lake Tai ecosystem, representing the oligotrophic stage (before 1960S), the disordered mutation stage (1960–1980), and the eutrophication stage (1980–2010).

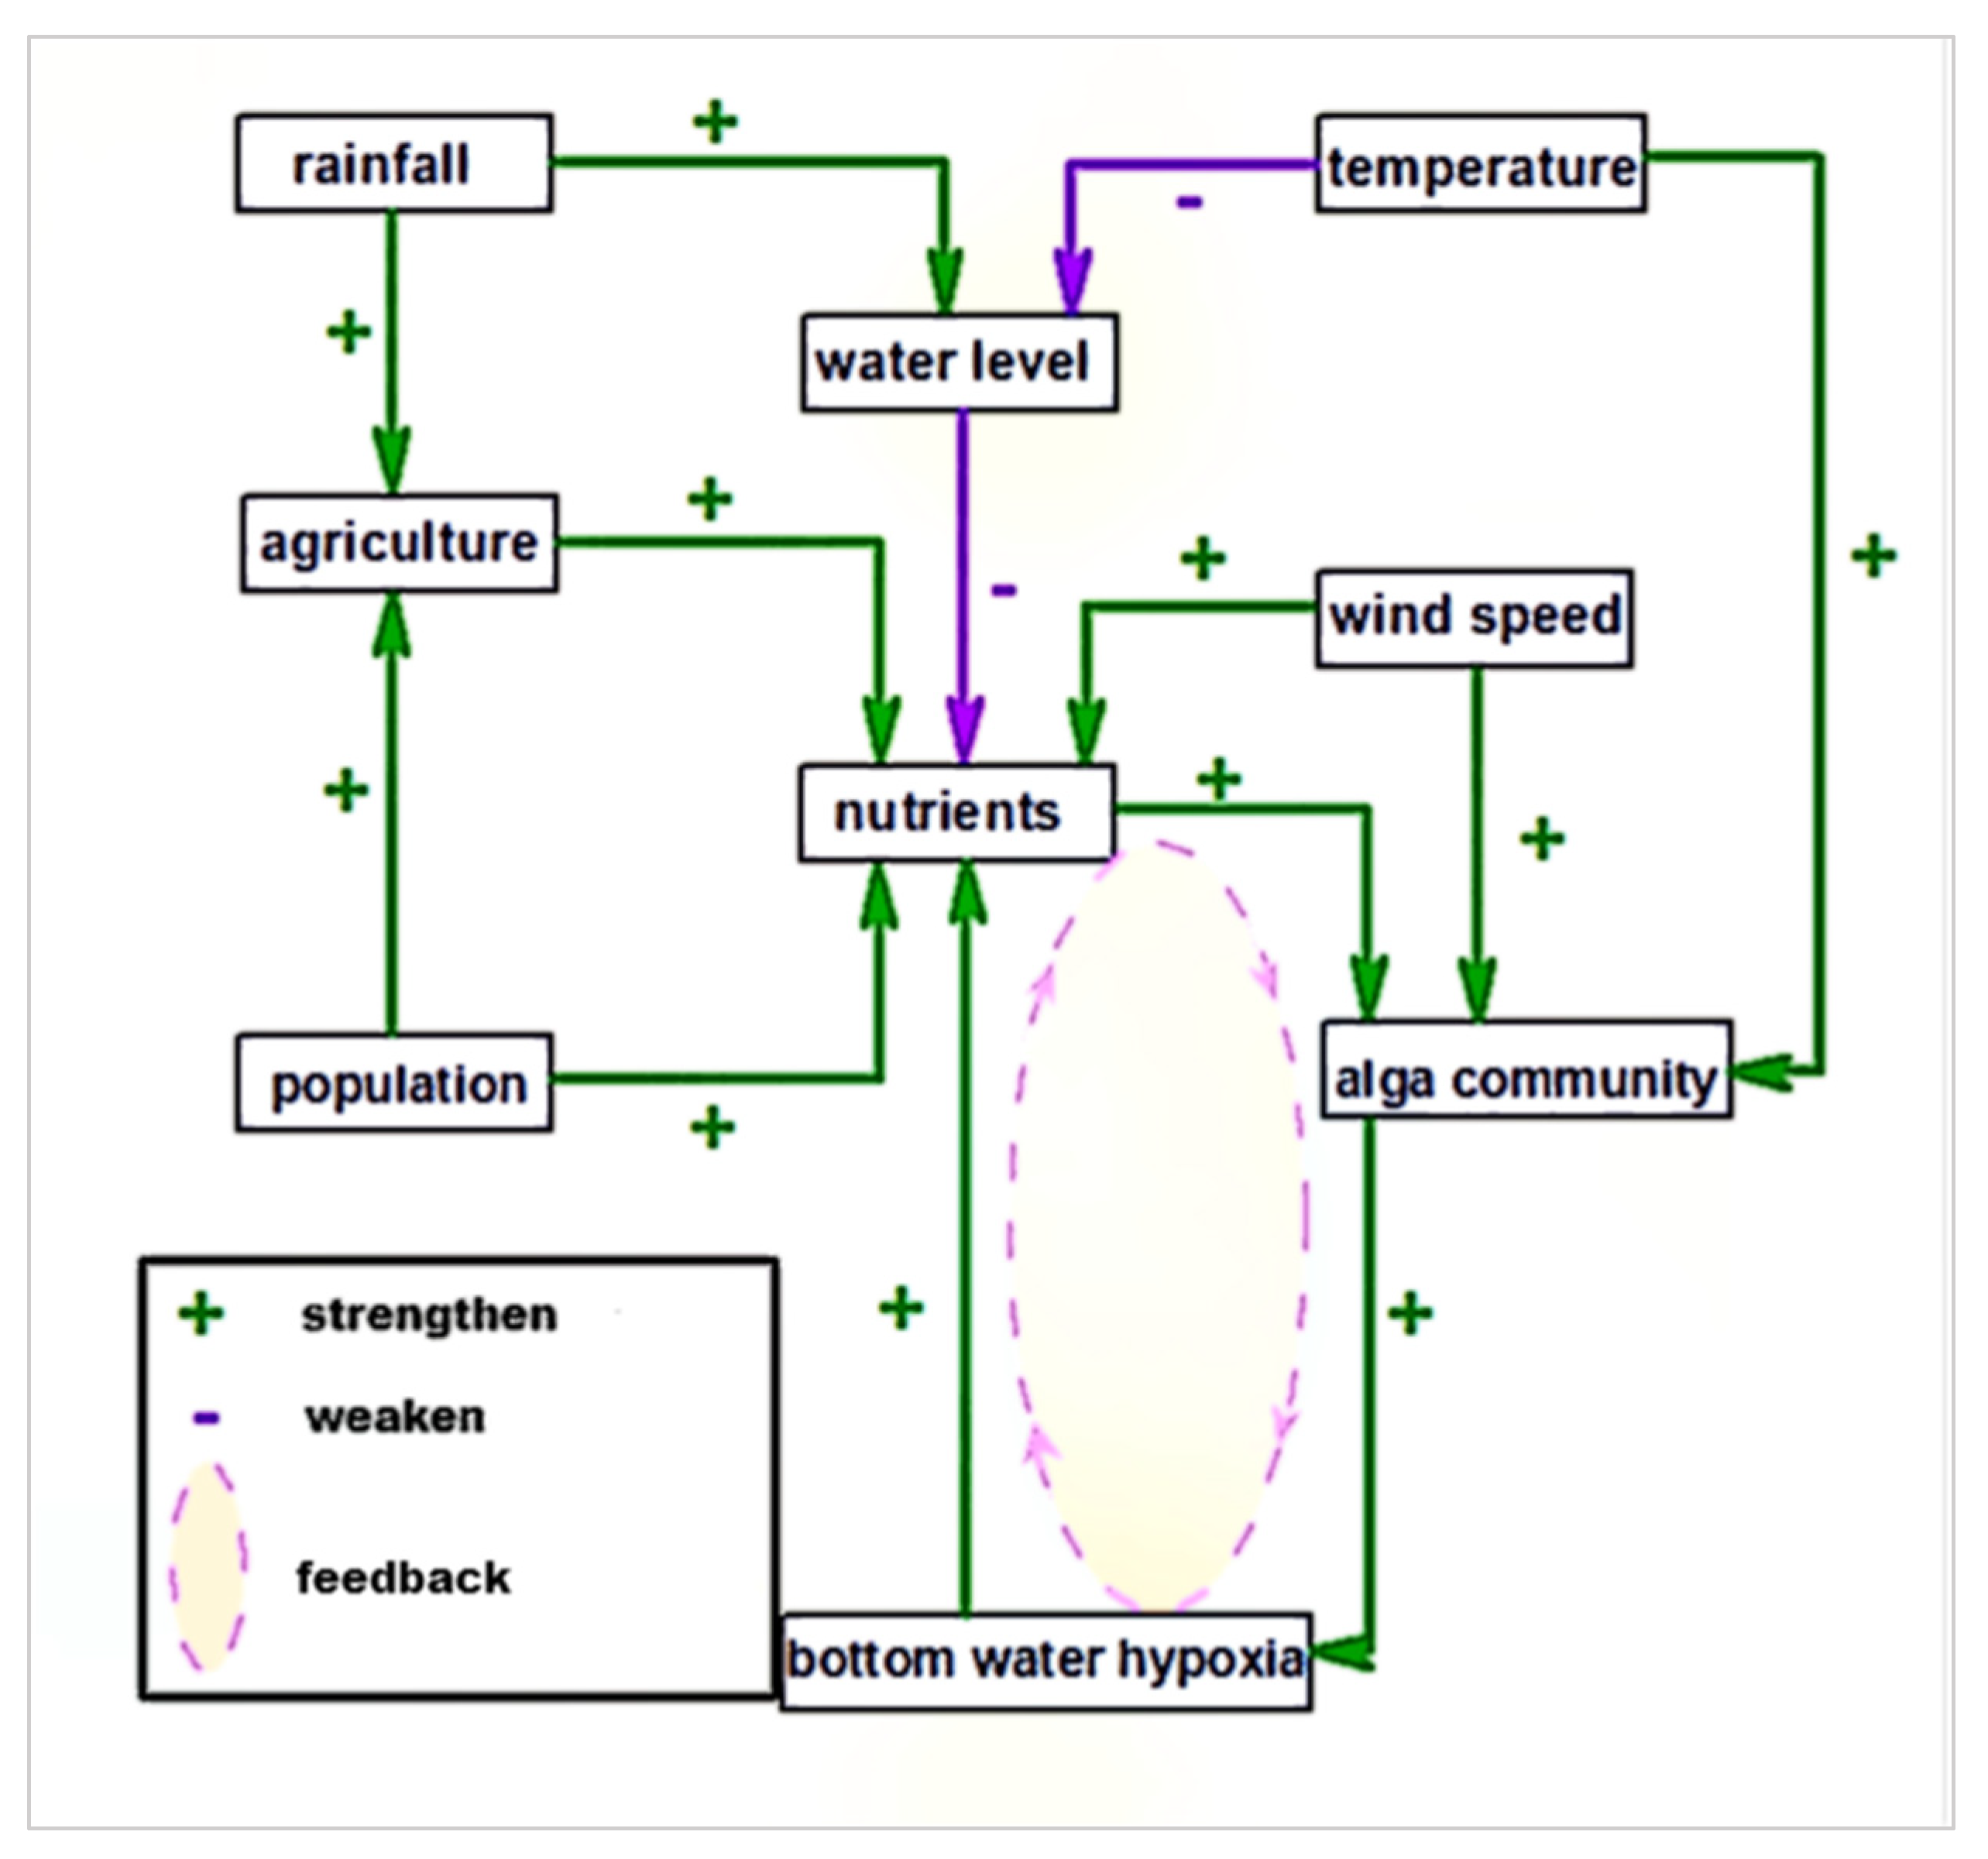
Figure 10.
The figure describes the occurrence of eutrophication (Figure 6) after the 1980s. At this time, a positive feedback loop (dotted ellipse) of phosphorus in the sediments circulating in the lake water was firmly established. The figure shows the diversity and interconnectivity of the main external drivers (bold) of the algal community in Lake Tai, with typical relationships (positive and negative) shown for major interactions. This figure is modified from Wang et al., 2012 [16].


Table 1.
The selection details of the ARIMA (1,1,2) model of PCA1, including model type (AR and MA), coefficient, standard deviation of coefficient, T-test statistic, and probability level (P).
Table 1.
The selection details of the ARIMA (1,1,2) model of PCA1, including model type (AR and MA), coefficient, standard deviation of coefficient, T-test statistic, and probability level (P).
| PCA1_ARIMA (1,1,2) | R2 = 0.98 | |||
|---|---|---|---|---|
| Type | Cofficient | SE Coef | T | P |
| AR(1) | 0.533 | 0.375 | 1.422 | 0.193 |
| AR(2) | 0.466 | 0.368 | 1.265 | 0.242 |
| MA(1) | 0.888 | 0.171 | 2.185 | 0.0008 |
Table 2.
A simple, multivariate regression analysis of potential external drivers (rainfall, air temperature, wind speed, fertilizer, water level, and crop production) and algal response (PCA1) in the Tai Lake ecosystem from 1950 to 2000.
Table 2.
A simple, multivariate regression analysis of potential external drivers (rainfall, air temperature, wind speed, fertilizer, water level, and crop production) and algal response (PCA1) in the Tai Lake ecosystem from 1950 to 2000.
| Multiple regression model standardized coefficients | |
| PCA1 | |
| precipitation air temperature | −0.046 −0.039 |
| wind speed | 0.942 |
| fertilizer | 0.586 |
| crop production | −0.438 |
| Water level | 0.046 |
| Notes: p ≤ 0.05 insignificant. | |
| Simple regression model R value | |
| PCA1 | |
| precipitation | −0.476 |
| air temperature | −0.476 |
| wind speed * | 0.834 |
| Fertilizer * | −0.739 |
| water level | 0.077 |
| crop production * | −0.773 |
| Notes: p < 0.05 * (2-tailed test) significant, the rest are insignificant. | |
Disclaimer/Publisher’s Note: The statements, opinions and data contained in all publications are solely those of the individual author(s) and contributor(s) and not of MDPI and/or the editor(s). MDPI and/or the editor(s) disclaim responsibility for any injury to people or property resulting from any ideas, methods, instructions or products referred to in the content. |
© 2023 by the authors. Licensee MDPI, Basel, Switzerland. This article is an open access article distributed under the terms and conditions of the Creative Commons Attribution (CC BY) license (https://creativecommons.org/licenses/by/4.0/).
Share and Cite
MDPI and ACS Style
Li, C.; Wu, W. Analysis of the Driving Mechanism of Water Environment Evolution and Algal Bloom Warning Signals in Tai Lake. Water 2023, 15, 1245. https://doi.org/10.3390/w15061245
AMA Style
Li C, Wu W. Analysis of the Driving Mechanism of Water Environment Evolution and Algal Bloom Warning Signals in Tai Lake. Water. 2023; 15(6):1245. https://doi.org/10.3390/w15061245
Chicago/Turabian StyleLi, Cuicui, and Wenliang Wu. 2023. "Analysis of the Driving Mechanism of Water Environment Evolution and Algal Bloom Warning Signals in Tai Lake" Water 15, no. 6: 1245. https://doi.org/10.3390/w15061245
Note that from the first issue of 2016, this journal uses article numbers instead of page numbers. See further details here.