Article

Microbial and Biogeochemical Shifts in a Highly Anthropogenically Impacted Estuary (“El Sauce” Valparaíso)

by
Francisco Pozo-Solar
1,2,3,
Marcela Cornejo-D’Ottone
4,
Roberto Orellana
2,3,
Carla Acuña
3,
Cecilia Rivera
2,3,
Polette Aguilar-Muñoz
3,
Céline Lavergne
3,5 and
Verónica Molina
2,3,6,*
1
Programa de Doctorado Interdisciplinario en Ciencias Ambientales, Facultad de Ciencias Naturales y Exactas, Universidad de Playa Ancha, Valparaíso 2340000, Chile
2
Departamento de Ciencias y Geografía, Universidad de Playa Ancha, Avenida Leopoldo Carvallo 270, Playa Ancha, Valparaíso 2340000, Chile
3
HUB Ambiental UPLA, Universidad de Playa Ancha, Leopoldo Carvallo 207, Playa Ancha, Valparaíso 2340000, Chile
4
Escuela de Ciencias del Mar and Instituto Milenio de Oceanografía, Pontificia Universidad Católica de Valparaíso, Valparaíso 2950, Chile
5
Laboratory of Aquatic Environmental Research, Centro de Estudios Avanzados, Universidad de Playa Ancha, Viña del Mar 450, Chile
6
Centro de Investigación Oceanográfica COPAS COASTAL, Universidad de Concepción, Concepción 4070386, Chile
*
Author to whom correspondence should be addressed.
Water 2023, 15(6), 1251; https://doi.org/10.3390/w15061251
Submission received: 19 November 2022 / Revised: 21 February 2023 / Accepted: 27 February 2023 / Published: 22 March 2023
(This article belongs to the Section Biodiversity and Functionality of Aquatic Ecosystems)

Abstract

:
Coastal zones are ecosystems that are sensitive to climate change and anthropogenic pollution, resulting in a potential loss of biodiversity and ecosystem services through eutrophication and nutrient imbalances, among others. The coastal El Sauce catchment area, Central Chile, is under multiple anthropogenic pressures including wastewater treatment plant (WWTP) discharge, which its broad effect remains underexplored. In order to assess the impact of the WWTP on El Sauce stream, the benthic microbial communities and key functional groups variability (i.e., nitrifiers, methanogens and methanotrophs) were determined by 16S rDNA high-throughput sequencing and by functional genes quantification, respectively, during two contrasted seasons in three catchment areas (pre-, WWTP and post-discharge). The microbial communities’ structure profiles were associated with the water quality, nutrients, greenhouse gas (GHG) distribution, and the organic matter isotopic signatures in the sediments, for the first time, in this ecosystem. The results show that organic matter isotopic signatures using nitrogen and carbon (δ15N and δ13C) and the physicochemical conditions in El Sauce estuary changed from the pre- to WWTP discharge areas (i.e., a pH decrease of 0.5 units and an increase of 4–6 °C in the water temperature). The WWTP discharge area was characterized by a low nutrient concentration and significantly higher GHG distribution (>600 µM CO2, >30,000 nM CH4, and >3000 nM N2O). In addition, the benthic microbial community structure shifted spatially and seasonally, including specific phyla known as sewage bioindicators, such as Firmicutes (Clostridiales order) and Bacteroidetes. In addition, other taxa were enriched or only retrieved in the sediments of the WWTP influenced area, e.g., Tenericutes, Lentisphaerae, Synergistetes, and LCP-89. Methanogens were more enriched near the WWTP discharge compared to those in the pre-discharge site in both seasons, while methanotrophs and ammonia oxidizers were unfavored only during winter. Our results indicate that the WWTP discharge impacts the biogeochemical conditions in El Sauce catchment area modifying the benthic microbial communities, including a decrease in the key functional groups able to mitigate CH4 and regulate nutrients recycling in these aquatic ecosystems.

Graphical Abstract

1. Introduction

Organic matter (OM) is a central factor regulating nutrient recycling in several aquatic ecosystems. The processes involved in controlling the transformation of OM are especially relevant in coastal environments, such as estuaries and wetlands, since they contribute to global carbon mitigation [1]. Estuarine OM is composed of a diverse mixture of allochthonous and autochthonous sources [2]. While autochthonous OM enriched by plant-derived polymers is locally originated from the high primary productivity associated with phytoplankton and aquatic vegetation, allochthonous OM is often advected from rivers, tributaries, groundwater, or allocated sources mainly from a terrestrial origin. The seasonal distribution of OM sources, its quantity, quality, and environmental physical and chemical characteristics are key factors governing the biogeochemical processes in estuaries. Therefore, it affects the net flux of nutrients to coastal marine ecosystems. Several of those elements are currently threatened by climate change and anthropogenic activities [3,4,5]. Indeed, many estuaries receive industrial, domestic, agricultural, and wastewater discharges, which often are highly enriched by fractions of sewage and fossil fuels, and may include complex OM mixtures [6,7] and other pollutants [8,9] resulting in eutrophication and biodiversity loss [10] and affecting aquatic ecosystem functions [11].
Among the other environmental factors, the origin, composition, and distribution of OM play a relevant role in reshaping the structure and composition of natural microbial communities of estuaries [12,13,14]. Anthropogenic OM sources and compositions were reported to influence water quality and microbial community taxonomic composition and structure in aquatic ecosystems [15]. Wastewater treatment plants (WWTP) are facilities in which several processes aim to remove solids, as well as transform liquid wastes into an acceptable final effluent. The partial degradation of OM and nutrients mineralization occur through a series of stages, such as activated sludge, aeration tanks, bioreactors, and disinfection processes before water is discharged to the environment. However, multiple studies have reported that WWTPs are important sources of several contaminants that may negatively impact aquatic ecosystems, including those of emerging concern [16,17,18]. Besides persistent chemical residuals, OM, and microorganisms remain in treated waters influencing both the bio-physical and ecological conditions, especially when the receiving water body is a semi-closed aquatic transition ecosystem, such as estuaries with higher water residence times [19,20,21,22]. Several lines of evidence suggest that wastewater discharge in estuaries increases the amount of greenhouse gases (GHG) emitted into the atmosphere [16,23,24], as well as other freshwater ecosystems, such as river mouths [25] and lakes [26]. WWTP discharges carry over a significant proportion of remaining microbes associated with the human gut microbiome, including pathogens and other microbial communities besides Coliform bacteria. These microbes are typical indicators of wastewater that can shape the natural community structure and substantially affect their biogeochemical activity [27]. In addition, WWTP discharge changes the water quality by increasing its temperature, altering the nutrient concentration and stoichiometry, as well as, adding antibiotics and other emerging pollutants that affects the microbial community structure [28]. Moreover, WWTP could cause shifts in the functional microbial groups, for instance, methanogenic communities are favored, while methanotrophs and phototrophs are unfavored in WWTP-impacted zones [29,30].
El Sauce catchment, located in Laguna Verde, Valparaíso, has been considered as a eutrophic system for several years mainly due to runoff and loading of various sources of pollution from the constant water discharge of a WWTP, as well as inputs from leachates from a municipal landfill and domestic wastewater [31]. Nevertheless, it is unknown how these disturbances influence GHG and the native microbiome including functional groups associated with GHG recycling. This study aimed to determine the influence of WWTP discharge on the overall biogeochemical conditions along El Sauce estuary in winter and summer, including the changes in the dissolved nutrient and GHG concentration (CO2, CH4, and N2O), OM quality, and benthic microbial community structure.

2. Materials and Methods

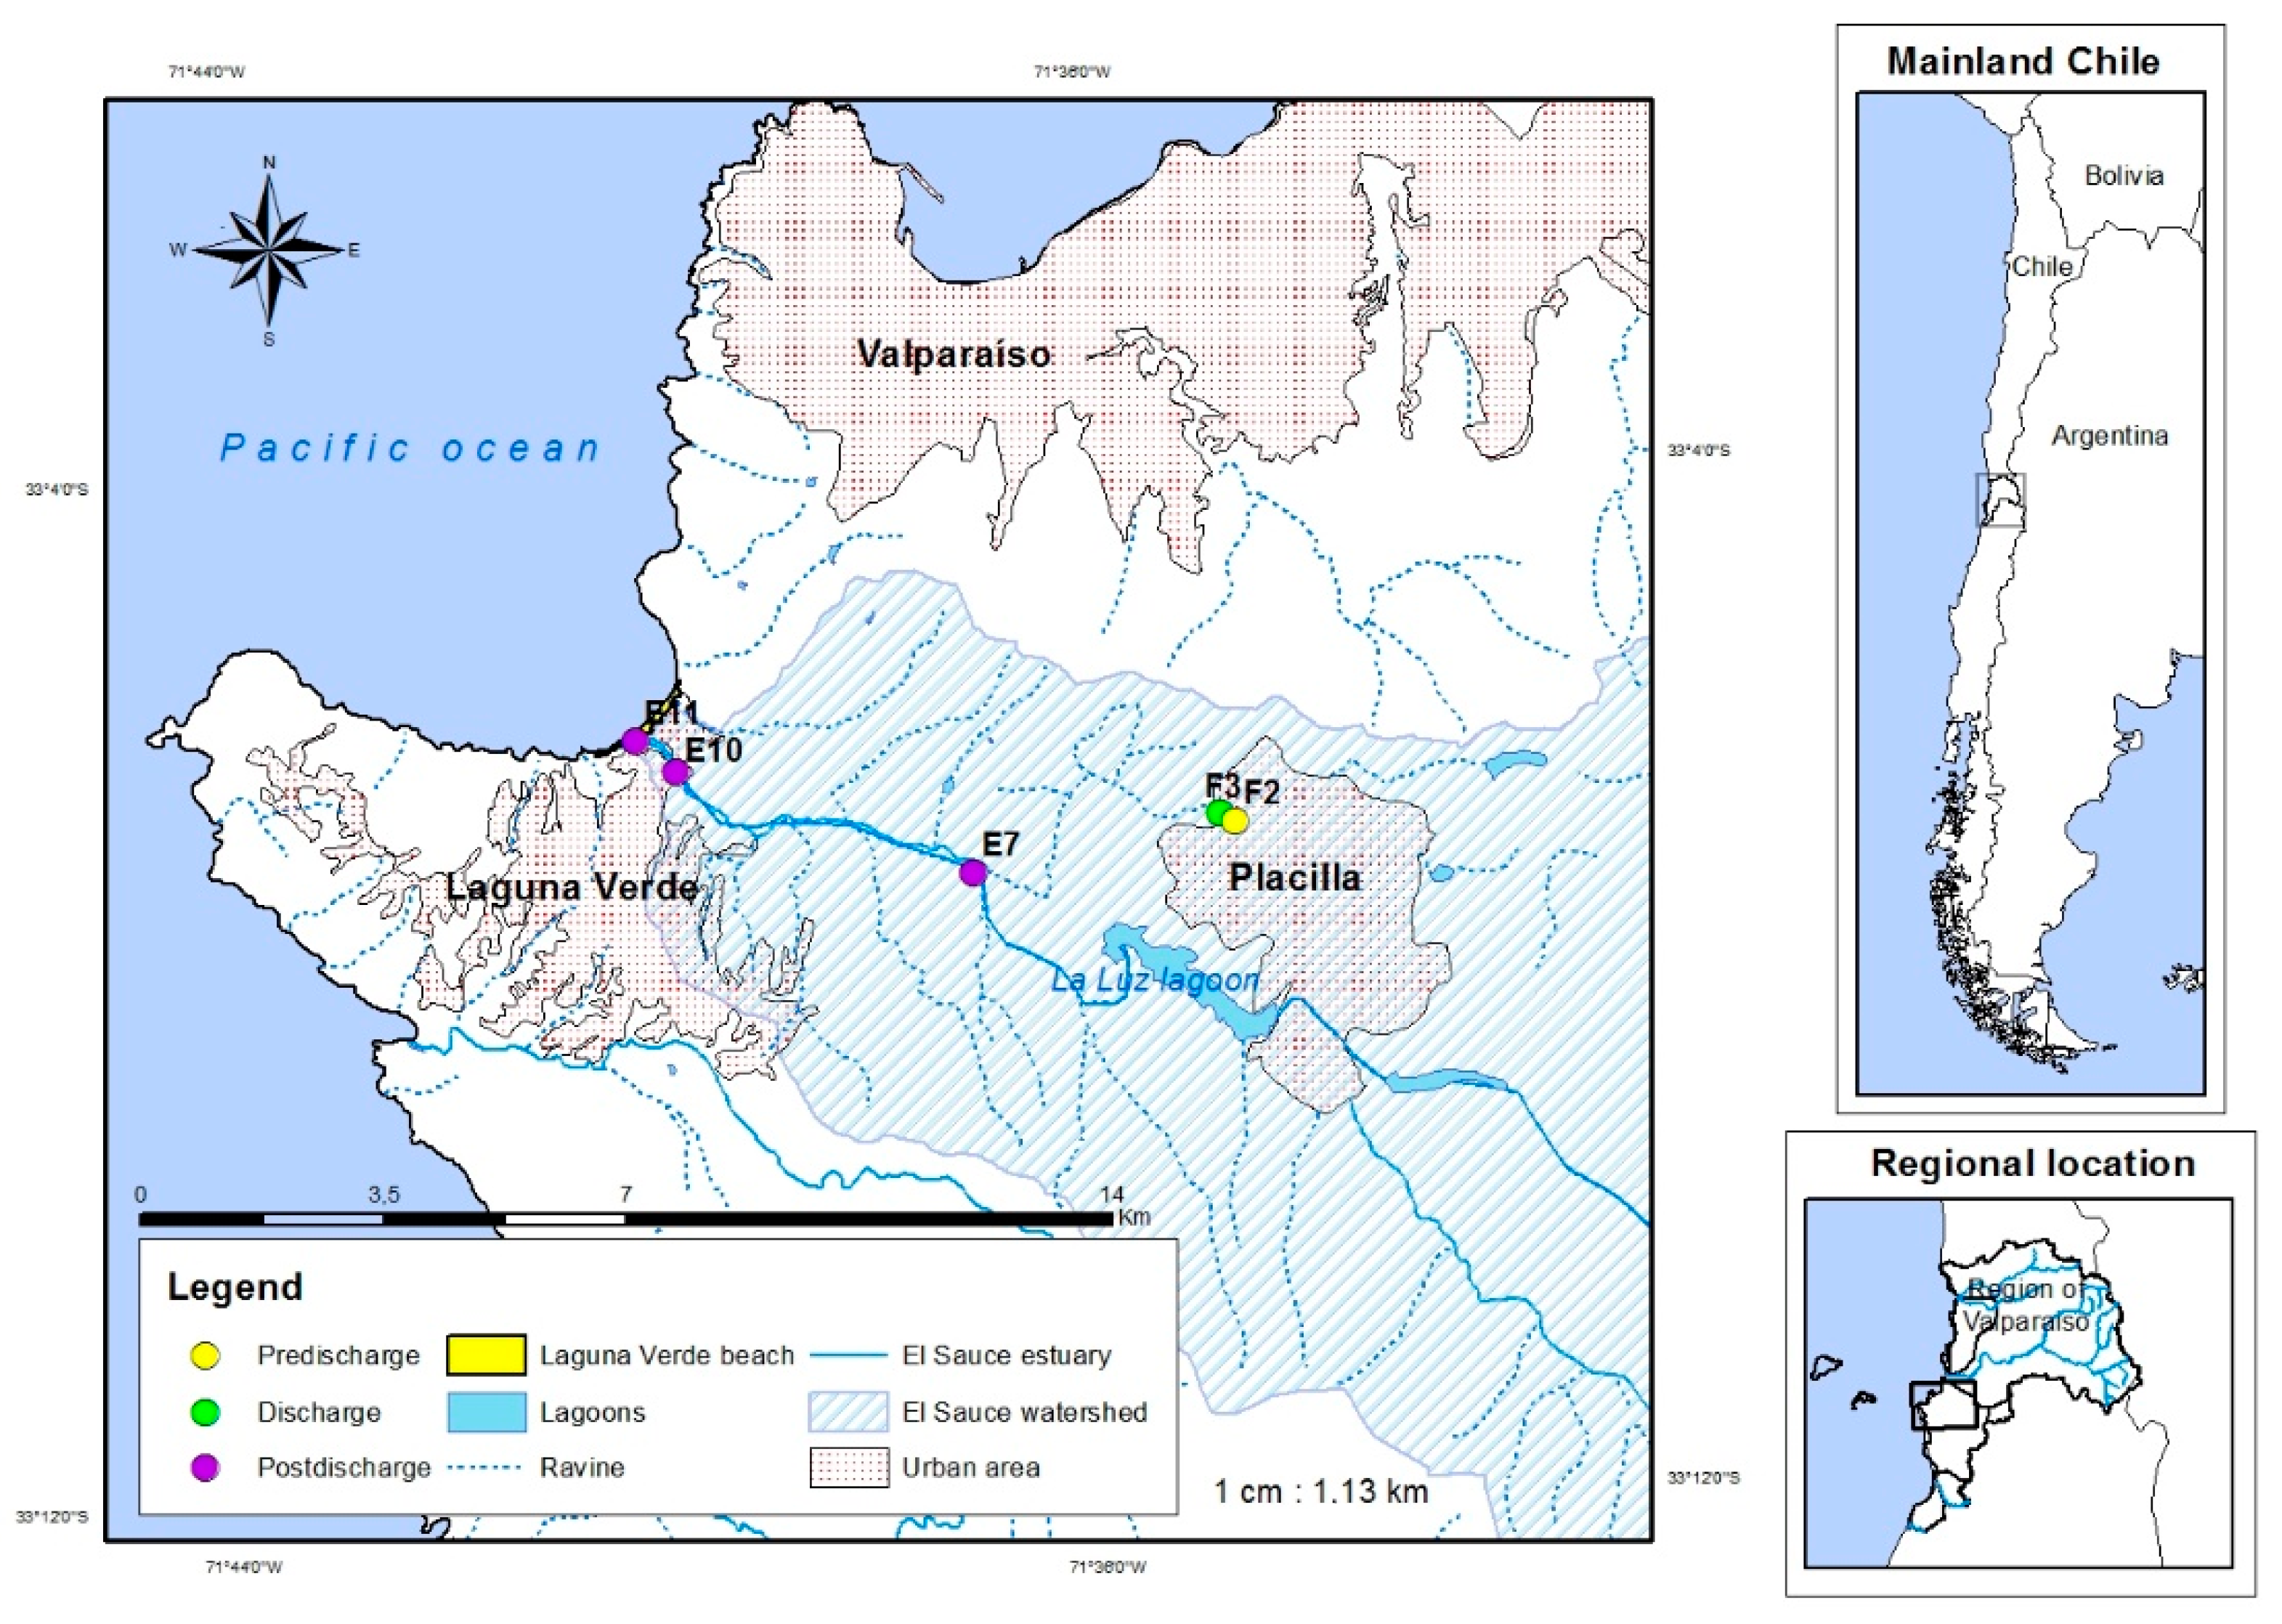
2.1. Study Area and Sampling Procedures

El Sauce estuary is located in Valparaíso (Central Chile; 33°6′ S—71°38′ O), and its main water flow from Las Cenizas basin area is connected with “La Luz” reservoir. The studied stream is situated within the Peñuelas sub-watershed, representing a total of 320.9 km2 (DGA, 2014). [32] As a part of the coastal watershed complex called “Aconcagua/Maipo Coast”, the water flow is mainly dependent on rainfall and anthropogenic activities. It is important to note that a sandbar avoiding superficial water exchanges between the stream and the ocean is almost constantly present at the estuary and was present during both sampling periods. Field work to collect physicochemical data water and sediments samples was conducted on August 26, 2019 (austral winter) and January 07, 2020 (austral summer). Five sites were sampled along the main tributary and estuary mouth of the Las Cenizas basin following a previous report (Rivera-Castro et al., 2020) [31]. Two sampling sites from the upper area of the main tributary were located 30 m upstream (F2) and 30 m downstream of the WWTP discharge (F3). A third site (E7) was located at an intermediate tributary area characterized by a pond. The last two sampling sites were situated near the estuary (E10) and in the mouth (E11) (Figure 1). During winter and summer, the tributary upper and intermediate portions were shallow, with a 10–20 cm water depth, whereas at the estuary mouth the water depth was approximately 50–60 cm.
Physicochemical parameters such as temperature, pH, dissolved oxygen (DO), and conductivity were recorded in the surface water in triplicate (except for DO) using a multiparameter probe (YSI and ProDSS model). Triplicate water samples were collected from the water surface for nutrients, including nitrate (NO3), nitrite (NO2), phosphate (PO43−), and silicic acid (SiO44−) determinations. The water was filtered through a 0.45 µm GFF filter and collected into 60 mL “Nalgene” bottles (Nalgene, Waltham, MA, USA). These bottles were kept cool for less than 3 h and frozen at −20 °C until further analysis. Additionally, water samples were collected to determine the concentration of dissolved GHG (CO2, N2O, and CH4) using 20 mL gas-tight vials, in triplicate. These vials were filled under water to avoid bubbles, then, were immediately fixed with 50 µL saturated HgCl2 solution, and stored at room temperature in the dark until their analysis in the laboratory. Water samples that met the standard water quality parameters, according to Chilean regulation NCh409/84, were also collected in triplicate and transported to the laboratory following procedures established by the Standard Methods Book [33]. For the determination of Chlorophyll-a concentration, in triplicate, discrete water samples (500 mL) were filtered onto GF/F filters (Whatman® glass microfiber filters, USA, Sigma Aldrich), and then stored and frozen until laboratory analyses.
Surface sediment samples were sampled in sealable bags for organic matter and granulometry determinations and were kept at 4 °C for further laboratory analyses. Fine-grained sediment samples were collected to determine carbon (δ13C) and nitrogen (δ15N) isotopes and stored in cryotubes (2 mL, in duplicate). Additionally, fine-grained sediments were sampled for molecular microbial community composition analysis in cryotubes (2 mL, in duplicate) filled with RNA later (Ambion, Life Technologies, Carlsbad, CA, USA, Thermo Fisher Scientific) to preserve nucleic acids [34]. All the sediment samples were transported under cool conditions using gel packs (less than 3 h). Sediments for isotopic and microbial community analyses were stored frozen at −80 °C until analyses.

2.2. Laboratory Procedures for Biochemical Parameters

Nutrients concentrations were determined through spectrophotometric methods. Nitrate and nitrite concentration were determined following Strickland et al. (1972) [35] and PO43- and SiO44- were measured following Atlas et al. (1971) [36] using a nutrient autoanalyzer. Chlorophyll-a concentration was determined in discrete seawater samples according to the method described by Holm-Hansen et al. (1965) [37]. Dissolved GHG concentrations in water were determined by gas chromatography through the headspace technique McAuliffe (1971) [38] using a Greenhouse GC-2014 Shimadzu chromatograph equipped with an electron capture detector (ECD) for N2O and a flame ionization detector (FID) for CO2 and CH4 attached to a methanizer for the conversion of CO2 into CH4. Calibration was carried out using three calibration points using helium, air, and a standard ratio of 600 to 5, to 1 of a CO2, CH4, and N2O mixture for absolute quantification (Scotty gas mixture; Air Liquid Co., Paris, France). Standard water quality parameters such as transparency, turbidity, color, dissolved total solids (DTS), sulfates, chlorides, fecal coliforms, and BOD5 (biochemical oxygen demand) according to Chilean regulation NCh1333/78 were measured following the Standard Methods Book [33]. All the chemicals used for the above analyses were of analytical grade.

2.3. Sediment Granulometry, Organic Matter, and Isotopic Analyses

Sediment granulometry of samples were assessed using dry sediment (40 °C during 24 h) and analyzed by standard mesh analysis method to sort out the sand, gravel, and silt size fractions (Friedman and Sanders 1978) [39]. Total organic matter was determined using the Loss-On-Ignition (LOI) method in a muffle furnace [40]. Carbon (δ13C) and nitrogen (δ15N) isotopes were analyzed using mass spectrometry (Thermo Scientific Delta V Advantage IRMS using an EA-2000 Flash Elemental analyzer, Waltham, MA, USA) according to Pee Dee Belemnite (VPDB) and the air standards of the Laboratory of Biogeochemistry and Applied Stable Isotopes (LABASI, PUC, Chile).

2.4. Benthic Microbial Community Characterization Using Molecular Approaches

DNA was extracted using the DNAeasy PowerSoil DNA Isolation Kit (Qiagen, Germantown, MD, USA). Briefly, after thawing, the RNA later buffer was removed from the sample, then 250 mg of wet sediment was weighted and distributed into the PowerBead tubes provided by the manufacturer. DNA extracts were quantified (1.3–40 ng/µL) using the dsDNA BR (Broad Range) Qubit 2.0 fluorometer (Thermo Fisher Scientific, Waltham, MA, USA), and DNA quality (260/280) was determined by spectrophotometry using Cytation 5 (BioTek, Shoreline, WA, USA), and template amplification was tested using conventional 16S rDNA PCR using 27F and 519R primers. DNA extracts (n = 10) were sent to the Illumina Miseq sequencing platform in Mr. DNA laboratory (Shallowater, TX, USA) to be sequenced using 515F (GTGYCAGCMGCCGCGGTAA) [41] and 806R (GGACTACNVGGGTWTCTAAT) primers [42] for the V4 region of the 16S rDNA gene. The sequences were deposited in the European Nucleotide Archive (ENA) under project accession ID PRJEB44347 and primary accession samples (ERR9814522–ERR9814533). The stations were separated into three categories, e.g., pre-discharge (F2), discharge (F3), and post-discharge (E10 and E11). Samples from station E7 were not included in the microbial communities’ analysis. The same criteria were used in the qPCR analyses.

2.5. Quantitative PCR Analyses

Ammonia oxidizing bacteria from the Betaproteobacteria (βAOB), comammox Nitrospira sp, Methanotrophic bacteria associated with Methylobacter-like ones, and Methanogenic archaea functional groups were quantified using the following functional genes amoA, comaA, pmoA, and mcrA, respectively, with the primer references and qPCR conditions shown in Table 1. The qPCR reactions used approximately 10 ng of DNA as a template and 20 µL reactions using the Power SYBR Green Master Mix (Applied Biosystems, Waltham, MA, USA) using the QuantStudio 3 thermocycler (Applied Biosystems, Waltham, MA, USA).
Data were collected and further analyzed by the software QuantStudioTM Design and Analysis Software v1.5.2. The reactions were run following the manufacturer’s recommendations and previous protocols available in the laboratory for βAOB [48] and methanogens [49]. All the reactions were run in triplicate using the standards available in our laboratory (Table 1), and the results are expressed as gene copies per gram of wet sediment. Detection limits were confirmed by the dynamic range of the curves, which were above CT 31–33 (~40 copies × µL), and the expected amplicon peak during the melting curve inspection.

2.6. Sequencing Data Curation and Taxonomic Classification Processing

QIIME2 (v.2019.7) was used for sequence curation and taxonomic classification into Amplicon Sequence Variant (ASVs) [50]. First, the sequences were imported to QIIME2 using Casava. Then, the sequences were demultiplexed, and poor-quality or short sequences (<210 bp length) were removed using qiime dada2 denoised-paired plugin [51]. The summer samples from E7 contained a few sequences, and thus, were removed for further analyses. Taxonomic classification was performed using the SILVA132 database (V4 subunit of the 16S rRNA gene region) with the feature-classifier classify-consensus-vsearch plugin [52].

2.7. Statistical Analyses

All the statistical analyses were carried out using R software [53]. Because the normality assumption cannot be verified with our data, Spearman correlations were conducted to evaluate the relationships between the physical and chemical conditions in water and sediments using the rcorr function with the ‘Hmisc’ package [54]. Graphical visualization, including significance, were generated using the corrplot package [55]. Taxa bar plots for phylum and functional groups related to GHG recycling spatial and winter/summer changes were generated using the ‘phyloseq’ package [56]. In addition, to determine the potential changes associated with the influence of WWTP discharge in the benthic microbial community structure and their association with environmental conditions, the samples were grouped as: pre-discharge (F2), discharge (F3), and post-discharge stations (E10 and E11) and plotted using the amp_heatmap function of the ‘ampvis2′ package [57]. A redundancy analysis (RDA) was performed using the ordinate function of the ‘phyloseq’ package to determine the relationship between the microbial community (Phylum level) shifts and the environmental factors using the envfit function of vegan package [58] to identify the significance of the correlation. A differential analysis of ASVs was performed using the ‘DESeq2′ package, specifically, the DESeq function. The data used for the comparison are the ASV of each crude sample, without normalization. The results are visualized in a Volcano Plot [59]. SIMPER (Similarity Percentage) analysis was conducted using PRIMER6 software [60] to identify the phylum contributions between the pre-discharge, discharge, and post-discharge stations.

3. Results

3.1. Environmental Factors, Nutrients, and Water Quality Variables

The surface water temperature of El Sauce estuary was characterized by lower values in winter (12.1–17.6 °C) compared to those in summer (17.63–26.1 °C), and the maxima were found associated with the WWTP discharge station F3 (Figure 2A,B). The water pH was lower at the upper stations, particularly in F3 station, which was characterized by pH values < 6.86 in winter and summer, compared to those of the post-discharge stations, where pH > 7.4 was detected (Figure 2A,B). Water conductivity was found to increase from the upper portion towards the mouth, ranging from 766 to 1304 µS cm−1 and 828 to 4150 µS cm−1 in winter and summer, respectively. In general, the DO demonstrated spatial conductivity shifts, but with a higher variability in winter compared to that in summer (Figure 2C,D).
The nutrients (i.e., nitrite, nitrate, silicate, and phosphate) at the F2 and F3 stations were characterized by extreme changes in nitrate and nitrite, which reached the lowest values at the WWTP discharge station (F3 station), <14 µM for nitrate and <3 µM for nitrite in winter and summer, respectively. The highest values of nitrate and nitrite concentrations were registered in the upper tributary and intermediate pond stations (F2 and E7,) with >200 and µM > 100 µM values in summer (Figure 2E,F), respectively. Estuary stations E10 and E11 were characterized by similar nitrate and nitrite concentrations, and slightly higher concentrations towards the mouth (from E10 to E11) during summer (Figure 2E,F). The phosphate concentrations were higher in the upper tributary station (F2), and unlike other nutrients, greater concentrations were found in winter (>15 µM) than those in summer (<5 µM). The F3 and E11 stations exhibited lower concentrations (<1 µM) in both seasons (Figure 2G,H). Except for the upper tributary (Station F2) in summer, silicate presented lower concentrations during winter (320–100 µM) versus those in summer (100–250 µM) from F3 station to the estuary mouth (Figure 2G,H).
The water quality conditions based on additional physicochemical variables, such as transparency, color, and dissolved total solid (DTS), exceeded the maximum permitted values for agricultural irrigation and animal consumption according to the environmental Chilean regulation NCh1333/78 (Table 2). Moreover, fecal coliforms also exceeded the allowed values (>1000 CFU/mL) in the upper tributary (F2) and in the mouth (E11) in both the summer and winter seasons.

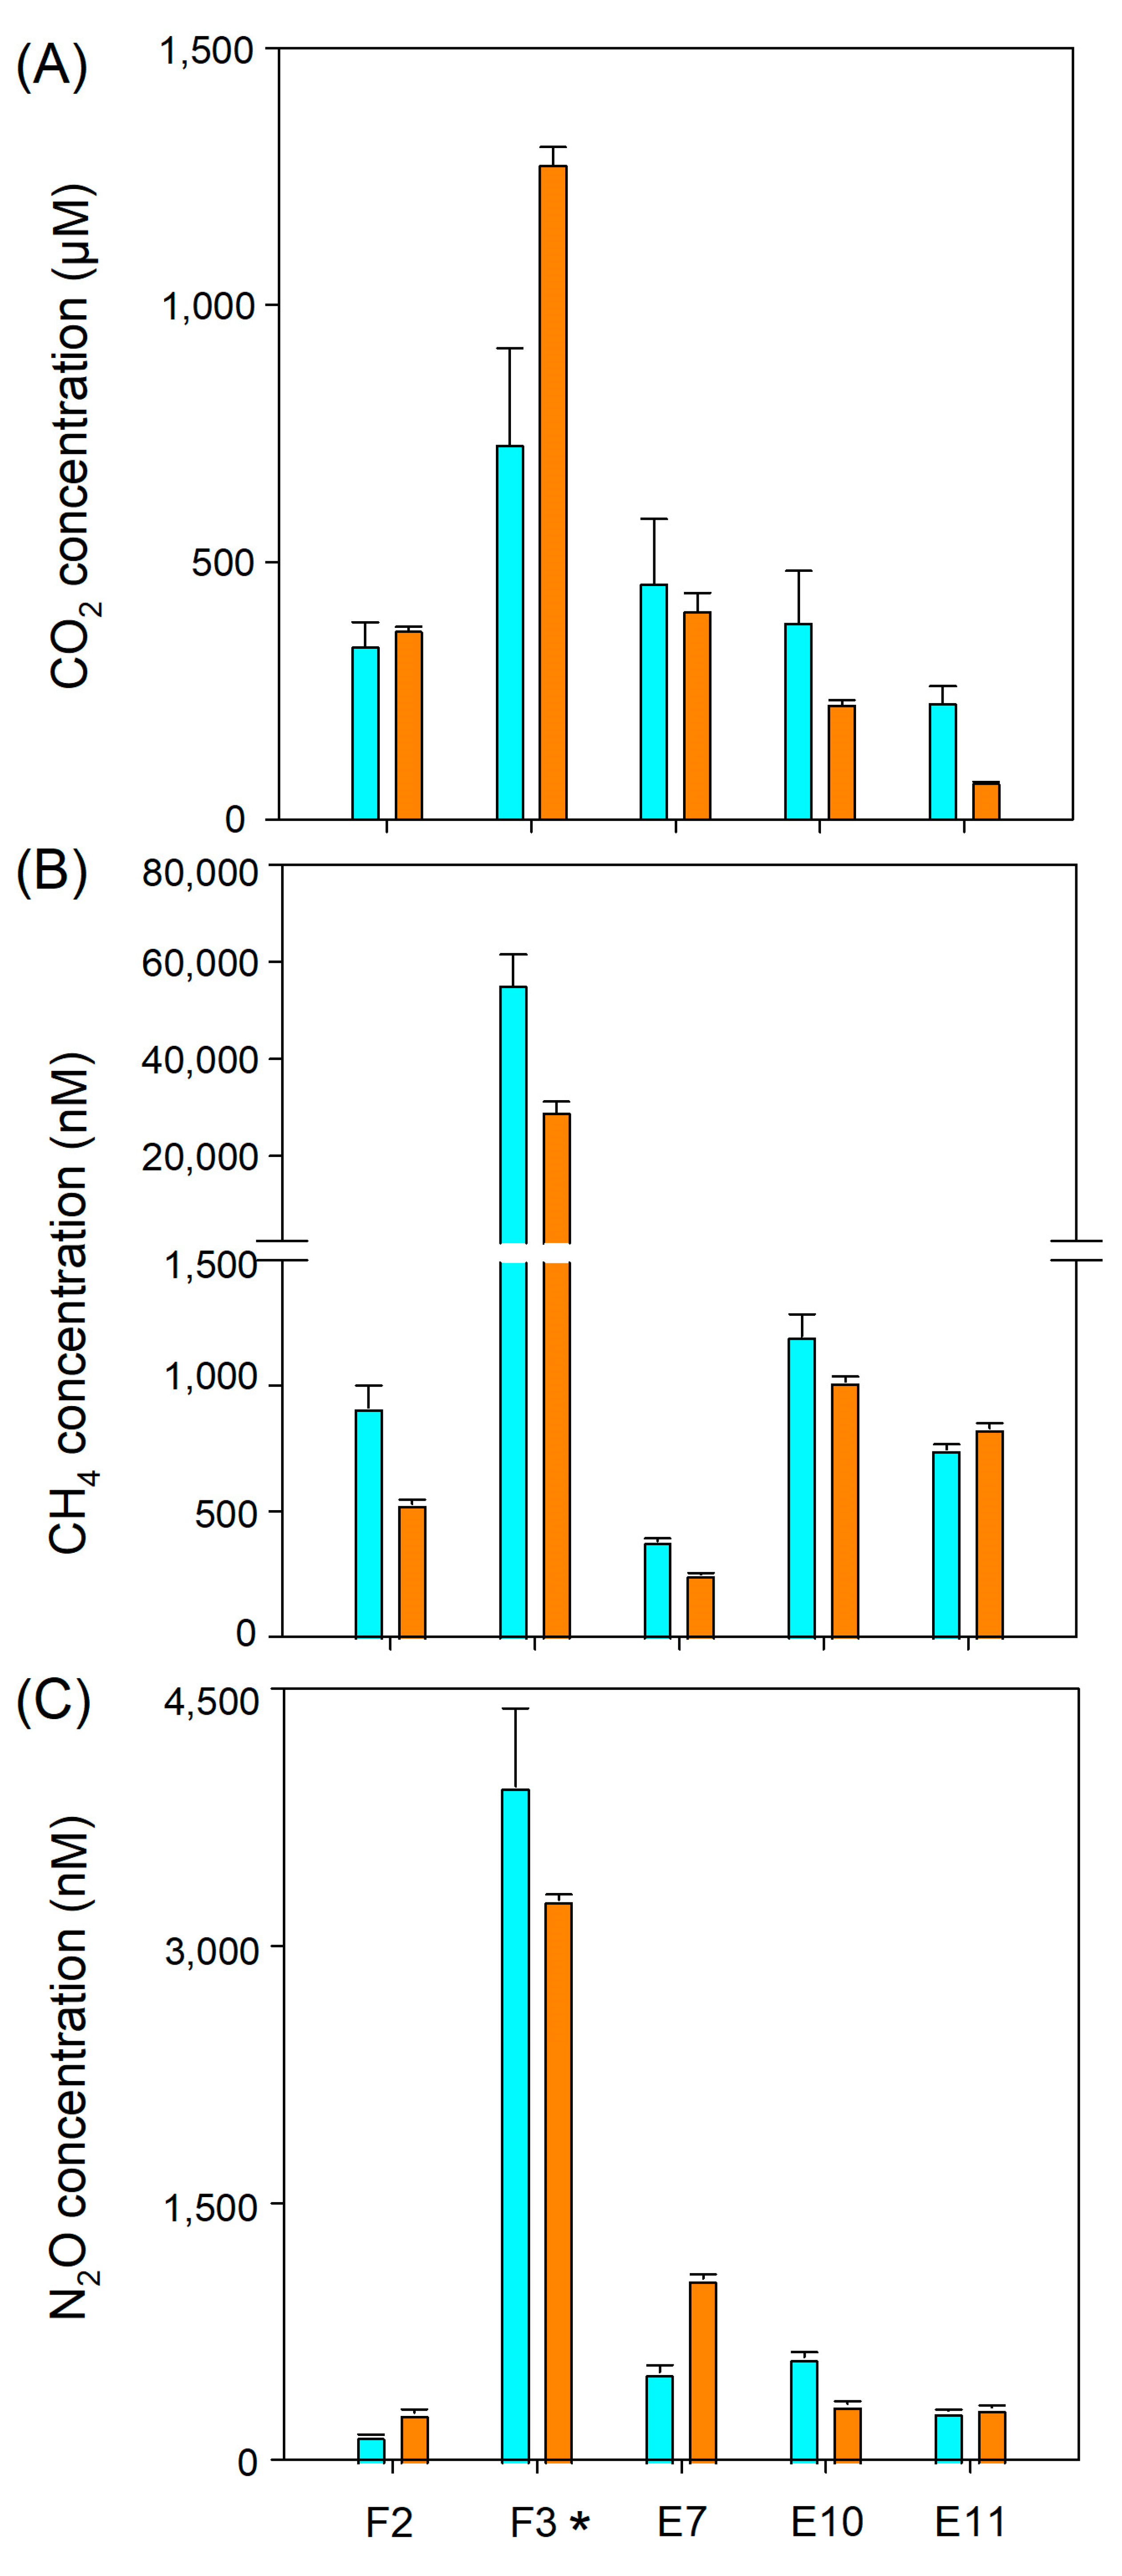
3.2. GHG Distribution along El Sauce Estuary

WWTP discharge has a high impact on the dissolved concentration of GHG in the Laguna Verde estuary, which presented a maximum value at station F3 (WWTP discharge site), reaching up to 1200 µM CO2 in summer, and 55,301 nM CH4 and 3930 nM N2O in winter (Figure 3). These dissolved CH4 concentration values were up to 60 fold higher than they were in the upper tributary pre-discharge water (Station F2). While the WWTP discharge increases the concentration of methane to a greater extent than the concentrations of N2O and CO2, those gases registered a continuous decrease from the intermediate pond (Station E7) to the estuary mouth (Figure 3).

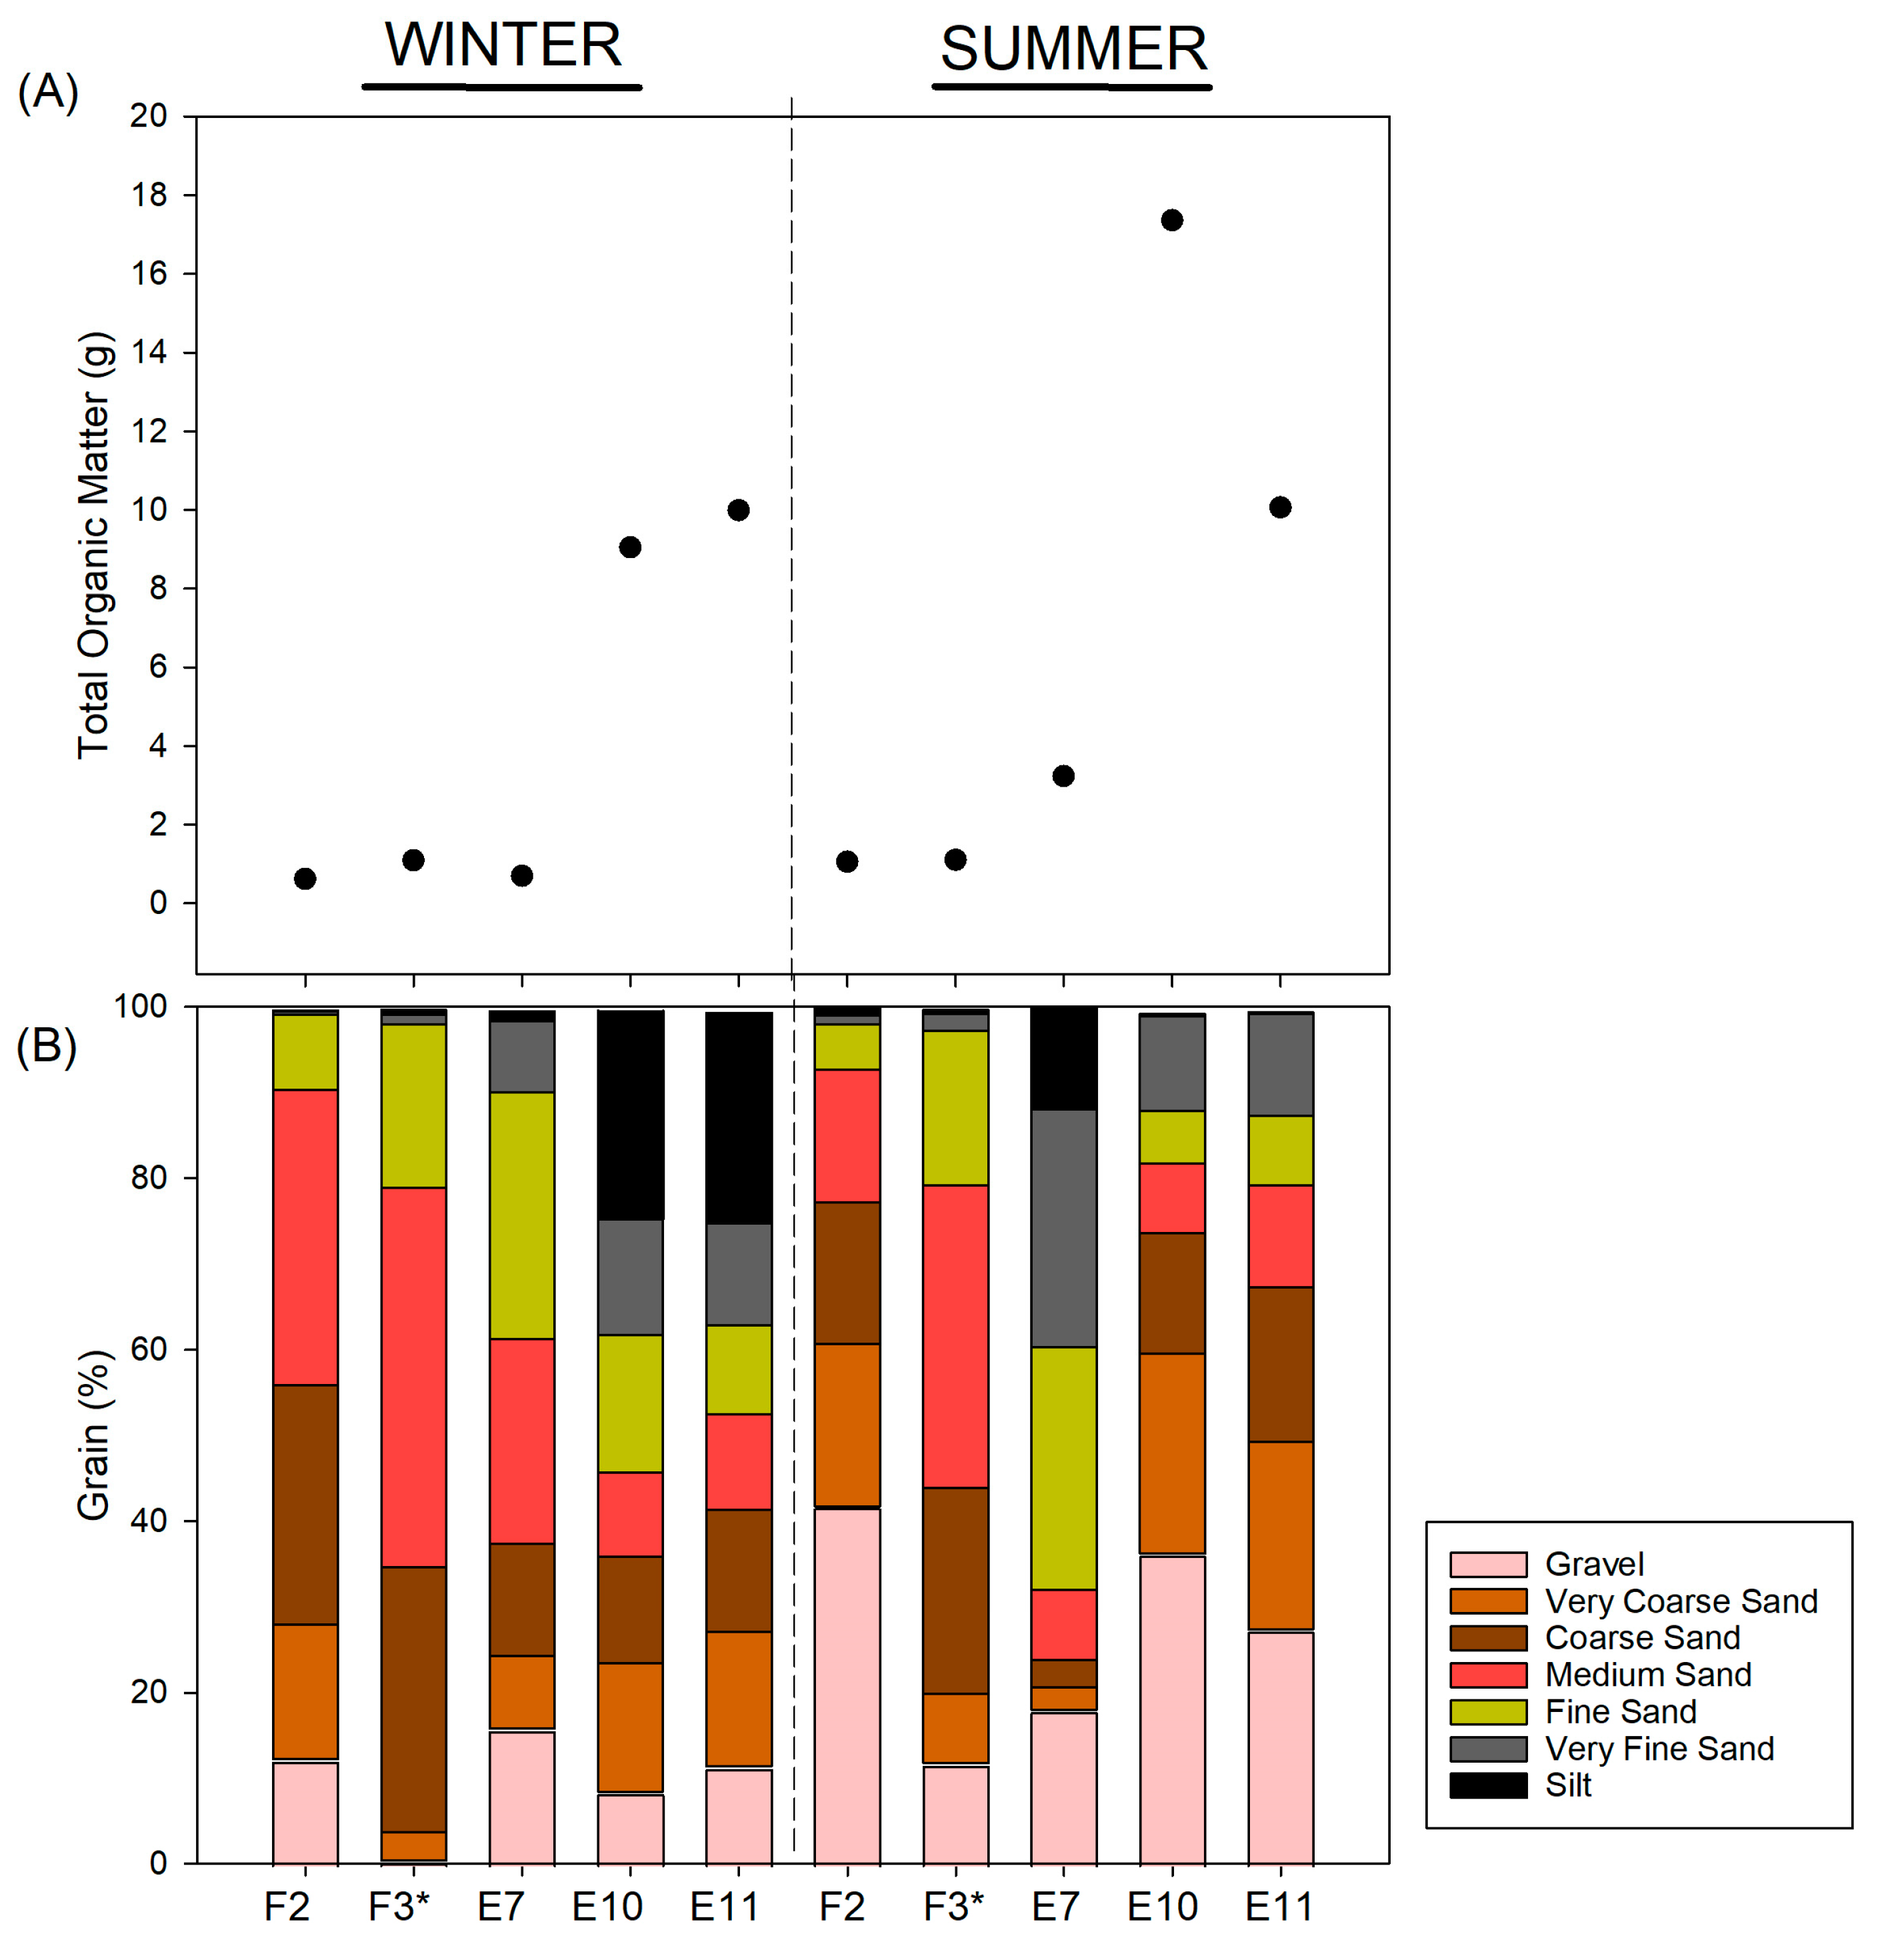
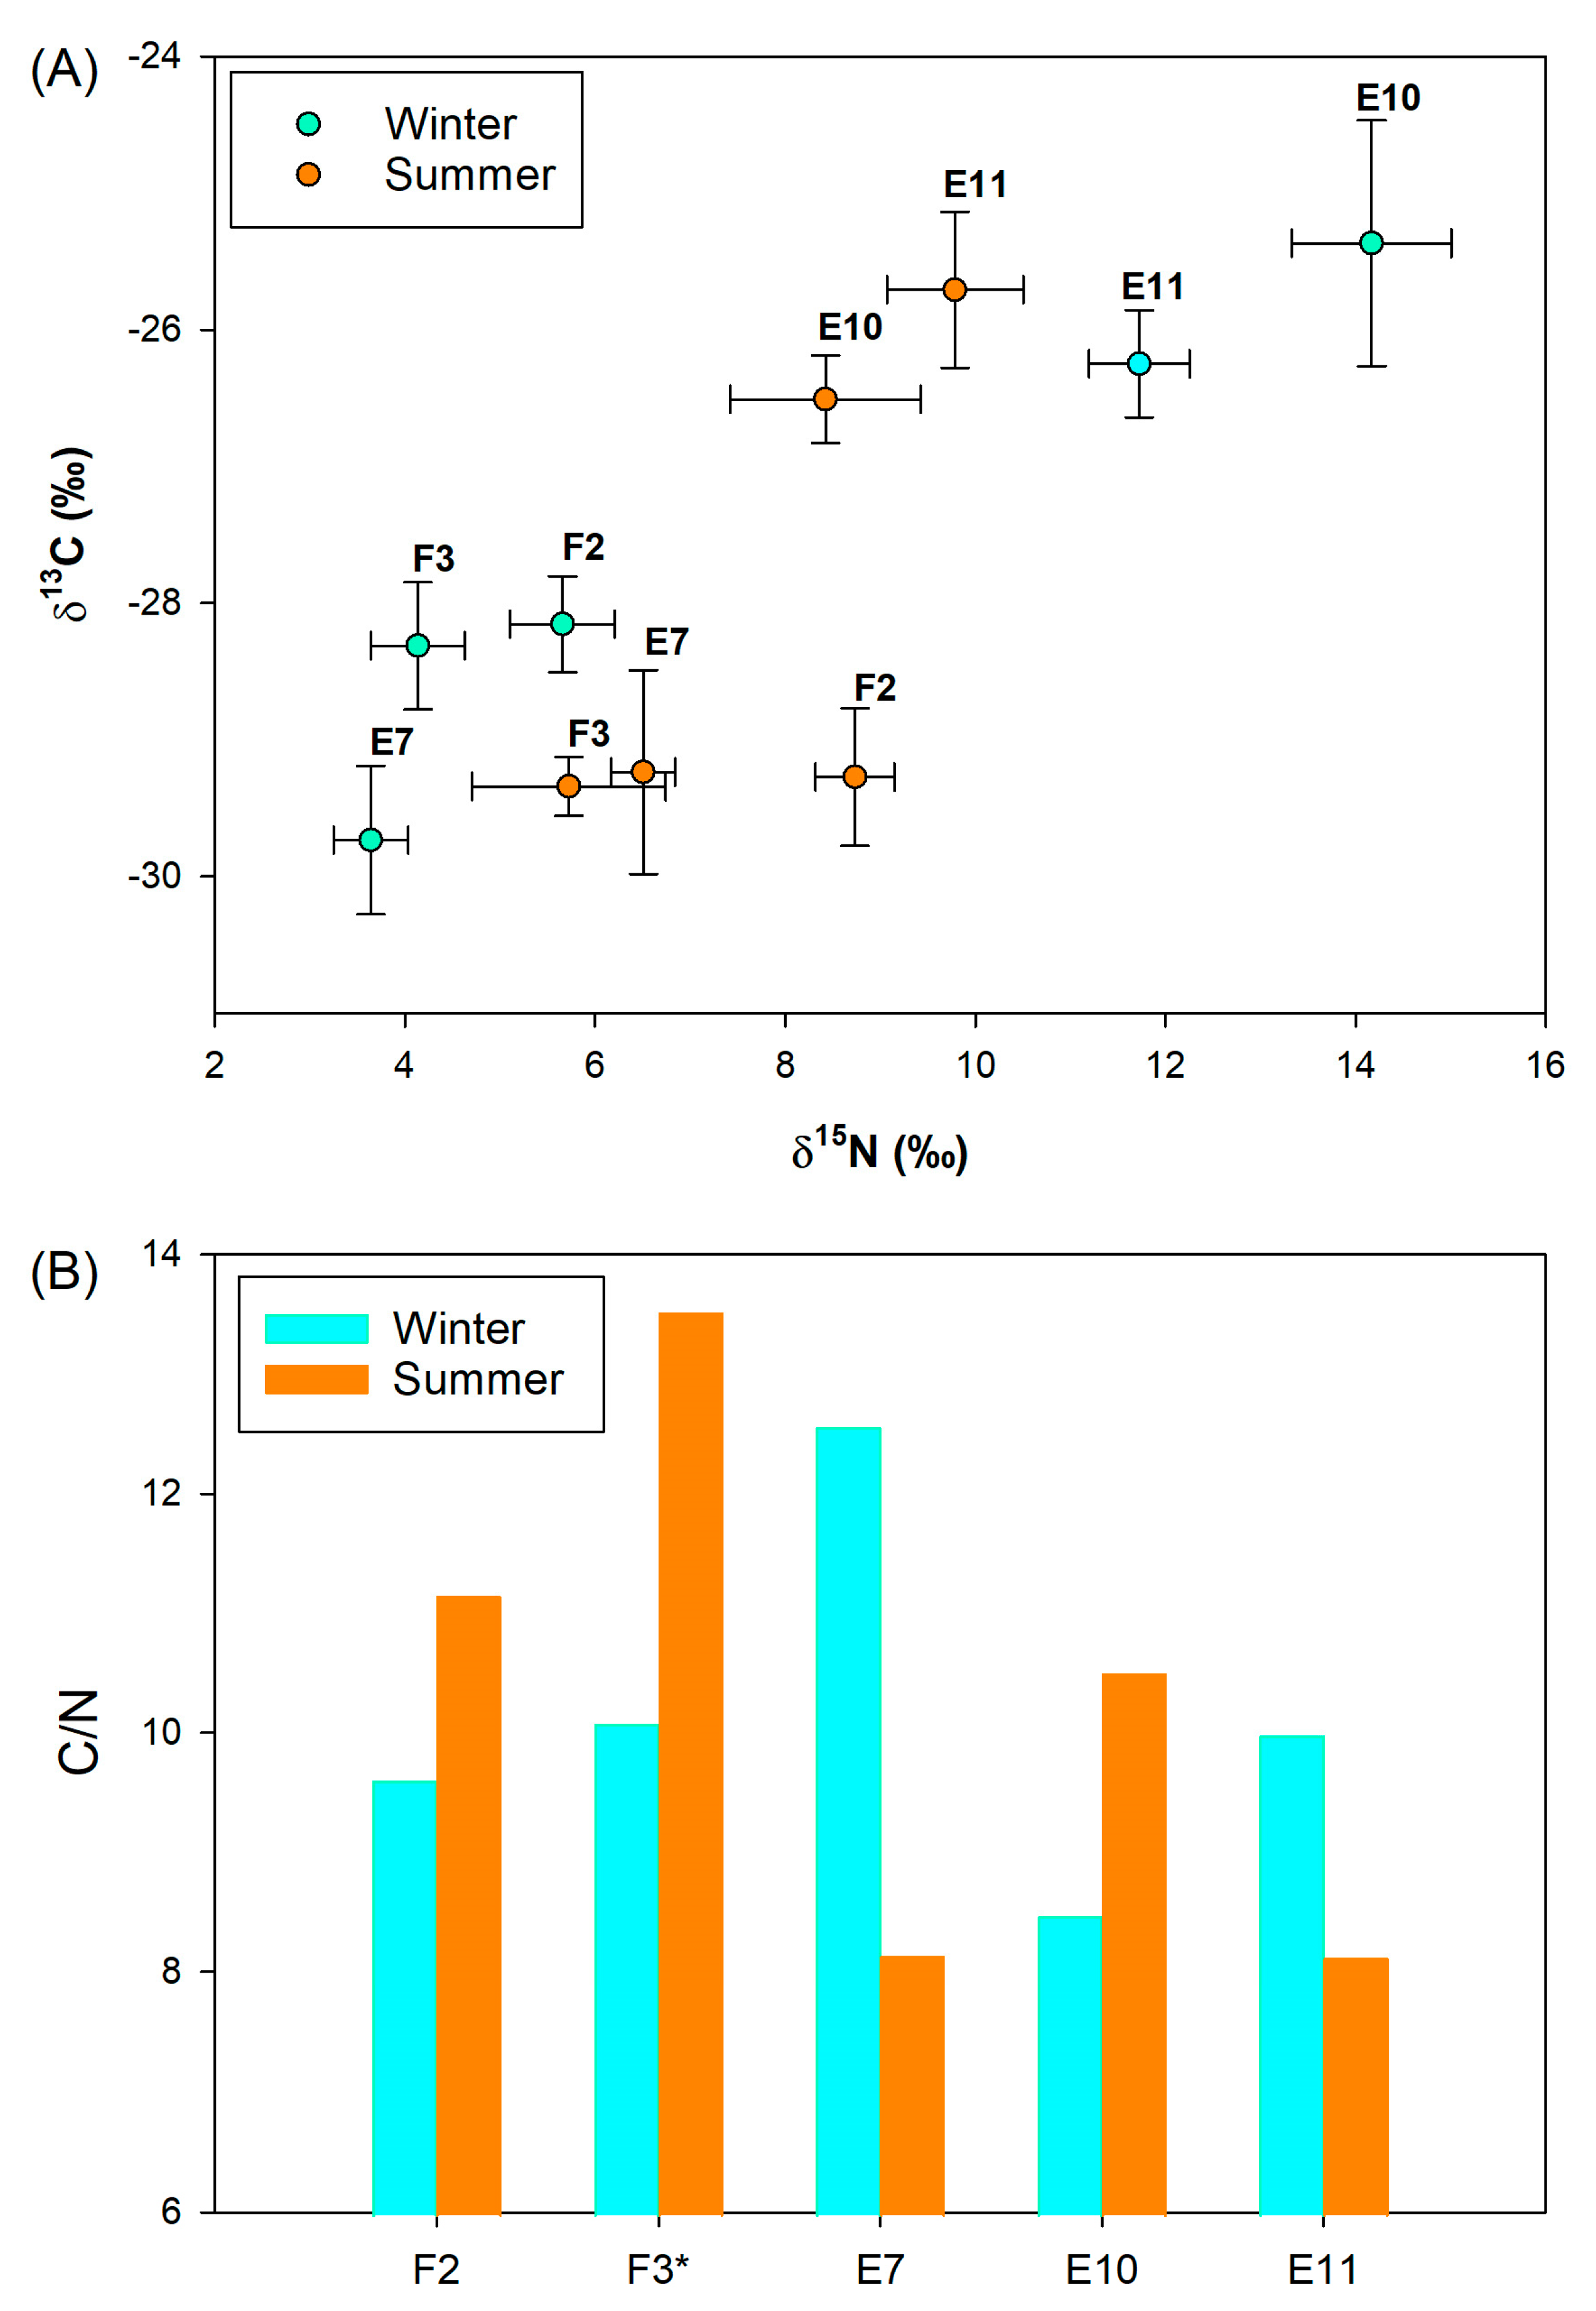
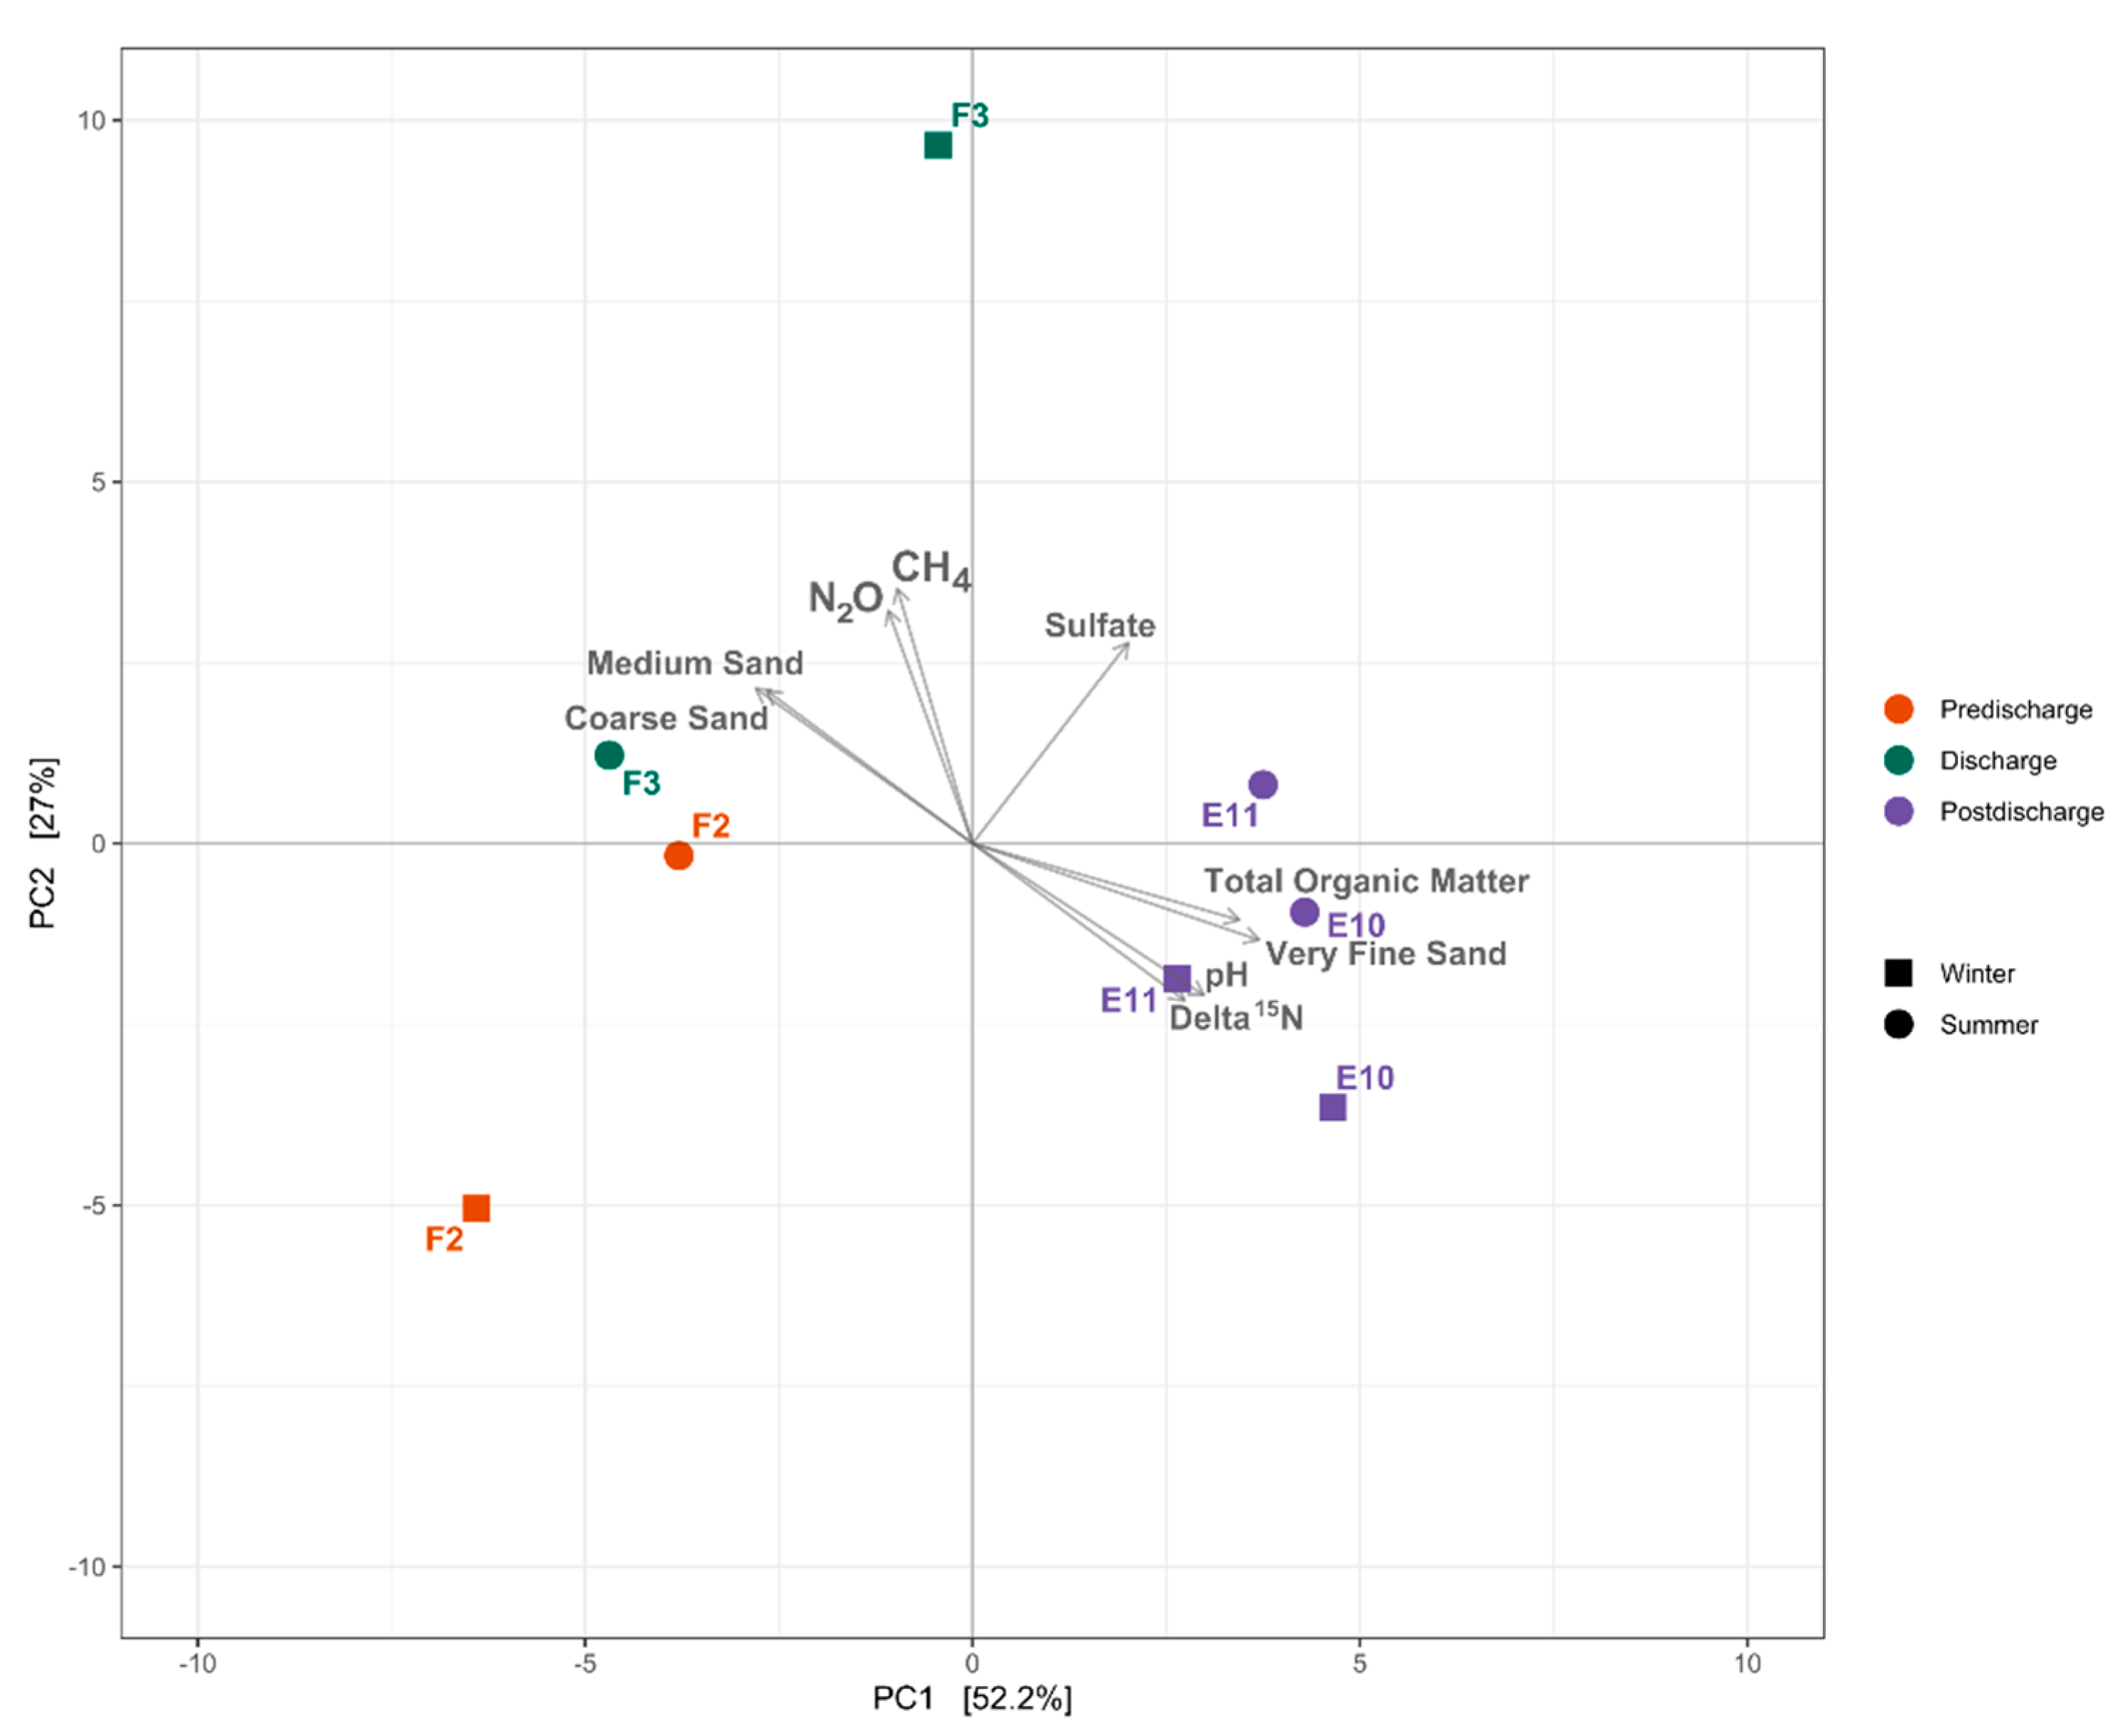
3.3. Sedimentary Conditions and Potential Organic Matter Quality

Sediments were characterized by the predominance of larger particle sizes (i.e., medium–coarse and very coarse ones) in the upper tributary, whereas lower particle sizes (i.e., silt and very fine sand) were found in the sediments of the mouth, especially during winter compared to those of the summer samples (Figure 4). The total organic matter (TOM) increased by >100 % (<4 to >8 g) from the upper tributary (F2 and F3) and intermediate pond (E7) post-discharge WWTP to the mouth stations (E10 and E11) (Figure 4).
The isotopic organic matter signatures coincided with TOM shifts characterized by a marked difference in δ15N versus δ13C isotopes ratios, predominantly ~29 δ13C and ~6 δ15N in the upper tributary compared to the mouth estuary sediment, ~26 δ13C and ~12 δ15N (Figure 5A), showing higher δ15N ratios in summer compared to those in winter. In addition, higher C/N ratios were found in the WWTP discharge during summer and the intermediate pond water during winter (C/N > 10), whereas lower ratios were determined around the mouth station (E10 and E11) and the intermediate pond water during summer, reaching C/N < 8 (Figure 5B).

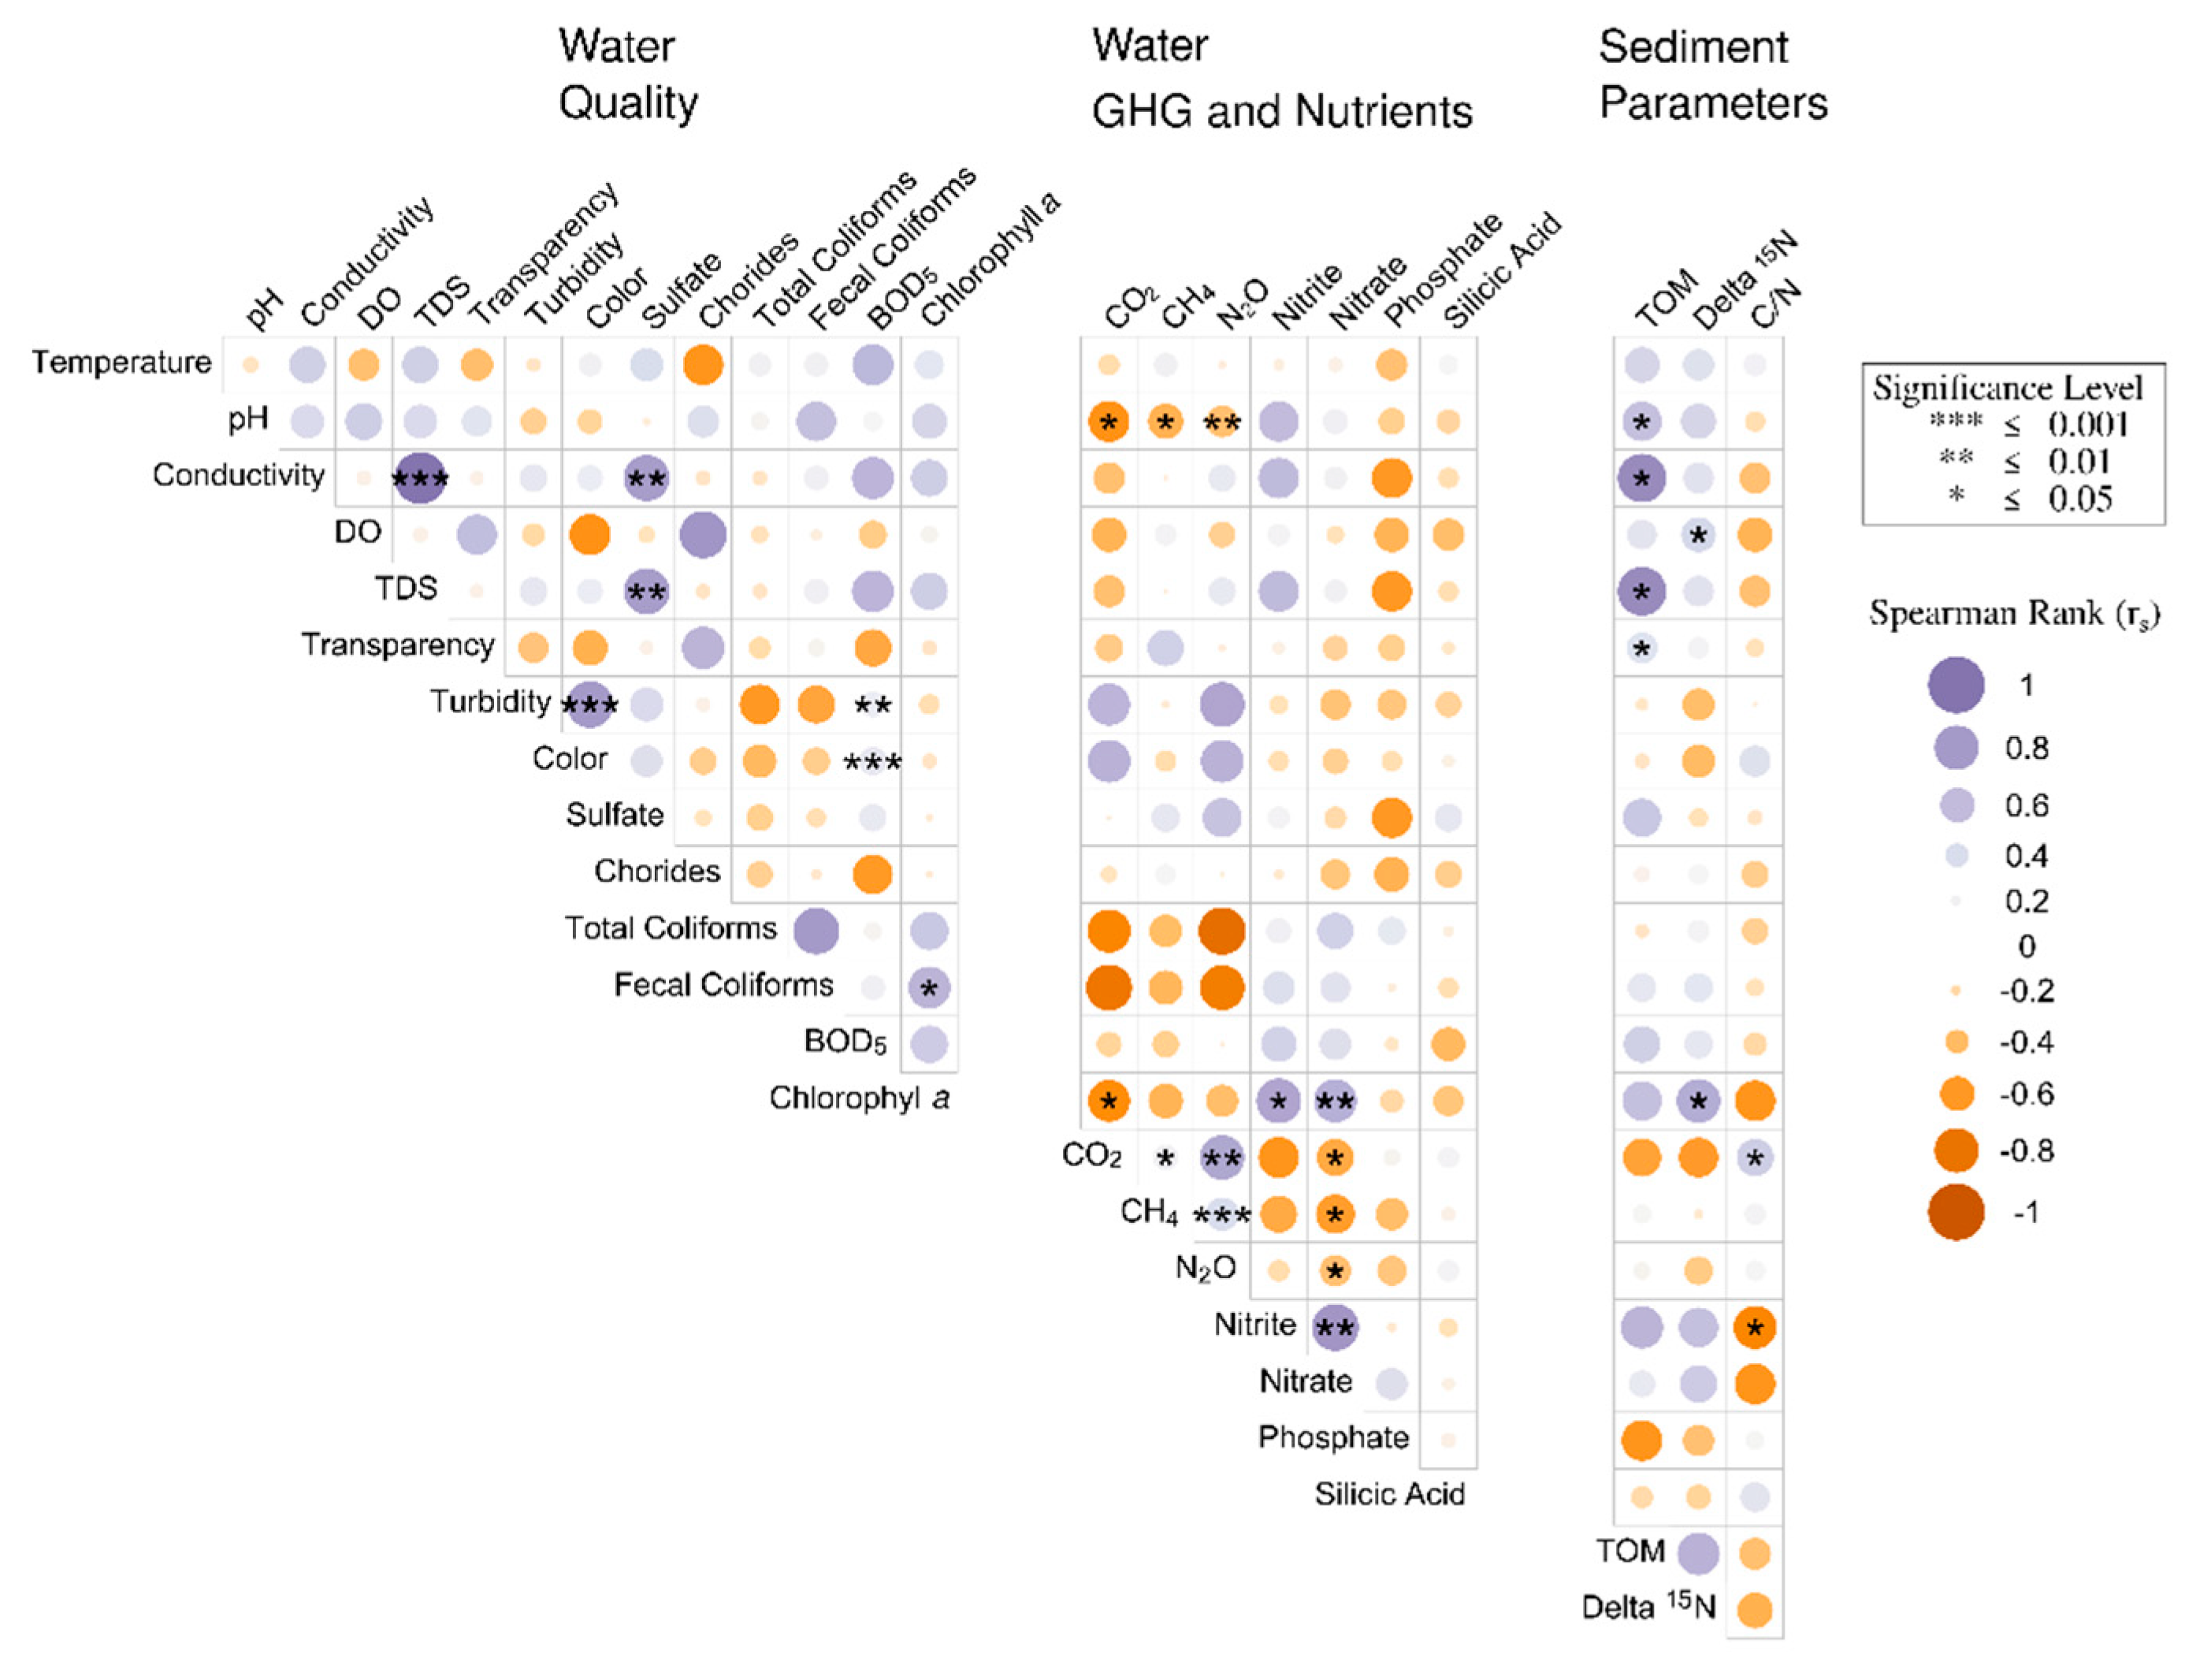
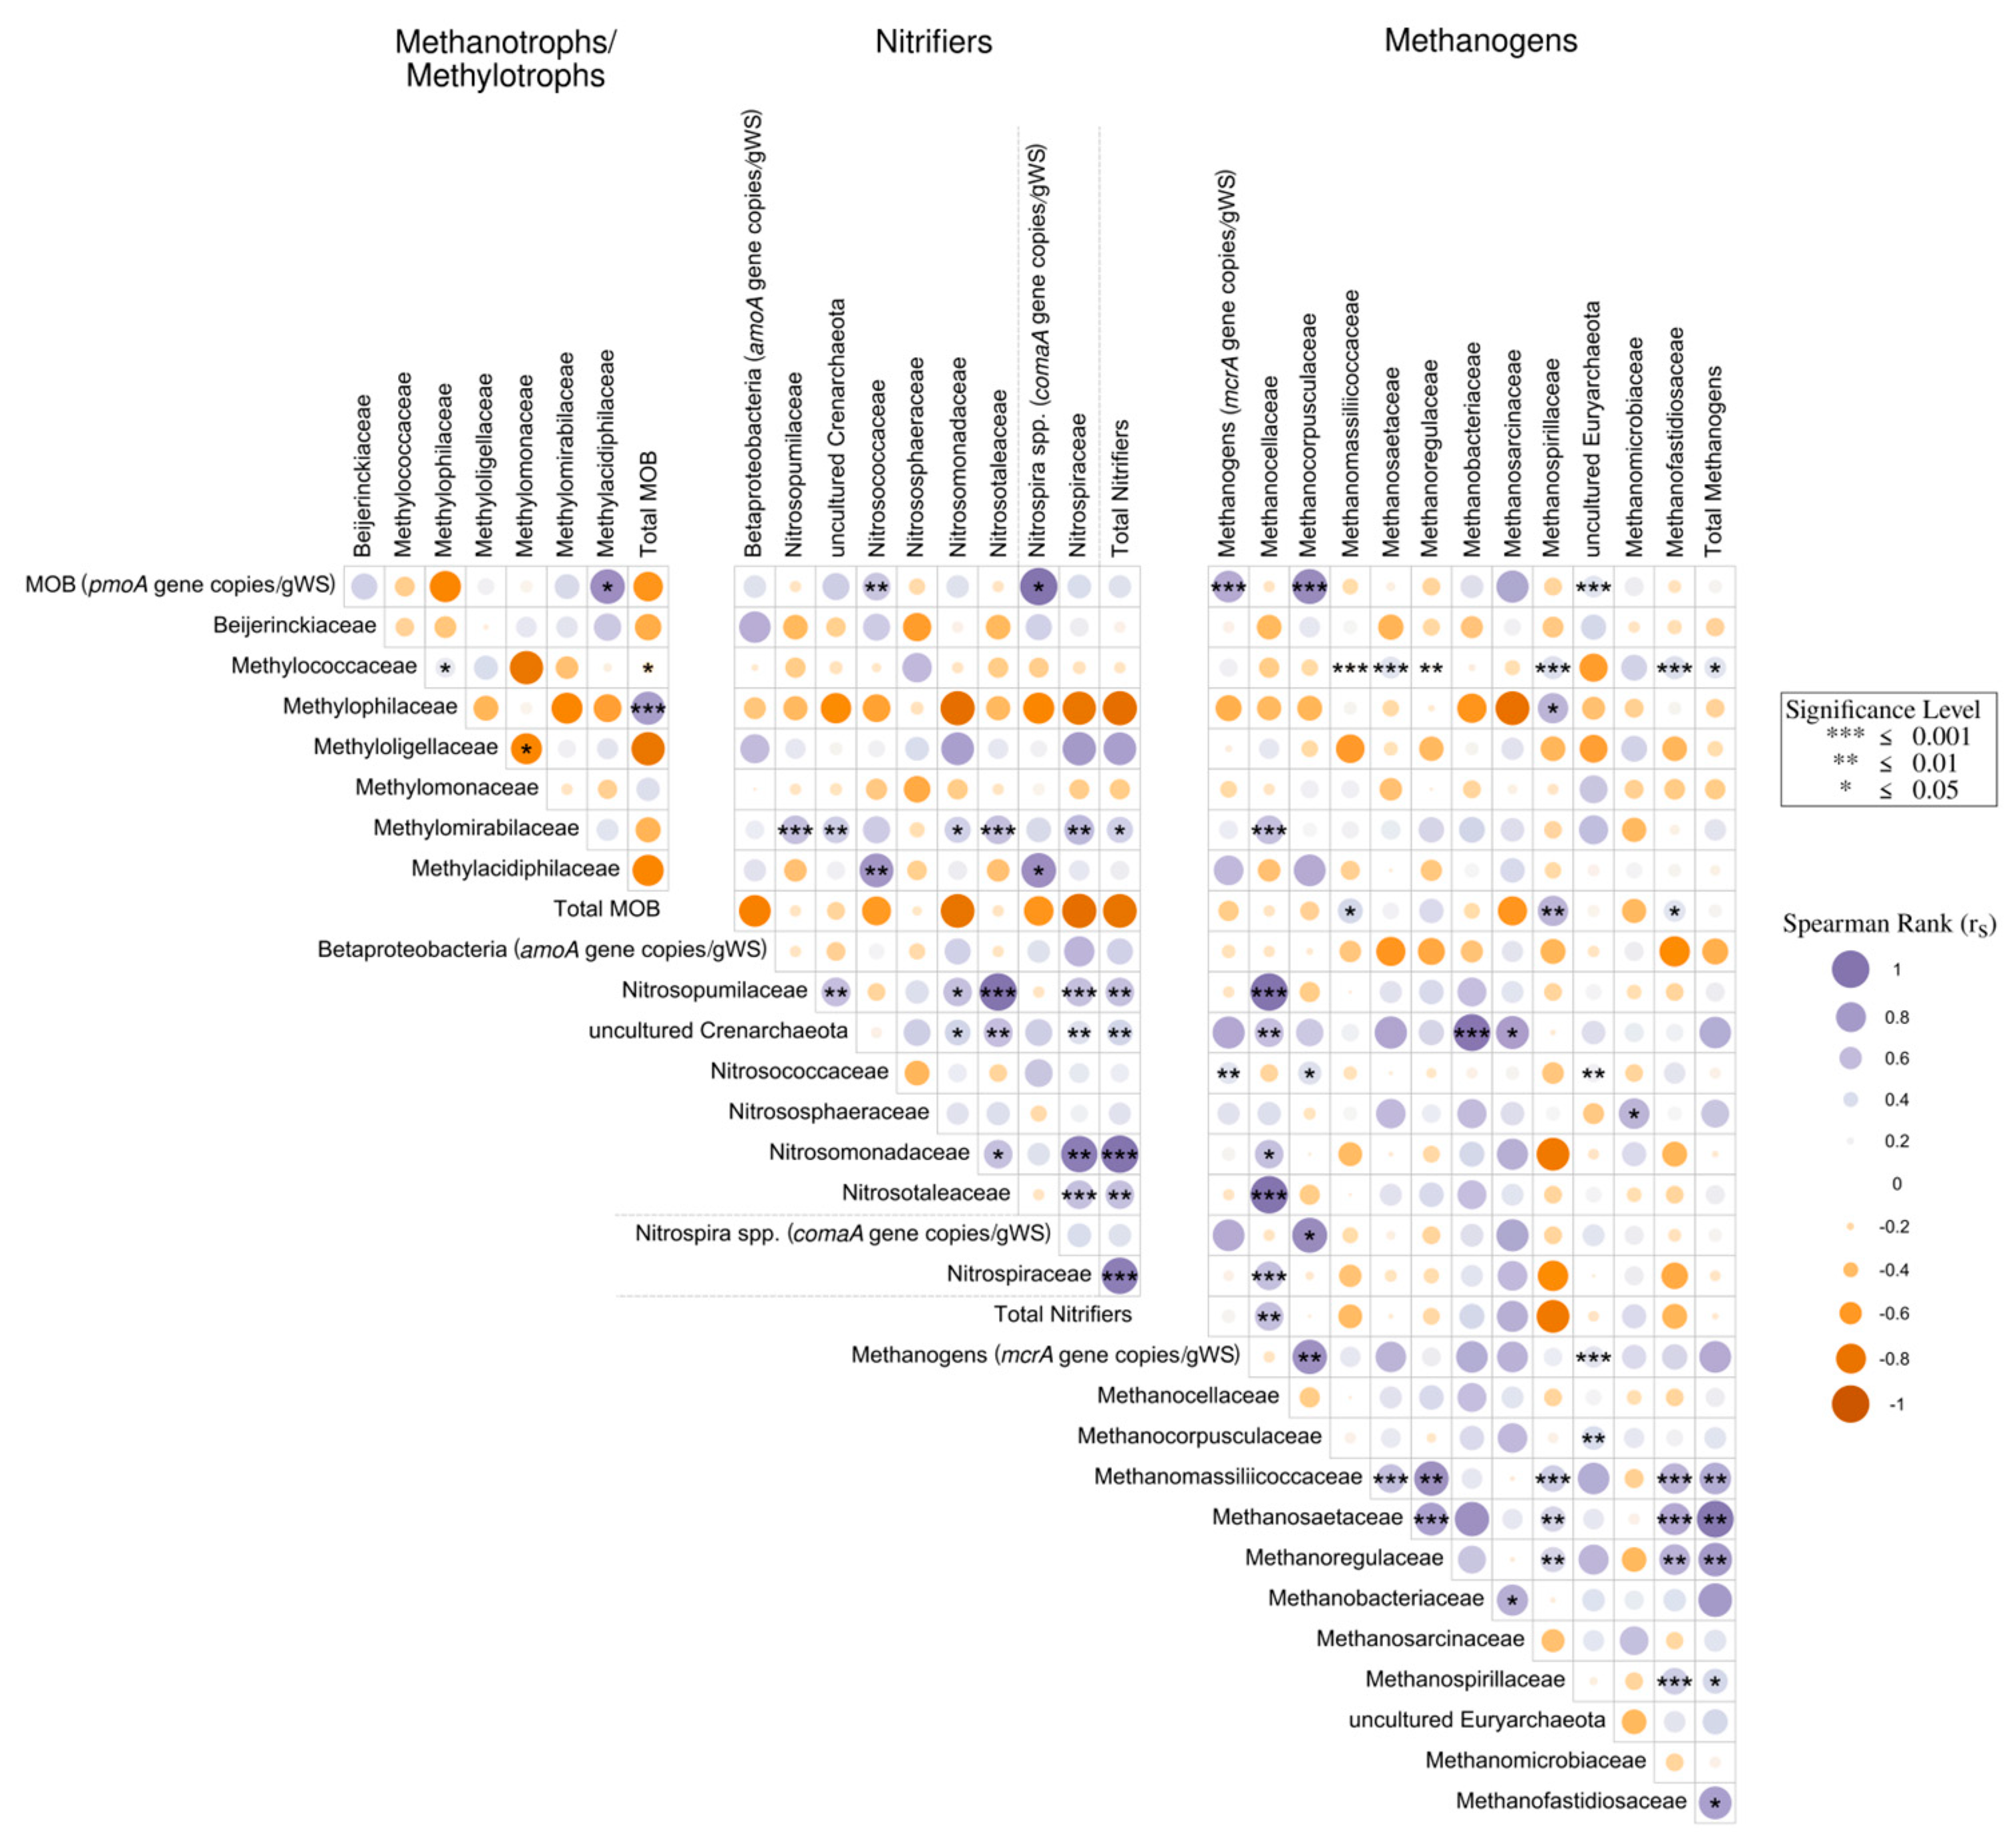
3.4. Spearman Correlation Analyses Associated with Water Quality Parameters and GHG

Among the physicochemical parameters, pH and conductivity were significantly linked to the water quality parameters, GHG concentrations, nutrients, and sediments properties (Figure 6). For instance, pH was significantly negatively correlated with GHG in the water and granulometry in the sediments (p-value < 0.05), while it was positively correlated with TOM in the sediments (p-value < 0.05) (Figure 6). Conductivity was significantly positively correlated with the TDS, sulfates, and sedimentary TOM (p-value < 0.05). Water quality variables, such as turbidity, were significantly correlated with color (p-value < 0.05) and with both BOD5, TDS, and sulfates (p-value < 0.05) in the water and with TOM (p-value < 0.05) in the sediments. In addition, Chlorophyll-a was significantly correlated with fecal coliforms, CO2, nitrate, nitrite, and δ15N (p-value < 0.05). Interestingly, GHG was significantly correlated among them (p-value < 0.05), and also, with nitrate (p-value < 0.05) (Figure 6). Regarding sediment granulometry, medium sand was significantly correlated (p-value < 0.05) with those in the different categories and with other sediment variables (Figure 6), for example, with TOM, δ15N and several water physico-chemical variables, including Chlorophyll-a, GHG, nitrite, and nitrate. The coarse sand percentage was also significantly correlated with pH, Chlorophyll-a, CH4, nitrite, and nitrate (p-value < 0.05) (Figure 6).

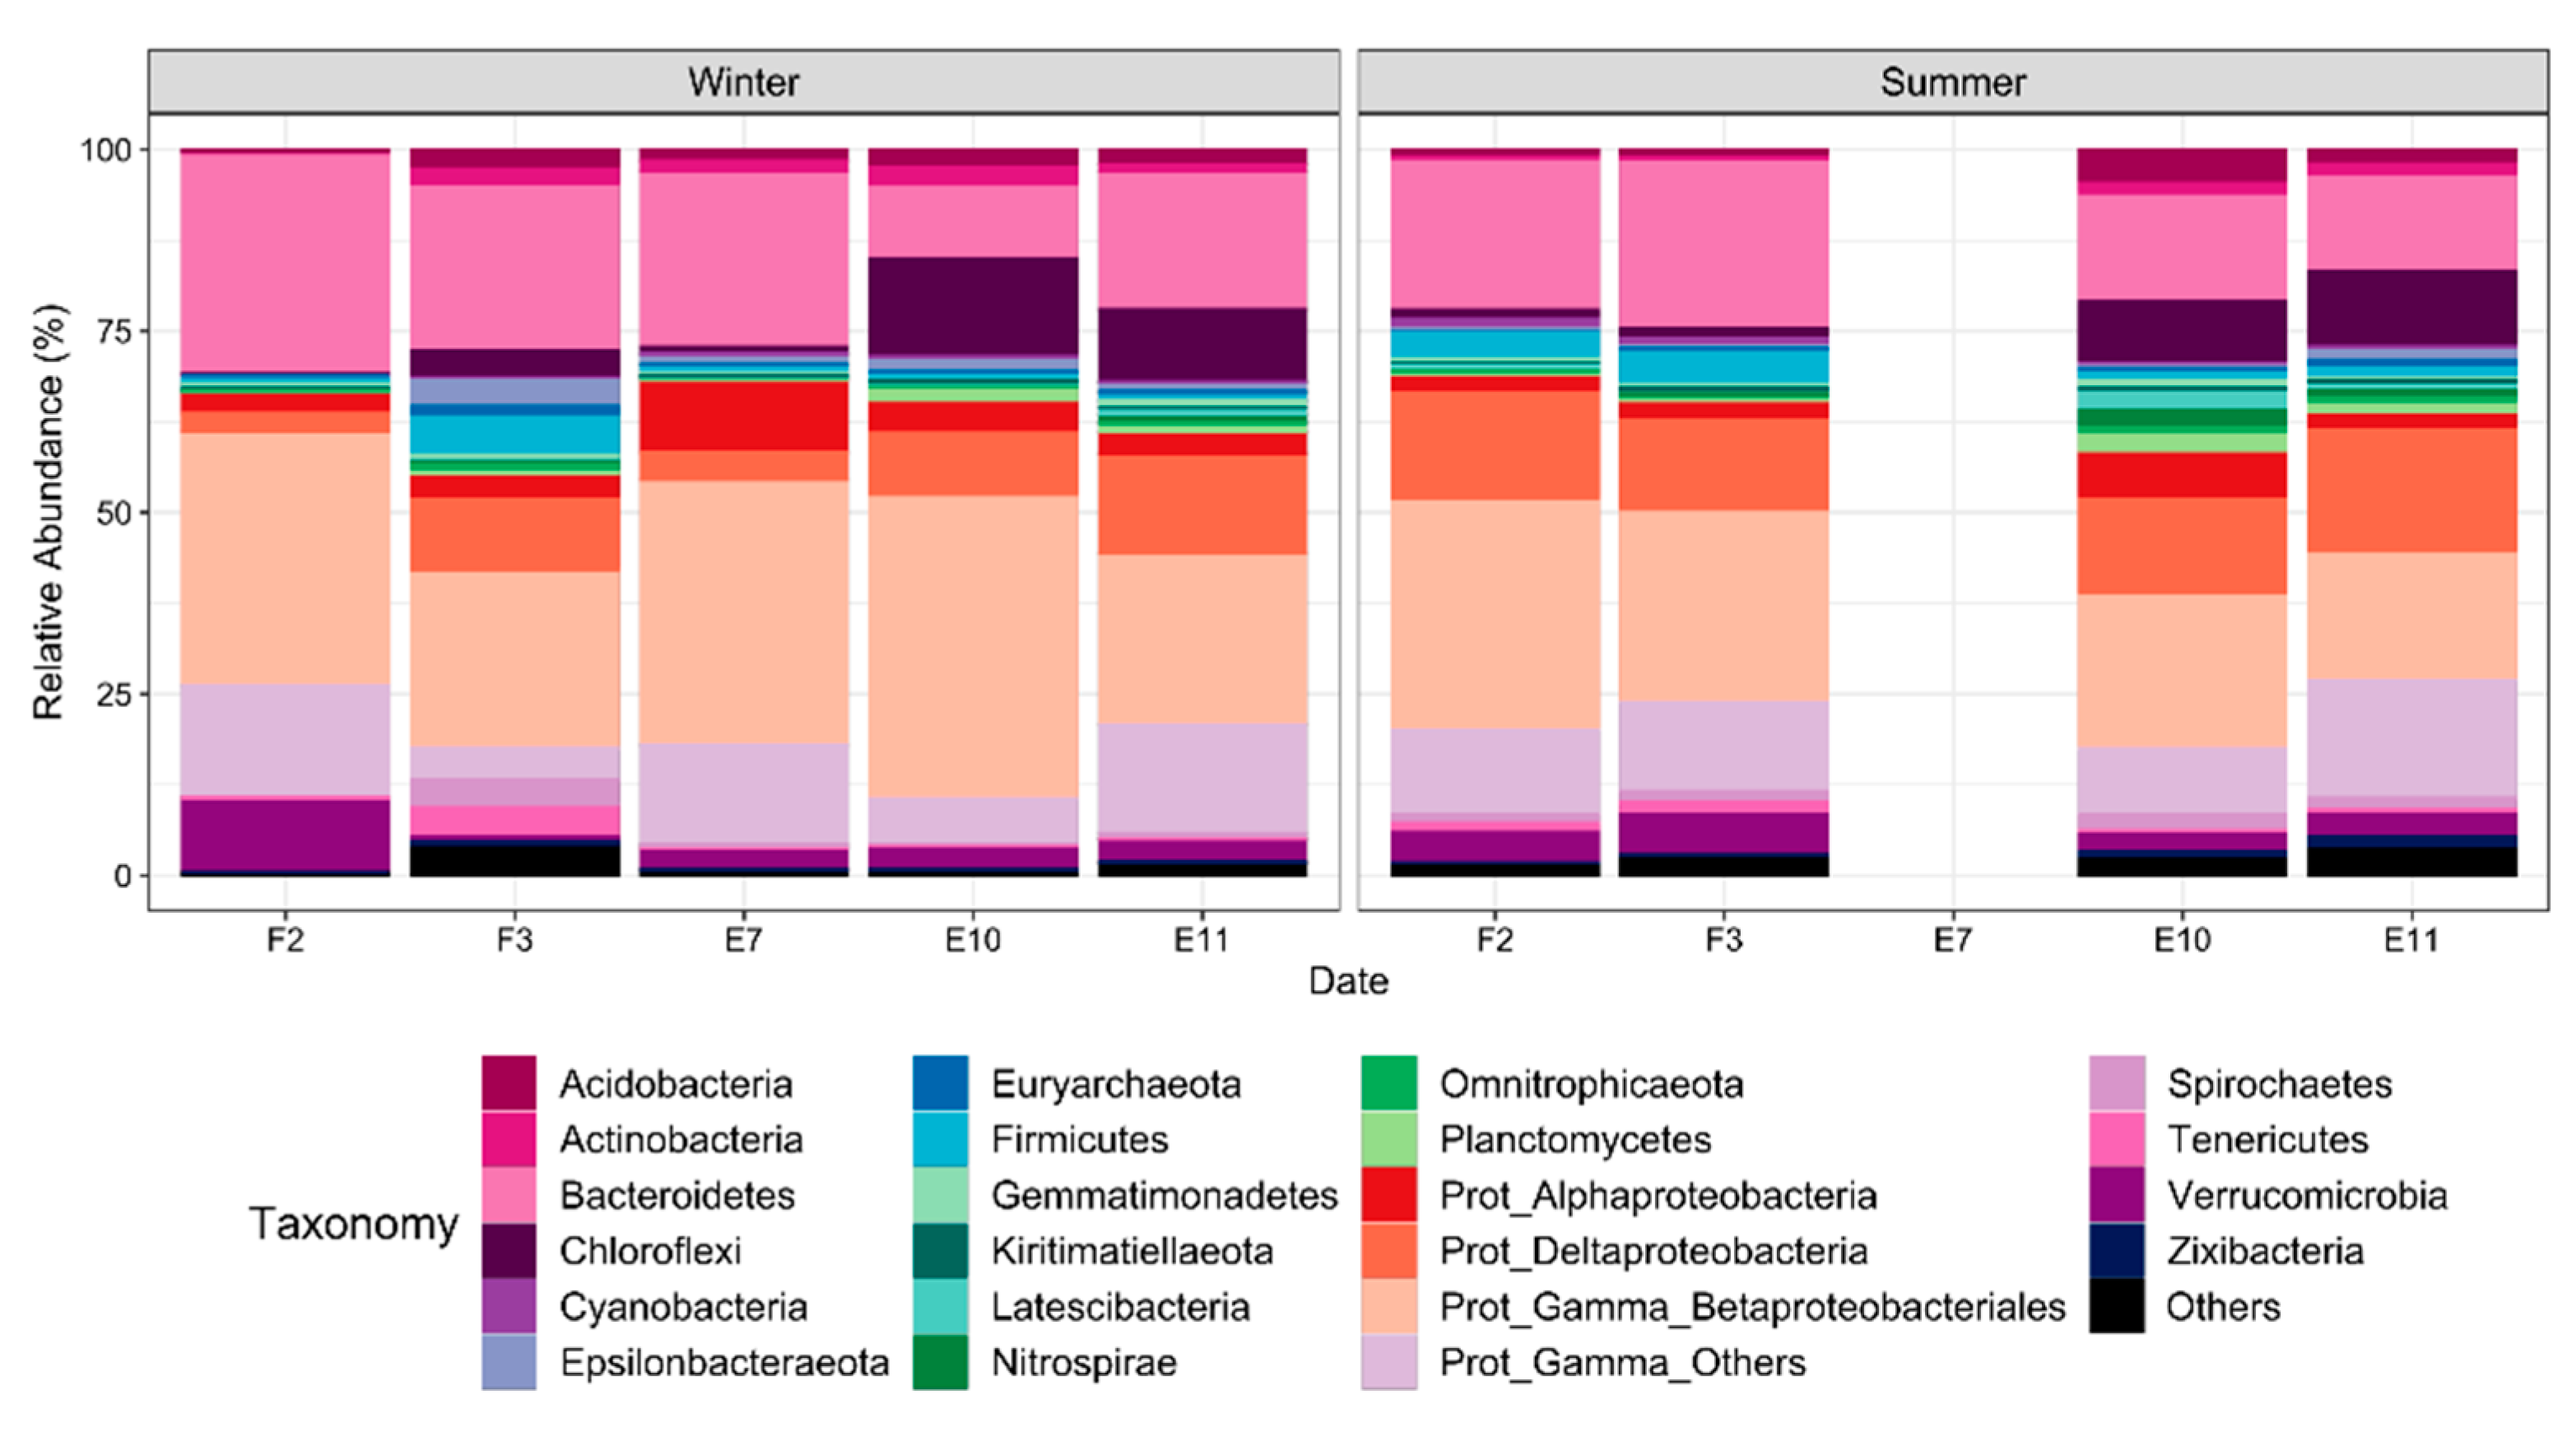
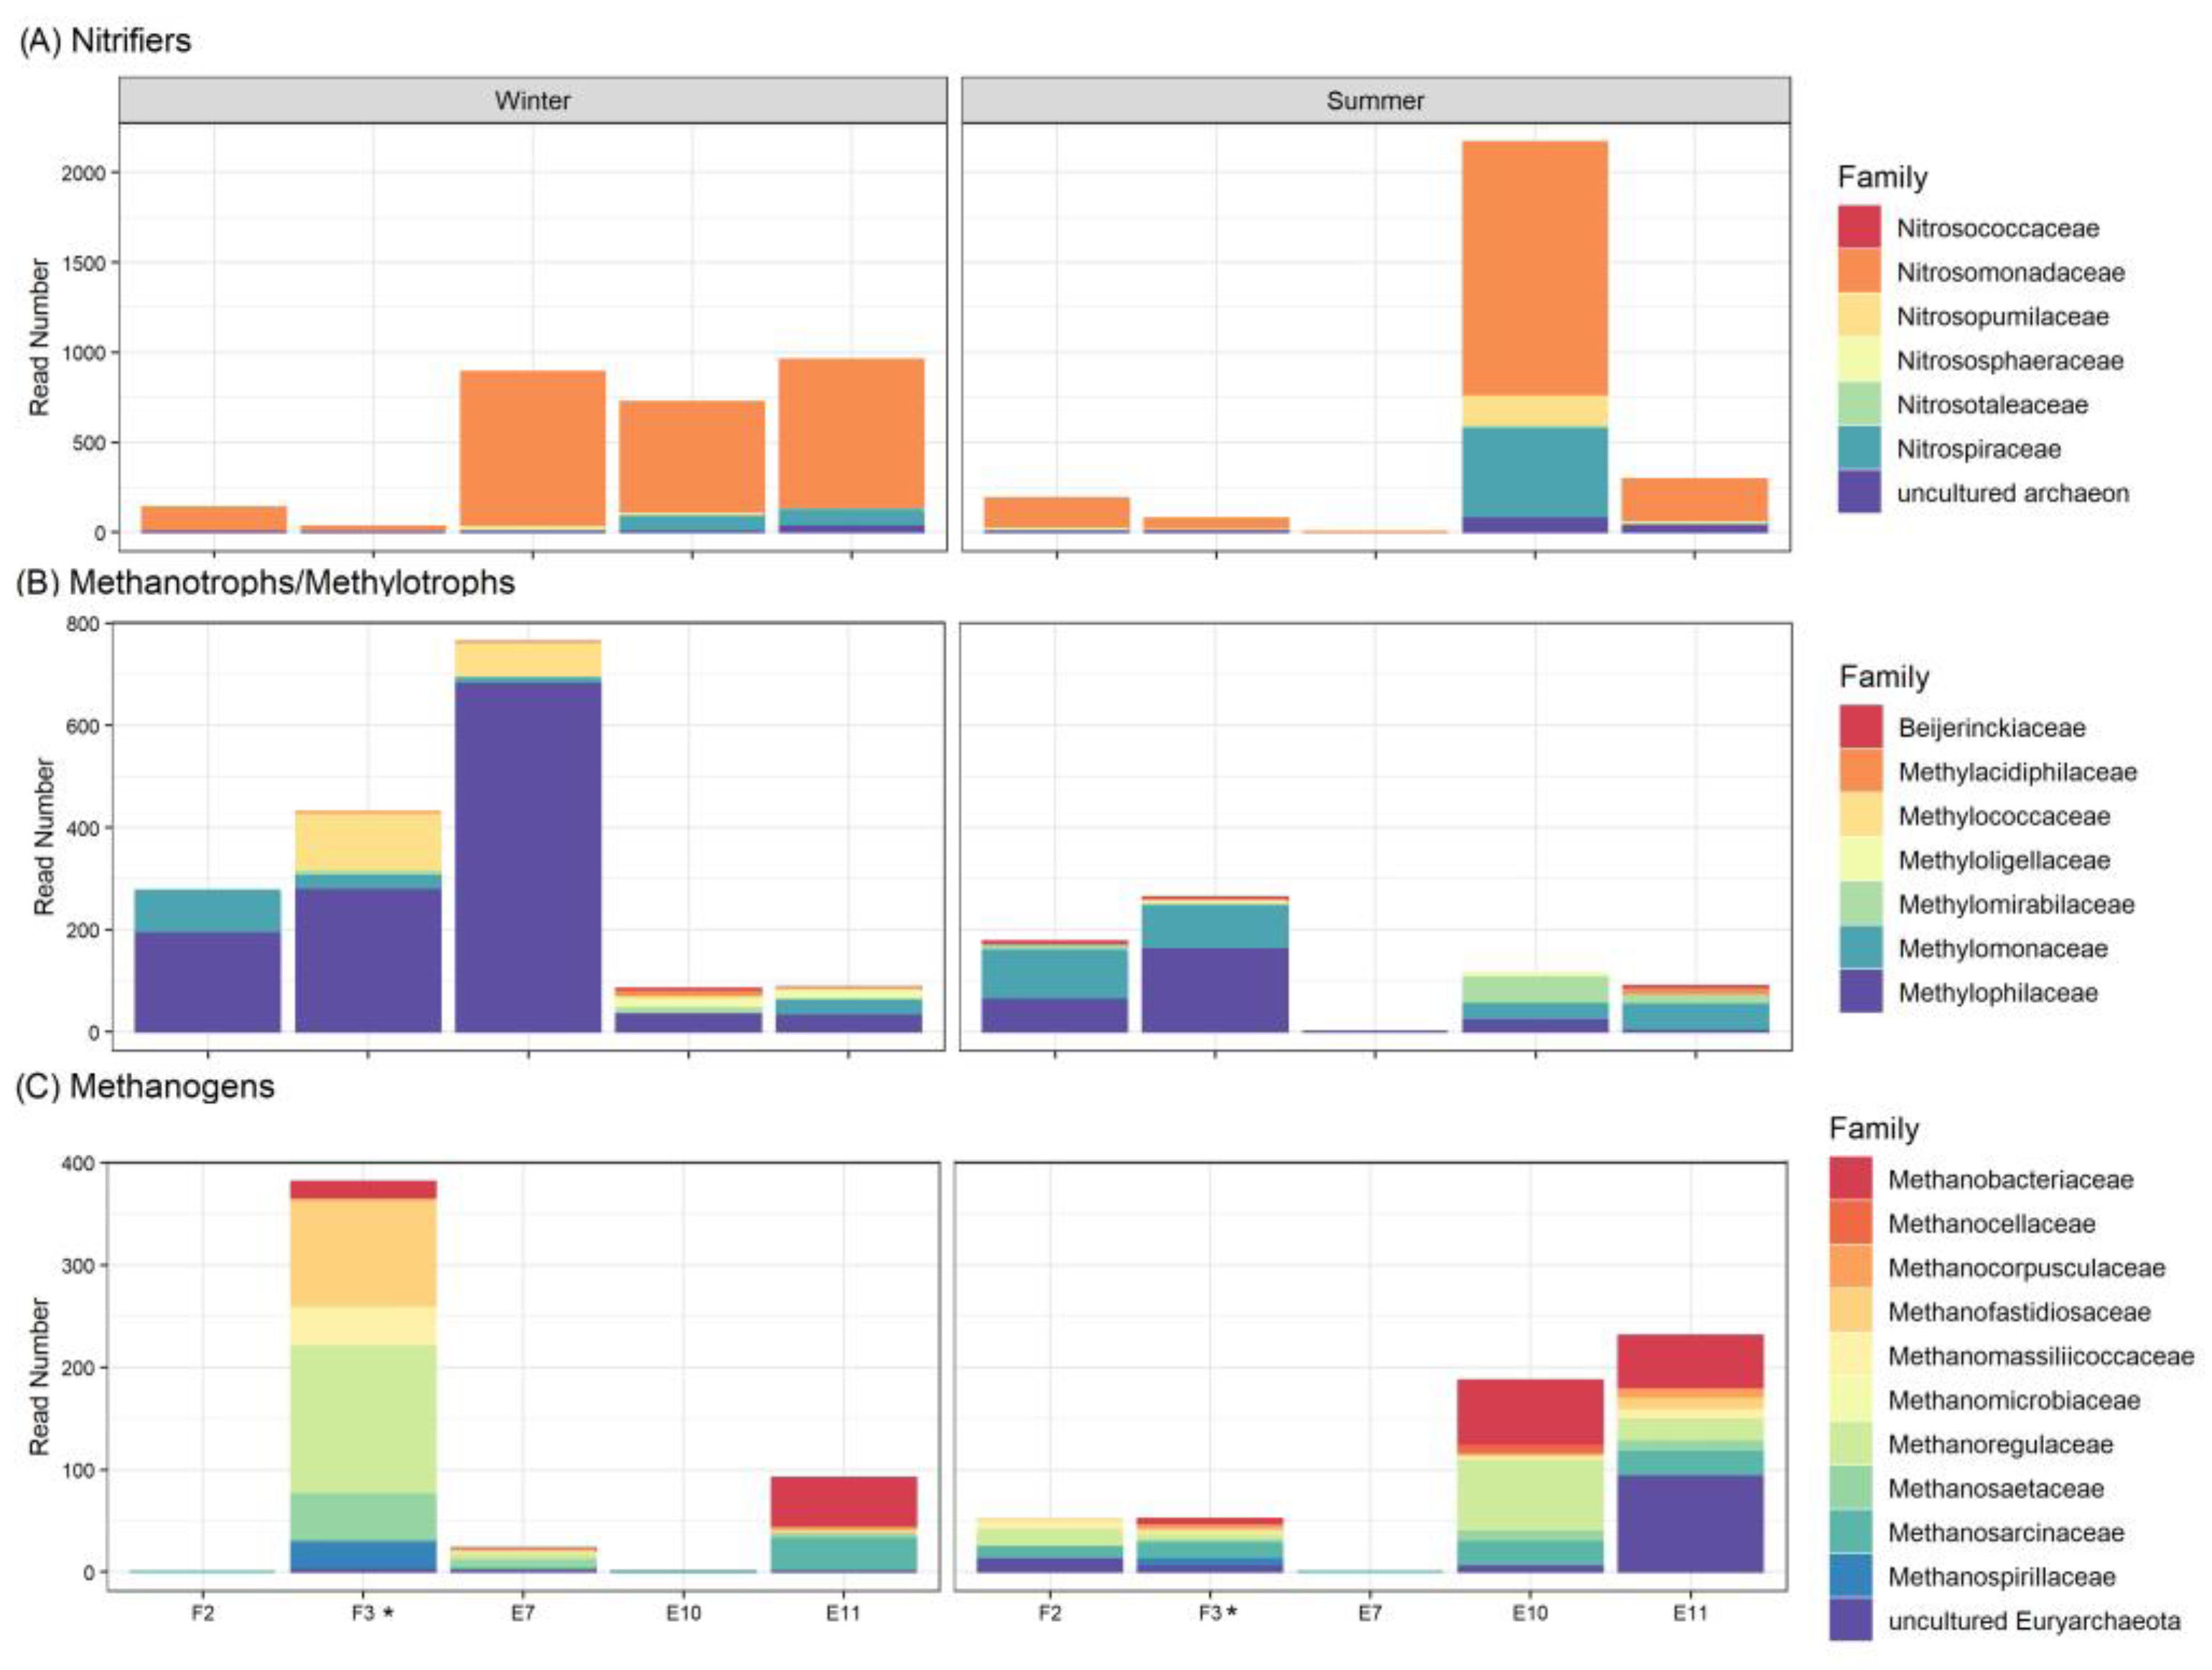
3.5. Benthic Microbial Community Composition

The benthic microbial communities of El Sauce estuary were characterized by the presence of 56 bacterial and 8 archaea phyla (Supplementary Table S1). The microbial communities were dominated by Proteobacteria affiliated to Gammaproteobacteria class, mainly represented by the Betaproteobacterales order, followed by Bacteroidetes and Chloroflexi. Both spatial and temporal variations were observed, including changes in Chloroflexi that were predominantly detected towards the mouth of the estuary stations (E10 and E11), whereas Firmicutes and Verrucomicrobia had a higher relative contribution to the total microbial community towards the upper tributary (Stations F2 and F3), also showing slight changes in the winter versus the summer (Figure 7).
SIMPER analysis considering the spatial grouping, excluding Station E7, indicated that the core benthic microbial community, i.e., Proteobacteria, Bacteroidetes, and Verrucomicrobia, were more consistently present at the predischarge site compared to those in the discharge and post-discharge areas of the estuary (Figure S1). Discharge benthic microbial communities were differentiated by a greater contribution of Firmicutes and Spirochaetes and by the exclusive presence of Tenericutes, Lentisphaerae, Synergistetes, and LCP-89. In addition, Hydrogenedentes, Nitrospirae, Latescibacteria, Gemmatimonadetes, and Zixibacteria were exclusively found in the post-discharge area, whereas Actinobacteria, Acidobacteria, Planctomycetes, and Cloroflexi had a greater contribution (Figure S1).
In the pre-discharge area, Xhantomonadales, Sphingobacteriales, Cytophagales, Verrucomicrobiales, Flavobacteriales, and Pseudomonadales were among the twenty most abundant orders, being the most abundant ones during winter (Figure 8). In the discharge zone, Bacteroidales and Clostridiales were highly prevalent during winter and summer, whereas Desulfuromonadales, Syntrobacterales, Chitinophagales, Campylobacterales, and Spirochaetales had a greater contribution during summer. In the post-discharge zone, Desulfobacterales, Anaerolineales, and Myxococcales were abundant during winter and summer, while Steroidobacterales exhibited a greater contribution during summer (Figure 8).
Differential analysis based on the comparison of microbial communities at ASVs level showed a greater number of ASVs present in the discharge compared to those in the pre-discharge waters (Figure 9). Eighty-one ASVs predominantly affiliated to the orders Betaproteobacteriales, Bacteroidales, Syntrophobacterales, Campylobacterales, and Chitinophagales were more abundant ones in the discharge compared to those in the pre-discharge site, followed by a lower proportion of ASVs belonging to Spirochaetales, DTU014 (Clostridium), Izimaplasmatales, and Methanofastidiosales. In contrast, only eight ASVs affiliated with the orders Verrucomicrobiales and Flavobacteriales were enriched in the pre-discharge compared to those in the discharged water.
The redundancy analysis (RDA) confirmed the spatial variability of the microbial community structure at the phyla taxonomic level, revealing a clear separation between the discharge station (F3) and the mouth stations (E10 and E11) (Figure 10). Both the first and second axes account for 75.6% of the total variation in the benthic microbial community structure. Among the environmental variables accounting for the microbial community variability in the discharge waters, values of N2O and CH4 and medium and coarse sands were significant, whereas the amount of very fine sand, TOM, pH, and δ15N were significantly higher at the post-discharge stations E10 and E11 (Figure 10). Many water column quality parameters were associated with the benthic microbial community structure, but were not significant at a p value < 0.05.

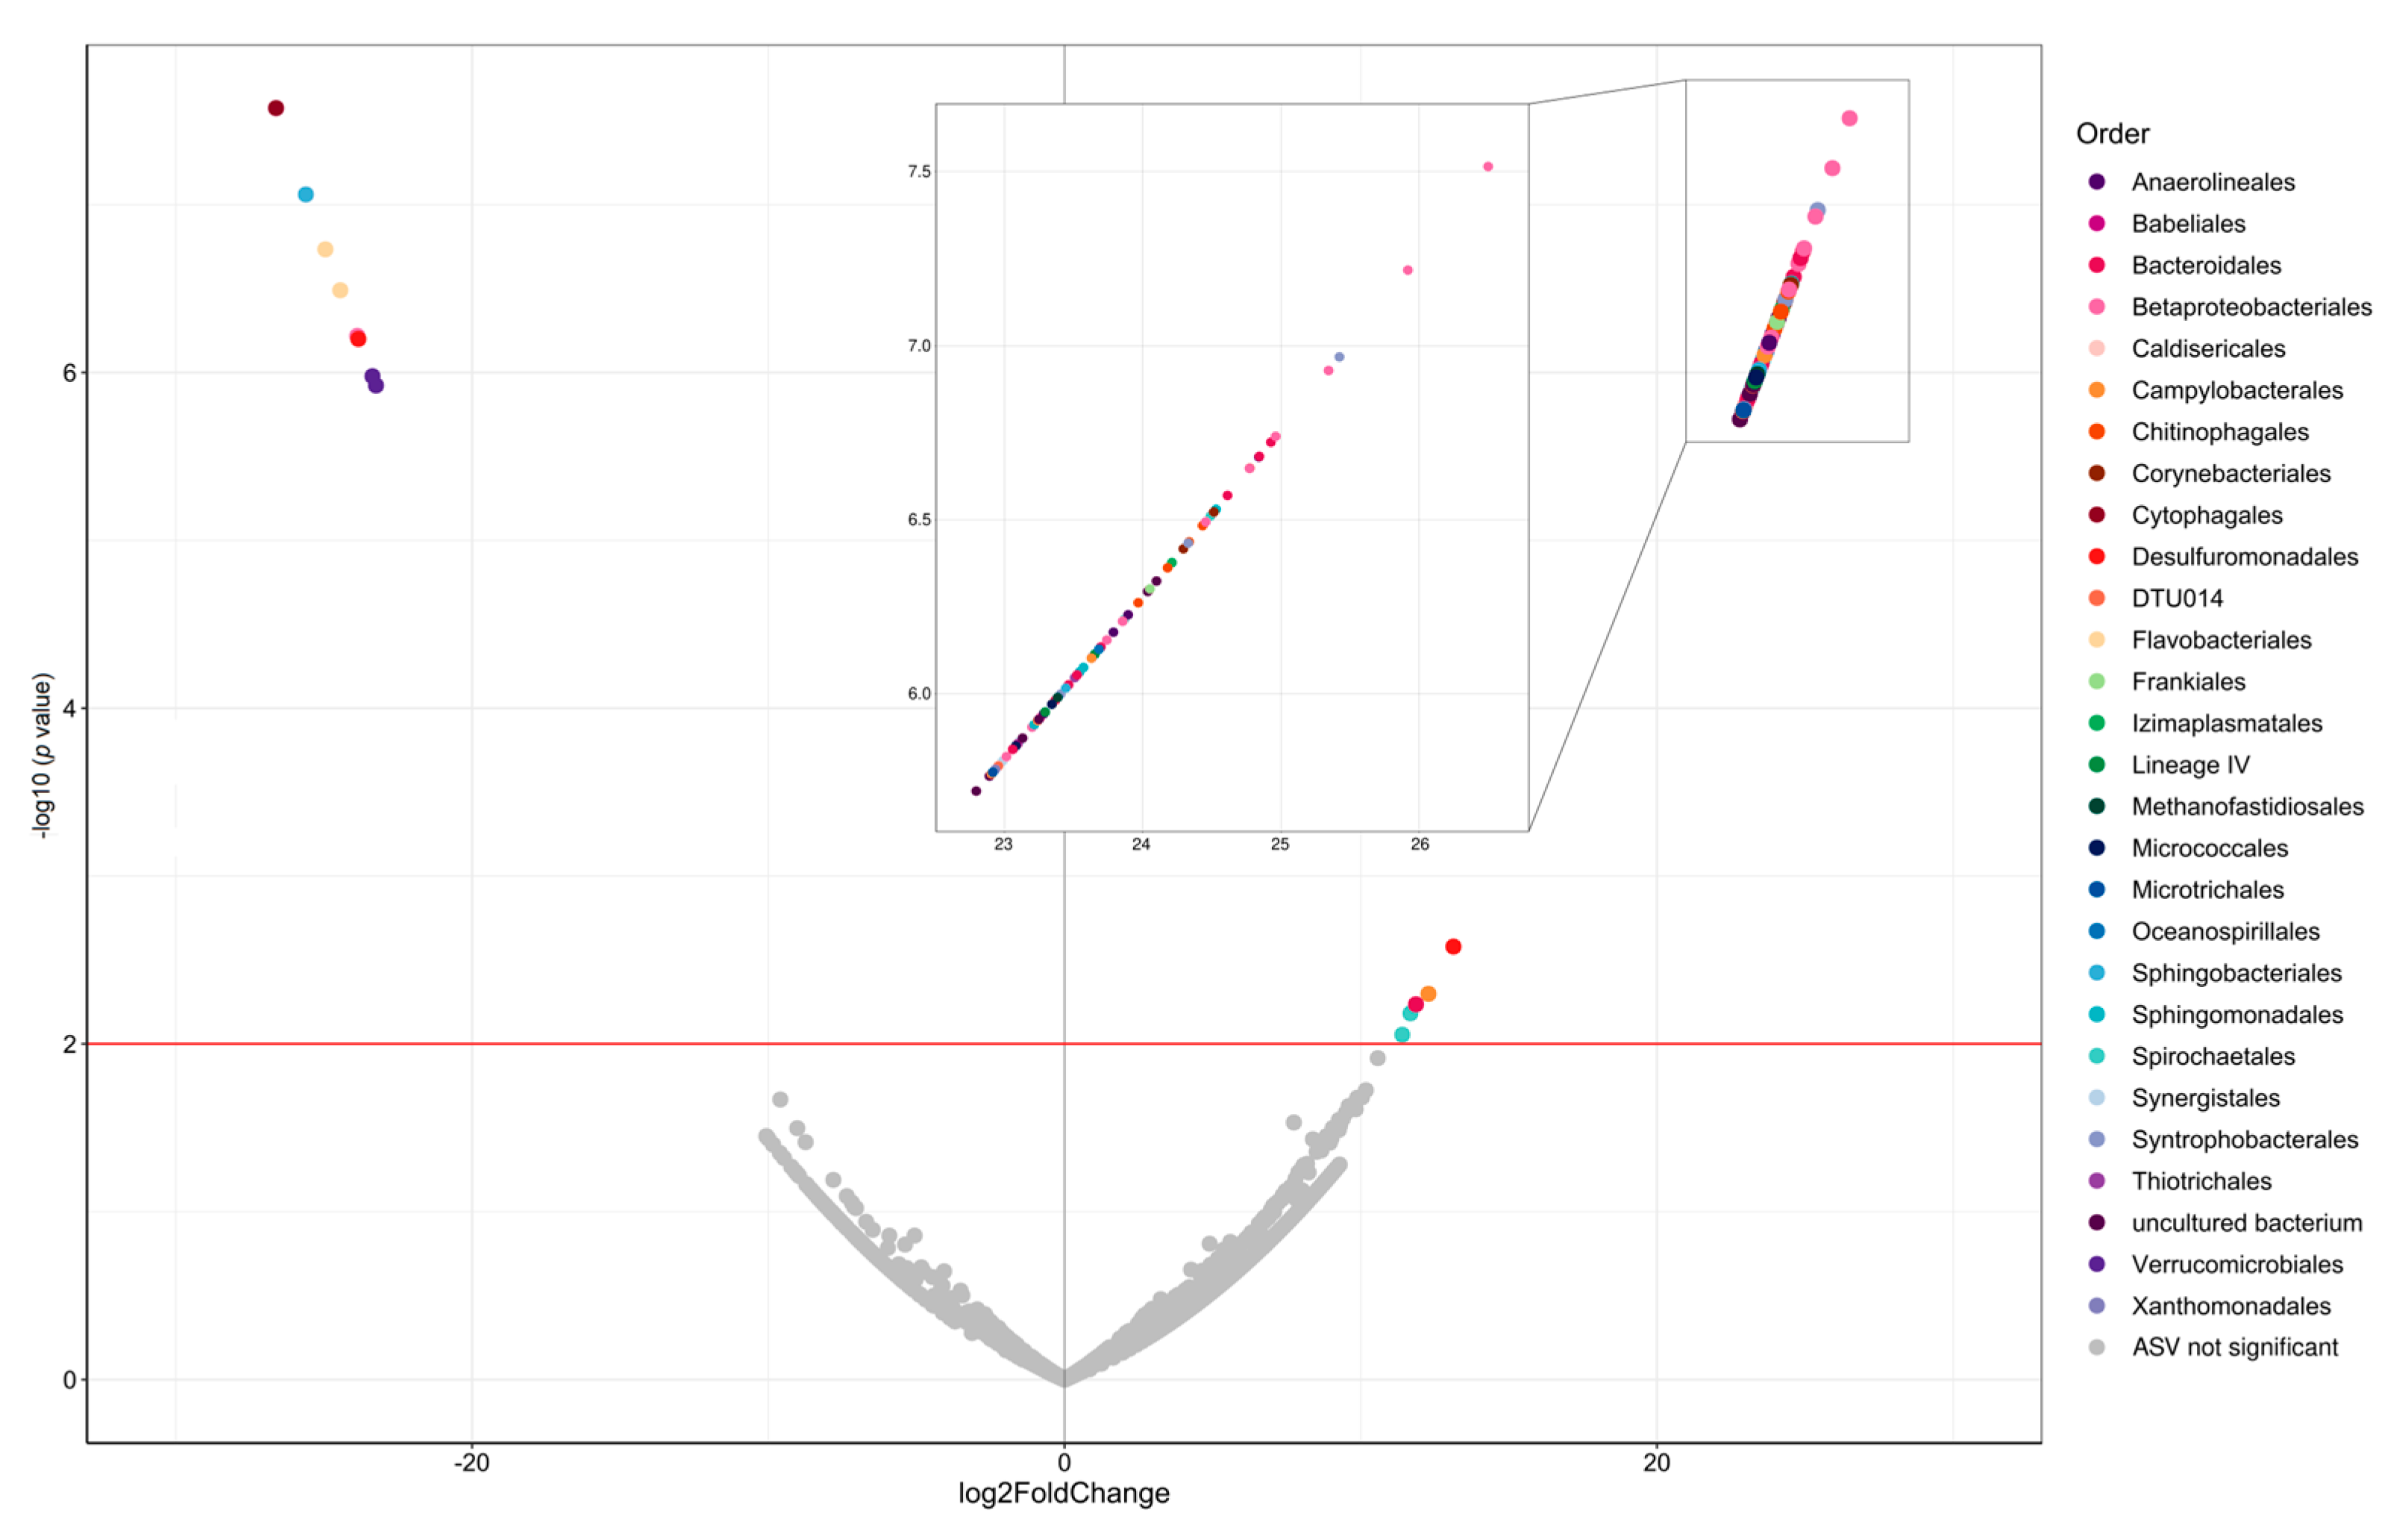
3.6. Functional Microbial Groups Spatial Variability during Winter and Summer in El Sauce Estuary

The nitrifying communities’ contribution based on 16S rRNA gene sequencing from the studied sediment presented distinct spatial patterns between winter and summer (Figure 11A). For instance, the Nitrosomonadaceae family was ubiquitous all along the stream during winter and summer, whereas Nitrospiraceae and ammonia-oxidizing archaea were detected mainly at the estuary mouth stations (Figure 11A). A higher richness of methanotrophs/methylotrophs were detected during winter compared to those in summer (Figure 11B), with the detection of Methylococcaceae at the discharge station. El Sauce benthic microbial communities were characterized by a rich methanogenic community that was particularly abundant at the discharge station (F3) in winter (Figure 11C). During winter, Methanobacteriaceae and Methanosarcinaceae were the predominant methanogens at the mouth stations (Figure 11C).
The abundance of the functional genes (amoA, comaA, pmoA, and mcrA) evaluated through qPCR showed a greater contribution of methanogens, ammonia, and methane oxidizers during summer compared to those in winter, especially at the estuary mouth (Figure 12A). In winter, the discharge station exhibited a lower abundance of ammonia and methane oxidizers compared to those of the pre- and post-discharge sites (Figure 12A–C). During summer, Betaproteobacteria ammonia oxidizers (βAOB) decreased in abundance towards the estuary mouth (Figure 12A), unlike comammox bacteria, which presented a similarly high contribution at all the sites, with a slightly greater contribution at the discharge station (Figure 12B). On the other hand, during winter and summer, methanogens abundance was higher in the discharge and post-discharge zones of the estuary (Figure 12D).
Spearman multiple correlation analysis was carried out to evaluate the relationships between the functional groups abundance based on qPCR and the contribution of functional microbial groups composition by 16S rDNA sequencing. The mcrA gene abundance (i.e., in copies/g sediment DW) showed a positive correlation between several taxa of methanogens, including counts belonging to Methanomassilicoccaceae, Methanosaetaceae, Methanoregulaceae correlated with Methanospirillaceae, Methanofastidiosaceae, and the total methanogens. On the other hand, methanotrophic communities quantification using pmoA gene copies/g sediment DW was positively correlated with the Methylacidiphilaceae family, whereas Methylococcaceae and Methylophilaceae families retrieved from 16S rRNA gene sequencing correlated positively with the total MOB (Figure 13). Neither βAOB nor commamox amoA gene copies/g sediment DW were correlated with the total nitrifiers communities recovered from 16S rRNA gene sequencing. However, counts belonging to several families of nitrifiers positively correlated with each other. This was the case for Nitrosopumilaceae and uncultured Crenarchaeota with Nitrosomonadaceae, Nitrosotaleaceae, and Nitropiraceae, whereas Nitrosomonadaceae and Nitrosotaleaceae were correlated with Nitropiraceae (Figure 13). Moreover, the functional microbial groups’ abundance based on gene quantification qPCR were correlated with environmental factors (Table S2). Except for methanogens, all the functional groups were significantly correlated with δ15N (p-value < 0.05). Additionally, comammox and methanotrophs were significantly correlated with temperature, BOD5, and TOM (p-value < 0.05). The commamox was significantly correlated (p-value < 0.05) with conductivity and DTS, and methanogens were correlated with phosphate (Table S2).

4. Discussion

El Sauce estuary is a fresh surface water body located in the Valparaíso region whose main water flow comes from Las Cenizas basin. Previous studies have reported that El Sauce is under anthropogenic pressure, categorizing the estuary as a permanent hypertrophic estuarine environment mainly impacted by WWTP discharges, as well as percolated liquids from a nearby landfill and sewage discharges from houses not included in the sewage system (Rivera-Castro et al., 2020) [31]. These inputs are often composed of a mixture of partially degraded OM, nutrients, and microorganisms, many of them pathogens, and emerging contaminants that have the potential to reshape the natural community structure and biogeochemical activity, especially in semi-closed environments such as El Sauce. Our study reports the first evidence of the WWTP discharge’s impact on the water quality, benthic microbial communities, and dissolved greenhouse gases of El Sauce estuary, providing new insights into how WWTP discharges influence the biogeochemistry of receiving water bodies, especially in complex and fragile environments such as the polluted coastal ecosystem of the Valparaiso region.

4.1. The WWTP Altered Physicochemical Properties of El Sauce Estuary

The physicochemical conditions of the watershed, such as color, transparency, turbidity, DTS, and total coliforms, suggest its poor water quality (Table 2). Moreover, the WWTP discharge (F3 station) considerably affected the physicochemistry of the estuary, decreasing the pH and the concentration of nitrate, nitrite, and phosphate compared to those levels in the upper tributary water in both winter and summer (Figure 2A,B). The DO decreased exclusively in summer, whereas the water temperature increased in both seasons. The discharge comes from Esval-Placilla wastewater treatment plant (WWTP), which includes an aerated lagoon and uses chloride gas bubbling as a secondary treatment, thus explaining the changes in the pH, temperature, and nutrient concentrations during our study. Our results agree with previous reports showing that El Sauce estuary is significantly affected by WWTP water discharge besides other sources of pollution, which have categorized the estuary as a eutrophic system for many years [31]. Moreover, in our study, the WWTP discharge station (F3) exhibited a twenty higher more dissolved CH4 concentration compared to those of the other stations, including the stations situated at the mouth of El Sauce catchment area (Figure 3). Similar results have been found in sewage draining rivers and in the Guadalete estuary (e.g., Hu et al. 2018, Burgos et al. 2015) [61,62]. The CH4 accumulation observed in the WWTP discharge station may be explained either by a stimulation of the methanogenesis or by the inhibition of CH4 oxidation [63]. Additionally, the aerated lagoon may stimulate nitrification and denitrification processes, contributing to nitrogen loss by means of NO, N2O, and N2 production [64,65].
The isotopic composition of OM exhibited a marked spatial variability between the upstream stations (pre-discharge and discharge areas) and the mouth stations (post-discharge area) (Figure 5A). The values of the sedimentary isotopic signatures indicated that OM in the upstream station was associated with a terrestrial OM origin (from δ13C = −28 to −29.5 and from δ15N = 4 to 8.7), unlike those of the mouth of the estuary (from δ13C = −25.3 to −26.5 and from δ15N = 8.4 to 14.2) that evidenced a marine OM origin (Figure 4A). The OM isotopic δ13C magnitudes were within values previously reported in estuaries in temperate areas, i.e., Godavari (−24.6), Loire (−26.8), Ems (−24.2), and the Sado (−25.6) mouth estuary [66,67]. Conversely, the OM isotopic δ15N values determined in our study could be associated with various origins, including phytoplankton or residual anthropogenic nitrogen by rivers and diffuse runoff, i.e., δ15N = 7.3 ± 2.1 % [68,69].

4.2. Benthic Microbial Communities and Functional Groups of El Sauce Estuary

El Sauce estuary holds a diverse benthic microbial community with the predominance of Proteobacteria, mainly Betaproteobacteriales and Bacteroidetes phyla (Figure 7). These results agree with microbial community composition reported from coastal wetlands of the semi-arid zone of central Chile [70] and with other tidal estuarine sediment systems [71]. Regarding the water physicochemical properties, the benthic microbial community structure along El Sauce estuary was enriched with Firmicutes (Clostridiales order) and Bacteroidetes (Bacteroidales order), mainly in the WWTP discharge waters (Figure 7). These bacterial phyla are often dominant during wastewater treatment processes [72,73,74]. Moreover, in our study, Tenericutes, Lentisphaerae, Synergistetes, and LCP-89 phyla were exclusively detected in the WWTP discharge station (F3) and not in the other sampling areas (e.g., Figure S1). Moreover, a significant number of ASVs changed at the discharge station compared to those at the pre-discharge station (Figure 9). Firmicutes have been reported to be prevalent in the human stool microbiome, and therefore, are enriched in WWTP discharge [75,76]. In particular, the orders Clostridiales and Bacteroidales have been proposed as good bioindicators to estimate the degree of influence of sewage and fecal source in water catchment impacted by WWTP discharge [73,77,78]. However, its integration with alternative tools to identify and model the influence of WWTP discharge on the microbial communities in aquatic environments remains to be explored in depth.
In general, microbial groups belonging to Proteobacteria, Verrucomicrobia, and Actinobacteria were the dominant phyla in upstream waters of El Sauce estuary, as well as other wetlands of the semi-arid region of central Chile [70]. These groups were found to significantly decrease in the WWTP discharge station; however, they recovered again in the mouth of the estuary. Similar studies associated with WWTP discharge in urban and sub-urban rivers also found shifts in relevant phyla characterized by an increment in Verrucomicrobia and Actinobacteria and a decrease in Deltaproteobacteria [77].
Moreover, the phylum associated with functional groups, such as Cyanobacteria, showed a low abundance in all the sampled sites (Figure 7), which is probably attributed to the higher water turbidity, which decreases the solar radiation penetration to the sediment, thus inhibiting benthic photosynthetic processes [79]. In addition, other known functional taxa associated with nutrient recycling, such as the Nitrospirae and Chloroflexi phyla, were rare or undetected at the WWTP discharge station compared to those at the Estuary mouth (Figure 7). These phyla increased their relative sequence abundance towards the mouth (E10 and E11 stations) of the estuary (Figure 7), where higher dissolved nutrient concentrations were detected in the water. Nutrient availability and other compounds in the WWTP effluent could affect sensitive microbes such as Chloroflexi, as previously suggested [77].
The quantification of specific functional microbial groups by qPCR associated with nutrients and GHG recycling were influenced by the WWTP discharge and by the sampling season. The nitrifying (βAOB and comammox) and methanotrophic communities abundances decreased at the WWTP discharge station (F3) during winter (Figure 12A,C) and increased towards the mouth, which is important since they can still co-oxidize a variety of remaining xenobiotic compounds [80]. These results are in agreement with the decrease in the relative abundance of the Betaproteobacteriales order at the WWTP discharge station (Figure 9). Similarly, βAOB gene abundances were low in activated sludge from WWTP compared to those in coastal sediments (5.68 × 10⁻⁶ − 4.79 × 10⁻⁵ versus 5.4 × 10⁻¹ − 34.4 × 10⁻¹ copies/g sample) [81] and between the sewage effluents in eutrophic lakes sediments, unlike in the adjacent areas [82]. Further research is required to elucidate if the decrease in Betaproteobacteriales is due to outcompetition with ammonia-oxidizing archaea and anaerobic ammonium-oxidizing bacteria or other specific environmental fluctuations.
In addition, all the targeted functional groups (βAOB, comammox, and methanotrophic) were enriched in the discharge area during summer, unlike winter, and in both seasons downstream at the estuary mouth (Figure 12A–C). In particular, a higher abundance of methanogenic communities was observed in the areas affected by the WWTP discharge (Figure 12D) than those in the other estuaries impacted by WWTP effluents [29]. Moreover, a rich methanogenic community was observed in winter at the discharge station and downstream based on 16S rRNA sequencing, accounting for the relevance of methanogenesis in wetlands.
The BOD5 in the water, as well as the total OM and δ15N in the sediments, were significantly correlated with comammox and methanotrophic abundances. In general, both functional groups increased downstream towards the estuary mouth (Figure 12A–C), where greater δ15N values and more nutrients were found during both winter and summer (Figure 4A). Moreover, methanotrophic abundance in the estuary was significantly correlated with methanogens and with nitrifiers (Figure 13), indicating the potential metabolic interaction between these three functional groups. This is the case of nitrite-dependent anaerobic methane oxidation by bacteria, including Methylomirabilaceae (Figure 11), which could benefit from the nitrite produced by ammonia oxidation, linking carbon and nitrogen cycling in wetlands, as previously reported [83,84].
Benthic OM considering nitrogen availability could be relevant for the resistance or tolerance of the functional microbial groups to the WWTP discharge in the estuary. Winter conditions were unfavorable for methanotrophs and nitrifying assemblages, potentially reducing their role in nutrient and GHG recycling. Nutrient accumulation towards the mouth was evidenced during both seasons, confirming the pervasive eutrophic conditions of El Sauce estuary [31].
These results, together with previous studies on the same ecosystem, encourage further research on the current effects of WWTP discharges, an issue that has aroused wide public concern, especially in rural areas, since more infrastructure, resources, and higher regulatory standards are often oriented towards increasing the wastewater treatment capacity of cities [28,85]. This situation is even worse in countries such as Chile, where a relevant fraction of rural residents has a lower income, less education, and more importantly, less access to public utilities compared to those of their urban counterparts [86]. The effects on water availability and quality caused by these discharges and other sources of contamination are often suffered by more vulnerable rural communities that experience reduced fishery resources, agricultural production, and health [87].
This is the case of Laguna Verde and the community residing near El Sauce estuary, which is an area of rapid population growth in the Valparaiso area, and precarious urban development, and is highly dependent on agriculture [88]. Thereby, gaining insights into the interaction of the negative impacts that these discharges have on water quality is necessary to optimally address, not only their consequences on the environment at the local level, but also their effects on greenhouse gas dynamics.

5. Conclusions

In summary, our results confirm that El Sauce Estuary is an anthropogenically impacted ecosystem characterized by with poor-quality conditions in 40–60% of the variables. Among other anthropogenic pressures, including leachate from a municipal landfill and domestic water inputs that have permanently contributed to this eutrophic system, our study concluded that WWTP effluents play a major role in shaping the microbial and biogeochemical processes, resulting in GHG accumulation. For instance, WWTP effluent was found to have a greater impact in the upstream area compared to those in the pre- and post-discharge sites on the physicochemical conditions and the dissolved GHG concentration in the water, especially for CH4 and N2O by one order of magnitude. The organic matter quality varied spatially along the estuary, shifting upstream towards the mouth associated with terrestrial (δ13C = from −28 to −29.5 and δ15N = from 4 to 8.7, respectively) vs. estuarine (δ13C = from −25.3 to −26.5 and δ15N = from 8.4 to 14.2, respectively) origins. The benthic microbial community composition in the estuary followed the same trend as that of OM, characterized by the enrichment and enhancement of functional groups of methanotrophs and methanogens, reaching up to 6.5 × 10⁵ and 2.1 × 10⁵ abundance towards the mouth. However, the anthropogenic impact of the WWTP-discharge effluent upstream contributed to reshaping the benthic microbial community composition even at the phylum level by introducing allochthonous phyla and changing the relative contribution of core wetland taxa, thus potentially limiting the growth of nitrifying and methanotrophic bacteria during winter. Therefore, the spatio-temporal (winter vs. summer) natural conditions and anthropogenic sources of perturbations strongly drive the dynamics of the benthic microbial community composition, and potentially, the way nutrients and GHG are recycled in El Sauce estuary.

Supplementary Materials

The following supporting information can be downloaded at: https://www.mdpi.com/article/10.3390/w15061251/s1, Figure S1: (A) Total organic matter percentage and (B) sediment granulometry distribution; Table S1: Benthic microbial community comparison between winter (W) and summer (S) sequences reads retrieved at El Sauce estuary sampling stations; Table S2: Spearman correlation analyses between functional group abundance quantification (qPCR) and the physicochemical variables studied.

Author Contributions

Conceptualization, F.P.-S., V.M. and R.O.; methodology, M.C.-D., C.L., C.A., C.R. and P.A.-M.; writing—original draft preparation, F.P.-S. and V.M.; writing—review and editing, F.P.-S., V.M., R.O., C.L., M.C.-D. and P.A.-M.; funding acquisition, V.M, M.C.-D. and R.O. All authors have read and agreed to the published version of the manuscript.

Funding

This research was funded by FONDECYT grant number 1211977 and Proyecto de Tesis de Postgrado at UPLA for FP and The APC was funded by the Dirección General de Investigación UPLA.

Data Availability Statement

Raw data supporting the conclusions of this article will be made available by the authors, without undue reservation.

Acknowledgments

We acknowledge N. Bassi and Mirian Lanfranco for their support in the field campaigns. We are grateful to Elias Arredondo, H. Peña, C. Sepúlveda, P. Reinoso, and A. Bello for their technical support in the laboratory for the molecular, nutrient, and GHG analyses. This research was technically supported by the GIIA Uplaguas, the supercomputing infrastructure of the National Laboratory for High Performance Computing, (ECM-02), FONDEQUIP EQM160131, and the Network Project RED21992 “Sistema articulado de investigación en Cambio Climático y Sustentabilidad en zonas costeras de Chile”.

Conflicts of Interest

The authors declare no conflict of interest.

References

  1. Bianchi, T.S. Biogeochemistry of Estuaries; Oxford University Press: New York, NY, USA, 2007. [Google Scholar]
  2. Vincent, S.G.T.; Reshmi, R.; Hassan, S.J.; Nair, K.D.; Varma, A. Predominant terminal electron accepting processes during organic matter degradation: Spatio-temporal changes in Ashtamudi estuary, Kerala, India. Estuar. Coast. Shelf Sci. 2017, 198, 508–517. [Google Scholar] [CrossRef]
  3. Kirwan, M.L.; Megonigal, J.P. Tidal wetland stability in the face of human impacts and sea-level rise. Nature 2013, 504, 53–60. [Google Scholar] [CrossRef] [PubMed]
  4. Tian, B.; Wu, W.; Yang, Z.; Zhou, Y. Drivers, trends, and potential impacts of long-term coastal reclamation in China from 1985 to 2010. Estuar. Coast. Shelf Sci. 2016, 170, 83–90. [Google Scholar] [CrossRef]
  5. Chen, X.; Zong, Y.; Zhang, E.; Xu, J.; Li, S. Human impacts on the Changjiang (Yangtze) River basin, China, with special reference to the impacts on the dry season water discharges into the sea. Geomorphology 2001, 41, 111–123. [Google Scholar] [CrossRef]
  6. Haarstad, K.; Bavor, H.J.; Maehlum, T. Organic and metallic pollutants in water treatment and natural wetlands: A review. Water Sci. Technol. 2012, 65, 76–99. [Google Scholar] [CrossRef] [PubMed]
  7. Davidson, E.A.; Savage, K.E.; Bettez, N.; Marino, R.; Howarth, R. Nitrogen in Runoff from Residential Roads in a Coastal Area. Water Air Soil Pollut. 2009, 210, 3–13. [Google Scholar] [CrossRef]
  8. Siddiqui, Z. Holistic Approach to Mitigate the Pollution Impacts in the Coastal Ecosystem of Thailand Using the Remote Sensing Techniques. Int. J. Environ. Res. 2011, 5, 297–306. [Google Scholar]
  9. Findlay, S.; Fischer, D. Ecosystem attributes related to tidal wetland effects on water quality. Ecology 2013, 94, 117–125. [Google Scholar] [CrossRef]
  10. Deegan, L.A.; Johnson, D.S.; Warren, R.S.; Peterson, B.J.; Fleeger, J.W.; Fagherazzi, S.; Wollheim, W.M. Coastal eutrophication as a driver of salt marsh loss. Nature 2012, 490, 388–392. [Google Scholar] [CrossRef]
  11. Savage, C.; Thrush, S.F.; Lohrer, A.M.; Hewitt, J.E. Ecosystem Services Transcend Boundaries: Estuaries Provide Resource Subsidies and Influence Functional Diversity in Coastal Benthic Communities. PLoS ONE 2012, 7, e42708. [Google Scholar] [CrossRef]
  12. Harvey, H.; Dyda, R.; Kirchman, D. Impact of DOM composition on bacterial lipids and community structure in estuaries. Aquat. Microb. Ecol. 2006, 42, 105–117. [Google Scholar] [CrossRef] [Green Version]
  13. Osterholz, H.; Kirchman, D.L.; Niggemann, J.; Dittmar, T. Diversity of bacterial communities and dissolved organic matter in a temperate estuary. FEMS Microbiol. Ecol. 2018, 94, 119. [Google Scholar] [CrossRef] [PubMed] [Green Version]
  14. Traving, S.J.; Rowe, O.; Jakobsen, N.M.; Sørensen, H.; Dinasquet, J.; Stedmon, C.A.; Andersson, A.; Riemann, L. The Effect of Increased Loads of Dissolved Organic Matter on Estuarine Microbial Community Composition and Function. Front. Microbiol. 2017, 8, 351. [Google Scholar] [CrossRef] [PubMed] [Green Version]
  15. Zhu, X.; Wang, L.; Zhang, X.; He, M.; Wang, D.; Ren, Y.; Yao, H.; Ngegla, J.N.V.; Pan, H. Effects of different types of anthropogenic disturbances and natural wetlands on water quality and microbial communities in a typical black-odor river. Ecol. Indic. 2022, 136, 108613. [Google Scholar] [CrossRef]
  16. Golovko, O.; Örn, S.; Sörengård, M.; Frieberg, K.; Nassazzi, W.; Lai, F.Y.; Ahrens, L. Occurrence and removal of chemicals of emerging concern in wastewater treatment plants and their impact on receiving water systems. Sci. Total. Environ. 2020, 754, 142122. [Google Scholar] [CrossRef]
  17. Sörengård, M.; Campos-Pereira, H.; Ullberg, M.; Lai, F.Y.; Golovko, O.; Ahrens, L. Mass loads, source apportionment, and risk estimation of organic micropollutants from hospital and municipal wastewater in recipient catchments. Chemosphere 2019, 234, 931–941. [Google Scholar] [CrossRef]
  18. Gago-Ferrero, P.; Gros, M.; Ahrens, L.; Wiberg, K. Impact of on-site, small and large scale wastewater treatment facilities on levels and fate of pharma-ceuticals, personal care products, artificial sweeteners, pesticides, and perfluoroalkyl substances in recipient waters. Sci. Total Environ. 2017, 601, 1289–1297. [Google Scholar] [CrossRef]
  19. Lawrie, R.A.; Stretch, D.D.; Perissinotto, R. The effects of wastewater discharges on the functioning of a small temporarily open/closed estuary. Estuar. Coast. Shelf Sci. 2010, 87, 237–245. [Google Scholar] [CrossRef]
  20. Santos, I.R.; Costa, R.C.; Freitas, U.; Fillmann, G. Influence of effluents from a Wastewater Treatment Plant on nutrient distribution in a coastal creek from southern Brazil. Braz. Arch. Biol. Technol. 2008, 51, 153–162. [Google Scholar] [CrossRef] [Green Version]
  21. Aguirre, M.; Abad, D.; Albaina, A.; Cralle, L.; Goñi-Urriza, M.S.; Estonba, A.; Zarraonaindia, I. Unraveling the environmental and anthropogenic drivers of bacterial community changes in the Estuary of Bilbao and its tributaries. PLoS ONE 2017, 12, e0178755. [Google Scholar] [CrossRef] [Green Version]
  22. Fonseca, V.F.; Reis-Santos, P.; Duarte, B.; Cabral, H.N.; Caçador, M.I.; Vaz, N.; Dias, J.M.; Pais, M.P. Roving pharmacies: Modelling the dispersion of pharmaceutical contamination in estuaries. Ecol. Indic. 2020, 115, 106437. [Google Scholar] [CrossRef]
  23. Shao, S.; Tai, X.; Zhen, F.; Li, J.; Li, Y. Organic Carbon in Urban Wetland Sediments and Implication for Potential Greenhouse Gas Emission. In Euro-Mediterranean Conference for Environmental Integration; Springer: Berlin/Heidelberg, Germany, 2017. [Google Scholar]
  24. Amaral, V.; Ortega, T.; Romera-Castillo, C.; Forja, J. Linkages between greenhouse gases (CO2, CH4, and N2O) and dissolved organic matter composition in a shallow estuary. Sci. Total. Environ. 2021, 788, 147863. [Google Scholar] [CrossRef] [PubMed]
  25. Euler, S.; Jeffrey, L.C.; Maher, D.T.; MacKenzie, D.; Tait, D.R. Shifts in methanogenic archaea communities and methane dynamics along a subtropical estuarine land use gradient. PLoS ONE 2020, 15, e0242339. [Google Scholar] [CrossRef] [PubMed]
  26. Vincent, S.; Salahudeen, J.; Godson, P.; Abhijith, S.; Nath, A.; Krishnan, K.; Magesh, N.; Kumar, S.; Moses, S. Environmental factors influencing methanogenic activity in two contrasting tropical lake sediments. J. Environ. Biol. 2021, 42, 211–219. [Google Scholar] [CrossRef]
  27. Burdon, F.J.; Bai, Y.; Reyes, M.; Tamminen, M.; Staudacher, P.; Mangold, S.; Singer, H.; Räsänen, K.; Joss, A.; Tiegs, S.D.; et al. Stream microbial communities and ecosystem functioning show complex responses to multiple stressors in wastewater. Glob. Change Biol. 2020, 26, 6363–6382. [Google Scholar] [CrossRef] [PubMed]
  28. Wang, J.; Chen, Y.; Cai, P.; Gao, Q.; Zhong, H.; Sun, W.; Chen, Q. Impacts of municipal wastewater treatment plant discharge on microbial community structure and function of the receiving river in Northwest Tibetan Plateau. J. Hazard. Mater. 2021, 423, 127170. [Google Scholar] [CrossRef]
  29. Guo, X.-P.; Yang, Y.; Niu, Z.-S.; Lu, D.-P.; Zhu, C.-H.; Feng, J.-N.; Wu, J.-Y.; Chen, Y.-R.; Tou, F.-Y.; Liu, M.; et al. Characteristics of microbial community indicate anthropogenic impact on the sediments along the Yangtze Estuary and its coastal area, China. Sci. Total Environ. 2018, 648, 306–314. [Google Scholar] [CrossRef] [PubMed]
  30. Mansfeldt, C.; Deiner, K.; Mächler, E.; Fenner, K.; Eggen, R.I.; Stamm, C.; Schönenberger, U.; Walser, J.-C.; Altermatt, F. Microbial community shifts in streams receiving treated wastewater effluent. Sci. Total. Environ. 2019, 709, 135727. [Google Scholar] [CrossRef]
  31. Rivera Castro, C.A.; Pino, J.A.L.; Pizarro, B.A.; del Pilar Tobar Correa, T.; Lepe, C.L.T.; Figueroa, A.M.C.; Geisse, A.R.; Castro, M.Á.R. Water quality in the El Sauce Estuary, Valparaíso, central Chile. Rev. Int. Contam. Ambient 2020, 36, 261–273. [Google Scholar]
  32. División de Estudios y Planificación STD N° 364. Inventario de Cuencas, Subcuencas y Subsubcuencas de Chile; Dirección General de Aguas: Santiago, Chile, 2014; p. 16. [Google Scholar]
  33. Laura Bridgewater; American Public Health Association; American Water Works Association; Water Environment Federation. Book Standard Methods for the Examination of Water and Wastewater; Mc Graw Hill: New York, NY, USA, 2005. [Google Scholar]
  34. Gray, M.; Pratte, Z.; Kellogg, C. Comparison of DNA preservation methods for environmental bacterial community samples. FEMS Microbiol. Ecol. 2013, 83, 468–477. [Google Scholar] [CrossRef] [PubMed] [Green Version]
  35. Strickland, J.D.H.; Parsons, T. A Practical Handbook of Seawater Analysis; Fisheries Research Board of Canada: Ottawa, ON, Canada, 1972. [Google Scholar]
  36. Atlas, E.L.; Hager, S.; Gordon, L.; Park, P. A Practical Manual for Use of the Technicon (Trade Name) Autoanalyzer (Trade Name) in Seawater Nutrient Analyses; Revised; Oregon State Univ Corvallis Dept Of Oceanography: Corvallis, OR, USA, 1971. [Google Scholar]
  37. Holm-Hansen, O.; Lorenzen, C.J.; Holmes, R.W.; Strickland, J.D.H. Fluorometric Determination of Chlorophyll. ICES J. Mar. Sci. 1965, 30, 3–15. [Google Scholar] [CrossRef]
  38. McAuliffe, C. Gas chromatographic determination of solutes by multiple phase equilibrium. Chem. Technol. 1971, 1, 46–51. [Google Scholar]
  39. Friedman, G.M.; Sanders, J. Principles of Sedimentology; Wiley: Hoboken, NJ, USA, 1978. [Google Scholar]
  40. Byers, S.C.; Mills, E.L.; Stewart, P.L. A comparison of methods of determining organic carbon in marine sediments, with suggestions for a standard method. Hydrobiologia 1978, 58, 43–47. [Google Scholar] [CrossRef]
  41. Parada, A.E.; Needham, D.M.; Fuhrman, J.A. Every base matters: Assessing small subunit rRNA primers for marine microbiomes with mock communities, time series and global field samples. Environ. Microbiol. 2016, 18, 1403–1414. [Google Scholar] [CrossRef] [PubMed]
  42. Apprill, A.; McNally, S.; Parsons, R.; Weber, L. Minor revision to V4 region SSU rRNA 806R gene primer greatly increases detection of SAR11 bacterio-plankton. Aquat. Microb. Ecol. 2015, 75, 129–137. [Google Scholar] [CrossRef] [Green Version]
  43. Rotthauwe, J.H.; Witzel, K.P.; Liesack, W. The ammonia monooxygenase structural gene amoA as a functional marker: Molecular fine-scale analysis of natural ammonia-oxidizing populations. Appl. Environ. Microbiol. 1997, 63, 4704–4712. [Google Scholar] [CrossRef] [PubMed] [Green Version]
  44. Pjevac, P.; Schauberger, C.; Poghosyan, L.; Herbold, C.; van Kessel, M.; Daebeler, A.; Steinberger, M.; Jetten, M.; Lücker, S.; Wagner, M.; et al. AmoA-targeted polymerase chain reaction primers for the specific detection and quantification of comammox Nitrospira in the environment. Front. Microbiol. 2017, 8, 1508. [Google Scholar] [CrossRef] [Green Version]
  45. Holmes, A.J.; Costello, A.; Lidstrom, M.E.; Murrell, J.C. Evidence that participate methane monooxygenase and ammonia monooxygenase may be evolutionarily related. FEMS Microbiol. Lett. 1995, 132, 203–208. [Google Scholar] [CrossRef]
  46. Costello, A.M.; Lidstrom, M.E. Molecular Characterization of Functional and Phylogenetic Genes from Natural Populations of Methanotrophs in Lake Sediments. Appl. Environ. Microbiol. 1999, 65, 5066–5074. [Google Scholar] [CrossRef] [PubMed] [Green Version]
  47. Steinberg, L.M.; Regan, J.M. Phylogenetic Comparison of the Methanogenic Communities from an Acidic, Oligotrophic Fen and an Anaerobic Digester Treating Municipal Wastewater Sludge. Appl. Environ. Microbiol. 2008, 74, 6663–6671. [Google Scholar] [CrossRef] [Green Version]
  48. Molina, V.; Belmar, L.; Levipan, H.A.; Ramírez-Flandes, S.; Anguita, C.; Galán, A.; Montes, I.; Ulloa, O. Spatiotemporal Distribution of Key Pelagic Microbes in a Seasonal Oxygen-Deficient Coastal Upwelling System of the Eastern South Pacific Ocean. Front. Mar. Sci. 2020, 7, 561597. [Google Scholar] [CrossRef]
  49. Cabrol, L.; Thalasso, F.; Gandois, L.; Sepulveda-Jauregui, A.; Martinez-Cruz, K.; Teisserenc, R.; Tananaev, N.; Tveit, A.; Svenning, M.M.; Barret, M. Anaerobic oxidation of methane and associated microbiome in anoxic water of Northwestern Siberian lakes. Sci. Total. Environ. 2020, 736, 139588. [Google Scholar] [CrossRef] [PubMed]
  50. Bolyen, E.; Rideout, J.R.; Dillon, M.; Bokulich, N.; Abnet, C.; Al-Ghalith, G.; Alexander, H.; Alm, E.; Arumugam, M.; Asnicar, F.; et al. QIIME 2: Reproducible, interactive, scalable, and extensible microbiome data science. Nat. Biotechnol. 2019, 37, 852–857. [Google Scholar] [CrossRef]
  51. Callahan, B.J.; Mcmurdie, P.J.; Rosen, M.J.; Han, A.W.; Johnson, A.J.A.; Holmes, S.P. DADA2: High-resolution sample inference from Illumina amplicon data. Nat. Methods 2016, 13, 581–583. [Google Scholar] [CrossRef] [Green Version]
  52. Rognes, T.; Flouri, T.; Nichols, B.; Quince, C.; Mahé, F. VSEARCH: A versatile open source tool for metagenomics. PeerJ 2016, 2016, e2584. [Google Scholar] [CrossRef] [PubMed] [Green Version]
  53. Team, R.C. R: A Language and Environmental for Statistical Computing; R Foundation for Statistical Computing: Vienna, Austria, 2020. [Google Scholar]
  54. Harrell; Dupont, C. Harrell Miscellaneous, R Package, Version 4.6-0. 2021. Available online: https://cran.r-project.org/package=Hmisc (accessed on 1 November 2022).
  55. Wei, T.; Simko, V.; Levy, M.; Xie, Y.; Jin, Y.; Zemla, J. Package “corrplot”: Visualization of a Correlation Matrix. 2017. Available online: https://github.com/taiyun/corrplot (accessed on 1 November 2022).
  56. McMurdie, P.J.; Holmes, S. phyloseq: An R package for reproducible interactive analysis and graphics of microbiome census data. PLoS ONE 2013, 8, e61217. [Google Scholar] [CrossRef] [PubMed] [Green Version]
  57. Andersen, K.S.; Kirkegaard, R.H.; Karst, S.M.; Albertsen, M. Ampvis2: An R package to analyse and visualise 16S rRNA amplicon data. BioRxiv 2018, 299537. [Google Scholar]
  58. Oksanen, J.; Guillaume, B.; Kindt, R.; Pierre, L. Community Ecology Package, R Package Version. 2013; Volume 2, pp. 321–326. Available online: cran.r-project.org/package=vegan (accessed on 1 November 2022).
  59. Love, M.I.; Huber, W.; Anders, S. Moderated estimation of fold change and dispersion for RNA-seq data with DESeq2. Genome Biol. 2014, 15, 550. [Google Scholar] [CrossRef] [PubMed] [Green Version]
  60. Anderson, M.; Gorley, R.; Clarke, R. Permanova+ for Primer: Guide to Software and Statisticl Methods; Primer-E Limited: Auckland, New Zealand, 2008. [Google Scholar]
  61. Hu, B.; Wang, D.; Zhou, J.; Meng, W.; Li, C.; Sun, Z.; Guo, X.; Wang, Z. Greenhouse gases emission from the sewage draining rivers. Sci. Total. Environ. 2018, 612, 1454–1462. [Google Scholar] [CrossRef]
  62. Burgos, M.; Sierra, A.; Ortega, T.; Forja, J. Anthropogenic effects on greenhouse gas (CH4 and N2O) emissions in the Guadalete River Estuary (SW Spain). Sci. Total. Environ. 2015, 503–504, 179–189. [Google Scholar] [CrossRef]
  63. Ivanov, M.; Pimenov, N.; Rusanov, I.; Lein, A. Microbial Processes of the Methane Cycle at the North-western Shelf of the Black Sea. Estuar. Coast. Shelf Sci. 2002, 54, 589–599. [Google Scholar] [CrossRef]
  64. Beaulieu, J.J.; Shuster, W.D.; Rebholz, J.A. Nitrous Oxide Emissions from a Large, Impounded River: The Ohio River. Environ. Sci. Technol. 2010, 44, 7527–7533. [Google Scholar] [CrossRef]
  65. Hinshaw, S.E.; Dahlgren, R.A. Dissolved Nitrous Oxide Concentrations and Fluxes from the Eutrophic San Joaquin River, California. Environ. Sci. Technol. 2013, 47, 1313–1322. [Google Scholar] [CrossRef] [PubMed]
  66. Sarma, V.V.S.S.; Arya, J.; Subbaiah, C.V.; Naidu, S.A.; Gawade, L.; Kumar, P.P.; Reddy, N.P.C. Stable isotopes of carbon and nitrogen in suspended matter and sediments from the Godavari estuary. J. Oceanogr. 2012, 68, 307–319. [Google Scholar] [CrossRef]
  67. Middelburg, J.J.; Herman, P.M.J. Organic matter processing in tidal estuaries. Mar. Chem. 2007, 106, 127–147. [Google Scholar] [CrossRef]
  68. Vaalgamaa, S.; Sonninen, E.; Korhola, A.; Weckström, K. Identifying recent sources of organic matter enrichment and eutrophication trends at coastal sites using stable nitrogen and carbon isotope ratios in sediment cores. J. Paleolimnol. 2013, 50, 191–206. [Google Scholar] [CrossRef]
  69. Voss, M.; Emeis, K.-C.; Hille, S.; Neumann, T.; Dippner, J.W. Nitrogen cycle of the Baltic Sea from an isotopic perspective. Glob. Biogeochem. Cycles 2005, 19. [Google Scholar] [CrossRef] [Green Version]
  70. Pozo-Solar, F.; Cornejo-D´ottone, M.; Orellana, R.; Yepsen, D.V.; Bassi, N.; Salcedo-Castro, J.; Aguilar-Muñoz, P.; Molina, V. Dissolved greenhouse gases and benthic microbial communities in coastal wetlands of the Chilean coast semiarid region. PLoS ONE 2022, 17, e0271208. [Google Scholar] [CrossRef]
  71. Wyness, A.J.; Fortune, I.; Blight, A.J.; Browne, P.; Hartley, M.; Holden, M.; Paterson, D.M. Ecosystem engineers drive differing microbial community composition in intertidal estuarine sediments. PLoS ONE 2021, 16, e0240952. [Google Scholar] [CrossRef]
  72. Niestępski, S.; Harnisz, M.; Ciesielski, S.; Korzeniewska, E.; Osińska, A. Environmental fate of Bacteroidetes, with particular emphasis on Bacteroides fragilis group bacteria and their specific antibiotic resistance genes, in activated sludge wastewater treatment plants. J. Hazard. Mater. 2020, 394, 122544. [Google Scholar] [CrossRef]
  73. Price, J.R.; Ledford, S.H.; Ryan, M.O.; Toran, L.; Sales, C.M. Wastewater treatment plant effluent introduces recoverable shifts in microbial community composition in receiving streams. Sci. Total. Environ. 2018, 613–614, 1104–1116. [Google Scholar] [CrossRef]
  74. McLellan, S.L.; Huse, S.M.; Mueller-Spitz, S.R.; Andreishcheva, E.N.; Sogin, M.L. Diversity and population structure of sewage-derived microorganisms in wastewater treatment plant influent. Environ. Microbiol. 2010, 12, 378–392. [Google Scholar] [CrossRef] [PubMed] [Green Version]
  75. The Human Microbiome Project Consortium. Structure, function and diversity of the healthy human microbiome. Nature 2012, 486, 207–214. [Google Scholar] [CrossRef] [PubMed] [Green Version]
  76. Cai, L.; Ju, F.; Zhang, T. Tracking human sewage microbiome in a municipal wastewater treatment plant. Appl. Microbiol. Biotechnol. 2013, 98, 3317–3326. [Google Scholar] [CrossRef]
  77. Drury, B.; Rosi-Marshall, E.; Kelly, J.J. Wastewater Treatment Effluent Reduces the Abundance and Diversity of Benthic Bacterial Communities in Urban and Suburban Rivers. Appl. Environ. Microbiol. 2013, 79, 1897–1905. [Google Scholar] [CrossRef] [Green Version]
  78. Tertuliani, J.; Alvarez, D.; Furlong, E.; Meyer, M.; Zaugg, S.; Koltun, G. Occurrence of Organic Wastewater Compounds in the Tinkers Creek Watershed and Two Other Tributaries to the Cuyahoga River, Northeast Ohio; U.S. Geological Survey: Reston, VA, USA, 2008.
  79. Zerva, I.; Remmas, N.; Kagalou, I.; Melidis, P.; Ariantsi, M.; Sylaios, G.; Ntougias, S. Effect of Chlorination on Microbiological Quality of Effluent of a Full-Scale Wastewater Treatment Plant. Life 2021, 11, 68. [Google Scholar] [CrossRef]
  80. Dang, H.; Li, J.; Chen, R.; Wang, L.; Guo, L.; Zhang, Z.; Klotz, M. Diversity, abundance, and spatial distribution of sediment ammonia-oxidizing Betaproteobacteria in response to environmental gradients and coastal eutrophication in Jiaozhou Bay, China. Appl. Environ. Microbiol. 2010, 76, 4691–4702. [Google Scholar] [CrossRef] [PubMed] [Green Version]
  81. Zhang, Y.; Chen, L.; Sun, R.; Dai, T.; Tian, J.; Wen, D. Ammonia-oxidizing bacteria and archaea in wastewater treatment plant sludge and nearby coastal sediment in an industrial area in China. Appl. Microbiol. Biotechnol. 2015, 99, 4495–4507. [Google Scholar] [CrossRef]
  82. Xu, Y.; Liu, G.; Hua, Y.; Wan, X.; Hu, J.; Zhu, D.; Zhao, J. The diversity of comammox bacteria and the effect of sewage discharge on their abundance in eutrophic lake sediments. J. Soils Sediments 2020, 20, 2495–2503. [Google Scholar] [CrossRef]
  83. Hu, B.-L.; Shen, L.-D.; Lian, X.; Zhu, Q.; Liu, S.; Huang, Q.; He, Z.-F.; Geng, S.; Cheng, D.-Q.; Lou, L.-P.; et al. Evidence for nitrite-dependent anaerobic methane oxidation as a previously overlooked microbial methane sink in wetlands. Proc. Natl. Acad. Sci. USA 2014, 111, 4495–4500. [Google Scholar] [CrossRef] [PubMed] [Green Version]
  84. Naqvi, S.W.A.; Lam, P.; Narvenkar, G.; Sarkar, A.; Naik, H.; Pratihary, A.; Shenoy, D.M.; Gauns, M.; Kurian, S.; Damare, S.; et al. Methane stimulates massive nitrogen loss from freshwater reservoirs in India. Nat. Commun. 2018, 9, 1265. [Google Scholar] [CrossRef] [PubMed]
  85. Deb, D.; Schneider, P.; Dudayev, Z.; Emon, A.; Areng, S.S.; Mozumder, M.M. Perceptions of urban pollution of river dependent rural communities and their impact: A case study in Bang-ladesh. Sustainability 2021, 13, 13959. [Google Scholar] [CrossRef]
  86. Aranda Sagredo, C. Plan maestro de recualificación sostenible en Laguna Verde, in Facultad de Arquitectura y Urbanismo. Bachelor´s Thesis, Universidad de Chile, Santiago, Chile, 2013. [Google Scholar]
  87. Wang, M.; Gong, H. Imbalanced Development and Economic Burden for Urban and Rural Wastewater Treatment in China—Discharge Limit Legislation. Sustainability 2018, 10, 2597. [Google Scholar] [CrossRef] [Green Version]
  88. Jensen, L.; Ader, D. The Demography of Rural Latin America: The Case of Chile, in International Handbook of Rural Demography; Springer: Berlin/Heidelberg, Germany, 2012; pp. 95–110. [Google Scholar]
Figure 1. Sampled sites of El Sauce estuary including five stations.
Water 15 01251 g001
Figure 2. Physicochemical and nutrients conditions in all water samples during winter (left panels) and summer (right panel) of El Sauce estuary; Temperature (A,B); Conductivity (C,D); Nitrate and Nitrite (E,F), Silicate (G,H). * Discharge Station.
Water 15 01251 g002
Figure 3. Greenhouse gas concentration (A) CO2, (B) CH4, and (C) N2O dissolved in water in winter (cyan bars) and summer (orange bars) of El Sauce Estuary. * Discharge Station.
Water 15 01251 g003
Figure 4. (A) Total organic matter percentage and (B) sediment granulometry distribution. * Discharge Station.
Water 15 01251 g004
Figure 5. Isotopic organic matter signatures (A) and C/N rates (B) in sediments during winter and summer of El Sauce estuary. * Discharge Station.
Water 15 01251 g005
Figure 6. Spearman correlation analysis between water quality parameters, GHG, nutrients and sediment parameters.
Water 15 01251 g006
Figure 7. Taxa bar plot showed microbiome distribution from sediment at the phylum level during winter (left panel) and summer. Others correspond to phyla with relative abundance < %. Note that no sequencing data were available for E7 in summer.
Water 15 01251 g007
Figure 8. Heatmap showed the most dominant orders in the pre-discharge, discharge, and post-discharge stations during winter and summer.
Water 15 01251 g008
Figure 9. Volcano plot of differentially abundant ASVs identified between discharge and pre-discharge. A positive log2-fold change in relative abundance indicates the feature predominated in discharge water, and vice versa for pre-discharge water. The gray dots denote the ASVs without marked differences (p-value > 0.01, red line).
Water 15 01251 g009
Figure 10. Bray–Curtis based redundancy analysis comparing benthic microbiomes dissimilarities between pre-discharge, discharge, and post-discharge stations and its relationship with physicochemical parameters. Parameters significantly correlated with the ordination identified through envfit function p-value < 0.05 were depicted in black.
Water 15 01251 g010
Figure 11. Taxa bar plot showed functional group 16S metabarcoding abundance at the family level (A) Nitrifyiers, (B) Methanotrophs/Methylotrophs and (C) Methanogens during winter and summer in all sampled sites. Note that no sequencing data were available for E7 in summer. * Discharge Station.
Water 15 01251 g011
Figure 12. Abundance of all targeted functional genes (A) amoA, (B) commaA, (C) pmoA, and (D) mrcA) in the predischarge, discharge, and post-discharge stations during winter (black bars) and summer (grey bars). The abundance is expressed in copies per gram of sediment dry weight (DW).
Water 15 01251 g012
Figure 13. Spearman correlation analysis between functional microbial groups correlations based on qPCR genes abundances correlation with reads.
Water 15 01251 g013
Table 1. qPCR table indicating its gene, group, primers, primers concentration, annealing temperature, efficiency, R2, and reference.
GeneGroupPrimersPrimer Concentration (µM)Annealing Temperature (°C)Efficiency (%)R2Reference
Ammonia monooxygenase subunit A (amoA)Betaproteobacteria βAOBamoA1F0.45692.55%0.998[43]
amoA2R0.4
Ammonia monooxygenase subunit A (comaA)COMAMMOX Nitrospira Clade AcomaA-244F coma-659R0.45283.10%0.999[44]
0.4
Methane monooxygenase subunit A (pmoA)MethanotrophsA189F0.45590.34%0.999[45]
mb661R0.4[46]
Methyl coenzyme M reductase subunit A (mcrA)MethanogensmlasmcrA-rev15590.59%0.999[47]
1
Table 2. Water quality factors in all sampled stations during winter and summer. All bold numbers are values that exceed the maximum allowed limit (MAL). The values in brackets are the results previously reported by Rivera et al. (2020).
WINTERSUMMERMAL
FACTORF2F3E7E10E11F2F3E7E10E11
DTS (mg/L)3815875435636474136456601406>2000<500
Transparency (Secchi disk depth in cm)1840126084NDNDND60 (0.61; 0.2)4 (0.11; 0.12)≥120
Turbidity (NTU)5.5418.5315.6010.0214.271.9332.8355.404.9110.1650
Color (Pt/C)139.00316.00299.67183.00278.67254.00
(139; 126)
624.00
(448; 1063)
715.00 (550; 1572)239.00 (415; 75)218.00 (350; 225)<100
Sulfate (mg/L)85.33244.00141.33133.33136.00124.85159.15153.66205.80270.28250
Chlorides (mg/L)75.63146.53146.53184.34255.240.70
(70.9; 113.5)
1.43
(106. 4; 156)
1.57
(355; 269)
5.30
(142; 326)
8.73
(709; 2822)
200
Total Coliforms (NMP)9200<1.8<1.8ND110016,000 (>16,000; >1600)0
(>16,000; <1.8)
11050022001000
Fecal Coliforms (NMP)140<1.8<1.8ND490260 (<1.8; 20)0 (20; <1.8)803001401000
BOD5 (mg/L)7.300.004.354.5111.9811.3
(1000; 5.44)
65.79
(1400; 99.9)
66.4117.7120.3120
Chlorophyll-a (mg/L)6.520.60.1920.0241.1431.810.3939.2822.7432.9210
Disclaimer/Publisher’s Note: The statements, opinions and data contained in all publications are solely those of the individual author(s) and contributor(s) and not of MDPI and/or the editor(s). MDPI and/or the editor(s) disclaim responsibility for any injury to people or property resulting from any ideas, methods, instructions or products referred to in the content.

