1. Introduction
Valves are widely used in several areas, from medical equipment and installations in various industrial branches to domestic equipment. Their application in building installations is common, e.g., as shower control valves.
The evolution of valves throughout history is neither regular nor systematic. Pearson [
1] reports that the first type of valve, the male-type valve, was recorded before the Christian era. The second valve model, created around 1790, was the globe type. The third and fourth valve types were developed in the 19th century: the gate valve in 1839 and the parallel slide valve in 1884.
Even acknowledging that the study of hydraulic valves for building installations has been consolidated, which can be confirmed by a literature review, further research and development could still be useful in this area. Recent and rapid technological advances have facilitated improvements in the performance of this type of equipment, typically resulting in reduced water and energy consumption, which are increasingly essential features. Mete and Xue [
2] state that one of the main characteristics of ecological modernization is technological innovation.
Lisowski and Rajda [
3] state that energy consumption in hydraulic systems must be reduced by minimizing head loss in their components, which include valves. Thus, the objective of this study is to present a new type of control valve for showers.
Valves are necessary for the proper functioning of any fluid transport system. Building installations mostly use gate valves and globe valves.
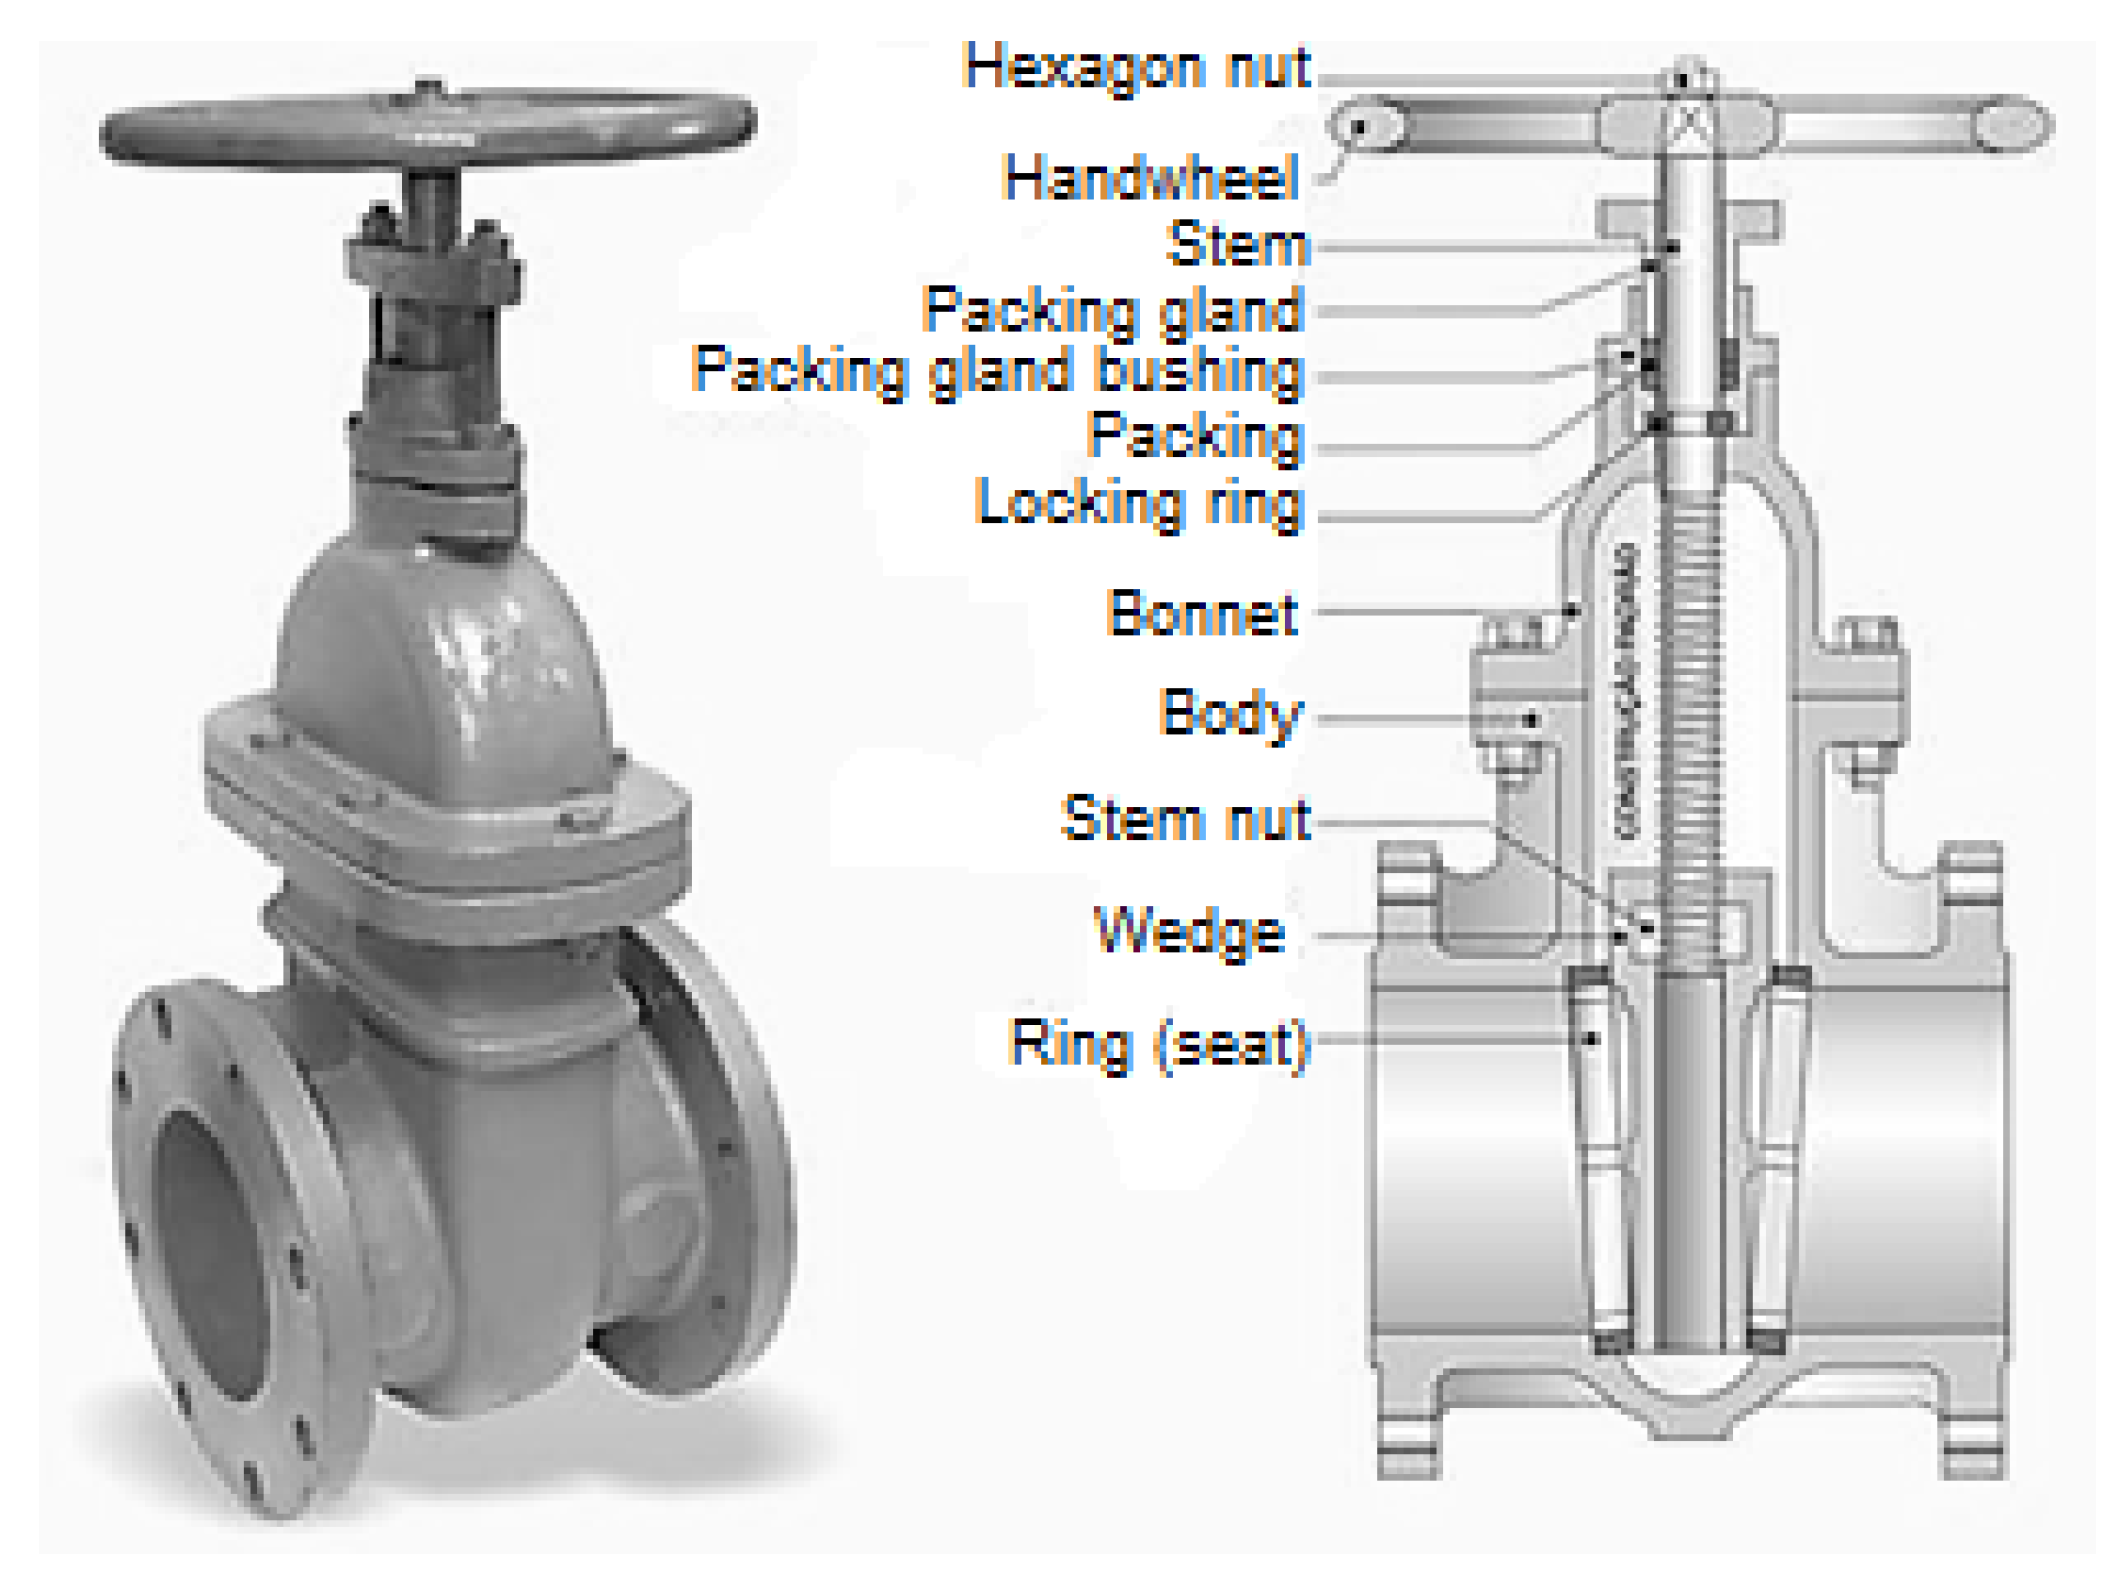
Gate valves are designed to act as maintenance valves, i.e., operating fully open or closed. The advantages of gate valves are as follows: they permit the completely unobstructed passage of fluid when the valve is fully open, they provide good tightness for any type of fluids, they can be constructed in a wide range of sizes, they can operate under wide ranges of pressure and temperature, and they permit flow in both directions of the valve. On the other hand, gate valves are not suitable for frequent operation, flow regulation and throttling cannot be applied, and they are necessarily large because of the translation movement of the plug.
Figure 1 shows the fluid passage and the interior of a gate valve.
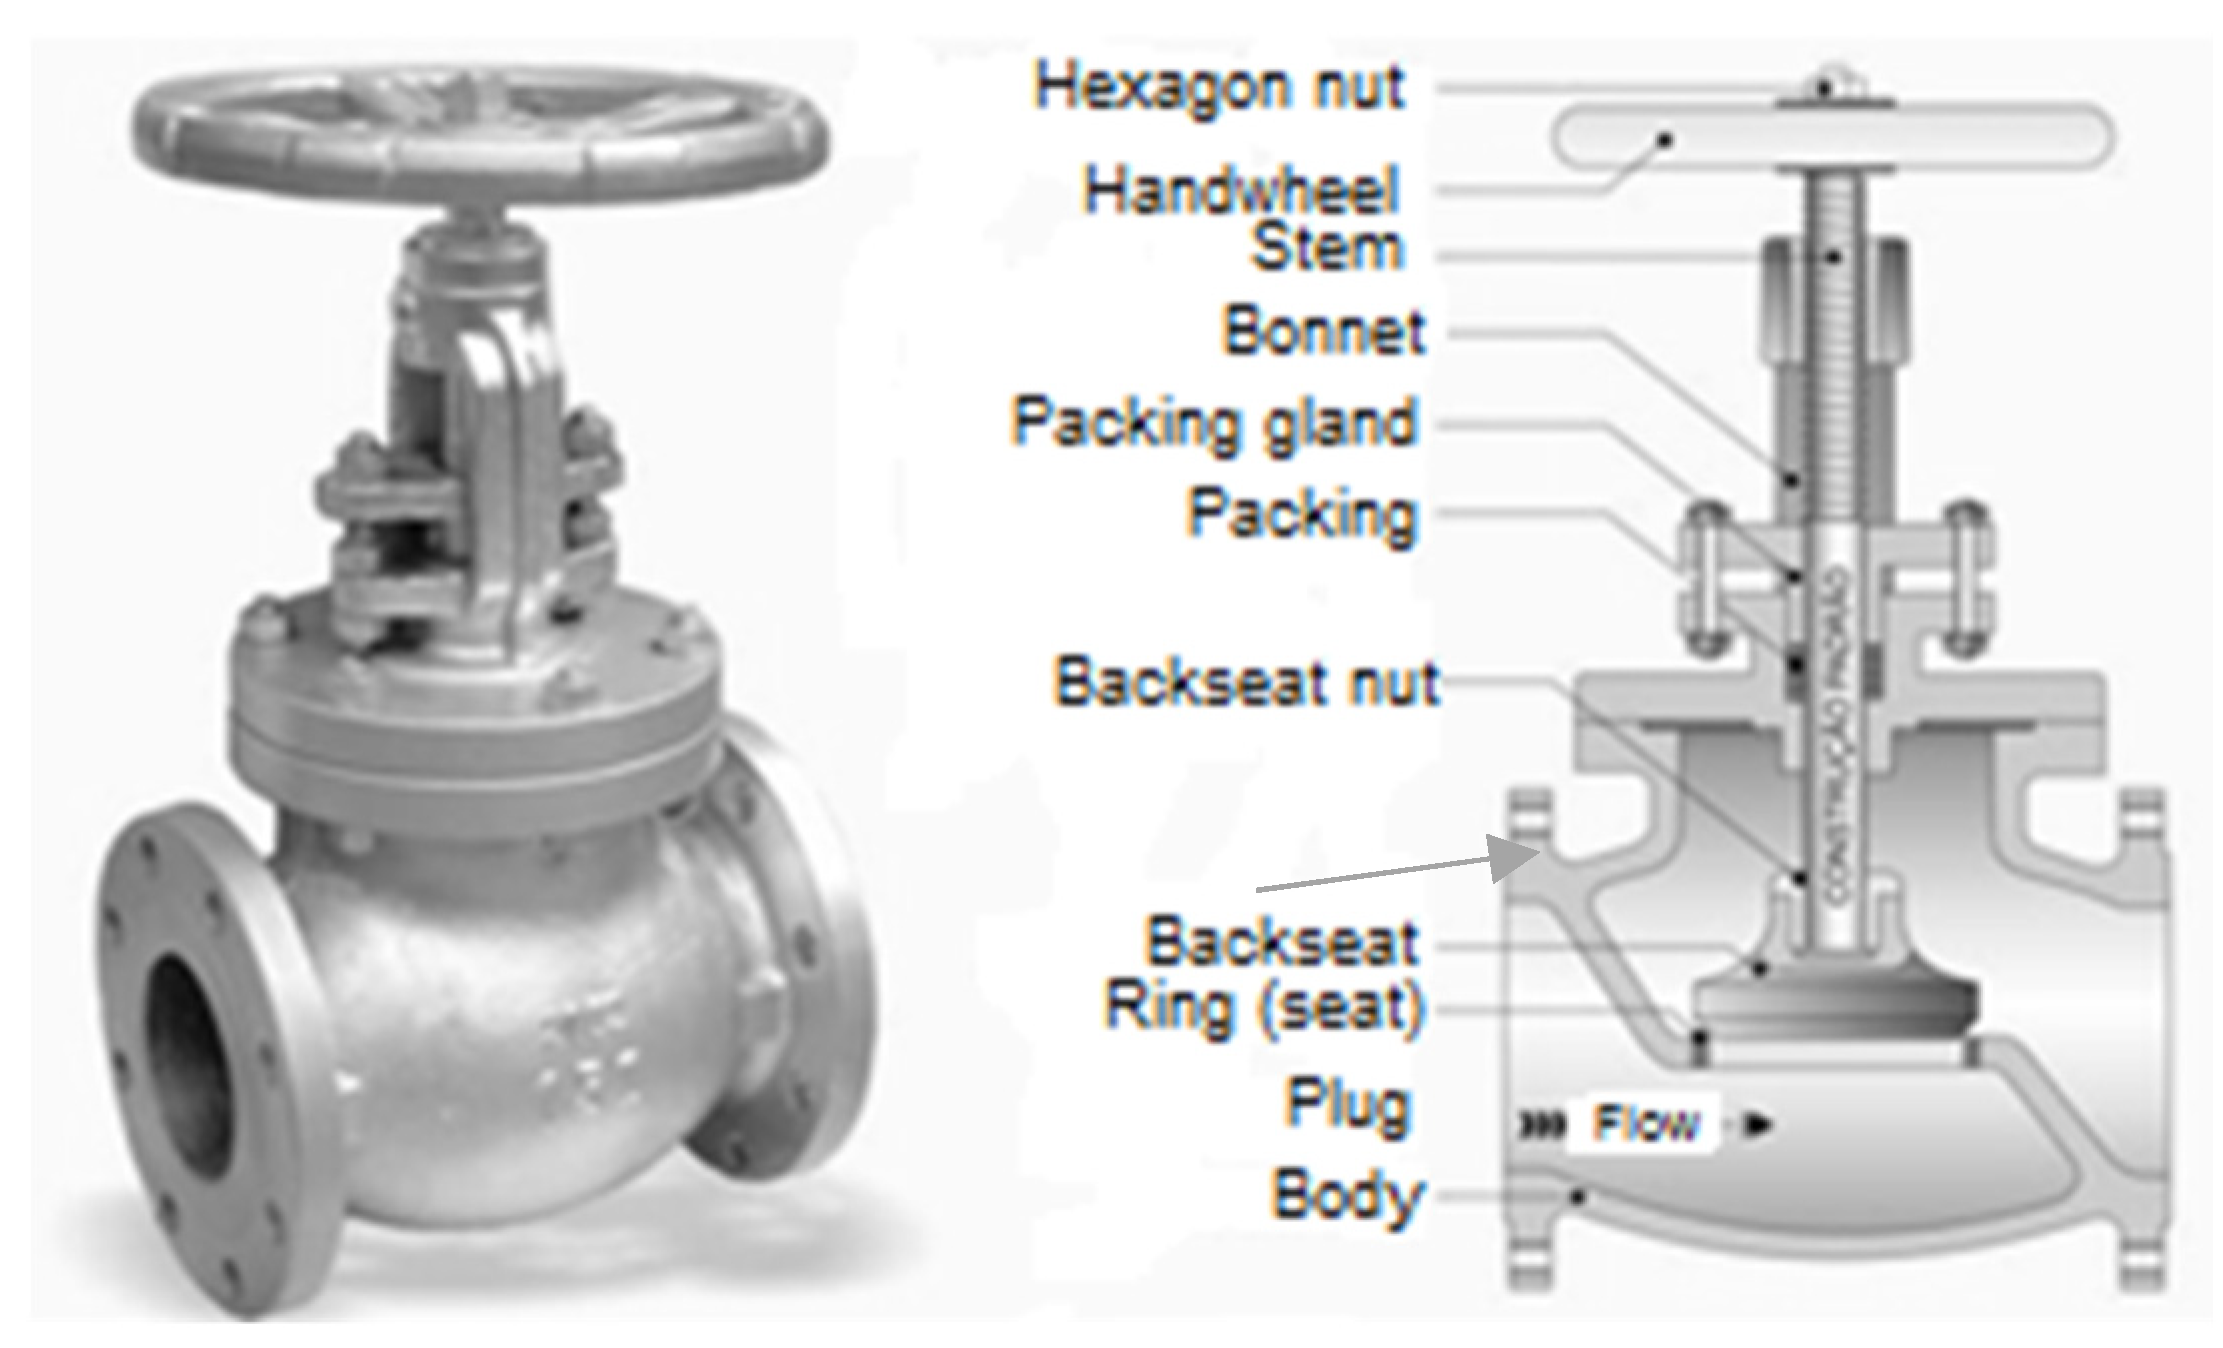
Globe valves are designed to control flow rate and pressure, and they are widely used in building and industrial installations. The advantages of globe valves include their ability to partially control the flow rate, with faster opening and closing than gate valves. The constructive characteristics of the seat-plug allow total sealing, and because the internal components can be accessed without removing them from the hydraulic installation, maintenance is relatively easy. They can also function in a wide pressure/temperature range. However, globe valves do not permit flow in both directions and head loss can be high due to the change in flow direction and the turbulence of the water inside [
5]. High head loss must be avoided, as it indicates wasted energy during the flow.
Figure 2 shows the fluid passage and the interior of a globe valve.
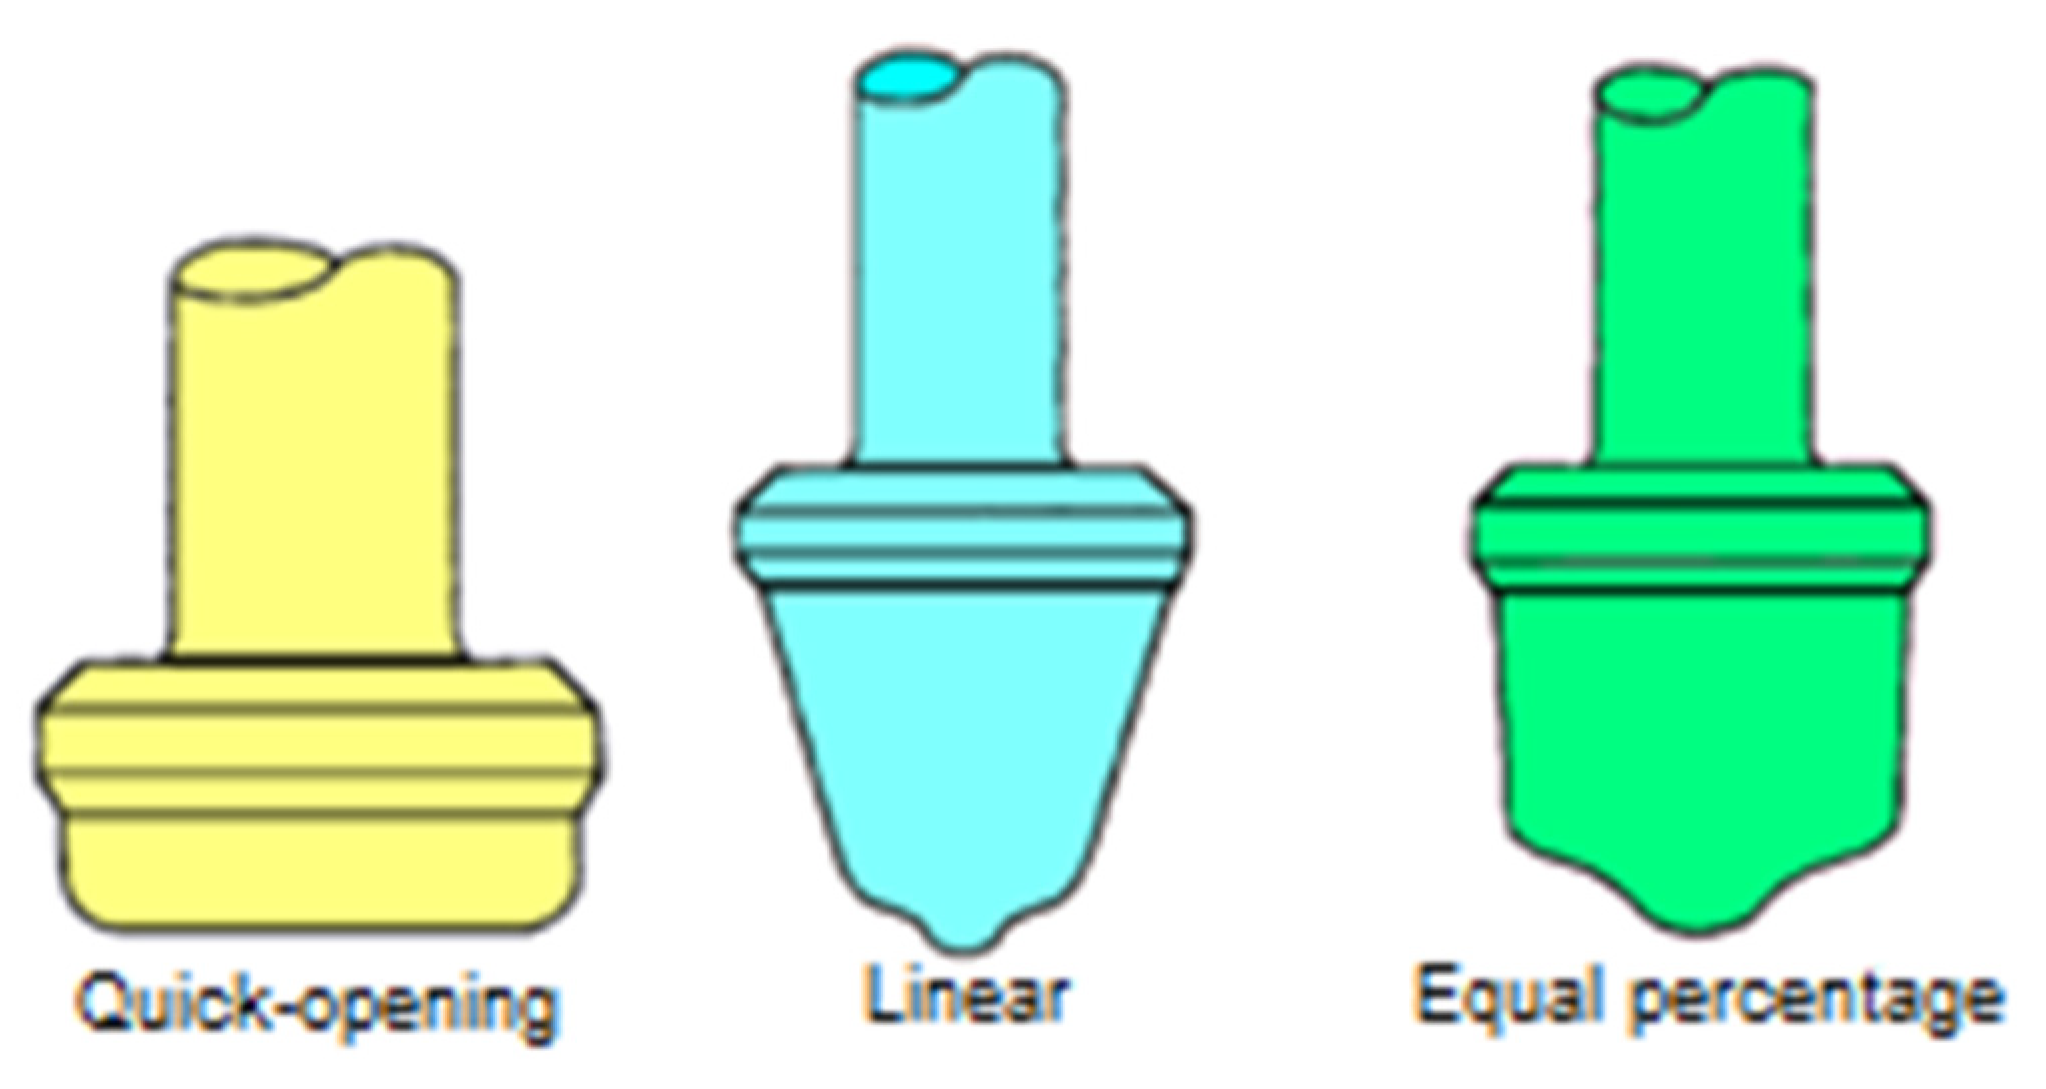
An essential operational characteristic of valves is the flow rate variation according to the valve opening. This can be classified as quick-opening, linear, or equal percentage [
7]. In the case of globe valves, one factor affecting their behavior is the plug design, examples of which are shown in
Figure 3. The quick-opening globe type is usually used to regulate water flow in shower stalls.
Qian, J. et al. [
8] also cite the high head loss of globe valves. The authors emphasize that these devices are widely used in the process industry as they provide stability and security to the system. Manufacturers seek alternative valve designs with low head loss and constructive simplicity.
Head loss reduces the mechanical energy of the fluid when it flows through a valve, which can lead to decreased pressure and flow rate or to increased electrical energy consumption (when a pumping system is present). This problem, which is critical in the case of the globe valves, can be prevented by increasing the diameter of the pipes, though this can lead to increased installation costs and material waste. Saving resources is essential for civil construction. The IEDI-FGV (Getúlio Vargas Foundation—Institute of Studies for Industrial Development) [
9] found that civil construction is responsible for consuming 30% of all resources extracted from nature and that it causes about 30% of global GHG (greenhouse gas) emissions. Thus, Mete and Xue [
2] suggest that, regarding the environmental sustainability of future housing, any reduction in the consumption of materials in civil construction will also result in a reduction in GHG emissions. Improved valve design can thus result in environmental benefits.
Another aspect we considered when researching new valves was the handwheel (handle) design, located outside the wall in the shower stall area. Usable space in real estate is decreasing worldwide. Data from EMBRAESP (Empresa Brasileira de Estudos de Patrimônio Ltd., São Paulo, Brazil), published in [
10], highlight the trend of new apartments with smaller areas. In São Paulo, Brazil, there has been a 29% reduction in the areas of properties in recent years. More recently, Mendonça and Villa [
11] verified that the shrinking of properties is a reality throughout Brazil. Thus, research is essential for designing innovative equipment and products that favor living in smaller spaces. The valve parts external to the masonry combined with these reduced spaces may lead to mechanical shocks, especially in children and the elderly. Furthermore, because the opening and closing of traditional valves are performed in a rotating manner, Campos [
12] highlights the importance of ergonomic studies on the design of sanitary metal handwheels.
Improving the controllability of hydraulic parts reduces water waste, a problem that affects many countries worldwide. In Brazil, despite offering 19 times what is established by the United Nations annually per inhabitant [
13], the country wastes approximately 40% of its total treated water during distribution. The increase in controllability provided by better equipment could significantly reduce water consumption in buildings [
14,
15].
In addition to environmental gains and energy savings, the new valve provides even greater comfort to users due to the elimination of parts external to the masonry. Additional benefits include gaining internal space in the shower stall and improved ergonomics in valve operation. The front access to the internal parts of the designed valve facilitates maintenance, reducing maintenance time and, consequently, saving water since leaks can be quickly corrected [
16]. Front access to parts for maintenance eliminates the need to break masonry and coatings, avoiding the generation of demolition waste, which is responsible for approximately 25–30% of the total waste in the European Union, and reducing the environmental impact [
17].
The objective of this study is to present a new model of hydraulic valve for building installations. This new valve is designed to decrease head loss, increase controllability, and eliminate parts external to the masonry or other type of seal.
The paper is arranged as follows: following a brief concept review of computational fluid dynamics, the Materials and Methods section will discuss the development of the appropriate geometry for the proposed valve model. The Results and Analysis section will show the best geometry that demonstrates desirable hydraulic characteristics for a building valve, and this will be followed by the Conclusions section.
Computational Fluid Dynamics—CFD
The research process for the new valve involved evaluating different alternatives until reaching a satisfactory solution. The evaluations of the head loss and the general aspect of the flow of each alternative design were performed using CFD software, an acronym for computational fluid dynamics. Versteeg and Malalasekera [
18] show that the use of CFD programs contributes to the analysis of complex flow phenomena in various fields of application. This tool is very suitable for predicting flow behavior, allowing the visualization of three-dimensional flows and providing detailed information concerning velocities and pressures. CFD has been successfully used in more complex hydraulic applications than the one treated here, such as two-phase flows [
19,
20]. CFD has been widely used in the design of valves [
3,
8,
21,
22,
23,
24,
25,
26,
27,
28], with many works predicting head loss with good accuracy compared with experimental data [
3,
21,
22,
23,
24] (the other works, [
8,
25,
26,
27,
28], made no comparisons). CFD software allows the testing of several design options, sometimes without the need to build physical models [
29], thus enabling considerable savings in product development.
The present study used SolidWorks, a CAD program with an optional CFD module called Flow Simulation. Parts assembly, adjustments, and flow simulation can be performed, providing data on the inherent characteristics of the valve, i.e., the characteristics of the isolated valve, without it being inserted in any hydraulic system.
CFD programs solve Navier–Stokes equations using numerical methods. These equations apply Newton’s second law to fluid flow and are valid for both laminar and turbulent flows. However, turbulent flows present an additional difficulty. They require very refined meshes to resolve all flow scales up to the smallest vortexes, and the flow simulation thus becomes unfeasible in most practical cases, even using currently available supercomputers [
18]. Despite this, such flow simulations have been used for scientific research, and they are known as direct numerical simulations (DNS). CFD programs use so-called turbulence models to address this problem. These models can be classified into two broader classes: LES models and RANS models.
Large eddy simulation (LES) models are similar to DNS, but they allow for the use of meshes larger than the finest vortexes (eddies). The effect of the smaller vortexes is included through so-called subgrid models. RANS models, on the other hand, solve only the time average of the flow, leaving the turbulent fluctuations. Therefore, LES models tend to be less computationally demanding than DNS (by orders of magnitude), but tend to be more demanding than RANS simulations (by orders of magnitude).
RANS originates from the use of the Reynolds average of the Navier–Stokes equations. The main types of RANS-based turbulence models currently used are the turbulent viscosity models. These models additionally apply the Boussinesq hypothesis, which involves the use of turbulent viscosity [
18]. The Flow Simulation program from SolidWorks also uses this type of turbulence modeling, and the resulting equations for incompressible flow include the continuity equation (Equation (1)) and the equations of motion in the
x,
y, and
z directions, represented by Equations (2)–(4), respectively.
In Equations (1)–(4), Vx, Vy, and Vz are the velocities in the x, y, and z directions, respectively, μeff is the effective viscosity of the fluid, p is pressure, and ρ is the specific mass of the fluid.
Additional equations are required to complete the mathematical formulation to calculate the effective viscosity
μeff, the sum of the actual fluid viscosity, and the turbulent viscosity, as indicated in Equation (5).
For this purpose, Flow Simulation uses the
k–
ε turbulence model, where
k is the kinetic energy of turbulent fluctuations and
ε its dissipation rate. In this model, the turbulent viscosity is given by Equation (6). There is a marked variation in the turbulent flow properties in the region near the solid surfaces. Wall functions are used to consider this effect without significantly reducing the cell size. More details about the turbulence model and the equations for
k and
ε can be obtained in [
30].
where:
.
The numerical method used by Flow Simulation is based on the finite volume method [
18]. All simulations were performed using the standard numerical options available in the software [
30].
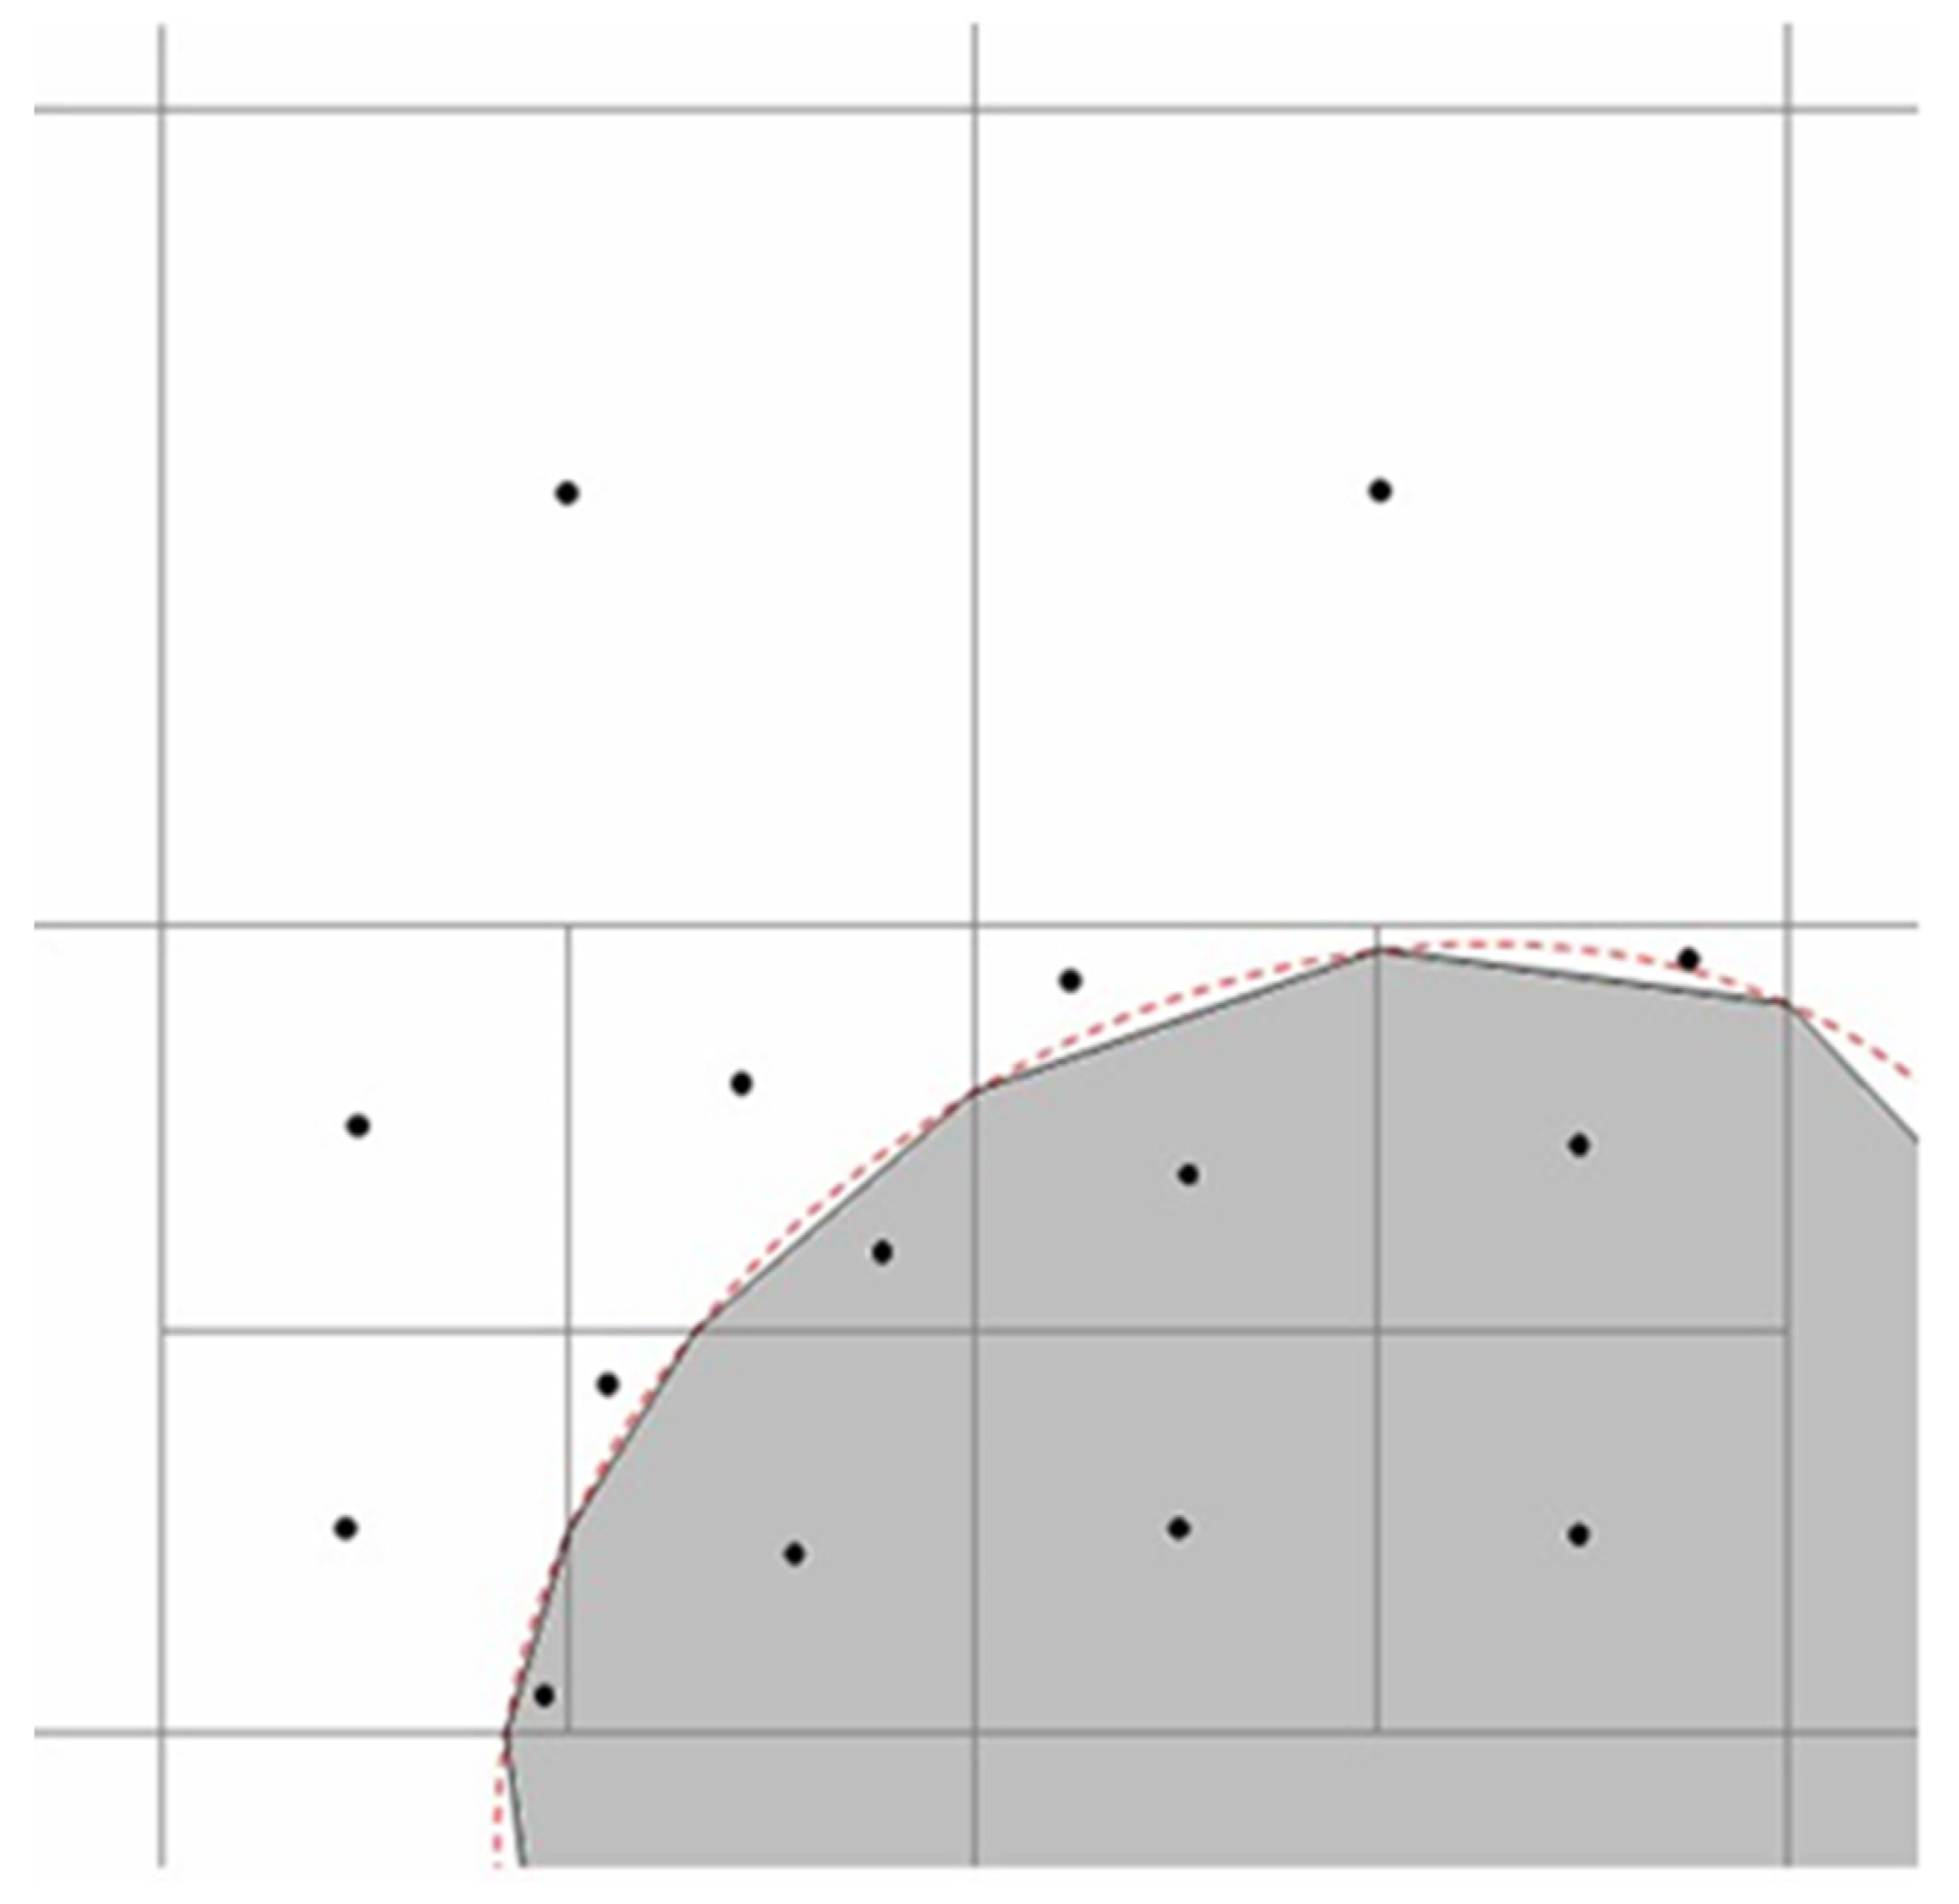
SolidWorks [
30] automatically generates the mesh, using parallelepiped-shaped cells. Its faces are arranged orthogonally to the specified axes of the Cartesian coordinate system. Cells located close to the boundary of the part geometry or the contact between the fluid and the geometry are cut by these boundaries, becoming a part of the previously parallelepiped-shaped cell. Thus, they become polyhedra.
Figure 4 presents a visualization of the shape of the cells located close to the contact points between the fluid and the part geometry. The mesh used is three-dimensional, but the cells in the figure are represented as flat figures to facilitate visualization. The white cells are the fluid, the gray cells are solids, the red dashed line is the boundary of the solid geometry, and the cut cells are those close to the boundaries.
2. Materials and Methods
The first valve geometry was designed using the SolidWorks Premium software, version 2017 × 64 Edition SP 1.0, Dassault Systèmes, France. The fluid was defined as water, the fluid flow region was limited, and the pressures at the inlet and outlet of the analyzed section were defined.
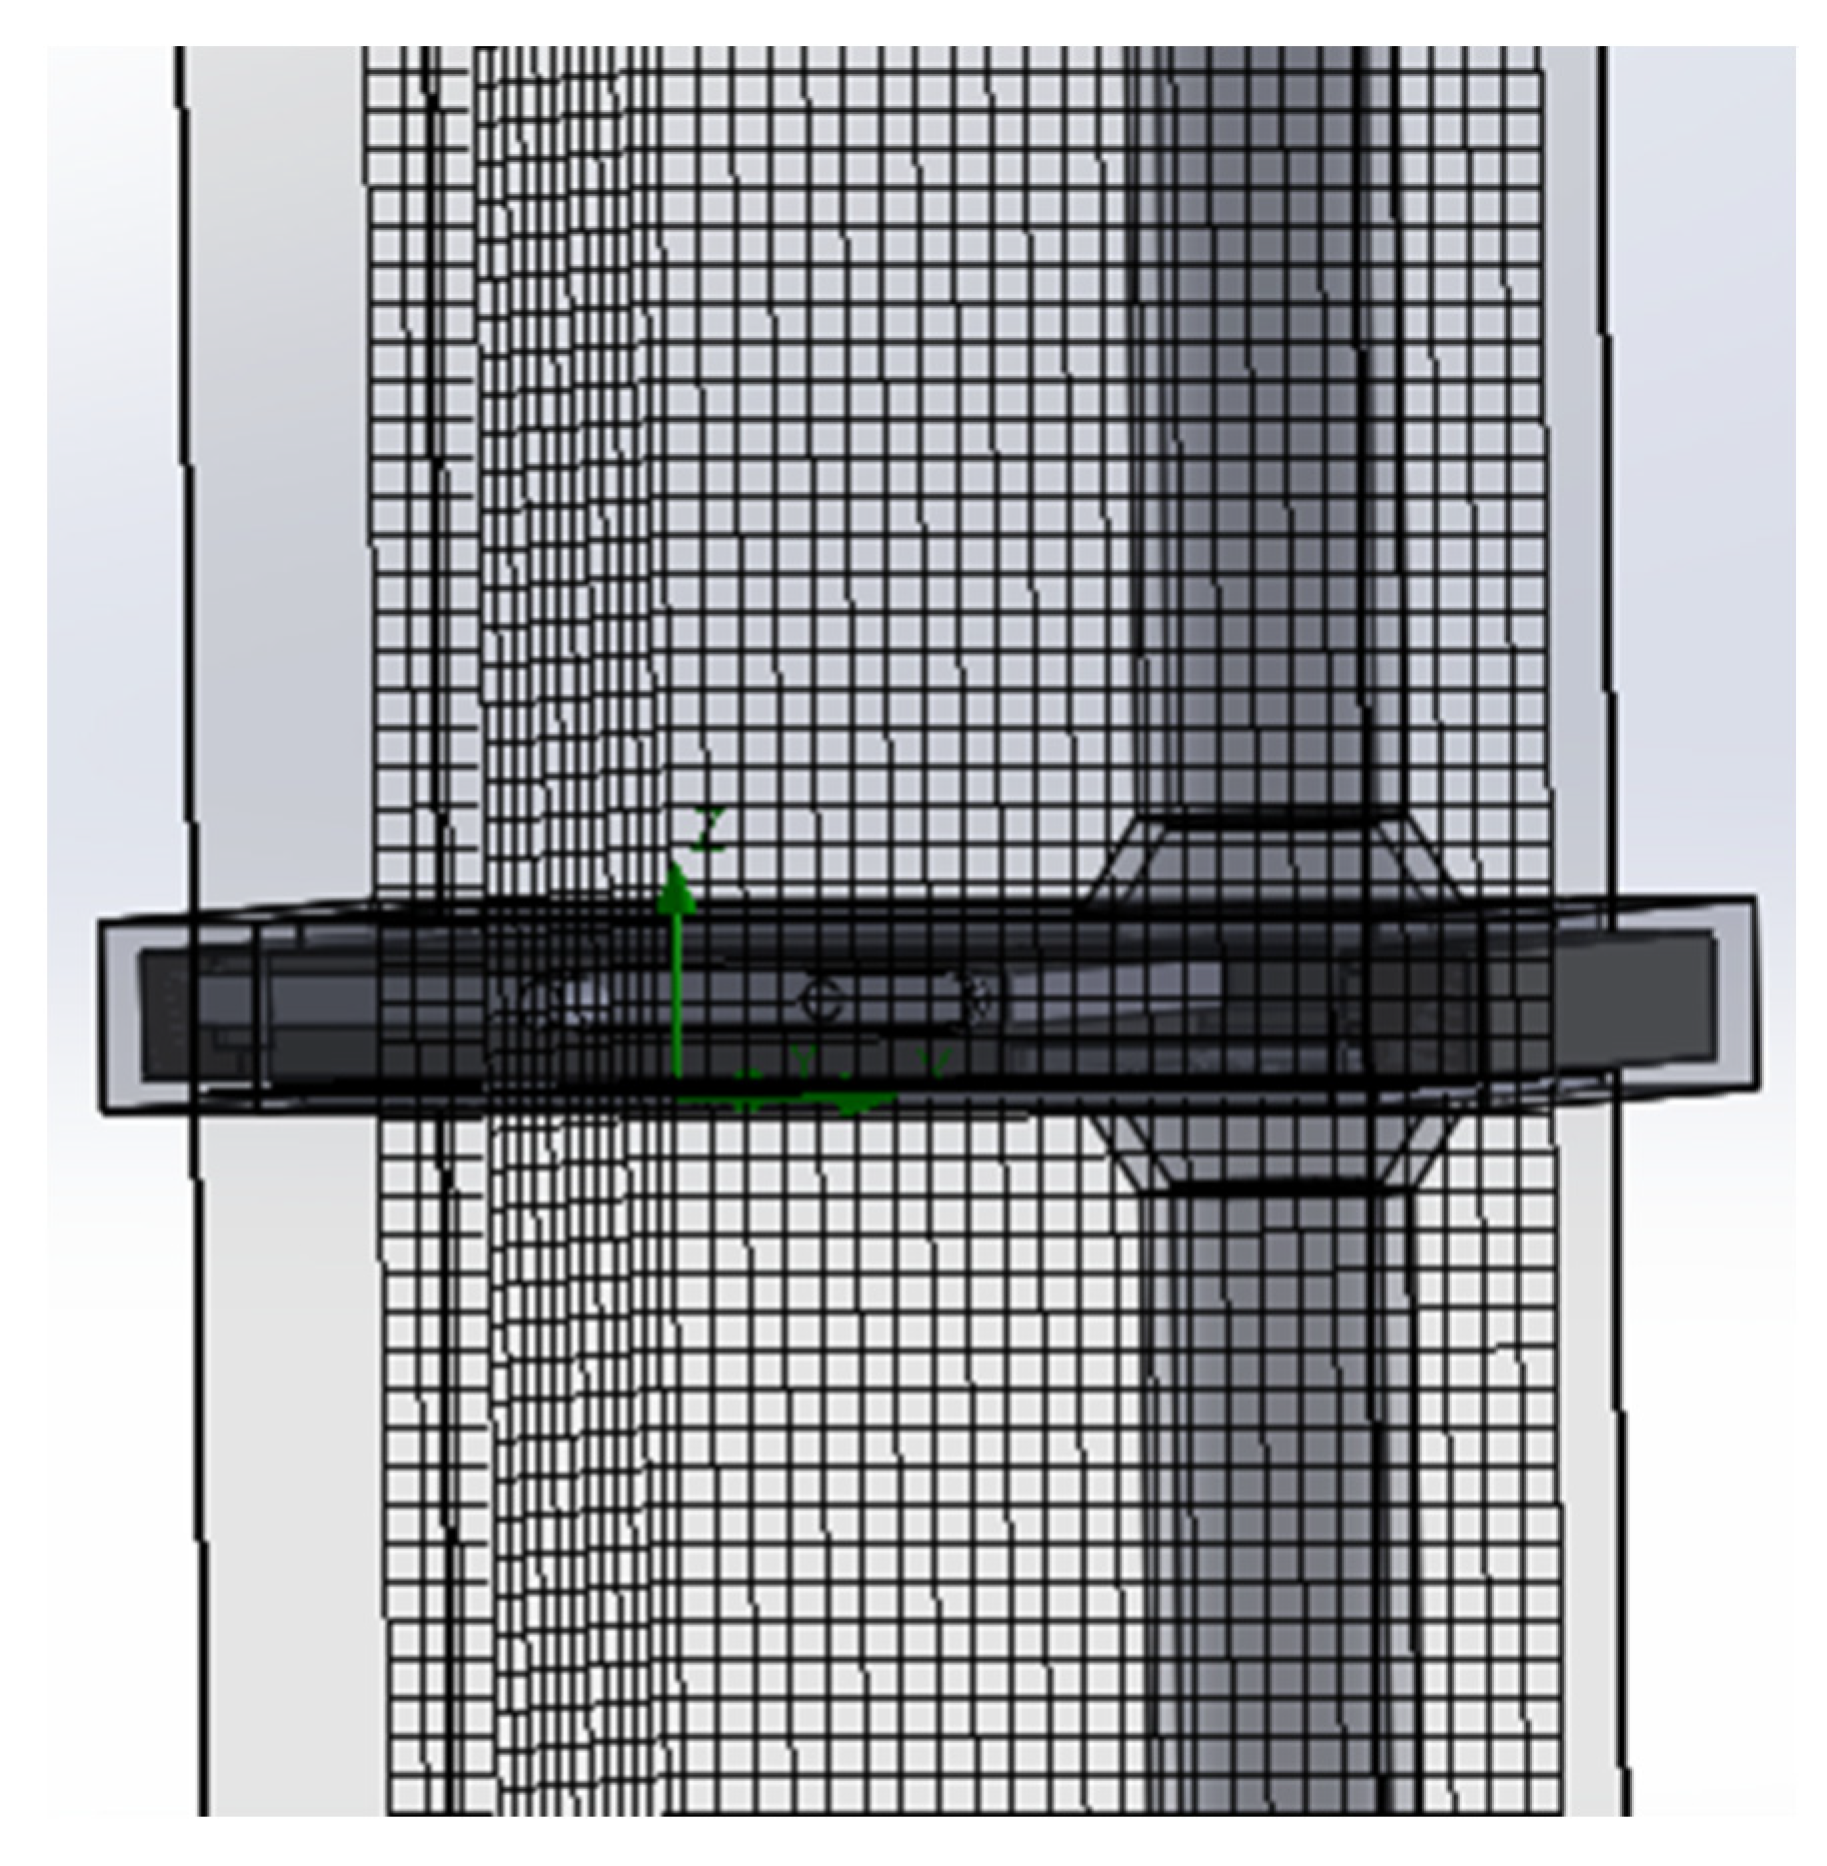
After an analysis in the spatial discretization, the mesh was defined as having 82,214 cells (
Figure 5). This definition resulted from testing with 581,031 cells, which considerably increased the processing time and caused a difference of less than 10% in the result, which was negligible for this research.
For an accurate simulation, the CFD model flow domain included, in addition to the valve, a pipe section before and after the valve. The Brazilian Association of Technical Standards [
31] recommends that the head loss should be measured using an inlet section positioned 20 diameters before the valve and an outlet section positioned 20 diameters after the valve. The boundary conditions were then applied according to the adopted guidelines. Thus, in the inlet section, a 130.7 kPa pressure was applied, and in the outlet section, a 101.3 kPa pressure, which is equivalent to the atmospheric pressure, was applied, resulting in a 29.4 kPa or 3 mca pressure difference between the inlet and the outlet, simulating the approximate hydraulic head of a one-story house.
The software was used to determine the fluid velocity with these applied pressure boundary conditions. Thus, the velocities in the inlet and outlet sections were not established; these variables were calculated as a pressure function. The other boundary condition used was zero velocity along the solid walls. The singular head loss coefficient of the valve was calculated using the velocity value and Equation (7).
where ∆
p is the pressure difference before and after the valve,
g is the gravitational acceleration, and
v is the average velocity of the fluid in the pipeline.
With these head loss values calculated for the new valve, a comparison was made with the head loss value of a globe valve, according to information in the scientific literature.
3. Results and Analysis
With CFD bringing economy, versatility, and precision to the understanding of fluid flow and providing reliable data for model calibration essential to industrial design [
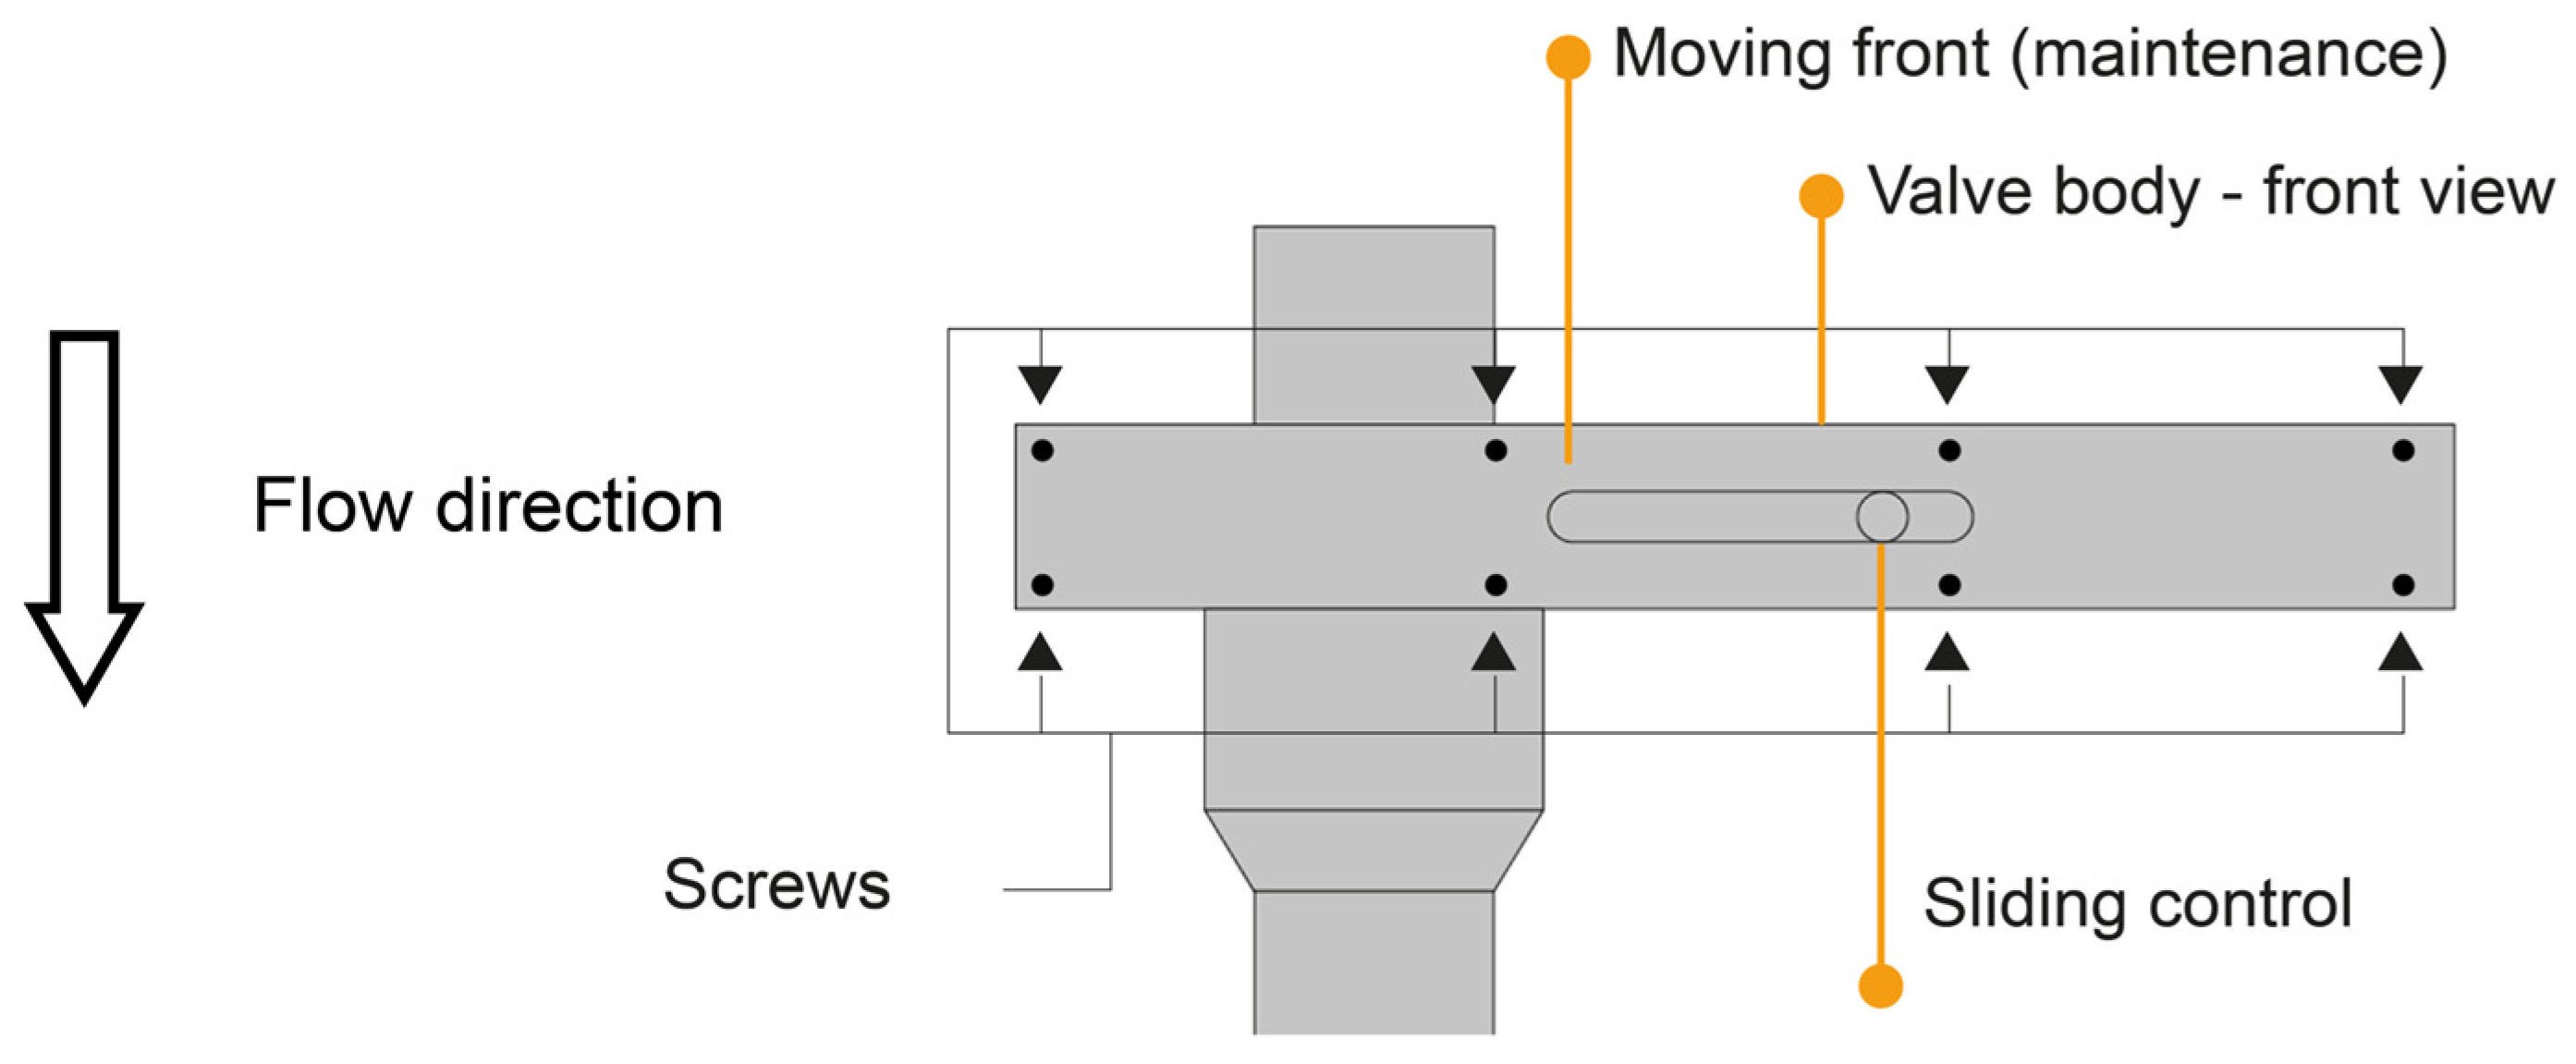
32], the research on the new valve was conducted with an evolutionary process. The process involved an initial proposal, CFD tests, improvement proposals, and new tests. The opening and closing processes of the valve are performed by moving the sliding control to the right or to the left, and the valve is totally open when the sliding control is shifted entirely to the right and totally closed when the sliding control is fully shifted to the left.
Figure 6 shows the valve components. The first valve geometry was created using the SolidWorks CAD software and is shown in
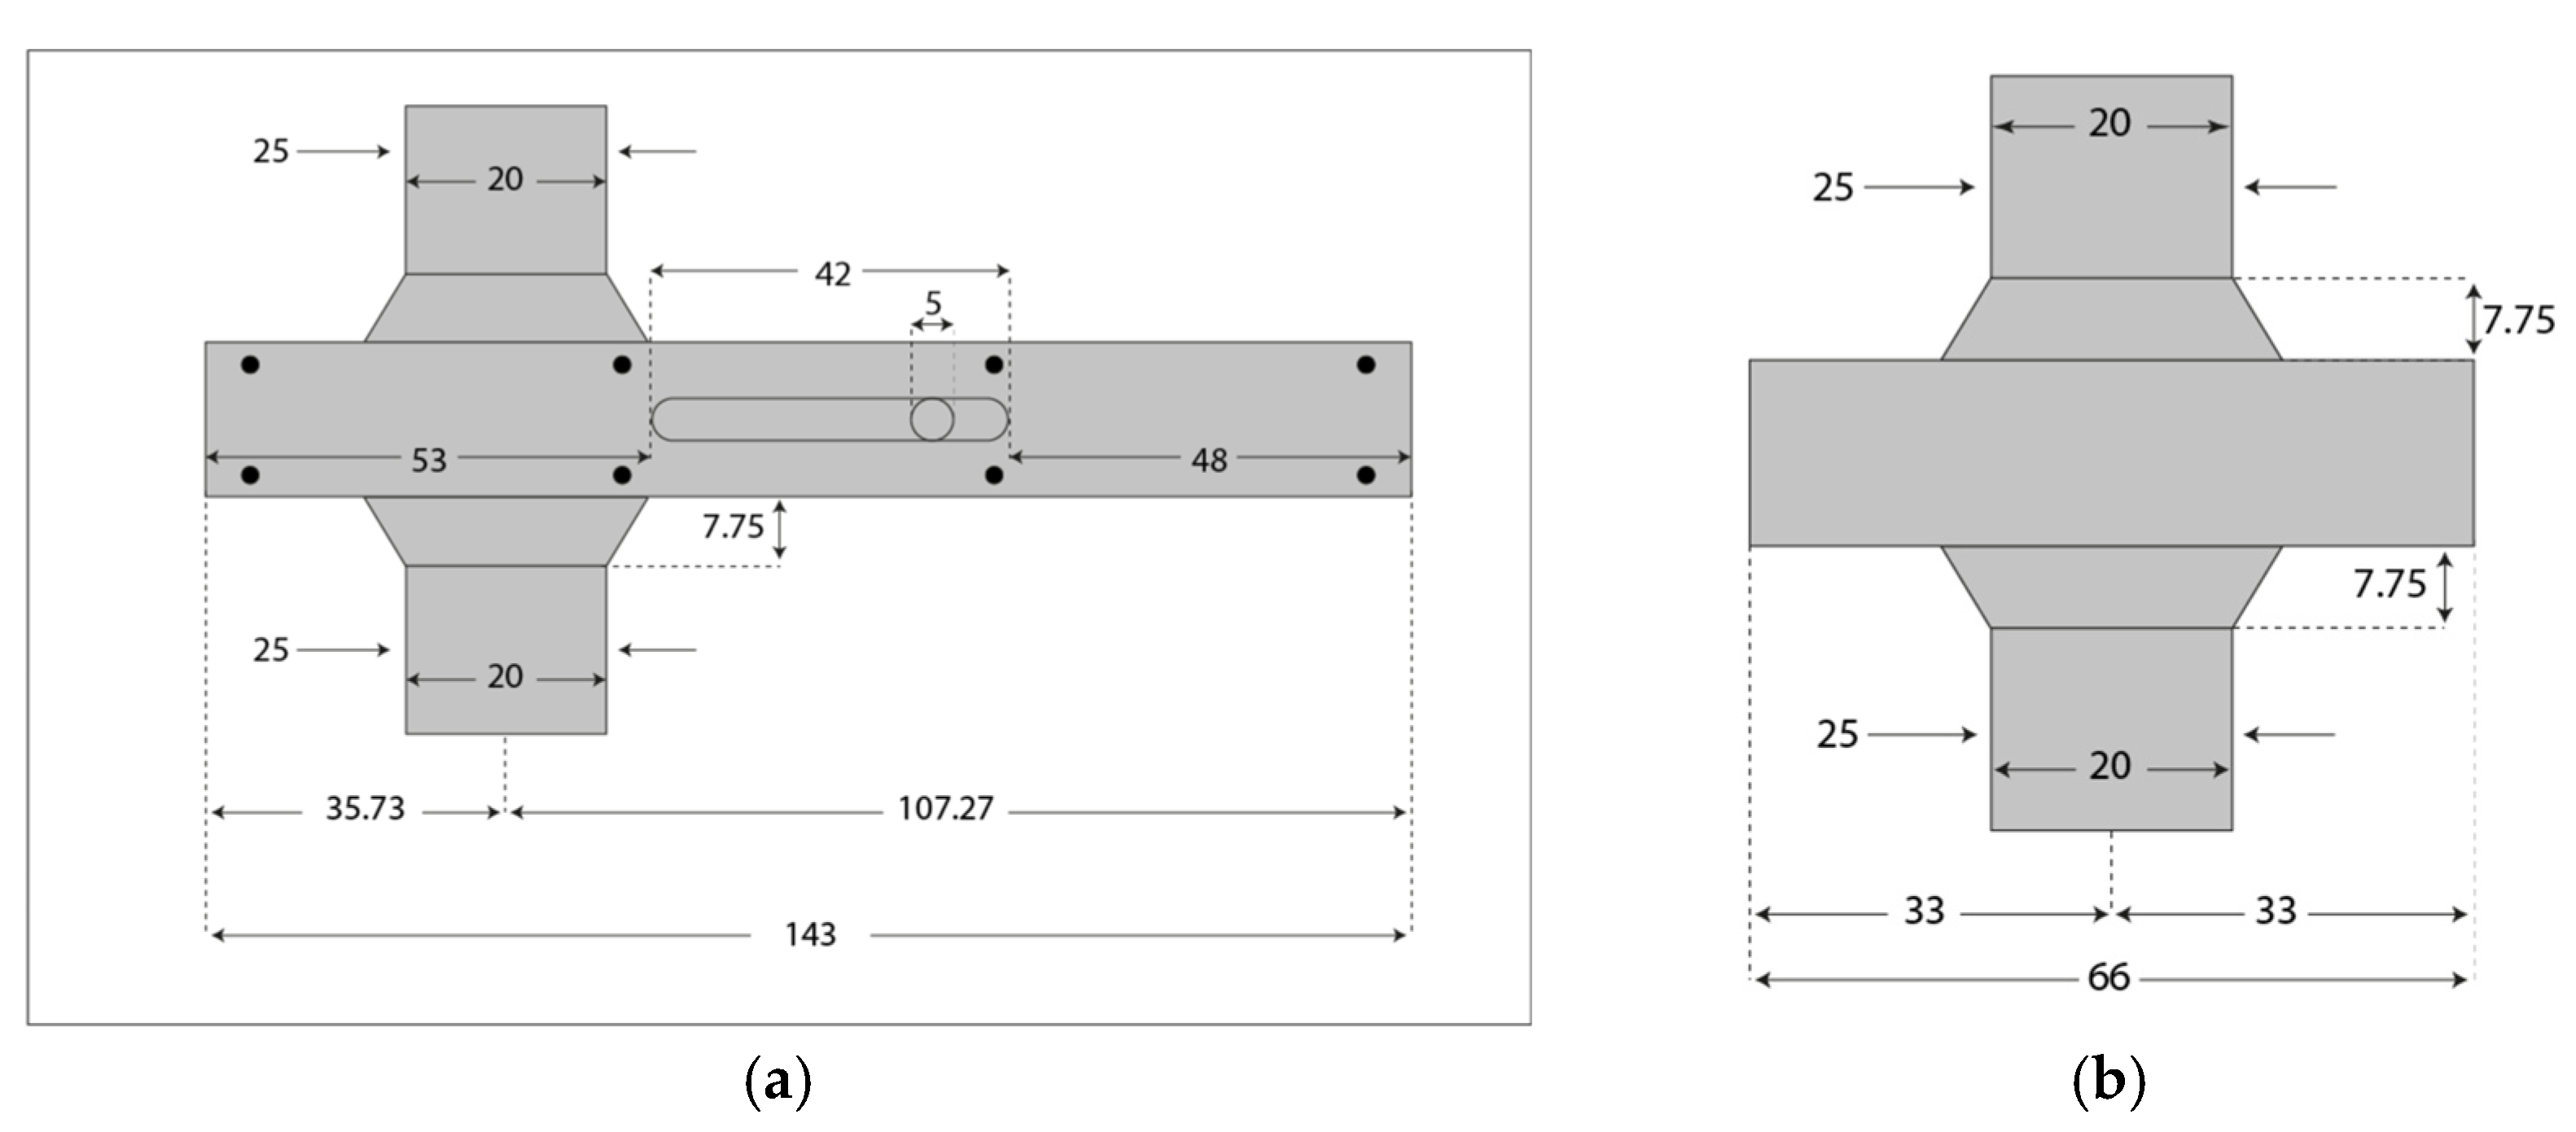
Figure 7. In all of the figures, the dimensions are in millimeters and the fluid flows from top to bottom.
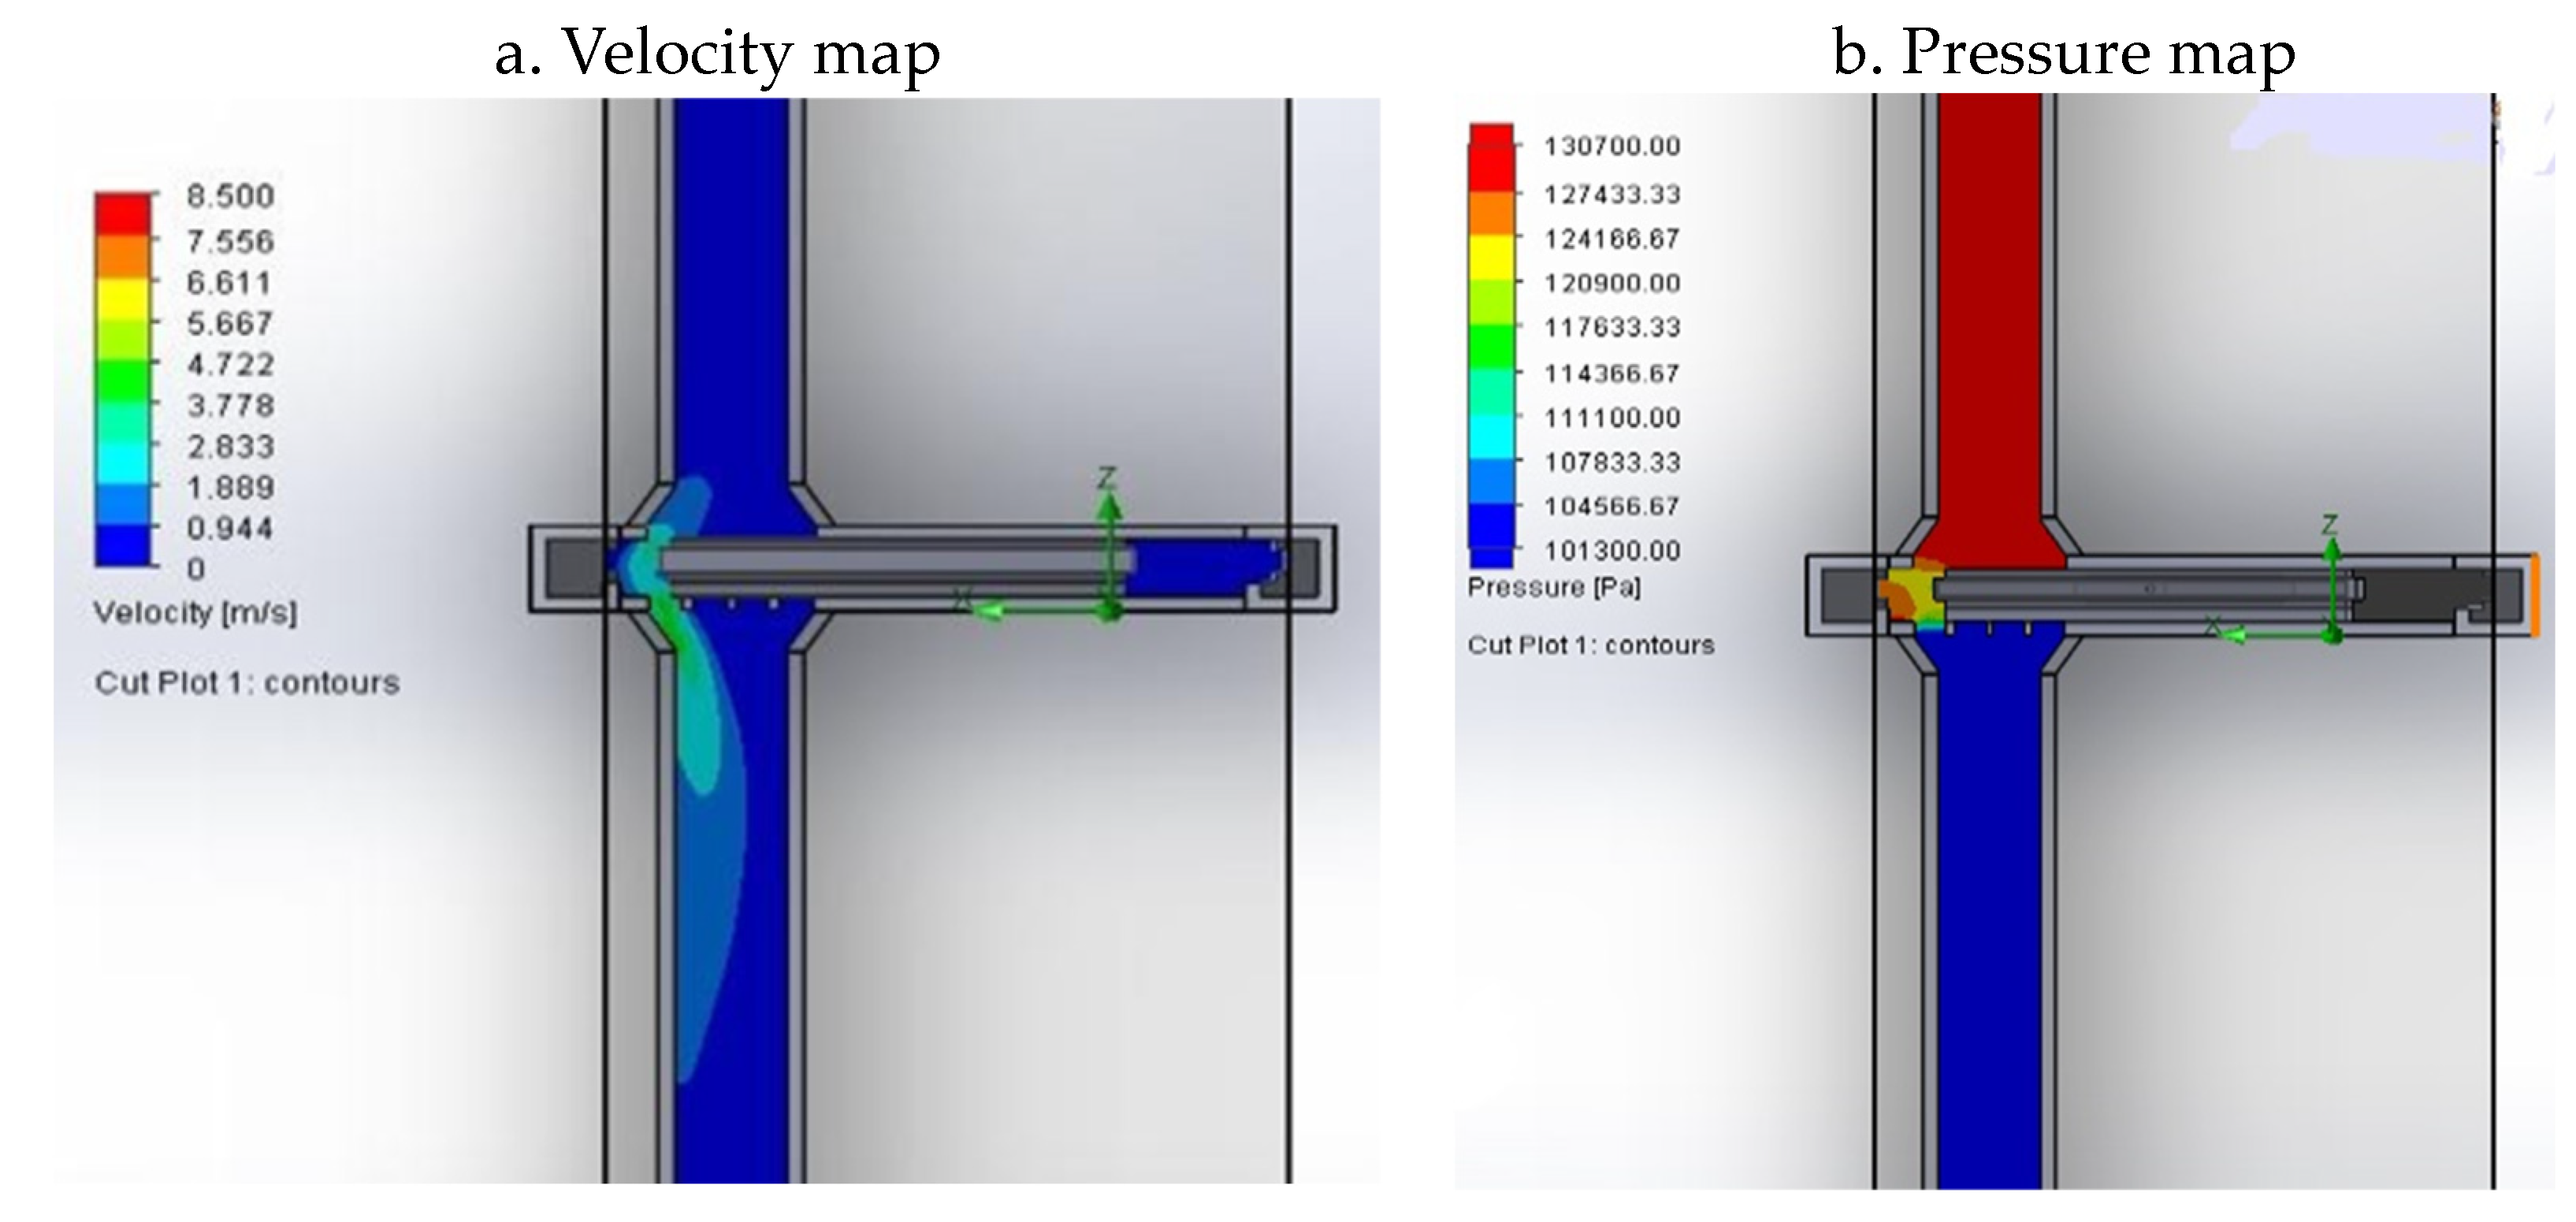
For this geometry, analyses were performed using velocity and pressure maps obtained from the cross-section of the valve. The first analysis was performed for an opening of 10% of the valve, as is shown in
Figure 8a,b.
The analysis showed no flow for a 10% opening of the valve (
Figure 8a). This occurred because the inlet section is smaller than the outlet section, and therefore, when the valve is open 10%, even though the outlet section is open, the input section remains closed. The first proposed geometry was therefore discarded. Some geometric adjustments were then made, increasing the valve inlet section to create a second valve geometry, as can be seen in
Figure 9a,b.
For the 10% opening,
Figure 10a indicates the beginning of the flow. The highest velocities are in the plug opening region, and they are close to zero in the opposite region. As for pressure,
Figure 10b shows a slight variation in values due to the small opening of the plug compared with the pipe diameter. For the 30% opening, a region with velocities close to zero on the left side of the valve can be seen in
Figure 11a, which can be created as a function of the geometry in the region with a smaller diameter, causing turbulence.
Figure 11b shows that the pressure begins to vary in the section where the fluid passes through the plug.
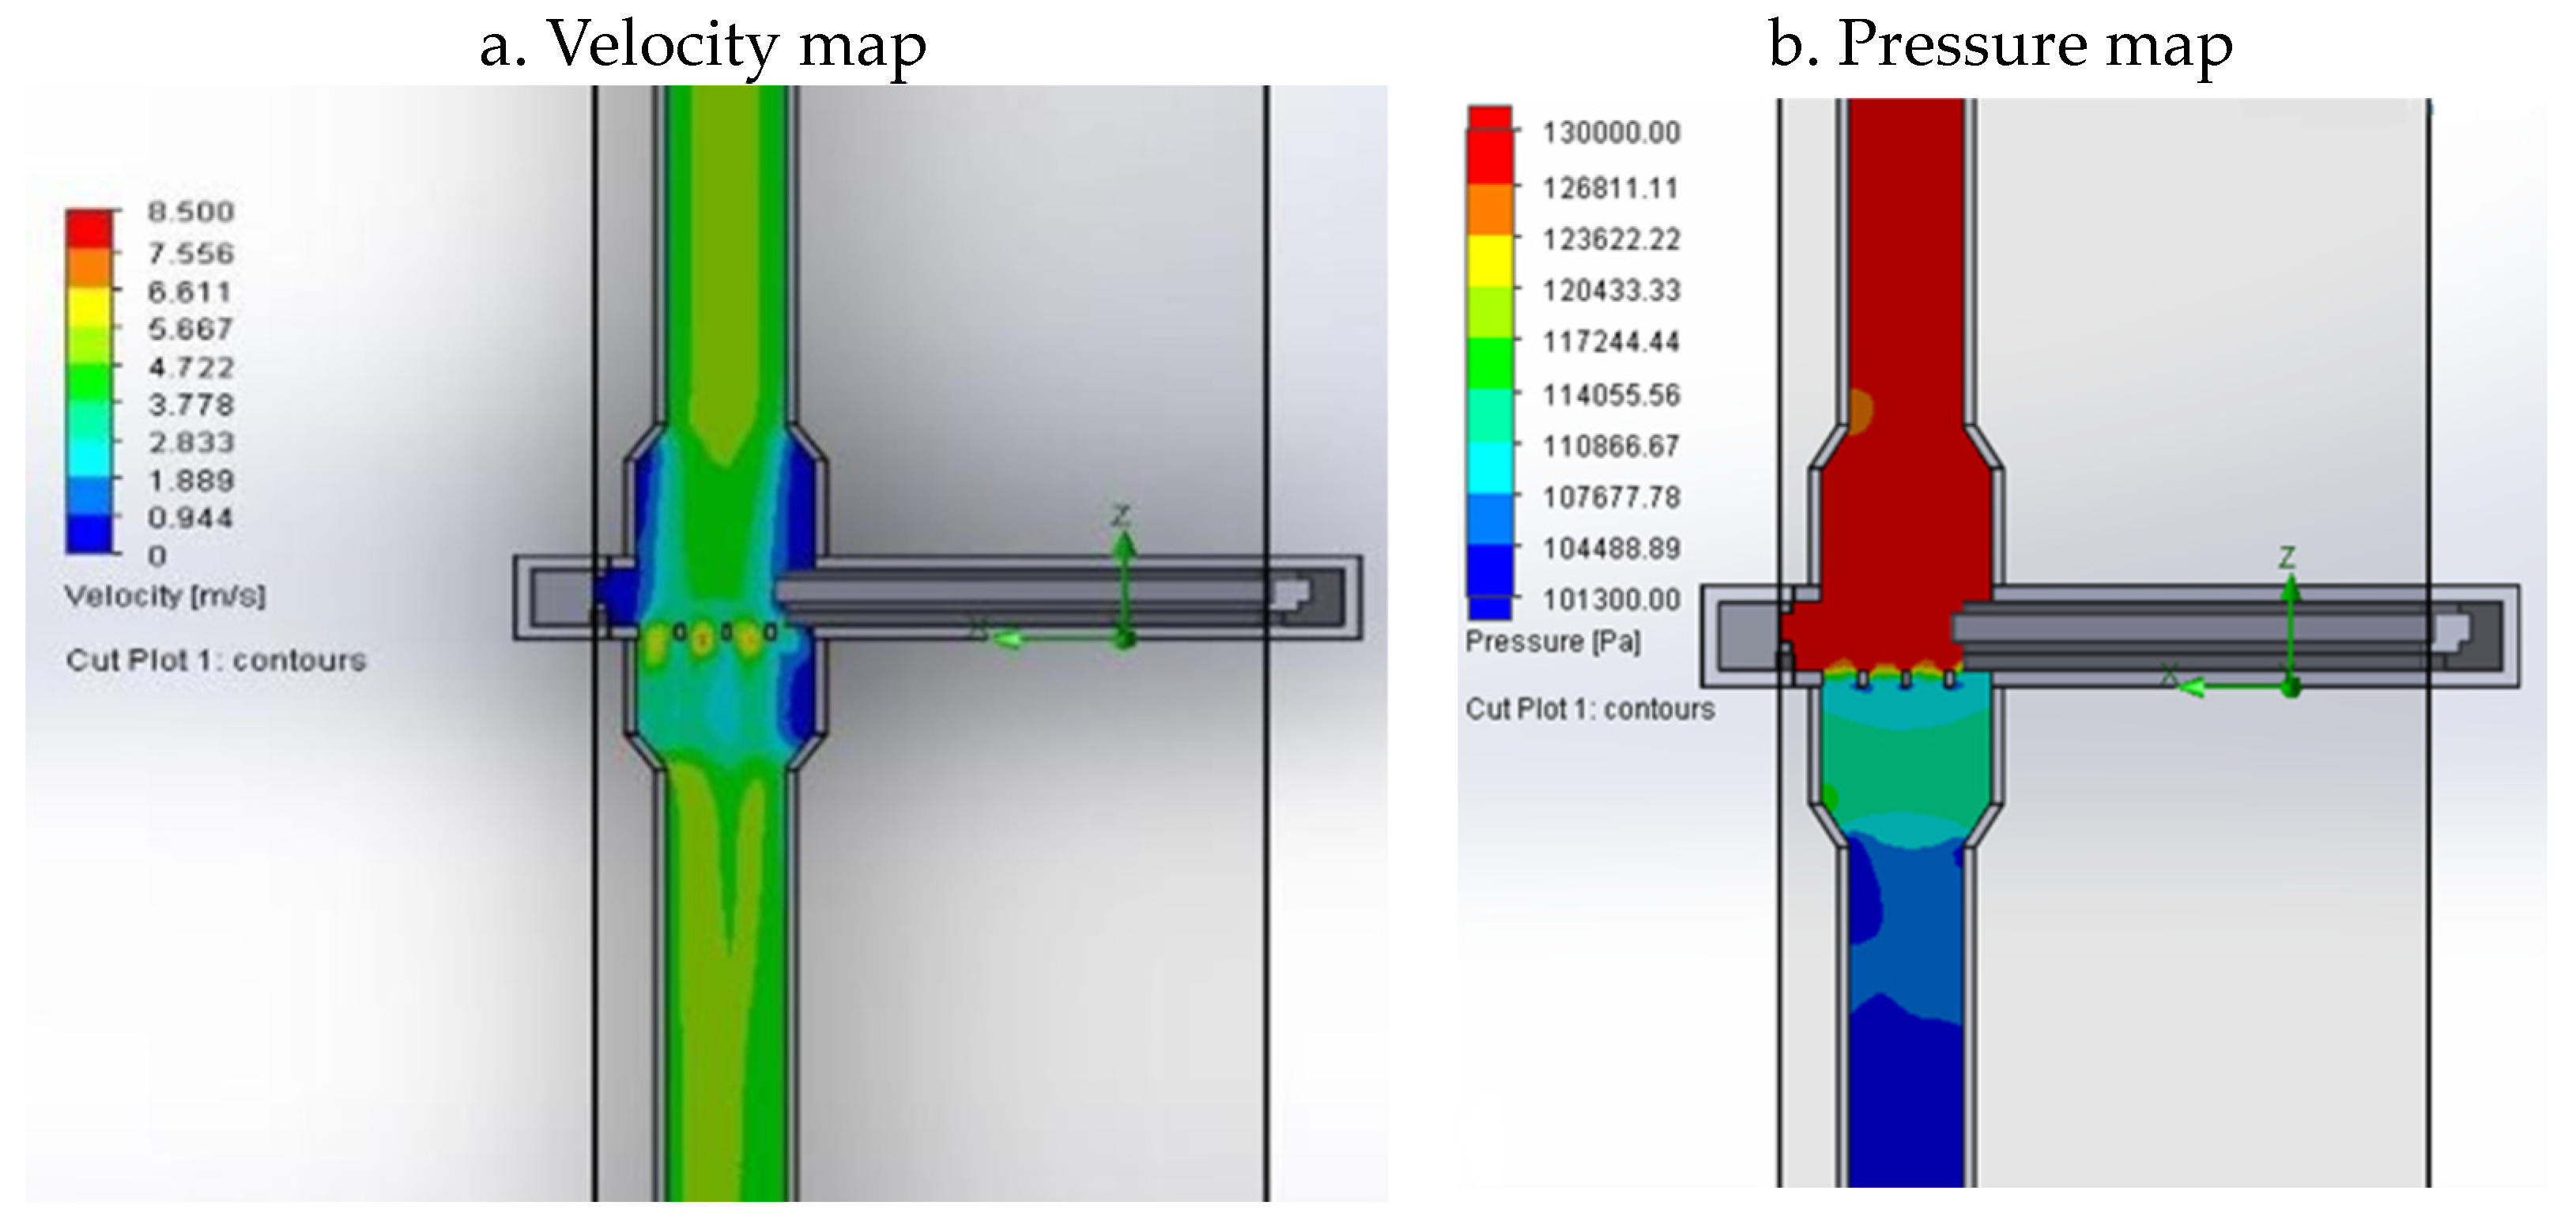
For the 50% opening, the region of velocities close to zero starts forming on the right side of the valve. It is a function of the increase in the volume of drained fluid and valve geometry (see
Figure 12a). For the 70% opening, areas with near-zero velocities remain in the valve diameter change region (see
Figure 13a). Additionally, a region with higher pressure appears in the pipe diameter transition region after passing through the valve opening section (see
Figure 13b).
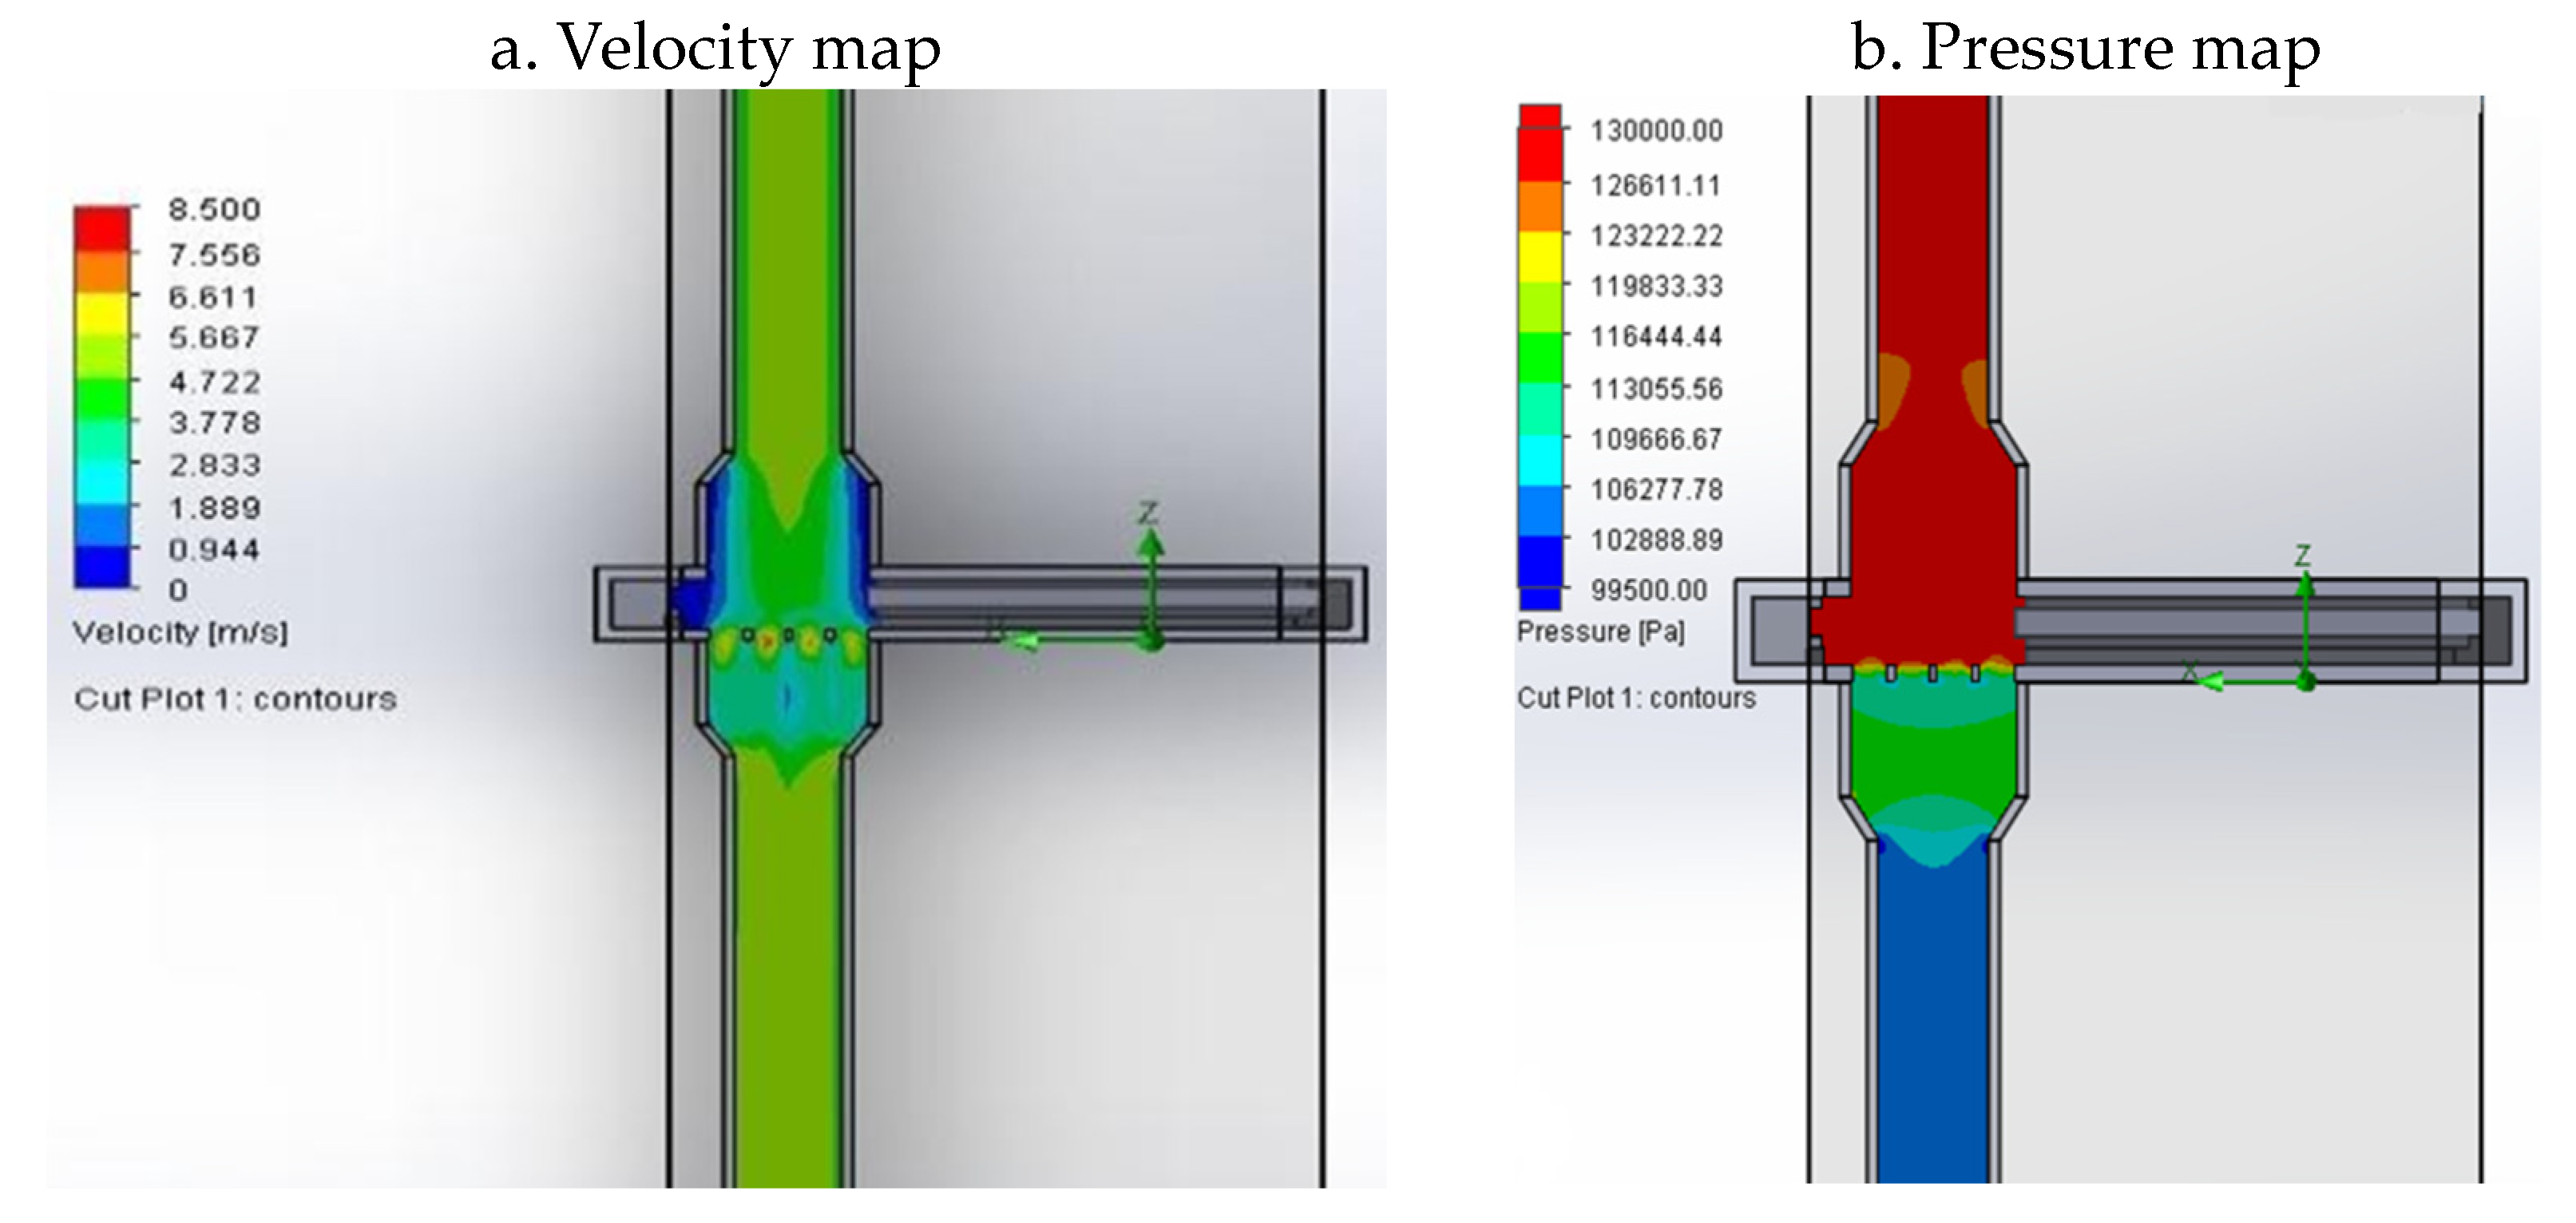
For the 90% opening, despite an increase in velocity along the pipeline, as can be observed in
Figure 14a, areas with values close to zero remained in the section of the valve with the largest diameter (highlighted in blue). Finally, for the fully open valve (
Figure 15a,b), it can be seen that the flow that developed along the pipe exhibited good velocity and pressure, with no velocity points close to zero (dead zones).
So far, when analyzing the velocities and pressures for the different valve openings, the second geometry has presented advantages over the first one. It has solved the problem of the inexistence of flow with a 10% opening. However, it was expected that improvements to the flow behavior could be achieved by incorporating subtle changes in the inlet and outlet sections of the valve in a third geometry that would be suitable for mass production and offer better performance and reduced size.
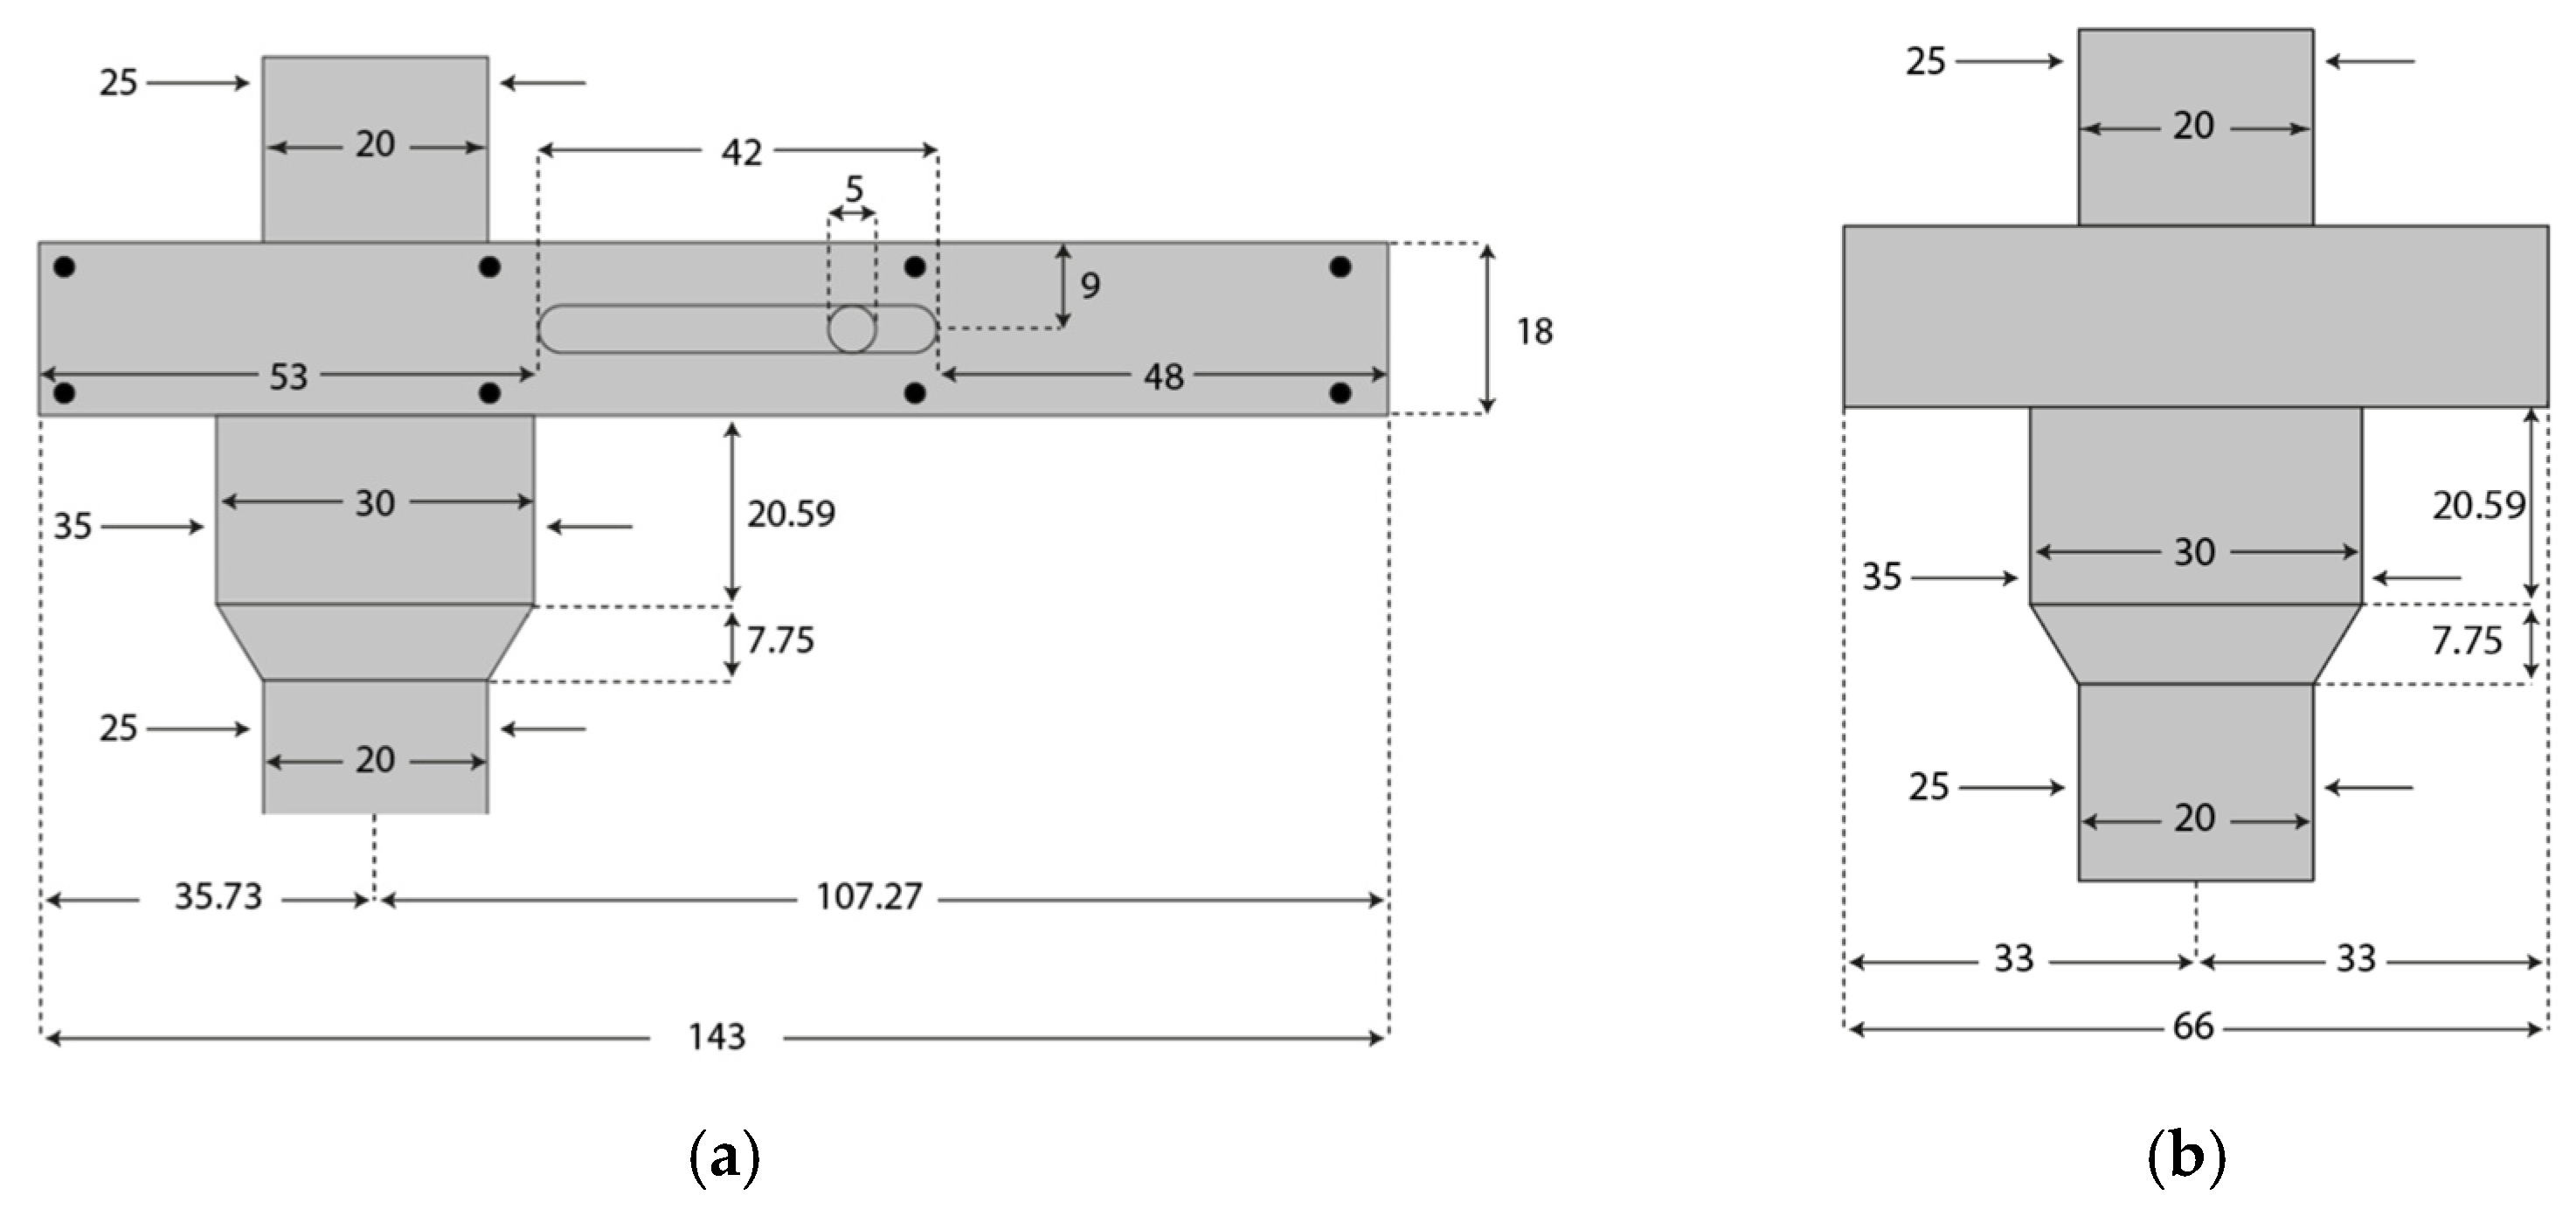
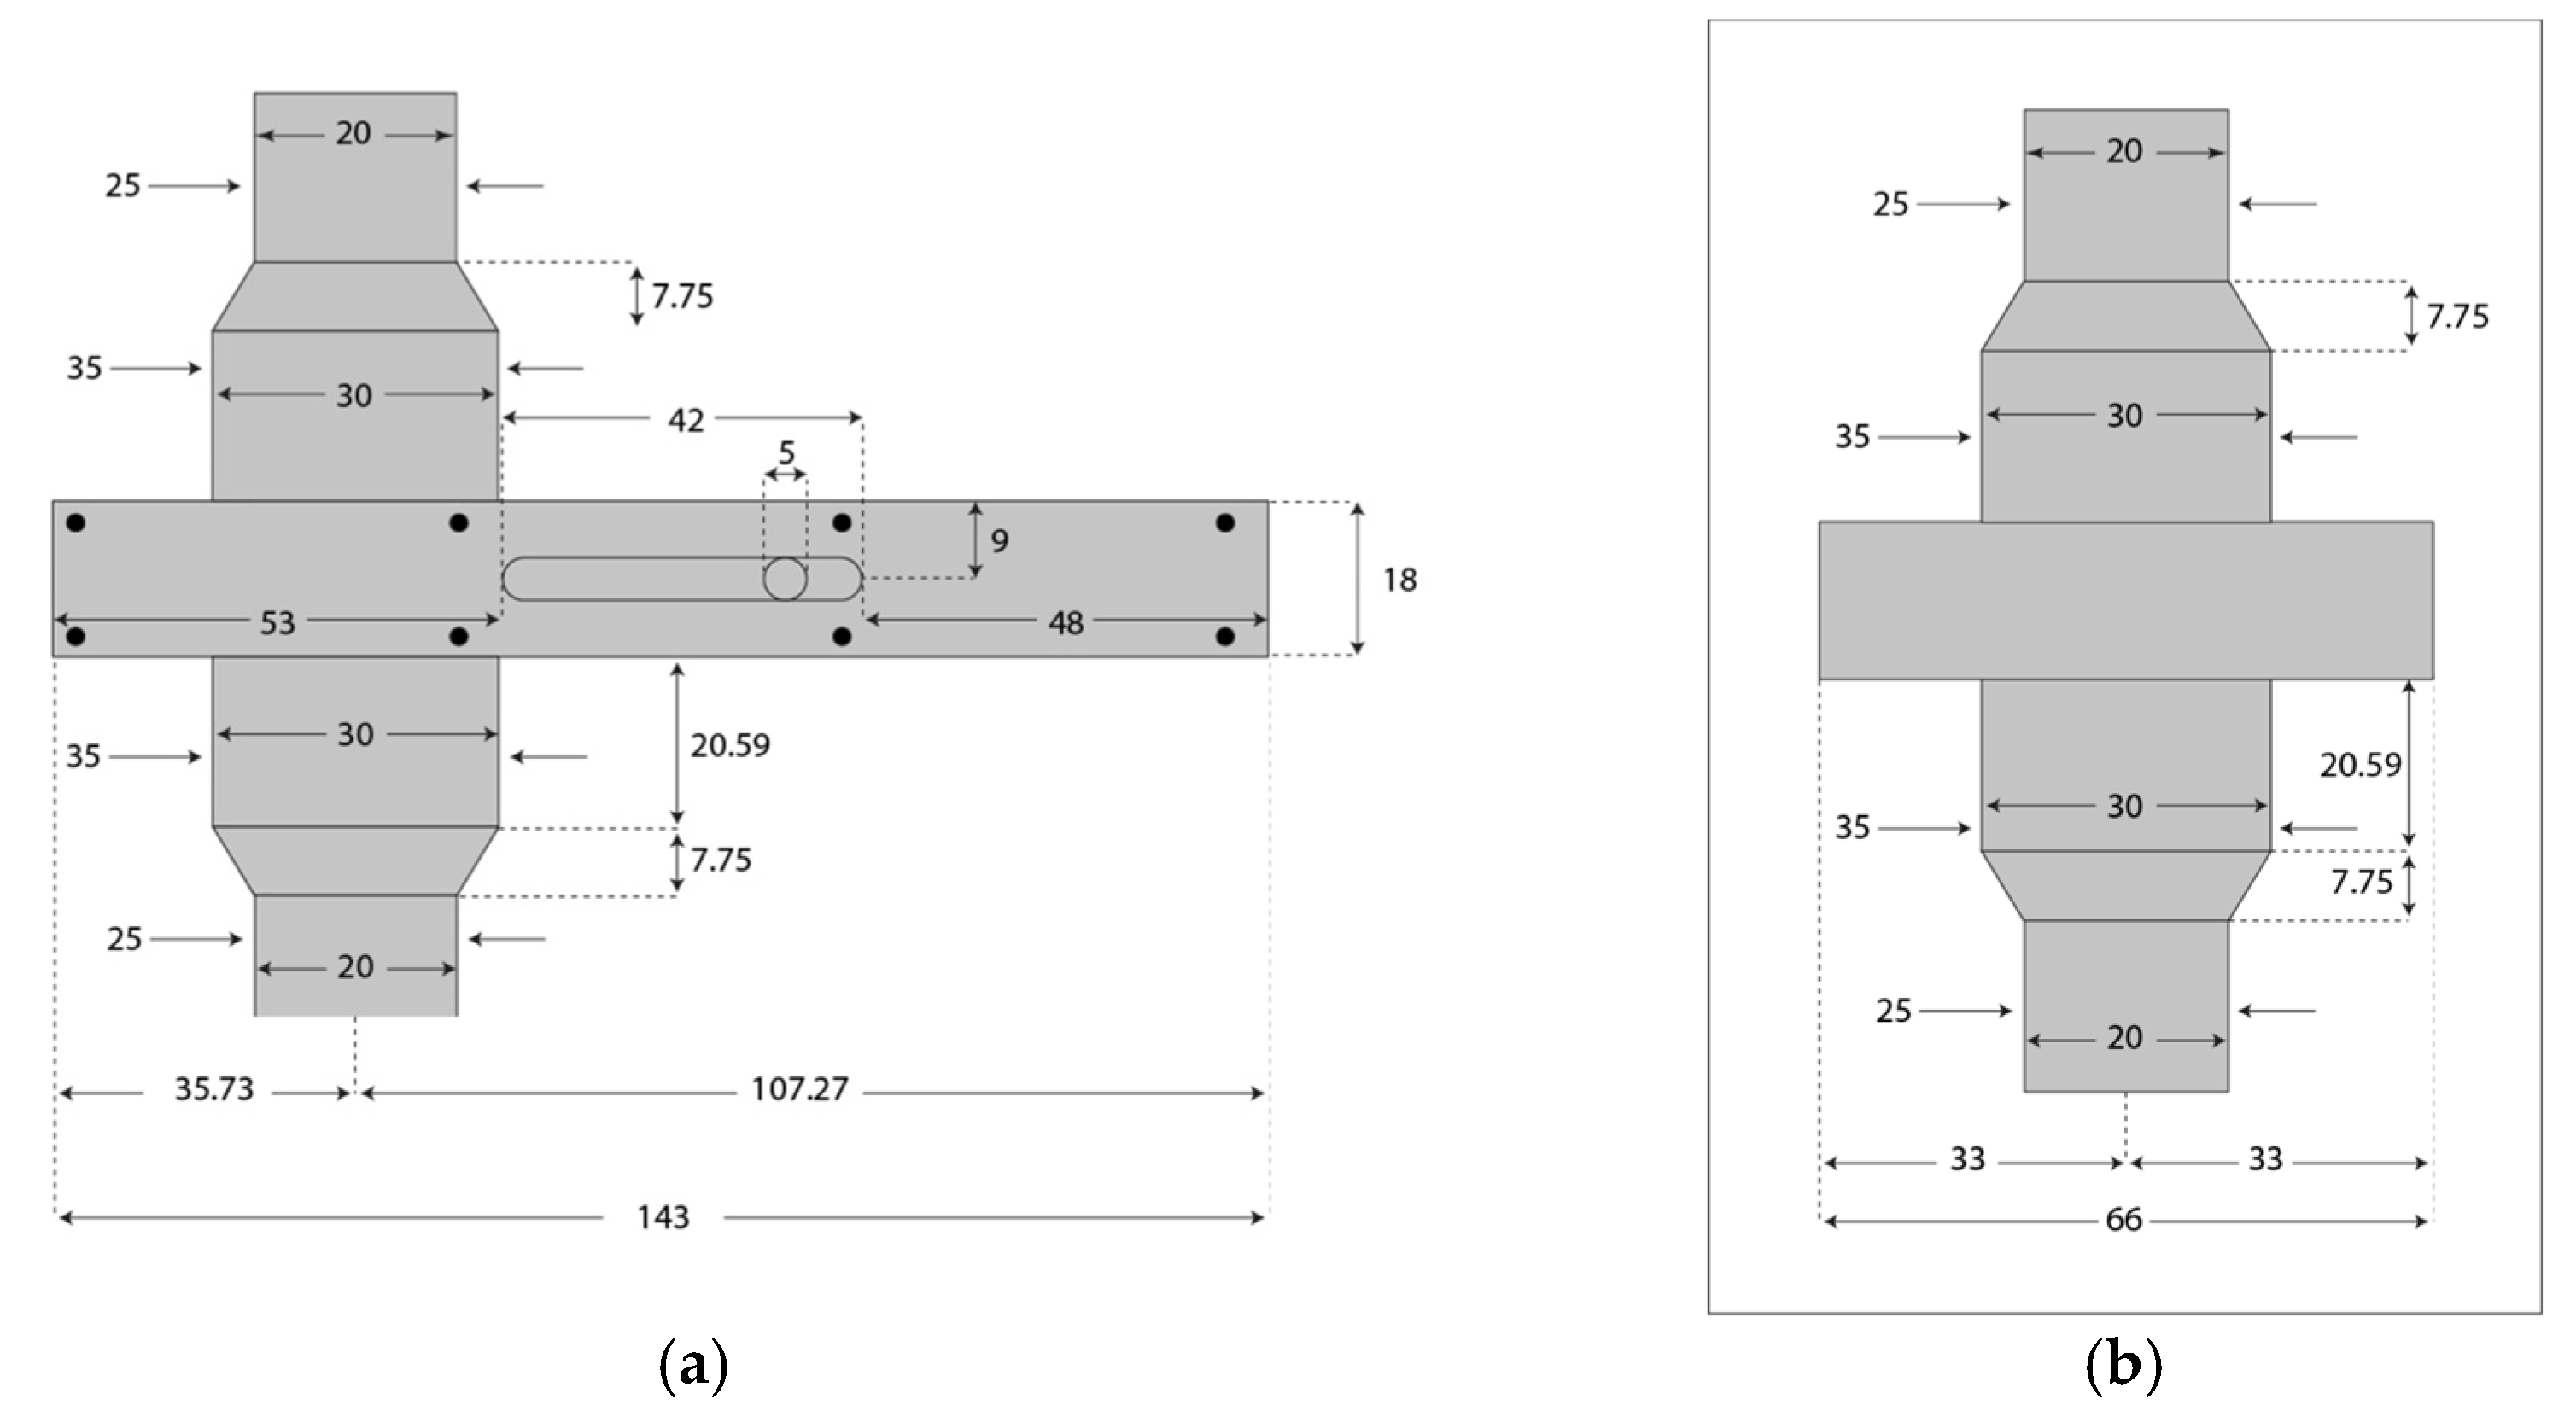
Figure 16a,b present the design of the third valve (all measurements in mm).
The previous analyses were also carried out for the third valve geometry, obtaining the velocity and pressure maps from the cross-section of the valve for 10%, 30%, 50%, 70%, 90%, and 100% openings, as is shown in
Figure 17a,
Figure 18a,
Figure 19a,
Figure 20a,
Figure 21a and
Figure 22b.
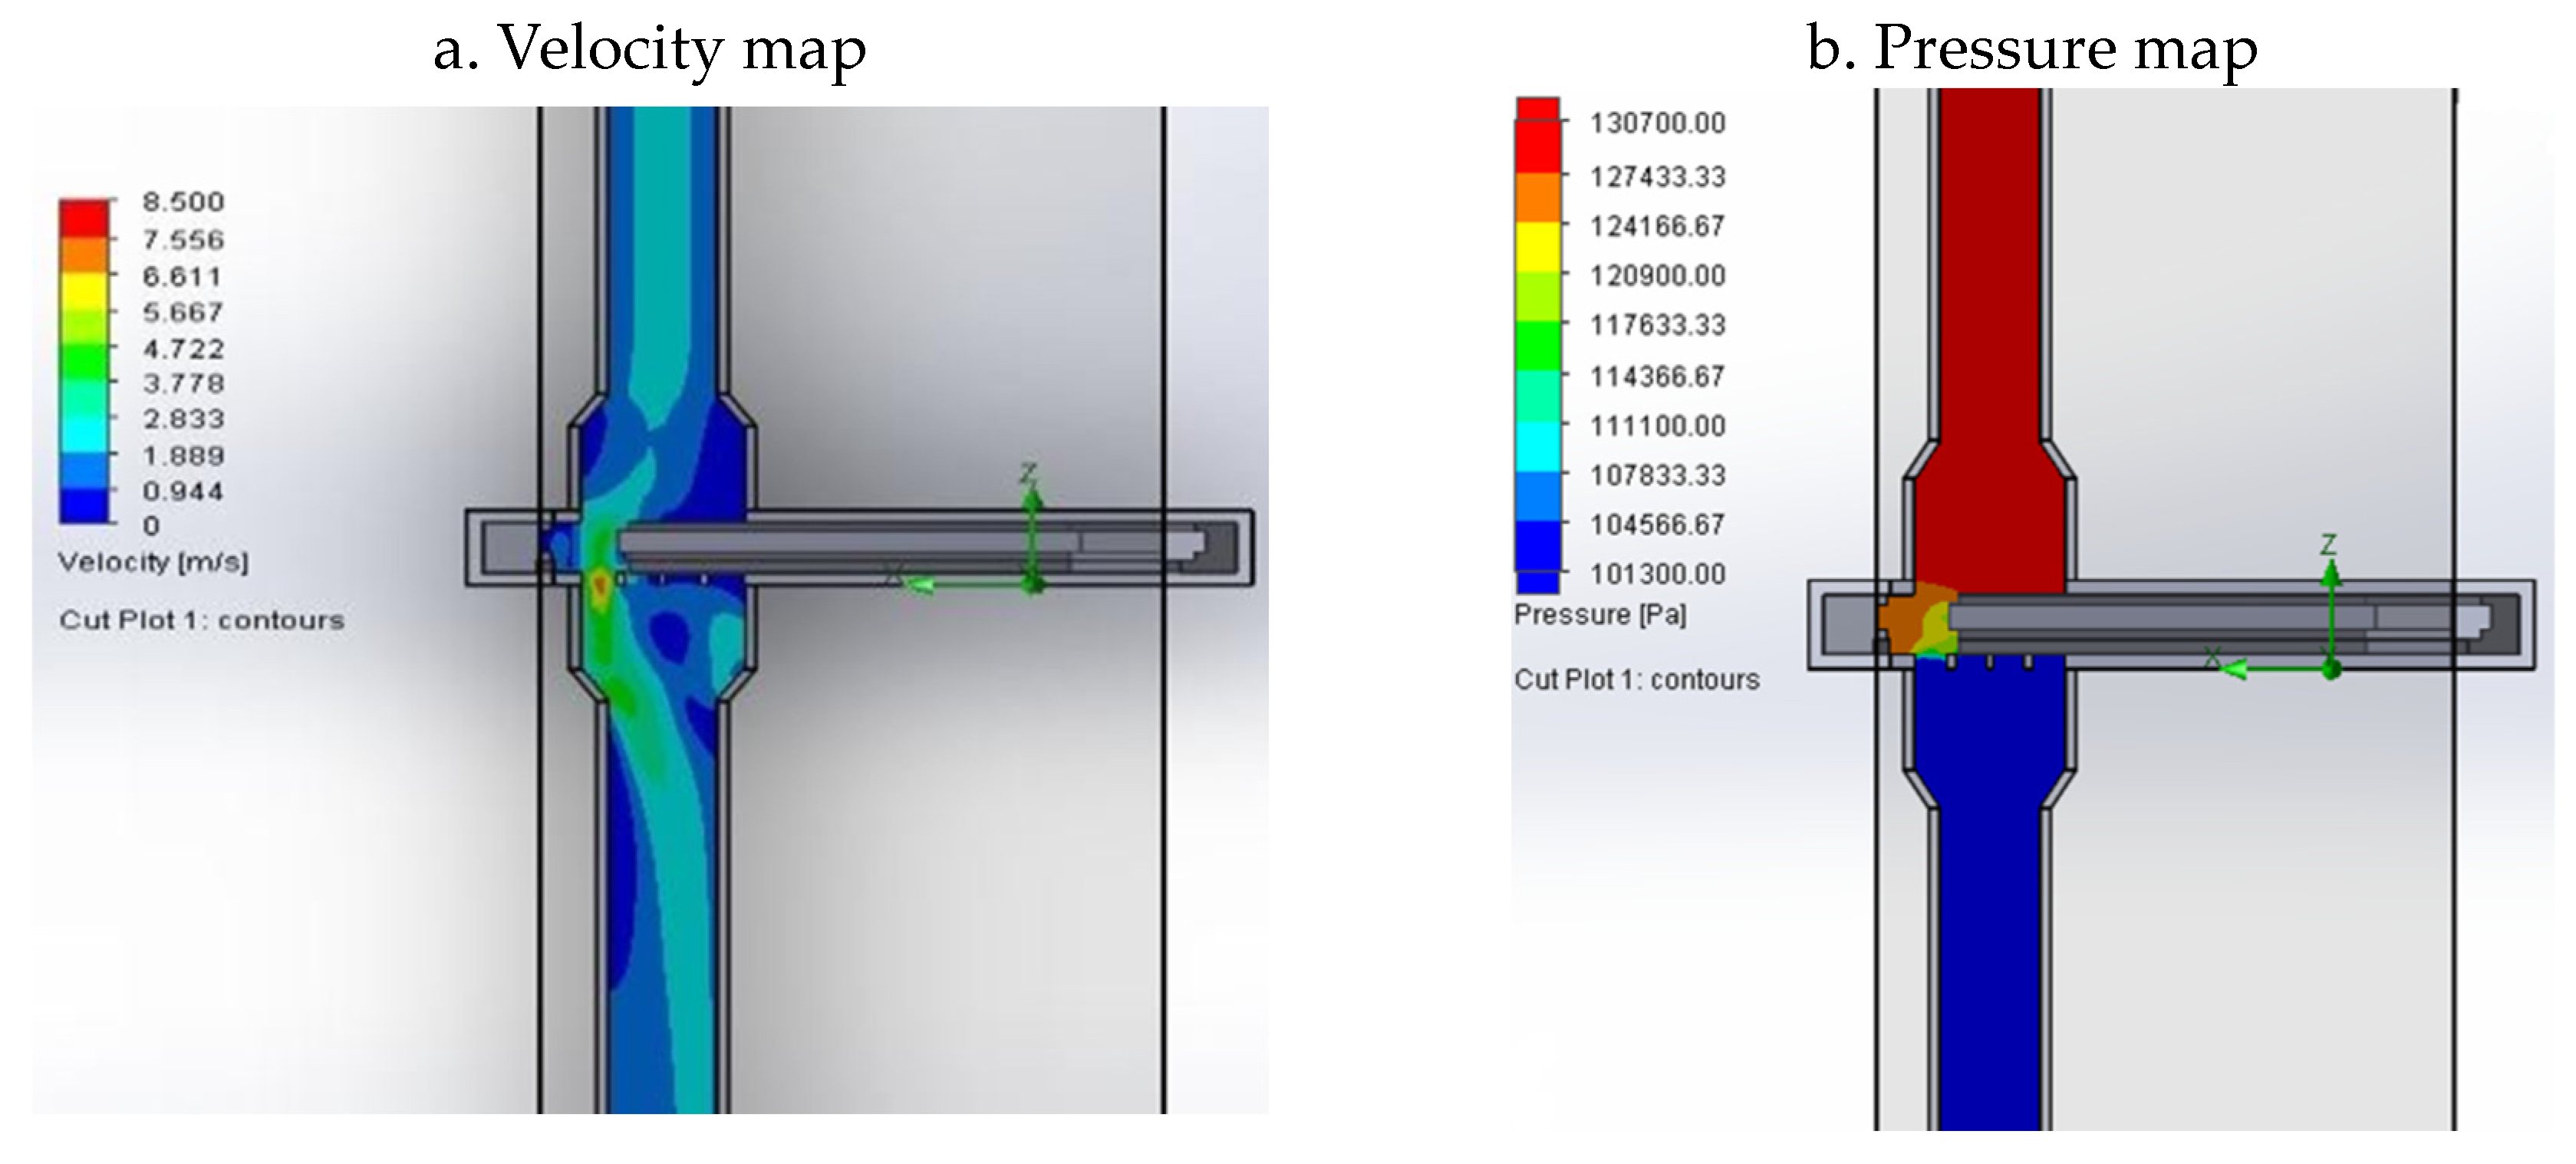
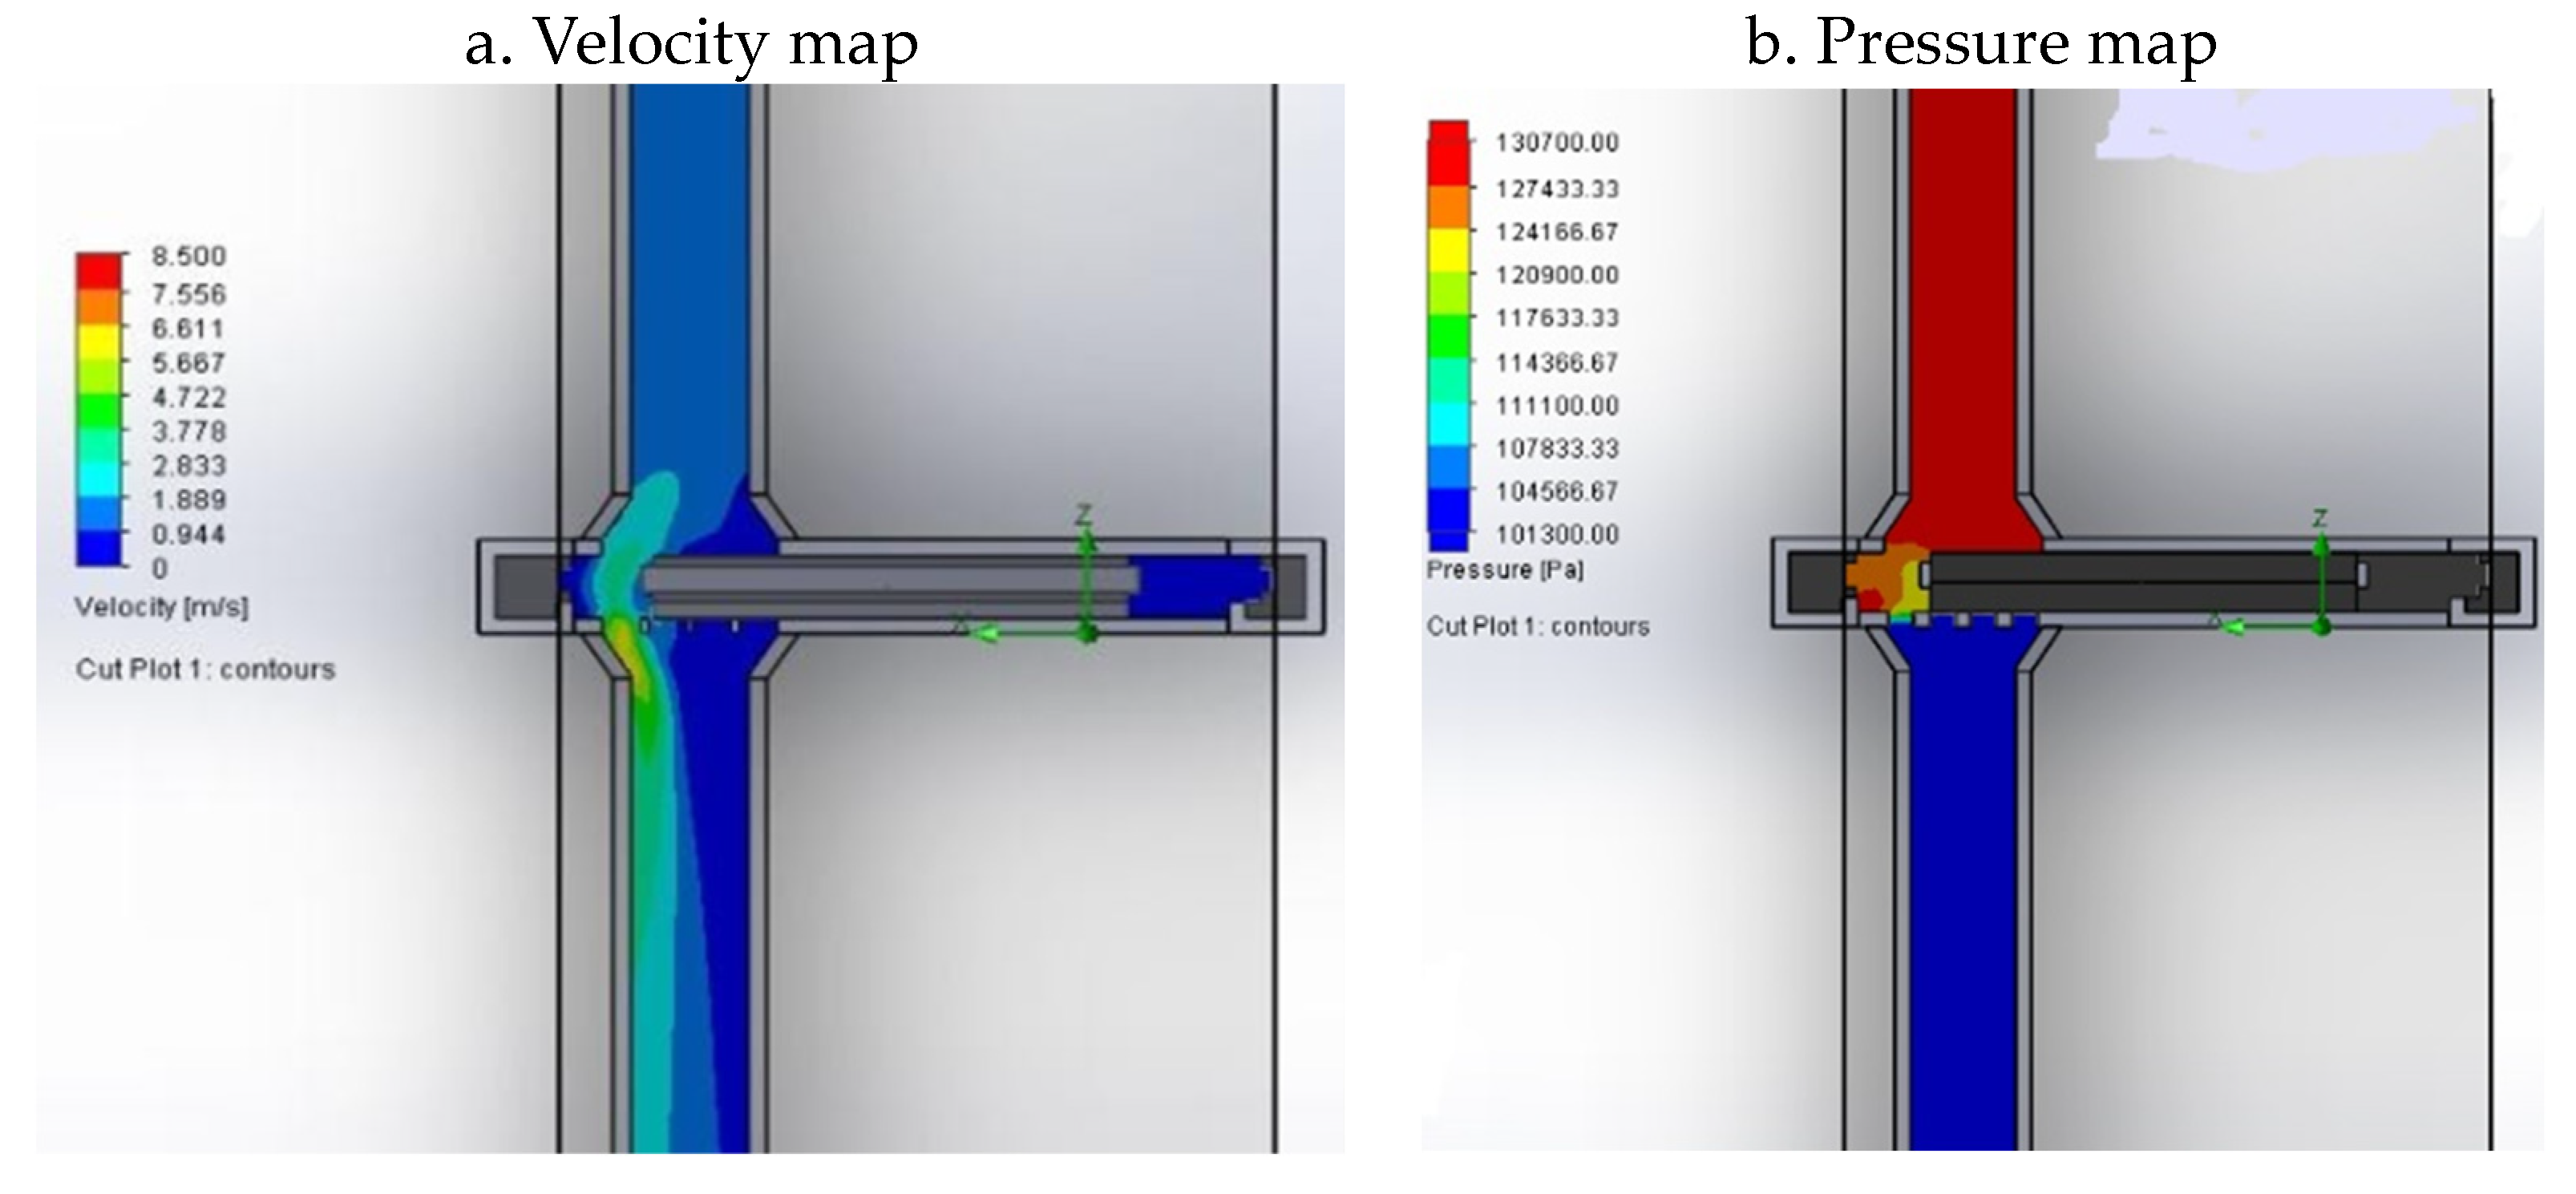
For the 10% opening,
Figure 17a shows regions with velocity values close to zero concentrated close to the wall on the opposite side of the opening.
Figure 17b indicates the pressure with slight variations in the valve opening. Variations in the velocity and pressure values begin to appear during the passage of the fluid through the valve plug.
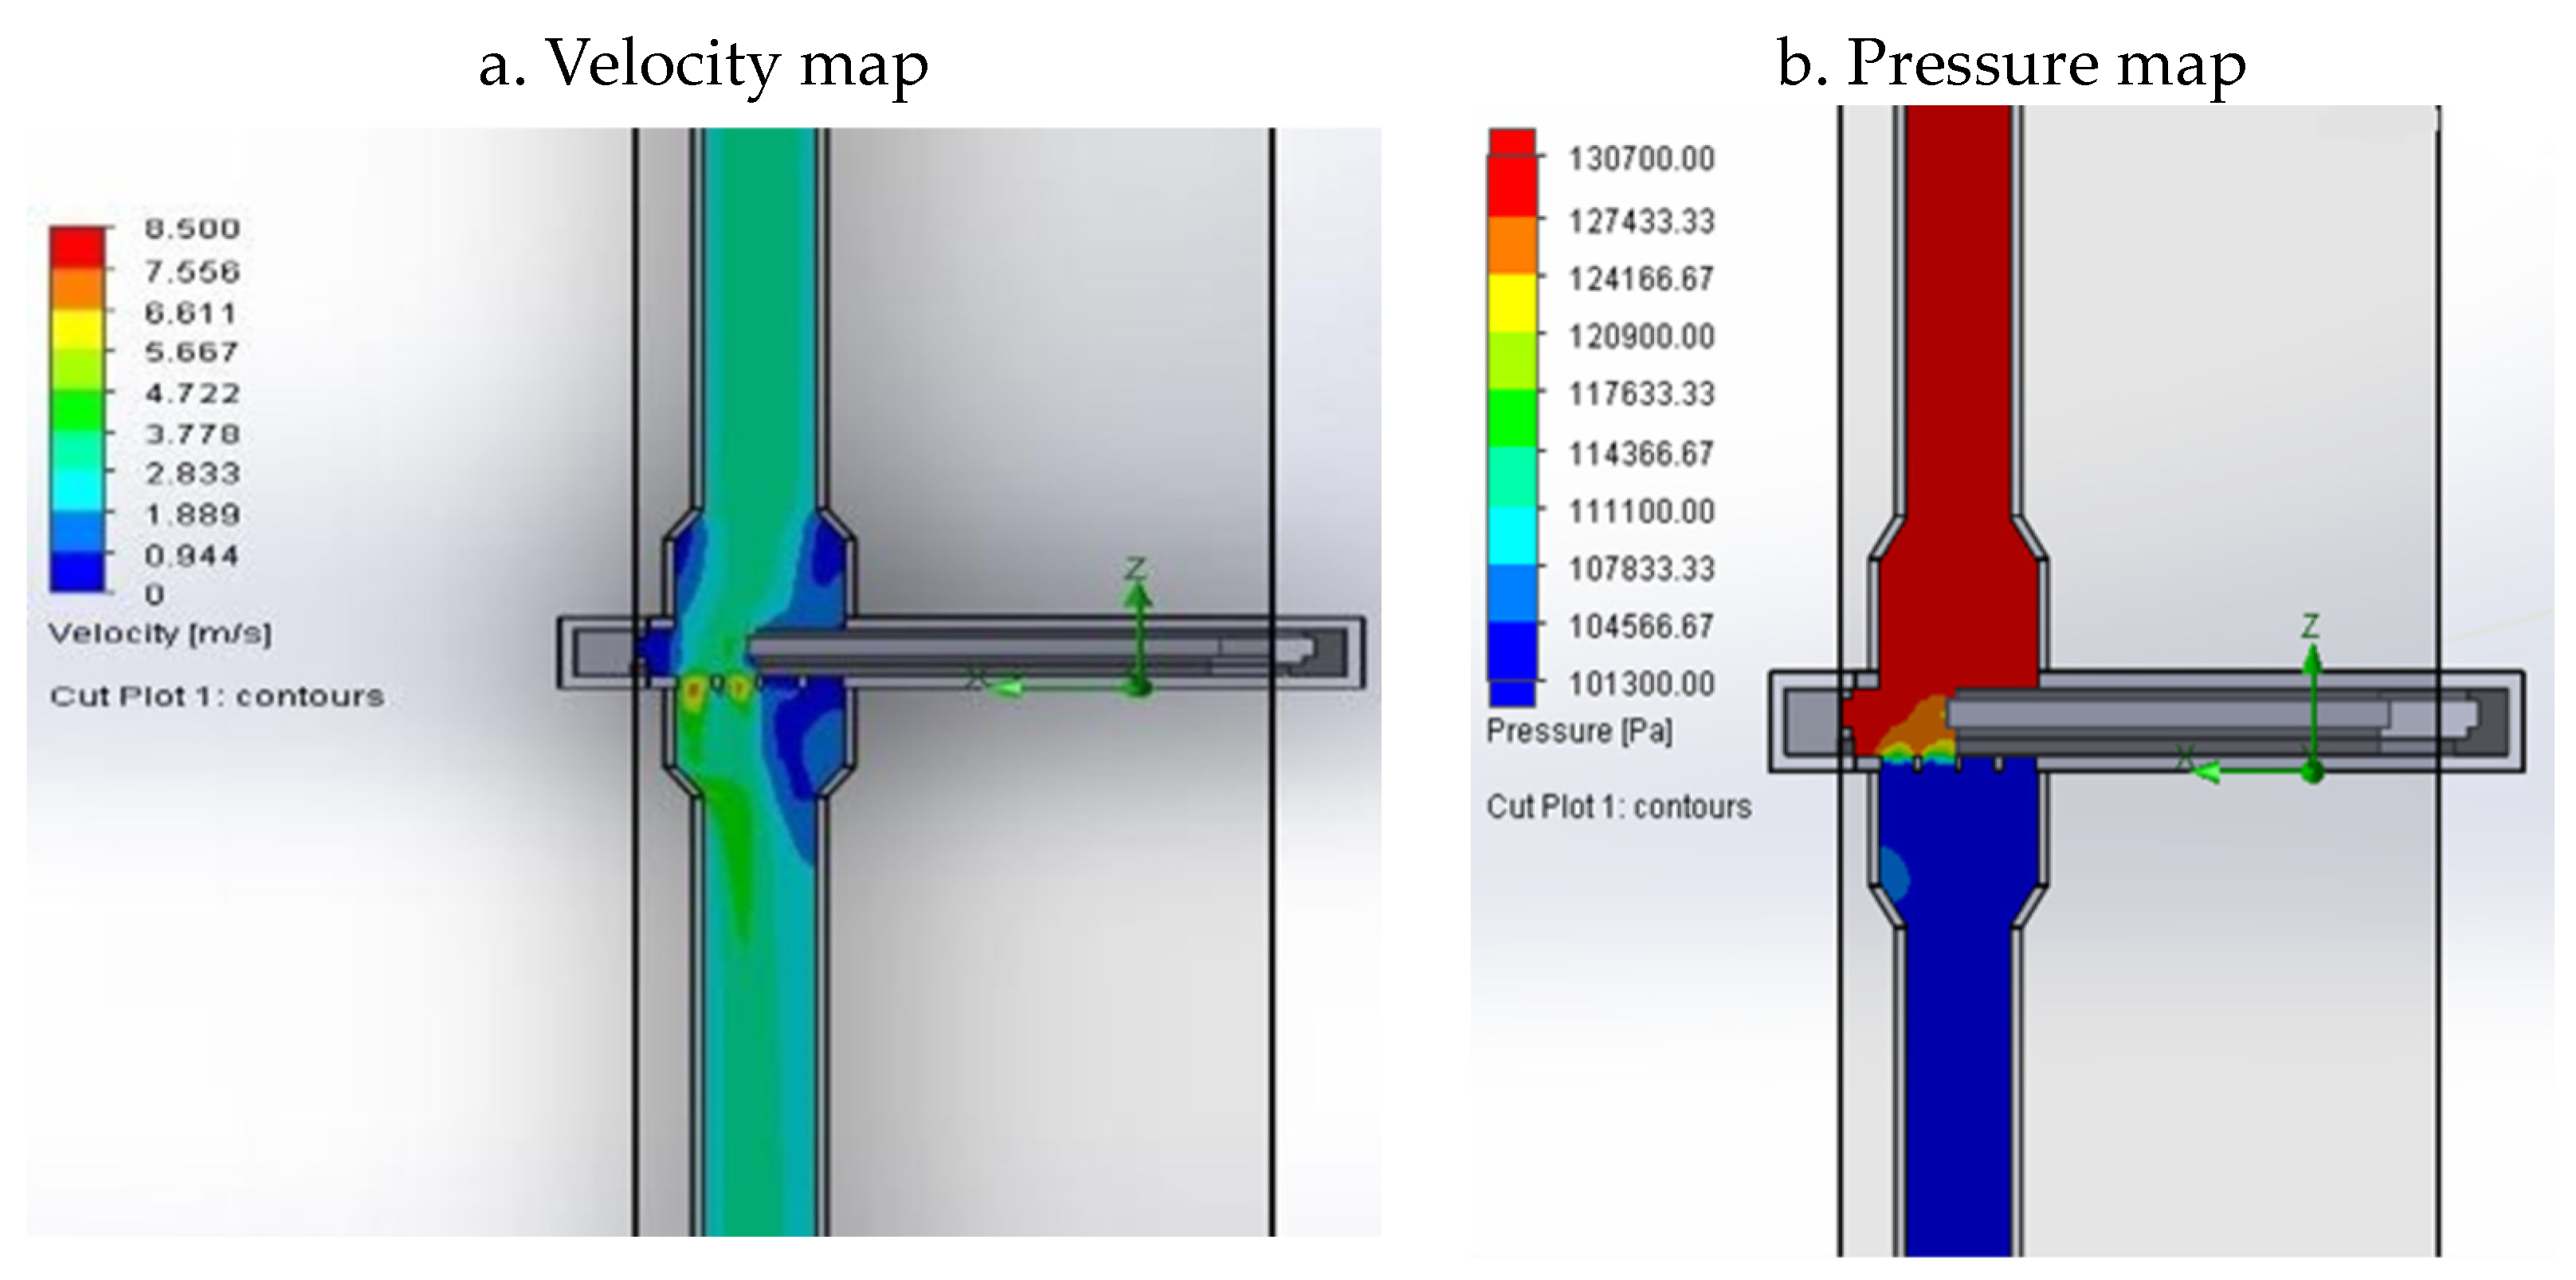
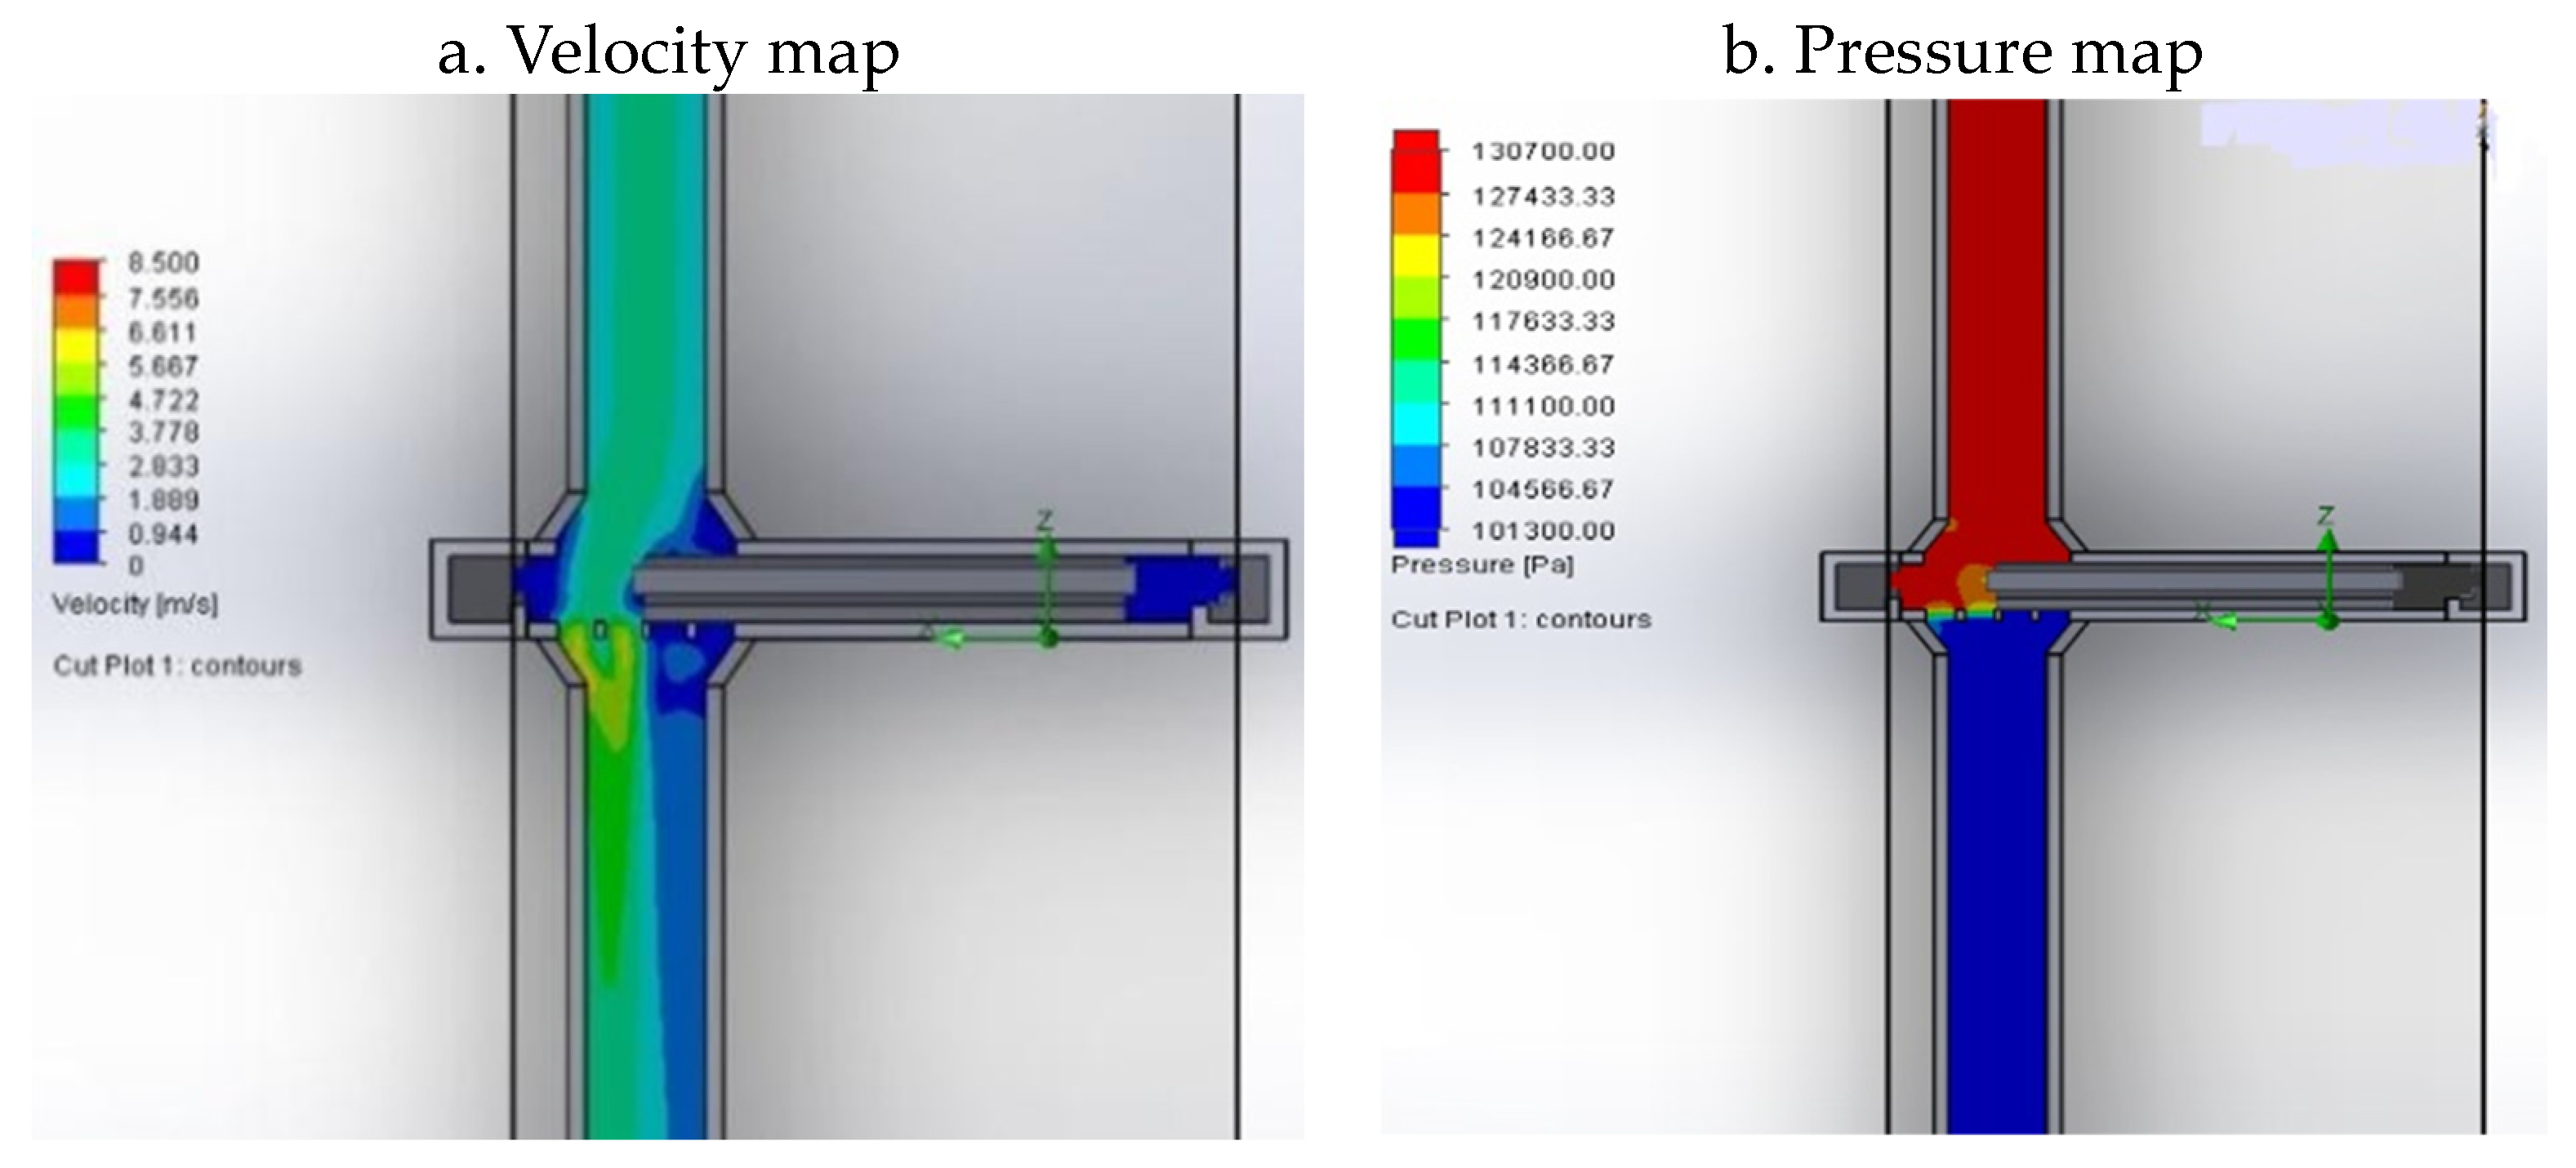
For the 30% opening,
Figure 18a,b show the flow velocity increasing from left to right, indicating a better flow development than that of the second geometry. As the speed increases, there is also an increase in pressure during the fluid flow through the obturator orifices, indicating an area of turbulence inside the valve.
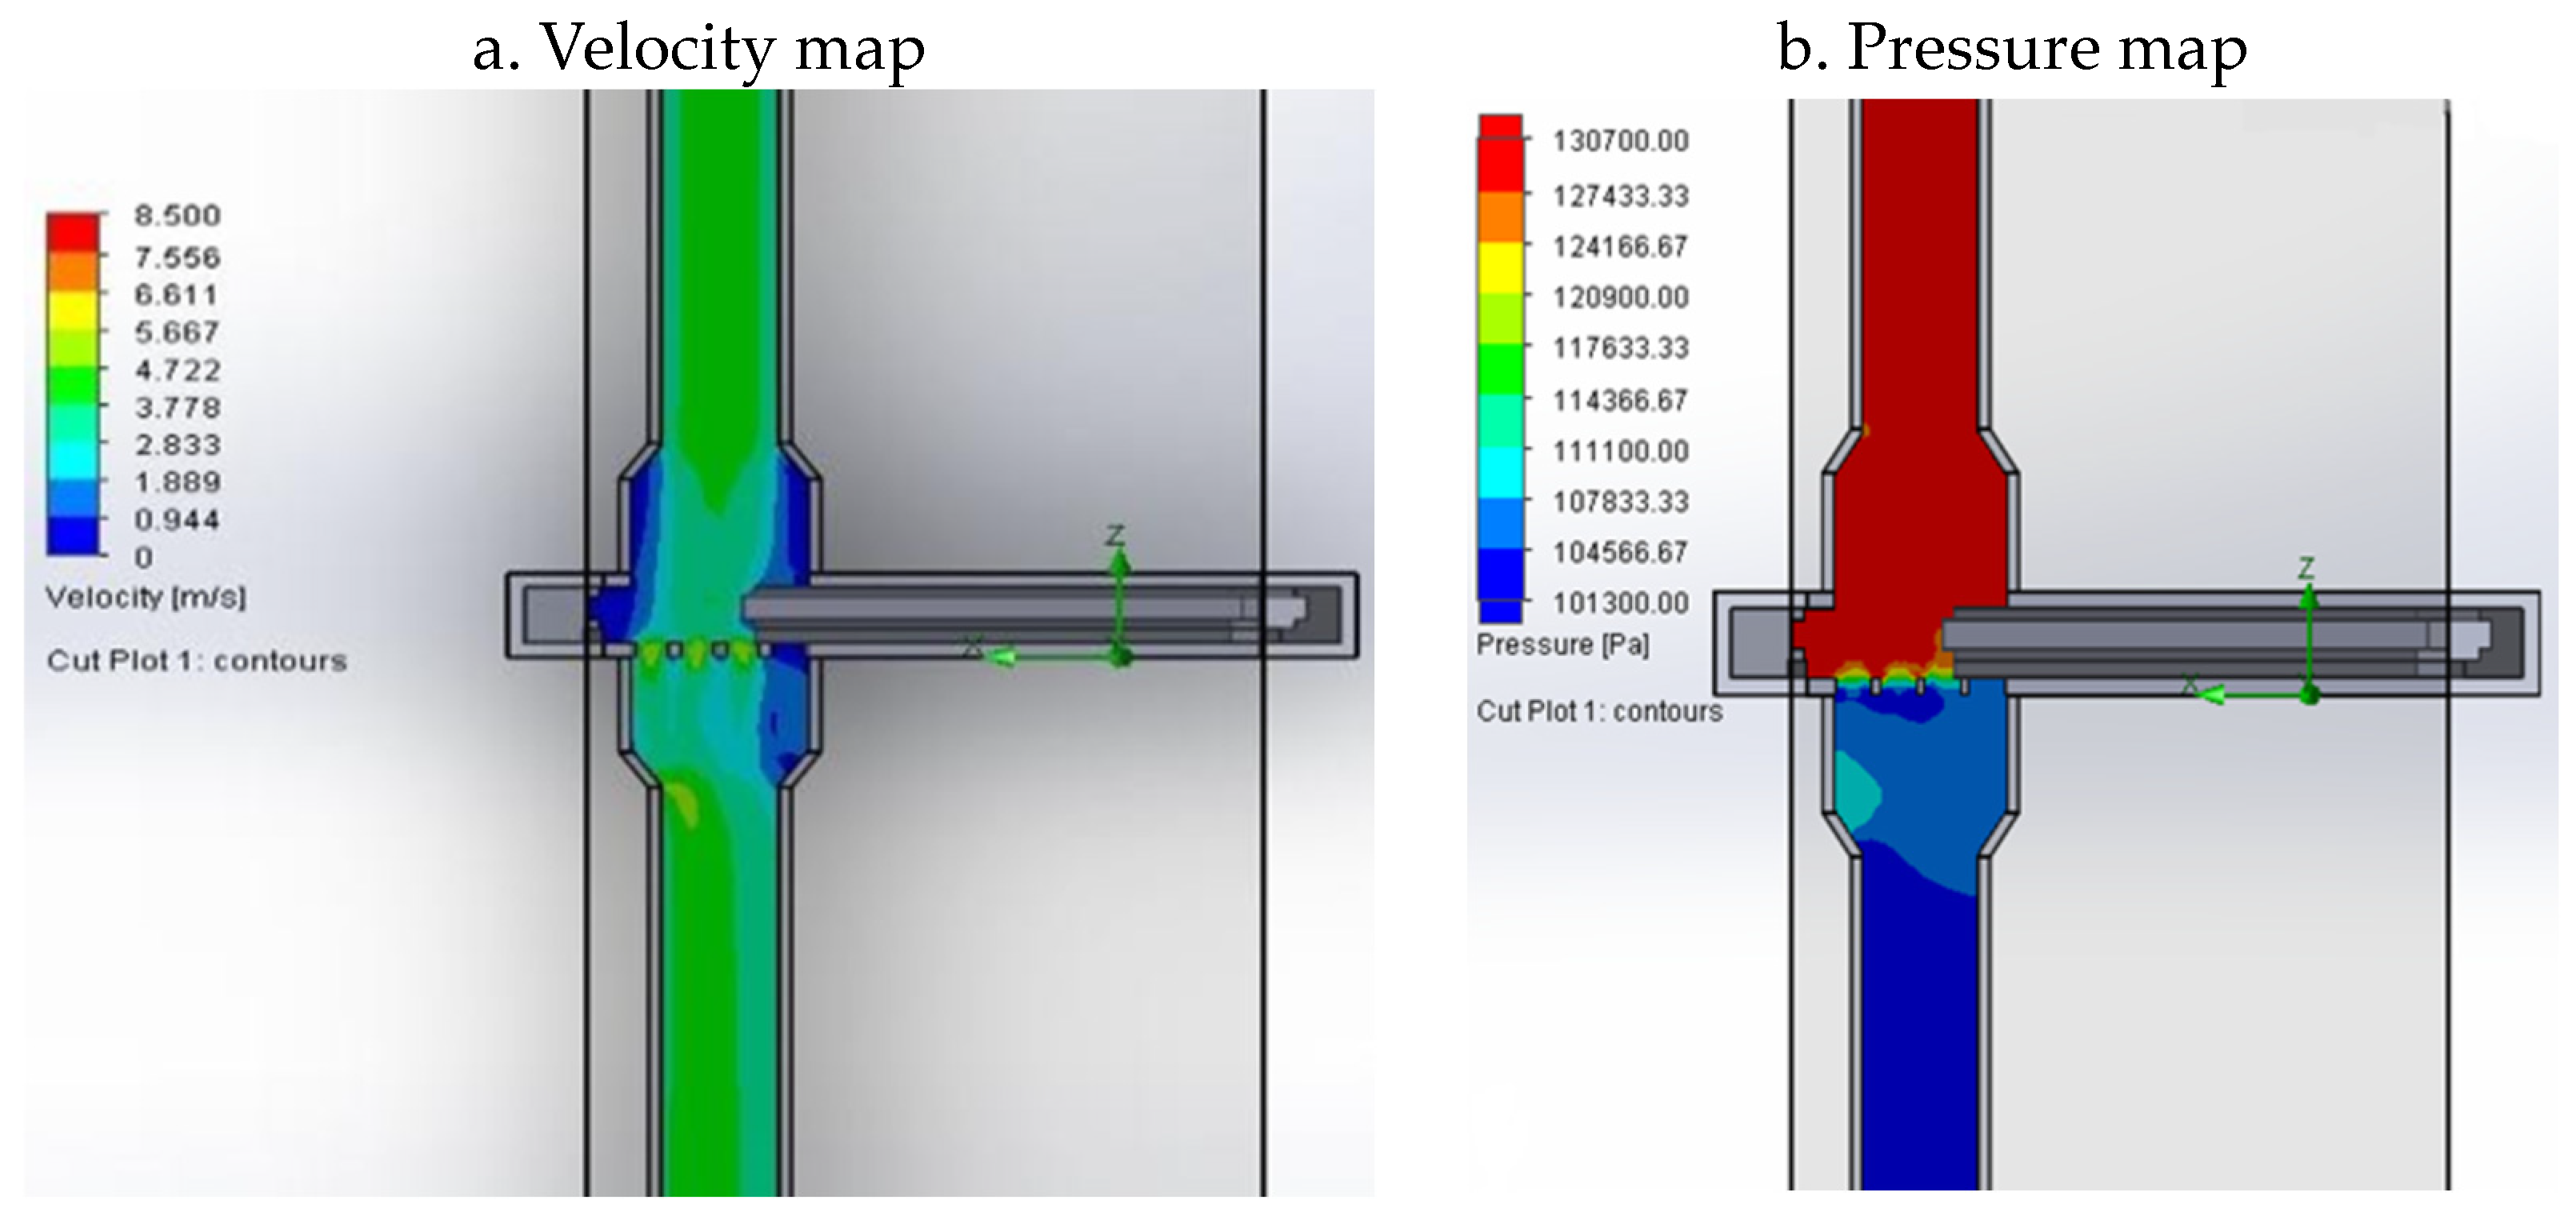
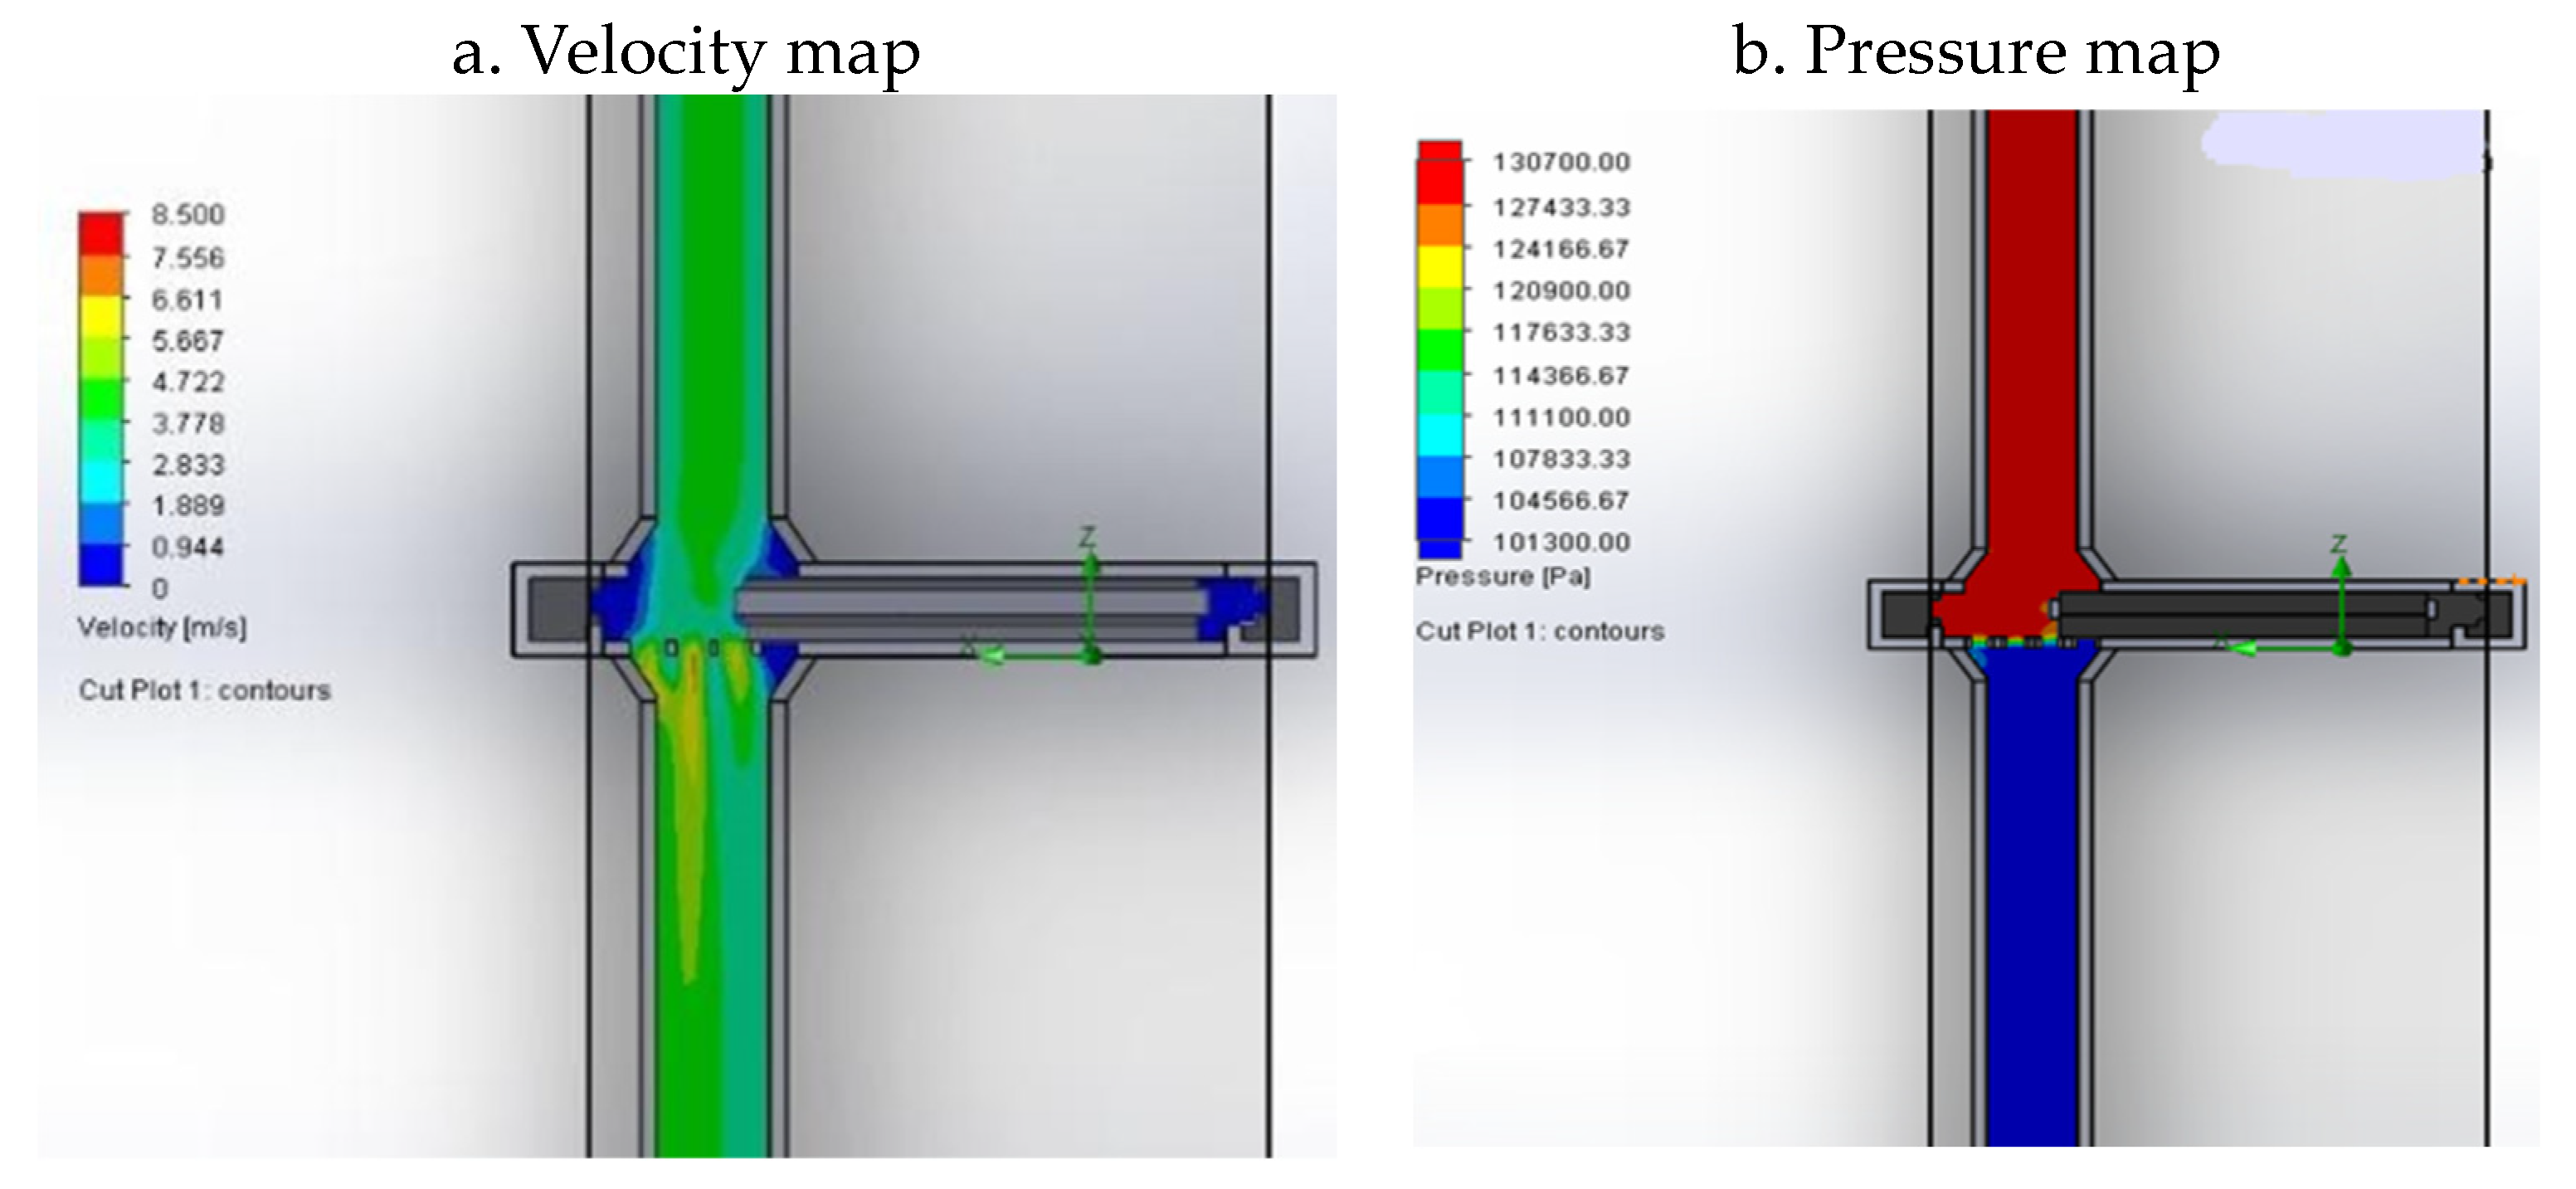
For the 50% opening, despite some areas with velocity values close to zero (highlighted in blue in
Figure 19a), the flow development is better than in the second geometry. The velocity and pressure continue to vary only in the section where the fluid passes through the plug, as can be seen in
Figure 19b.
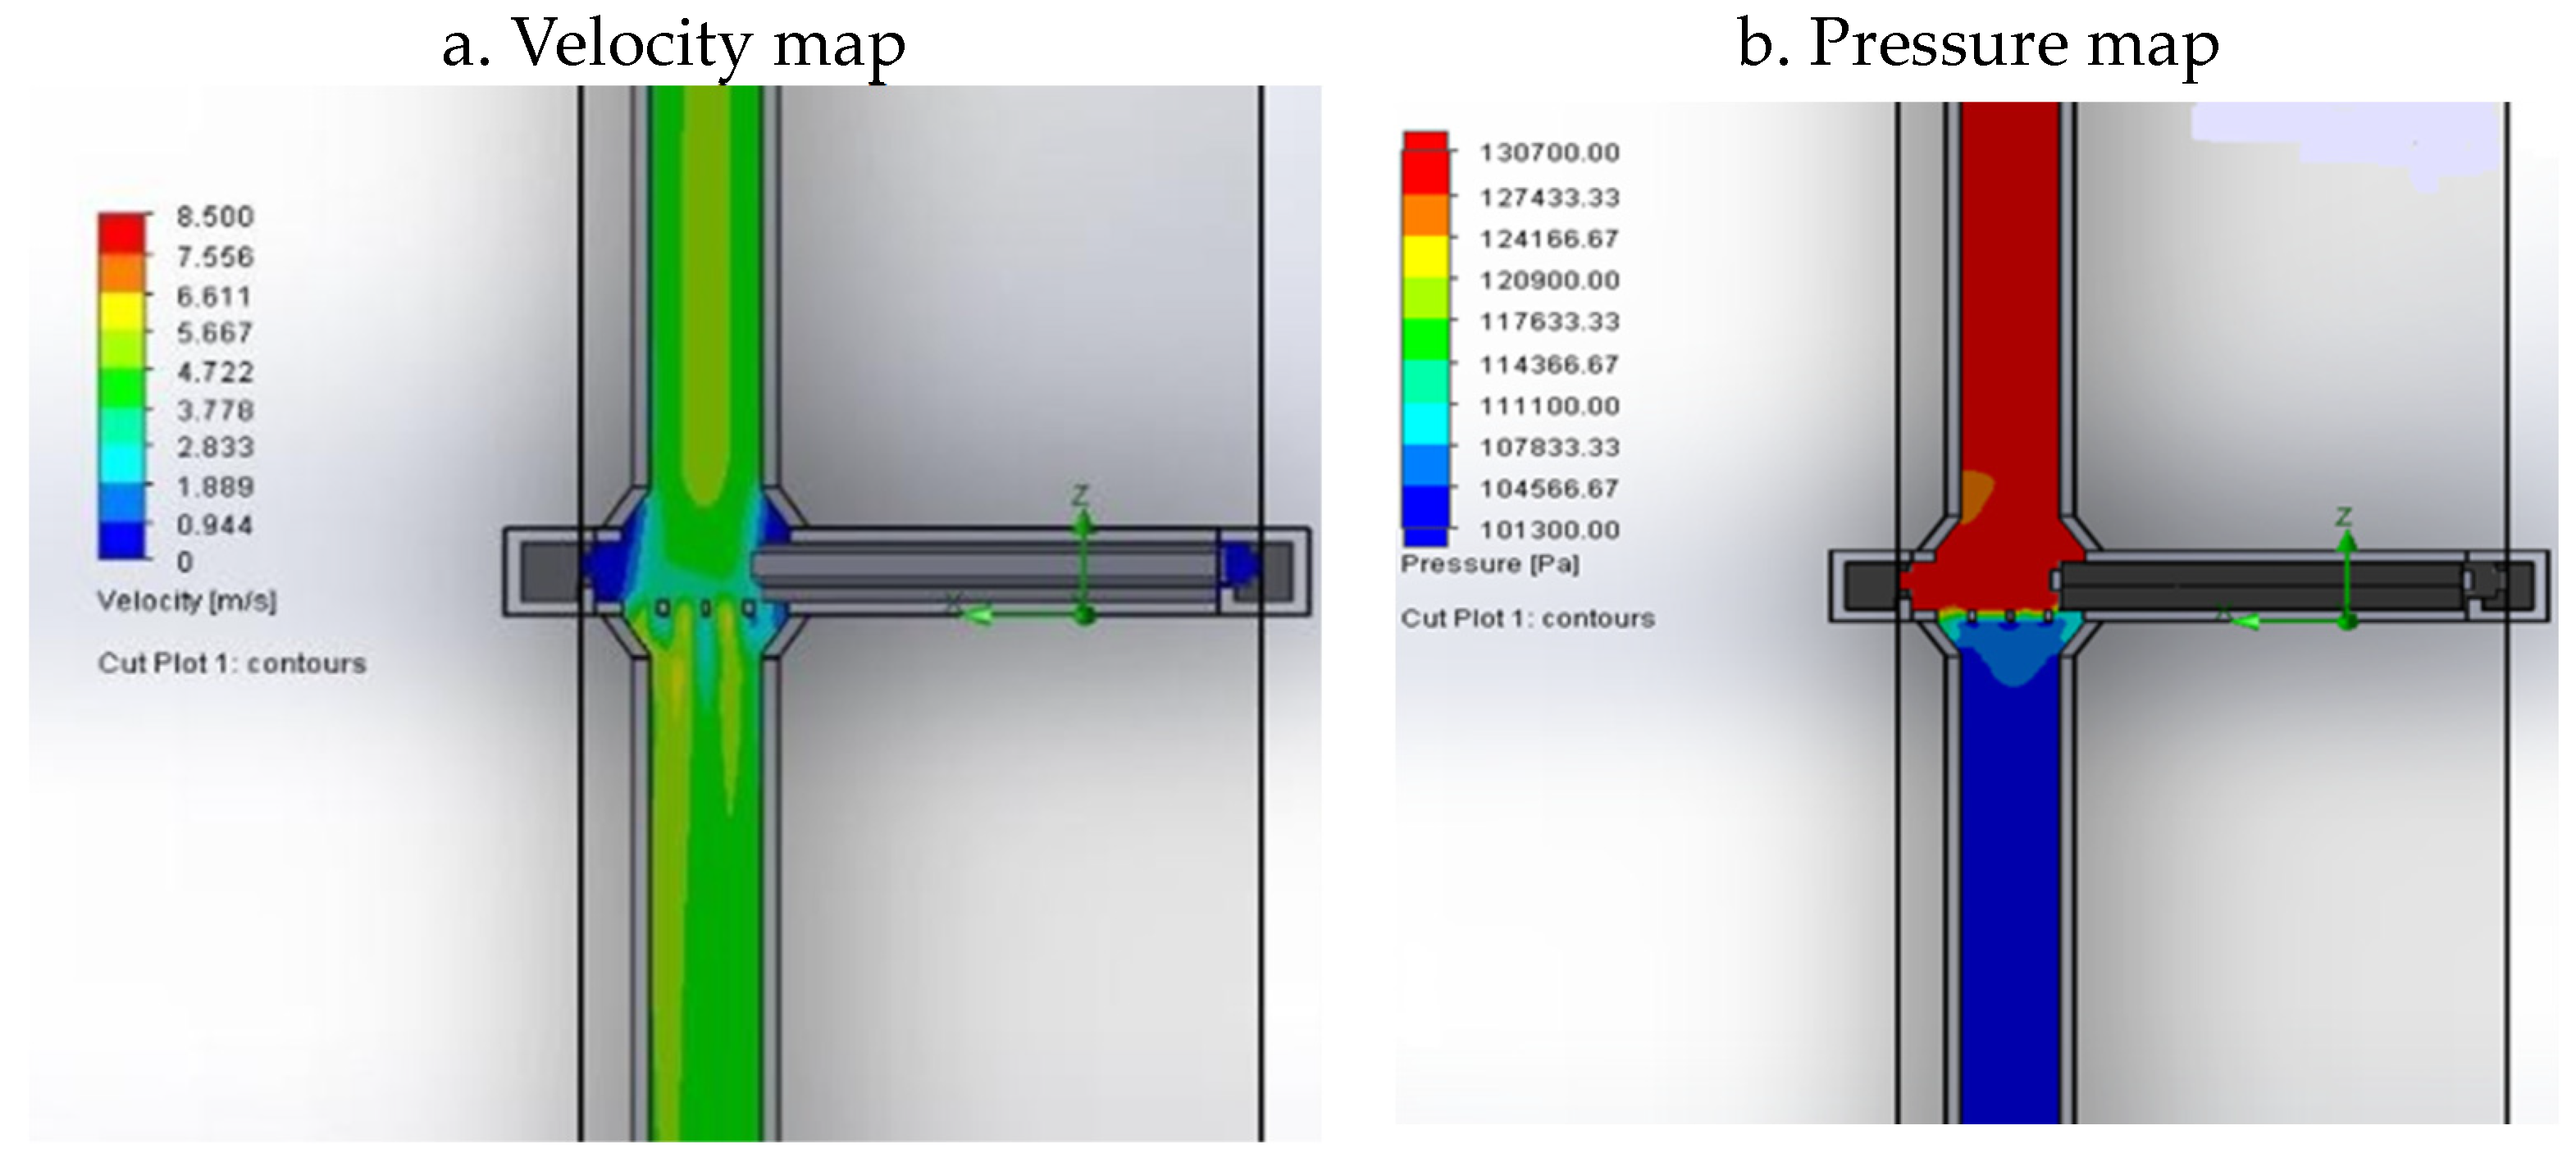
For the 70% and 90% openings, shown in
Figure 20a,b and
Figure 21a,b, respectively, better flow development is more evident than in the previous designs, despite a few velocity points close to zero (highlighted in blue in
Figure 20a and
Figure 21a). The velocity and pressure gradients demonstrate the existing variation inside the valve, and the flow developed in the sequence.
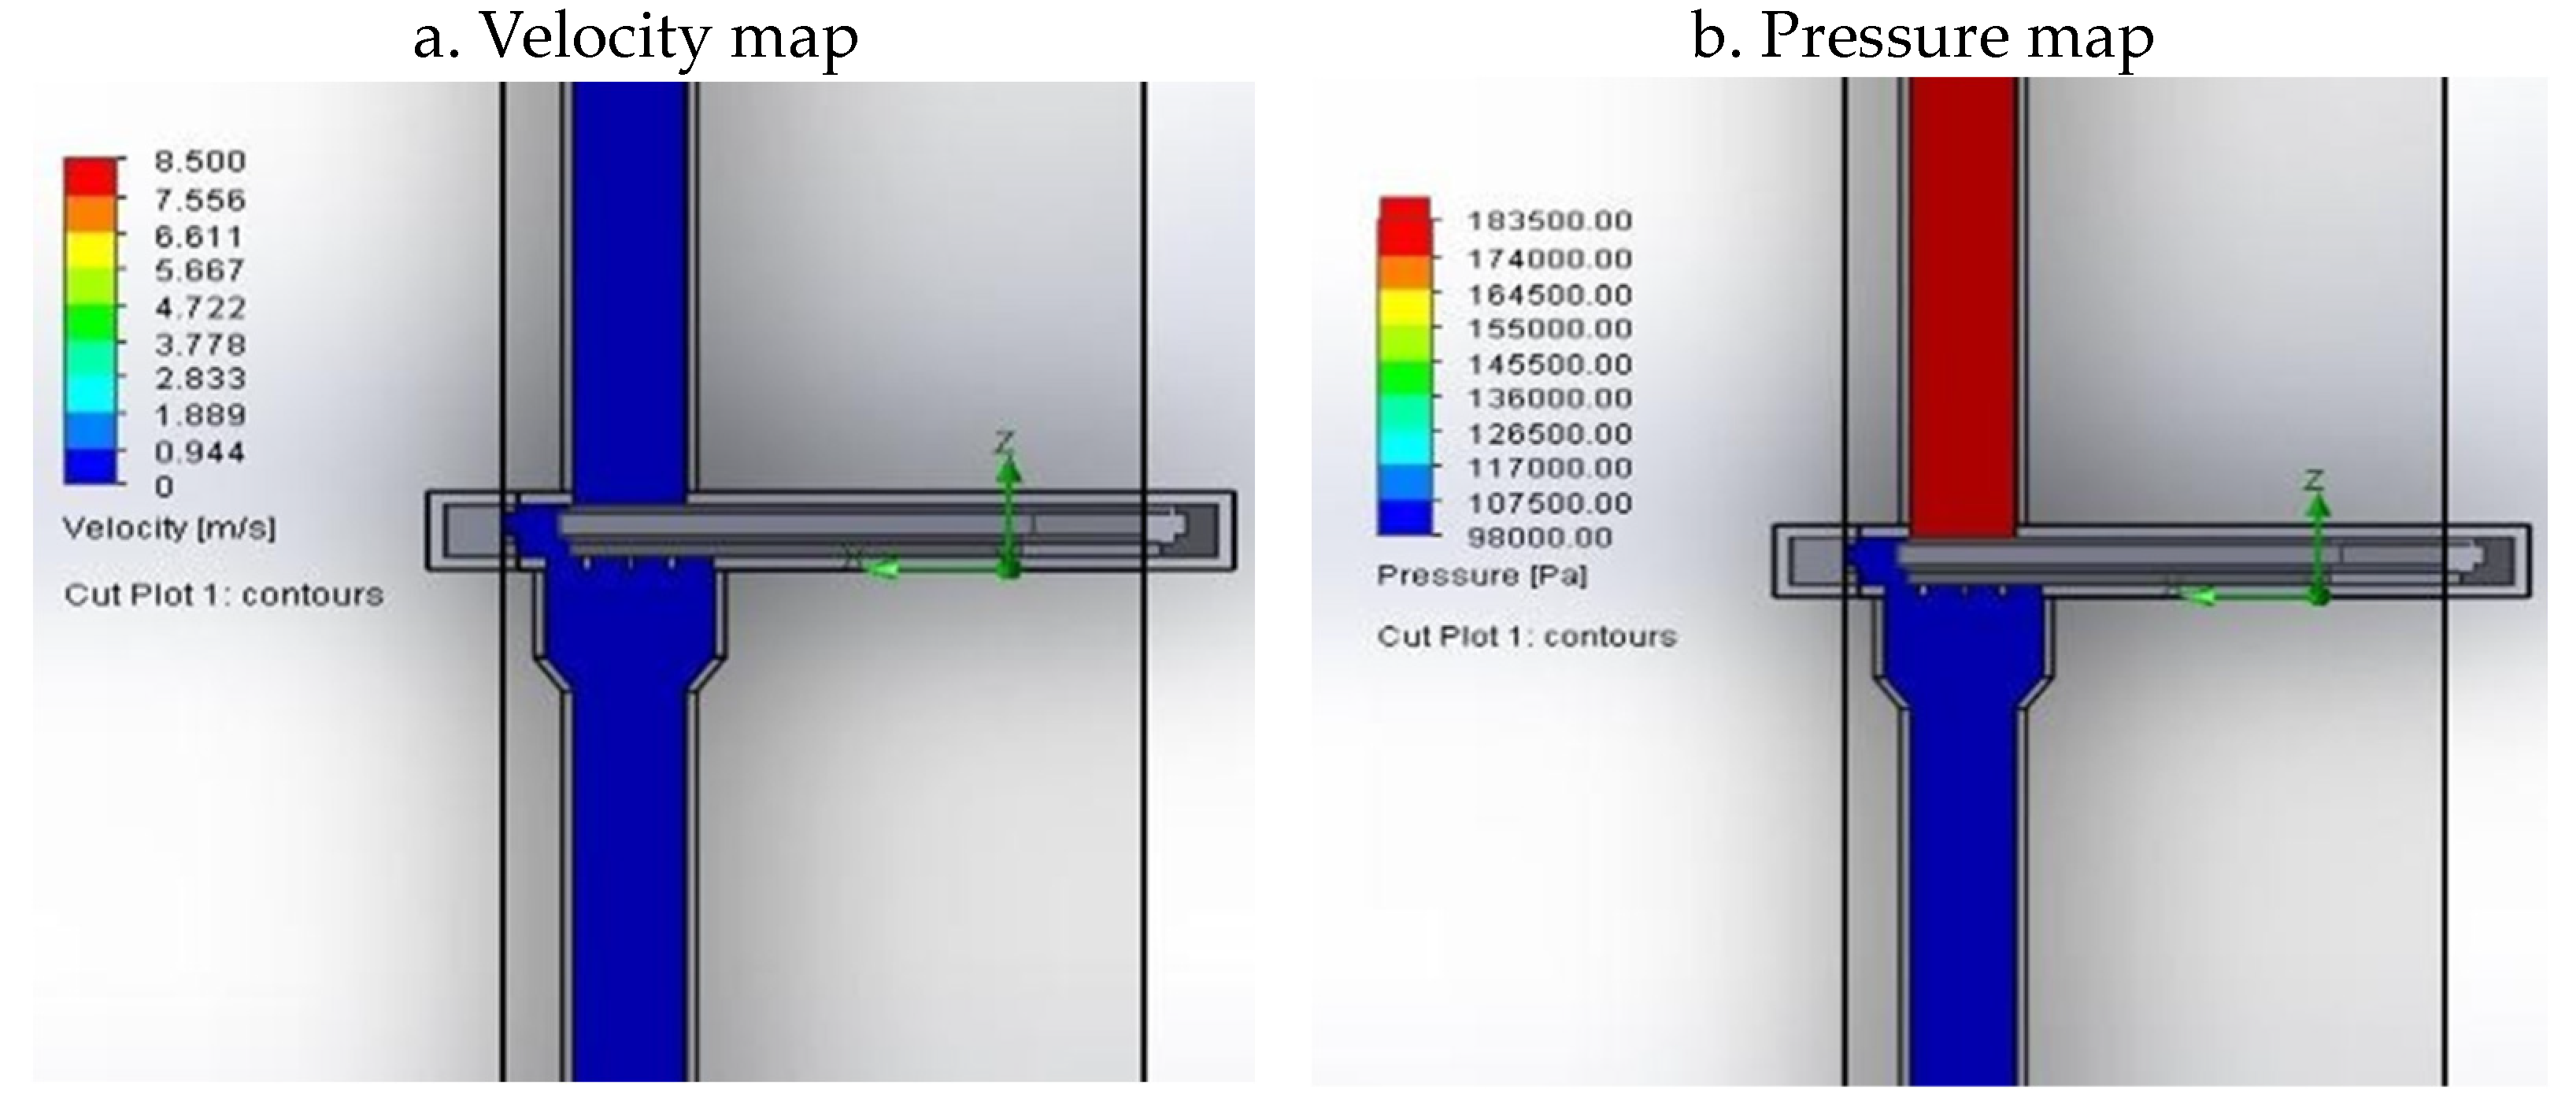
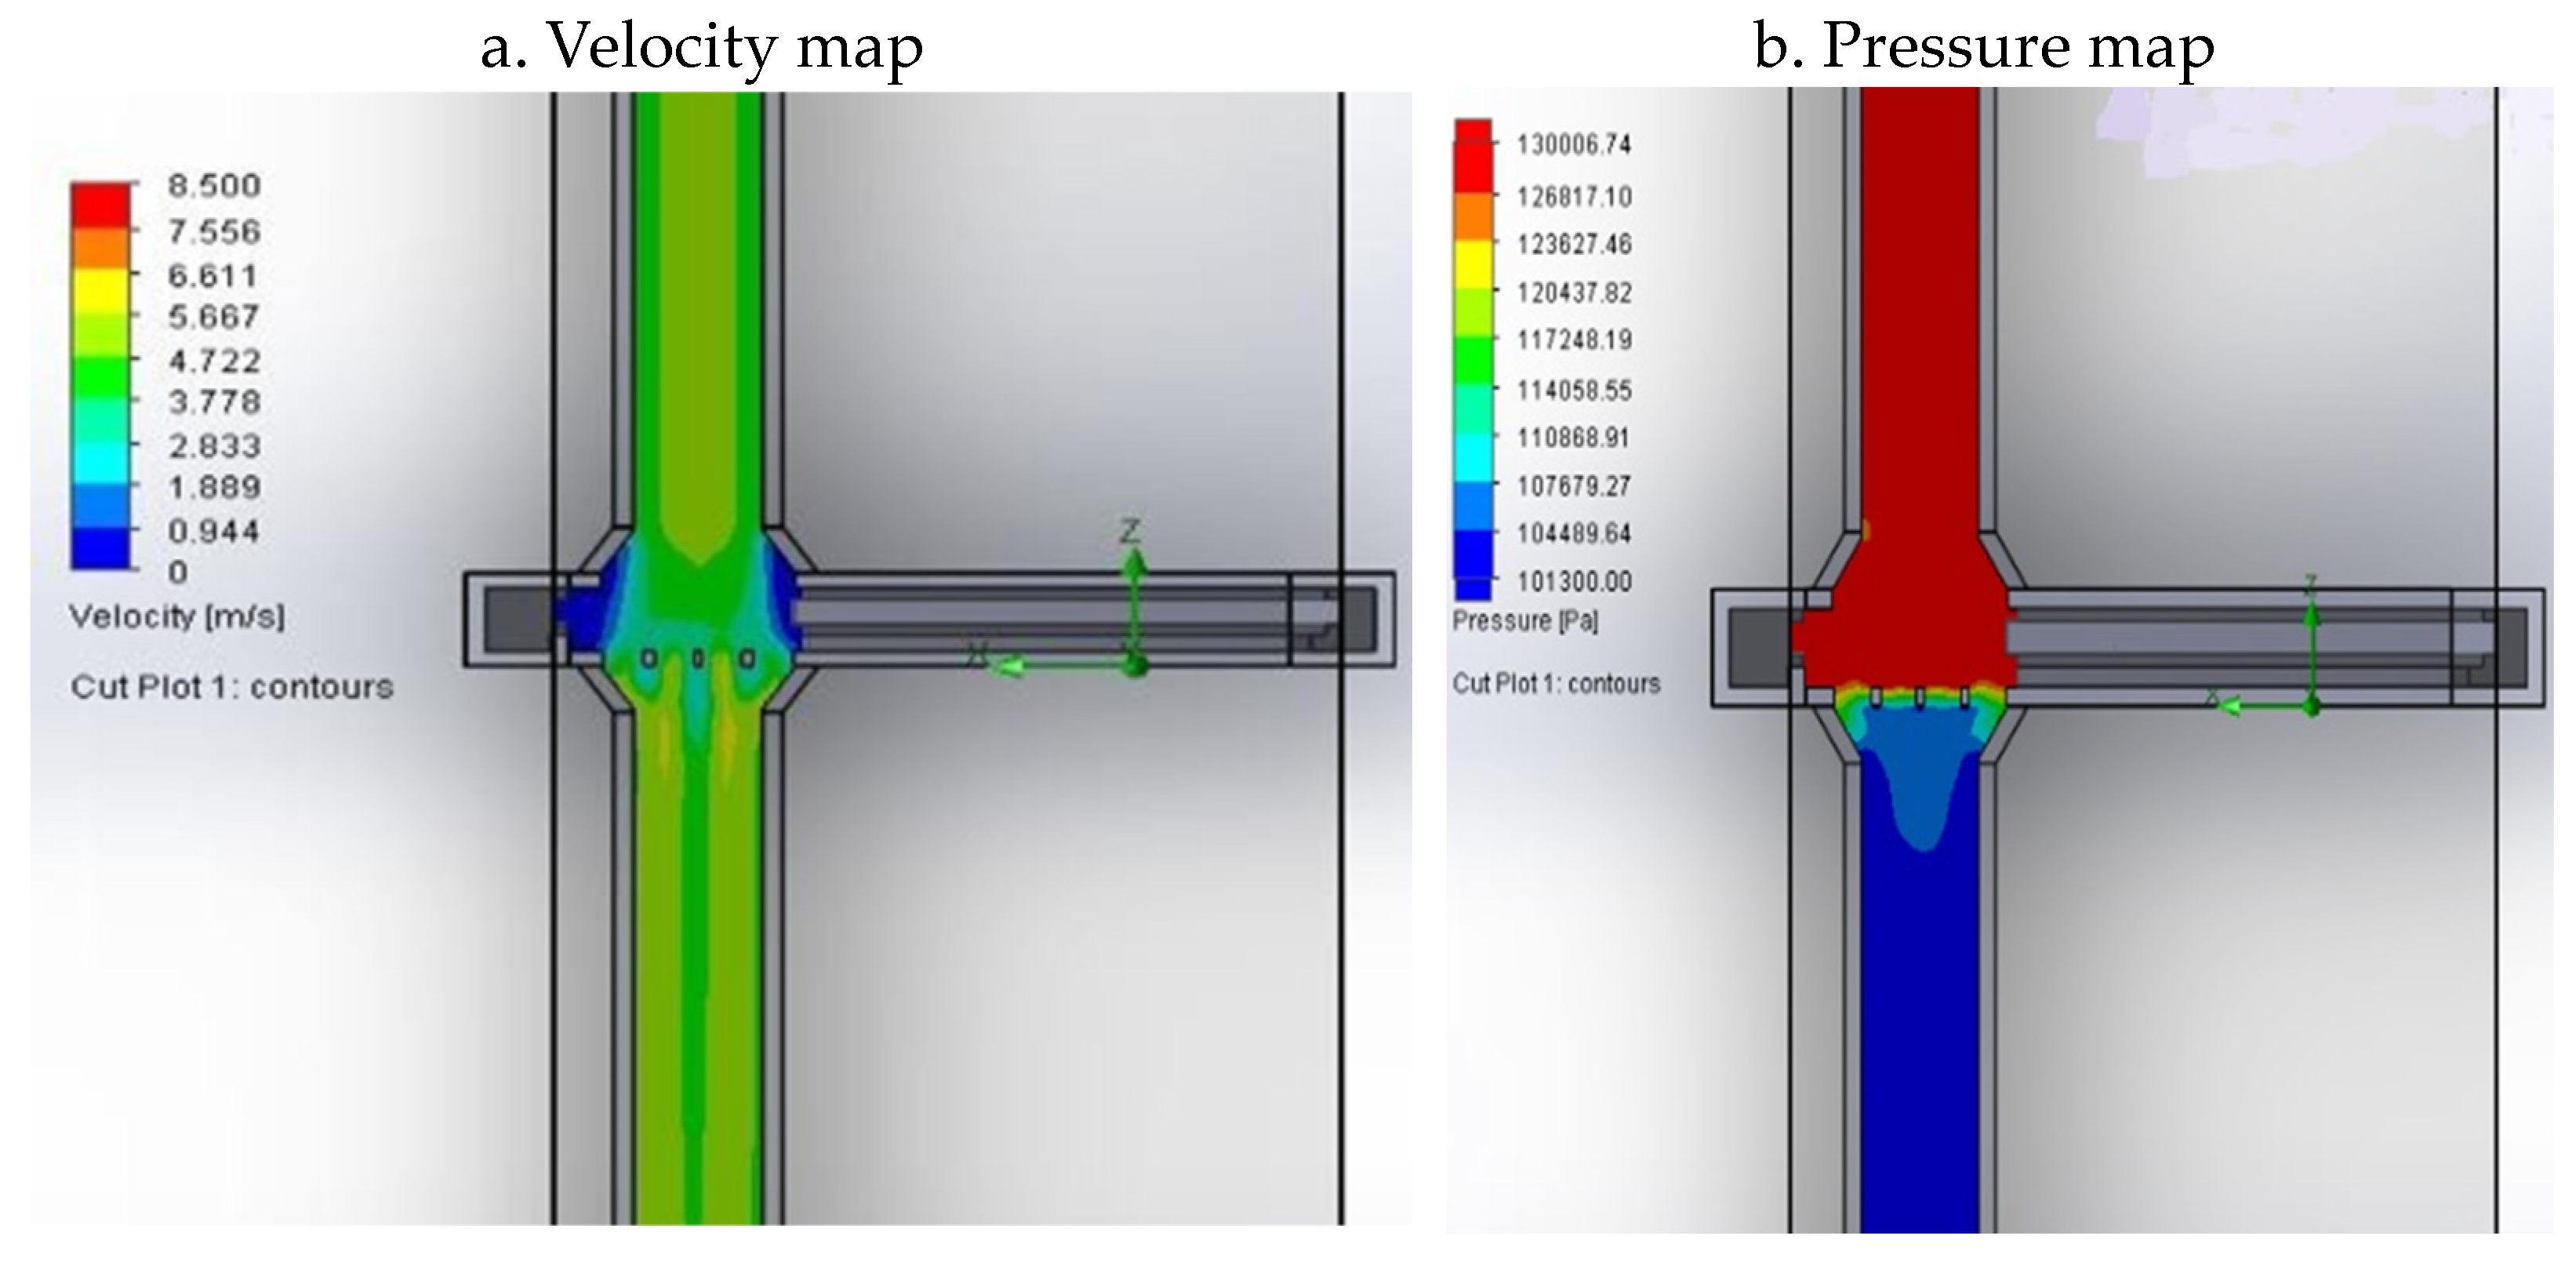
Finally, the analyses of the velocity and pressure maps of the fully open valves show advantages compared with the second geometry. Flow development is improved when compared with the second geometry at the same opening percentage, with higher velocities for a smaller geometry, as is shown in
Figure 15a and
Figure 22a. Thus, reducing the dimensions leads to savings in the construction process.
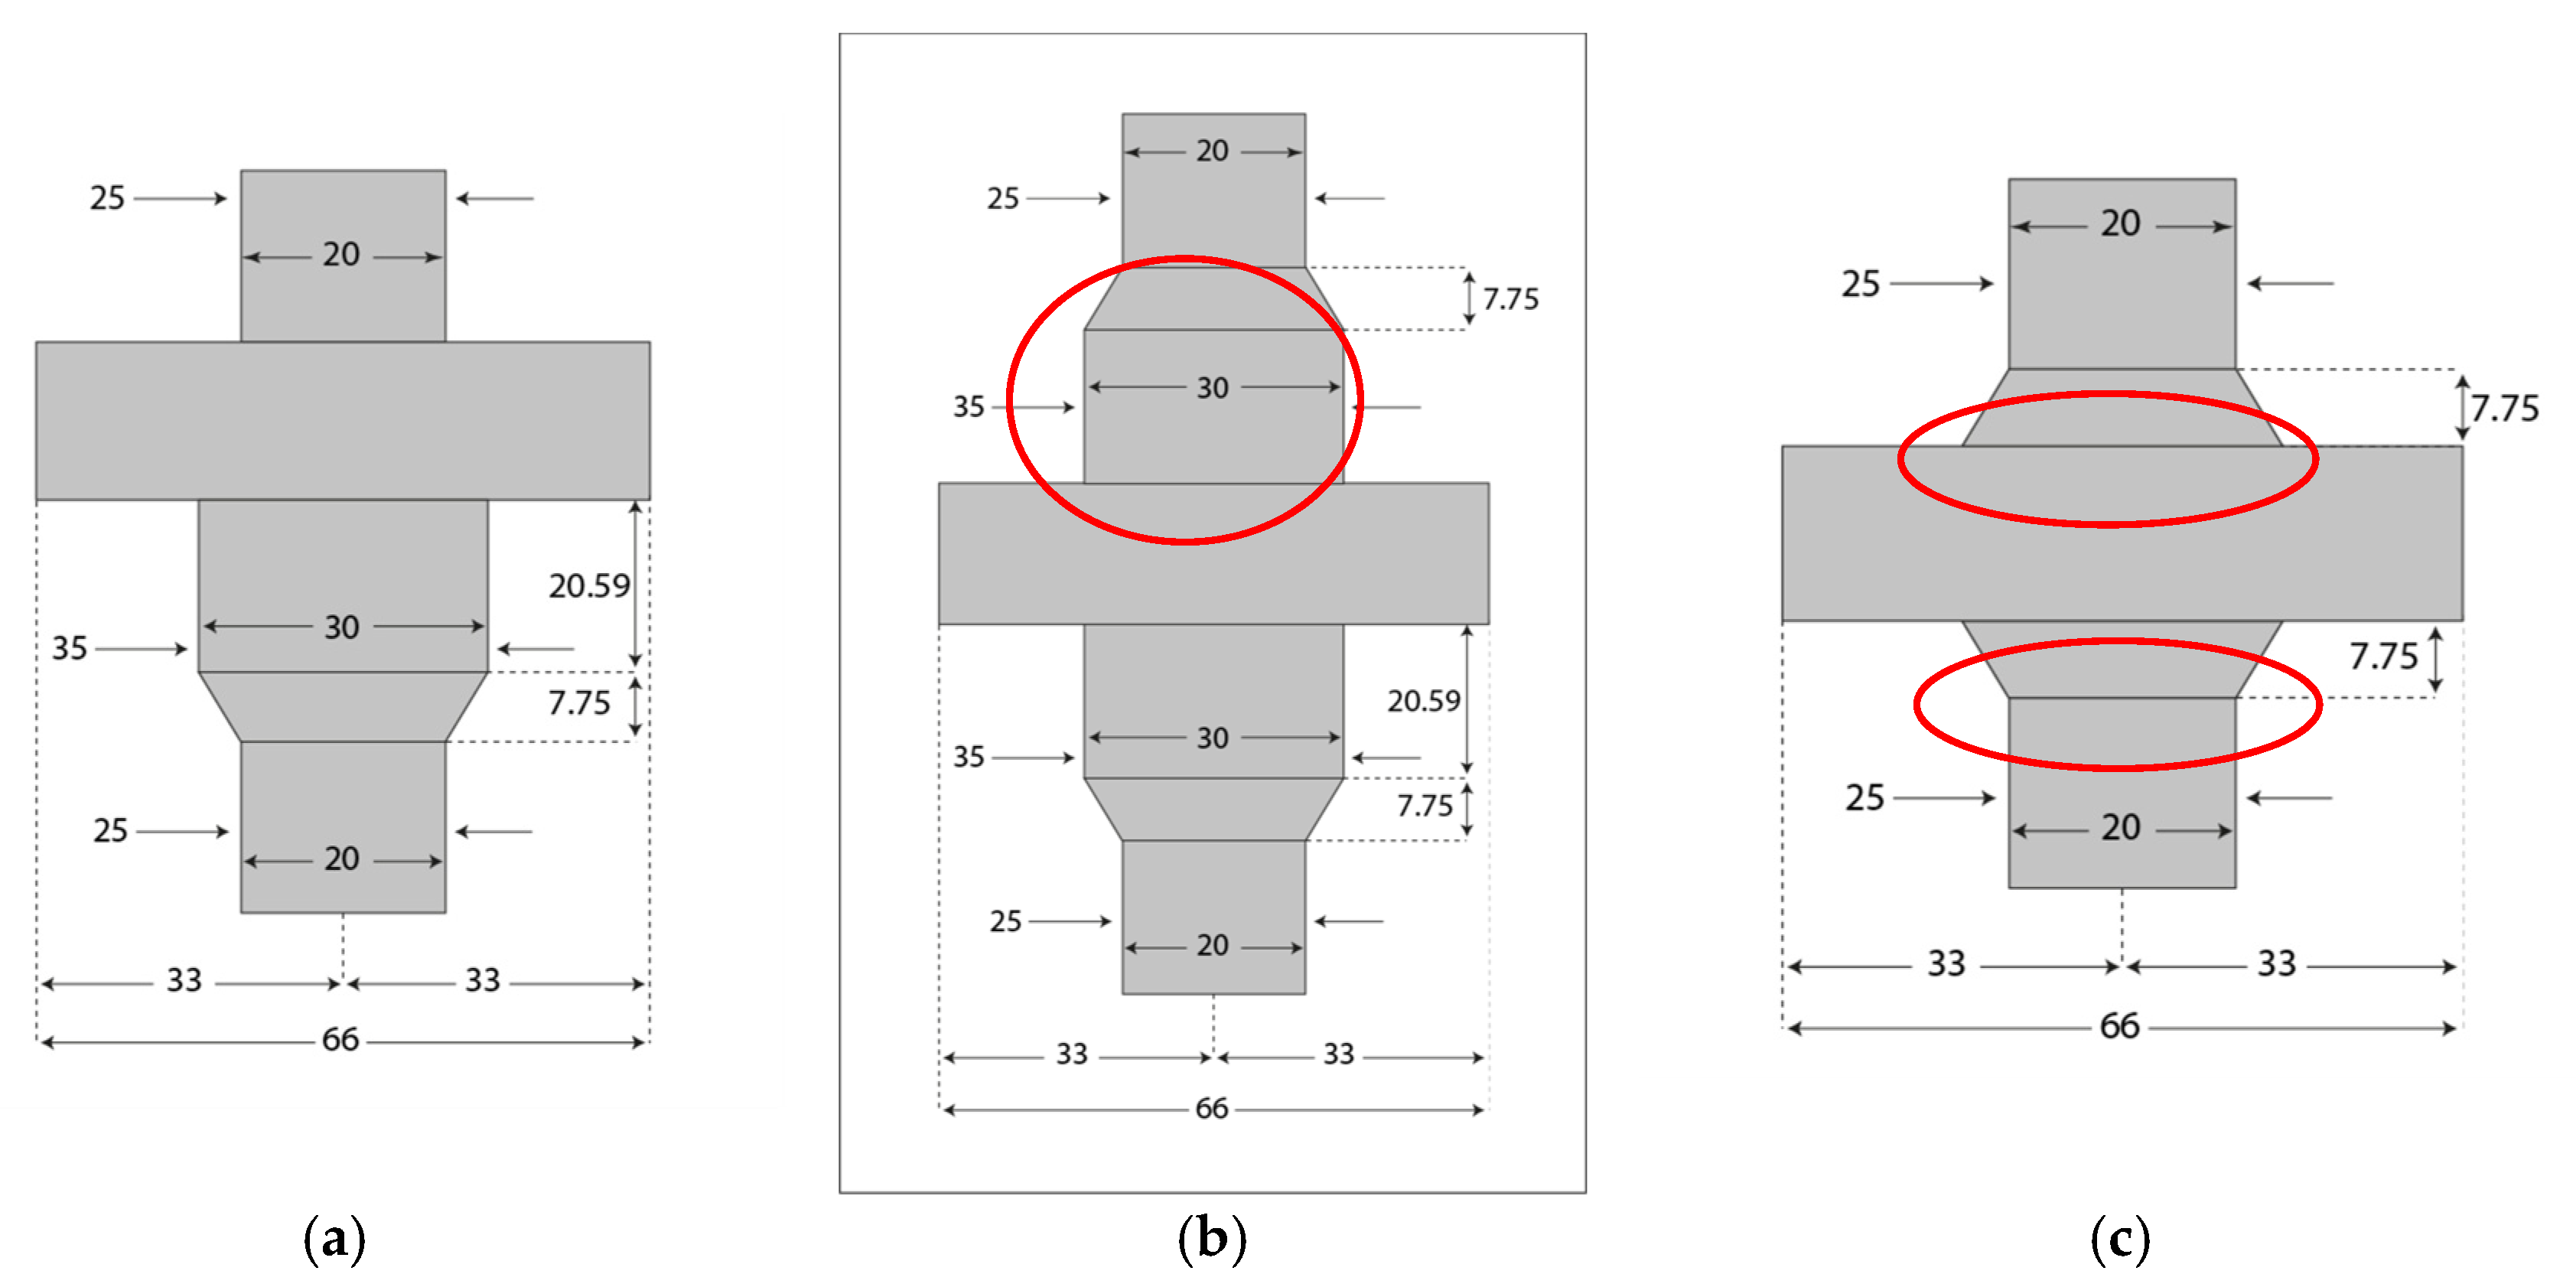
Figure 23a–c show, in the areas circled in red, the changes implemented from the first geometry to the third geometry.
For the third geometry, the head loss was determined based on the results obtained from the flow simulation with the CFD software. Using Equation (7), a 2.90 pressure drop coefficient of the valve when 100% open (Kv
100) was calculated. In comparison, the head loss coefficient for a globe valve when 100% open is Kv
100 = 9.00 [
33]. This indicates that the new valve possesses a great advantage over the globe valve when comparing their head loss coefficients (Kv
100). Thus, the valve developed in this study presents a significant reduction in the head loss. The loss coefficient is close to one third of the typical globe valve coefficient indicated the literature.
In hydraulic installations that require pumps to increase the pressure, the reduction in the head loss provided by the valve should reduce the power required, resulting in lower energy consumption. In a scenario in which the pump power is used exclusively to overcome the head loss, replacing a globe valve (Kv = 9.00) with the valve developed in this study (Kv = 2.9) would lead to an estimated 67% energy saving (calculated using the classical pump power equation) [
34].
The controllability was also analyzed for each valve geometry. The controllability of a valve when installed in a hydraulic system varies as a function of the head loss of the system, i.e., the lower its value compared with the head loss of the system, the lower the controllability of the valve, and vice versa.
Table 1,
Table 2 and
Table 3 present flow rate values related to each opening percentage for each valve.
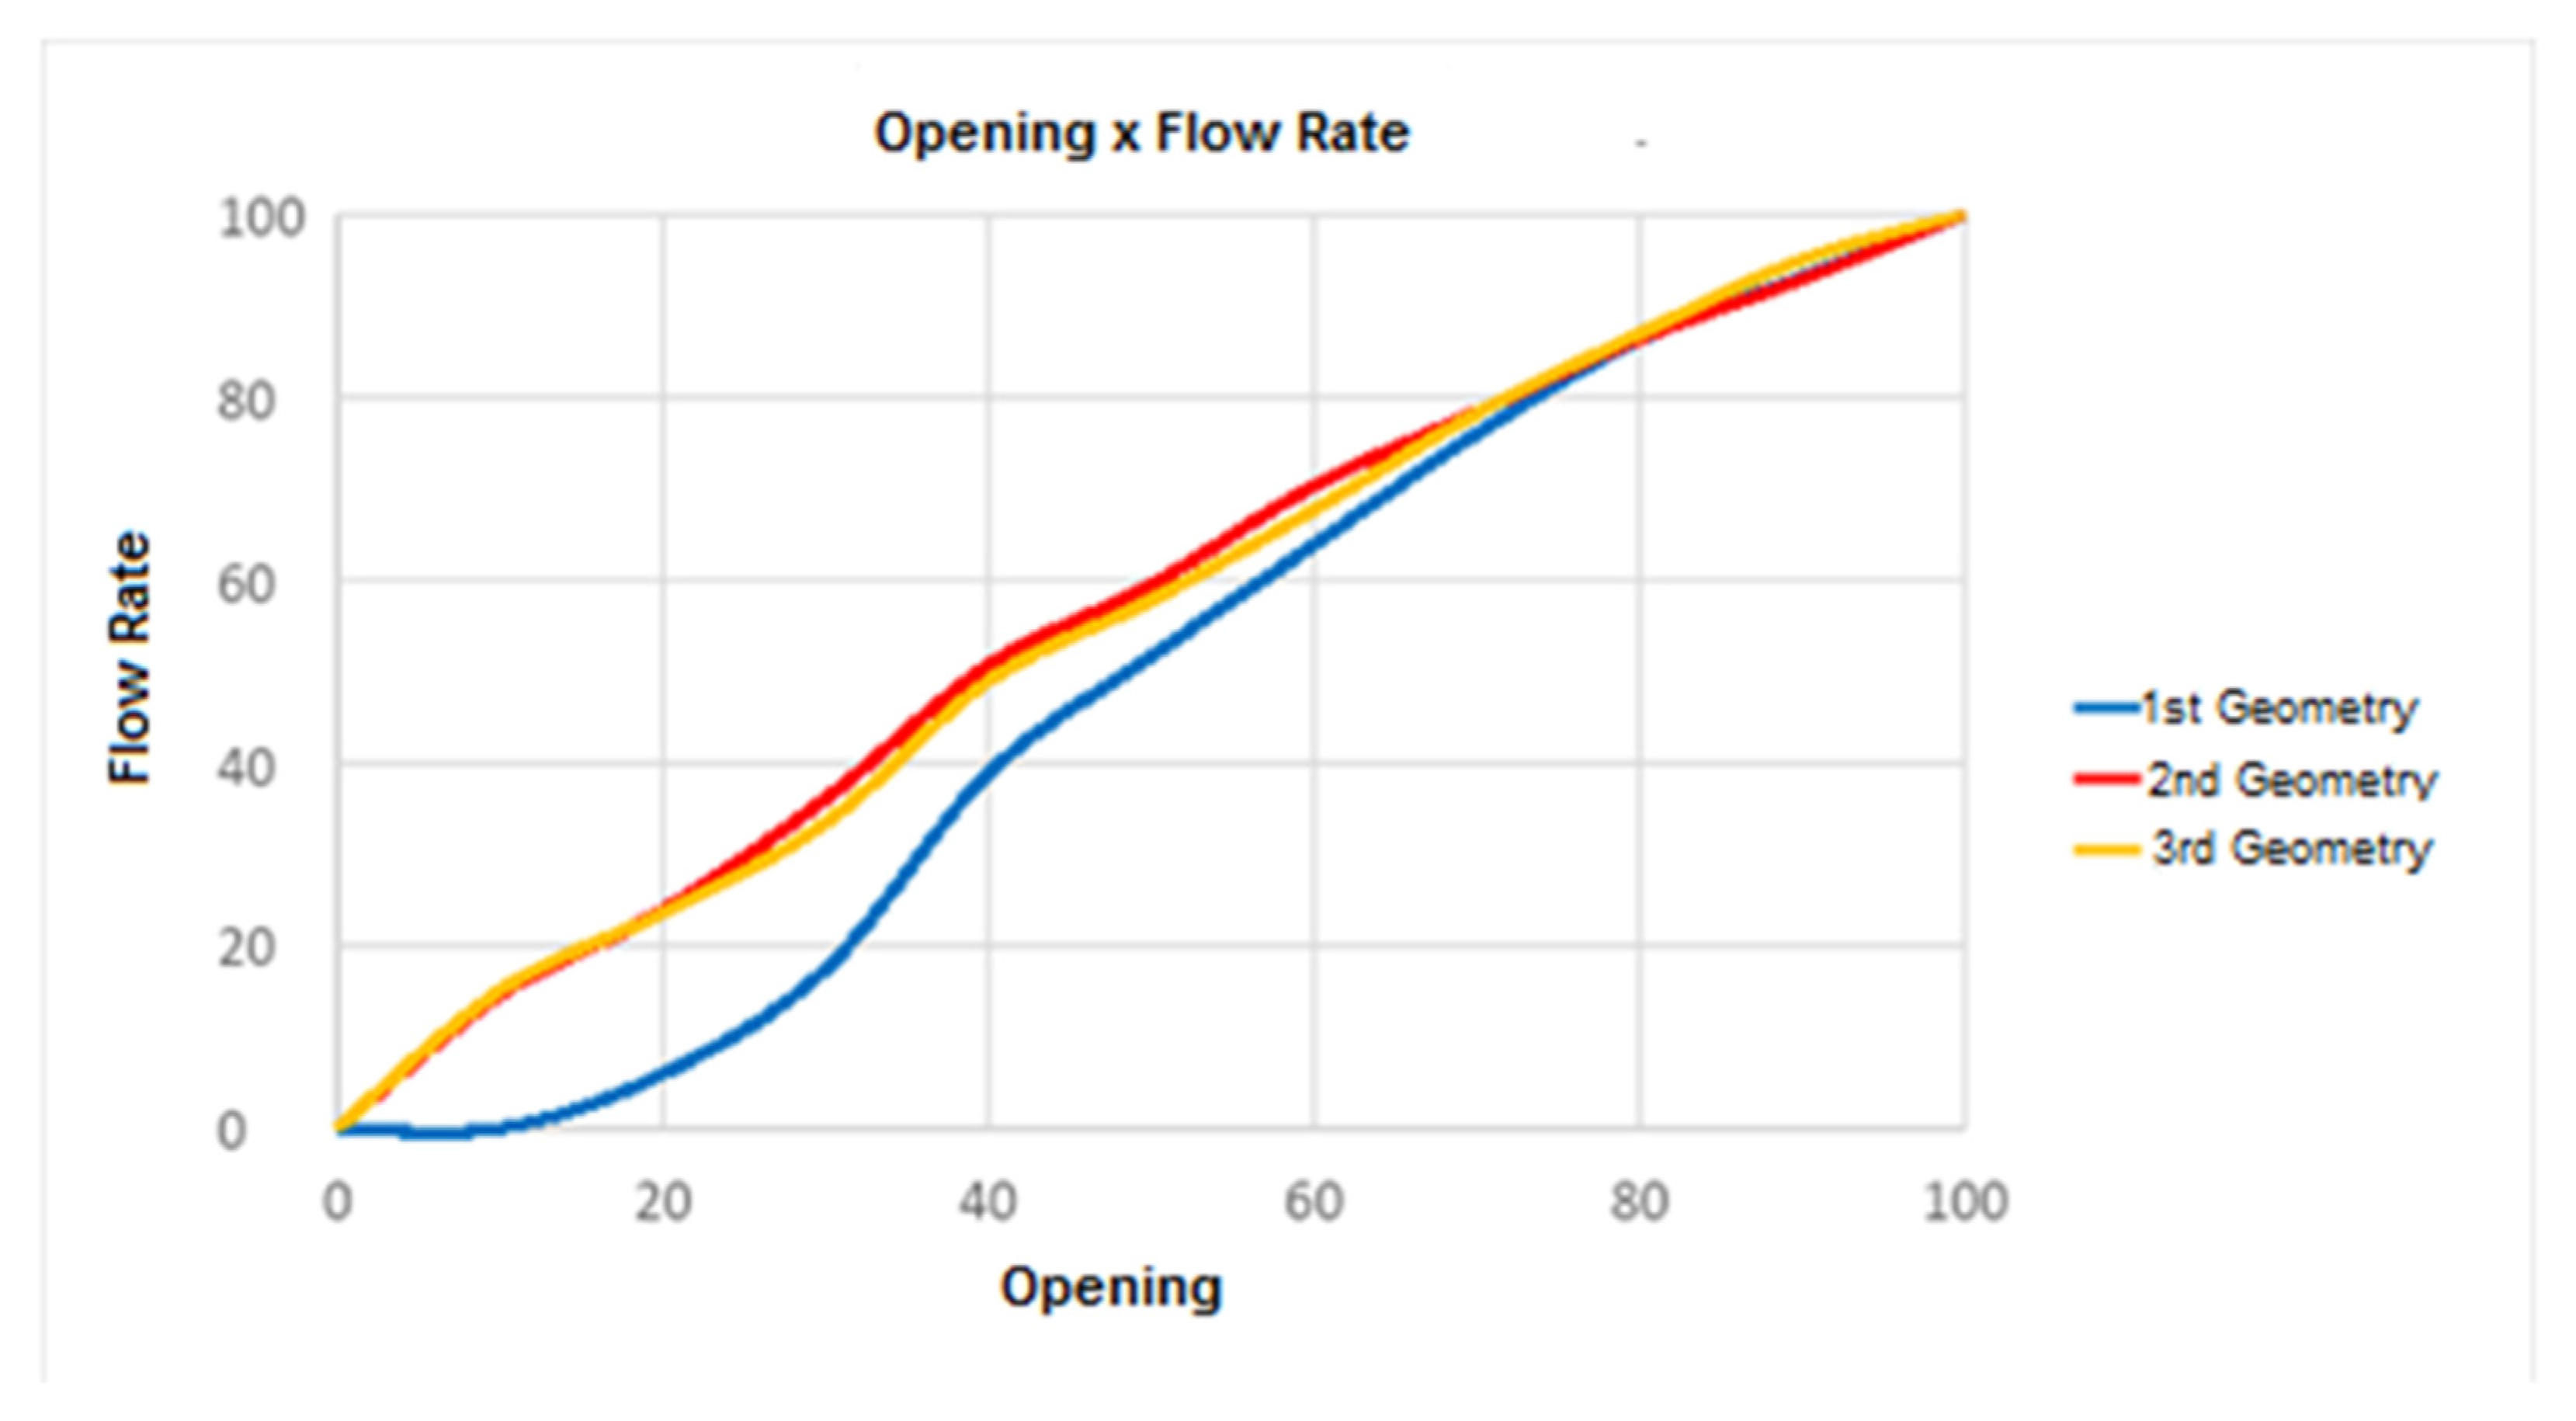
Figure 24 represents the tabulated data graphically.
The results presented in
Table 1,
Table 2 and
Table 3 and in
Figure 24 show that the second and third geometries exhibit similar controllability figures. The simulation performed with the CFD software used fixed pressure and atmospheric pressure at the inlet and outlet of the valve. Thus, the calculated controllability is an inherent characteristic of the valve, i.e., it is isolated from the system in which it operates.
As a result, when laboratory tested, the valve response tends to be different as it will be inserted into a specific hydraulic system. In this work, we wanted to compare the controllability of the three designs. The second and third geometries present good controllability represented by linearity. The use of the third geometry instead of the second one is justified, considering the previous analyses.
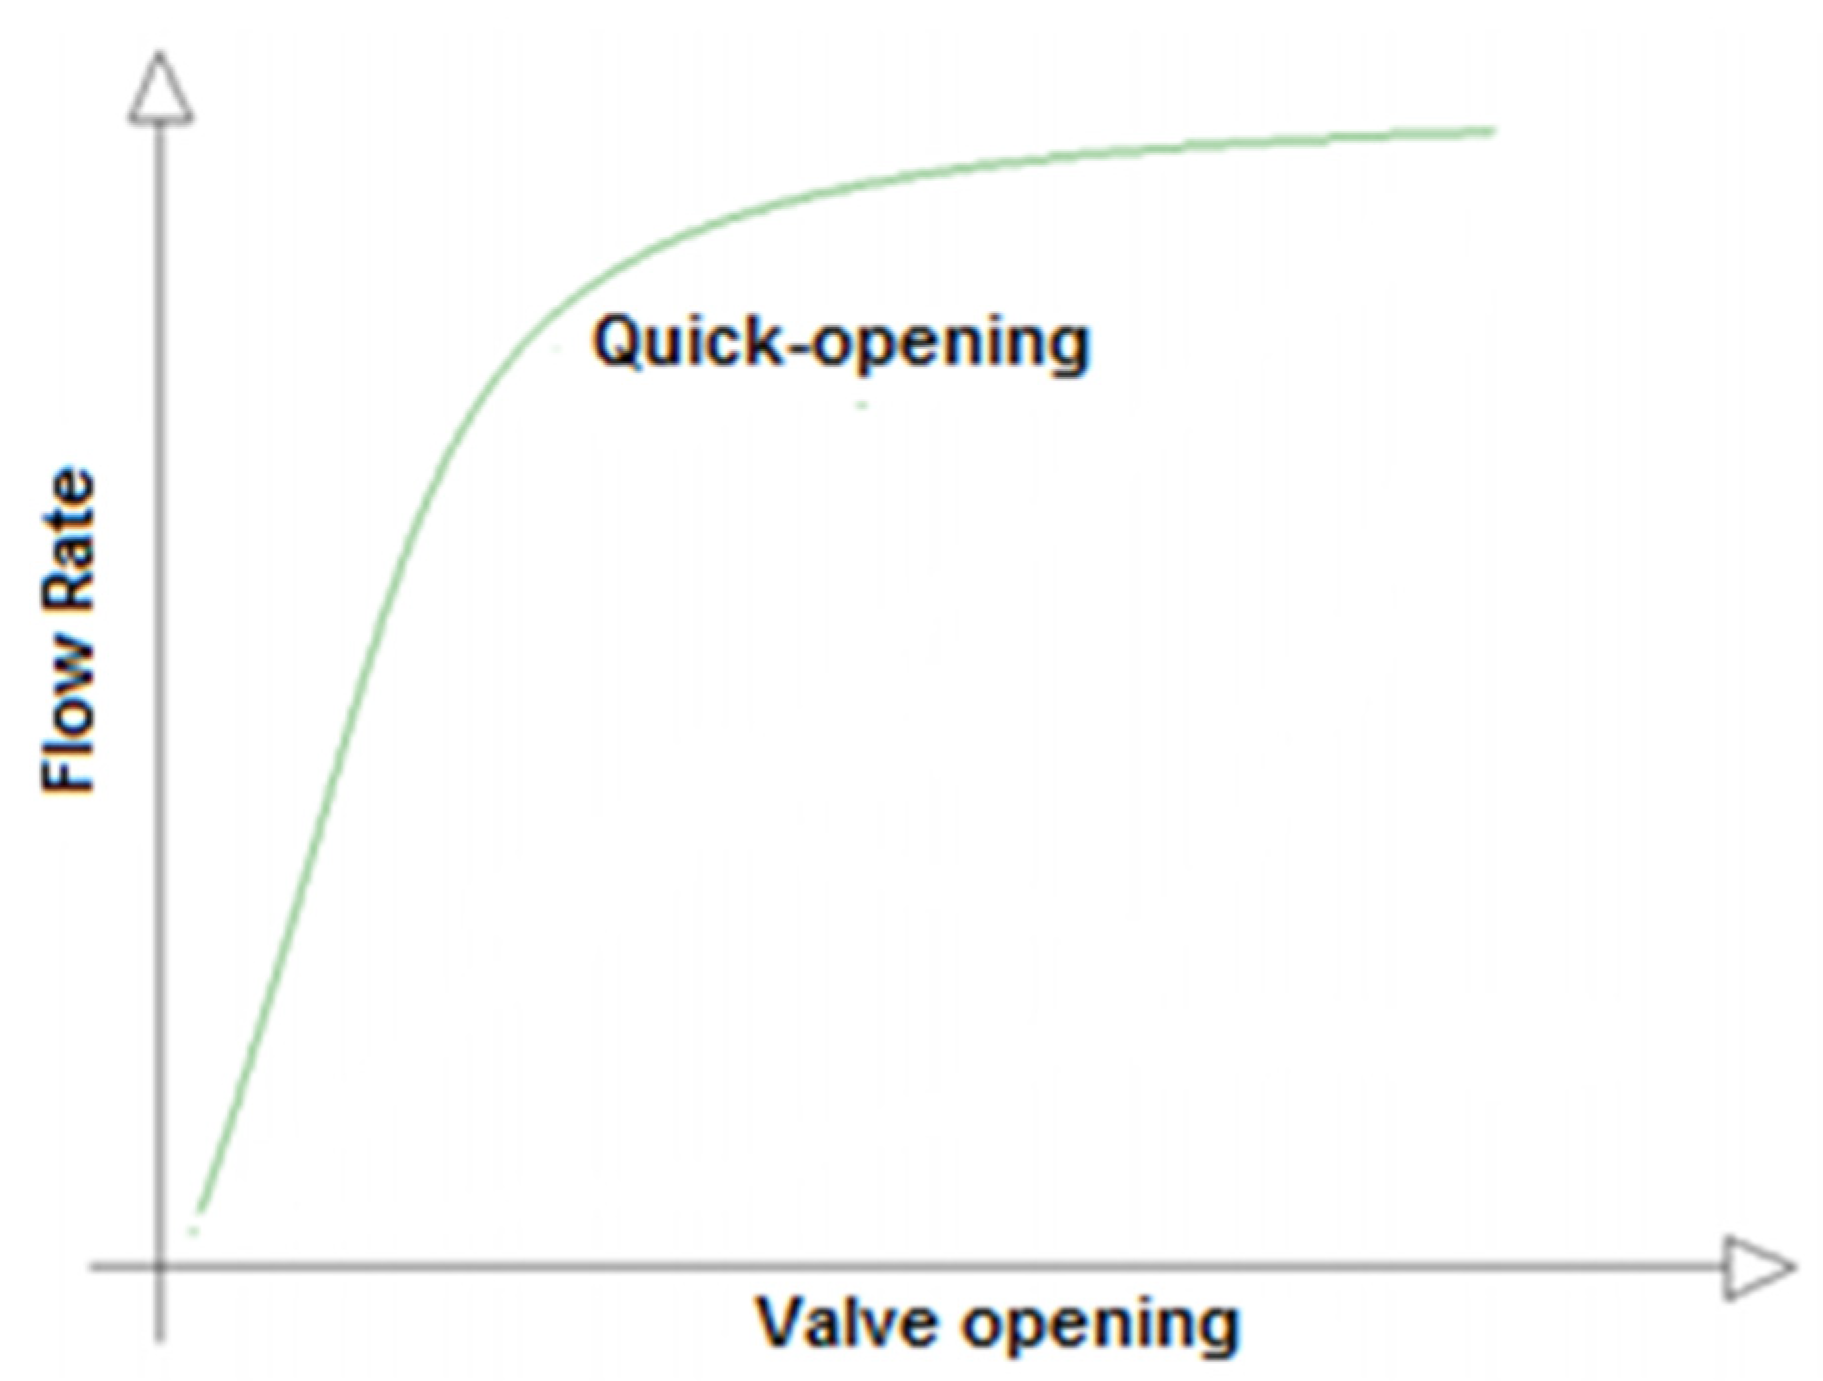
Globe valves used in shower installations are commonly quick-opening.
Figure 25 illustrates the controllability characteristic curve of a quick-opening valve to facilitate this comparison. The difference in flow rate control for a quick-opening globe valve can be seen and compared with the valve tested in this research.
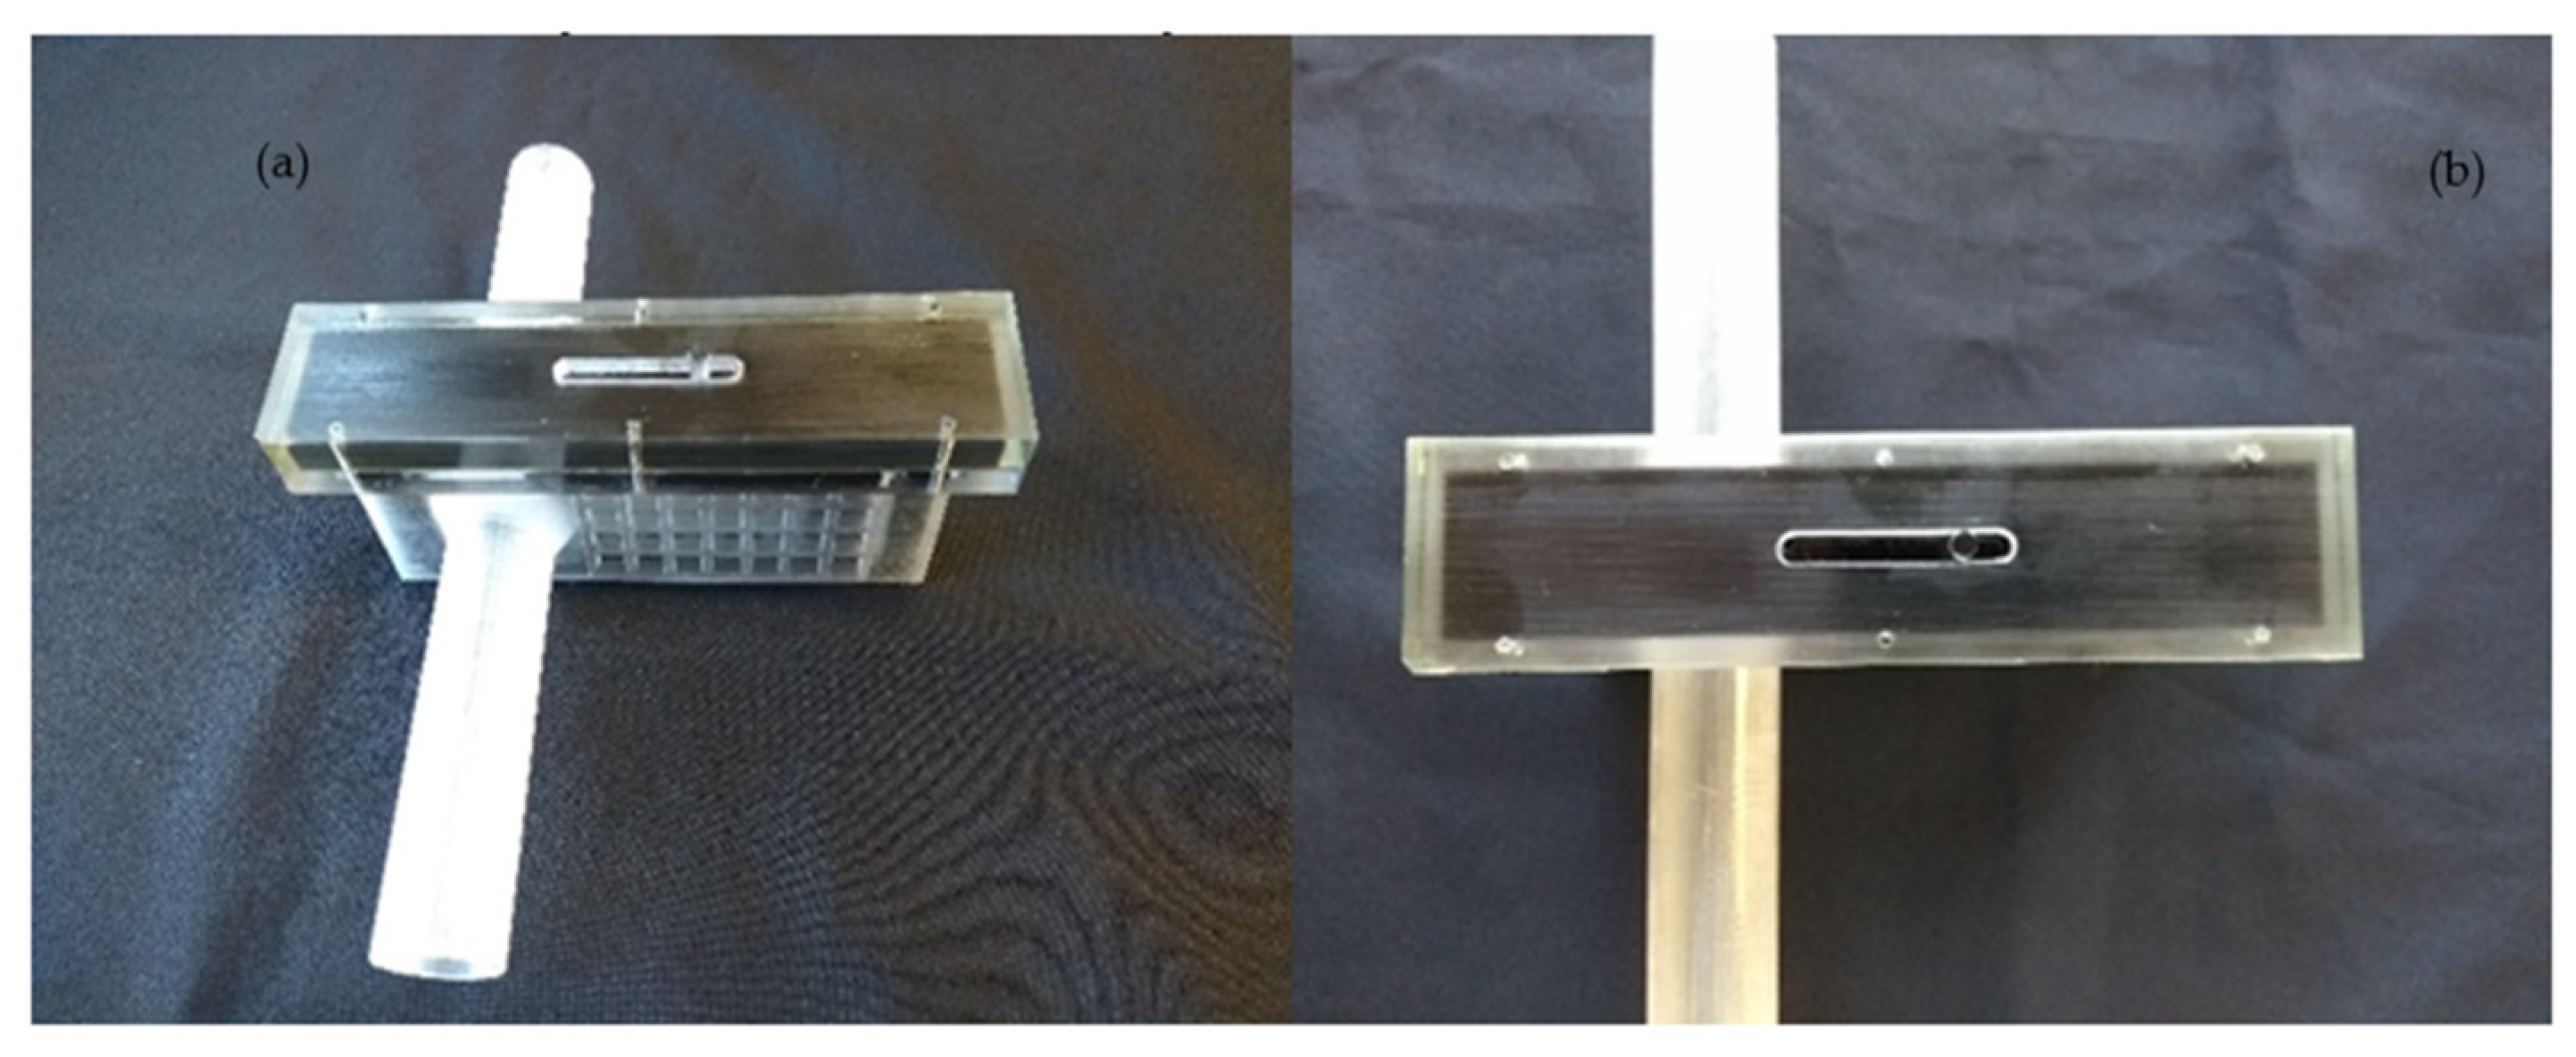
After analyzing the simulations performed using the CFD software, a valve prototype was 3D printed (
Figure 26a,b) so that it could be subjected to physical tests in the hydraulics laboratory.
4. Conclusions
There is still room for advancement in hydraulic valve technologies for building installations that will bring benefits to users and the environment. Thus, three new valve geometries were analyzed. The first geometry we developed did not present a flow when 10% open, and as a result it was improved, generating a second geometry, which presented the desired characteristics of a reduction in the pressure drop coefficient and an improvement in the development of the fluid flow. Using the data from the simulation of the second geometry, a third geometry was created. This third valve geometry is reduced in size and is intended to be incorporated into the valve market. In this third geometry, the head loss coefficient was one third of that typically seen in a conventional globe valve (usually used in installations for showers), according to the literature. The main objective of the CFD analysis was to compare the three valve geometries, avoiding the manufacture of a large number of prototypes and unnecessary testing. The process used to develop the geometry has intrinsic validity, as the CFD calculations were made using the same methodology for each of the three geometries studied. Any errors due to methodology or numerical sources would therefore have affected the three geometries equally.
From the results of the CFD simulations, the valve is also expected to provide precise control, which reduces consumption since maximum flows are not achieved with small openings. On a large scale, this avoids wasting natural resources. Other advantages that directly impact civil construction include the possibility of installation completely embedded in the masonry, resulting in smaller dimensions than other models; frontal access to internal components, facilitating maintenance and preventing the breaking of masonry and coatings; and greater comfort for the user due to the sliding movement used to open or close the valve (rather than the rotary movement used in conventional valves).
Although the efficiency of CFD in evaluating pressure loss has been confirmed in the scientific literature, our results will be confirmed experimentally. The substantial reduction in the pressured drop will encourage the continuation of this project and lead to the manufacturing of the proposed valve, the gathering of experimental measurements, and comparisons with existing valves.

 ,
, 


