
Model-Based Assessment of Preventive Drought Management Measures’ Effect on Droughts Severity


1
IHE Delft Institute for Water Education, P.O. Box 3015, 2601 DA Delft, The Netherlands
2
Department of Water Management, Faculty of Civil Engineering and Geosciences, Delft University of Technology, P.O. Box 5048, 2600 GA Delft, The Netherlands
3
RAS Water Problems Institute, 119333 Moscow, Russia
*
Author to whom correspondence should be addressed.
Water 2023, 15(8), 1442; https://doi.org/10.3390/w15081442
Submission received: 15 February 2023
/
Revised: 20 March 2023
/
Accepted: 1 April 2023
/
Published: 7 April 2023
(This article belongs to the Special Issue Drought Occurrences, Characteristics, Impacts and Mitigations)
Abstract
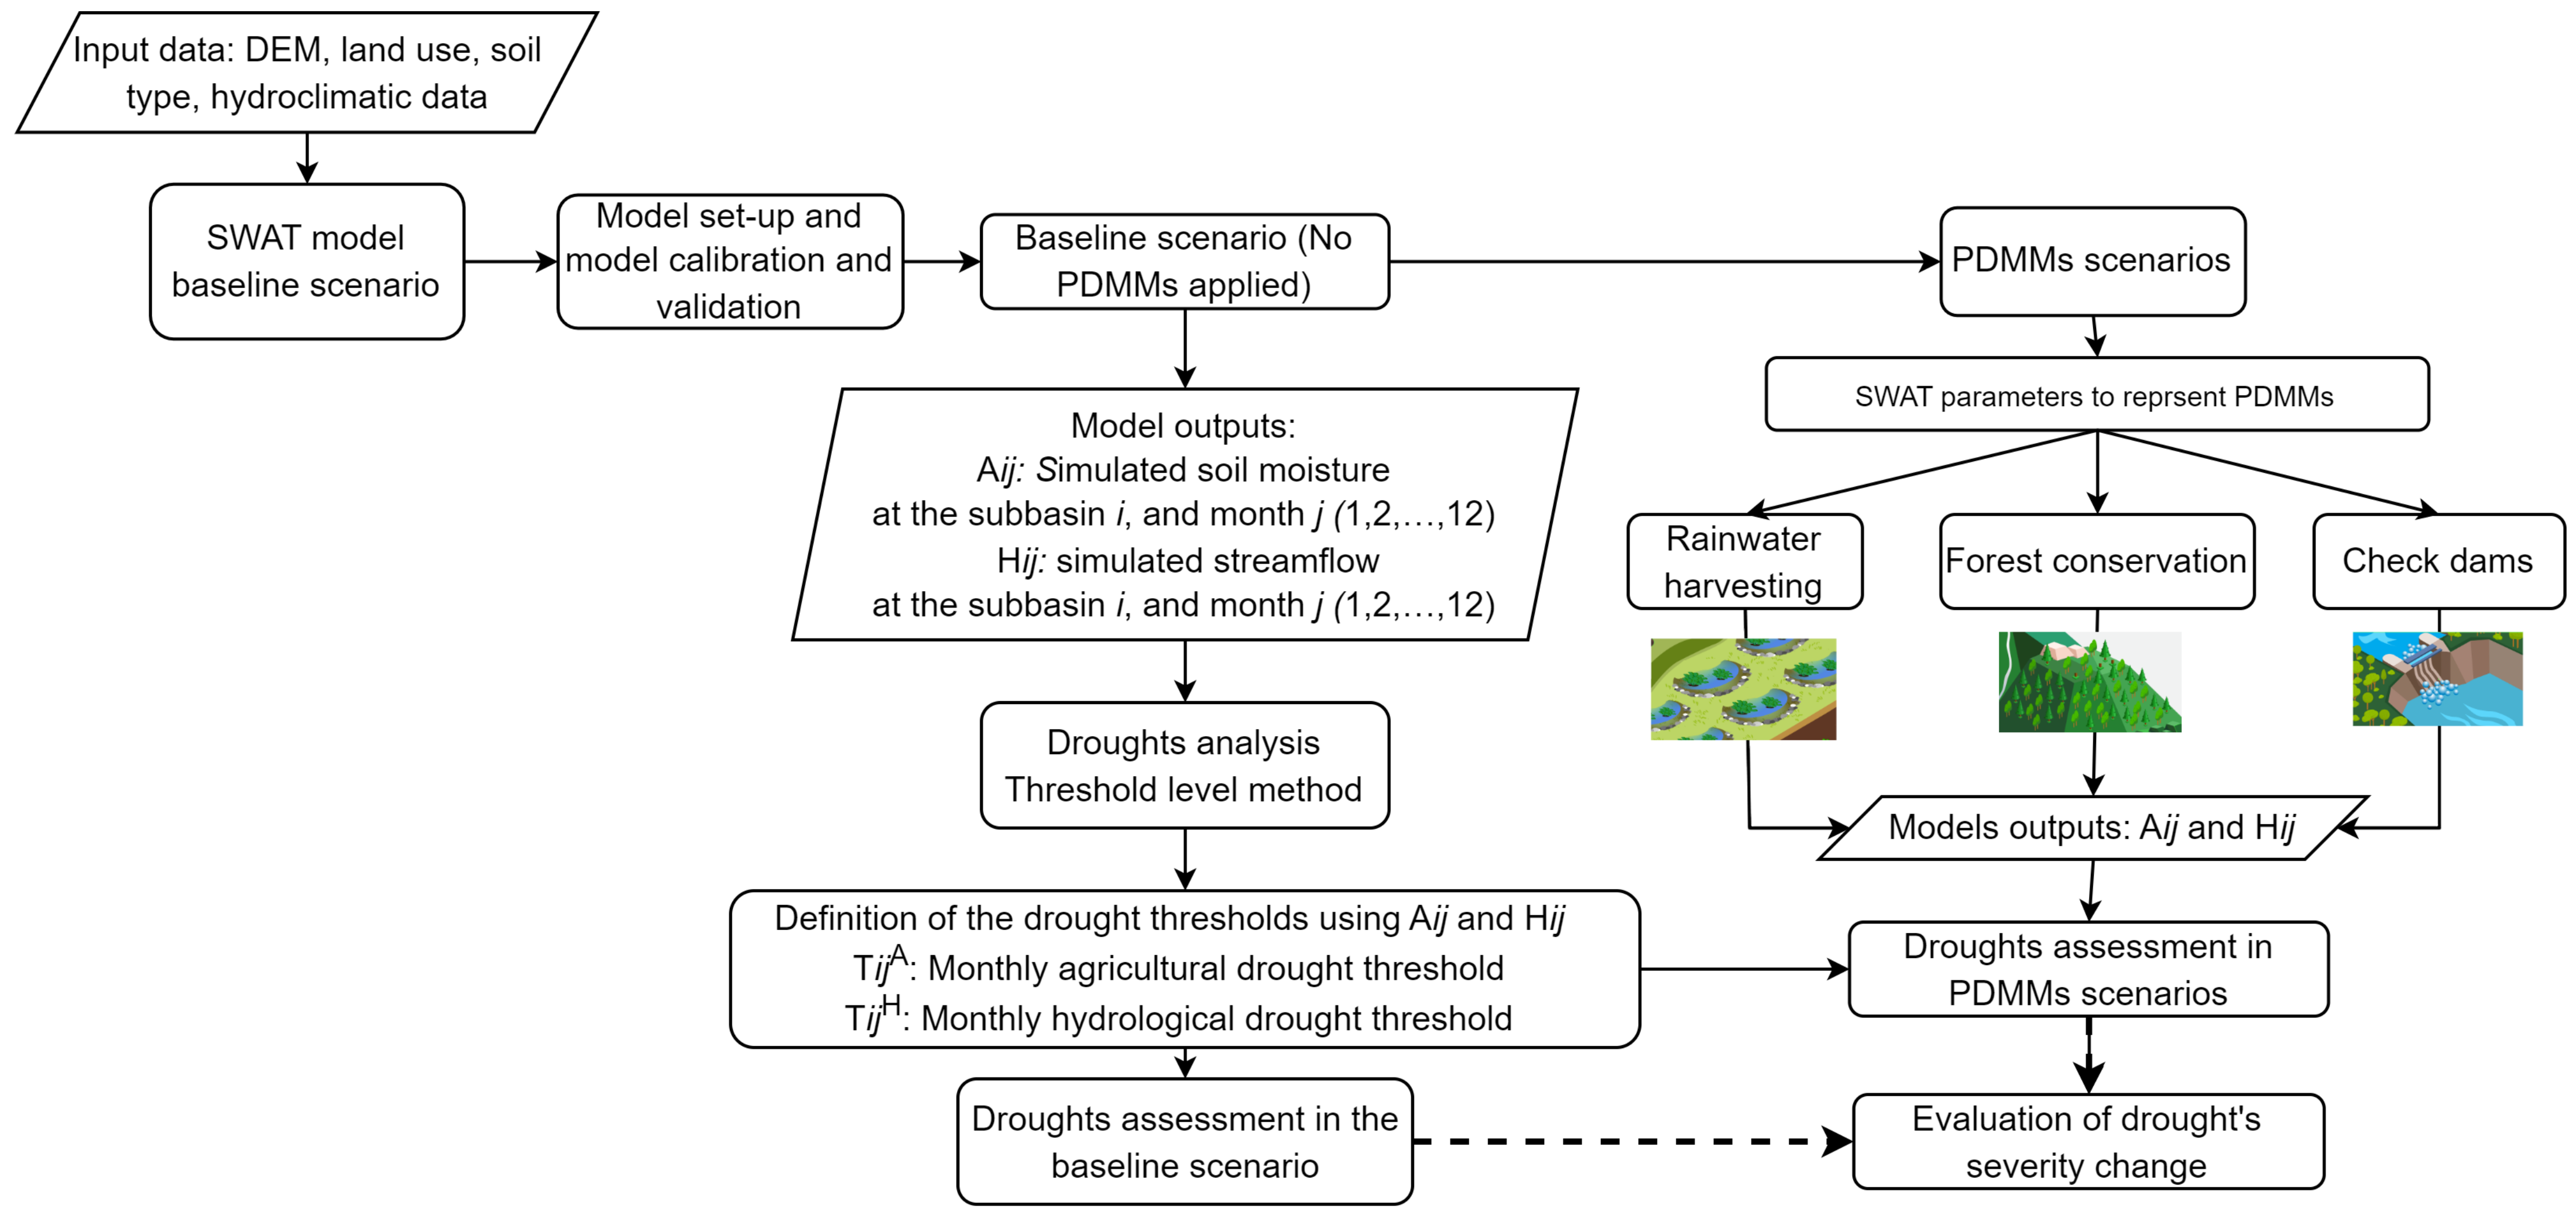
:Preventive Drought Management Measures (PDMMs) aim to reduce the chance of droughts and minimize drought-associated damages. Selecting PDMMs is not a trivial task, and it can be asserted that actual contributions to drought alleviation still need to be adequately researched. This study evaluates the effects of three potential PDMMs, namely, rainwater harvesting ponds, forest conservation, and check dams, on agricultural and hydrological drought severity. The Soil Water Assessment Tool is used for hydrological modeling and representing PDMMs. The threshold level method is applied to analyze droughts and evaluate the impact of PDMMs on drought severity. Findings show that rainwater harvesting ponds applied on agricultural land reduce the severity of agricultural droughts and hydrological droughts, particularly during the first months of the drought events observed in the rainy season. Results also reveal that forest conservation contributes to reducing the severity of hydrological droughts by up to 90%. Finally, check dams and ponds in upstream subbasins considerably reduce agricultural and hydrological drought severity in the areas where the structures are applied; however, they exacerbate drought severity downstream. The analysis was developed in the Torola River Basin (El Salvador) for the period spanning 2004 to 2018.
1. Introduction
Droughts trigger a range of pervasive effects on society, the environment, and the economy. Drought-associated societal impacts include food insecurity and increased social conflict [1]. In terms of environmental damage, droughts can lead to the overexploitation of forests, riverbanks, and groundwater, as well as biodiversity loss [1,2]. For the economy, it is estimated that droughts cause 84% of the agriculture sector’s total economic damage and losses [3] and bring critical losses to multiple economic sectors [4].
Therefore, there is an urgent need to develop drought policies and management plans to alleviate or minimize drought-associated damages. A key element of these policies and plans are the Preventive Drought Management Measures (PDMMs), also known as the Strategic Drought Management Measures or Drought Risk Reduction Measures [5,6]. These measures aim to reduce social, environmental, and economic vulnerability to droughts [5,7], and they are developed and applied before the drought occurs [8]. PDMMs can be classified into two main categories: short-term actions and long-term actions. Both types consist of technical and regulatory measures [7,9]. This study analyzes long-term technical measures.
A wide range of measures can be considered PDMMs. For instance, the United Nations World Water Assessment Program includes rainwater harvesting (RWH), gully control structures and terraces, and nonstructural interventions such as soil conservation practices and forest conservation [10]. The Global Water Partnership Central and Eastern Europe [11] encourages the use of natural water retention measures (NWRM), such as floodplains and wetlands restoration, to limit the adverse effects of droughts. Together with the previous measures, the United Nations Convention to Combat Desertification [12] presented and assessed 14 categories of drought-smart land management practices in four land-use types (agriculture, grazing, forests and woodlands, mixed land use).
Despite the broad list of interventions applicable to drought management, the actual contribution of PDMMs to drought mitigation or alleviation remains to be determined. While some interventions have been widely applied to local initiatives, they are rarely part of a structured drought management plan. As such, there is very little coordination to guarantee their operation in the long term, and PDMM performance for drought mitigation is hardly ever assessed. Consequently, local measures are not appropriately informed by knowledge of a region’s drought likelihood and potential impacts on the hydrological cycle [1,13].
Of equal importance is the lack of studies that examine the applicability and effectiveness of PDMMs in alleviating drought. Assessment of these measures relies on their applicability to increase infiltration and water availability, improving soil water-holding capacity and preventing land degradation or desertification [10,12]. While these criteria provide valuable insights into the applicability of these measures, they do not explicitly appraise their effectiveness in alleviating drought’s characteristics (e.g., duration, spatial extent, severity).
Therefore, the key question is: How should the contribution of PDMMs to drought alleviation be assessed? To address this, the present study applies a modeling-based approach to assess changes in agricultural and hydrological drought severity after applying three potential PDMMs: RWH ponds on agricultural lands, forest conservation in forested areas, and ponds and check dams in upstream subbasins.
2. Materials and Methods
This study used the soil and water assessment tool (SWAT) for hydrological modeling and to represent the PDMMs. The threshold level method was used to assess the effects of PDMMs on drought’s severity. Figure 1 presents the flowchart of the methodology applied.
2.1. Case of Study
The Torola River Basin is a transboundary basin between 88°22′ W 88°16′ W and 13°50′ N 13°53′ N latitude (Central America). The basin is located within the Central America Dry Corridor, a drought-prone area threatened by erratic seasonal rainfall patterns and increasing temperatures [14]. It has an area of 1575 km2, distributed between Honduras (557 km2) and El Salvador (1018 km2). This study was conducted in the area that corresponds to El Salvador.
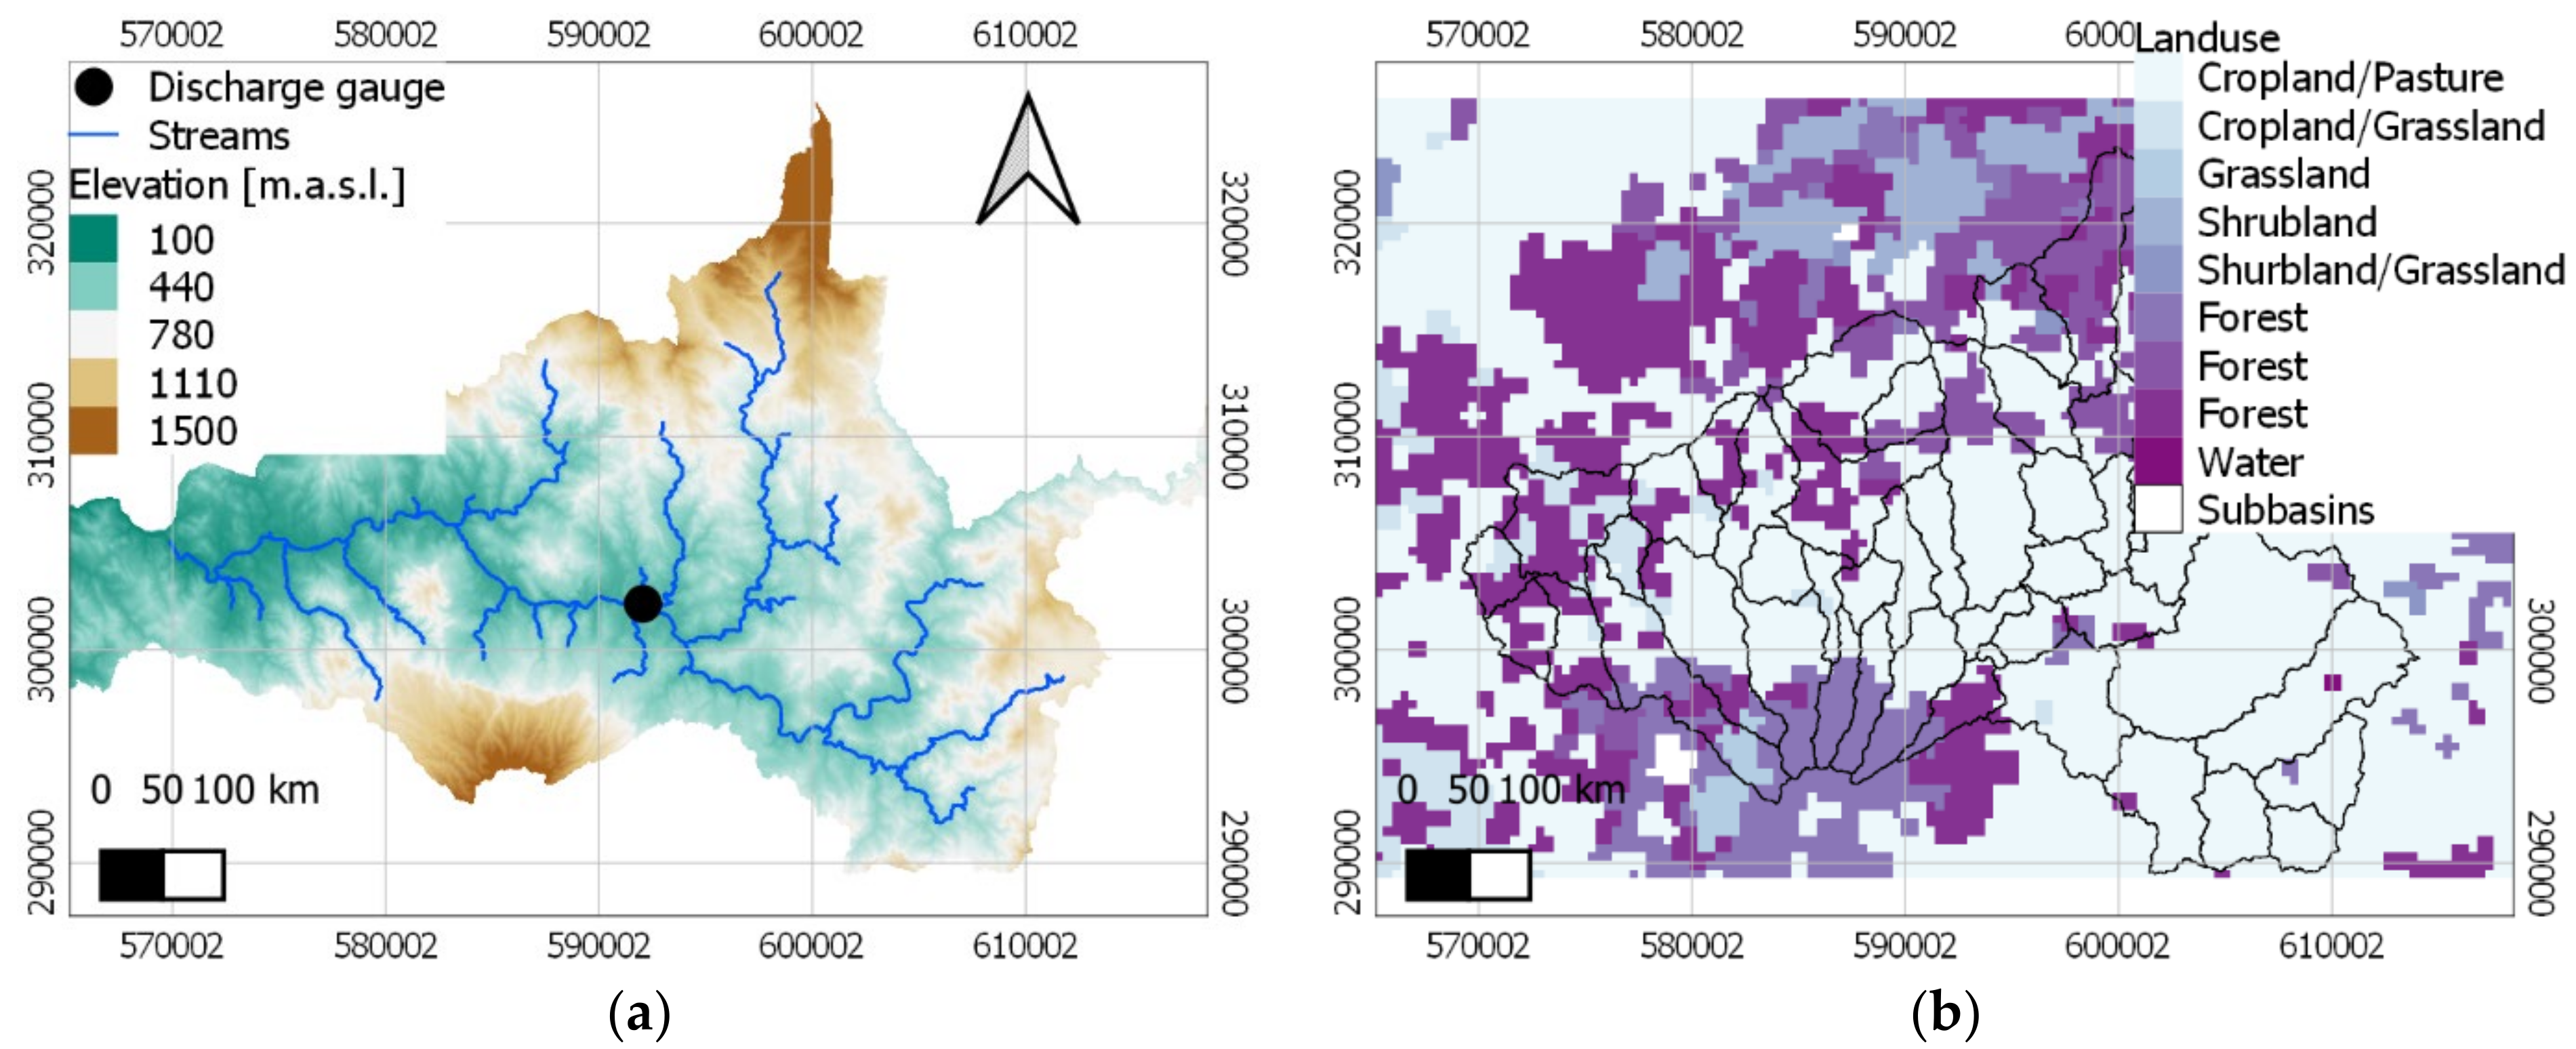
The basin’s topography is characterized by steeply sloped mountains, with elevations ranging from 100 m above sea level (masl) to 1450 masl. Sandy-loam soil is the most common soil type in the basin. These soils tend to have low water-holding capacity. The predominant land use is agriculture, particularly subsistence crops such as corn, beans, and sorghum. Forest covers around 30% of the basin and is concentrated mainly in mountainous areas above 1100 masl.
The basin has a tropical savanna climate. Temperatures range from 19 °C to 23 °C in the mountainous areas and from 25 °C to 30 °C in lower-altitude regions. Annual rainfall varies from 1900 to 2700 mm, and the mean annual evapotranspiration is 1000–1100 mm [15,16]. The annual rainfall pattern is characterized by a dry season from November to April, followed by a rainy season from May to October. The intermediate period of decreased precipitation from July to August is known as the “mid-summer drought” [17]. The main rainfall events occur in May and September, with a 363 mm and 401 mm monthly average, respectively.
The basin’s river system comprises the Torola River and its tributaries. At the Osicala station (discharge gauge in Figure 2 the mean streamflow is 30 m3/s, and the minimum discharge is 0.9 m3/s.
2.2. Hydrological Modeling
2.2.1. Model Setup
SWAT with a QGIS 3 extension was used to develop the Torola watershed model. SWAT was developed by the Agricultural Research Service of the United States Department of Agriculture (ARS-USDA). It is a continuous-time, semidistributed, process-based river-watershed-scale model designed to simulate the quality and quantity of surface and groundwater and predict the environmental impacts of land use, land management, and climate change [18]. The entire basin area up to the selected outlet point is divided into subbasins. Each subbasin is further divided into a number of hydrological response units (HRUs), which are land areas within the subbasin with common combinations of land cover, soil type, and slope [19].
The model was built for the period spanning 2004 to 2018. The Torola basin was divided into 44 subbasins with a median area of 15 km2. Four slope classes were set for the HRUs generation: gentle (0–10%), moderate (11–20%), steep (21–30%), and considerable steep (>31). The following methods were used to model the major hydrological processes: the soil conservation services-curve number (SCS-CN) was used to simulate surface runoff; potential evapotranspiration was calculated using the Hargreaves method; and water was routed through the channel network using the variable storage routing method. The details and sources of the SWAT model input data are presented in Table 1.
2.2.2. Model Sensitivity Analysis and Calibration
This study used the SWAT-CUP software package with the Sequential Uncertainty Fitting version 2 (SUFI-2) for model global sensitivity analysis, calibration, and validation. In SUFI-2, parameter sensitivities are determined following a multiple regression approach, which regresses the Latin hypercube generated parameters against the objective function values [22]. The sensitivity analysis calculates the t-test and p-values of each parameter to evaluate its relative sensitivity and significance to other parameters. A high t-test and low p-value indicate that the parameter significantly affected the model output. The most sensitive parameters are employed in the calibration process to optimize the objective functions [19].
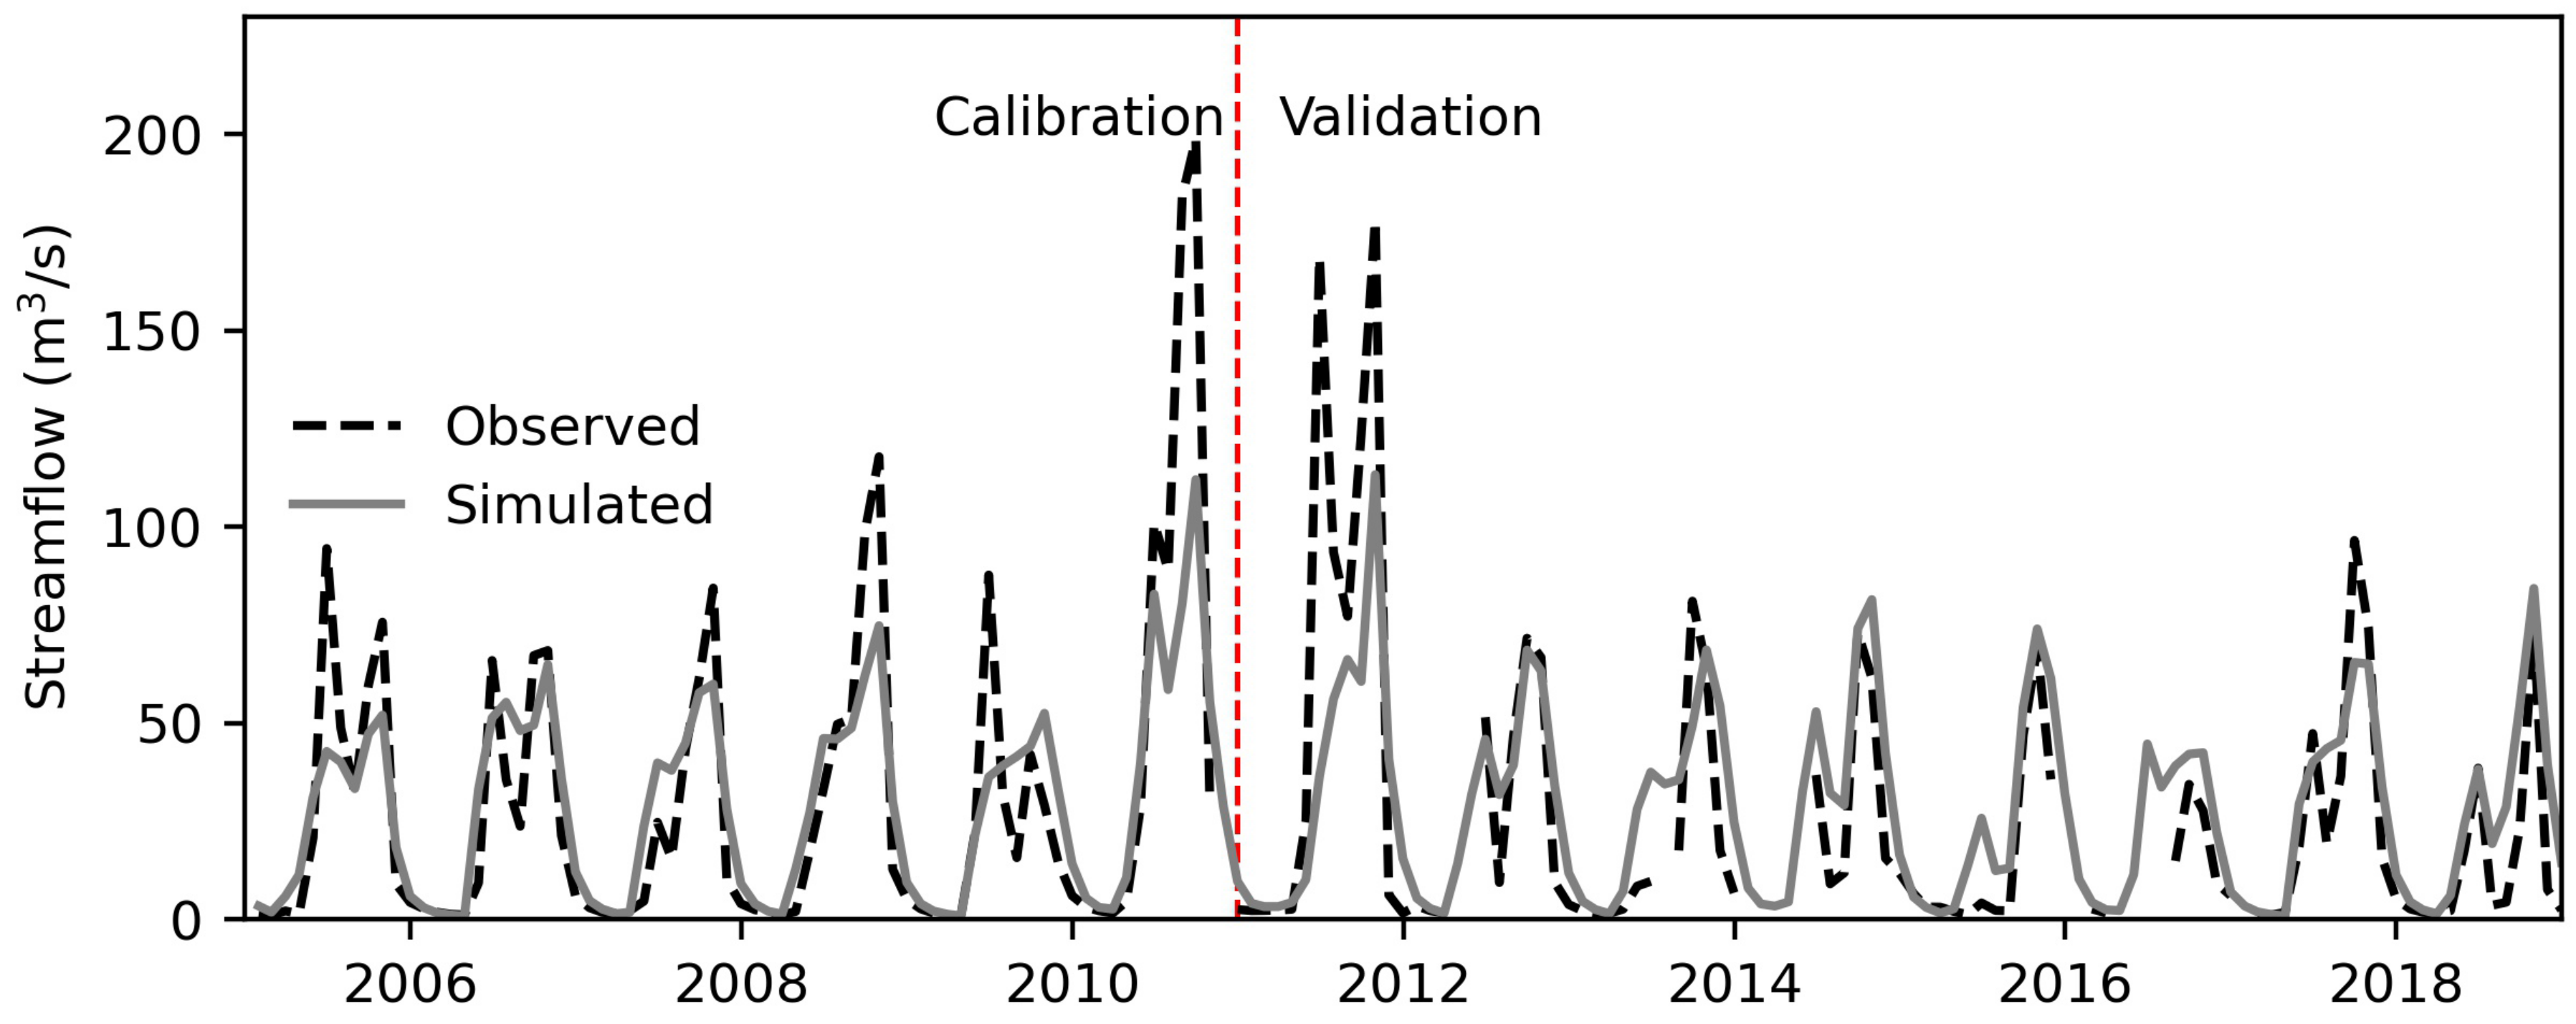
Monthly automatic calibration and validation were conducted to evaluate the model’s performance in simulating streamflow. The model was calibrated from 2004 to 2010 and validated from 2010 to 2018. In both cases, the first year was used as a warming-up period. Thus, performance indicators were calculated for 2005 to 2010 (calibration) and 2011 to 2018 (validation).
The model was evaluated using the Nash–Sutcliffe Efficiency (NSE) and the percent bias (PBIAS), Equations (1) and (2).
where is the observed data, is the predicted data, is the mean of the observed data, and is the number of observations during the simulation period.
The NSE represents a dimensionless indicator ranging from −∞ to 1, with 1 representing the perfect match between the observed and simulated values [23]. The PBIAS measures the average tendency of the simulated values to be larger or smaller than the observed values. A low PBIAS magnitude indicates an accurate model simulation [23].
2.2.3. Modeling PDMMs
Table 2 presents the evaluation criteria to identify suitable interventions for drought management in the study area. Evaluation criteria included intervention requirements for an adequate operation, compatibility with the basin’s land use, and availability of parameters to model the intervention. Applying the criteria and comparing these requirements with the basin characteristics, RWH ponds in agricultural land, forest conservation in forested areas, and check dams in upstream subbasins were selected to assess their effectiveness for drought management. The last row of Table 2 shows measures allocation (subbasins highlighted in grey).
The first measure RWH ponds, traps, and collects runoff from a relatively small catchment area (10–500 m2) [24]. The RWH ponds were modeled in the SWAT model using the pothole routine. Potholes are water bodies located off the main channel, and water flows to them from the subbasin [18]. The potholes were applied at the HRU level, wherein the user indicated the fraction of flow from the upland HRUs that contributed to the pothole HRU and the maximum water depth over the entire HRU [35]. The storage capacity of that pothole was given by the area of each HRU multiplied by the maximum water depth. As there could be only one pothole in each HRU, for the present study the sequence of the RWH pond’s storage capacity was aggregated into one pothole [32].
The second measure was conserving forested areas, which aims to maintain forest cover and limit soil degradation to slow runoff and increase infiltration and groundwater recharge. Such actions include forest regeneration, species diversity, and unevenly aged stands [25]. In the SWAT model, the CN2 value of forested HRUs could be reduced from the calibrated value to the recommended value for forested areas in good hydrological conditions. In the present study, the CN2 value was modified according to the HRU’s hydrologic soil group [33]
The final measure, check dams, are small barriers constructed across channels or gullies to obstruct flow. These structures store floodwater and allow more time for water percolation to recharge aquifers, among other purposes [26,36]. Check dams were simulated in the SWAT model as ponds [37]. The SWAT model defined ponds as water bodies located off the stream network that only receive loadings from the subbasin’s HRUs. Predicted runoff from the HRUs was aggregated and routed into ponds, regardless of the pond’s location in the subbasin [34]. The required inputs were the pond’s storage capacity and surface area.
2.3. Applying the Threshold Level Method to Analyze the Effect of PDMMs on Drought Severity
Drought severity was calculated separately for the baseline and PDMMs scenarios to assess the PDMMs’ effectiveness in alleviating drought. The severity change was estimated by comparing the severity in the baseline scenario to the severity in the PDMMs scenarios.
The threshold level method was applied to calculate drought severity. Per this methodology, a drought is a sequence of intervals (days, weeks, months) in which a variable of interest (e.g., precipitation, soil moisture, or streamflow) remains below a set threshold (). Generally, the threshold lies between the distribution’s fifth and thirtieth percentiles [38,39,40]. Each drought event can be characterized by its duration, spatial extent, and severity, among other characteristics [41]. In this study, simulated soil moisture represented agricultural droughts, simulated streamflow represented hydrological droughts, and severity was the characteristic of interest.
2.3.1. Setting the Thresholds to Identify Droughts
This study used the SWAT model outputs, namely, soil moisture and streamflow, to calculate agricultural and hydrological drought thresholds, respectively. SWAT results obtained on the subbasin level allowed us to evaluate the drought severity at each subbasin and assess the differential effect of the mitigation measures in upstream and downstream subbasins.
The simulated soil moisture at the subbasin and month in the baseline scenario was used to set the monthly threshold . This corresponded to the twentieth percentile of . Similarly, the daily simulated streamflow in the baseline scenario was used to set the monthly threshold . It corresponded to the twentieth percentile of .
Notably, the monthly threshold calculated in the baseline scenario was used to identify droughts and calculate severity in the baseline and PDMM scenarios. This approach allowed the researchers to set a threshold that represented the region’s drought status and estimate changes in drought severity after applying the PDDM.
2.3.2. Identifying Drought Events and Calculating Drought Severity
The agricultural drought state was assumed to occur in a subbasin when the monthly simulated soil moisture remained below the set threshold . Similarly, the hydrological drought state was assumed to occur in a subbasin when the monthly simulated streamflow fell below the set threshold . In both cases, a drought state began when the variable of interest fell below the threshold () and continued until it exceeded the threshold again (). To classify a drought state in a subbasin ( at time step of a drought event, it had to be followed or preceded by a month of drought conditions. Equations (3) and (4) indicate the procedure applied to identify agricultural and hydrological drought conditions during the simulation period:
where and were binary variables indicating the droughts state per subbasin at time ; and represented the soil moisture and the streamflow in the subbasin ( at time step ; and and were the set thresholds.
After identifying the drought state per subbasin, we summed the area of the subbasins in drought condition at each time step. Then, the drought events during the period of analysis were identified. A drought (agricultural or hydrological) event was assumed to occur in the basin when at least 30% of the basin area was in a moderate drought category at the same time step (in this study month). We opted for setting a spatial extension minimum threshold, considering droughts usually extend regionally [42]. Setting a minimum spatial threshold prevented a reduced number of subbasins experiencing water scarcity, or periods of water shortage were considered drought events.
After identifying the drought events, Equations (5) and (6) were applied to calculate their duration:
where was the duration of the agricultural drought was the duration of the hydrological drought ; was the end of the drought event; and was the time step (in this study: 1 month).
The agricultural and hydrological drought severity at each subbasin were estimated using Equations (7) and (8):
where represents the deviation from the threshold at the subbasin at time step ( (in mm), and represents the deviation from the threshold at the subbasin ( at time step ( (in mm d−1).
2.3.3. Estimating Changes in Drought Severity
Equations (9) and (10) were used to estimate changes in drought severity after applying the PDMMs:
where is the change in agricultural drought severity (%) in the subbasin () at time step (; is the change in hydrological drought severity (%) in the subbasin () at time step ; is the baseline scenario; and is the PDMM scenario. A positive value indicates a decrease in drought severity compared to the baseline scenario, and a negative value represents the worsening of drought severity.
3. Results and Discussion
3.1. Sensitivity Analysis and Model Calibration
Table 3 presents the top 10 most sensitive parameters from the model setup. These parameters are used for model calibration and validation. The NSE is 0.73 for calibration and 0.62 for validation, and the PBIAS is 6.7% for calibration and −7.6% for validation. According to Moriasi et al. [23], the model performance is considered appropriate for simulating streamflow.
Figure 3 shows the model’s performance at Osicala station. Although peak discharges are underestimated in specific years of the calibration and validation periods, the overall performance of the SWAT model is acceptable for simulating streamflow.
3.2. Agricultural and Hydrological Droughts in the Baseline Scenario
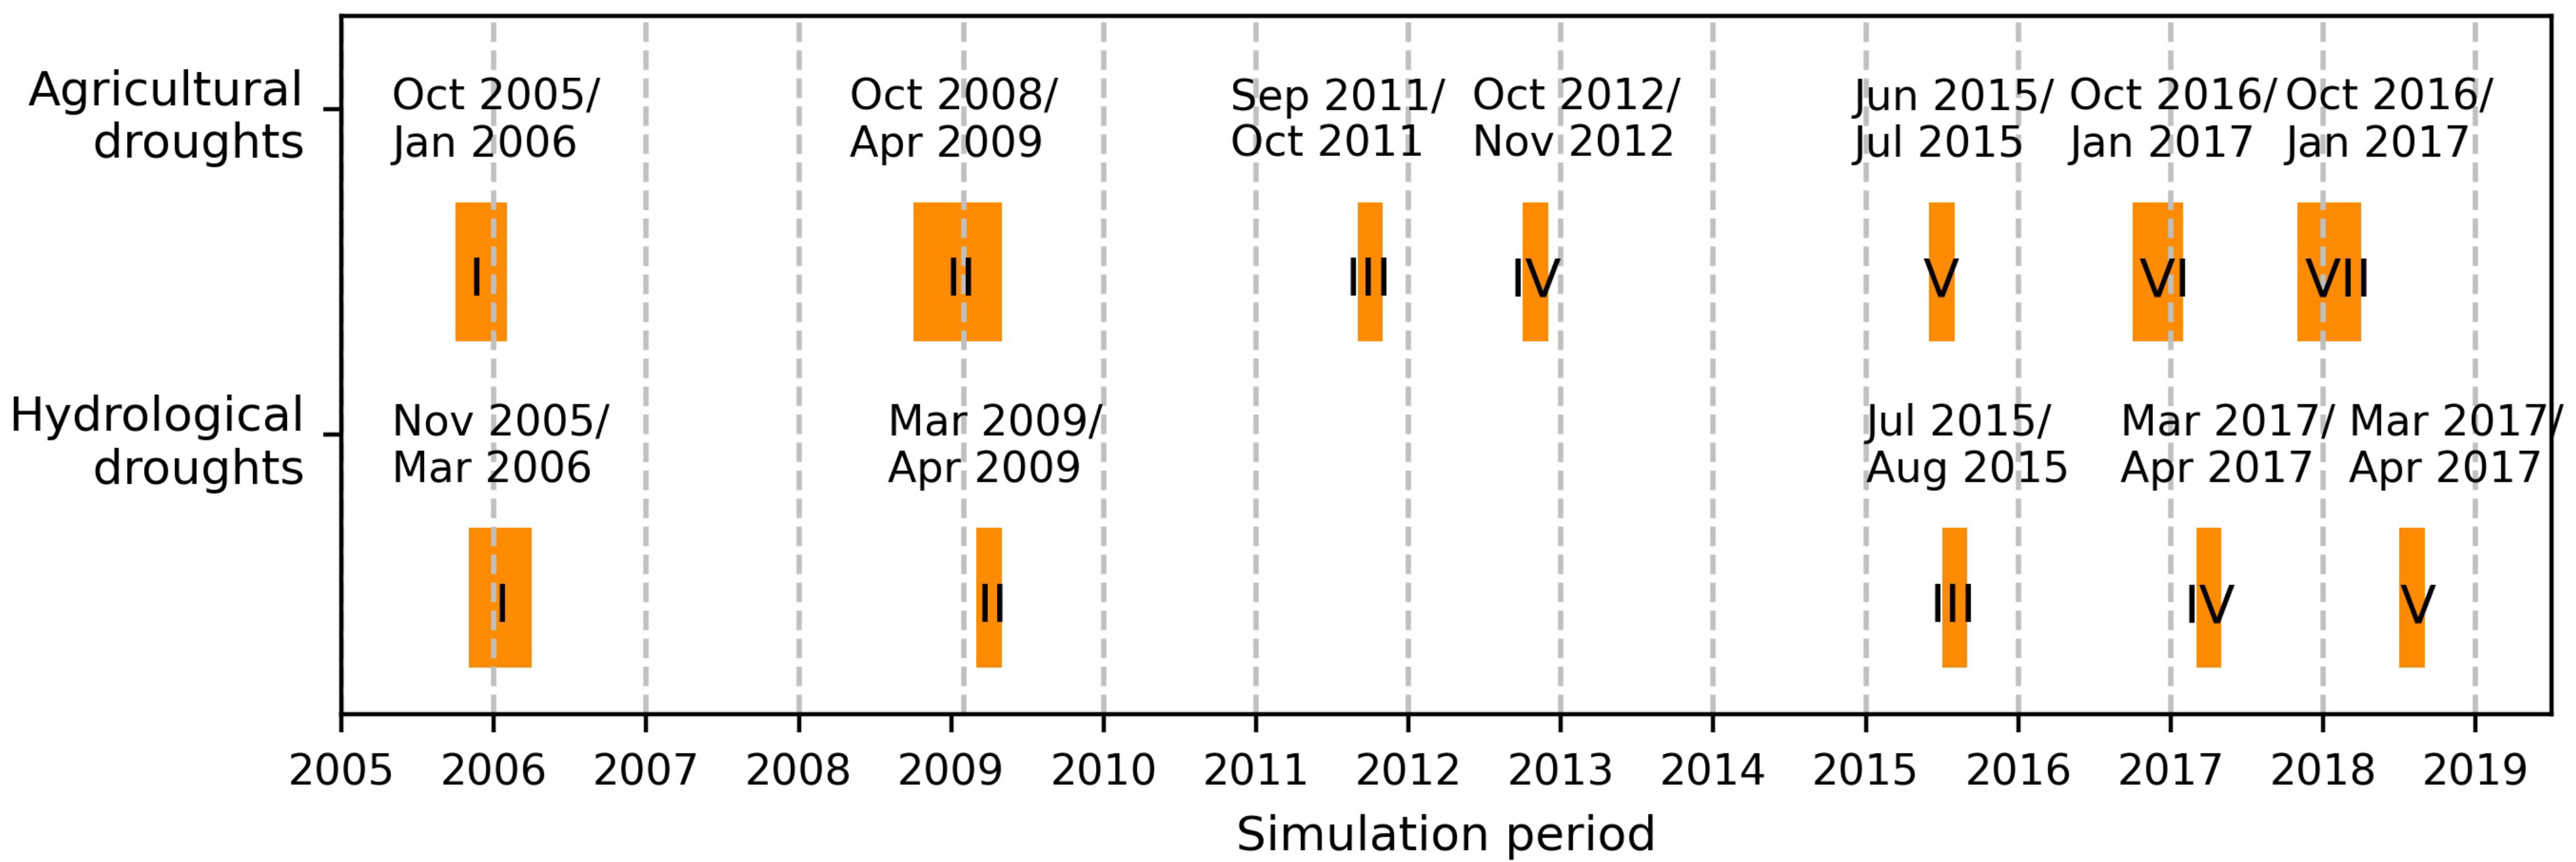
Applying the methodology presented in Section 2.3, seven agricultural droughts and five hydrological droughts were identified during the simulation period Figure 4. shows the timeline of the drought periods. Agricultural drought events are named from I to VII, and hydrological drought events are named from I to V. The events are consistent with the drought chronology in the region [43], and are in line with previous studies that indicated that between 2015 and 2019, the region experienced a multiyear meteorological drought, one of the main drivers of agricultural and hydrological droughts [17,44]. According to the results, in the simulation period (15 years) are observed 26 months in agricultural drought condition and 14 months in hydrological drought condition.
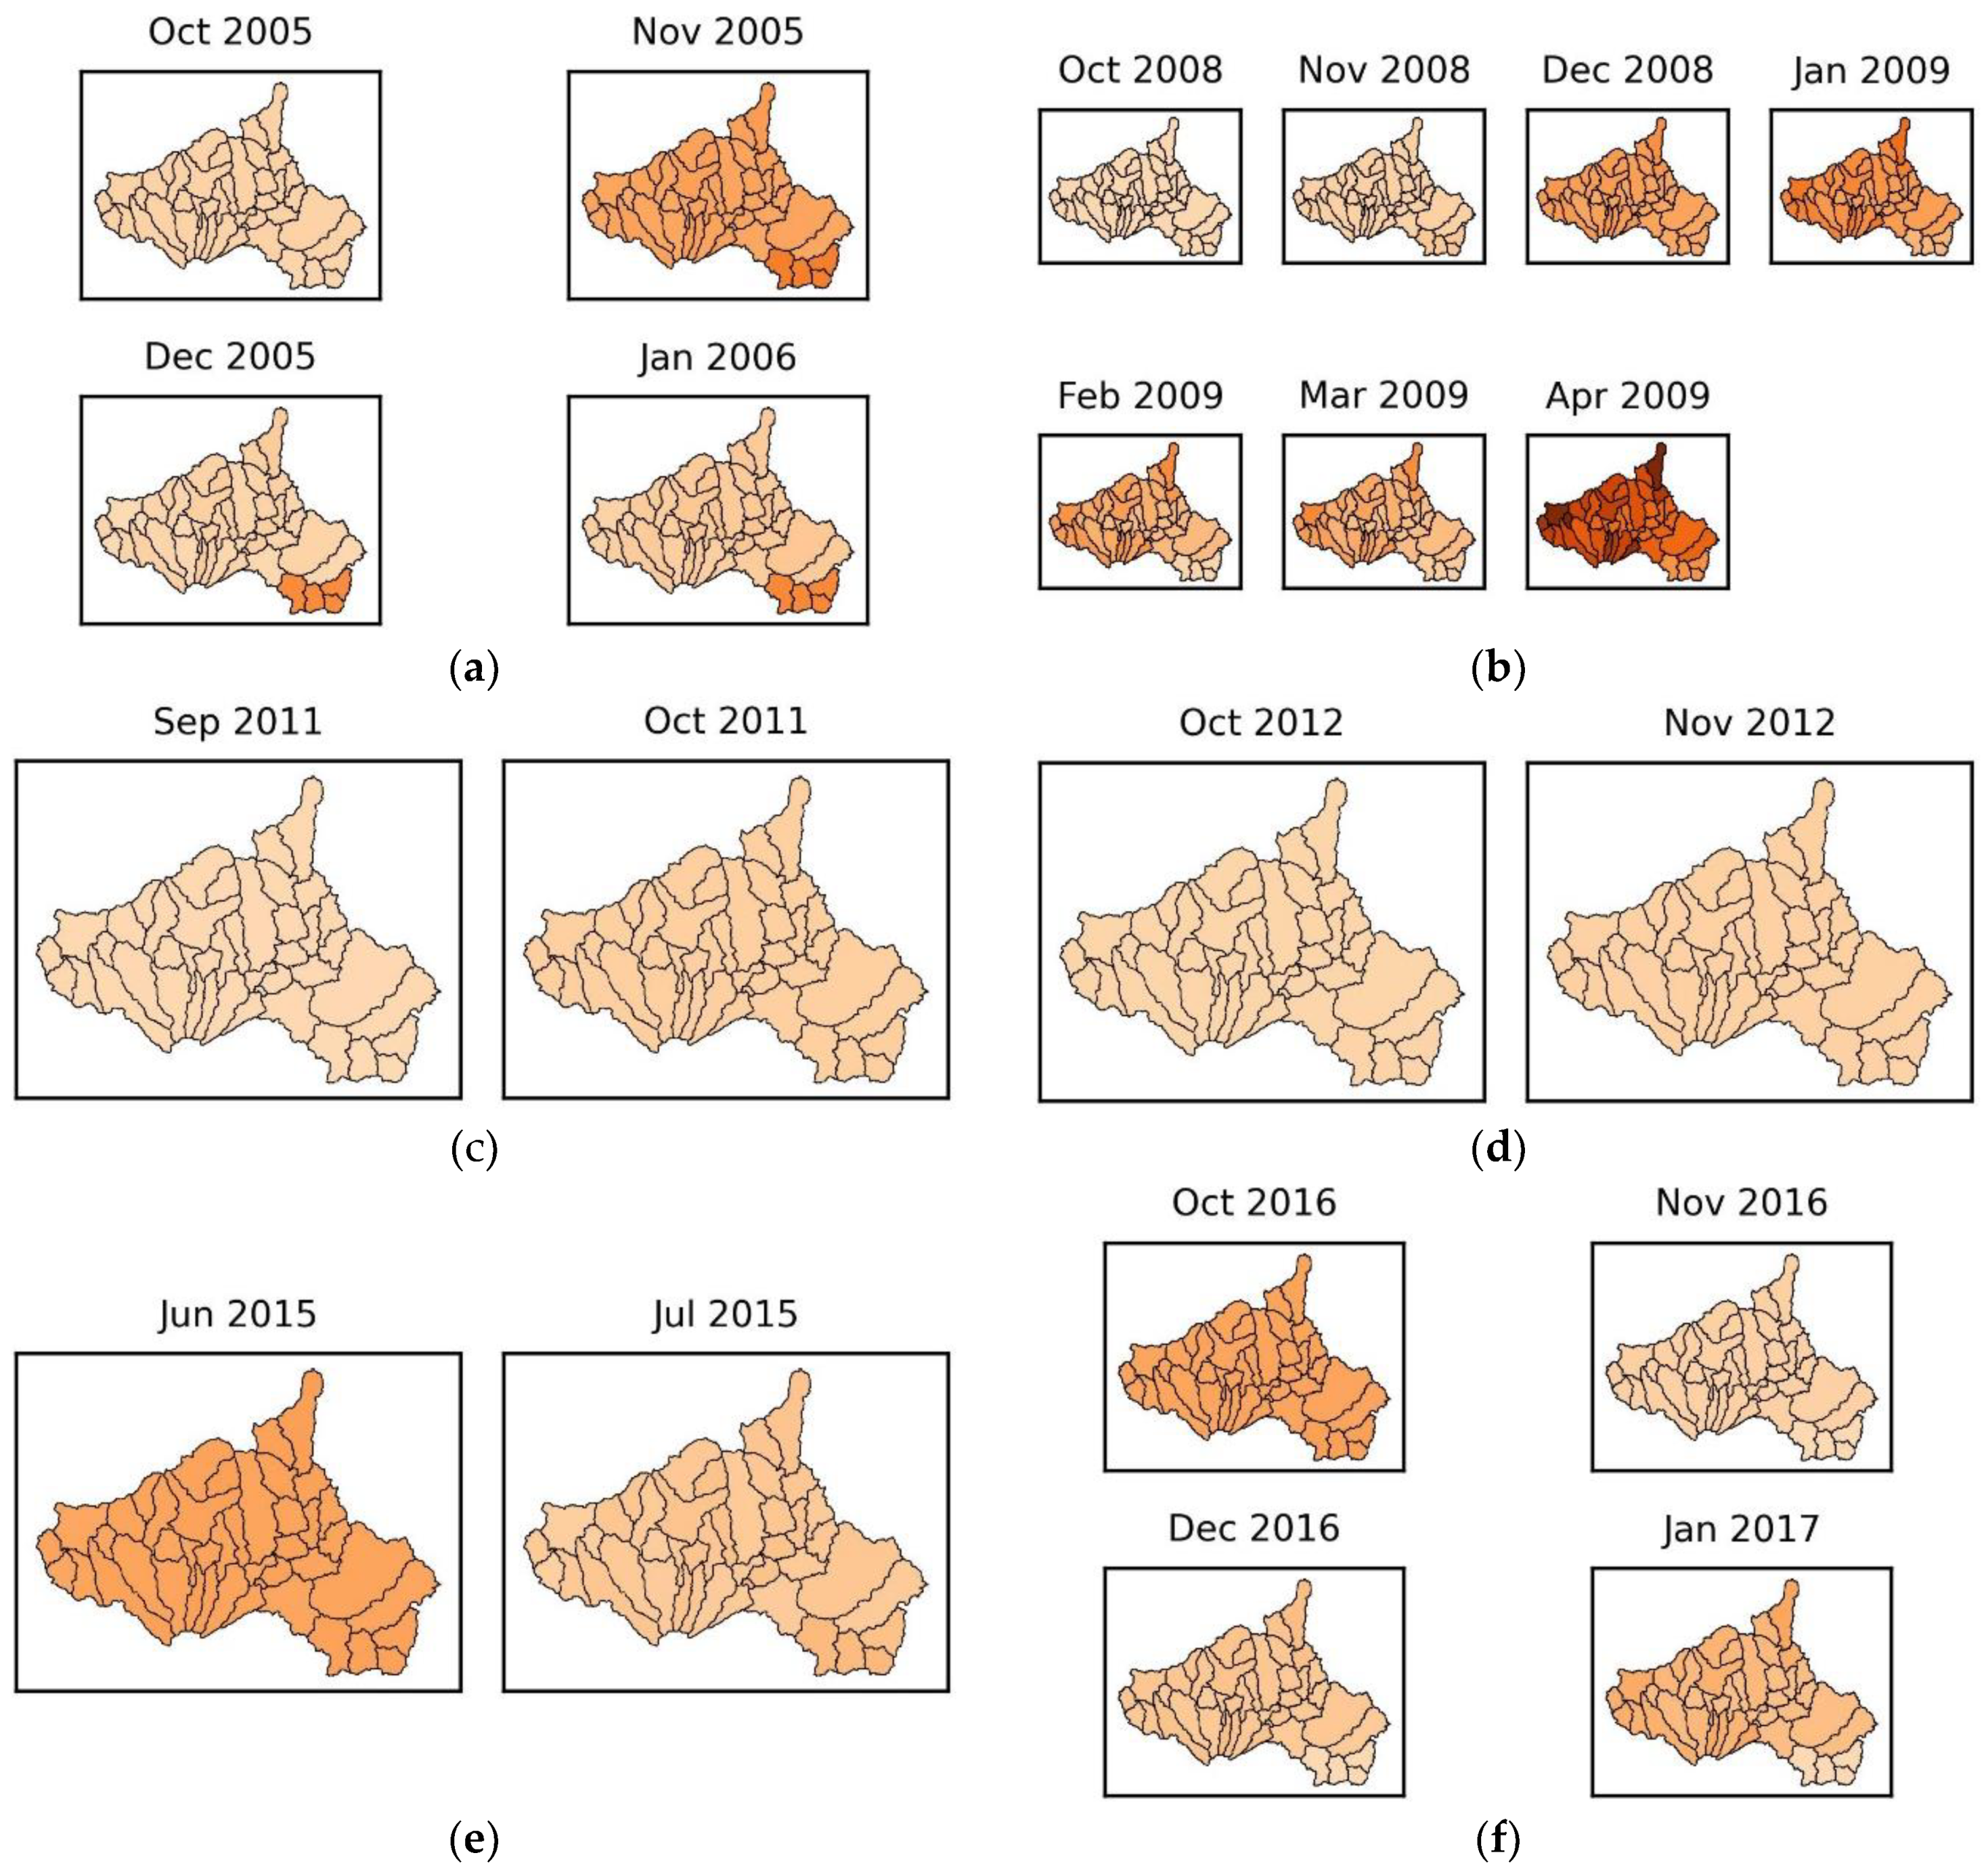
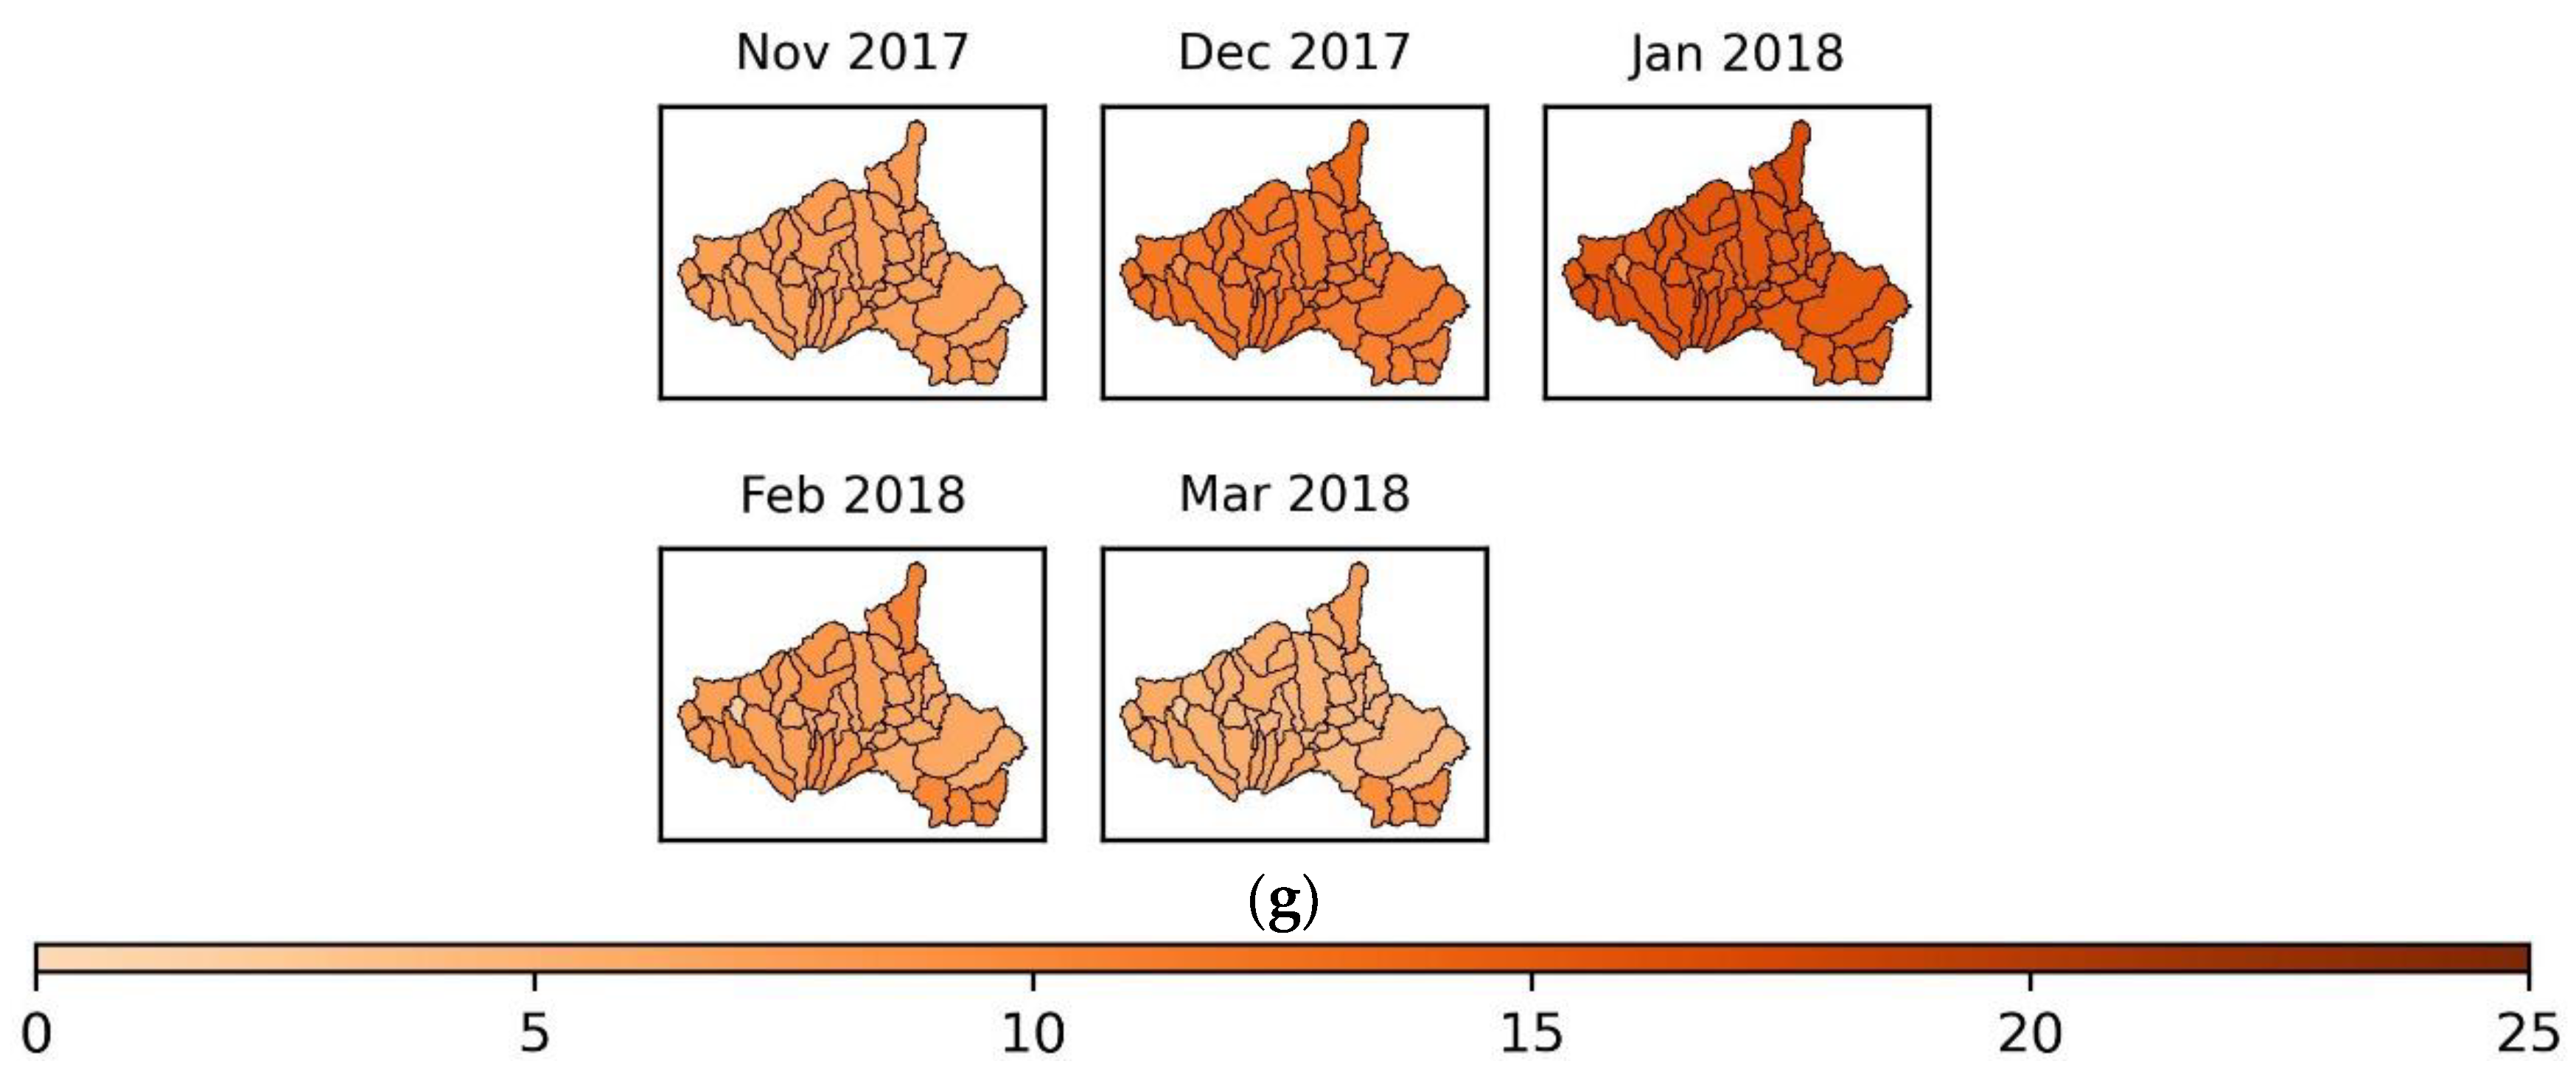
Figure 5 and Figure 6 present the monthly severity of the agricultural and hydrological droughts at each subbasin. Results reveal that agricultural drought event II is the most prolonged and severe episode in the period of analysis (Figure 5b). Regarding hydrological droughts, event I is the most extended episode (Figure 6a), and event III is the most severe (Figure 6c).
3.3. Effect of PDMMs on Drought Severity
This section presents the drought severity change after applying PDMMs. According to the methodology, a positive change indicates a decrease in drought severity compared to the baseline scenario, and a negative value represents the worsening of drought severity.
3.3.1. Effect RWH Ponds on Drought Severity
Figure 7 presents changes in the agricultural drought severity in subbasins where RWH ponds are applied. Results indicate that the agricultural drought severity reduces during the first months of events I, II, and IV (Figure 7a,b,d). Severity alleviation continues until the end of the events, declining gradually. This suggests that the surface runoff collected and sorted during the rainy season continues to be available for infiltration at the beginning of the dry season when the droughts are more likely to start. These findings are consistent with previous studies, which found that RWH ponds improve water availability during drought events [27,45]. The reduction in the agricultural drought severity may also be linked to an improved soil structure. Model outputs indicate that soil erosion decreases by up to 30% in the subbasins where RWH ponds are applied. Previous studies have found that RWH techniques reduce soil erosion, improve soil structure, and enhance soil water retention capacity [31,46].
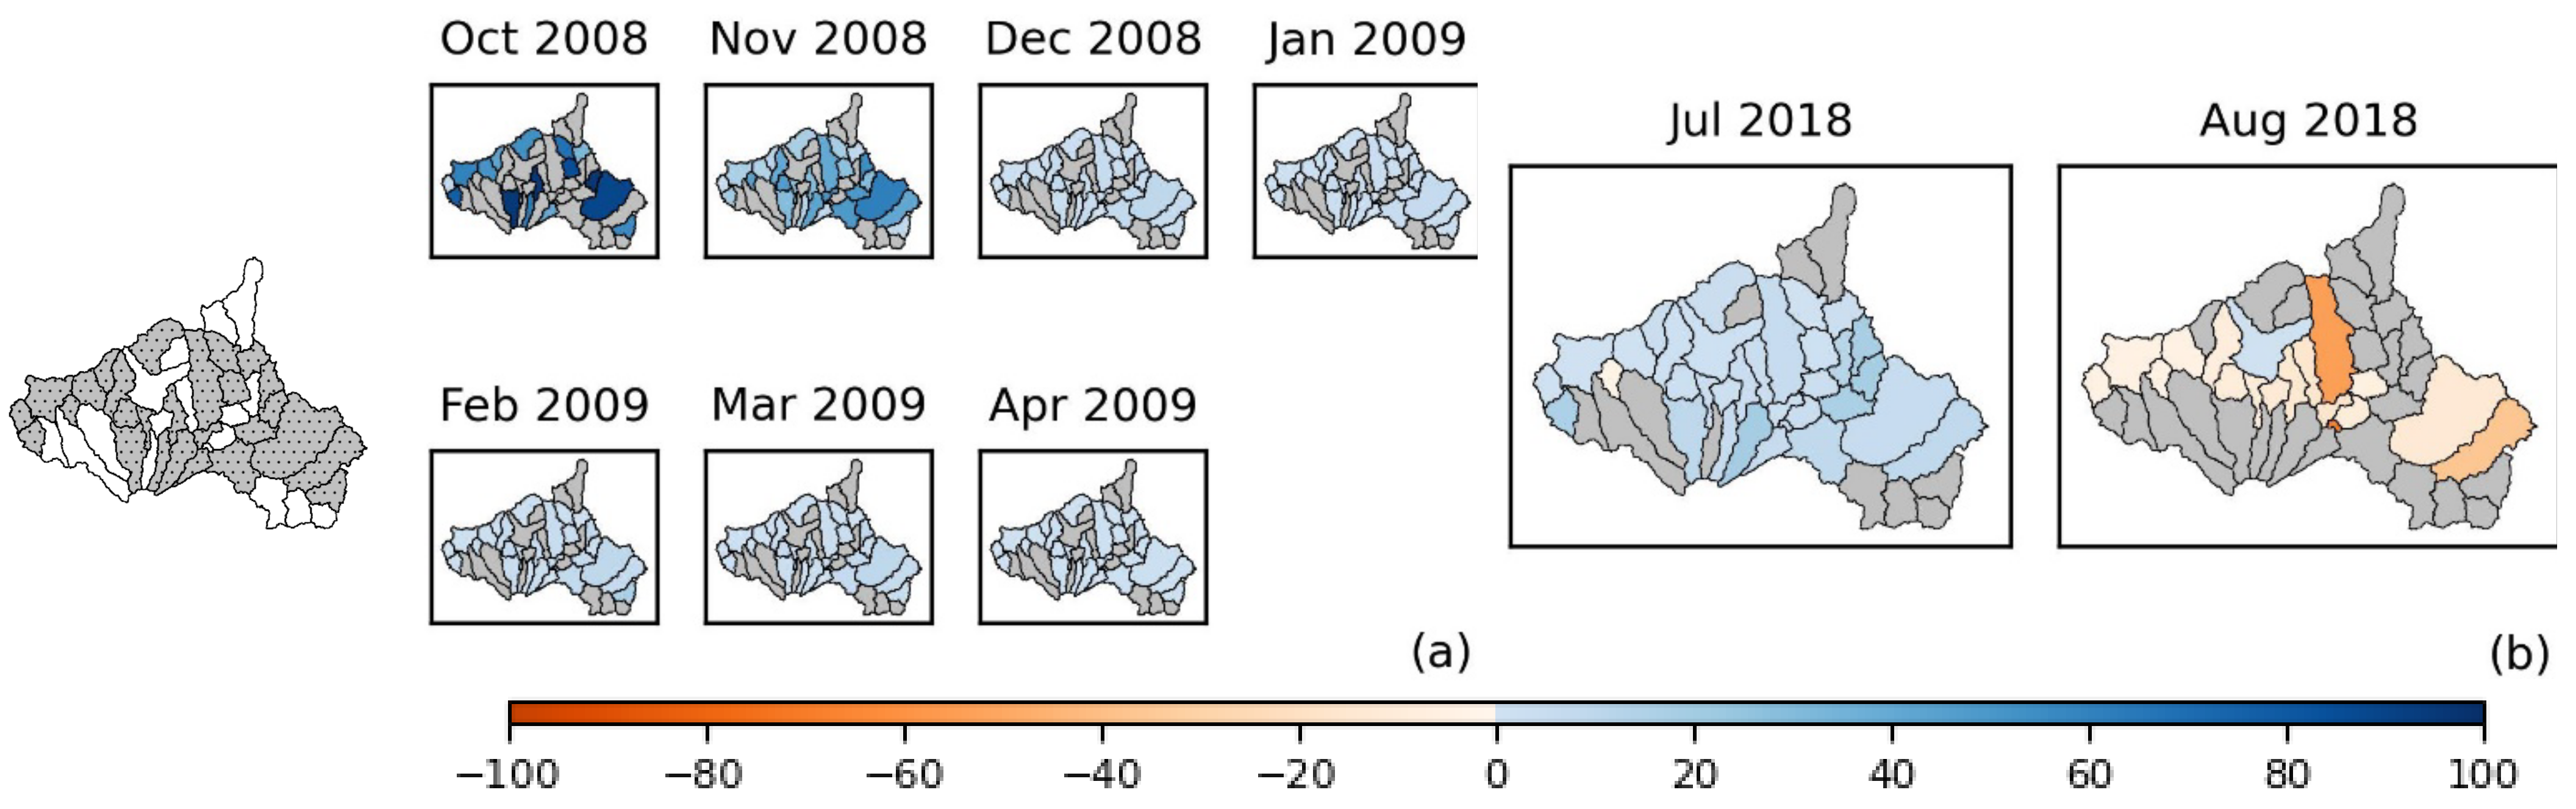
Figure 8 presents the changes in hydrological drought severity in the subbasin where the measure is applied and in subbasins downstream of where it is applied. Findings reveal that RWH ponds help alleviate the severity of the events observed in the dry season. In event I Figure 9a), drought severity reduces by up to 90%. This severity alleviation continues until the end of the event. Similarly, severity reduces by up to 50% and 80% during event II and the first month of event IV (Figure 9b,d). According to the modeling outputs, RWH ponds improve percolation and groundwater recharge during the rainy season. Consequently, more groundwater is stored, and baseflow contribution to the river flow increases, particularly during the dry season, alleviating the severity of the hydrological droughts observed in that period.
After applying the RWH ponds, hydrological drought severity worsens slightly during events that occur in the rainy season (events III and V). One reason for this could be that surface runoff remains stored in the RWH ponds, reducing the surface runoff contribution to the streamflow during the rainy season. Consequently, the streamflow deficit increases, and the severity of the hydrological droughts rises in most subbasins where the ponds are applied (Figure 8c,e and Figure 9b). Interestingly, most of these subbasins correspond to those showing a reduced agricultural drought severity.
It is important to note that, overall, the severity change of the agricultural droughts V, VI, and VII (Figure 7e–g) and hydrological droughts III, IV, and V (Figure 8c–e) remain below 20%. The limited impacts on these events may be linked to the precipitation anomalies observed between 2015 and 2019. The region experienced the lowest five-year mean May to September precipitation over the last century during that period. The lack of precipitation markedly reduces the surface runoff available to collect and store in the RWH ponds. Compared to 2005 and 2008, in 2015, 2016, and 2017, the volume of water collected in the ponds declined by 45% on average. Our findings align with previous studies that concluded that the performance of RWH ponds highly depends on rainfall availability [27,47].
3.3.2. Effect of Forest Conservation on Droughts Severity
The outcomes of the drought analysis indicate that forest conservation has a minimal effect on agricultural drought severity. Although minor changes are observed at the beginning of events II and IV, these changes remain below 3% compared to the baseline scenario. The limited impact of the intervention on agricultural drought severity may be linked to the rainfall distribution over the year and the storage capacity of the soil. Modeling outputs indicate that surface runoff decreases in the subbasins when the measure is applied during the rainy season. Nevertheless, the intercepted surface runoff evaporates or percolates before the dry season starts; consequently, the water is not stored in the soil column or kept available to infiltrate when agricultural droughts are more likely to occur.
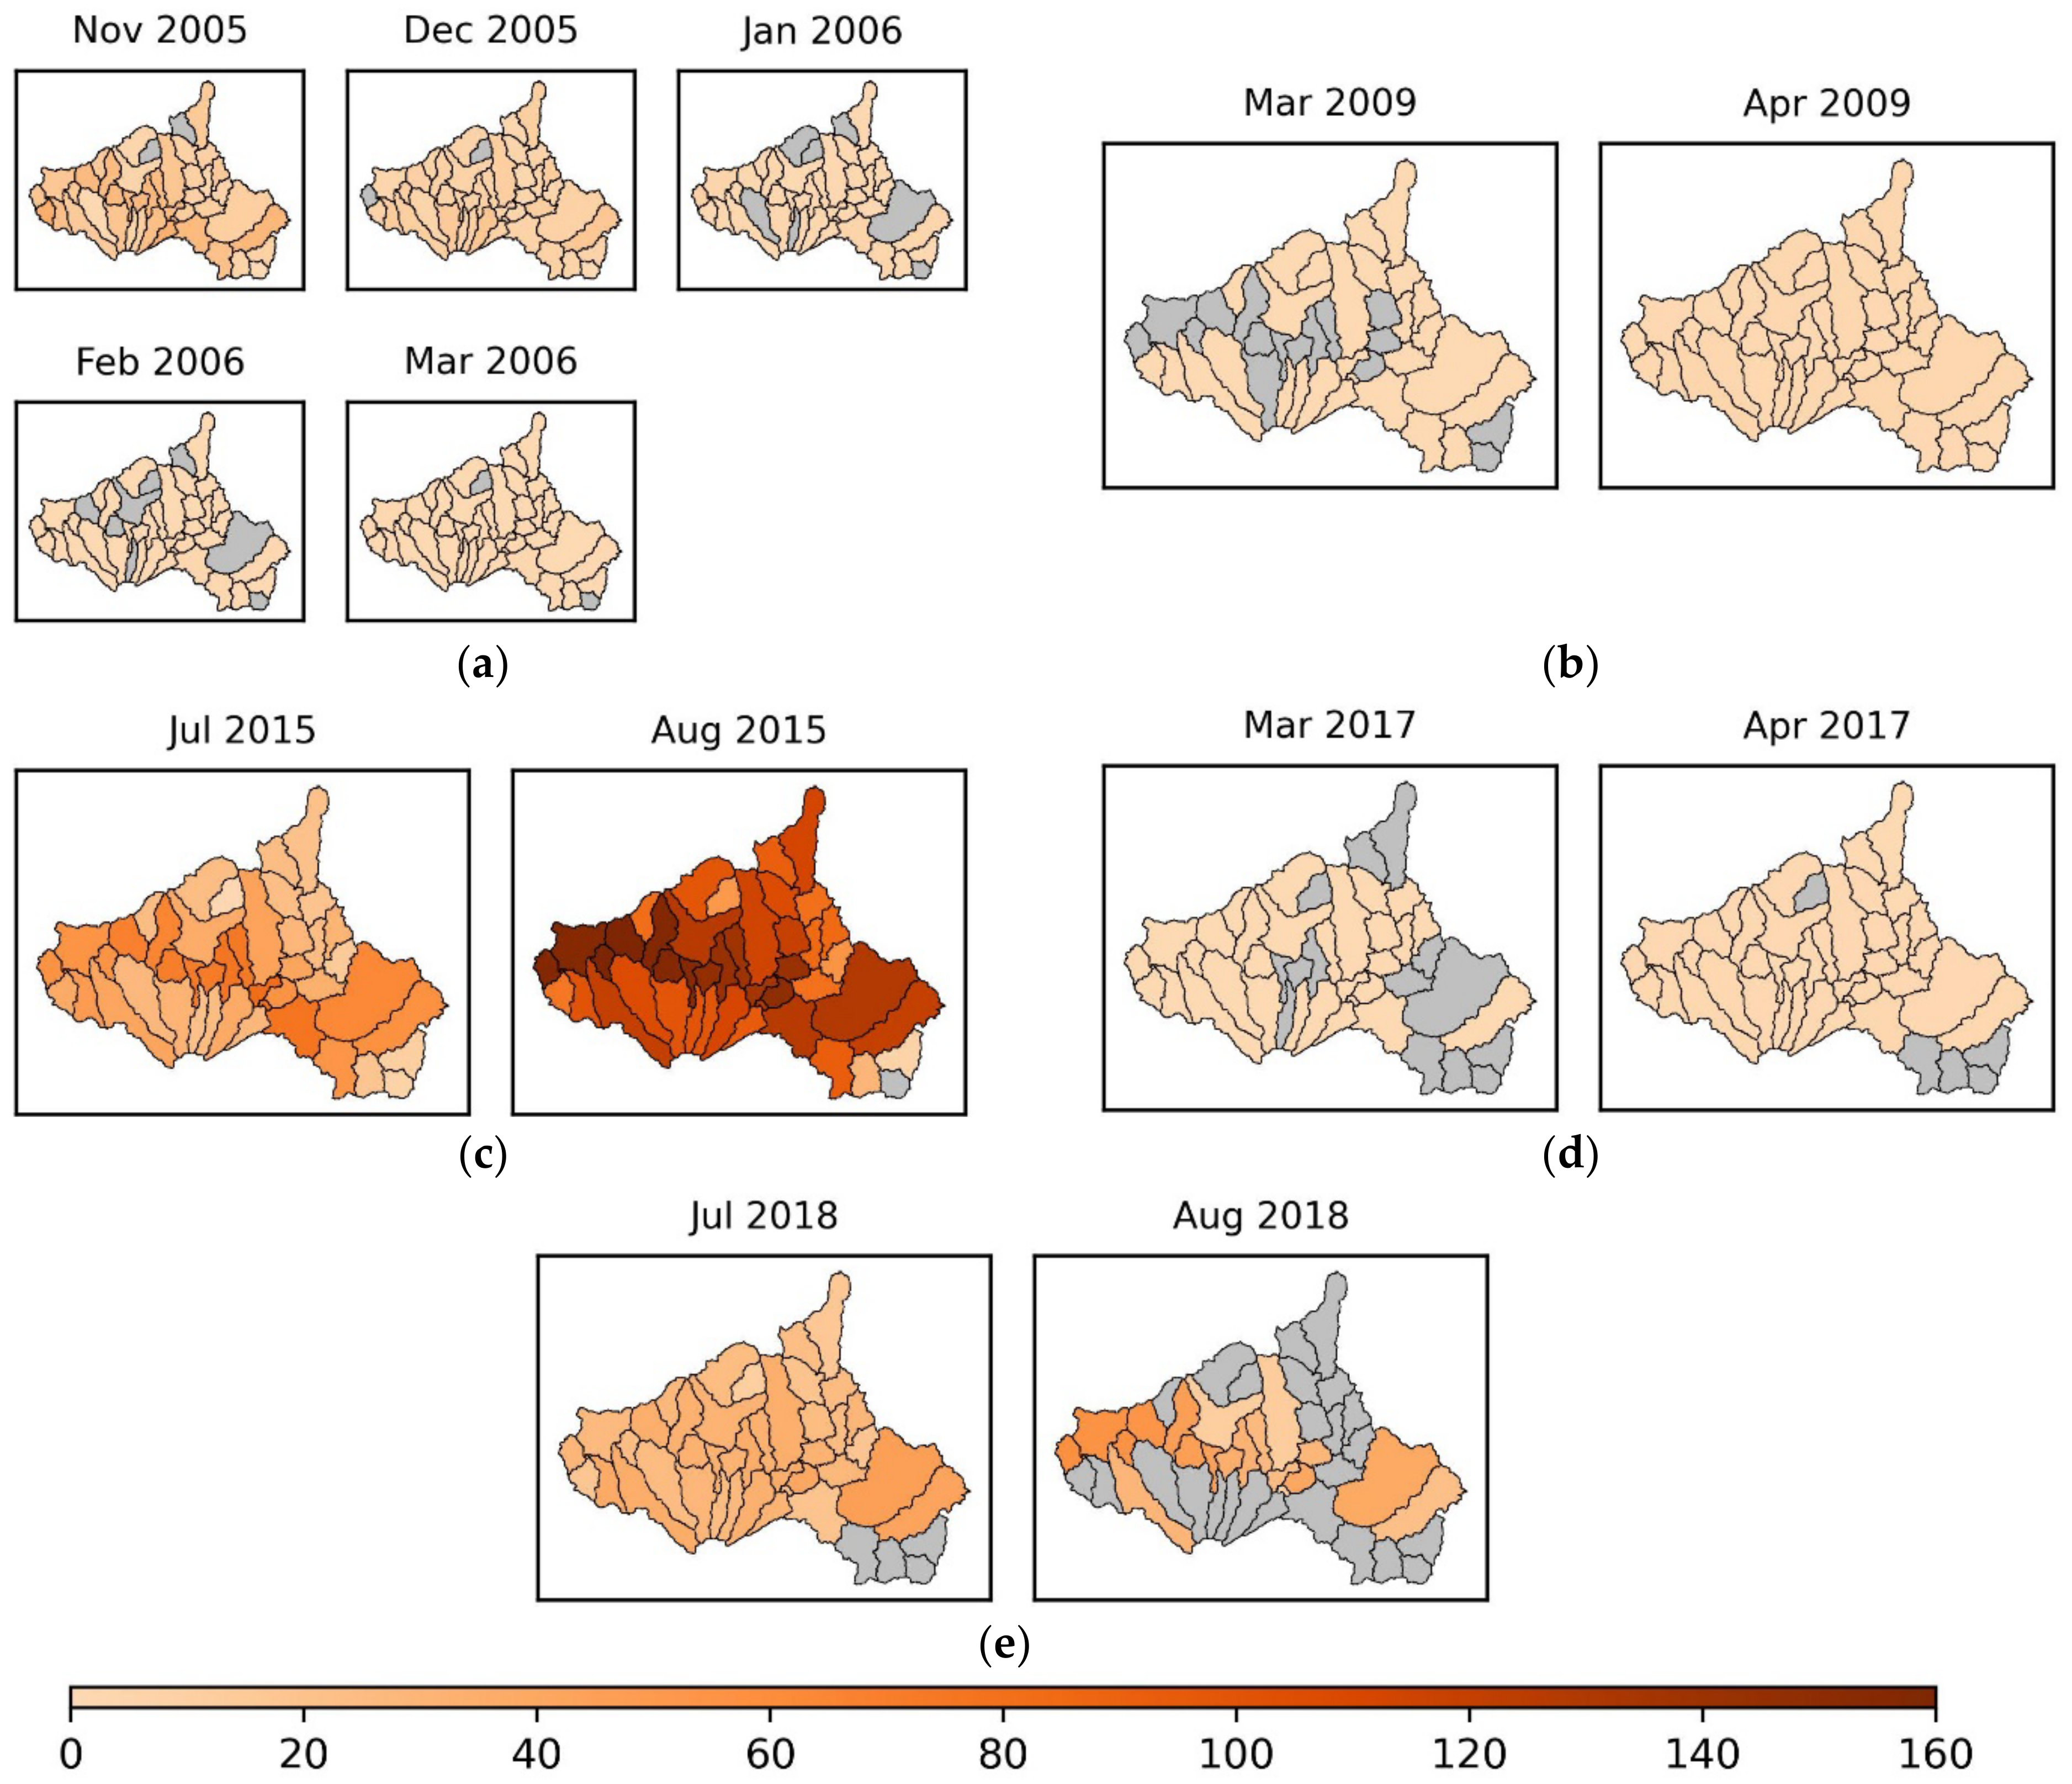
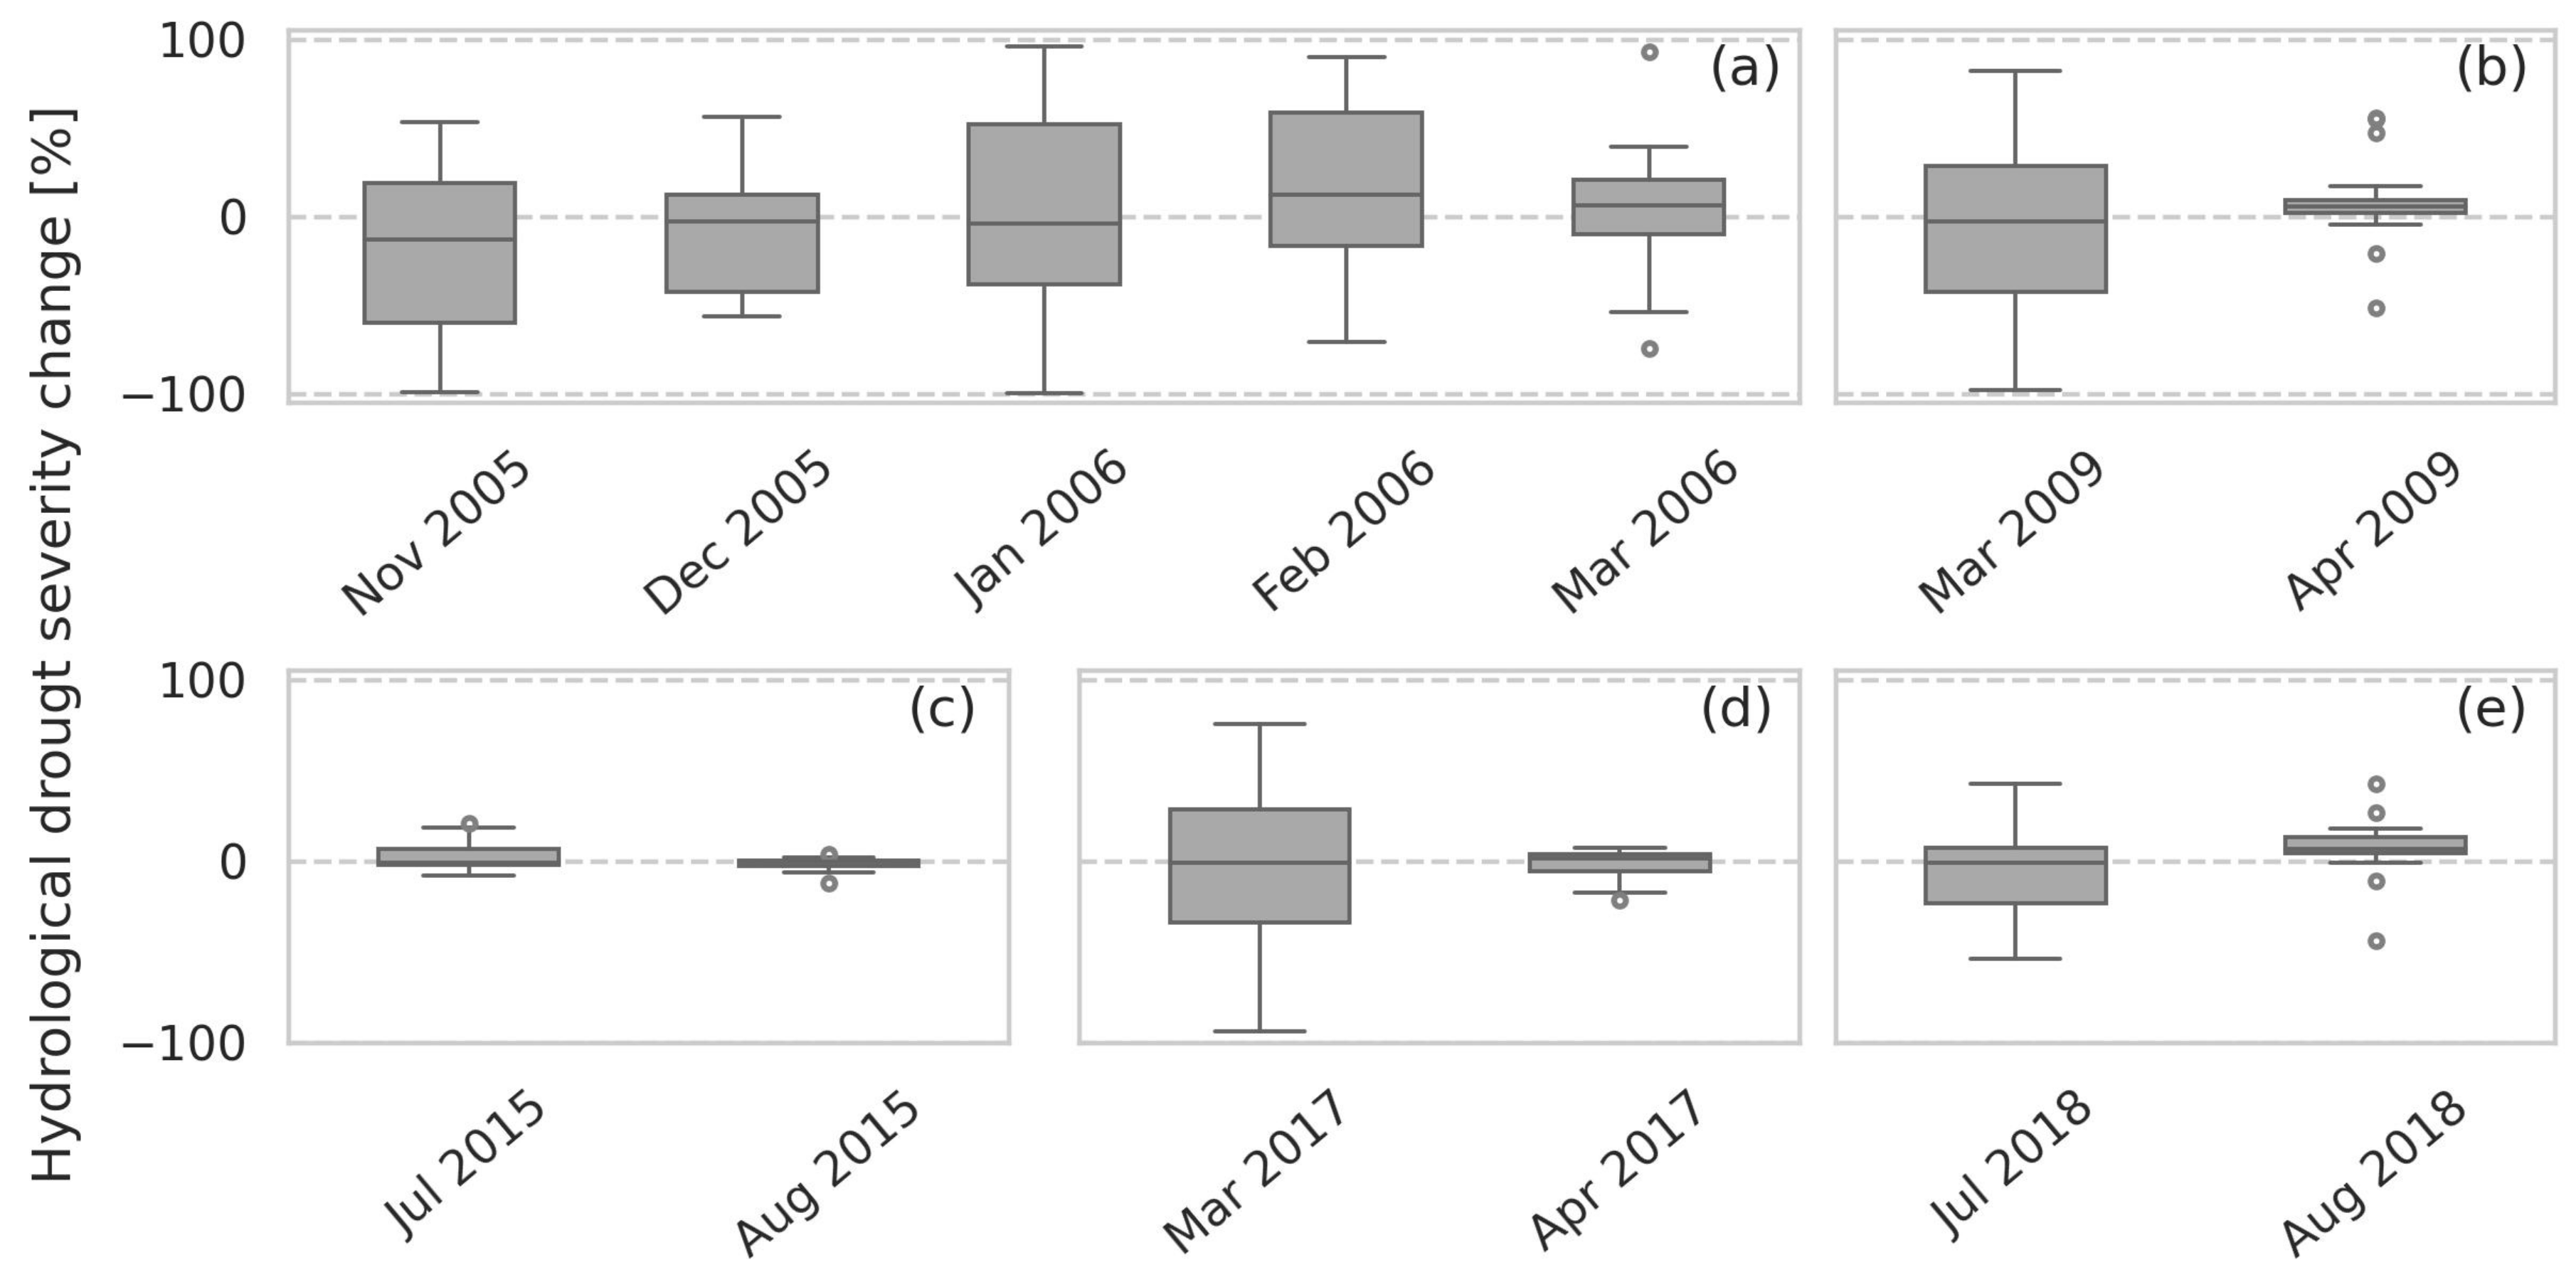
Concerning hydrological droughts, the findings indicate that forest conservation helps reduce the severity of the events observed during the dry season. Figure 10 presents the changes in hydrological drought severity in the subbasins where the measure is applied and in subbasins downstream of where it is applied.
Figure 10a,b,d demonstrate that the severity of events I, II, and IV decrease. For example, the positive effect lasts until the end of event I Figure 10a and Figure 11a). The analysis reveals that while surface runoff reduction caused by forest conservation has little impact on agricultural droughts, it may contribute to alleviating the severity of hydrological droughts. Results also suggest that surface runoff reduction leads to increased percolation, favoring groundwater contribution to the streamflow and alleviating the water deficit. Groundwater contribution to the streamflow improves primarily during the dry season, when droughts are more likely to occur.
The results highlight the relevance of maintaining forest cover in headwater areas for hydrological drought alleviation. These findings are consistent with previous analyses showing that basins with forest cover present more stable seasonal flows, better soil structure and infiltration capacity, and less streamflow reduction during the dry season than those with less forest cover [48,49,50,51].
Conversely, the results indicate that forest conservation has minimal impact on droughts that occur in the rainy season and even slightly worsens drought severity in some subbasins (Figure 10c,e and Figure 11b). This appears to occur because surface runoff contributes significantly to the streamflow during the wet season. After applying forest conservation, surface runoff declines, thus exacerbating the streamflow deficit.
3.3.3. Effect of Check Dams and Ponds on Droughts Severity
Figure 12 presents the changes in agricultural drought severity in the subbasins where check dams and ponds are applied. Notably, the duration of event II reduces by two months, and the severity decreases by more than 40% on average (Figure 12b). The severity of event V, the most severe event during the simulation period, declines by up to 80% Figure 12g).
Similarly to the effects of RWH ponds on agricultural land, the check dams and ponds store surface runoff, making the water available for infiltration. This compensates for soil moisture deficits during drought events, thus alleviating the agricultural drought severity. Additionally, modeling results show that soil erosion is reduced by up to 40% in the subbasins where the measure is applied; this contributes to maintaining the soil structure and enhances soil water-holding capacity. However, it is important to note that impoundments applied in forested areas (mainly upstream subbasins) perform better at alleviating agricultural drought severity, despite the reduced available surface runoff in forested areas compared to agricultural areas. This may be because impoundments can be applied at a larger scale in forested areas.
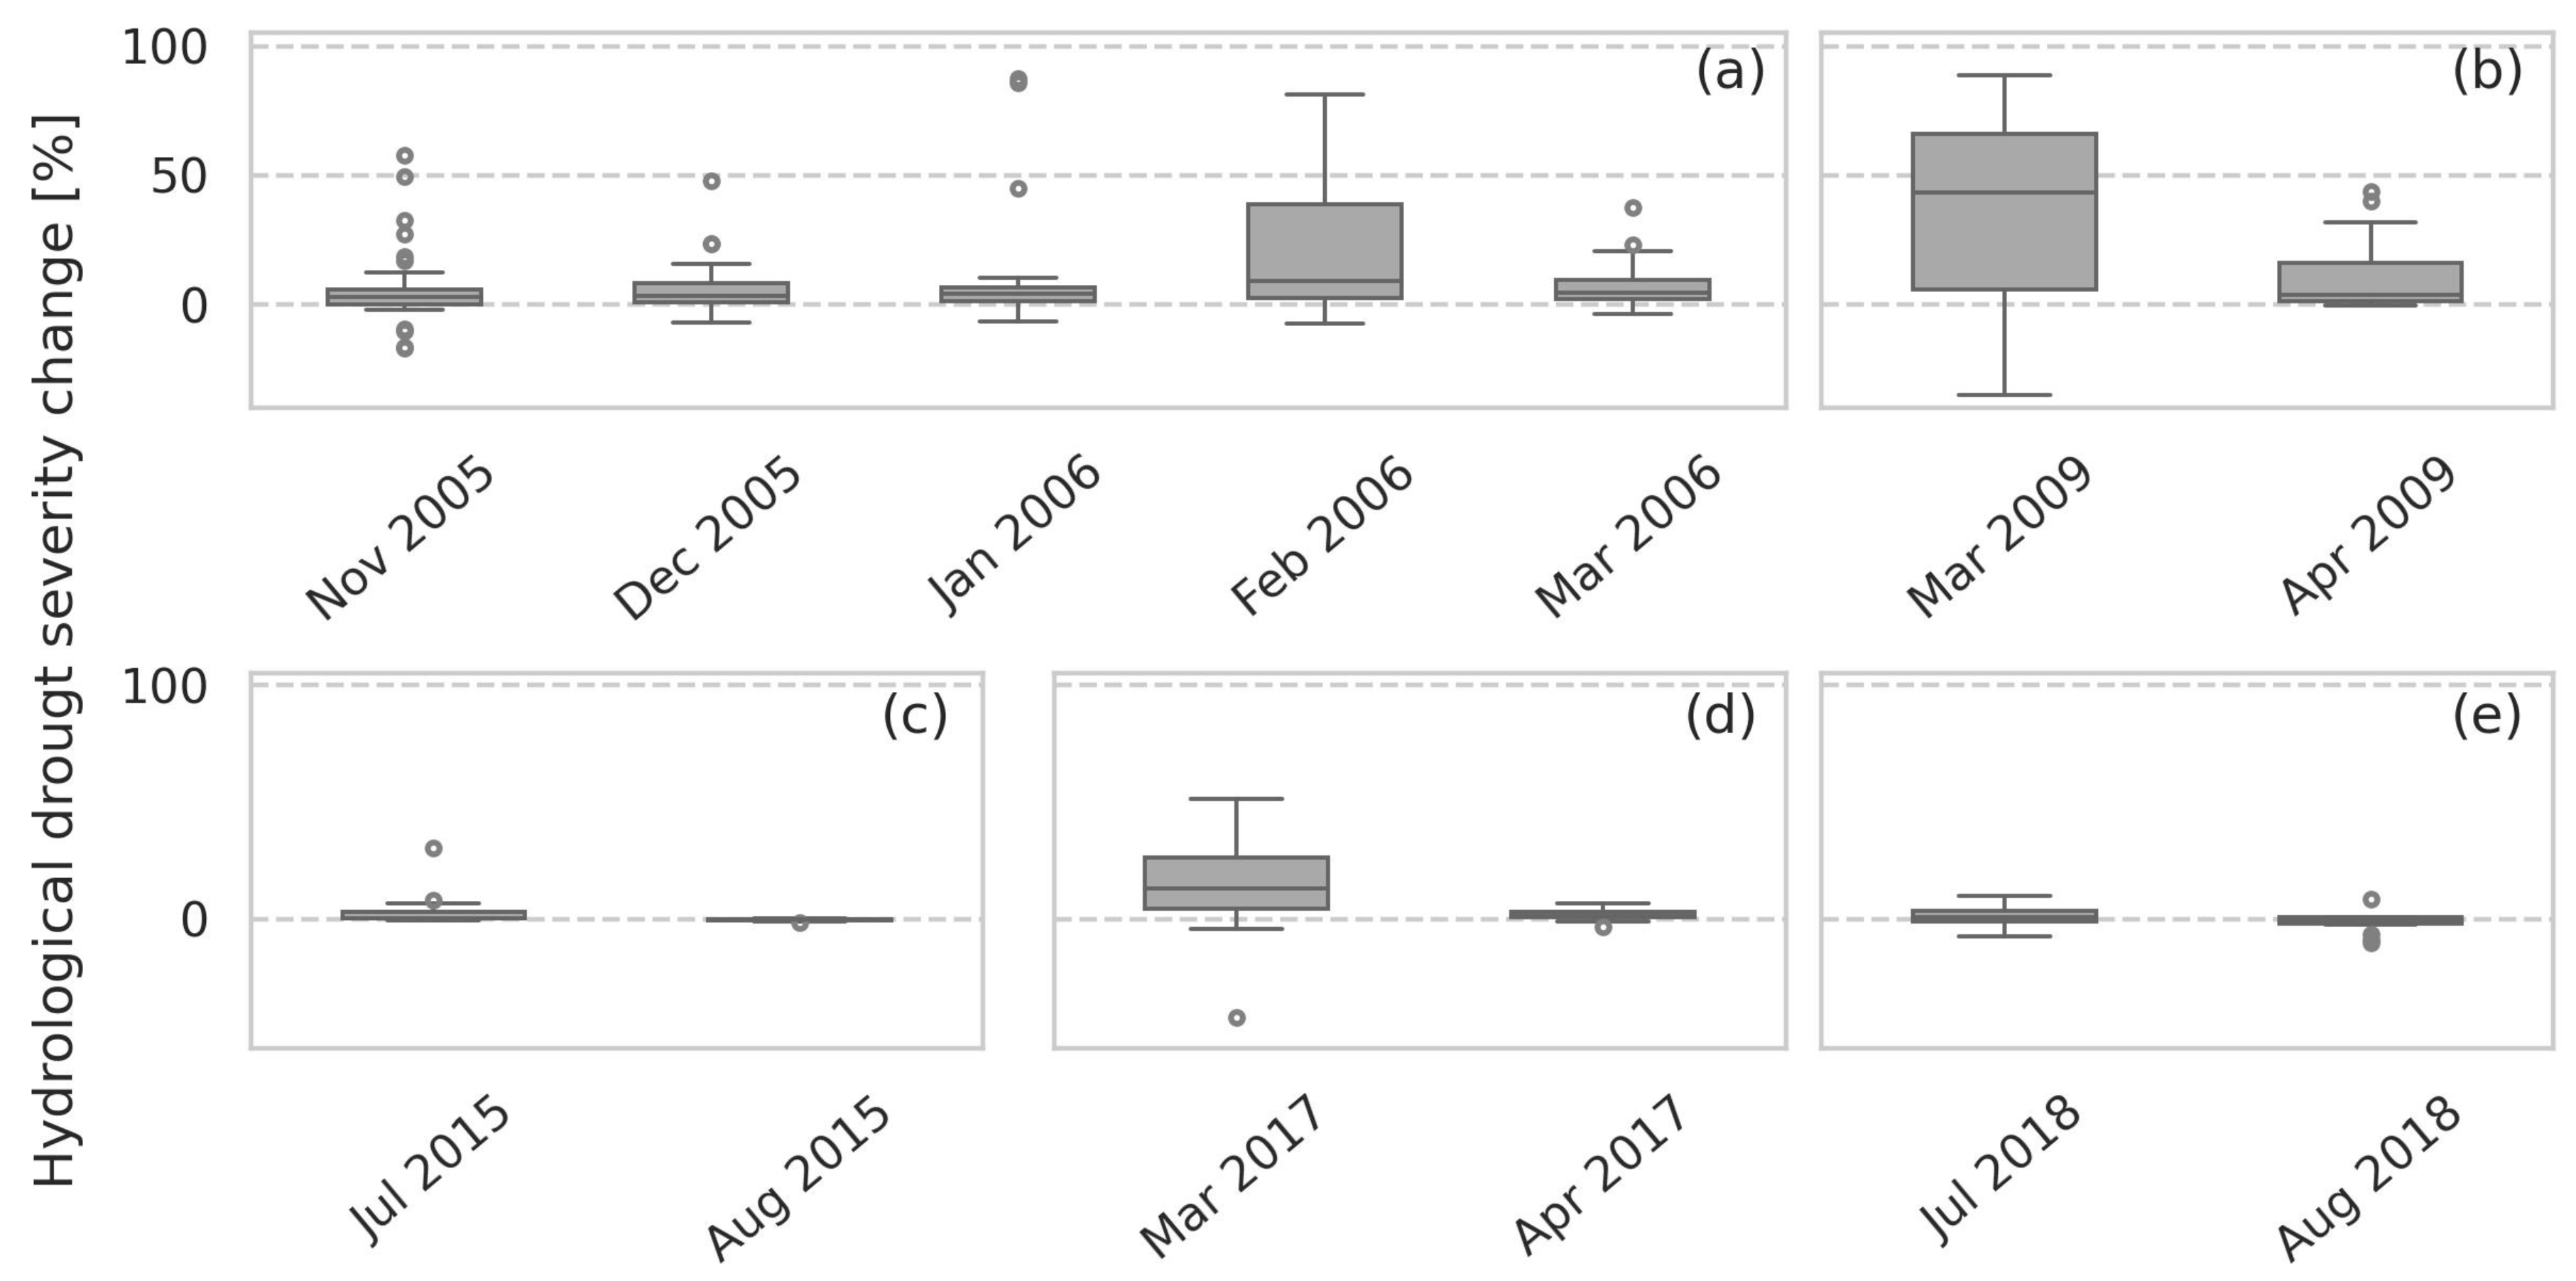
Figure 13 presents the changes in hydrological drought severity in the subbasins where the measures are applied and in the downstream subbasins where the measures are applied. The impacts of check dams and ponds on hydrological drought severity vary. The measures reduce severity in the subbasins where applied, but an equivalent drought worsening is observed downstream (Figure 14b).
Applying check dams and ponds increases percolation and groundwater recharge during the rainy season, which contributes to the alleviation of drought severity in the dry season. These results are observed only in the upstream subbasins. Modeling outputs indicate that in these subbasins, the surface runoff contribution to streamflow reduces by up to 70% during the rainy season, while groundwater contribution to the streamflow increases by up to 40% during the dry season.
Conversely, the change in the groundwater contribution to the streamflow is minimal in the downstream subbasins. Additionally, the streamflow into these subbasins is reduced by up to 55% during the dry season. This suggests that although impoundments that store surface runoff allow more time for infiltration, the soil’s infiltration capacity is low, constraining groundwater recharge. Accordingly, a significant volume of water evaporates or remains stored in the upstream subbasins (in the impoundments and the soil profile), exacerbating the streamflow water deficit downstream.
These results support previous studies, which report that check dams in the upper reaches can disrupt the downstream transfer of water [28]. Previous studies also report that for check dams to increase groundwater availability, high local infiltration and specific aquifer characteristics, such as smaller lateral than vertical transmission and low permeability bottom layer, are required [52].
4. Conclusions
The modeling-based approach applied in this study allowed assessing the impacts of three potential PDMMs (RWH ponds, forest conservation, and check dams) on the severity of agricultural and hydrological droughts in the Torola Basin. The RWH ponds alleviated the severity of agricultural and hydrological droughts in the dry season but slightly worsened the severity of hydrological droughts in the rainy season. Forest conservation did not affect the severity of agricultural droughts and had minimal impact on the severity of hydrological droughts observed in the rainy season. In contrast, it considerably reduced the severity of hydrological droughts in the dry season. Finally, check dams and ponds significantly alleviated the severity of agricultural and hydrological droughts in upstream subbasins but enhanced hydrological droughts downstream.
The findings suggest that basin characteristics (e.g., rainfall distribution over the year, soil infiltration capacity, and topography) and the season (rainy or dry) in which the drought event occurs influence the effectiveness of PDMMs in alleviating drought severity. In addition, the results reveal that PDMMs can reduce the severity of agricultural droughts but produce the opposite effect on the severity of hydrological droughts. Therefore, the selection and allocation of PDMMs must be tailored to each region and require prior assessment of the basin and drought characteristics and the evaluation of the measures’ potential effects on each type of drought.
Some limitations of this study could be addressed in future research. Firstly, it is necessary to explore alternative sources of hydroclimatic data. The available time series in the stations located within the basin are relatively short for long-term drought analysis. Secondly, it is required to include socioeconomic parameters such as governance discord, public participation and demographic constraints, and construction and maintenance costs in the criteria list to select and allocate PDMM. Thirdly, further data collection on irrigation systems in the study site is required to evaluate their effect on drought severity. Equally important, improving the characterization of the agriculture in the study site is necessary, including information on crop calendars and observed periods of crop stress. Finally, there is still a need to assess the mitigation measures’ optimal allocation and application scale and evaluate drought management scenarios where more than one intervention is applied.
The outcomes of this work are relevant for planning authorities and the agriculture sector in developing or improving proactive drought management plans.
Author Contributions
All authors contributed to the study conception and design. Material preparation, data collection, and analysis were performed by A.P.-T. The first draft of the manuscript was written by A.P.-T. and all authors commented on previous versions of the manuscript. A.P.-T., G.A.C., S.M. and D.S. read and approved the final manuscript. All authors have read and agreed to the published version of the manuscript.
Funding
This study was financially supported by the Ministry of Education Colombia, Programa Colombia Científica. Grant No 3597287. The authors have no relevant financial interest to disclose.
Data Availability Statement
Data are available on request.
Acknowledgments
The authors would like to express their gratitude to the Ministry of Environment and Natural Resources (MARN), El Salvador, for proving the digital elevation model and the hydroclimatic data used in this work.
Conflicts of Interest
The authors declare no conflict of interest.
References
- UNDRR. GAR Special Report on Drought 2021. Geneva, 2021. Available online: https://www.undrr.org/publication/gar-special-report-drought-2021 (accessed on 14 October 2021).
- FAO. The Impact of Disasters and Crises on Agriculture and Food Security. Rome, 2017. Available online: https://www.fao.org/documents/card/en/c/I8656EN/ (accessed on 14 October 2021).
- FAO. The State of Food and Agriculture 2020, Overcoming Water Challenges in Agriculture; FAO: Rome, Italy, 2020. [Google Scholar] [CrossRef]
- van Vliet, M.T.H.; Sheffield, J.; Wiberg, D.; Wood, E.F. Impacts of recent drought and warm years on water resources and electricity supply worldwide. Environ. Res. Lett. 2016, 11, 124021. [Google Scholar] [CrossRef]
- FAO. Proactive Approaches to Drought Preparedness–Where Are We Now and Where Do We Go from Here? Rome, 2019. Available online: http://www.fao.org/3/ca5794en/ca5794en.pdf (accessed on 6 March 2020).
- World Bank. Assessing Drought Hazard and Risk: Principles and Implementation Guidance. Washington, DC, USA. 2019. Available online: https://openknowledge.worldbank.org/handle/10986/33805 (accessed on 7 April 2020).
- Sayers, P.B.; Yuanyuan, L.; Moncrieff, C.; Jianqiang, L.; Tickner, D.; Gang, L.; Speed, R. Strategic drought risk management: Eight ‘golden rules’ to guide a sound approach. Int. J. River Basin Manag. 2017, 15, 239–255. [Google Scholar] [CrossRef]
- Bressers, H.; de Boer, C.; Lordkipanidze, M.; Özerol, G.; Vinke-de Kruijf, J.; Farusho, C.; Lajeunesse, C.; Larrue, C.; Ramos, M.H.; Kampa, E.; et al. Water Governance Assessment Tool–With an Elaboration for Drought Resilience; INTERREG IVb DROP Project; University of Twente: Enschede, The Netherlands, 2013. [Google Scholar]
- Assimacopoulos, D.; Kampragou, E.; Andreu, J.; Bifulco, C.; de Carli, A.; De Stefano, L.; Dias, S.; Kartalidis, A.; Massarutto, A.; Monteagudo, D.; et al. Drought Risk Mitigation Options–Case Study Scale. 2015. Available online: http://www.isa.ulisboa.pt/ceabn/uploads/docs/projectos/drought/DROUGHT_TR_29.pdf (accessed on 7 April 2020).
- United Nations World Water Assessment Programme. The United Nations World Water Development Report 2018: Nature-Based Solutions for Water; UN-Water WWAP: Paris, France, 2018. [Google Scholar]
- Global Water Partnership Central and Eastern Europe. Guidelines for preparation of the Drought Management Plans. Development and implementation in the context of the EU Water Framework Directive. 2015. Available online: https://climate-adapt.eea.europa.eu/metadata/guidances/guidelines-for-preparation-of-the-drought-management-plans-1/guidelines-preparation-drought (accessed on 27 February 2020).
- UNCCD. The Land-Drought Nexus Enhancing the Role of Land-Based Interventions in Drought Mitigation and Risk Management. 2019. Available online: https://catalogue.unccd.int/1211_03EP_UNCCD_SPI_2019_Report_2.pdf (accessed on 28 December 2021).
- Islam, M.S.; Hossain, M.Z.; Sikder, M.B. Drought adaptation measures and their effectiveness at Barind Tract in northwest Bangladesh: A perception study. Nat. Hazards 2019, 97, 1253–1276. [Google Scholar] [CrossRef]
- World Bank; International Center for Tropical Agriculture (CIAT); Centro Agronómico Tropical de Investigación y Enseñanza (CATIE). Climate-Smart Agriculture in El Salvador. CSA Country Profiles for Latin America Series, 2nd ed.; World Bank: Washington, DC, USA, 2015. [Google Scholar]
- Brutsaert, W.; Cheng, L.; Zhang, L. Spatial Distribution of Global Landscape Evaporation in the Early Twenty-First Century by Means of a Generalized Complementary Approach. J. Hydrometeorol. 2020, 21, 287–298. [Google Scholar] [CrossRef]
- UNESCO. Balance hídrico integrado y dinámico de El Salvador Documentos Técnicos del PHI-LAC, No 2. 2006. Available online: http://www.unesco.org.uy/phi (accessed on 12 March 2021).
- Depsky, N.; Pons, D. Meteorological droughts are projected to worsen in Central America’s dry corridor throughout the 21st century. Environ. Res. Lett. 2020, 16, 014001. [Google Scholar] [CrossRef]
- Neitsch, S.L.; Arnold, J.G.; Kiniry, J.R.; Williams, J.R. Soil and Water Assessment Tool Theoretical Documentation Version 2009; Texas Water Resources Institute: College Station, TX, USA, 2011; Available online: https://swat.tamu.edu/media/99192/swat2009-theory.pdf (accessed on 3 August 2021).
- Arnold, J.G.; Moriasi, D.N.; Gassman, P.W.; Abbaspour, K.C.; White, M.J.; Srinivasan, R.; Santhi, C.; Harmel, R.D.; Van Griensven, A.; Van Liew, M.W.; et al. SWAT: Model Use, Calibration, and Validation. Trans. ASABE 2012, 55, 1491–1508. Available online: http://swatmodel.tamu.edu (accessed on 12 August 2020). [CrossRef]
- FAO; UNESCO. Digital Soil Map of the World. 2007. Available online: https://data.apps.fao.org/map/catalog/static/api/records/446ed430-8383-11db-b9b2-000d939bc5d8 (accessed on 13 March 2023).
- FAO. Global land cover distribution, by dominant land cover type (FGGD). 2007. Available online: https://data.apps.fao.org/map/catalog/static/api/records/b915a4c0-7592-11db-b9b2-000d939bc5d8 (accessed on 13 March 2023).
- Abbaspour, K.C.; Vaghefi, S.A.; Srinivasan, R. A Guideline for Successful Calibration and Uncertainty Analysis for Soil and Water Assessment: A Review of Papers from the 2016 International SWAT Conference. Water 2018, 10, 6. [Google Scholar] [CrossRef] [Green Version]
- Moriasi, D.N.; Arnold, J.G.; van Liew, M.W.; Bingner, R.L.; Harmel, R.D.; Veith, T.L. Model evaluation guidelines for systematic quantification of accuracy in watershed simulations. Trans. ASABE 2007, 50, 885–900. [Google Scholar] [CrossRef]
- Berhane, G. Benefits and Challenges of Dugout Rainwater Harvesting Ponds in Tigray Region, Ethiopia. In Rainwater-Smart Agriculture in Arid and Semi-Arid Areas: Fostering the Use of Rainwater for Food Security, Poverty Alleviation, Landscape Restoration and Climate Resilience; Springer: Cham, Switzerland, 2017; pp. 259–280. [Google Scholar] [CrossRef]
- FAO; IUFRO; USDA. A Guide to Forest–Water Management; FAO: Rome, Italy, 2021. [Google Scholar] [CrossRef]
- Lucas-Borja, M.E.; Piton, G.; Yu, Y.; Castillo, C.; Zema, D.A. Check dams worldwide: Objectives, functions, effectiveness and undesired effects. Catena 2021, 204, 105390. [Google Scholar] [CrossRef]
- Woldegiorgis, B.G. Effect of Water Harvesting Techniques on Hydrological Processes and Sediment Yield in Northern Ethiopia. Ph.D. Thesis, Wageningen University, Wageningen, The Netherlands, 2017. [Google Scholar] [CrossRef] [Green Version]
- Polyakov, V.O.; Nichols, M.H.; McClaran, M.P.; Nearing, M. AEffect of check dams on runoff, sediment yield, and retention on small semiarid watersheds. J. Soil Water Conserv. 2014, 69, 414–421. [Google Scholar] [CrossRef] [Green Version]
- Kahinda, J.M.M.; Lillie, E.S.B.; Taigbenu, A.E.; Taute, M.; Boroto, R.J. Developing suitability maps for rainwater harvesting in South Africa. Phys. Chem. Earth 2008, 33, 788–799. [Google Scholar] [CrossRef]
- Piton, G.; Carladous, S.; Recking, A.; Tacnet, J.M.; Liébault, F.; Kuss, D.; Quefféléan, Y.; Marco, O. Why do we build check dams in Alpine streams? An historical perspective from the French experience. Earth Surf. Process. Landforms 2016, 42, 91–108. [Google Scholar] [CrossRef]
- Oweis, T.Y.; Prinz, D.; Hachum, A.Y. Rainwater Harvesting for Agriculture in the Dry Areas; CRC Press: Boca Raton, FL, USA, 2012. [Google Scholar] [CrossRef]
- Wambura, F.J.; Dietrich, O.; Graef, F. Analysis of infield rainwater harvesting and land use change impacts on the hydrologic cycle in the Wami River basin. Agric. Water Manag. 2018, 203, 124–137. [Google Scholar] [CrossRef]
- Mishra, S.K.; Singh, V.P. Soil Conservation Service Curve Number (SCS-CN) Methodology. Water Sci. Technol. Libr. 2003, 42, 355–362. [Google Scholar]
- Jalowska, A.M.; Yuan, Y. Evaluation of SWAT Impoundment Modeling Methods in Water and Sediment Simulations. JAWRA J. Am. Water Resour. Assoc. 2019, 55, 209–227. [Google Scholar] [CrossRef] [Green Version]
- Du, B.; Arnold, J.G.; Saleh, A.; Jaynes, D.B. Development and application of SWAT to landscapes with tiles and potholes. Trans. ASAE 2005, 48, 1121–1133. [Google Scholar] [CrossRef] [Green Version]
- Abbasi, N.A.; Xu, X.; Lucas-Borja, M.E.; Dang, W.; Liu, B. The use of check dams in watershed management projects: Examples from around the world. Sci. Total. Environ. 2019, 676, 683–691. [Google Scholar] [CrossRef] [PubMed]
- Waidler, D.; White, M.; Steglich, E.; Wang, S.; Williams, J.; Jones, C.A.; Srinivasan, R. Conservation Practice Modeling Guide for SWAT and APEX. 2009. Available online: https://swat.tamu.edu/media/57882/Conservation-Practice-Modeling-Guide.pdf (accessed on 1 July 2022).
- Herrera-Estrada, J.E.; Satoh, Y.; Sheffield, J. Spatiotemporal dynamics of global drought. Geophys. Res. Lett. 2017, 44, 2254–2263. [Google Scholar] [CrossRef] [Green Version]
- Heudorfer, B.; Stahl, K. Comparison of different threshold level methods for drought propagation analysis in Germany. Hydrol. Res. 2017, 48, 1311–1326. [Google Scholar] [CrossRef]
- Van Lanen, H.A.J.; Wanders, N.; Tallaksen, L.M.; Van Loon, A.F. Hydrological drought across the world: Impact of climate and physical catchment structure. Hydrol. Earth Syst. Sci. 2013, 17, 1715–1732. [Google Scholar] [CrossRef] [Green Version]
- Van Loon, A.F. How Climate and Catchment Characteristics Influence Hydrological Drought Development and Recovery. Ph.D. Thesis, Wageningen University, Wageningen, The Netherlands, 2017. Available online: https://edepot.wur.nl/249786 (accessed on 17 October 2021).
- Sheffiel, J.; Wood, E.F. What is drought. In Drought: Past Problems and Future Scenarios; Taylor & Francis Group: Abingdon, UK, 2011; pp. 9–15. [Google Scholar]
- FAO. Chronology of the Dry Corridor: The Impetus for Resilience in Central America. Agronoticias: Agriculture News from Latin America and the Caribbean. 2017. Available online: https://www.fao.org/in-action/agronoticias/detail/en/c/1024539/ (accessed on 17 October 2021).
- Pascale, S.; Kapnick, S.B.; Delworth, T.L.; Hidalgo, H.G.; Cooke, W.F. Natural variability vs forced signal in the 2015–2019 Central American drought. Clim. Chang. 2021, 168, 1–21. [Google Scholar] [CrossRef]
- Dile, Y.T.; Karlberg, L.; Temesgen, M.; Rockström, J. The role of water harvesting to achieve sustainable agricultural intensification and resilience against water related shocks in sub-Saharan Africa. Agric. Ecosyst. Environ. 2013, 181, 69–79. [Google Scholar] [CrossRef]
- Filho, W.J.; de Trincheria Gomez, J. Rainwater-Smart Agriculture in Arid and Semi-Arid Areas: Fostering the Use of Rainwater for Food Security, Poverty Alleviation, Landscape Restoration and Climate Resilience; Springer: Cham, Switzerland, 2017. [Google Scholar] [CrossRef]
- Zelelew, D.G.; Ayimute, T.A.; Melesse, A.M. Evaluating the Response of In Situ Moisture Conservation Techniques in Different Rainfall Distributions and Soil-Type Conditions on Sorghum Production and Soil Moisture Characteristics in Drought-Prone Areas of Northern Ethiopia. Water Conserv. Sci. Eng. 2018, 3, 157–167. [Google Scholar] [CrossRef]
- Krishnaswamy, J.; Kelkar, N.; Birkel, C. Positive and neutral effects of forest cover on dry-season stream flow in Costa Rica identified from Bayesian regression models with informative prior distributions. Hydrol. Process. 2018, 32, 3604–3614. [Google Scholar] [CrossRef]
- Roa-García, M.C.; Brown, S.; Schreier, H.; Lavkulich, L.M. The role of land use and soils in regulating water flow in small headwater catchments of the Andes. Water Resour. Res. 2011, 47. [Google Scholar] [CrossRef]
- Ogden, F.L.; Crouch, T.D.; Stallard, R.F.; Hall, J.S. Effect of land cover and use on dry season river runoff, runoff efficiency, and peak storm runoff in the seasonal tropics of Central Panama. Water Resour. Res. 2013, 49, 8443–8462. [Google Scholar] [CrossRef] [Green Version]
- Mohammad, A.G.; Adam, M.A. The impact of vegetative cover type on runoff and soil erosion under different land uses. Catena 2010, 81, 97–103. [Google Scholar] [CrossRef]
- Glendenning, C.; van Ogtrop, F.; Mishra, A.; Vervoort, R. Balancing watershed and local scale impacts of rain water harvesting in India—A review. Agric. Water Manag. 2012, 107, 1–13. [Google Scholar] [CrossRef]
Figure 1.
Flowchart of the methodology.

Figure 2.
(a) Basin topography; (b) basin land use.

Figure 3.
Monthly calibration and validation for streamflow at Osicala station.

Figure 4.
Agricultural and hydrological drought events during the simulation period. Roman numerals indicate the name of the drought event. Agricultural drought events are named from I to VII, and hydrological drought events are named from I to V.
Figure 4.
Agricultural and hydrological drought events during the simulation period. Roman numerals indicate the name of the drought event. Agricultural drought events are named from I to VII, and hydrological drought events are named from I to V.

Figure 5.
Monthly agricultural drought severity in mm expressed as a deviation from the threshold (baseline scenario): event I (a), event II (b), event III (c), event IV (d), event V (e), event VI (f), and event VII (g). Higher values represent larger deviation (or moisture deficit) and more severe drought.


Figure 6.
Monthly hydrological drought severity in mm expressed as a deviation from the threshold (baseline scenario): event I (a), event II (b), event III (c), event IV (d), event V (e). Higher values represent larger deviation (or moisture deficit) and more severe drought.
Figure 6.
Monthly hydrological drought severity in mm expressed as a deviation from the threshold (baseline scenario): event I (a), event II (b), event III (c), event IV (d), event V (e). Higher values represent larger deviation (or moisture deficit) and more severe drought.

Figure 7.
Agricultural drought severity changes in subbasins where RWH ponds are applied: event I (a), event II (b), event III (c), event IV (d), event V (e), event VI (f), and event VII (g).
Figure 7.
Agricultural drought severity changes in subbasins where RWH ponds are applied: event I (a), event II (b), event III (c), event IV (d), event V (e), event VI (f), and event VII (g).

Figure 8.
Hydrological drought severity changes in the subbasin where RWH ponds are applied and in subbasins downstream of where they are applied: event I (a), event II (b), event III (c), event IV (d), event V (e).
Figure 8.
Hydrological drought severity changes in the subbasin where RWH ponds are applied and in subbasins downstream of where they are applied: event I (a), event II (b), event III (c), event IV (d), event V (e).

Figure 9.
Drought severity change in percentage in the subbasins where the measure is applied, agricultural drought event II (a). Drought severity change in percentage in the subbasins where the measure is applied and in downstream subbasins, hydrological drought event V (b). The location of the measure is presented on the left side of the figure.

Figure 10.
Hydrological drought severity changes in subbasins where forest conservation is applied and in subbasins downstream of where it is applied: event I (a), event II (b), event III (c), event IV (d), event V (e).
Figure 10.
Hydrological drought severity changes in subbasins where forest conservation is applied and in subbasins downstream of where it is applied: event I (a), event II (b), event III (c), event IV (d), event V (e).

Figure 11.
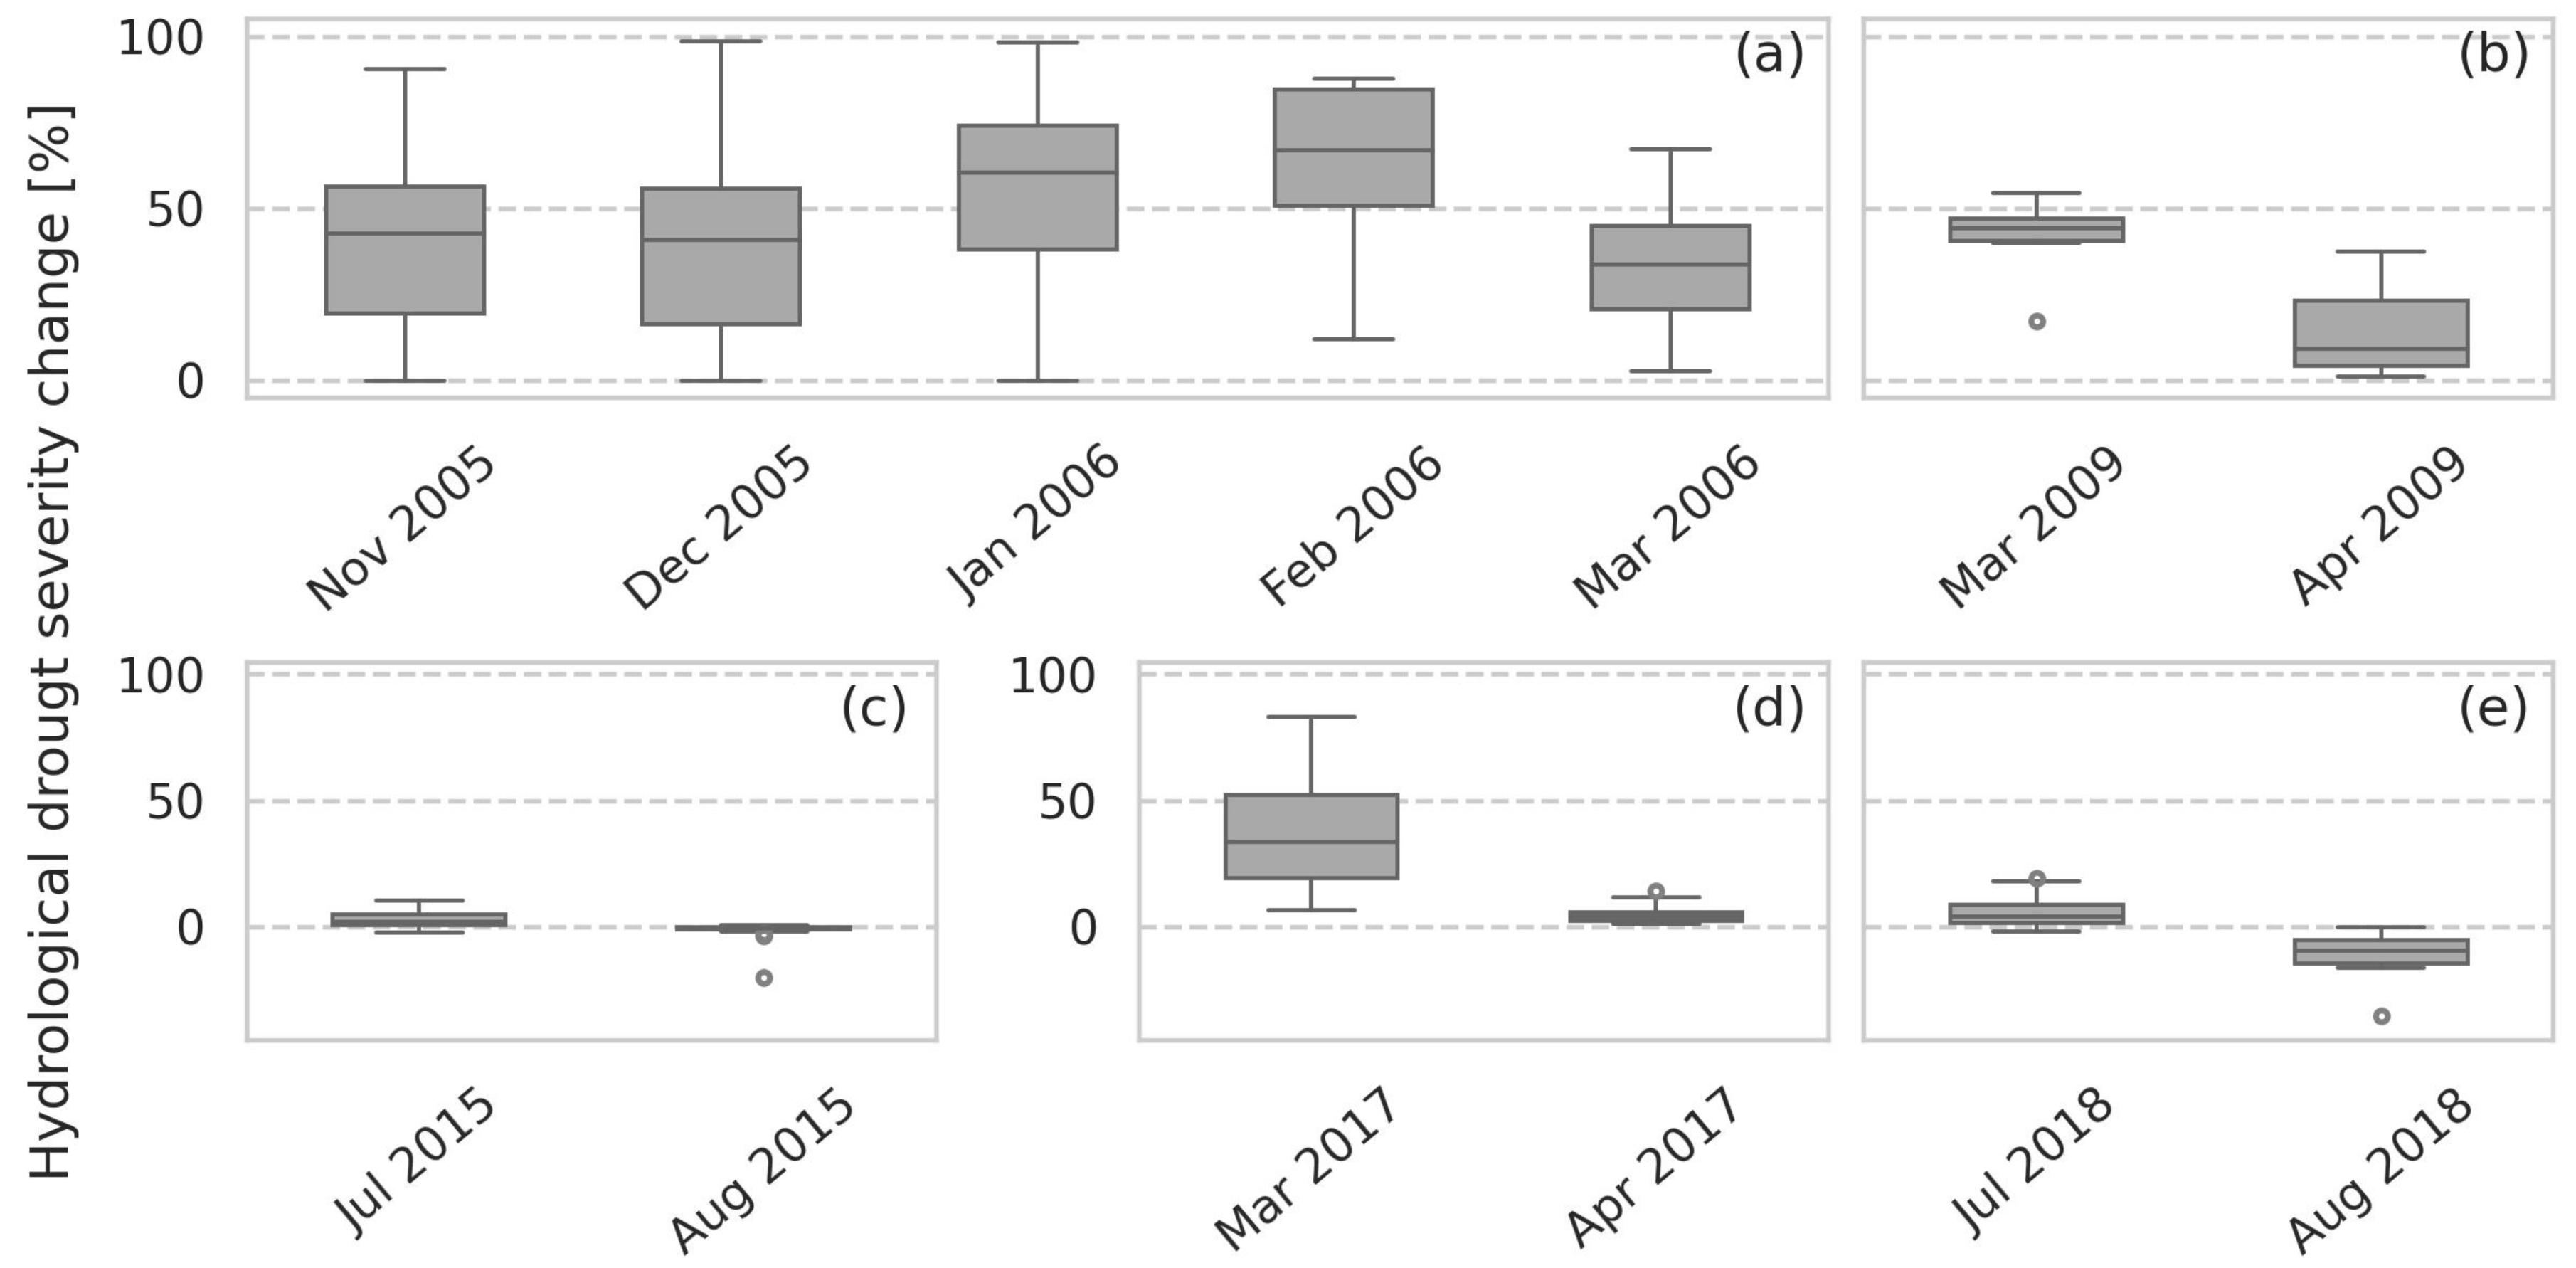
Drought severity change in percentage in the subbasins where the measure is applied and in downstream subbasins: hydrological drought event I (a) and hydrological drought event III (b). The location of the measure is presented on the left side of the figure.
Figure 11.
Drought severity change in percentage in the subbasins where the measure is applied and in downstream subbasins: hydrological drought event I (a) and hydrological drought event III (b). The location of the measure is presented on the left side of the figure.

Figure 12.
Agricultural drought severity changes in subbasins where check dams and ponds are applied: event I (a), event II (b), event III (c), event IV (d), event V (e), event VI (f), and event VII (g).
Figure 12.
Agricultural drought severity changes in subbasins where check dams and ponds are applied: event I (a), event II (b), event III (c), event IV (d), event V (e), event VI (f), and event VII (g).

Figure 13.
Hydrological drought severity changes in subbasins check dams and ponds are applied and in subbasins downstream of where they are applied: event I (a), event II (b), event III (c), event IV (d), event V (e).
Figure 13.
Hydrological drought severity changes in subbasins check dams and ponds are applied and in subbasins downstream of where they are applied: event I (a), event II (b), event III (c), event IV (d), event V (e).

Figure 14.
Drought severity change in percentage in the subbasins where the measure is applied, agricultural drought event VII (a). Drought severity change in percentage in the subbasins where the measure is applied and in downstream subbasins, hydrological drought event I (b). The location of the measure is presented on the left side of the figure.


Table 1.
SWAT model input data.
| Data Type | Details | Source |
|---|---|---|
| Digital elevation model | 5 × 5 m | Ministry of Environment and Natural Resources, El Salvador. |
| Soil map | 300 × 300 m | Digital Soil Map of the World [20]. |
| Land use map | 300 × 300 m | Global land cover distribution, by dominant land cover type (FGGD) [21]. |
| Rainfall and temperature, daily data (2 stations) | Period 2004–2018 (15 years) | Ministry of Environment and Natural Resources, El Salvador. |
| Discharge, monthly data (1 station) | Period 2004–2018 (15 years) | Ministry of Environment and Natural Resources, El Salvador. |
Table 2.
Evaluation criteria to identify interventions for drought management in study area.
| Criteria | RWH Ponds | Forest Conservation | Check Dams |
|---|---|---|---|
| Description | Designed to trap and collect runoff from a relatively small catchment area (10–500 m2) [24]. | Forest conservation aims to maintain forest cover and limit soil degradation [25]. | Small barriers constructed across channels to obstruct flow [26]. |
| Annual rainfall | 200–1000 mm [27]. | NA. | Used frequently in arid or mountainous environments with ephemeral hydrology [28]. |
| Topography | Steeply and mild slopes [29]. | NA. | Steep and mild slopes [30]. |
| Soil type | Sandy loam, sandy clay loam, and sandy clays [29]. | NA. | On areas with coarse soil texture [28]. |
| Land use compatibility | Applied in agricultural land [31]. | Land where forest is, or is planned to become, the dominant land use [25]. | Where the slope is mild and the area is sufficient to store discharge and sediment [30]. |
| Parameter(s) to model the measure in SWAT | Pothole routine: POT_FR a (0.3), POT_VOLX b (20 cm), [32]. | CN2 c value of forested HRUs was reduced from the calibrated value to the recommended value for forest in good hydrological conditions [33]. | Ponds: PND_FR d (0.3), PND_PVOL e (5 × 10⁴ m3), PND_PSA f (1 ha) [34]. |
| No. of PDMM applied | 140 potholes were applied at HRU level (140 HRUs met the allocation criteria). | – | 17 ponds were applied at the subbasin level (17 subbasins met the allocation criteria). |
| Measures allocation |  |  |  |
Notes: a Fraction of the HRU area that drains into a pothole; b maximum volume of water stored in the pothole (mm) over the entire HRU; c initial SCS runoff curve number for moisture condition II; d fraction of subbasin area that drains into ponds; e volume of water stored in ponds when filled to the principal spillway (104 m3. H2O); f surface area of ponds when filled to principal spillway (ha).
Table 3.
Sensitivity analysis rankings for streamflow model output.
| Parameter a | Description in SWAT | Range | Default Value | Calibrated Value |
|---|---|---|---|---|
| r__SOL_Z().sol | Depth from soil surface to bottom of layer (mm). | 0–3500 | Soil and layer specific | 300–1000 b |
| r__SOL_BD().sol | Moist bulk density (g/cm3). | 0.9–2.5 | Soil and layer specific | 1.0–1.3 b |
| r__SOL_AWC().sol | Available water capacity of the soil layer (mm H20/mm soil). | 0–1 | Soil and layer specific | 0.1–0.2 b |
| r__SOL_K().sol | Saturated hydraulic conductivity (mm/h). | 0–2000 | Soil and layer specific | 8.0–45.0 b |
| r__CN2.mgt | SCS runoff curve number. | 35–98 | Specific HRU | 70–85 b |
| v__RCHRG_DP.gw | Deep aquifer percolation fraction. | 0–1 | 0.05 | 0.02 |
| v__GWQMN.gw | Threshold depth of water in the shallow aquifer required for return flow to occur. | 0–5000 | 1000 | 4642 |
| v__GW_DELAY.gw | Groundwater delay (days). | 0–500 | 31 | 4.0 |
| r__ESCO.hru | Soil evaporation compensation factor. | 0–1 | 0.95 | 0.51 |
| v__CH_N2.rte | Manning’s for the main channel. | −0.01–0.3 | 0.014 | 0.10 |
Notes: a v: parameter value is replaced by a value from the given range; r: parameter value is multiplied by (1 + a given value), b range of calibrated values.
Disclaimer/Publisher’s Note: The statements, opinions and data contained in all publications are solely those of the individual author(s) and contributor(s) and not of MDPI and/or the editor(s). MDPI and/or the editor(s) disclaim responsibility for any injury to people or property resulting from any ideas, methods, instructions or products referred to in the content. |
© 2023 by the authors. Licensee MDPI, Basel, Switzerland. This article is an open access article distributed under the terms and conditions of the Creative Commons Attribution (CC BY) license (https://creativecommons.org/licenses/by/4.0/).
Share and Cite
MDPI and ACS Style
Paez-Trujillo, A.; Corzo, G.A.; Maskey, S.; Solomatine, D. Model-Based Assessment of Preventive Drought Management Measures’ Effect on Droughts Severity. Water 2023, 15, 1442. https://doi.org/10.3390/w15081442
AMA Style
Paez-Trujillo A, Corzo GA, Maskey S, Solomatine D. Model-Based Assessment of Preventive Drought Management Measures’ Effect on Droughts Severity. Water. 2023; 15(8):1442. https://doi.org/10.3390/w15081442
Chicago/Turabian StylePaez-Trujillo, Ana, Gerald A. Corzo, Shreedhar Maskey, and Dimitri Solomatine. 2023. "Model-Based Assessment of Preventive Drought Management Measures’ Effect on Droughts Severity" Water 15, no. 8: 1442. https://doi.org/10.3390/w15081442
Note that from the first issue of 2016, this journal uses article numbers instead of page numbers. See further details here.