

Comparative Assessment of the Application of Four Water Quality Indices (WQIs) in Three Ephemeral Rivers in Greece

1
Laboratory of Ecological Engineering and Technology, Department of Environmental Engineering, School of Engineering, Democritus University of Thrace, 67100 Xanthi, Greece
2
Centre for the Assessment of Natural Hazards and Proactive Planning & Laboratory of Reclamation Works and Water Resources Management, Department of Infrastructure and Rural Development, School of Rural and Surveying Engineering, National Technical University of Athens, 15780 Zographou, Greece
*
Author to whom correspondence should be addressed.
Water 2023, 15(8), 1443; https://doi.org/10.3390/w15081443
Submission received: 28 February 2023
/
Revised: 31 March 2023
/
Accepted: 4 April 2023
/
Published: 7 April 2023
(This article belongs to the Special Issue Water Quality for Sustainable Development)
Abstract
:In this work, the possibility of using four water quality indices (WQIs) to evaluate the quality status of small rivers in the Mediterranean region (Northern Greece) was investigated. The WQIs selected were the NSF WQI, Oregon WQI, CCME WQI and Prati’s Index of Pollution and were applied to three rivers, namely Laspias, Kosynthos and Lissos, located in the prefectures of Xanthi and Rhodope, Northern Greece. The individual indices were calculated based on the values of 11 physicochemical parameters derived from field measurements and chemical laboratory analyses of water samples at two monitoring stations in each river. The in situ measurements and samplings were executed at a frequency of approximately 10 days and lasted 20, 12 and 10 months for rivers Laspias, Kosynthos and Lissos, respectively. The comparative results from the four indices in the three rivers showed that for rivers Kosynthos and Lissos, which had comparable values of physicochemical parameters, Prati’s and CCME indices classified these water bodies into the highest quality classes, the NSF WQI into a slightly lower class and the Oregon WQI into the lowest classes of quality ranking. Regarding Laspias River, whose physicochemical parameter values indicated inferior water quality than the other two rivers, the Oregon index ranked this water body in the lowest quality class, while the other indices in slightly higher classes. In conclusion, regarding the water quality of ephemeral streams in the Mediterranean, it seems that the Oregon index is stricter followed by the NSF, and then, Prati’s and CCME WQIs.
1. Introduction
Population growth, anthropogenic activities, such as agricultural intensification and industrial development, as well as land use/land cover change and climate change have resulted in recent decades in the reduction of surface water body quantity and the impairment of their quality. Thus, the availability of freshwater gradually decreases and many of its uses are excluded due to pollution [1,2]. This fact leads to the need to monitor the surface water quality of surface aquatic systems and implement measures for maintaining their good quality.
Water quality is expressed by many different water quality parameters (WQPs) that include physical, chemical and biological. The participation of these WQPs in the water quality assessment process is not of the same importance and depends on the ultimate water use. Therefore, the expression of the water quality of a water system (e.g., river, lake and reservoir) using the values of the individual WQPs is difficult to understand by non-experts [3,4]. The development of water quality indices (WQIs) has been a satisfactory solution to this problem, as it indicates the quality status of a water body with a single unitless numerical value obtained from various WQPs through an aggregation function [3,5,6]. Thus, the WQIs are important tools, as they transform the raw values of WQPs into a single value which helps to express in an easy and fast way the overall water quality status of the monitored river or lake. In addition, WQIs help the decision and policy makers and the water body managers to easily and quickly assess the water body quality status and propose management or remedial measures [7].
Many WQIs have been created and are used to assess surface water quality, and there have been numerous applications [8,9,10,11,12,13,14,15,16]. The most commonly used WQIs are the following: CCME-WQI [17], NSF-WQI [18], Oregon WQI (O-WQI) [19], Prati’s Index of Pollution [20], Weighted Arithmetic WQI [4], Bhargava’s WQI [21], Dinius WQI [22], etc. Various studies have shown that in many cases the results of the indicators obtained from the use of various WQIs can be different even when they are applied to the same water system. This is because each WQI is designed for a different purpose, or uses data from locations with different geomorphological and climatic characteristics, or uses a different function or weights when agglomerating the various WQPs [23,24,25].
Although there are many WQI methods for assessing the water quality of water bodies, none of them is universally recognized as the best for assessing water quality. Many studies have been conducted at both regional and global scales in order to investigate the utility and reliability of WQIs in different settings. However, fewer studies have been performed applying different WQI methods to a specific water system in order to assess their comparative performance [26,27]. Especially for the Mediterranean region, few studies referring to the comparative evaluation of WQIs in various water systems have been published to date. Akkoyunlu and Akiner [28] compared three water quality indices (i.e., CCME WQI, NSF WQI and O-WQI) for the rivers of the Sapanca Lake Basin (Marmara Region, Turkey). Hamlat et al. [29] evaluated and compared ten WQIs (i.e., CCME-WQI, British Columbia WQI, NSF-WQI, O-WQI, ATI, D-WQI, Overall Index of Pollution, Universal WQI, DOE-WQI and ISQA-WQI) in Tafna catchment (Algeria). Perrin et al. [30] applied and compared several WQIs in Vene River (South France) and in Oued Fez River (Morocco). Alexakis et al. [6] applied and compared CCME-WQI and NSF-WQI in Polyphytos artificial lake in Kozani prefecture, Northern Greece. Zotou et al. [26,27] applied and compared seven widely used WQIs in Vosvozis River and in an artificial lake of Aliakmon River, respectively, both located in Northern Greece. The results of all the aforementioned studies showed that there are considerable differences in the water quality classification of water systems when a different index is applied. The conclusion reached was that more studies are needed applying the water quality indices to a large variety of water bodies (i.e., with different local conditions) to reduce the uncertainty regarding their behavior. Then, and possibly after modification or adjustments, they could be applied to the Mediterranean area. The modification mainly refers to the reduction in the initial number of parameters used in the calculation of the indices. The reduction is executed using various methods such as principal component analysis (PCA) [31,32] and the correlation coefficients method between each water quality parameter and the WQI value [26,27].
The purpose of this study was to evaluate and compare the effectiveness of various WQI methods by applying four WQIs in three rivers located in the Mediterranean region (Prefectures of Xanthi and Rhodope, Northern Greece). The WQIs applied and evaluated were the following: NSF-WQI, O-WQI, CCME-WQI and Prati’s Index of Pollution. The rivers selected are of small length (from 30 to 52 km) and are characterized as “ephemeral” as their discharge is reduced to zero for approximately 2 months during the summer season. This also constitutes one of the innovations of the research, i.e., to see the applicability and comparative assessment of known WQIs in small ephemeral streams in Mediterranean countries. The main criteria for the selection of WQIs were first, the availability of the data required for their application and second, their widespread use and potential to assess the overall surface water quality. Another objective was to assess the quality status of the three rivers and find possible discrepancies between their water quality.
2. Materials and Methods
2.1. Study Area Description
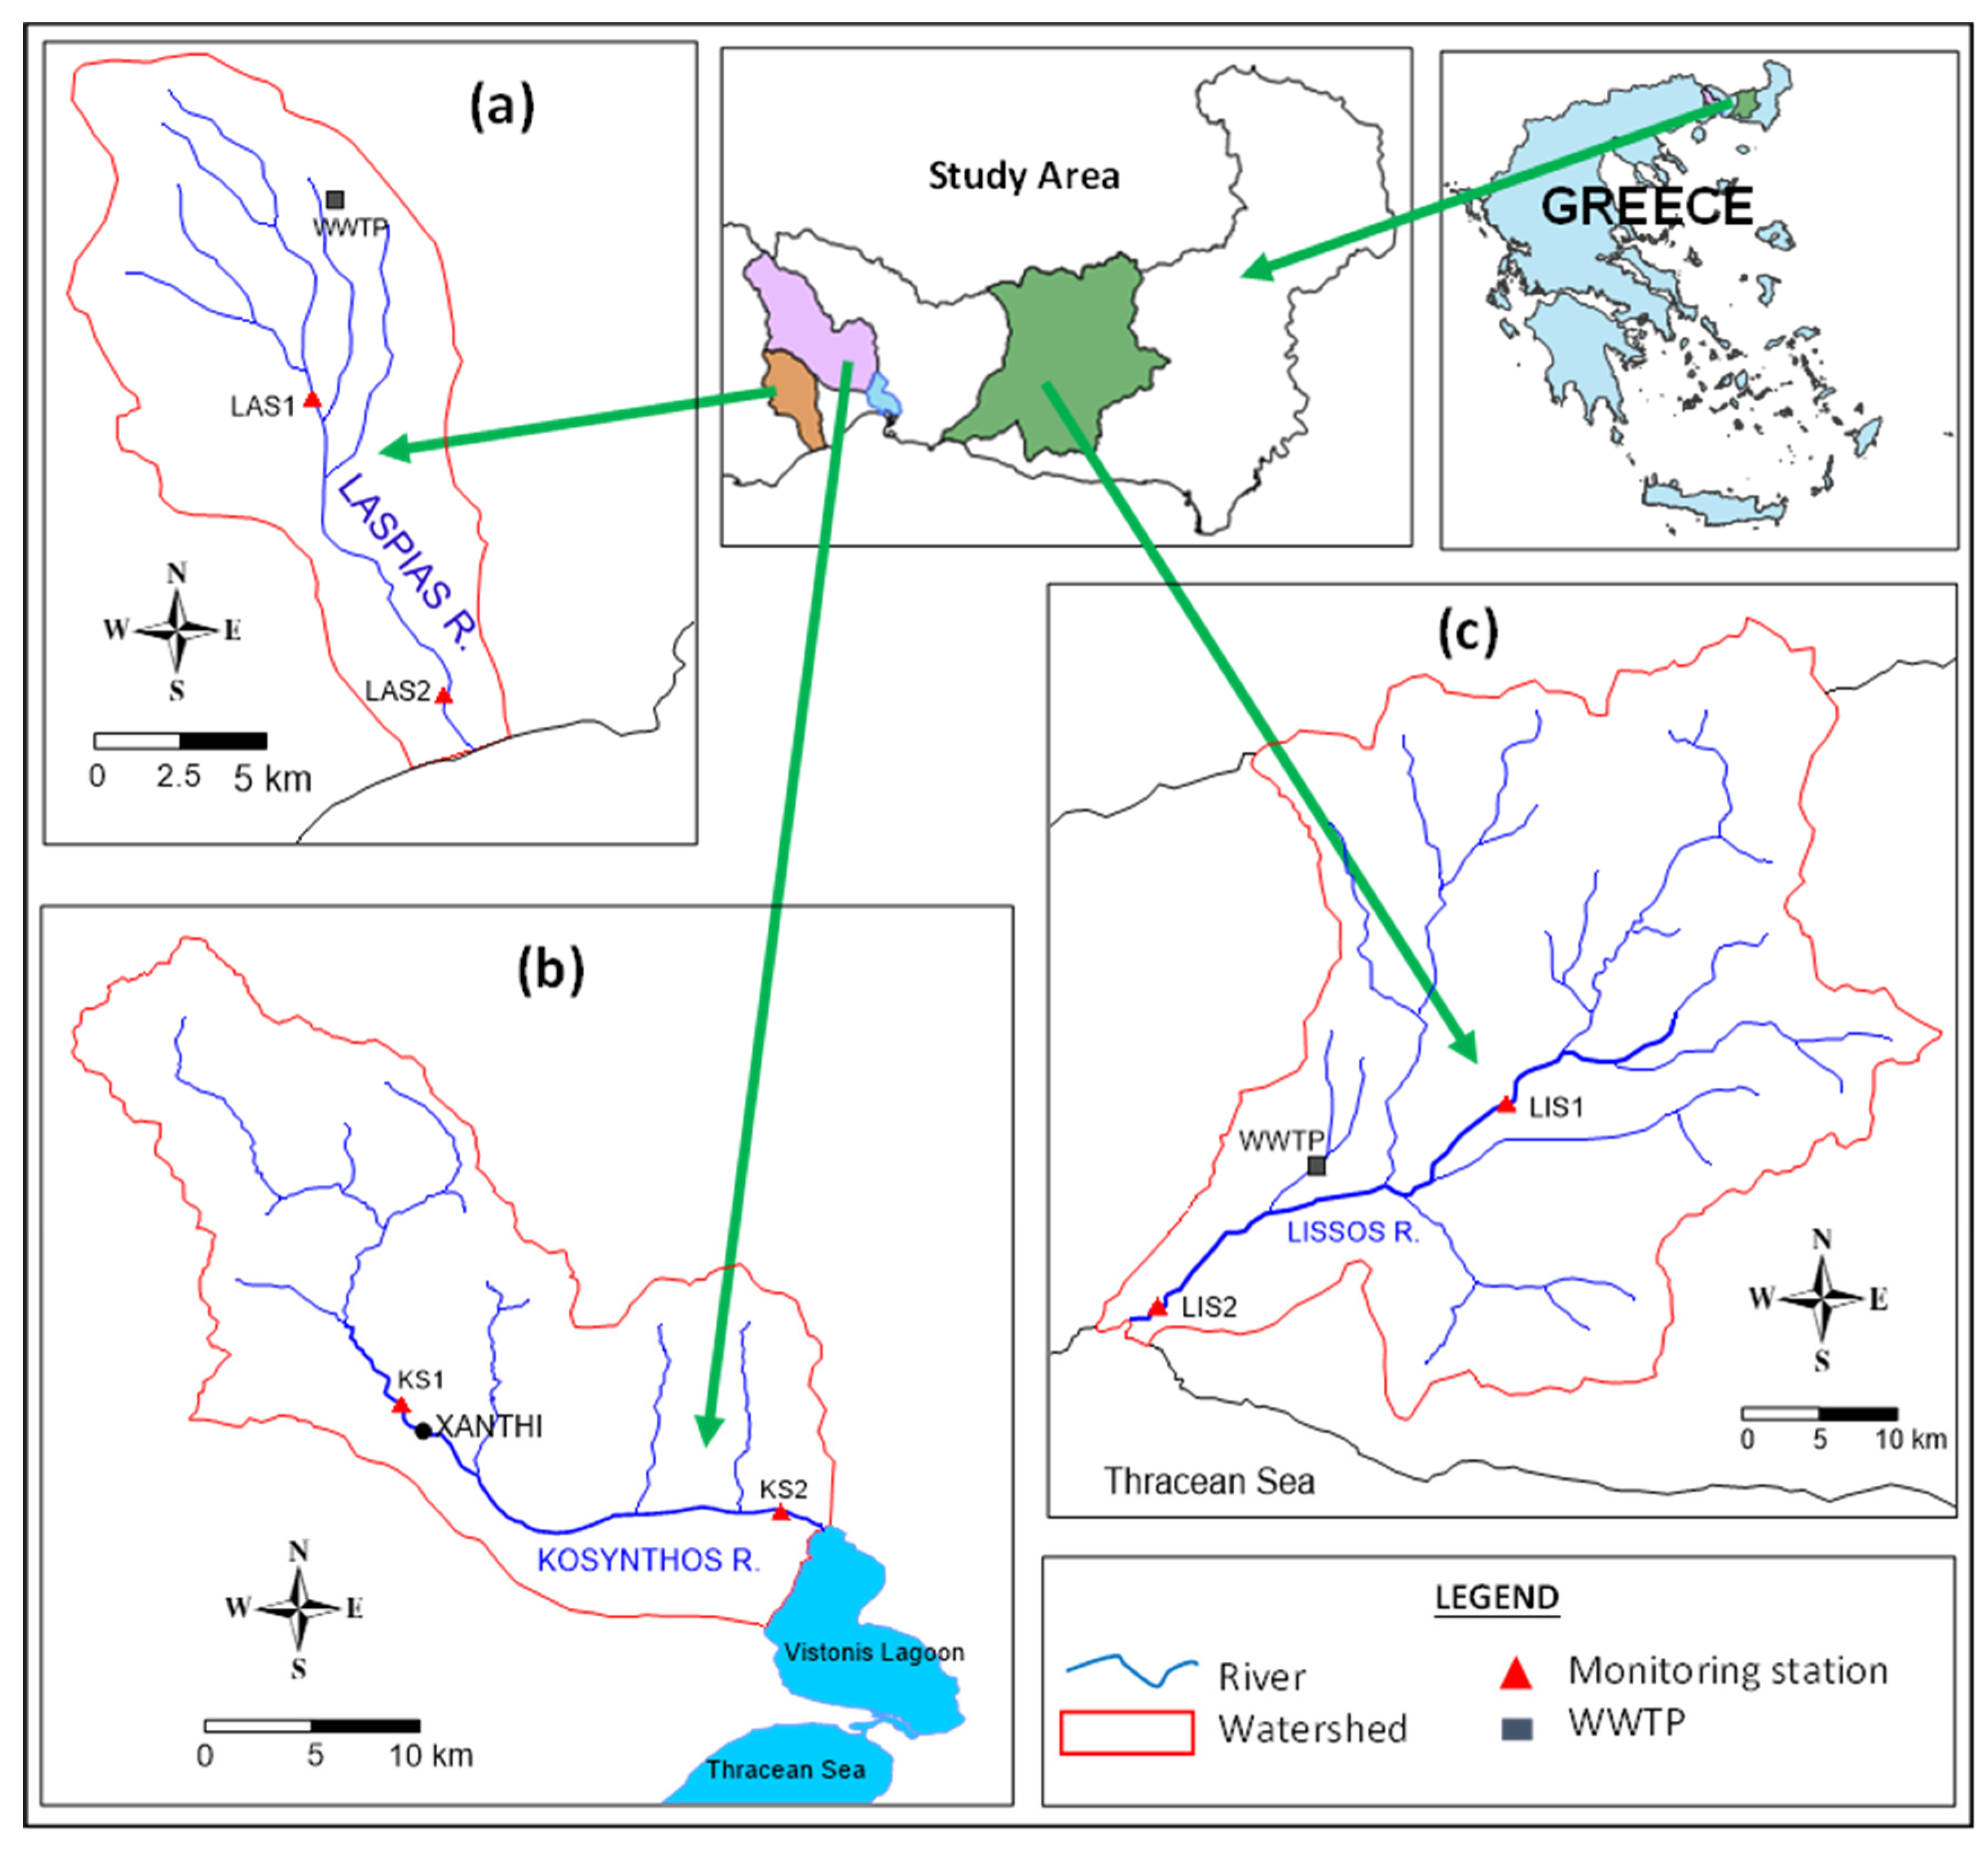
The study areas comprise the watersheds of three ephemeral rivers, namely Laspias, Kosynthos and Lissos, located in Thrace District, Northern Greece (Figure 1). The three rivers spring from the Rhodope Mountains. Rivers Laspias and Lissos drain into the Thracian Sea, North Aegean [33,34], while Kosynthos River empties into Vistonis lagoon, which is an important ecosystem under tidal exchange with the Thracian Sea [35,36,37]. The estuaries of rivers Laspias and Lissos and Vistonis lagoon are protected by the Ramsar Convention. The reason for selecting these three rivers are the following: All three met the criteria of ephemeral streams located in the same area (Northern Greece) which belongs to the wider Mediterranean area; data were available for the present study as water quantity and quality monitoring programs in these rivers were carried out recently; there are water quality issues because intensive agriculture is an activity taking place in their catchment area, as one of the rivers receives urban runoff from the city of Xanthi, and the other two receive treated effluent from wastewater treatment plants. Furthermore, the lowlands of Laspias, Kosynthos and Lissos watersheds are ecologically protected areas included in the “NATURA 2000” network of the EU. The river water is mostly used for irrigation. No matter what the use is, its water quality assessment is needed following the requirements of the EU Water Framework Directive 2000/60/EC [38,39,40].
The geomorphological characteristics as well as the main pollution sources in the three watersheds are presented in Table 1. Detailed descriptions of geomorphological characteristics, meteorological conditions and pollution sources of the watersheds of rivers Laspias, Kosynthos and Lissos are reported by Gikas [33], Gikas et al. [35,36], Pisinaras et al. [37] and Gikas [34], respectively. Briefly, geologically the mountainous part of the three watersheds is located in the Rhodope mountain range and consists of metamorphic rocks (i.e., gneisses, marbles and schists). There are also igneous rocks such as granites and granodiorites that entered the Rhodope massif through magmatic events in tertiary times. The climate in the three watersheds varies depending on elevation. The mean annual precipitation is 622 mm, 748 mm and 706 mm for Laspias, Kosynthos and Lissos watersheds, respectively, with significant discrepancies between the dry (June–September) and wet (October–May) period.
2.2. Data Collection and Measurements
In order to compute the four WQIs (i.e., CCME, O-WQI, NSF-WQI and Prati’s index), the following physicochemical parameters were used: temperature (T), dissolved oxygen (DO), pH, electrical conductivity (EC), BOD5, COD, NO2-N, NO3-N, NH4-N, total phosphorus (TP) and total suspended solids (TSS). Not all these parameters were used in all methodologies, as each methodology uses different WQPs. For the rivers Laspias and Lissos, the data on the quality parameters came from the measurements carried out in previous studies by Gikas [33] and Gikas et al. [34]. In the case of Laspias River, physicochemical parameters were measured at four monitoring stations (namely LS1, LS2, LS3 and LS4) along the river as described in detail by Gikas [33]. The field measurements and water sampling were conducted at a frequency of approximately 10 days from October 2010 to May 2012. For the needs of the present study, only the data of the stations LS2 and LS4 (station code names in the study of Gikas [33] with code names LAS1 and LAS2 (present study), respectively) were used (Figure 1a). LAS1 station was located in the middle of the basin and provides information on the quality of water coming from the upper part of the watershed, where there are agricultural crops and two livestock establishments. Station LAS2 was situated near the mouth of the river and downstream of the site, where the WWTP discharges its effluent.
Regarding Lissos River, the WQPs were measured at seven monitoring stations (namely LS1 to LS7) along the river and its main tributaries as described in detail by Gikas et al. [34]. The field measurements and water sampling were conducted at a frequency of approximately 10 days from October 2010 to July 2011. For the needs of the present study, only the data of stations LS1 and LS3 (station code names in the study of Gikas et al. [34] with code names LIS1 and LIS2 (present study), respectively) were used (Figure 1c). LIS1 station was located in the middle of the basin and provides information on the quality of water coming from the mountainous part of the catchment. LIS2 station was situated upstream of the river mouth and provided information on the overall water quality of the river before its discharge into the Thracian Sea.
To determine WQPs in Kosynthos River, two monitoring and sampling stations (namely KS1 and KS2) along the main course of the river were installed (Figure 1b). The monitoring stations were selected based on the information they provide about the state of the river. KS1 was located after the mountainous area of the watershed and provided information on the quality of water coming from the mountainous part, upstream of the agricultural area. KS2 station was located upstream of the river mouth and this station provided information on the overall water quality of Kosynthos River before its discharge into Vistonis lagoon. All aforementioned WQPs were measured at the two Kosynthos stations. Measurements and sampling were performed at a frequency of 10 days from December 2016 to November 2017. In July and August, the depth and flow velocity at the two Kosynthos stations were extremely low or even zero, so water measurements and sampling were impossible. The following parameters were measured in situ using portable WTW (Weilheim, Germany) instruments: T, DO, pH and EC. In addition, water samples were collected from both stations and transported in a portable cooler to the laboratory, where they were analyzed according to standards methods [41] to determine the concentration of the following parameters: BOD5, COD, NO2-N, NO3-N, NH4-N, TP and TSS. NO2-N and NO3-N were determined with ion chromatography Dionex ICS-300. For the estimation of total dissolved solids (TDS, mg/L) in freshwater, the following equation was used [42]:
where EC (μS/cm) is the electrical conductivity.
TDS = 0.65 × EC
2.3. WQI Description and Application
As mentioned above, the four WQIs selected in the present study to evaluate the water quality status of the three rivers were NSF-WQI, O-WQI, CCME-WQI and Prati’s Index of Pollution. The main criteria for the selection of WQIs were first, the availability of the data required for their application and second, their potential to assess the overall surface water quality. The steps followed to calculate each WQI were as follows: (i) selection of the physicochemical parameters to be used in the calculation; (ii) generation of the corresponding unitless sub-index by transforming concentration values to “water quality” levels using the appropriate mathematical equations; (iii) assignment of an appropriate weighting factor for each sub-index and (iv) calculation of the overall index using a cumulative equation that includes the individual sub-index scores and their respective weighting factors from the previous two steps.
For consistency, the same WQPs were used to calculate the values of the four WQIs used, in order to enable their comparison. We could also have used the Principal Component Analysis (PCA) and/or machine learning techniques to reduce the number of variables to be used in calculating a water quality index [43,44]. However, in this way, a modified form of the WQI would be obtained, which would make difficult or not possible the comparison between the four WQIs in their original form.
Each WQI was calculated separately at each measuring station of each of the three rivers, and then, each computed WQI value was assigned to the corresponding quality category on a scale of 1 to 5, according to each methodology’s classification system. In all cases, the worst quality is indicated by 1 and the best by 5. A brief description of the four WQIs is presented in the subsequent paragraphs, and Table 2 presents additional information such as the physicochemical parameters, weighting factors (for NSF-WQI), objective concentration values (for CCME WQI), the aggregation equation and the classification system used by each WQI.
2.3.1. NSF WQI
Brown et al. [18] recommended a WQI which is known as NSF-WQI because its development was contended by the National Sanitation Foundation (NSF). This index evaluates general water quality. The NSF-WQI calculation is based on the following process: Each WQP is assigned a weighting factor that reflects the parameter’s relative importance to water quality; the value of each WQP is normalized through sub-index function (curve); summing these values produces the final index, whose value ranges between 0 and 100 with 0 representing the worst quality [3,18]. The weights proposed for DO%, pH, BOD5, NO3, PO4, T and TS are 0.17, 0.11, 0.11, 0.10, 0.10, 0.10 and 0.07, respectively. The sum of the weights of all parameters included in the index should be 1.0, otherwise, the weights are modified by dividing the weight value of each parameter by the sum of the weight values. The methodology also proposes a classification system (from 1 to 5) as presented in Table 2. The NSF WQI was used in its original form. Alternatively, the Analytic Hierarchy Process (AHP) method [45] can be used to calculate weighing factors for the NSF WQI application [46]. We decided to not apply the AHP in the current study because we wanted to use the NSF WQI in its original form so that it would be possible the comparison with the results of the other three WQIs.
2.3.2. Oregon WQI
The original O-WQI was created by the Oregon Department of Environmental Quality, USA, in the 1970s. The purpose was to summarize and evaluate Oregon’s streams for general use. The O-WQI was improved in 1995 by adding new sub-indices (i.e., temperature and total phosphorus) and meliorating the aggregation function [19]. Each WQP included in the index is transformed into a sub-index with a value from 10 to 100. The final index (i.e., O-WQI) is produced from all sub-indices using an aggregation formula and ranges from 10 to 100, with 10 expressing the worst water quality. The WQPs, the aggregation function and the classification system are presented in Table 2 [3,19].
2.3.3. CCME WQI
Three factors F1, F2 and F3 participate in the calculation of CCME-WQI which represents overall water quality [17]. The values of the three factors and the final index range from 0 to 100. The F1 factor is called “Scope” and represents the percentage of total WQPs that do not meet the water quality standards or objectives (“failed variables”). The F2 factor is called “Frequency” and represents the percentage of the tests that do not meet the objectives (“failed tests”) relative to the total number of tests. The F3 factor is called “Amplitude” and represents the amount by which the objectives are not met. An advantage of this methodology is that it does not specify which or how many WQPs should be included. The determination of the objective values (water quality standards) was based on a similar study carried out in the same area in Vosvozis River by Zotou et al. [26]. The WQPs, the corresponding objectives, the CCME-WQI calculation equation and the classification system are presented in Table 2. The application developed by CCME [17] was used to calculate the index.
2.3.4. Prati’s Index of Pollution
Prati et al. [20] created this index of pollution which can be used to assess surface water quality for general use. They developed mathematical equations to transform each of the WQPs into a sub-index. The arithmetic mean of the sub-indices provides the value of the final pollution index which ranges between 0 and 14, with a lower score expressing higher water quality, i.e., lower pollution level. In other words, the index value increases when the level of pollution increases and, for this reason, Prati’s index is characterized as an “Ascending scale” or “Pollution” index. The classification system of Prati’s index is presented in Table 2, and the sub-index equations are presented in detail by Prati et al. [20].
3. Results and Discussion
3.1. Water Quality Data of the Three Rivers
Table 3 presents the statistics of physicochemical parameters in the three rivers used to determine the WQIs. The mean temperature values fluctuated at the same levels in the three rivers, which is expected since the rivers are located in the same wider area and their watersheds have the same climatic conditions (Figure 1). The mean values of DO concentration were similar in rivers Kosynthos and Lissos and ranged between 9.8 and 11.2 mg/L. In contrast, the mean DO value in Laspias River was less than 6 mg/L at both stations, while the minimum values measured were 0.7 mg/L and 0.2 mg/L (i.e., anoxic conditions) at stations LAS1 and LAS2, respectively. According to Chapman [47], a low DO concentration indicates water pollution with organic matter and fish death can be observed when its concentration is less than 2 mg/L. The mean pH values in the three rivers, as in the case of temperature, were at the same level (Table 3) and their range of variation (i.e., from 7.8 to 8.5) was within the range of pH value variation for natural waters (i.e., from 6.0 to 8.5) [47]. The EC value in polluted waters is greater than 1 mS/cm [47]. Based on this, rivers Kosynthos and Lissos are considered unpolluted as the average values of EC were lower than 0.55 mS/cm (Table 3), while Laspias is considered polluted as the average values at the two measuring stations were greater than 1.0 mS/cm (Table 3).
The mean BOD5 concentration values in rivers Kosynthos and Lissos ranged from 1.9 mg/L to 2.9 mg/L, which are below the EU limit of 3–6 mg/L for aquatic life [48]; in contrast, the average BOD5 concentration at Laspias River stations LAS1 and LAS2 was 14.4 and 12.0 mg/L, respectively, which is higher than the limit (Table 3). Similarly, the mean COD concentrations in rivers Kosynthos and Lissos were less than the limit of 20 mg/L for unpolluted waters [47], while in Laspias River it was higher than the limit (Table 3). These results show the loading of Laspias River with organic matter. Among the three rivers, Kosynthos presented the lowest mean concentration of NOx-N (i.e., the sum of nitrite and nitrate nitrogen), which was 0.4 and 1.7 mg/L at stations KS1 and KS2, respectively. The mean concentrations in the other two rivers ranged from 2.3 to 5.7 mg/L, with the highest concentrations occurring in Laspias River (Table 3). The mean concentrations of nitrate nitrogen at all six stations were higher than that of nitrite nitrogen whose values were very low or zero. Regarding ammonia nitrogen, a concentration in water bodies greater than 3 mg/L indicates possible pollution from urban sewage, industrial wastewater and/or agricultural runoff [47]. The mean concentrations of NH4-N at stations of Laspias River were 19.1 and 7.5 mg/L for LAS1 and LAS2, respectively, indicating polluted waters, while in the other two rivers, the concentrations ranged between 0.1 and 0.8 mg/L, indicating unpolluted waters.
The concentration of TP in Laspias River is an order of magnitude higher than that of the other two rivers. The waters of all three rivers are considered polluted with total phosphorus as its mean concentration ranged from 0.03 to 0.7 mg P/L (Table 3), which is higher than the limit of 0.005–0.02 mg P/L observed in natural surface waters [47]. At all stations in the three rivers, the measured TSS concentration values were greater than the EU limit of 25 mg/L for aquatic life (Table 3) [47]. However, the mean TSS concentration was greater than 25 mg/L only at station LAS1. Based on the results of the physicochemical parameters, it is clear that the quality of the water in rivers Kosynthos and Lissos was similar, while the water of Laspias River was of lower quality compared to that of the other two rivers. A better picture of the water quality of the three rivers can be obtained from the WQIs.
Based on the Dodds [49] classification method, the trophic state of rivers Laspias and Lissos, during the monitoring period, was eutrophic at both stations [33,34]. Regarding Kosynthos River, the trophic state during the monitoring period was mesotrophic and eutrophic at stations KS1 and KS2, respectively.
3.2. Water Quality Class in the Three Rivers according to the Four WQIs
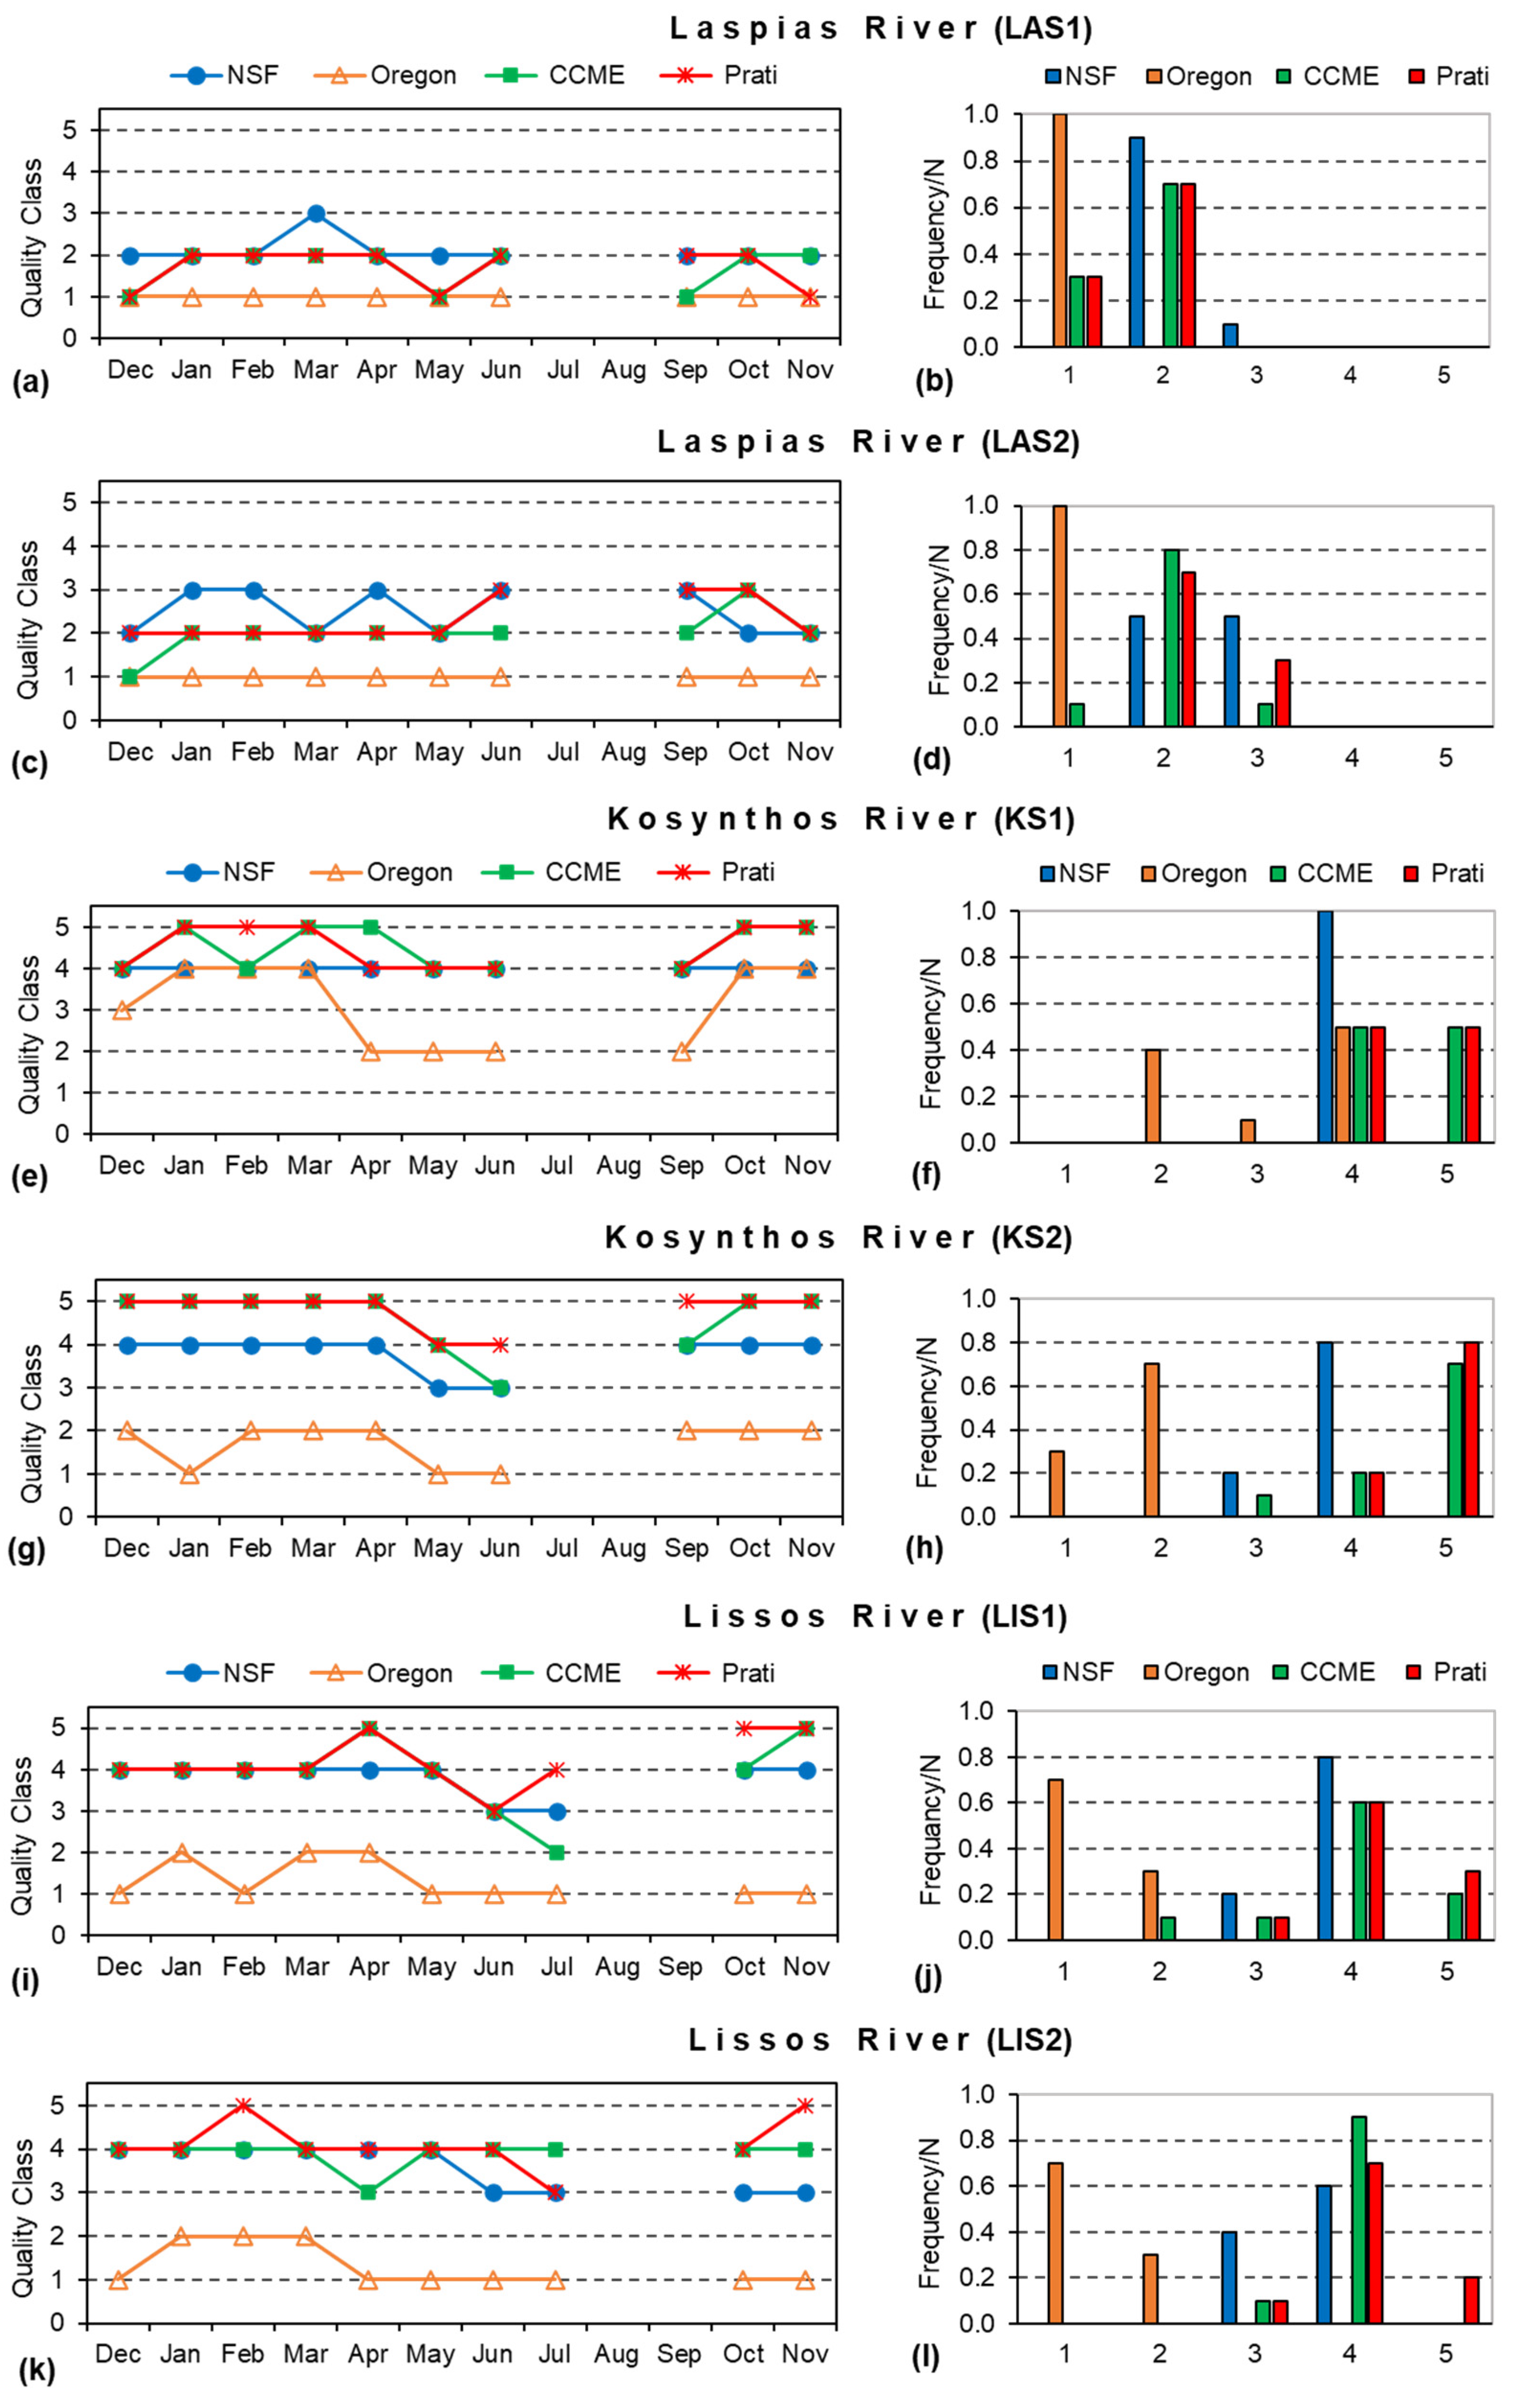
The monthly fluctuation of the quality class in the three rivers (i.e., Laspias, Kosynthos and Lissos) and for each monitoring station of each river (i.e., LAS1, LAS2, KS1, KS2, LIS1 and LIS2) is presented in Figure 2. To make the comparison of WQIs possible and feasible, the quality class (scale 1–5) was chosen, as presented in Table 2, instead of the numerical value of each WQI, because the numerical value scale is not the same for all indices. More specifically, the numerical values of Prati’s Index and O-WQI are expressed on scales of 0–14 and 10–100, respectively, while the NSF-WQI and CCME-WQI are expressed on a scale of 0–100. The correspondence between quality class scale 1–5 and quality characterization (i.e., very bad, bad, fair, good and excellent) is shown in Table 2. In addition, in Figure 2, for each monitoring station, a frequency graph is presented. This chart shows the normalized frequency of occurrence of each WQI in each quality category.
In the case of Laspias River (Figure 2a,c) and at both monitoring stations, the O-WQI classifies the river waters into the lowest quality class (i.e., class 1) and the NSF index into higher quality class than the O-WQI with values between 2 and 3. The CCME-WQI and Prati’s index give classification results lower than the NSF index. More specifically, the CCME classifies the river water into a quality class between 1 and 2 at the LAS1 station and between 1 and 3 at the LAS2 station. Accordingly, Prati’s index classifies the river water into a quality class between 1 and 2 at station LAS1 and between 2 and 3 at station LAS2. The above conclusions are confirmed by the corresponding normalized frequency graphs (Figure 2b,d). The O-WQI appears to be the “strictest” index as it shows no flexibility and classifies Laspias year-round into class 1.
Regarding Kosynthos River (Figure 2e,g), the O-WQI seems to be more flexible or sensitive compared to its results in Laspias River as it classifies the river water into a quality class between 1 and 4 at KS1 station and between 1 and 2 at KS2 station. However, this ranking is again lower than those of the other two indices, which rank Kosynthos at KS1 and KS2 stations into quality classes between 4 and 5, and 3 and 5, respectively. Among the NSF-WQI, CCME-WQI and Prati’s index, the NSF-WQI ranks Kosynthos in a lower quality category compared to the others. More specifically, NSF-WQI classifies the water body into quality class 4 at a frequency of 100% and 80% for KS1 and KS2 stations, respectively, while CCME-WQI and Prati’s index classify this water body into quality classes 4 and 5 at a frequency of 50% for both classes for station KS1. At KS2 monitoring station, Prati classifies the water body into quality classes 4 and 5 at 20% and 80% frequency, respectively, and CCME-WQI into quality classes 3, 4 and 5 at 10%, 20% and 70% frequency, respectively (Figure 2f,h).
Finally, at both monitoring stations of Lissos River, the O-WQI classifies the water body, as in the case of KS2, into quality classes between 1 and 2 indicating lower flexibility as in the case of Kosynthos River (Figure 2i,k). The greater flexibility shown by the O-WQI to changes in the water quality of rivers Kosynthos and Lissos compared to Laspias River is likely due to the high difference in the concentrations of several physicochemical parameters between the rivers. For instance, the mean concentration of EC, COD, NH4-N and TP is at least an order of magnitude higher in Laspias River than the corresponding values in rivers Kosynthos and Lissos (Table 3). Among the NSF-WQI, CCME-WQI and Prati’s index, the NSF-WQI ranks Lissos River, as in the case of Kosynthos River, in a lower quality category compared to the others. More specifically, the NSF-WQI classifies the water body into quality classes between 3 and 4 at a frequency of 20% and 80% for LIS1 station, and 40% and 60% for LIS2 station, respectively. The CCME-WQI and Prati’s index classify the water body mainly into quality class 4 at both LIS1 and LIS2 stations at a frequency higher than 60% (Figure 2j,l).
The graphs in Figure 2 show that for the three rivers, the different WQI methodologies applied rank the three water systems in different quality classes. This fact is probably due to the type and number of parameters used in a WQI (Table 2), the mathematics proposed to obtain unitless numbers, the different aggregation function used by each methodology, the different ranges of the water quality parameters measured in developing the WQI, the method used to set the boundaries in the classification system, the different limits of standards for each water quality parameter, the ultimate water use implied in WQI development, the personal perceptions of the WQI developers on the water quality status of a water body and the relevant classification method, and finally, the fact that the indices were designed for USA (i.e., NSF-WQI and O-WQI) or Canada (i.e., CCME-WQI) rivers, where flow is perennial and where the environmental conditions and anthropogenic activities differ from those of Mediterranean ephemeral streams [5,23,25,26].
The final classification results of the three water bodies obtained from each of the four methodologies are presented in Table 4. This classification is based on the worst-quality scenario recorded at the two monitoring stations of each river. Laspias River is classified at both LAS1 and LAS2 stations into quality class 2 (characterization: bad quality) according to the NSF-WQI, while with all other indices, it is classified into quality class 1 (characterization: poor or very poor quality; Table 2). Kosynthos River is classified at both stations KS1 and KS2 into quality class 4 (characterization: acceptable) according to Prati’s Pollution Index. According to the NSF and CCME indices, at station KS2, it is classified into quality class 3 (characterization: medium or fairly poor quality); based on O-WQI, it is classified, only at station KS2, into the lowest class 1 (i.e., very poor quality). Finally, Lissos River is ranked at both stations LS1 and LS2 according to the NSF-WQI and Prati’s Index of Pollution into quality class 3 (characterization: medium quality or slight pollution), with the CCME-WQI, into quality class 2 (i.e., marginal quality) and according to the O-WQI, it is ranked, only at KS2, into the lowest class 1 (i.e., very poor water quality).
Previous studies have also compared the WQIs used in the present study. Zotou et al. [26] compared seven WQIs including NSF-WQI, CCME-WQI, O-WQI and Prati’s index in assessing the water quality of Vosvozis River, Rhodope Prefecture, North Greece. Zotou et al. [26] results agree with those of the present study regarding the O-WQI index. The results are also similar for all indices to those of Laspias River, while there is no agreement with those of rivers Kosynthos and Lissos as the NSF index tends to classify the water body (i.e., Vosvozis River) into a higher class compared to the CCME-WQI and Prati’s Index. These results are probably due to the fact that the values of several physicochemical parameters (e.g., NH4-N, TP, COD and BOD5) in Vosvozis River are similar to those in Laspias River. Other studies also report that the NSF-WQI leads to higher quality classes compared to O-WQI [23,28].
According to Darvishi et al. [24], who compared NSF and O-WQI in assessing the water quality of Talar River discharging into the Caspian Sea, NSF classifies river waters into a higher quality class than O-WQI. They consider the NSF index as more suitable for the assessment of Talar River water quality. Perrin et al. [30] assessed the water quality of the Vene River (France) and the Oued Fez and Sebou Rivers (Morocco) in the Mediterranean region using 17 WQIs, including Prati’s Index of Pollution, CCME-WQI and O-WQI. The results, which are in agreement with those of the present study, showed that the indices presented sensitivity to the hydrological conditions and the different geographical locations. The CCME index clearly reflected changes in water quality along rivers even under extreme low-flow conditions that characterize most ephemeral rivers in the Mediterranean region [50]. The O-WQI ranked rivers into the lowest quality class even in locations known to be less polluted. Akkoyunlu and Akiner [28] assessed river quality in the Sapanca Lake Basin using several indices, including CCME-WQI, O-WQI and NSF-WQI. The comparative assessment showed that the NSF-WQI was the best approach to reflect the river quality in the Sapanca Lake Basin, while the water quality classifications of CCME-WQI and O-WQI were mainly “very poor”, “poor” and “marginal”. Hamlet et al. [29] give similar results of the Tafna Basin (north-western Algeria) to those of Laspias River of the present study, regarding the relative performance of CCME, NSF and Oregon WQIs, emphasizing that results differ from one region to another depending on local conditions.
The European Council Water Framework Directive (WFD) [38] has set the objectives concerning the prevention of water degradation (inland, transitional and coastal) and the achievement and maintenance of their good ecological status [39]. Based on the WFD, the assessment of the ecological status of a river is based on river basin management plans, which include monitoring programs on several quality parameters. The ecological status is determined based on three qualitative elements: biological, physicochemical and hydro-morphological [40,51]. After 22 years of WFD implementation in Europe, there is a concern that the target of good status, or higher, in all EU waters has not yet been achieved [52], and it is proposed to assess the effectiveness of the ecological assessment and investigate its improvement [53,54].
The ecological status of a water system (e.g., river) is determined by the physicochemical state of the system, biological parameters (e.g., phytoplankton, macrophages invertebrates) and hydro-morphological elements (e.g., depth, width and flow). The WFD methodology as proposed to be implemented by the Ministry of Environment and Energy of Greece (WFD-MEEG) was used to assess the physicochemical quality of the river water based on the nutrient classification system (NCS) method [55]. The types of nutrients included are N-NO3, N-NH4 and N-NO2. The method was modified to additionally include the following parameters: total phosphorus (TP), P-PO4 and dissolved oxygen (DO). The methodology for assessing the physicochemical quality of surface water systems in Greece has been presented in detail by Panagopoulos et al. [56] and Gikas et al. [50].
In the recent literature [52,53,57], the following are mentioned as the main weaknesses of the WFD: (a) the “one-out, all-out” principle, (b) the lack of a different line of evidence delineating the cause–effect relationship, and (c) the definition of reference conditions and degree of deviation from the reference. The “one-out, all-out” principle shows the strictness of the methodology because it results in the lowest ecological status for the water body being assigned by any of the quality elements considered.
Regardless of the WQPs used in some WQIs and the appropriate mathematical equations proposed to obtain a unitless sub-index, the main question is how to define the boundaries between water quality classes. To avoid subjectivity and improve the adaptability of the WQIs application, new techniques have been developed, emphasizing the weighting of parameters. A representative example is the use of the information entropy method. This has led to an improved WQI, the entropy-weighted water quality index, which has been efficiently used in the evaluation of hydrogeochemical water quality [56,58]. Andricevic [54] reported a methodology for the ecological status assessment based on quantifying the uncertainty of selected quality descriptors through the probabilistic description. The classification boundaries for each selected metric were determined based on the correlation between the TRIX index scale [59], which relates the trophic status, and corresponding coastal water quality conditions.
The question to be answered in this work was whether the WQIs used can be applied to small rivers in assessing quality status based on physicochemical parameters. The research results showed that the CCME index better describes the spatial and temporal changes occurring in river water quality compared to the others. It should be stressed that these indices evaluate the physicochemical state of the waters, which was the classic water quality assessment that was used before the implementation of the WFD. The inclusion of the ecological lines of evidence (LoE) in the evaluation of water bodies constitutes an innovation of the WFD [53]. Therefore, for the evaluation of the ecological status of the water body based on WFD requirements, WQI results can be used to assess the physicochemical element, and this assessment can be complemented by the biological quality element assessment.
4. Conclusions
In the present study, the water quality of three rivers in the Mediterranean region (Northern Greece) was assessed using and comparing four water quality indices that are considered the most important and widely used. The results showed that for the same water body, the application of different WQI methodologies results in significant deviations in quality classification. In addition, the flexibility of the indices varies significantly when the values of the physicochemical parameters participating in the WQI methodology to estimate the quality status of the water body increase. It was found that Prati’s Index of Pollution tends to classify water bodies into higher quality classes compared to the CCME-WQI and NSF-WQI, while the Oregon WQI proved to be the strictest and least flexible index giving results ranging in the lowest quality class. From the present and other studies in the international literature, it appears that the CCME-WQI is flexible or sensitive enough to better describe the temporal and spatial changes occurring in water body quality and at the same time conservative enough to not overestimate the quality of the water body. Therefore, the use of CCME can be a useful tool for system administrators and policy makers. However, the effort to develop an index that takes into account the characteristics of the water body, such as geographical, hydrological, pollution sources and pollutant loads in the Mediterranean area, is necessary to capture the actual quality status of the water systems.
Author Contributions
Conceptualization, G.D.G.; methodology, G.D.G.; formal analysis, G.D.G. and D.L.; investigation, G.D.G. and D.L.; resources, G.D.G. and V.A.T.; writing—original draft preparation, G.D.G. and D.L.; writing—review and editing, V.A.T.; visualization, G.D.G. and V.A.T.; supervision, G.D.G.; project administration, G.D.G. All authors have read and agreed to the published version of the manuscript.
Funding
This research received no external funding.
Data Availability Statement
The data supporting the research findings of this study are available from the corresponding author upon request.
Conflicts of Interest
The authors declare no conflict of interest.
References
- Kummu, M.; Guillaume, J.H.A.; De Moel, H.; Eisner, S.; Flörke, M.; Porkka, M.; Siebert, S.; Veldkamp, T.I.E.; Ward, P.J. The world’s road to water scarcity: Shortage and stress in the 20th century and pathways towards sustainability. Sci. Rep. 2016, 6, 38495. [Google Scholar] [CrossRef] [Green Version]
- Gupta, S.; Gupta, S.K. A critical review on water quality index tool: Genesis, evolution and future directions. Ecol. Inform. 2021, 63, 101299. [Google Scholar] [CrossRef]
- Abbasi, T.; Abbasi, S.A. Water Quality Indices; Elsevier: Amsterdam, The Netherlands, 2012; p. 363. [Google Scholar]
- Tyagi, S.; Sharma, B.; Singh, P.; Dobhal, R. Water quality assessment in terms of Water Quality Index. Am. J. Water Resour. 2013, 1, 34–38. [Google Scholar] [CrossRef]
- Uddin, M.G.; Nash, S.; Olbert, A.I. A review of water quality index models and their use for assessing surface water quality. Ecol. Indic. 2021, 122, 107218. [Google Scholar] [CrossRef]
- Alexakis, D.; Tsihrintzis, V.A.; Tsakiris, G.; Gikas, G.D. Suitability of water quality indices for application in lakes in the Mediterranean. Water Resour. Manag. 2016, 30, 1621–1633. [Google Scholar] [CrossRef]
- Noori, R.; Berndtsson, R.; Hosseinzadeh, M.; Adamowski, J.F.; Abyaneh, M.R. A critical review on the application of the National Sanitation Foundation Water Quality Index. Environ. Pollut. 2019, 244, 575–587. [Google Scholar] [CrossRef]
- Trikoilidou, E.; Samiotis, G.; Tsikritzis, L.; Kevrekidis, T.; Amanatidou, E. Evaluation of water quality indices adequacy in characterizing the physico-chemical water quality of lakes. Environ. Process. 2017, 4 (Suppl. 1), 35–46. [Google Scholar] [CrossRef]
- Adimalla, N.; Li, P.; Venkatayogi, S. Hydrogeochemical evaluation of groundwater quality for drinking and irrigation purposes and integrated interpretation with water quality index studies. Environ. Process. 2018, 5, 363–383. [Google Scholar] [CrossRef]
- Yaseen, Z.M.; Ramal, M.M.; Diop, L.; Jaafar, O.; Demir, V.; Kisi, O. Hybrid adaptive neuro-fuzzy models for water quality index estimation. Water Resour. Manag. 2018, 32, 2227–2245. [Google Scholar] [CrossRef]
- Bao, Q.; Yuxin, Z.; Yuxiao, W.; Feng, Y. Can entropy weight method correctly reflect the distinction of water quality indices? Water Resour. Manag. 2020, 34, 3667–3674. [Google Scholar] [CrossRef]
- Sierra-Porta, D. Hydrogeochemical evaluation of water quality suitable for human consumption and comparative interpretation for water quality index studies. Environ. Process. 2020, 7, 579–596. [Google Scholar] [CrossRef]
- Prusty, P.; Farooq, S.H. Application of water quality index and multivariate statistical analysis for assessing coastal water quality. Environ. Process. 2020, 7, 805–825. [Google Scholar] [CrossRef]
- Jamshidzadeh, Z. An integrated approach of hydrogeochemistry, statistical analysis, and drinking water quality index for groundwater assessment. Environ. Process. 2020, 7, 781–804. [Google Scholar] [CrossRef]
- Xia, J.; Zeng, J. Environmental factors assisted the evaluation of entropy water quality indices with efficient machine learning technique. Water Resour. Manag. 2022, 36, 2045–2060. [Google Scholar] [CrossRef]
- Gao, Z.; Liu, Y.; Li, N.; Ma, K. An enhanced Beetle Antennae Search algorithm based comprehensive water quality index for urban river water quality assessment. Water Resour. Manag. 2022, 36, 2685–2702. [Google Scholar] [CrossRef]
- Canadian Council of Ministers of the Environment (CCME). Canadian Water Quality Guidelines for the Protection of Aquatic Life: Water Quality Index 1.0, User’s Manual. In Canadian Environmental Quality Guidelines; Canadian Council of Ministers of the Environment: Winnipeg, MB, Canada, 2001. Available online: http://www.mae.gov.nl.ca/waterres/quality/background/cwqi.html (accessed on 30 October 2022).
- Brown, R.M.; McClelland, N.I.; Deininger, R.A.; Tozer, R.G. A Water Quality Index-Do We Dare? Water Sew. Works 1970, 17, 339–343. [Google Scholar]
- Cude, C.G. Oregon Water Quality Index: A Tool for Evaluating Water Quality Management Effectiveness. J. Am. Water Resour. Assoc. 2001, 37, 125–137. [Google Scholar] [CrossRef]
- Prati, L.; Pavanello, R.; Pesarin, F. Assessment of Surface Water Quality by a Single Index of Pollution. Water Res. 1971, 5, 741–751. [Google Scholar] [CrossRef]
- Bhargava, D.S. Water quality variations and control technology of Yamuna River. Environ. Pollut. Ser. A Ecol. Biol. 1985, 37, 355–376. [Google Scholar] [CrossRef]
- Dinius, S.H. Design of an index of water quality. J. Am. Water Resour. Assoc. 1987, 23, 833–843. [Google Scholar] [CrossRef]
- Marselina, M.; Wibowo, F.; Mushfiroh, A. Water quality index assessment methods for surface water: A case study of the Citarum River in Indonesia. Heliyon 2022, 8, e09848. [Google Scholar] [CrossRef]
- Darvishi, G.; Kootenaei, F.G.; Ramezani, M.; Lotfi, E.; Asgharnia, H. Comparative investigation of river water quality by OWQI, NSFWQI, and wilcox indexes (case study: The Talar River—Iran). Arch. Environ. Prot. 2016, 42, 41–48. [Google Scholar] [CrossRef] [Green Version]
- Kachroud, M.; Trolard, F.; Kefi, M.; Jebari, S.; Bourrié, G. Water quality indices: Challenges and application limits in the literature. Water 2019, 11, 361. [Google Scholar] [CrossRef] [Green Version]
- Zotou, I.; Tsihrintzis, V.A.; Gikas, G.D. Performance of seven water quality indices (WQIs) in a Mediterranean river. Environ. Monit. Assess. 2019, 191, 505. [Google Scholar] [CrossRef]
- Zotou, I.; Tsihrintzis, V.A.; Gikas, G.D. Water quality evaluation of a lacustrine water body in the Mediterranean based on different water quality index (WQI) methodologies. J. Environ. Sci. Health Part A 2020, 55, 537–548. [Google Scholar] [CrossRef]
- Akkoyunlu, A.; Akiner, M.E. Pollution evaluation in streams using water quality indices: A case study from Turkey’s Sapanca Lake Basin. Ecol. Indic. 2012, 18, 501–511. [Google Scholar] [CrossRef]
- Hamlat, A.; Guidoum, A.; Koulala, I. Status and trends of water quality in the Tafna catchment: A comparative study using water quality indices. J. Water Reuse Desalination 2017, 7, 228–245. [Google Scholar] [CrossRef] [Green Version]
- Perrin, J.L.; Salles, C.; Bancon-Montigny, C.; Raïs, N.; Chahinian, N.; Dowse, L.; Rodier, C.; Tournoud, M.G. Comparison of index systems for rating water quality in intermittent rivers. Environ. Monit. Assess. 2018, 190, 70. [Google Scholar] [CrossRef]
- Najafzadeh, M.; Homaei, F.; Farhadi, H. Reliability assessment of water quality index based on guidelines of national sanitation foundation in natural streams: Integration of remote sensing and data-driven models. Artif. Intell. Rev. 2021, 54, 4619–4651. [Google Scholar] [CrossRef]
- Najafzadeh, M.; Ghaemi, A.; Emamgholizadeh, S. Prediction of water quality parameters using evolutionary computing-based formulations. Int. J. Environ. Sci. Technol. 2019, 16, 6377–6396. [Google Scholar] [CrossRef]
- Gikas, G.D. Water quantity and hydrochemical quality monitoring of Laspias River, North Greece. J. Environ. Sci. Health Part A 2017, 52, 1312–1321. [Google Scholar] [CrossRef]
- Gikas, G.D.; Dimou, D.; Tsihrintzis, V.A. River water quantity and quality monitoring in an agricultural basin in North Greece. Fresenius Environ. Bull. 2013, 22, 2006–2016. [Google Scholar]
- Gikas, G.D.; Yiannakopoulou, T.; Tsihrintzis, V.A. Modeling of non-point source pollution in a Mediterranean drainage basin. Environ. Model. Assess. 2006, 11, 219–234. [Google Scholar] [CrossRef]
- Gikas, G.D.; Yiannakopoulou, T.; Tsihrintzis, V.A. Water quality trends in a coastal lagoon impacted by non-point source pollution after implementation of protective measures. Hydrobiologia 2006, 563, 385–406. [Google Scholar] [CrossRef]
- Pisinaras, V.; Petalas, C.; Gikas, G.D.; Gemitzi, A.; Tsihrintzis, V.A. Hydrological and water quality modeling in a medium-sized basin using the Soil and Water Assessment Tool (SWAT). Desalination 2010, 250, 274–286. [Google Scholar] [CrossRef]
- WFD, 2000. Directive of the European Parliament and of the council 2000/60/EC establishing a framework for community action in the field of water policy. Official Journal C513 23/10/2000. 2000. Available online: https://eur-lex.europa.eu/resource.html?uri=cellar:5c835afb-2ec6-4577-bdf8-756d3d694eeb.0004.02/DOC_1&format=PDF (accessed on 15 December 2022).
- Tsakiris, G. The status of the European waters in 2015: A review. Environ. Process. 2015, 2, 543–557. [Google Scholar] [CrossRef] [Green Version]
- Zacharias, I.; Liakou, P.; Biliani, I. A Review of the status of surface European waters twenty years after WFD introduction. Environ. Process. 2020, 7, 1023–1039. [Google Scholar] [CrossRef]
- APHA, AWWA. Standard Methods for the Examination of Water and Wastewater, 20th ed.; American Public Health Association & American Water Works Association: Washington, DC, USA, 1998. [Google Scholar]
- Rusydi, A.F. Correlation between conductivity and total dissolved solid in various type of water: A review. IOP Conf. Ser. Earth Environ. Sci. 2018, 118, 012019. [Google Scholar] [CrossRef]
- Gradilla-Hernández, M.S.; de Anda, J.; Garcia-Gonzalez, A.; Montes, C.Y.; Barrios-Piña, H.; Ruiz-Palomino, P.; Díaz-Vázquez, D. Assessment of the water quality of a subtropical lake using the NSF-WQI and a newly proposed ecosystem specific water quality index. Environ. Monit. Assess. 2020, 192, 296. [Google Scholar] [CrossRef]
- Mahanty, B.; Lhamo, P.; Sahoo, N.K. Inconsistency of PCA-based water quality index—Does it reflect the quality? Sci. Total Environ. 2023, 866, 161353. [Google Scholar] [CrossRef]
- Saaty, T.L. The Analytic Hierarchy Process; McGraw Hill: New York, NY, USA; RWS Publications International: Pittsburgh, PA, USA, 1980. [Google Scholar]
- Sutadian, A.D.; Muttil, N.; Yilmaz, A.G.; Perera, B.J.C. Using the Analytic Hierarchy Process to identify parameter weights for developing a water quality index. Ecol. Indic. 2017, 75, 220–233. [Google Scholar] [CrossRef]
- Chapman, D. Water Quality Assessments, A Guide to the Use of Biota, Sediments and Water in Environmental Monitoring, 2nd ed.; Chapman & Hall: London, UK; Great Britain, University Press: Cambridge, UK, 1996; p. 559. [Google Scholar]
- Directive 2006/44/EC of the European parliament and of the council of 6 September 2006 on the quality of fresh waters needing protection or improvement in order to support fish life. Off. J. Eur. Union 2006, 264, 20–31.
- Dodds, W.K. Eutrophication and trophic state in rivers and streams. Limnol. Oceanogr. 2006, 51, 671–680. [Google Scholar] [CrossRef] [Green Version]
- Gikas, G.D.; Sylaios, G.K.; Tsihrintzis, V.A.; Konstantinou, I.K.; Albanis, T.; Boskidis, I. Comparative evaluation of river chemical status based on WFD methodology and CCME water quality index. Sci. Total Environ. 2020, 745, 140849. [Google Scholar] [CrossRef] [PubMed]
- Papadaki, C.; Soulis, K.; Bellos, V.; Ntoanidis, L.; Dimitriou, E. Estimation of a suitable range of discharges for the development of instream flow recommendations. Environ. Process. 2020, 7, 703–721. [Google Scholar] [CrossRef]
- Carvalho, L.; Mackay, E.B.; Cardoso, A.C.; Baattrup-Pedersen, A.; Birk, S.; Blackstock, K.L.; Borics, G.; Borja, A.; Feld, C.K.; Ferreira, M.T.; et al. Protecting and restoring Europe’s waters: An analysis of the future development needs of the Water Framework Directive. Sci. Total Environ. 2019, 658, 1228–1238. [Google Scholar] [CrossRef]
- Santos, J.I.; Vidal, T.; Gonçalves, F.J.; Castro, B.B.; Pereira, J.L. Challenges to water quality assessment in Europe—Is there scope for improvement of the current Water Framework Directive bioassessment scheme in rivers? Ecol. Indic. 2021, 121, 107030. [Google Scholar] [CrossRef]
- Andricevic, R. Ecological quality assessment under uncertainty for transitional and coastal waters: Central Eastern Adriatic Sea study. Ecol. Indic. 2022, 138, 108850. [Google Scholar] [CrossRef]
- Skoulikidis, N.; Amaxidis, Y.; Bertahas, I.; Laschou, S.; Gritzalis, K. Analysis of factors driving stream water composition and synthesis of management tools—A case study on small/medium Greek catchments. Sci. Total Environ. 2006, 362, 205–241. [Google Scholar] [CrossRef]
- Panagopoulos, Y.; Alexakis, D.E.; Skoulikidis, N.T.; Laschou, S.; Papadopoulos, A.; Dimitriou, E. Implementing the CCME water quality index for the evaluation of the physicochemical quality of Greek rivers. Water 2022, 14, 2738. [Google Scholar] [CrossRef]
- Voulvoulis, N.; Arpon, K.D.; Giakoumis, T. The EU Water Framework Directive: From great expectations to problems with implementation. Sci. Total Environ. 2017, 575, 358–366. [Google Scholar] [CrossRef] [PubMed] [Green Version]
- Xiao, Y.; Liu, K.; Hao, Q.; Xiao, D.; Zhu, Y.; Yin, S.; Zhang, Y. Hydrogeochemical insights into the signatures, genesis and sustainable perspective of nitrate enriched groundwater in the piedmont of Hutuo watershed, China. CATENA 2022, 212, 106020. [Google Scholar] [CrossRef]
- Rinaldi, A.; Giovanardi, F. Contribution of Richard A. Vollenweider toward understanding eutrophication of the coastal Adriatic Sea. Aquat. Ecosyst. Health Manag. 2011, 14, 200–203. [Google Scholar] [CrossRef]
Figure 1.
Study area: (a) Laspias watershed, (b) Kosynthos watershed and (c) Lissos watershed.

Figure 2.
Monthly variation of the quality class based on each WQI (a,c,e,g,i,k), and the normalized frequency diagrams for each WQI and quality class (b,d,f,h,j,l) at the monitoring sites of rivers Laspias, Kosynthos and Lissos.
Figure 2.
Monthly variation of the quality class based on each WQI (a,c,e,g,i,k), and the normalized frequency diagrams for each WQI and quality class (b,d,f,h,j,l) at the monitoring sites of rivers Laspias, Kosynthos and Lissos.


Table 1.
Geomorphological characteristics and pollution sources of the studied rivers [33,34,35,36,37].
| Characteristics | Laspias | Kosynthos | Lissos |
|---|---|---|---|
| Length | 30 km | 52 km | 45 km |
| Watershed area and morphology | 221 km2; mountainous 14%, plain area 86% | 440 km2; mountainous 80%, plain area 20% | 1475 km2; mountainous 26%, hilly area 34%, plain area 40% |
| Cultivated area | 122 km2 | 65 km2 | 407 km2 |
| Nutrient quantities used in agricultural activities | Nitrogen 1358 tn/y Phosphorus 239 tn/y | Nitrogen 1190 tn/y Phosphorus 162 tn/y | Nitrogen 5186 tn/y Phosphorus 958 tn/y |
| Pollution sources | Effluents from the WWTP * of the city of Xanthi, light industry, agricultural runoff, livestock units | Untreated wastewater from small settlements, urban and agricultural runoff, livestock units | Effluents from the WWTP * of an industrial area, agricultural runoff |
Note: * WWTP, wastewater treatment plant.
Table 2.
Parameters, aggregation function and classification scheme of each index.
| Index | Parameter (Unit) | Weight b | OV c | Aggregation Formula d | Range of WQI, Characterization | Class |
|---|---|---|---|---|---|---|
| NSF WQI [3,18] | DO (%) pH BOD5 (mg/L) NO3 (mg/L) PO4 (mg/L) T (°C) TS (mg/L) | 0.224 0.144 0.144 0.132 0.132 0.132 0.092 | - | 91–100 = Excellent 71–90 = Good 51–70 = Medium 26–50 = Bad 0–25 = Very bad | 5 4 3 2 1 | |
| O-WQI [19] | DO (mg/L), pH, BOD5 (mg/L) NH4-N + NO3-N (mg N/L) TP (mg P/L), T (°C), TSS (mg/L) | - | - | 90–100 = Excellent 85–89 = Good 80–84 = Fair 60–79 = Poor 10–59 = Very poor | 5 4 3 2 1 | |
| CCME WQI [17] | DO (mg/L) pH BOD5 (mg/L) TSS (mg/L) NH4-N (mg N/L) NOx-N (mg N/L) a TP (mg P/L) | - | >6 6.5–9.0 <6.0 <25 <0.6 <10 <0.165 | F1: Scope F2: Frequency F3: Amplitude | 95–100 = Excellent 80–94 = Good 65–79 = Fair 45–64 = Marginal 0–44 = Poor | 5 4 3 2 1 |
| Prati’s index of pollution [20] | DO (mg/L), pH, BOD5 (mg/L) COD (mg/L) TSS (mg/L) NO3-N (mg N/L) NH4-N (mg N/L) TP (mg P/L) | - | - | 0–1 = Excellent 1–2 = Acceptable 2–4 = Slight pollution 4–8 = Pollution >8 = Heavy pollution | 5 4 3 2 1 |
Note(s): a NOx-N = NO3-N + NO2-N; b modified weight for this study; c OV, objective values; d n, number of parameters, wi, weight of the ith parameter, SIi, sub-index value of the ith parameter.
Table 3.
Data of physicochemical parameters of rivers Laspias, Kosynthos and Lissos.
| Parameter | LAS1 | LAS2 | KS1 | KS2 | LIS1 | LIS2 | |
|---|---|---|---|---|---|---|---|
| Τ (°C) | Mean | 11.8 | 13.0 | 12.1 | 15.8 | 14.5 | 14.5 |
| SD * (n *) | 5.7 (35) | 5.7 (35) | 6.1 (25) | 6.5 (25) | 6.0 (20) | 7.2 (20) | |
| Min *–Max * | 2.1–22.8 | 3.9–22.8 | 2.0–22.3 | 5.7–27.8 | 5.2–26.0 | 5.5–28.0 | |
| DO (mg/L) | Mean | 5.0 | 5.7 | 11.1 | 11.2 | 10.0 | 9.8 |
| SD (n) | 3.1 (35) | 3.2 (35) | 2.5 (25) | 2.4 (25) | 1.8 (20) | 1.9 (20) | |
| Min–Max | 0.7–10.6 | 0.2–10.6 | 5.4–16.4 | 5.7–15.2 | 7.1–12.7 | 6.7–12.8 | |
| pH | Mean | 8.0 | 7.8 | 8.5 | 8.1 | 7.8 | 8.1 |
| SD (n) | 0.2 (35) | 0.2 (35) | 0.3 (25) | 0.3 (25) | 0.3 (20) | 0.2 (20) | |
| Min–Max | 7.5–8.4 | 7.3–8.2 | 8.0–9.5 | 7.2–8.7 | 7.2–8.3 | 7.7–8.7 | |
| EC (mS/cm) | Mean | 1.67 | 1.13 | 0.17 | 0.39 | 0.36 | 0.55 |
| SD (n) | 0.36 (35) | 0.53 (35) | 0.05 (25) | 0.13 (25) | 0.09 (20) | 0.13 (20) | |
| Min–Max | 0.63–2.31 | 0.36–2.25 | 0.09–0.26 | 0.15–0.64 | 0.19–0.53 | 0.28–0.80 | |
| ΒOD5 (mg/L) | Mean | 14.4 | 12.0 | 2.2 | 2.1 | 2.9 | 2.9 |
| SD (n) | 15.6 (30) | 9.0 (31) | 2.5 (25) | 3.2 (25) | 3.7 (20) | 3.6 (20) | |
| Min–Max | 0.0–71.2 | 1.4–36.7 | 0.0–8.1 | 0.0–11.5 | 0.0–10.7 | 0.0–12.0 | |
| COD (mg/L) | Mean | 95.2 | 93.2 | 5.8 | 7.4 | 9.4 | 10.9 |
| SD (n) | 69.5 (30) | 67.4 (30) | 3.9 (25) | 5 (25) | 6.7 (20) | 16.0 (20) | |
| Min–Max | 14.1–334.9 | 6.0–301.8 | 0.0–14.3 | 0.0–21.6 | 0.0–22.6 | 0.0–75.6 | |
| NOx-N (mg-N/L) | Mean | 5.7 | 2.3 | 0.4 | 1.7 | 2.9 | 2.6 |
| SD (n) | 2.5 (25) | 1.6 (24) | 0.2 (25) | 0.8 (25) | 1.8 (20) | 1.9 (20) | |
| Min–Max | 0.7–10.3 | 0.1–5.2 | 0.1–0.8 | 0.8–3.6 | 0.9–7.0 | 0.4–7.1 | |
| NH4-N (mg-Ν/L) | Mean | 19.1 | 11.5 | 0.2 | 0.1 | 0.9 | 0.8 |
| SD (n) | 19.1 (28) | 7.5 (28) | 0.2 (25) | 0.1 (25) | 0.7 (20) | 0.9 (20) | |
| Min–Max | 3.0–77.3 | 0.5–36.5 | 0.0–0.7 | 0.0–0.4 | 0.0–2.7 | 0.0–3.9 | |
| TP (mg-P/L) | Mean | 0.7 | 0.6 | 0.05 | 0.05 | 0.05 | 0.09 |
| SD (n) | 0.7 (35) | 0.5 (35) | 0.04 (25) | 0.02 (25) | 0.01 (20) | 0.06 (20) | |
| Min–Max | 0.0–3.2 | 0.0–1.7 | 0.0–0.19 | 0.0–0.09 | 0.01–0.09 | 0.05–0.31 | |
| TSS (mg/L) | Mean | 38.6 | 23.3 | 5.7 | 9.7 | 5.3 | 11.8 |
| SD (n) | 60.9 (34) | 27.2 (34) | 13.0 (25) | 18.1 (25) | 6.1 (20) | 20.0 (20) | |
| Min–Max | 0.2–276.4 | 0.3–121.0 | 0.0–65.7 | 0.4–89.7 | 0.2–23.7 | 0.3–74.2 |
Note(s): * SD, standard deviation; n, number of samples; Min, minimum; Max, maximum.
Table 4.
Total quality class of the three rivers based on the worst quality class for each methodology applied.
Table 4.
Total quality class of the three rivers based on the worst quality class for each methodology applied.
| River | WQI | Quality Class | Monitoring Station | Quality Characterization |
|---|---|---|---|---|
| Laspias | NSF-WQI | 2 | LAS1, LAS2 | Bad water quality |
| O-WQI | 1 | LAS1, LAS2 | Very poor water quality | |
| CCME-WQI | 1 | LAS1, LAS2 | Poor water quality | |
| Prati’s Index | 1 | LAS1 | Heavy pollution | |
| Kosynthos | NSF-WQI | 3 | KS2 | Medium water quality |
| O-WQI | 1 | KS2 | Very poor water quality | |
| CCME-WQI | 3 | KS2 | Fair water quality | |
| Prati’s Index | 4 | KS1, KS2 | Acceptable | |
| Lissos | NSF-WQI | 3 | LIS1, LIS2 | Medium water quality |
| O-WQI | 1 | LIS1, LIS2 | Very poor water quality | |
| CCME-WQI | 2 | LIS1 | Marginal water quality | |
| Prati’s Index | 3 | LIS1, LIS2 | Slight pollution |
Disclaimer/Publisher’s Note: The statements, opinions and data contained in all publications are solely those of the individual author(s) and contributor(s) and not of MDPI and/or the editor(s). MDPI and/or the editor(s) disclaim responsibility for any injury to people or property resulting from any ideas, methods, instructions or products referred to in the content. |
© 2023 by the authors. Licensee MDPI, Basel, Switzerland. This article is an open access article distributed under the terms and conditions of the Creative Commons Attribution (CC BY) license (https://creativecommons.org/licenses/by/4.0/).
Share and Cite
MDPI and ACS Style
Gikas, G.D.; Lergios, D.; Tsihrintzis, V.A. Comparative Assessment of the Application of Four Water Quality Indices (WQIs) in Three Ephemeral Rivers in Greece. Water 2023, 15, 1443. https://doi.org/10.3390/w15081443
AMA Style
Gikas GD, Lergios D, Tsihrintzis VA. Comparative Assessment of the Application of Four Water Quality Indices (WQIs) in Three Ephemeral Rivers in Greece. Water. 2023; 15(8):1443. https://doi.org/10.3390/w15081443
Chicago/Turabian StyleGikas, Georgios D., Dimitrios Lergios, and Vassilios A. Tsihrintzis. 2023. "Comparative Assessment of the Application of Four Water Quality Indices (WQIs) in Three Ephemeral Rivers in Greece" Water 15, no. 8: 1443. https://doi.org/10.3390/w15081443
Note that from the first issue of 2016, this journal uses article numbers instead of page numbers. See further details here.