
Long-Term Change of Lake Water Storage and Its Response to Climate Change for Typical Lakes in Arid Xinjiang, China


1
Key Laboratory of Geographic Information Science (Ministry of Education), School of Geographic Sciences, East China Normal University, Shanghai 200241, China
2
Research Center for East-West Cooperation in China, East China Normal University, Shanghai 200241, China
*
Author to whom correspondence should be addressed.
Water 2023, 15(8), 1444; https://doi.org/10.3390/w15081444
Submission received: 11 March 2023
/
Revised: 30 March 2023
/
Accepted: 2 April 2023
/
Published: 7 April 2023
(This article belongs to the Special Issue Climate and Water: Impacts of Climate Change on Hydrological Processes and Water Resources)
Abstract
:Lakes play a role as the sentinel of climate change. Surrounded by vast expanses of barren land with limited infrastructure, there is also a lack of knowledge about the dynamics of dryland lakes. The change of lake area can be effectively monitored by remote sensing, and multi-source satellite altimetry datasets provide the possibility to obtain long-term lake water level data. Using the Global Surface Water Monthly Historical dataset and altimetry water level dataset (Hydroweb), we reconstructed a time series of lake water storage changes in Xinjiang, Northwestern China, by establishing the empirical models based on the statistical relationship between the surface area and water level of each lake. We further explored lake response to climate change. The results show that the storage of water at Ayakkum Lake, Aqqikkol Lake and Aksayquin Lake have been undergoing an obvious expanding trend from 2000 to 2020, at a rate of , and , respectively. In the plain and transition zone, Ulungur Lake showed an upward tendency () in water storage, while Manas Lake and Bosten Lake experienced shrinkage with descending rates of and . Temperature changes significantly affect the lake water storage on plateaus, especially those lakes supplied with a large proportion of glacial meltwater. Precipitation is a key factor for changes of lake storage in the plain and transition zones. Meanwhile, extreme weather and man-made factors also play crucial roles. To reduce the risk of flood and drought disasters, rational regulation of water resources is required, and a large-scale integrated catchment management plan can avoid inadvertent trade-offs. This research provides a new perspective for lake water storage inversion, as well as data support for water resources management in arid areas including Xinjiang.
1. Introduction
As a crucial part of the hydrosphere, lakes are closely related to the atmosphere, biosphere and lithosphere [1]. In addition, lakes can record regional environmental changes [2], regulate local climate [3], and maintain regional ecosystem balance and biodiversity [4]. As the most important water and environmental resources in arid and semi-arid regions, not only are lakes good indicators of regional climate change, but they are also the foundation of human survival, economic and social development [5]. Especially for inland areas with less precipitation, lakes can record the impact of climate change and human activities on regional hydrological processes [6]. The expansion and shrinkage of lakes have changed dramatically on a global scale, due to climate change and human activities [7,8]. Driven by rising temperature and increasing precipitation, the retreat of mountain glaciers in high-mountain areas in Asia has accelerated the expansion of glacial lakes in recent decades [9]. Nevertheless, most lakes in dry subtropical regions are shrinking because of multiple effects such as climate warming, extended irrigation areas and economic development [10]. Compared with humid regions, the understanding of lakes in arid regions is far from sufficient due to their remoteness.
China is a large country with various lakes, and lakes in arid areas of China are mainly distributed in Xinjiang [11]. Xinjiang located in the center of Eurasia is far from the ocean and represents the landscape pattern of the arid region in Eurasia [12,13]. The water supply of lakes in Xinjiang includes glacial meltwater, precipitation and ground water. As important water resources in arid areas, lakes are used in many aspects, such as residential use, the ecological environment and economy [14]. During the past 50 years, the temperature in Xinjiang has been rising rapidly, with an average increase rate range of 0.33–0.39 /year, which was about twice the increase rate of China and three times the global increase rate [15]. Rising mean temperatures accelerate the decline of snow cover and glacier extent [16], causing significant expansion of glacial lakes. A long-term decrease in glacier coverage will reduce water supplies from upstream basins, putting the basins at risk of severe water scarcity [17]. Moreover, climate change and human activities in arid areas may increase the degree and frequency of extreme precipitation and droughts [18]. Climate change in Xinjiang has caused a huge crisis of water resources, so the continuous study of lake dynamics needs to be carried out.
Traditional methods for estimating water storage are obtained by direct hydrologic measurements and real-time kinematic surveys of the lake boundary from local water observation stations [19,20]. Because of the remoteness of lakes and the limit of water observation stations in Xinjiang, it is difficult to measure the change of water storage directly [21]. Remote sensing has the advantages of wide spatial coverage, long observation times, and relatively low labor costs, therefore, it has the potential to estimate water storage over a larger spatial scale and a longer time scale [22]. Several scholars have elucidated the lake dynamics in Xinjiang by using multi-temporal satellites. Many scholars have focused on the analysis of variations in lake surface area in Xinjiang using Landsat, MODIS, keyhole and other satellite images [23,24,25]. Dynamic thresholds of multiple remote sensing spectral indices [26] and a Combined Water Index (CWI) [27] are proposed to extract water areas in Xinjiang, while the Least Squares Method is used to analyze changes of lake areas in Central Asia [28]. Remote-sensing big data cloud platforms are widely used to investigate the lake changes of Xinjiang in recent years [6]. This research revealed that areas of plain lakes such as lakes around Tianshan Mountains showed a declining trend or a fluctuation, which resulted from both accelerated retreat of glaciers and human activities. Otherwise alpine lake areas showed an expanding trend, which was mainly attributable to climate change. Because of differences in the topography and lake size, lake area changes cannot reflect the lake water storage changes [29]. The development of satellite altimetry observations improves the examination of changes in the spatiotemporal patterns of water level and storage variations [30,31]. The laser altimeters ICESat and ICESat-2 show excellent potential in monitoring long-term changes in water level and storage of global lakes larger than 10 km² [32,33]. The result showed that lakes in hyper-arid and arid areas experienced dramatic water loss, despite water gained in most global lakes. There is a lack of specific research on the continuous variation of lake storage in arid areas. Compared to humid areas, the study of lake storage changes and water resource management in arid areas is urgently required.
Some scholars used water indices to extract lakes. Nevertheless, considering the influences of mountain shadows, glacier snow and vegetation, this approach cannot effectively extract lakes with regional differences [26]. Although the wide application of satellite altimetry improves the traditional water-level observations, it is still unreachable for a single radar/laser altimetry sensor to acquire fully-covered and long-term water level data of lakes [34]. The multi-satellite data and optical remote sensing images make it possible to measure long-term lake water level and water area, such as the Hydroweb database proposed by Laboratory of Studies in Space Geophysics and Oceanography (LEGOS) [35], Database for Hydrological Time Series of Inland Waters (DAHITI) [36] and the Global Surface Water (GSW) datasets of the Joint Research Centre (JRC) [37]. It has been observed that applying multi-satellite processing increased the precision of lake levels [35]. Lake database has been used as a complementary data to in-situ gauges [38]. Moreover, it has the potential to understand lake changes in areas where access to measurements are limited.
In order to comprehensively understand the long-term change of lake water storage and its response to climate change in Xinjiang, six typical lakes, namely Ulungur, Manas, Bosten, Ayakkum, Aqqikkol and Aksayquin, which cover surface areas larger than and are distributed across northern and southern Xinjiang were selected as representatives. This study aims to (1) analyze the annual variations of lake water levels and monitor the spatiotemporal characteristics of lake areas; (2) estimate lake storage changes and their trends; (3) explore the effects of temperature and precipitation on lake changes. Exploring the dynamic changes of regional lake resources and their response to climate change is of great significance for the scientific use of scarce water resources [14], sustainable development of the environment, as well as early warning of climate change in arid regions.
2. Study Area
Located between –49 and 73–92 in the northwest of China near the center of Eurasia, Xinjiang is representative of the landscape pattern and type of the Eurasian arid regions. It covers an area of about , and the topography of Xinjiang can be summarized as the basic pattern of “three mountains surrounding two basins” [27]. Xinjiang has typical continental arid climate and is dominated by westerlies [16,39]. The transport of water vapor is mainly via the westerlies in the Atlantic and a small amount from the Arctic Ocean. Due to orographic effects, temperature and precipitation are unevenly distributed. The climate of northern Xinjiang is a typical temperate continental climate, with an annual average temperature of −4–9 and an annual precipitation of 150–200 . While southern Xinjiang is warmer and drier with large amounts of evaporation, and where the annual average temperature is 7–14 , and the annual precipitation is 25–100 [40].
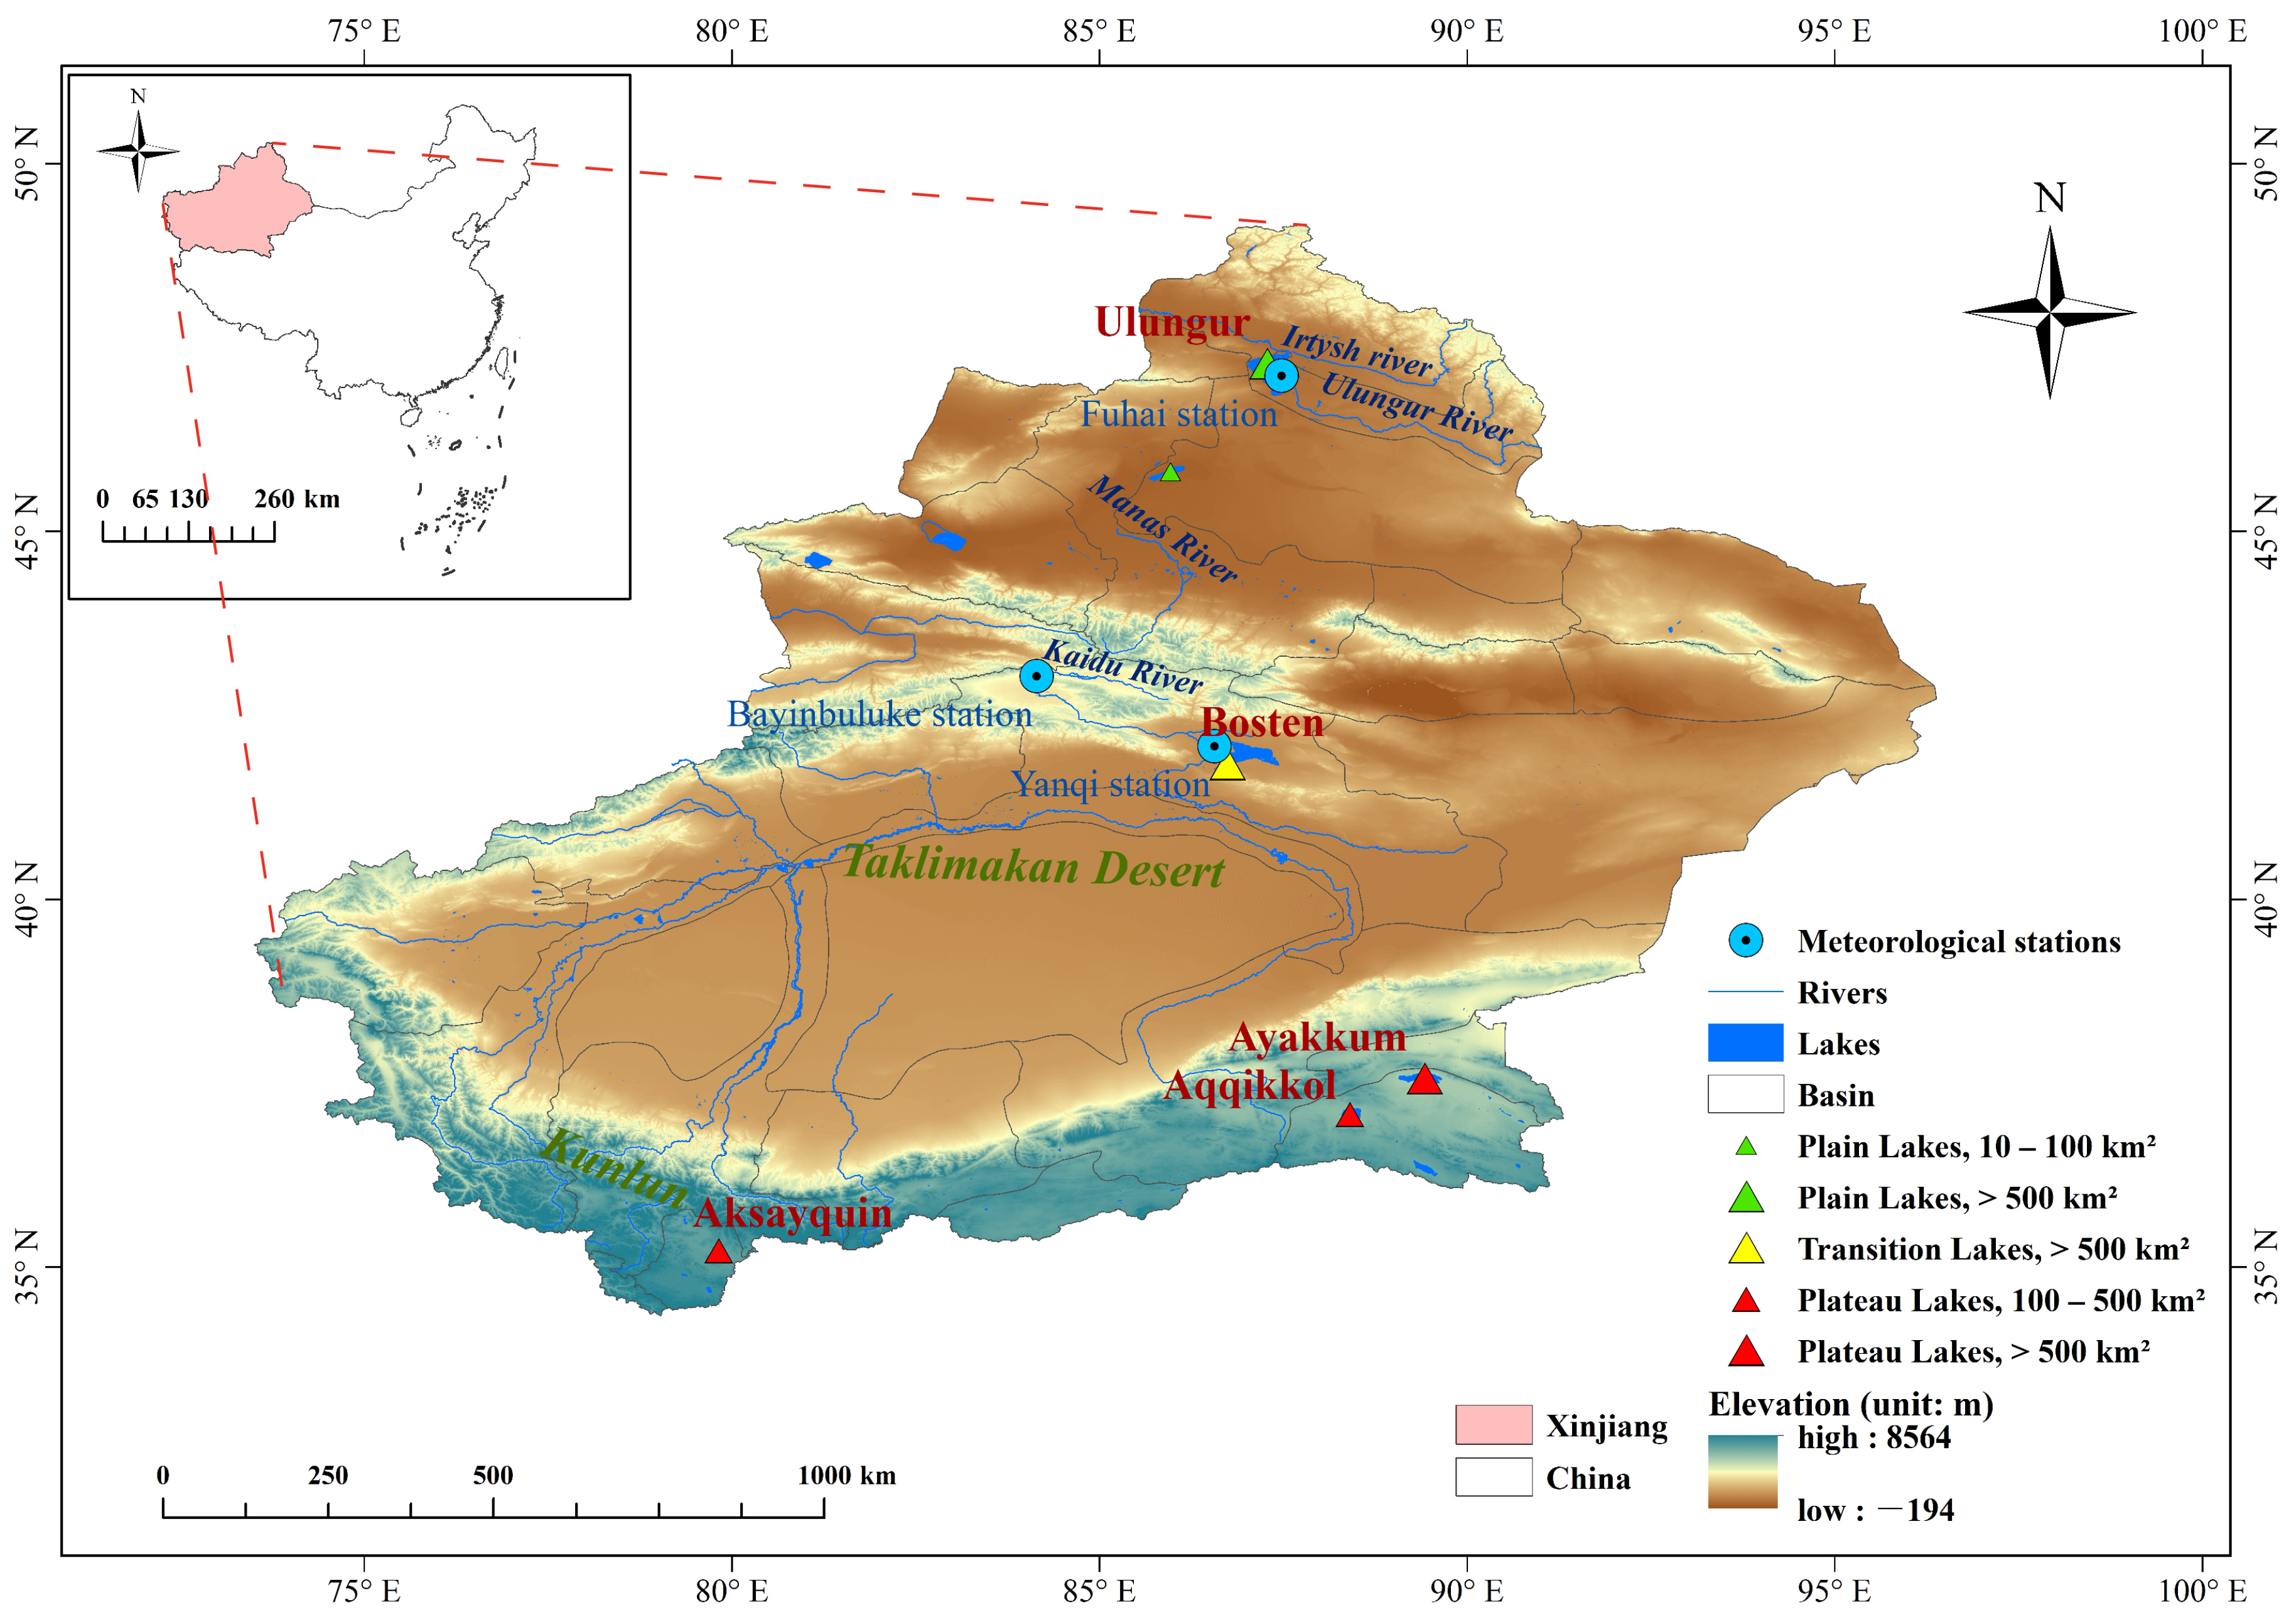
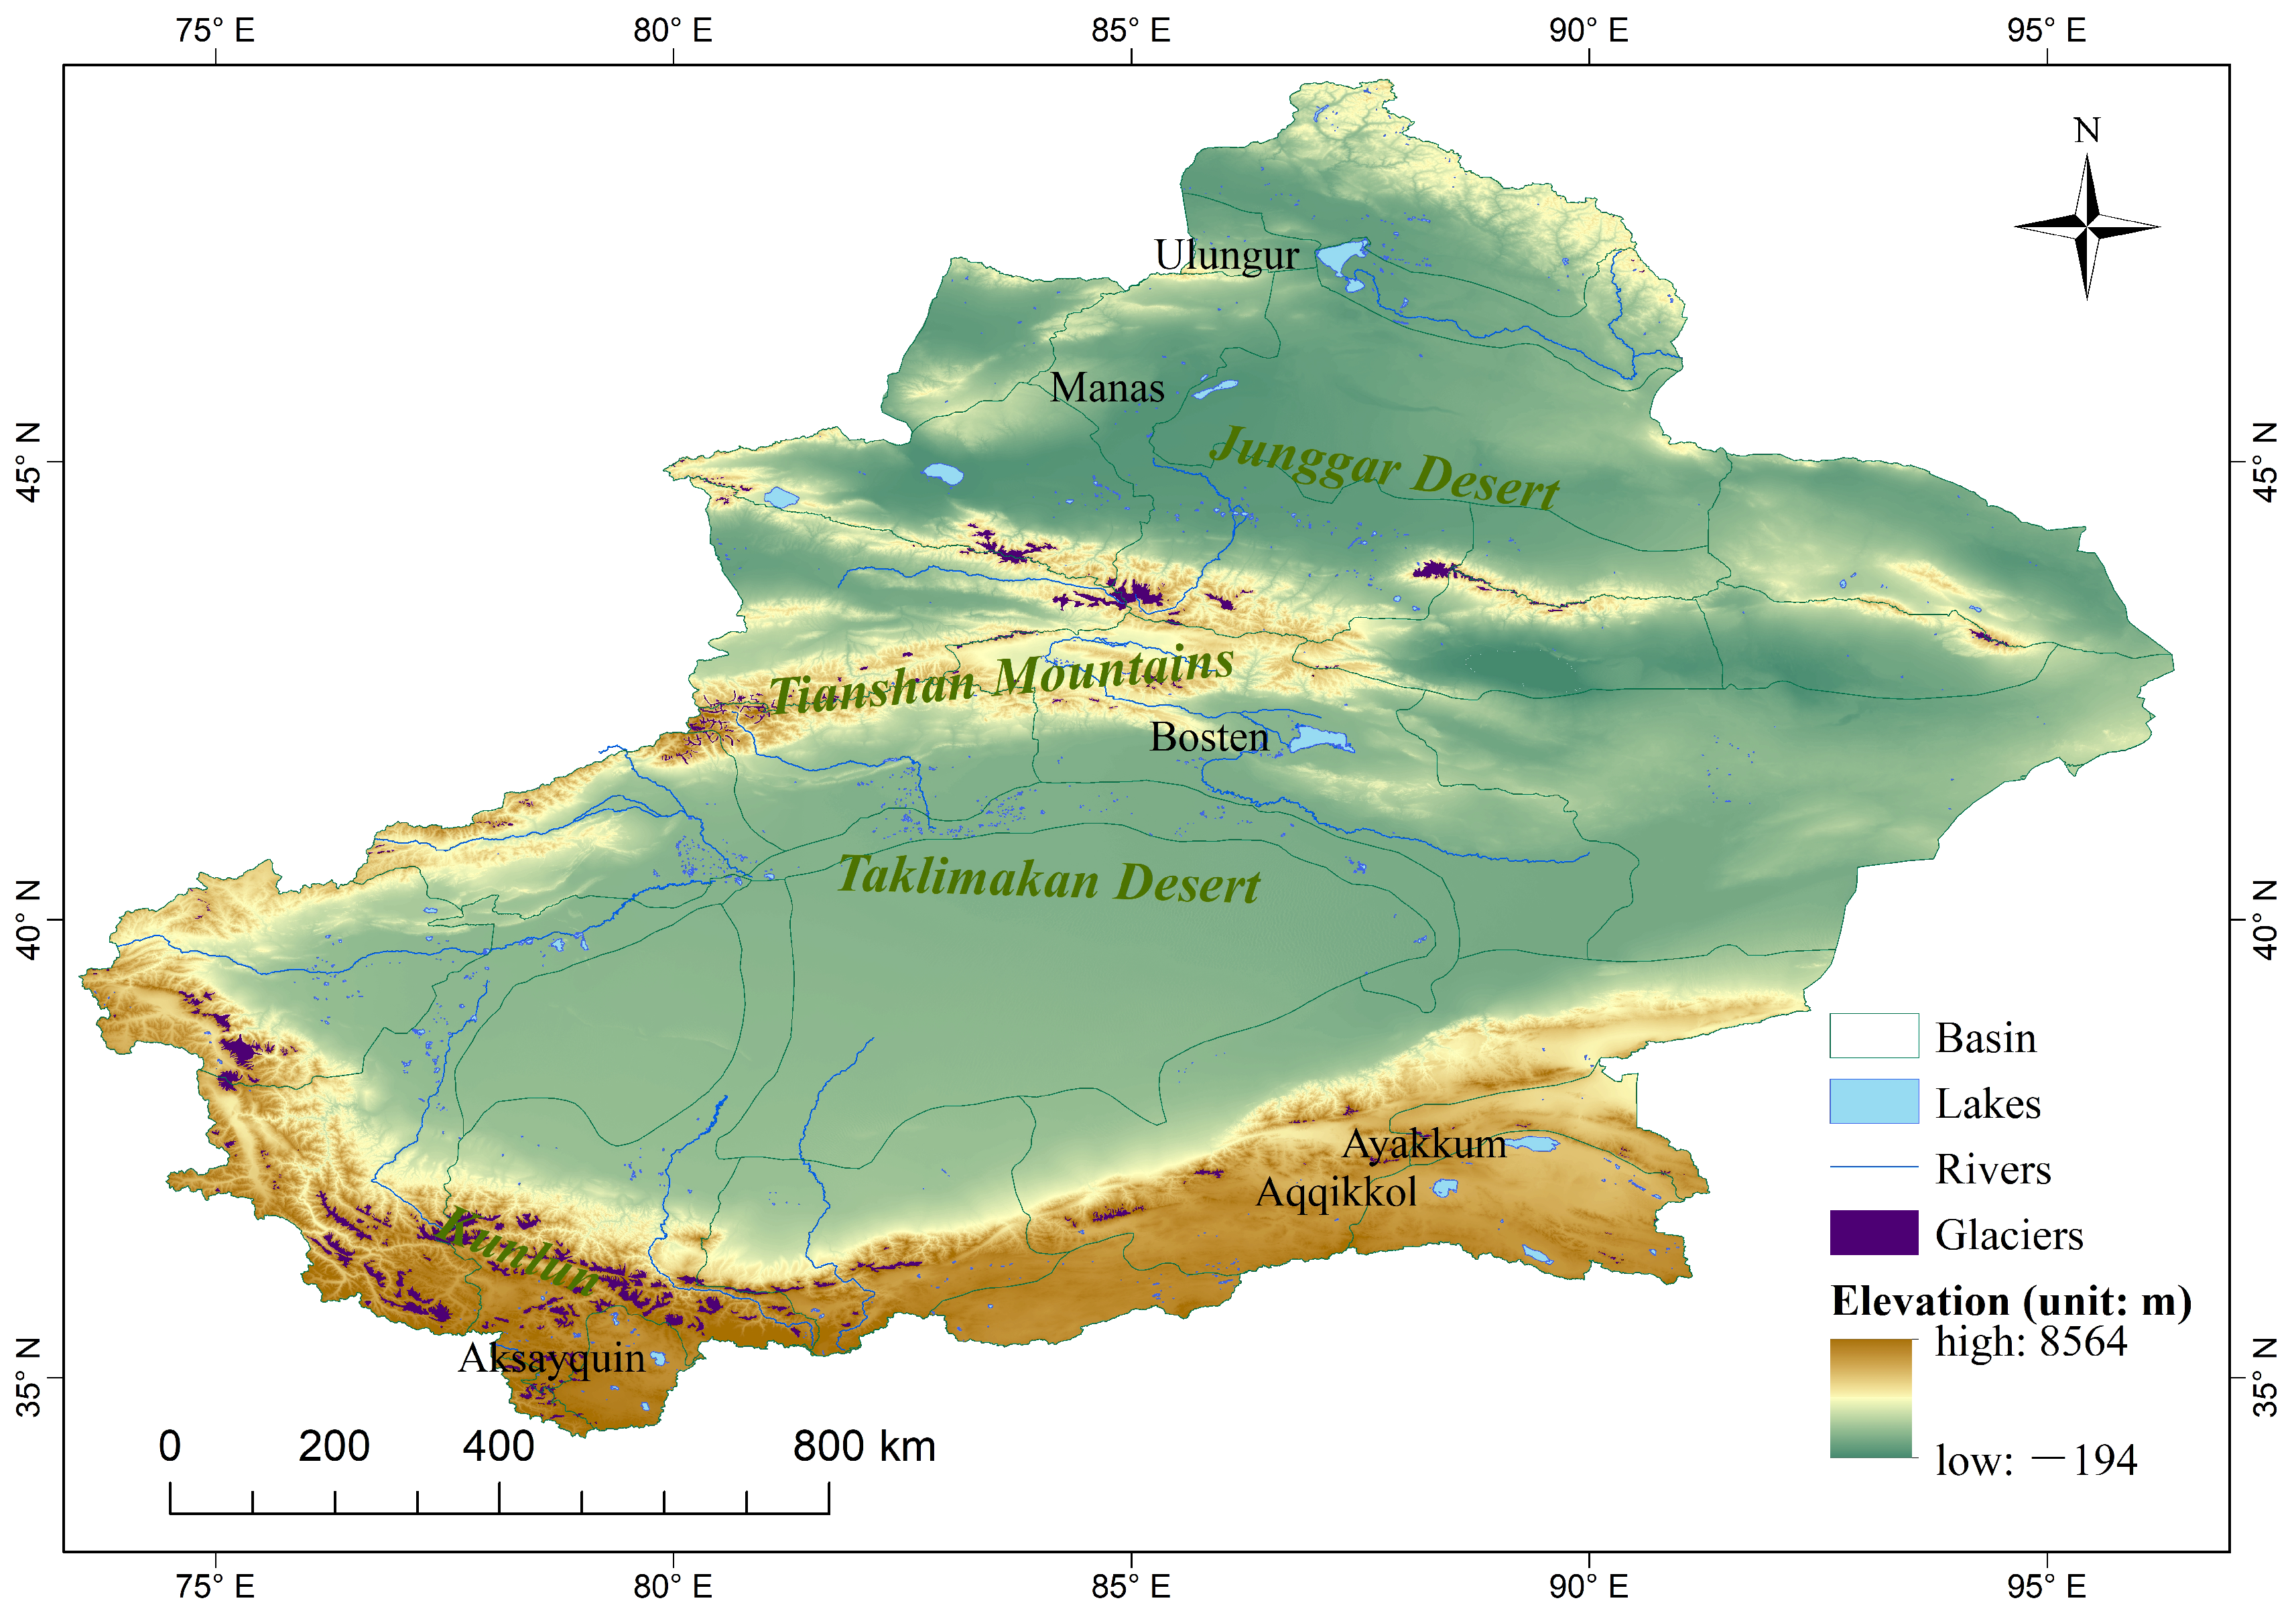
With areas larger than , and located in different elevation ranges, six typical Xinjiang Lakes (Ulungur, Manas, Bosten, Ayakkum, Aqqikkol and Aksayquin) were selected (Figure 1). Ulungur Lake and Manas Lake are located in the elevation bands lower than 1000 m; they are typical plain lakes whose main recharge mode is surface runoff. Ulungur Lake is the largest permanent freshwater lake in the northern Xinjiang and the rivers entering it are the Ulungur River and the Irtysh River [11]. The Ulungur River and Irtysh River both originate in the Altay Mountains and flow from East to West. The average annual runoff of Ulungur River is and that of Irtysh River is [41]. Ulungur Lake has a temperate continental arid climate with an average annual temperature of 3.4 , a mean annual precipitation of 116.5 mm and an average annual evaporation of 1844.4 mm. Manas Lake, a saltwater lake, is the tail lake of the lower reaches of the Manas River Basin. Manas River originates on the northern slope of the Tianshan Mountains, and its basin slopes from Southeast to Northwest. The average annual runoff of Manas River is [42]. The area of Manas Lake has a temperate arid climate with an annual mean temperature of 8.8 and a mean annual precipitation of 63.7 mm, and the amount of evaporation is 3110.5 mm [43]. The recharging rivers of plain lakes are affected by human activities, resulting in large fluctuations in the water storage flowing into lakes [40]. Bosten Lake is located in the transition zone with an elevation between 1000 m and 3500 m, belonging to the transition zone lakes. It is the largest lake in Xinjiang and the largest freshwater inland lake in China. With an altitude of 1048 m and an evaporation of 1195 mm, the average annual temperature of Bosten Lake is 9 , and the annual precipitation is 66 mm. Bosten Lake is supplied mainly by the Kaidu River which is mainly supplied by precipitation and seasonal snowmelt [11,20,44]. Kaidu River is located at the southern slope of the Tianshan Mountains with an average annual runoff amount of [45]. Irtysh River and Kaidu River are perennial rivers. Ulungur River and Manas River are affected obviously by seasonal rainfall runoff. Ayakkum Lake, Aqqikkol Lake and Aksayquin Lake are distributed in areas where the southern margin of Xinjiang meets the boundary of Tibet, with elevations higher than 3500 m. They are all plateau saltwater lakes. Ayakkum Lake and Aqqikkol Lake located in the Kumukuli Basin between the Altun Mountains and the Kunlun Mountains, are within the National Nature Protection of Altun Mountain. These two lakes have a plateau continental desert climate with runoff supplied by glacial/snow meltwater [40]. The annual average temperature of Ayakkum Lake is about 0 and the mean annual precipitation is 100–200 [46]. Aksayquin is a closed plateau lake located in the intermountain basin of the western Kunlun Mountains. The main recharge mode is surface runoff and the average annual temperature in this region is about −8 , and the mean annual precipitation is less than 100 mm, with a plateau arid climate [47]. These six typical lakes account for more than of the total area of lakes in Xinjiang, and they represent the different lake types in Xinjiang well (Table 1).
In this paper, the change trends of water levels, area and storage of six typical lakes in Xinjiang from 2000 to 2020 were studied. Moreover, we explored the response of water storage to the climate of typical lakes in this region.
3. Materials and Methods
3.1. Materials
3.1.1. Lake Area Data
In order to obtain the surface water coverage data with high accuracy, this study used the lake data extracted from the Global Surface Water Monthly Water History dataset (JRC Monthly Water History, v1.3) with 30 m spatial resolution from 2000 to 2020. The dataset is based on millions of Landsat satellite images that were processed on the Google Earth Engine platform by the Joint Research Centre (JRC) of the European Commission [37]. The dataset was proven to be reliable with an overall accuracy of over [48]. Compared with the high-frequency water bodies (spatial resolution of about 1km) obtained from previous coarse spatial resolution satellite observations and high-resolution maps which were usually produced at 5–10 year intervals. The JRC Monthly Water History Dataset with 30 m spatial resolution provides more accurate and detailed information on annual lake dynamics [48].
The Global Surface Water Monthly Historical dataset was used to extract the annual lakes’ areas, which includes three steps:
Step 1: Detection of permanent lake water bodies, where pixels with annual water frequencies more than 9 months of a year were classified as permanent water bodies [48]. This step was completed in the Google Earth Engine platform [49].
Step 2: Converting the raster data of water bodies into vector data to extract lake boundaries. This step was completed in ArcGIS 10.8 software.
Step 3: The global lakes’ vector data (HydroLAKES) provided by HydroSHEDS Database [50] was referenced to select six lakes from the lake boundaries. Small water bodies (<1) were deleted by filtering by area and an equal-area projection was performed on the data to calculate the lake area. This step was completed in ArcGIS 10.8 software.
3.1.2. Altimetry Water Level Datasets (Hydroweb)
Water level time series from Hydroweb [51], a web database containing time series over water levels of large rivers, lakes and wetlands on a global scale [35], were used in this paper. This database is a lake data resource developed by a laboratory (Laboratory of Studies in Space Geophysics and Oceanography) in Toulouse, France. It combines several satellite altimetry missions including Topex-Poseidon, GFO, ERS-2 Jason-1, Jason-2 and Envisat, freely sharing water level and area timing information of major lakes, reservoirs, and rivers around the world to all users [22].
3.1.3. GRACE Satellite Gravimetry Data
GRACE is jointly implemented by the U.S. National Aeronautics and Space Administration (NASA) and the German Aerospace Center [52,53]. GRACE makes scientific measurements by precisely measuring the distance between its twin satellites, GRACE-1 and GRACE-2. GRACE satellites accurately monitor the time variable gravity field, which reflects changes in mass resulting primarily from movement of water through the Earth’s water cycle [54]. The Center for Space Research (CSR) of the University of Texas has enhanced the RL05 GRACE solutions and provides accurate surface-based gridded information that can be used without further processing [53]. This article used the CSR RL06M monthly solutions [55], which have a spatial resolution of and can be applied to catchments larger than [56]. In this study, GRACE satellite gravity data were used to deduce the mass changes of water storage over time.
3.1.4. Meteorological Data
The density of meteorological stations is not homogeneous, and particularly low in the sparsely populated high mountainous and desert/semi-desert areas of west and south Xinjiang [57]. The meteorological station data used in this paper is the Chinese daily observational meteorological data [58] of the Resources and Environmental Science and Data Center. Fuhai Station, Bayinbuluke station and Yanqi station were selected to obtain precipitation and temperature data. The specific locations of these three stations can be referred to Figure 1. Since there are no meteorological stations in the catchments of Manas Lake, Ayakkum Lake, Aqqikkol Lake and Aksayquin Lake, this article used the fifth-generation reanalysis product of the European Centre for Medium-Range Weather Forecasts (ERA5) [59] as the data supplement. The time was from January 2000 to December 2020. This product was compiled by combining models with observations, and has been validated through a large number of ground-truth observations on a global scale [60,61,62]. The time solution is one month, and the spatial resolution is .
3.2. Methods
3.2.1. Monitoring Lake Area Changes
The annual lake area data extracted from the Global Surface Water Monthly Water History dataset (JRC Monthly Water History, v1.3) were used to determine the direction and magnitude of changes in lake surface area according to Equation (1) [63].
where and refer to the lake areas in periods and lake, respectively, represents the relative rate of change in lake area in compared to , and indicates new lake emergence and lake extinction. While the rate of change of a lake from to is less than , considering many factors such as classification errors and seasonal fluctuations, lakes can be seen as stable. In this article, , so means the relative change rate of lake area in any year compared with the previous year.
3.2.2. Constructing Water Level Changes of Lakes
Based on Hydroweb, the long-term water level change information of six lakes from 2000 to 2020 were obtained, which were Ulungur Lake, Manas Lake, Bosten Lake, Ayakkum Lake, Aqqikkol Lake and Aksayquin Lake. Table 2 shows the temporal span of the water level data for the six lakes.
Since water level data of lakes are not in the same time intervals and missing in some years, we first averaged all the water level observations in each month [64], and then the average water levels of three consecutive months including the highest water level in a year were used as the annual average water levels. The missing annual water level observations were interpolated based on the empirical equations and temporally corresponding lake area [65]. Consequently, the annual lake water level changes were analyzed.
3.2.3. Estimation of Annual Water Storage Changes
Due to the discontinuousness of time-series elevation data obtained from satellite altimeters, water level data for a full-time span from 2000 to 2020 are not available for Manas Lake, Bosten Lake, Aqqikkol Lake and Aksayquin Lake. This study established an empirical model based on the statistical relationship between water surface area and water level of each lake, and estimated lake water level according to lake area data, as shown in Formula (2) [22]:
According to Formula (2), the value of lake surface area or temporally corresponding water level can be derived from each other in a certain period.
Generally, the bottom morphology of lakes and reservoirs can be assumed as a regular pyramidal shape [66]. Using water quantity change in Formula (3) [22] the time series of lake storage changes were estimated.
where is the variation in lake water storage during the given period, , , and refer to the lake surface area and lake level at time 1 and time 2, respectively.
3.2.4. Mann–Kendall
The Mann–Kendall test [67] is a non-parametric statistical test method, which does not require samples to follow a certain distribution and is not disturbed by a few outliers. Because of its strong applicability and convenience, it can be used to test not only the trend, but also the mutation of time series [68].
In this paper, Mann–Kendall was used to measure the trends and mutations of lake area, lake water level and lake water storage variations. The null hypothesis that there is “no-trend” at the 0.9 confidence level was applied. There is a rising trend if the slope of change >0, and vice versa there is a decreasing trend [69].
4. Results and Analysis
4.1. Annual Variations of Lake Water Level
There are strong correlations between lake areas and lake water levels with high coefficients of determination () (Figure 2). Therefore, it is highly reliable to reconstruct the lake water level with the temporally corresponding lake area.
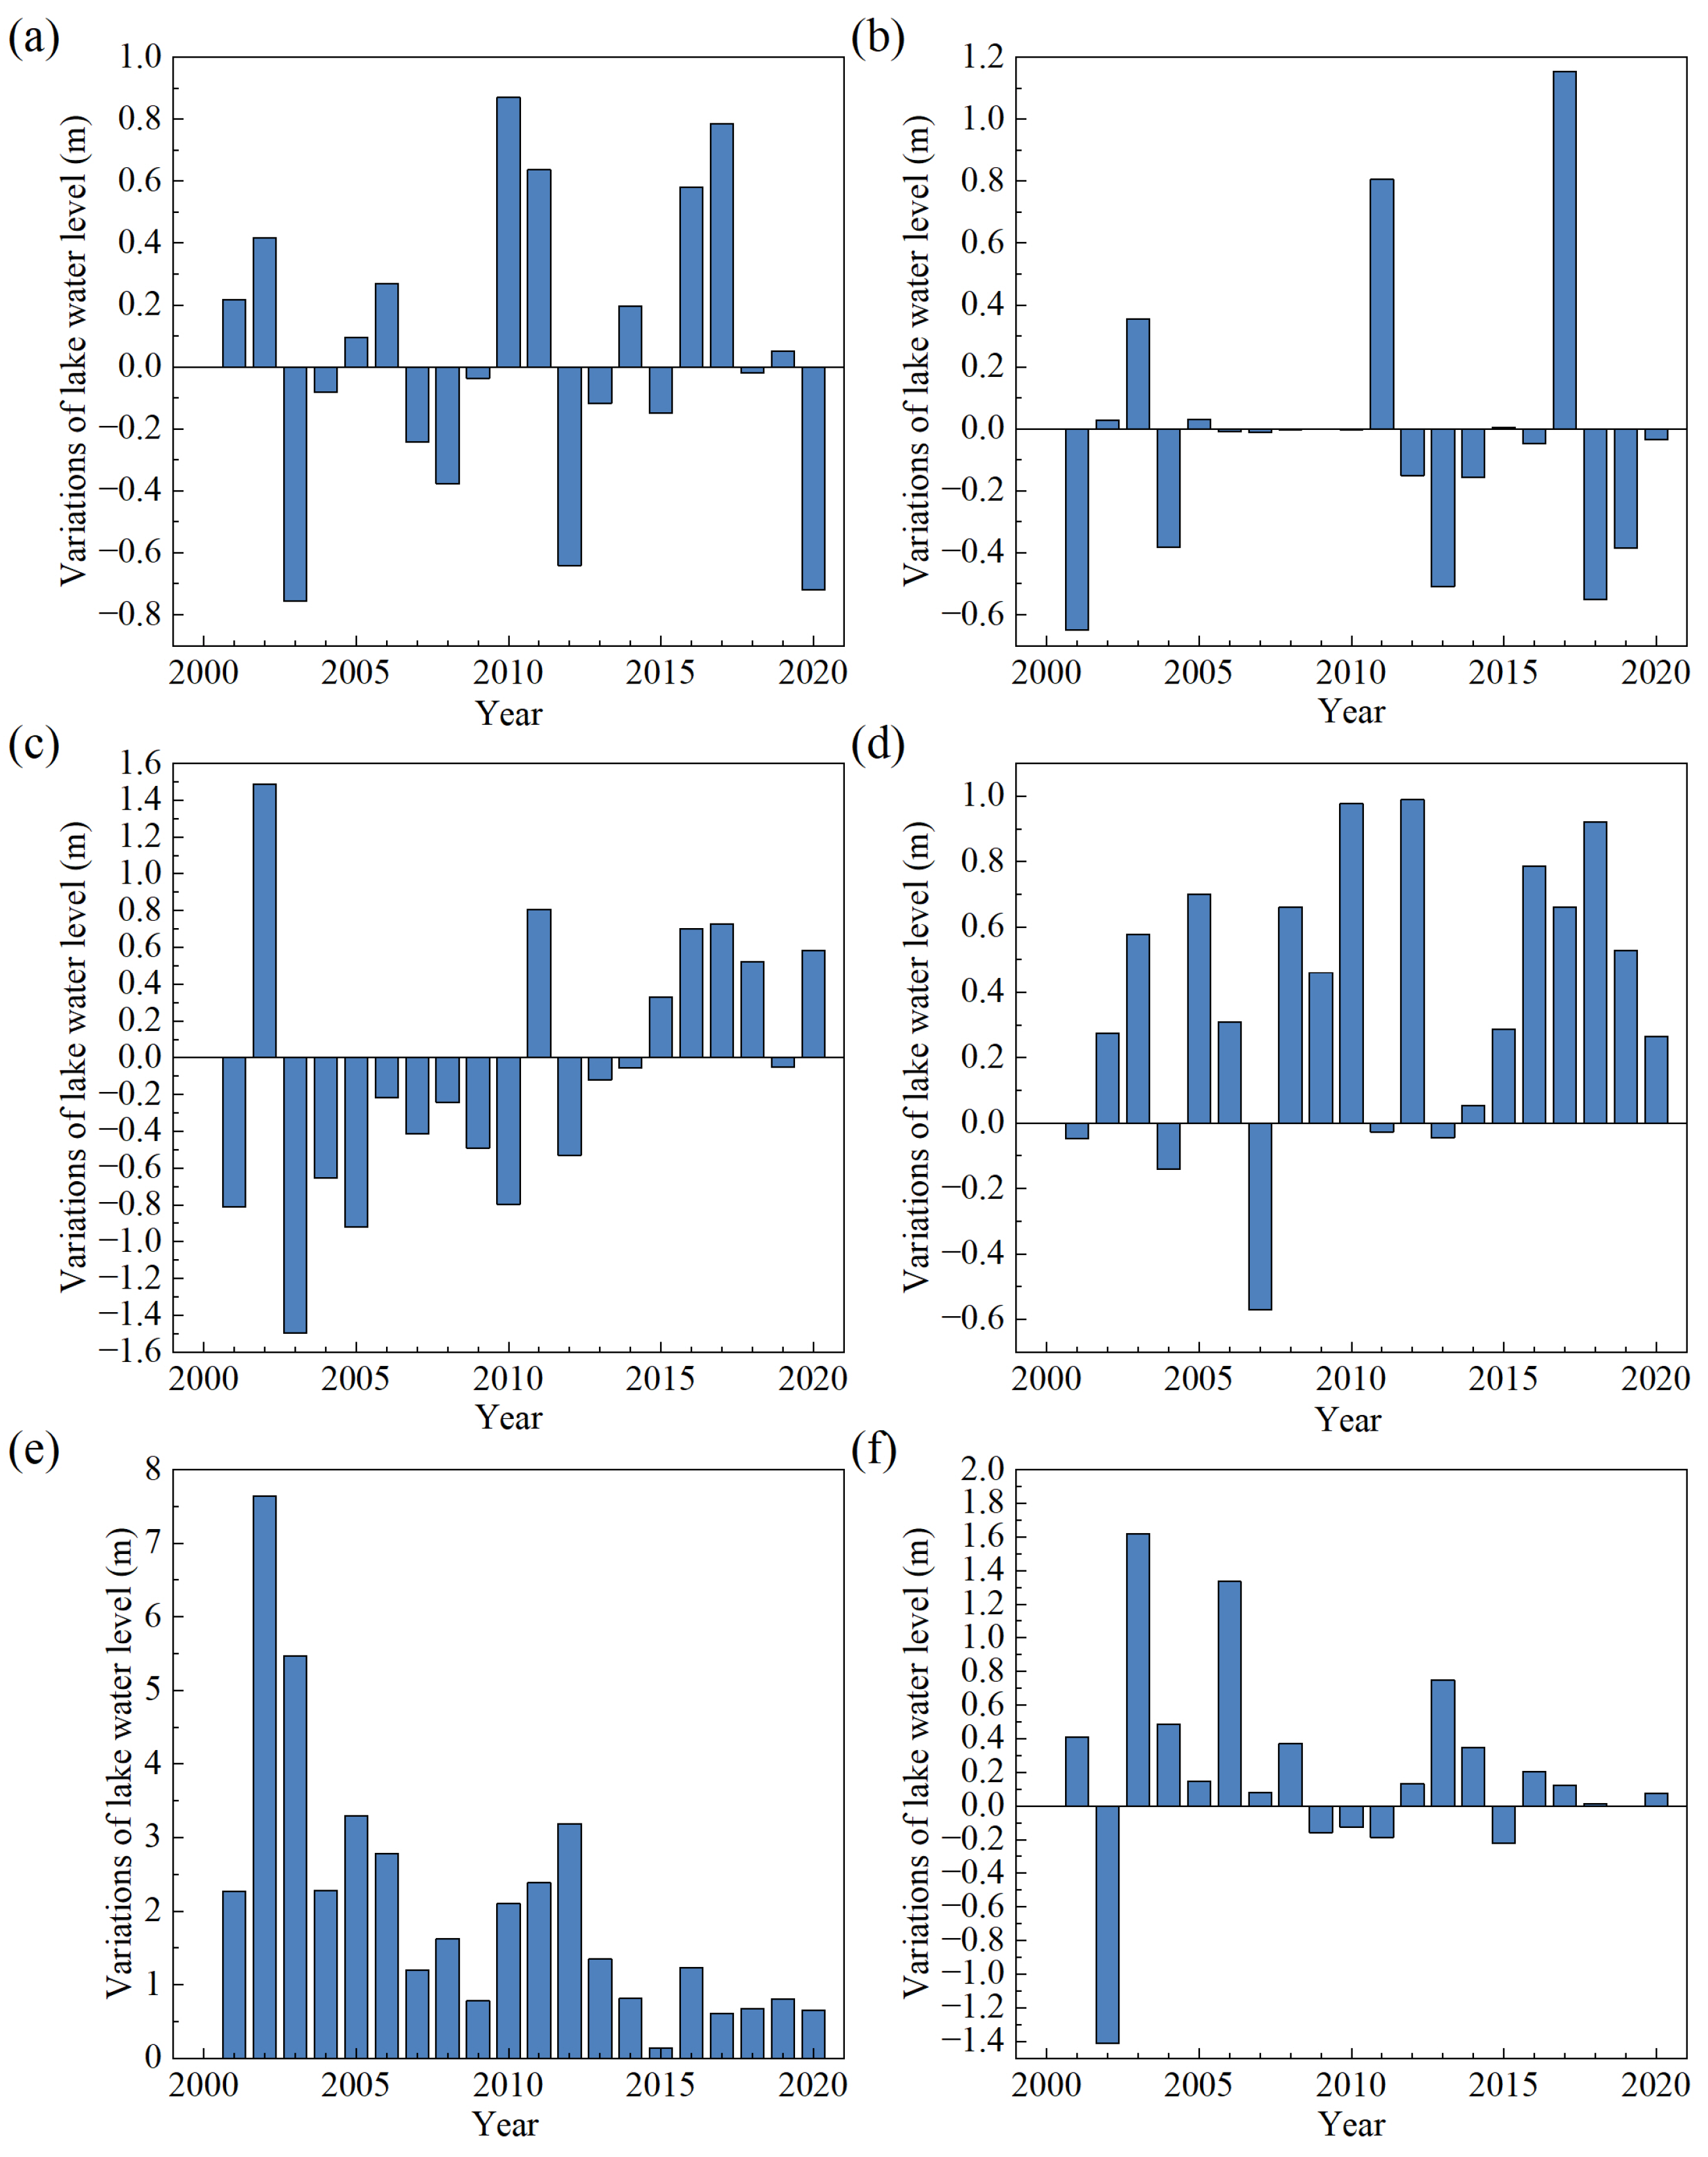
Figure 3 presents the water level changes in the six lakes (Ulungur Lake, Bosten Lake, Ayakkum Lake and Aksayquin Lake with altimetry data of 20, 18, 20 and 9 years, respectively) during the period of 2000 – 2020. According to the results of annual changes of lake water level, the water level of Ulungur Lake has risen for 10 years compared with the previous year, with the largest increase of 0.87 m in 2010. The decrease occurred in a total of 10 years after 2003, with the largest decline in 2003 (−0.76 m). There were 13 years of water level decline in Bosten Lake, mainly before 2014, with the largest decline in 2003 (−1.50 m), and 7 years of water level increase, mainly between 2015 and 2020. The Ayakkum Lake has been rising for 15 years, from 2014 to 2020, with the lake rising the most in 2012 at 0.99 m. The years of Ayakkum Lake water level decrease were mainly from 2001 to 2013, and the largest decrease of lake level was in 2007 (−0.57 m). The water level of Aksayquin lake rose over 15 years with the largest increase of 1.62 m in 2003, whereas the lake experienced a relatively slower rate of water level decrease between 2009 and 2015 (−0.13–−0.22 m). Manas Lake and Aqqikkol Lake only have four-year altimetry data from 2016 to 2020, and the lake level data from 2000 to 2015 were supplemented based on empirical models. There were six years of rising water levels in Manas Lake. Only in 2003, 2011 and 2017 were there significant increases of 0.35 m, 0.8 m and 1.15 m, respectively. In 2001, 2013 and 2018, the water level decreased significantly by 0.65 m, 0.51 m and 0.55 m, respectively. The water level of Aqqikkol Lake increased continuously from 2000 to 2020, but the increase rate was decreased.
Most of the lakes display an obvious elevation increase tendency since 2015, except Manas. From 2000 to 2020, the water level changes of lakes in the plain region (Ulungur and Manas) showed slight inter-annual fluctuations. While the water level changes of lakes in the transition zone (Bosten) fluctuated from 2015 to 2020, the water level dropped significantly before 2015 and rose after 2015. The water level of plateau lakes (Ayakkum, Aqqikkol and Aksayquin) have risen significantly. However, the rates of water level rise for both Aqqikkol Lake and Aksayquin Lake are decreasing.
4.2. Annual Lake Area Changes
As shown in Figure 4, the area of the six lakes have expanded significantly. In the east of Ulungur Lake, the lake expanded during 2009–2010 (+12.94 ) and 2016–2017 (+10.08 ). The expansion of Manas Lake mainly occurred in the northern and northeastern lakeshore, with a substantial increase in 2011 (+245.47 ) and 2017 (+221.68 ). The expansion of Bosten Lake mainly occurred in the northern part, increasing by 69 during 2001–2002 and 85.84 in 2017–2019. Ayakkum Lake, Aqqikkol Lake and Aksayquin Lake have expanded significantly over the entire period. The expansion of Ayakkum Lake was mainly in the south and southeast with the largest change in 2018, while the expansion of Aqqikkol Lake was mainly in the west and east with the largest change in 2020. Aksayquin Lake expanded mainly toward the southeast, and the lake area changed the most from 2002 to 2003, expanding by 32.79 .
Overall, Ulungur Lake expanded to the East, and Manas Lake and Bosten Lake expanded to the North. While Ayakkum Lake and Aksayquin Lake to the South, and Aqqikkol Lake expanded to the East and the West. All lakes have experienced a significant expansion since 2017.
Table 3 presents the number of years in which different relative rates of area changes appear using Formula (1). Considering the number of years when the Ulungur Lake area remained stable is 19 years, the area of Ulungur Lake has the smallest changes. Whereas, the area of Manas Lake has the largest changes with 8 years when was less than −10%. Bosten Lake shrank slightly between 2000 and 2020, with the rate of area changes ranging from −10% to 10%. Ayakkum Lake, Aqqikkol Lake and Aksayquin Lake expanded significantly from 2000 to 2020.
4.3. Annual Variations and Trends of Lake Water Storage
Using Formula (3), the variation in lake water storage can be estimated according to the lake area and the lake water level. Figure 5 shows the lake water storage changes from 2000 to 2020. Lake water storage of Ulungur increased by from 2000 to 2020. In contrast, lake storage of Manas decreased by during the same period, and this decrease occurred mainly after 2012. It is in good agreement with the finding of Jing et al. [27] that Manas Lake area declined from 2011 to 2015. The lake water storage of Bosten Lake decreased by , and this decrease appeared mainly before 2014. During 2015–2020, the water storage of Bosten Lake displayed a steadily increasing tendency. During the entire period, three plateau lakes all featured positive water budgets. The water storage of Ayakkum, Aqqikkol and Aksayquin increased at a rate of 3.59 × 10 m/, 9.43 × 10 and , respectively. The growth rate of Ayakkum Lake water storage showed an upward trend, whereas those of Aqqikkol and Aksayquin showed downward trends.
In general, the lake storage changes of Ulungur and Manas experienced fluctuations during 2000–2020. The water storage changes of Bosten Lake can be divided into two terms, water storage decreasing from 2000 to 2014 and increasing from 2015 to 2020. Meanwhile, lake water storages of Ayakkum, Aqqikkol and Aksayquin steadily increased from 2000 to 2020, and the magnitude of lake water storage changes is: Aqqikkol > Ayakkum > Aksayquin. The water storage changes demonstrate a robust linear correlation with water level changes for six typical lakes, with value more than 0.9.
The trends in lake area, water level and cumulative water storage found by Mann–Kendall test from 2000 to 2020 are noted in Table 4. A weak downward trend was found for Bosten Lake in lake area, water level and cumulative water storage changes. An upward trend can be observed in the lake area of Manas Lake. The most significant increases in lake area, water level and accumulative water storage are found in Ulungur, Ayakkum, Aksayquin, passing the significance test of 99%.
The Mann-Kendall mutation test is used to detect abrupt changes in time series [70]. As noted in Figure 6, the accumulative lake storage changes of Ulungur began to change abruptly in approximately 2015. During 2001–2002 and 2011–2017, the accumulative lake storage changes of Ulungur showed an upward trend. It shows that the abrupt change time of accumulative lake storage changes in Bosten occurred in 2003, and the time series showed a decreasing trend from 2003 to 2004. Since 1995, the area of Ulungur gradually increased because of the increased precipitation, rising temperature and the improvement of planning and management in the Ulungur watershed [71]. Precipitation of Ulungur Lake has declined for three consecutive years from 2013 to 2015, and then increased abruptly in 2016, which led to an abrupt change of accumulative lake storage changes around 2015. In 2002, water storage of Bosten increased a large amount. However, from 2003 to 2010, the water storage decreased continuously on account of a decrease in precipitation during this period [72].
4.4. Mass Changes in Xinjiang Observed in GRACE Satellite Data
GRACE satellite data are closely related to water mass changes, and are widely used to study continental or regional scale basins [73]. Zhang et al. [74] found that GRACE mascon solutions are suitable to recover mass redistributions of different mass sources in global and large basin scale applications, and performed poorly in local regions smaller than 100,000 km. Figure 7 displays the water mass changes on the Xinjiang derived from GRACE data from 2003 to 2020, showing the spatial heterogeneity of water storage in this region. It is worthy of note that the water mass change along northwestern Xinjiang is significantly negative at the rate of −1–−4 cm per year. In contrast, the regions in southeastern Xinjiang gained mass at a rate of 1–2.5 cm per year. From 2003 to 2020, the area of the Manas Lake and Bosten Lake decreased by 50–10%, while the areas of Ayakkum Lake, Aqqikkol Lake and Aksayquin Lake increased by 10–100%, which is consistent with the variations of equivalent water mass measured by GRACE satellite.
However, the water mass change retrieved from the GRACE satellite data in Ulungur basin decreased, while the Ulungur Lake area showed a slight upward trend. Considering GRACE contains both signals from water storage variations in the lakes of Xinjiang and other contributors to mass changes throughout neighboring regions, the water storage changes estimated by the empirical model and the water mass budget derived from the GRACE signals may show significant differences [63]. The increase of Ulungur Lake area may be related to its water supply from the Irtysh River north of Xinjiang.
4.5. Dynamics Changes of Lakes and Responses to Climate Change
As indicated in previous research, temperature and precipitation are two climate factors that are most significantly related to the variations of lakes in Xinjiang [14,27,48]. Due to the sparse distribution of meteorological stations in Xinjiang, only Ulungur Lake and Bosten Lake were able to obtain data from meteorological stations in their catchments (Figure 1), the remaining four lakes used the ERA5-Land dataset. Considering that the upstream basins of Manas Lake and Bosten Lake are different from the basins where the lakes are located, the changes in climate factors in their upstream basins are also calculated (shown in Appendix A).
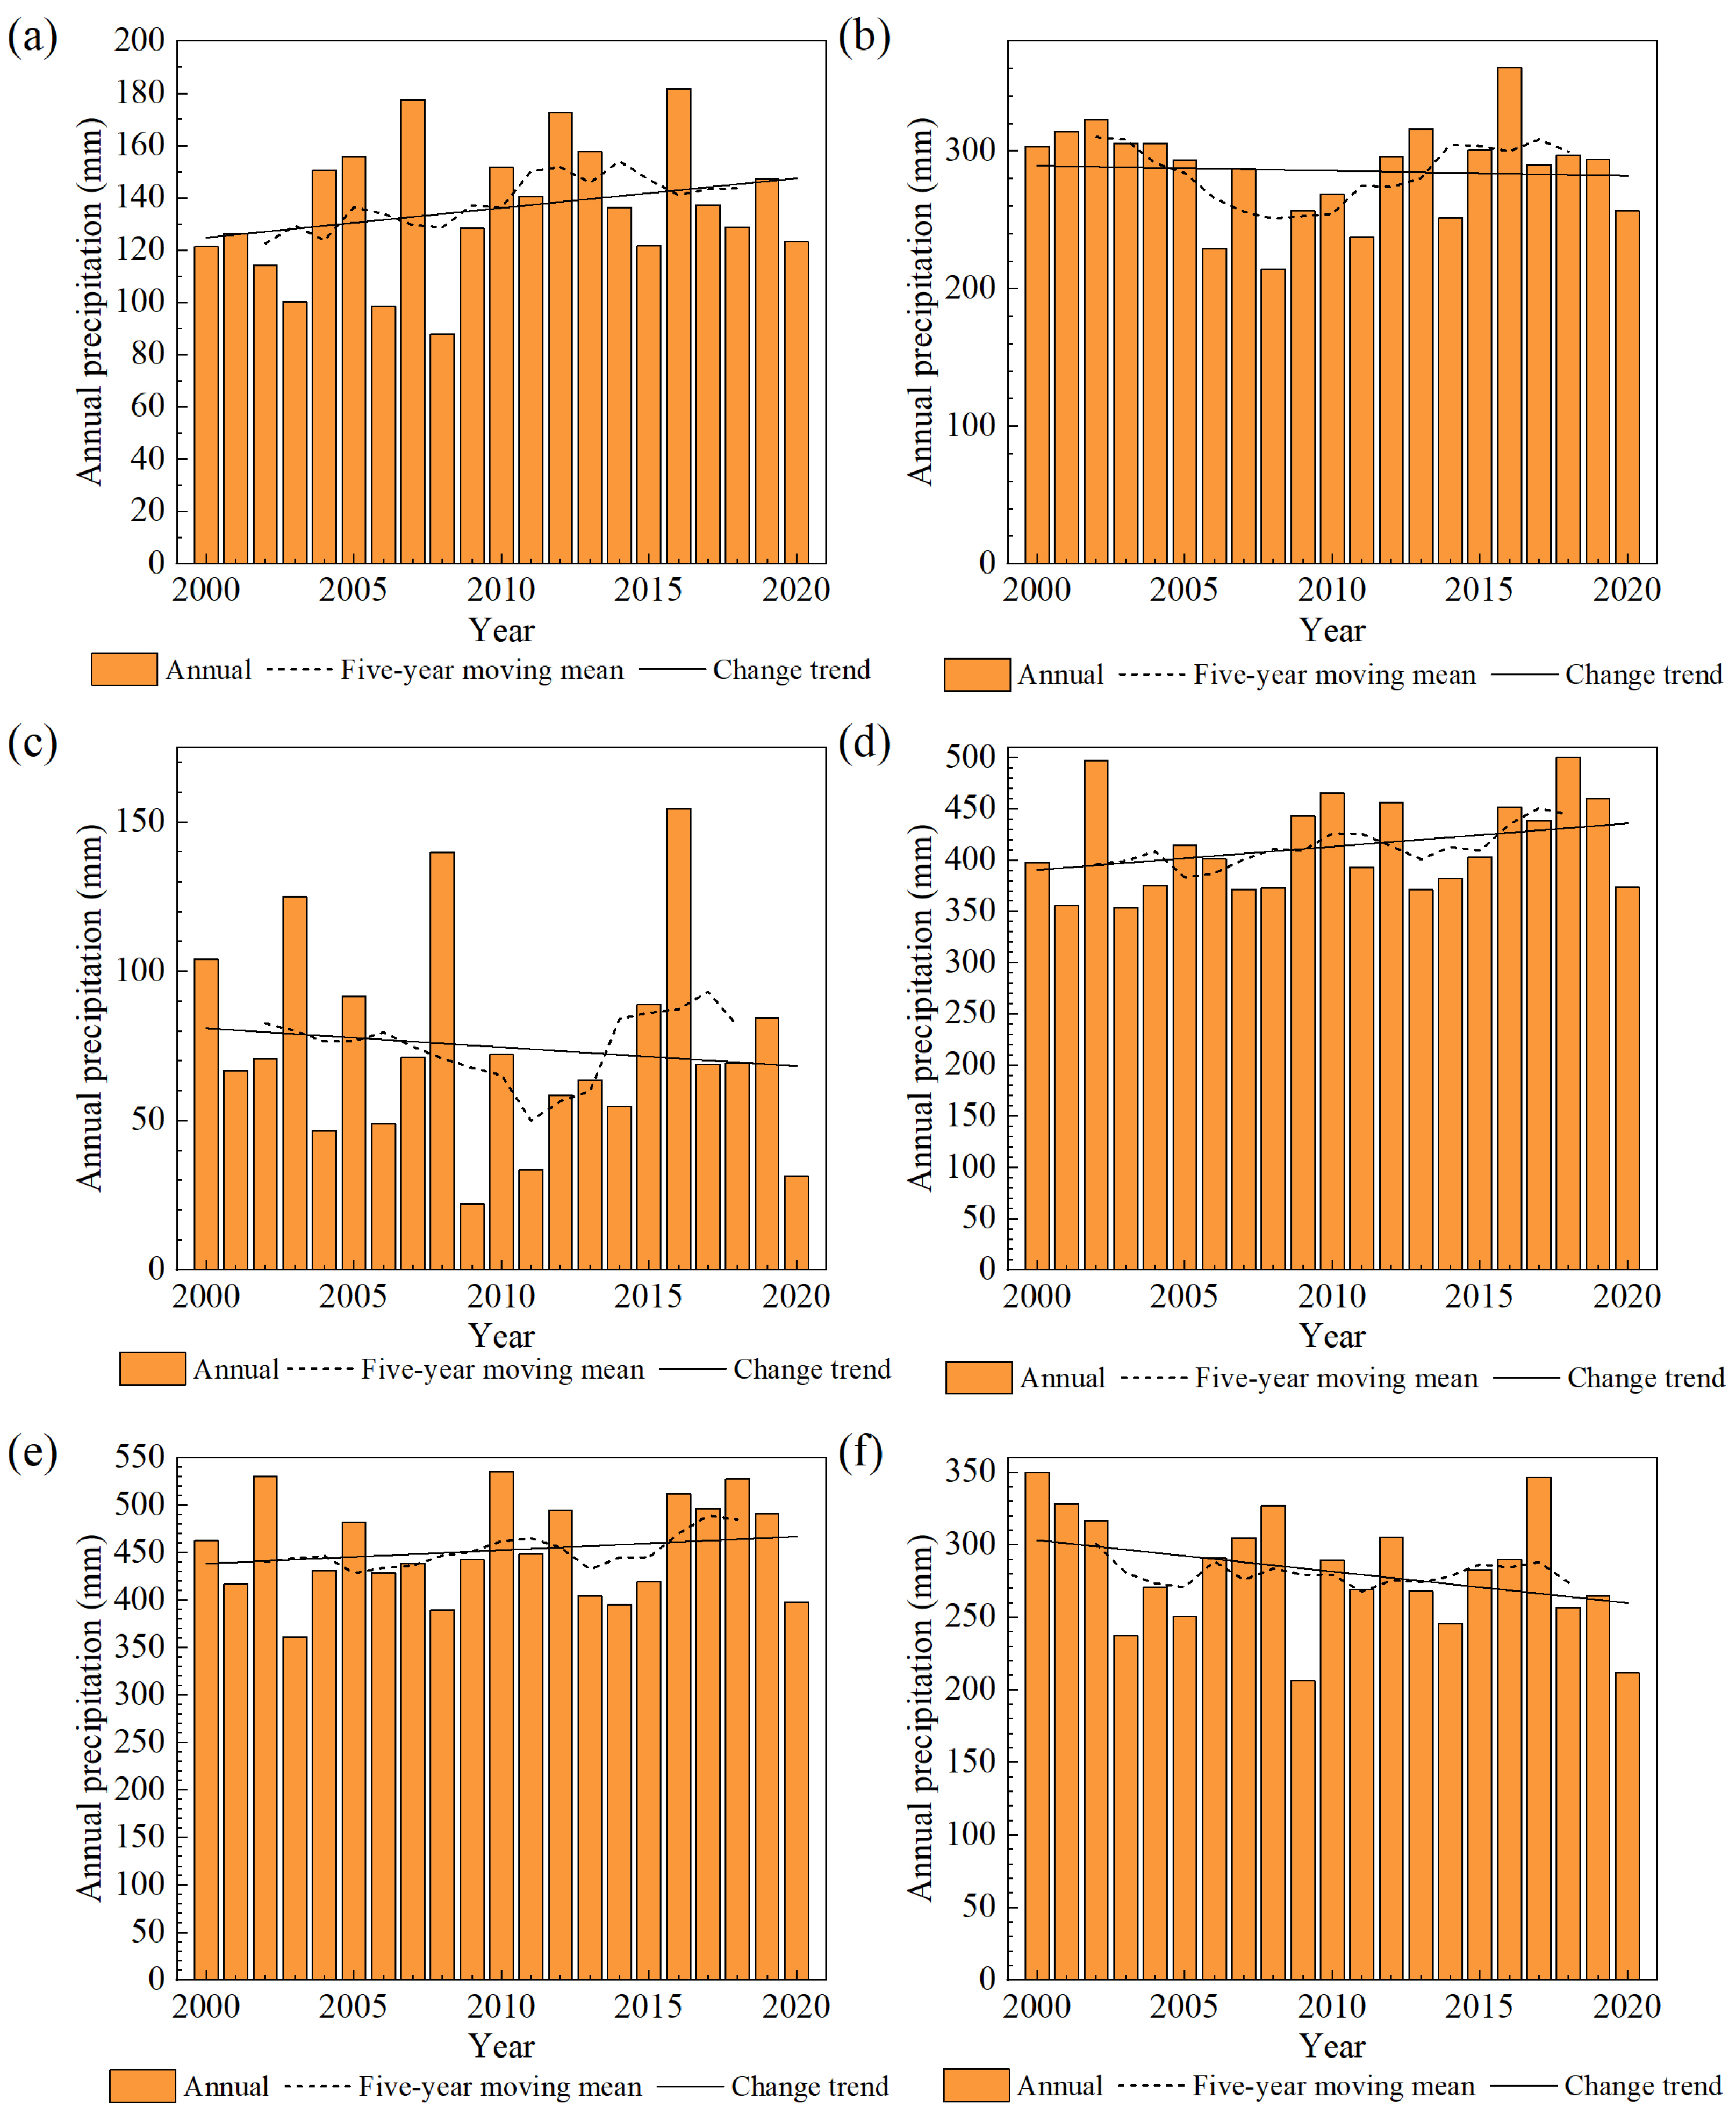
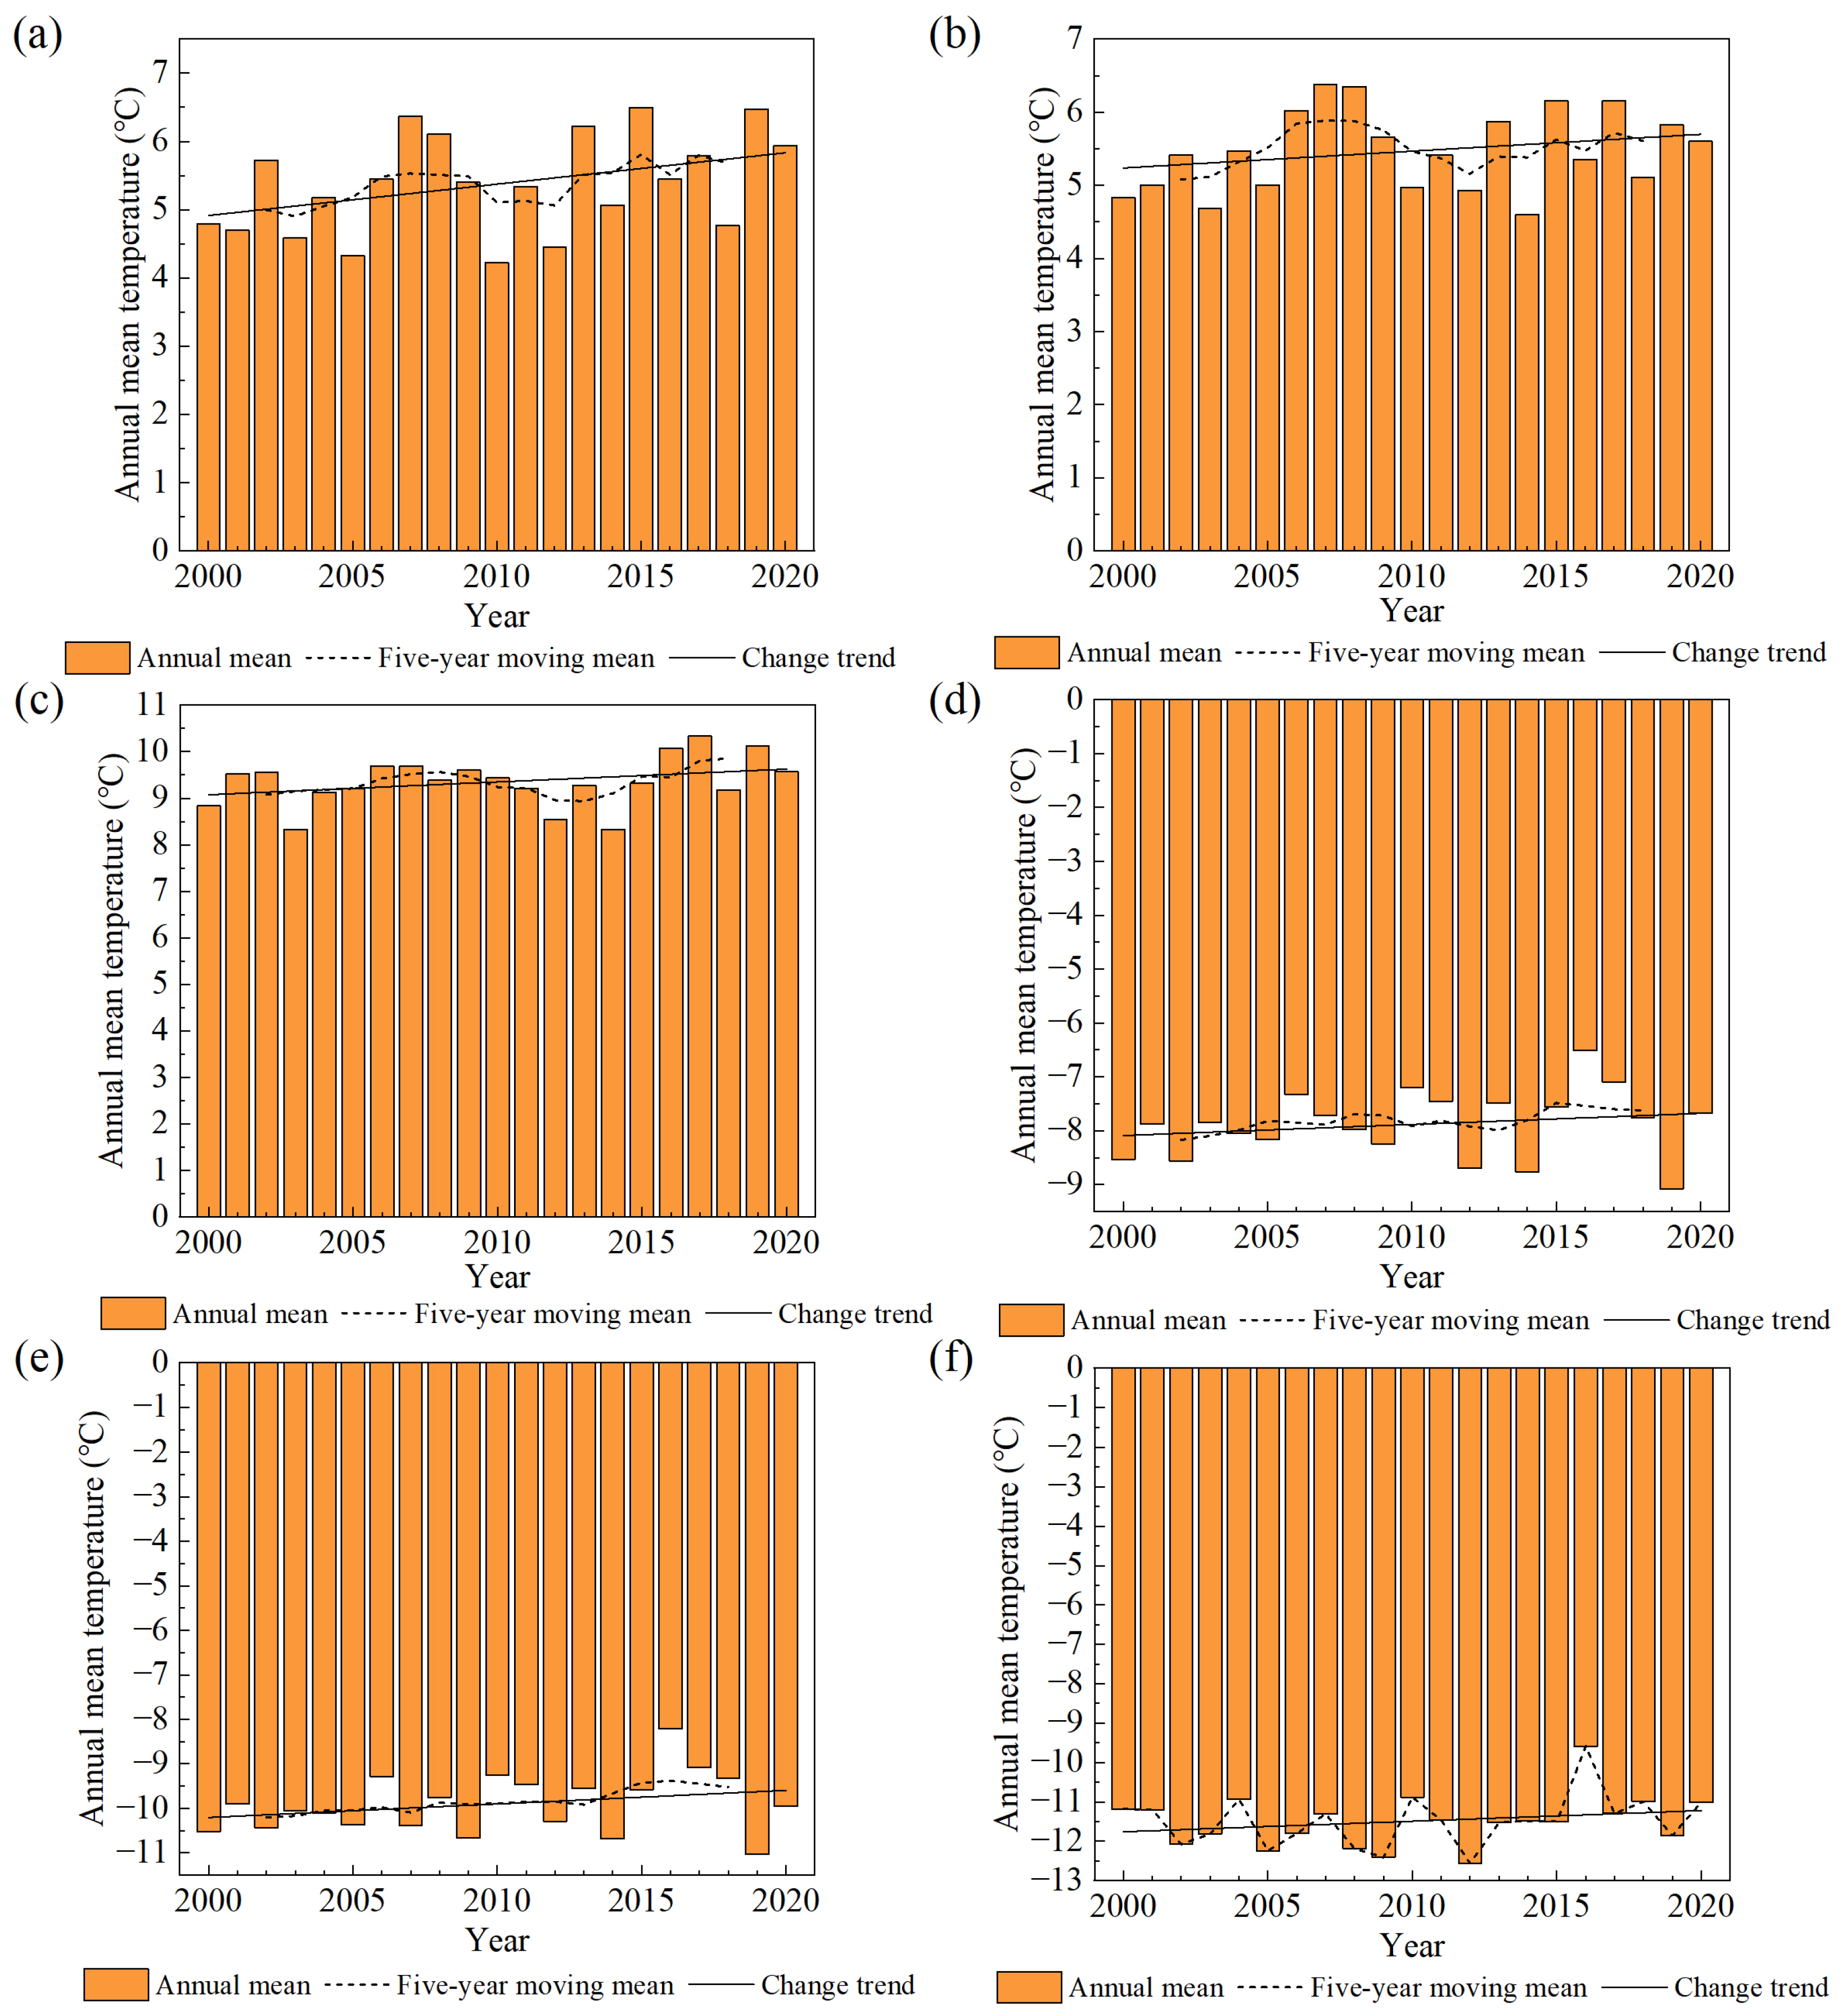
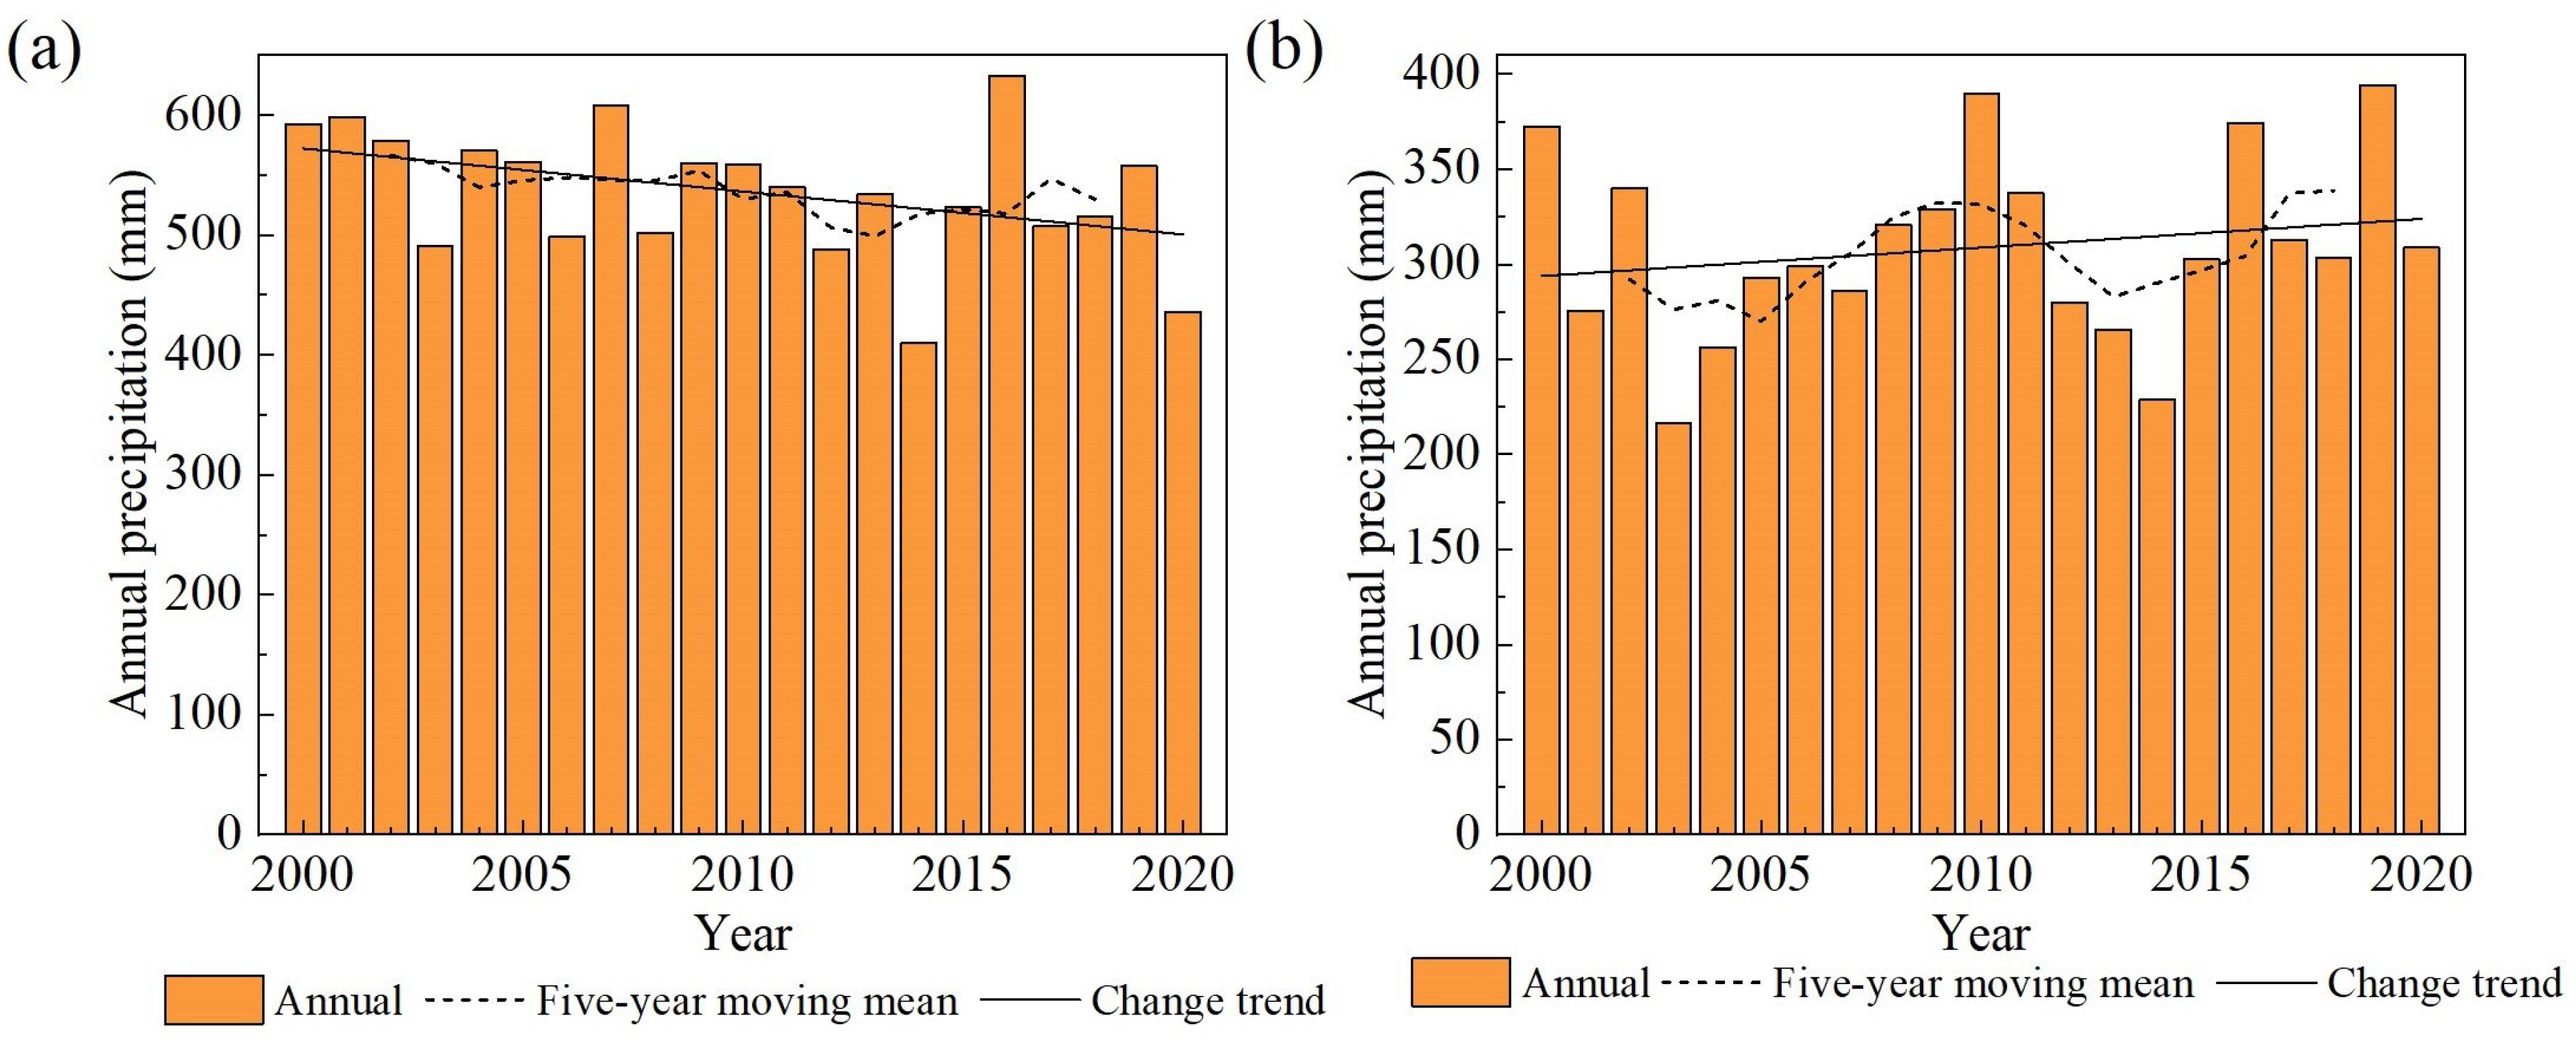
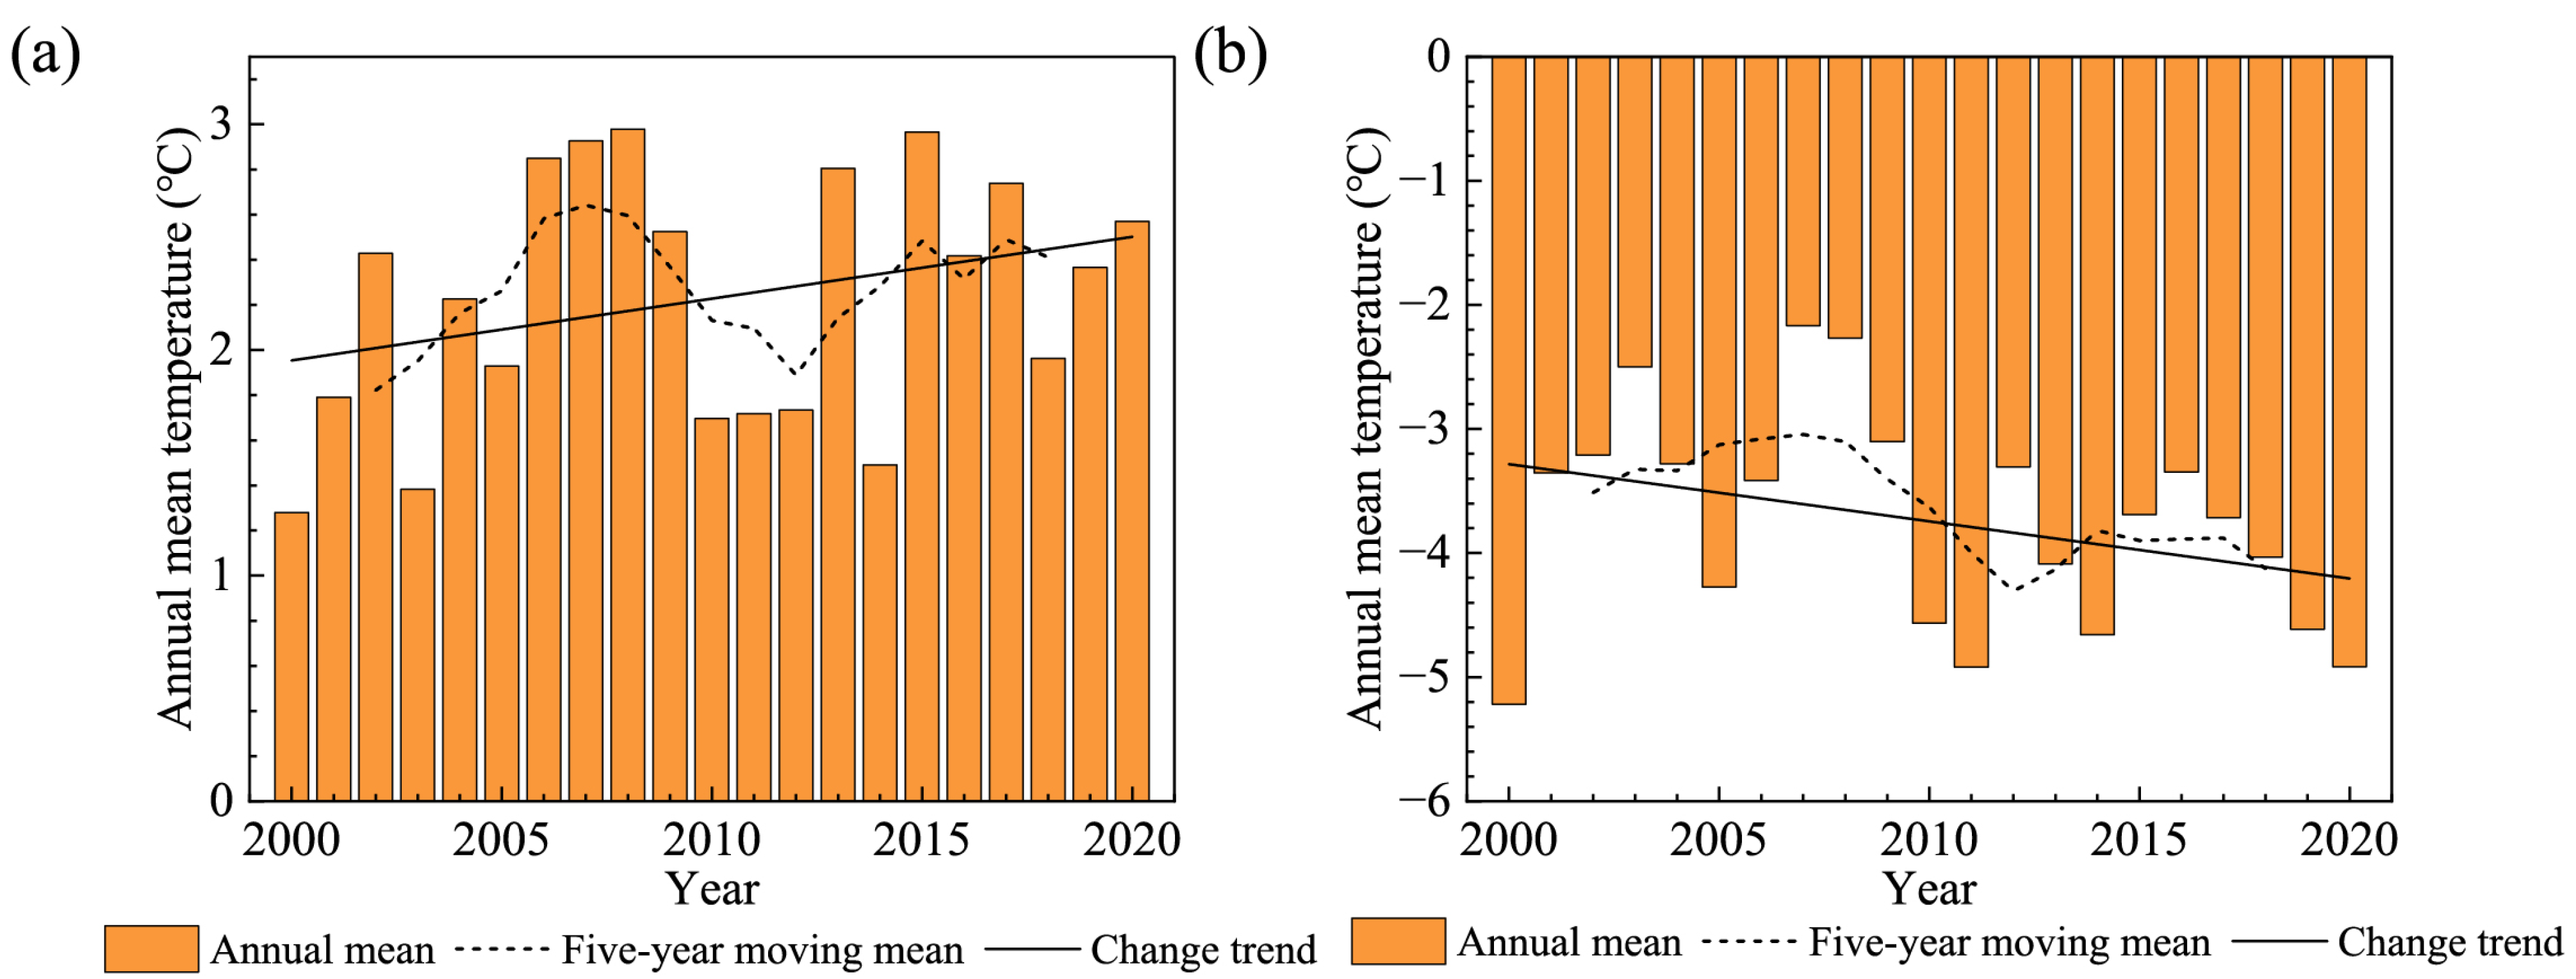
The annual, five-year moving mean and change trend of precipitation and temperature from 2000 to 2020 are calculated, respectively, as shown in Figure 8 and Figure 9. From 2000 to 2020, the annual precipitation of Ulungur Lake, Ayakkum Lake and Aqqikkol Lake all showed an upward trend, and that of Manas Lake, Bosten Lake and Aksayquin Lake showed a downward trend. According to the general trend of temperature change from 2000 to 2020, the temperatures of the six lakes were all on the rise.
In case of the limited human activities and natural precipitation, plateau lakes are mainly recharged by the increasing glacial meltwater caused by rising temperature. During the period of 2000–2020, three plateau lakes have displayed an obviously expansionist tendency, which matches the studies of plateau lakes by Jing et al. [27], Li et al. [75] and Wang et al. [26]. From 2000 to 2014, the temperature of Ayakkum Lake, Aqqikkol Lake and Aksayquin Lake increased steadily. The temperature of the three plateau lakes peaked in 2016, and then decreased slightly. The increased rate of Ayakkum Lake storage is similar with the temperature change. However, the increased rates of Aqqikkol and Aksayquin Lake storages showed a decreased trend during 2000–2020, which make sense with the reduction in water reserves caused by glacier retreat. The rising precipitation leads to more obviously increasing water storages of Ayakkum Lake and Aqqikkol Lake than Aksayquin Lake. For lakes in the plain and the transition zone, they are supplemented primarily by runoff from precipitation in upstream basins and basins where lakes are located. Lake variations of the Ulungur increased significantly due to the increasing precipitation from 2011 to 2017, which matches the change of Ulungur Lake area after 2006 by Li et al. [76]. Precipitation and temperature have no significant impact on Manas Lake and Bosten Lake. Manas Lake area showed a slight increase, despite the decrease in precipitation and the increase in temperature. Meanwhile, Manas Lake experienced a shrinkage from 2011 to 2014, which is consistent with the investigation of the spatiotemporal pattern of Manas Lake from 1972 to 2014 by Ziyinali et al. [43]. For Bosten Lake, precipitation increased and temperature decreased in the upstream basin, the opposite trend was found in the basin where it is located. Generally, the lake area, water level and water storage of Bosten Lake all displayed a slight declining trend. The study on the changes of Bosten Lake water level by Li et al. [77] showed that from 1960 to 2018, the lake water level revealed a downward trend overall, including the four stages of “down-up-down-up”. In summary, the lake area, water level and water storage of lakes in the plain and the transition area displayed a fluctuation, and had no significant change trend.
4.6. Driving Mechanism of Lake Changes in Xinjiang
The main driving factors that cause changes in the lake storage can be divided into social factors and natural factors, and the latter include precipitation and temperature. The increasing annual precipitation promotes the increase in lake water. For instance, the water level, area and storage of Ulungur Lake, Ayakkum Lake and Aqqikkol Lake and their annual precipitation all showed an increasing trend over the whole period. In contrast, Bosten Lake water level, area and storage were all on a downward trend, with the water level falling from 2000 to 2014 and rising from 2015 to 2020. The change of Bosten Lake water level was consistent with the annual precipitation in its own basin. For Manas Lake and Aksayquin Lake, the lake area increased significantly even though the annual precipitation decreased slightly. Ziyinali et al. [43] revealed that Manas Lake area variations were mainly governed by extreme heat and precipitation, and the decrease in precipitation led to a non-significant decrease in lake water storage.
With the increasingly intensive climate warming tendency, not only the evaporation of lakes but also the glacier melting has increased [78]. The distribution of glaciers in Xinjiang is shown in Appendix A. There are more than 300 glaciers covering an area of and ice reserves of around in the basin of Ayakkum Lake, and Ayakkum Lake is fed mainly by precipitation and meltwater runoff. Aqqikkol Lake and Ayakkum Lake are located in the same basin, and meltwater from glaciers and snow cover are important water sources for them. There are 129 glaciers in the basin of Aksayquin Lake, with an area of and ice reserves of . For plain and transition lakes, there are few glaciers in their basins. In 1970, northern Ulungur Lake channeled Irtysh River water to replenish itself [11]. Considering the Irtysh River is a snow-melting river, its water supply is mainly seasonal meltwater and precipitation. The basin of the Irtysh River is covered by glaciers, and rising temperatures will lead to an increase in river runoff, so increased precipitation and runoff resulted in an upward trend in lake water storage of Ulungur Lake. In recent years, the upriver reaches of the Manas Lake have been affected by rising temperatures. Even though precipitation in the basin of the Manas River has decreased, accelerated glacial melting has increased the annual runoff significantly. However, as a plain lake, Manas Lake by contrast, is supplied by its river, which is more susceptible to human activities along its route and this has caused shrinkage alongside the increased evaporation. There are glaciers in the basin of the Kaidu River which feeds Bosten Lake. Despite increased precipitation and decreased temperature, runoff into Bosten Lake is severely affected by human interference [23]. The increased evaporation due to rising temperatures resulted in a decreased trend of Bosten Lake variations. The water consumption of prefecture-level cities where lakes are located is shown in Figure 10. It shows that water consumption of Altay Administrative Offices where Ulungur Lake is located slightly decreased, while that of cities where Manas Lake and Bosten Lake are located, increased obviously. The results explain the increase in water storage of Ulungur Lake and the decrease in water storage of Manas Lake and Bosten Lake.
Overall, a warmer climate in recent decades can directly promote the melting of glaciers and snow, so temperature is the climate factor that is most significantly related to the expansion of lakes in plateaus which are fed by ice/snow meltwater. For the plain and transition lakes, they are more susceptible to extreme precipitation, evaporation and human activities. Suffering from a combination of human factors and natural factors, the plain and transition lakes were relatively stable or even contracted during the last decades.
4.7. Implication
Although most lakes in Xinjiang presented an expanding trend in recent decades, the water resources in Xinjiang still face many challenges. For lakes that are located in plain and transition zones, precipitation and snow meltwater are the main replenishment modes. Despite increasing temperature promoting the runoff recharged by glacial snow melting, the evaporation of lakes was also strengthened obviously, especially in northern Xinjiang [79]. Human factors such as the construction of reservoirs and agricultural water consumption play an important role in lake variations [23]. Bosten Lake is an important regional source of drinking water and irrigation water [48], and water from Manas River that supplies the Manas Lake is consumed for irrigation agriculture [43]. Considering plain and transition lakes were relatively stable or even contracted during the past decades, continuous expansion of the irrigation area and the population will result in scarcer water resources in Xinjiang [48]. To prevent water resource shortage in the near future, adaption and mitigation measures are required to alleviate the serious harm to the local environment and livelihoods. For instance, there should be a decrease in the area of high water-consuming crops and an enhancement of water saving projects [15]. Plain lake water in Xinjiang was used to solve the water storage problems in nearby cities, which resulted in a decline of lake water table depth. Recently, some measures were implemented to effectively replenish the lake water and surrounding groundwater, which included three diversion projects and a limitation of the exploitation of groundwater. Due to the increase in agricultural and industrial water consumption the total runoff entering the plain lakes reduced. In 2015, some restoration projects such as water-saving irrigation, the return of sand to grass, and ecological migration were launched to improve the ecological environment of lakes [71]. Intensive land use reduces the soil water storage and increases surface runoff, affecting the resilience of soil to drought and water quality of downstream areas. Proactive land management can reduce the risk of floods and droughts, including maintaining good soil structure, use of crop rotations, afforestation, floodplain or wetland restoration. For increased water scarcity risks, strategic interventions are required to implement sustainable abstraction limits and provide incentives for increased irrigation efficiency [80].
Far away from human disturbance, plateau lake dynamics are mainly influenced by climate change [23]. For example, Ayakkum Lake and Aqqikkol Lake are located in the National Nature Protection of Altun Mountain, so they are well-protected and their water storages have been increasing recently. The main replenishment mode of plateau lakes is runoff, which is highly dependent on glaciers and snow cover. With continuous warming, most glaciers gradually receded, indicating that the runoff recharged by glacial meltwater will correspondingly decline. Due to the declining regulation function of the glacial meltwater, extreme climatic and hydrological events happened more frequently [15], which will intensify the unreliability and vulnerability of water resources in Xinjiang. In addition, the continuous melting of glaciers will pose a potential danger to the storage of freshwater resources [81]. More extreme rainfall events occurred due to climate change, which resulted in large fluctuations in the amount of lake waters. Constructing a project to transfer the excess water caused by heavy rains to water-deficient basins, would achieve a desirable redistribution of water and promotion of economic activities in water-deficient areas [82]. For plateau areas, the retreat of glaciers reduced freshwater reserves. Over a long term to fight drought, modelling additional storage, improving water and land monitoring to build water accounts, and advising water management both during and between droughts deserve consideration [83].
In conclusion, with the continued ablation and retreat of glaciers, the risk of heavy flood disaster and water resource shortages will increase a lot. Exploring future trends of water resources and developing water management are worth realizing for sustainable ecological development.
5. Conclusions
Lakes are good indicators of regional climate change. Multi-satellite product data allows an accurate study of lake water storage changes in remote areas over a long-term. Based on the Global Surface Water Monthly Historical dataset and the altimetry water level dataset (Hydroweb) we estimated lake water changes for six typical lakes in Xinjiang from 2000 to 2020, and discussed their response to climate change. We conclude that: (1) the water level of plateau lakes increased steadily, but increased rates of water levels in Aqqikkol Lake and Aksayquin Lake reduced. (2) The area of Ulungur Lake rarely changed, while that of Manas Lake changed most dramatically. (3) using the Mann–Kendall test, the accumulative water storage of three plateau lakes and Ulungur Lake all displayed sharply rising trends, while that of Bosten Lake showed a slightly decrease, and that of Manas Lake did not change significantly. (4) precipitation and human activities are the significant factors behind the variations of plain and transition lakes. For plateau lakes, the increasing temperature accelerated the melting of glaciers, which contributed to the increase in lake water storages.
The experimental results provide a long-term comprehensive estimation of lake water storage changes in Xinjiang. The six lakes selected in this research are distributed across northern and southern Xinjiang, and well represent freshwater and saltwater lakes at different elevations in this region. Lake areas and water levels used to construct models have strong correlations, which proves the reliability of empirical models. The lake spatial variations derived from the empirical models reveal that plain and transition lakes near Tianshan Mountains were slightly contracted, while plateau lakes expanded obviously, which are very consistent with the water mass change retrieved from the GRACE satellite data. We discussed natural factors and social factors which affect the lake changes in Xinjiang. In addition, some recommendations for water management are provided herein. This study provides valuable materials for a better understanding of climate changes’ effects on lake variations in arid regions, as well as a reference for utilization and management policies of local water resources.
Author Contributions
Methodology, software, investigation, writing—original draft, writing—review and editing, Z.H.; conceptualization, validation, formal analysis, writing—review and editing, J.X.; resources, validation, formal analysis, visualization, writing—review and editing, L.Z. All authors have read and agreed to the published version of the manuscript.
Funding
The research was supported by The 3rd Comprehensive Scientific survey in Xinjiang (2022xjkk0107).
Data Availability Statement
The data that support the findings of this study are available from the corresponding author upon reasonable request.
Acknowledgments
We thank all the graduate students who participated in the field work and laboratory analyses.
Conflicts of Interest
The authors declare no conflict of interest.
Appendix A
Figure A1.
Precipitation in the upstream basins of lakes from 2000 to 2020 (a) Manas Lake; (b) Bosten Lake.
Figure A1.
Precipitation in the upstream basins of lakes from 2000 to 2020 (a) Manas Lake; (b) Bosten Lake.

Figure A2.
Temperature in the upstream basins of lakes from 2000 to 2020 (a) Manas Lake; (b) Bosten Lake.
Figure A2.
Temperature in the upstream basins of lakes from 2000 to 2020 (a) Manas Lake; (b) Bosten Lake.

Figure A3.
Glacier distribution of Xinjiang.

References
- Yang, K.; Yao, F.; Wang, J.; Luo, J.; Shen, Z.; Wang, C.; Song, C. Recent dynamics of alpine lakes on the endorheic Changtang Plateau from multi-mission satellite data. J. Hydrol. 2017, 552, 633–645. [Google Scholar] [CrossRef]
- Meyers, P.; Ishiwatari, R. Lacustrine organic geochemistry—an overview of indicators of organic matter sources and diagenesis in lake sediments. Org. Geochem. 1993, 20, 867–900. [Google Scholar] [CrossRef]
- Wong, C.; Jiang, B.; Bohn, T.; Lee, K.; Lettenmaier, D.; Ma, D.; Ouyang, Z. Lake and wetland ecosystem services measuring water storage and local climate regulation. Water Resour. Res. 2017, 53, 3197–3223. [Google Scholar] [CrossRef]
- Jeppesen, E.; Peder Jensen, J.; SØndergaard, M.; Lauridsen, T.; Landkildehus, F. Trophic structure, species richness and biodiversity in Danish lakes: Changes along a phosphorus gradient. Freshw. Biol. 2000, 45, 201–218. [Google Scholar] [CrossRef]
- Cao, J.; Wang, S. Main Environmental Problems of Inland Lakes in Northwest China. Sci. Technol. Rev. 2001, 19, 21–23. [Google Scholar]
- Wang, W.; Jiao, A.; Shan, Q.; Wang, Z.; Kong, Z.; Ling, H.; Deng, X. Expansion of typical lakes in Xinjiang under the combined effects of climate change and human activities. Front. Environ. Sci. 2022, 10, 1015543. [Google Scholar] [CrossRef]
- Herlihy, A.; Sobota, J.; McDonnell, T.; Sullivan, T.; Lehmann, S.; Tarquinio, E. An a priori process for selecting candidate reference lakes for a national survey. Freshw. Sci. 2013, 32, 385–396. [Google Scholar] [CrossRef]
- Alizadeh-Choobari, O.; Ahmadi-Givi, F.; Mirzaei, N.; Owlad, E. Climate change and anthropogenic impacts on the rapid shrinkage of Lake Urmia. Int. J. Climatol. 2016, 36, 4276–4286. [Google Scholar] [CrossRef]
- Song, C.; Sheng, Y.; Ke, L.; Nie, Y.; Wang, J. Glacial lake evolution in the southeastern Tibetan Plateau and the cause of rapid expansion of proglacial lakes linked to glacial-hydrogeomorphic processes. J. Hydrol. 2016, 540, 504–514. [Google Scholar] [CrossRef]
- Chaudhari, S.; Felfelani, F.; Shin, S.; Pokhrel, Y. Climate and anthropogenic contributions to the desiccation of the second largest saline lake in the twentieth century. J. Hydrol. 2018, 560, 342–353. [Google Scholar] [CrossRef]
- Dilinuer, A.; Aikebaer. Study on Dynamic Change of Main Lakes Water Area in Xinjiang. J. China Hydrol. 2010, 30, 91–95. [Google Scholar]
- Liu, Y.; Li, L.; Chen, X.; Zhang, R.; Yang, J. Temporal-spatial variations and influencing factors of vegetation cover in Xinjiang from 1982 to 2013 based on GIMMS-NDVI3g. Glob. Planet. Chang. 2018, 169, 145–155. [Google Scholar] [CrossRef]
- Tandong, Y.; Fahu, C.; Peng, C.; Yaoming, M.; Baiqing, X.; Liping, Z.; Fan, Z.; Weicai, W.; Likun, A.; Xiaoxin, Y. From Tibetan plateau to third pole and pan-third pole. Bull. Chin. Acad. Sci. 2017, 32, 924–931. [Google Scholar]
- Yang, J.; Ma, L.; Li, C.; Liu, Y.; Ding, J.; Yang, S. Temporal-spatial variations and influencing factors of Lakes in inland arid areas from 2000 to 2017: A case study in Xinjiang. Geomat. Nat. Hazards Risk 2019, 10, 519–543. [Google Scholar]
- Chen, Y.; Li, B.; Fan, Y.; Sun, C.; Fang, G. Hydrological and water cycle processes of inland river basins in the arid region of Northwest China. J. Arid Land 2019, 11, 161–179. [Google Scholar] [CrossRef]
- Shen, Y.; Guo, Y.; Zhang, Y.; Pei, H.; Brenning, A. Review of historical and projected future climatic and hydrological changes in mountainous semiarid Xinjiang (northwestern China), central Asia. Catena 2020, 187, 104343. [Google Scholar] [CrossRef]
- Huai, B.; Li, Z.; Sun, M.; Wang, W.; Jin, S.; Li, K. Change in glacier area and thickness in the Tomur Peak, western Chinese Tien Shan over the past four decades. J. Earth Syst. Sci. 2015, 124, 353–363. [Google Scholar]
- Liu, C.; Chen, Y.; Fang, G.; Zhou, H.; Huang, W.; Liu, Y.; Wang, X.; Li, Z. Hydrological Connectivity Improves the Water-Related Environment in a Typical Arid Inland River Basin in Xinjiang, China. Remote Sens. 2022, 14, 4977. [Google Scholar] [CrossRef]
- Fu, C.; Wu, H.; Zhu, Z.; Song, C.; Xue, B.; Wu, H.; Ji, Z.; Dong, L. Exploring the potential factors on the striking water level variation of the two largest semi-arid-region lakes in northeastern Asia. Catena 2021, 198, 105037. [Google Scholar] [CrossRef]
- Chen, Z.; Chen, Y. Effects of climate fluctuations on runoff in the headwater region of the Kaidu River in northwestern China. Front. Earth Sci. 2014, 8, 309–318. [Google Scholar] [CrossRef]
- Song, C.; Huang, B.; Ke, L.; Richards, K. Remote sensing of alpine lake water environment changes on the Tibetan Plateau and surroundings: A review. ISPRS J. Photogramm. Remote Sens. 2014, 92, 26–37. [Google Scholar] [CrossRef]
- Zhan, P.; Liu, K.; Song, C. A Comparative Study on the Changes of Typical Lakes in Different Climate Zones of the Tibetan Plateau at Multi-timescales based on Remote Sensing Observations. Remote Sens. Technol. Appl. 2021, 36, 90–102. [Google Scholar]
- Bai, J.; Chen, X.; Li, J.; Yang, L.; Fang, H. Changes in the area of inland lakes in arid regions of central Asia during the past 30 years. Env. Monit Assess 2011, 178, 247–256. [Google Scholar] [CrossRef] [PubMed]
- Bai, R.; He, L.; Wu, J. Analysis on Recent Change of Water Area of the Main Lakes in Xinjiang Based on MODIS Data. Arid Zone Res. 2012, 29, 561–566. [Google Scholar]
- Zhang, Y.; An, C.; Zheng, L.; Liu, L.; Zhang, W.; Lu, C.; Zhang, Y. Assessment of lake area in response to climate change at varying elevations: A case study of Mt. Tianshan, Central Asia. Sci. Total Environ. 2023, 869, 161665. [Google Scholar] [CrossRef]
- Wang, W.; Samat, A.; Ma, L.; Ge, Y.; Abuduwaili, J. Spatio-temporal variations and trend analysis of lake area in Xinjiang in 1986—2019. Acta Ecol. Sin. 2022, 42, 1300–1314. [Google Scholar]
- Jing, Y.; Zhang, F.; Wang, X. Monitoring dynamics and driving forces of lake changes in different seasons in Xinjiang using multi-source remote sensing. Eur. J. Remote Sens. 2018, 51, 150–165. [Google Scholar] [CrossRef]
- Liu, H.; Chen, Y.; Ye, Z.; Li, Y.; Zhang, Q. Recent Lake Area Changes in Central Asia. Sci. Rep. 2019, 9, 16277. [Google Scholar] [CrossRef]
- Qiao, B.; Zhu, L.; Yang, R. Temporal-spatial differences in lake water storage changes and their links to climate change throughout the Tibetan Plateau. Remote Sens. Environ. 2019, 222, 232–243. [Google Scholar] [CrossRef]
- Zhan, P.; Song, C.; Wang, J.; Li, W.; Ke, L.; Liu, K.; Chen, T. Recent Abnormal Hydrologic Behavior of Tibetan Lakes Observed by Multi-Mission Altimeters. Remote Sens. 2020, 12, 2986. [Google Scholar] [CrossRef]
- Liu, Y.; Ye, Z.; Jia, Q.; Mamat, A.; Guan, H. Multi-Source Remote Sensing Data for Lake Change Detection in Xinjiang, China. Atmosphere 2022, 13, 713. [Google Scholar] [CrossRef]
- Chen, T.; Song, C.; Luo, S.; Ke, L.; Liu, K.; Zhu, J. Monitoring global reservoirs using ICESat-2: Assessment on spatial coverage and application potential. J. Hydrol. 2022, 604, 127257. [Google Scholar] [CrossRef]
- Luo, S.; Song, C.; Ke, L.; Zhan, P.; Fan, C.; Liu, K.; Chen, T.; Wang, J.; Zhu, J. Satellite Laser Altimetry Reveals a Net Water Mass Gain in Global Lakes With Spatial Heterogeneity in the Early 21st Century. Geophys. Res. Lett. 2022, 49, e2021GL09667. [Google Scholar] [CrossRef]
- Zhan, P.; Song, C.; Luo, S.; Liu, K.; Ke, L.; Chen, T. Lake Level Reconstructed From DEM-Based Virtual Station: Comparison of Multisource DEMs With Laser Altimetry and UAV-LiDAR Measurements. IEEE Geosci. Remote Sens. Lett. 2022, 19, 6502005. [Google Scholar] [CrossRef]
- Crétaux, J.; Arsen, A.; Calmant, S.; Kouraev, A.; Vuglinski, V.; Bergé-Nguyen, M.; Gennero, M.; Nino, F.; Abarca Del Rio, R.; Cazenave, A.; et al. SOLS: A lake database to monitor in the Near Real Time water level and storage variations from remote sensing data. Adv. Space Res. 2011, 47, 1497–1507. [Google Scholar] [CrossRef]
- Schwatke, C.; Dettmering, D.; Bosch, W.; Seitz, F. DAHITI—An innovative approach for estimating water level time series over inland waters using multi-mission satellite altimetry. Hydrol. Earth Syst. Sci. 2015, 19, 4345–4364. [Google Scholar] [CrossRef]
- Pekel, J.; Cottam, A.; Gorelick, N.; Belward, A. High-resolution mapping of global surface water and its long-term changes. Nature 2016, 540, 418–422. [Google Scholar] [CrossRef]
- Jamro, S.; Naseer, T.; Zaidi, A.; Vignudelli, S. A Comparative Analysis of Altimetry Derived Water Levels with in-situ Gauge Data on River Indus. In Proceedings of the IGARSS 2019—2019 IEEE International Geoscience and Remote Sensing Symposium, Yokohama, Japan, 28 July–2 August 2019; pp. 6915–6918. [Google Scholar]
- Kong, Y.; Pang, Z. Evaluating the sensitivity of glacier rivers to climate change based on hydrograph separation of discharge. J. Hydrol. 2012, 434–435, 121–129. [Google Scholar] [CrossRef]
- Xu, Z. Exploring Typical Lake Water Surface Temperature Changes across Xinjiang during 2000–2017. Master’s Thesis, Xinjiang University, Xinjiang, China, 2020. [Google Scholar]
- Li, X.; Jia, P.; Niu, C.; Xing, Y.; Li, H.; Liu, H.; Tang, W.; Zhao, Y. Species diversity of freshwater fish and assessment on watershed health in the Irtysh River and Ulungur River basins in Xinjiang, China. Biodivers. Sci. 2020, 28, 422–434. [Google Scholar] [CrossRef]
- He, C.; Chen, F.; Wang, Y.; Long, A.; He, X. Flood frequency analysis of Manas River Basin in China under non-stationary condition. J. Flood Risk Manag. 2021, 14, e12745. [Google Scholar] [CrossRef]
- Hurixbek, Z.; Wu, Z.; Kazya, B. Lake changes in spatial evolution and driving force for the water area change of the Manas Lake in Xinjiang in the past forty years. Remote Sens. Land Resour. 2018, 30, 217–223. [Google Scholar]
- Tang, X.; Xie, G.; Deng, J.; Shao, K.; Hu, Y.; He, J.; Zhang, J.; Gao, G. Effects of climate change and anthropogenic activities on lake environmental dynamics: A case study in Lake Bosten Catchment, NW China. J. Environ. Manag. 2022, 319, 115764. [Google Scholar] [CrossRef] [PubMed]
- Shi, G.; Gao, B. Attribution Analysis of Runoff Change in the Upper Reaches of the Kaidu River Basin Based on a Modified Budyko Framework. Atmosphere 2022, 13, 1385. [Google Scholar] [CrossRef]
- Wang, S. Encyclopaedia of Xinjiang Rivers and Lakes; China Water & Power Press: Beijing, China, 2010; pp. 335–350. [Google Scholar]
- Xiang, C.; Wang, Y.; Wang, J.; Ma, Q. Environmental changes recorded by multiproxy of lake sediments in the high-altitude and arid area:A case of Lake Aksayqin. Arid Land Geogr. 2022, 45, 435–444. [Google Scholar]
- Zheng, L.; Xia, Z.; Xu, J.; Chen, Y.; Yang, H.; Li, D. Exploring annual lake dynamics in Xinjiang (China): Spatiotemporal features and driving climate factors from 2000 to 2019. Clim. Chang. 2021, 166, 36. [Google Scholar] [CrossRef]
- Google Earth Engine. Available online: https://earthengine.google.com (accessed on 5 April 2023).
- HydroLAKES. Available online: https://www.hydrosheds.org/products/hydrolakes (accessed on 5 April 2023).
- Hydroweb. Available online: https://hydroweb.theia-land.fr (accessed on 5 April 2023).
- Tapley, B.; Bettadpur, S.; Ries, J.; Thompson, P.; Watkins, M. GRACE measurements of mass variability in the Earth system. Science 2004, 305, 503–505. [Google Scholar] [CrossRef] [PubMed]
- Save, H.; Bettadpur, S.; Tapley, B. High-resolution CSR GRACE RL05 mascons. J. Geophys. Res. Solid Earth 2016, 121, 7547–7569. [Google Scholar] [CrossRef]
- Scanlon, B.; Zhang, Z.; Save, H.; Wiese, D.; Landerer, F.; Long, D.; Longuevergne, L.; Chen, J. Global evaluation of new GRACE mascon products for hydrologic applications. Water Resour. Res. 2016, 52, 9412–9429. [Google Scholar] [CrossRef]
- GRACE - Gravity Recovery and Climate Experiment. Available online: http://www2.csr.utexas.edu/grace (accessed on 5 April 2023).
- Zhang, L.; Sun, W. Progress and prospect of GRACE Mascon product and its application. Rev. Geophys. Planet. Phys. 2022, 53, 35–52. [Google Scholar]
- Zhang, Y.; Wei, W.; Jiang, F.; Liu, M.; Wang, W.; Bai, L.; Li, K. Brief communication “Assessment of change in temperature and precipitation over Xinjiang, China”. Nat. Hazards Earth Syst. Sci. 2012, 12, 1327–1331. [Google Scholar] [CrossRef]
- Resource and Environment Science and Data Center, Chinese Academy of Sciences. Available online: https://www.resdc.cn (accessed on 5 April 2023).
- cds.climate.copernicus.eu. Available online: https://cds.climate.copernicus.eu (accessed on 5 April 2023).
- Zheng, L.; Li, D.; Xu, J.; Xia, Z.; Hao, H.; Chen, Z. A twenty-years remote sensing study reveals changes to alpine pastures under asymmetric climate warming. ISPRS J. Photogramm. Remote Sens. 2022, 190, 69–78. [Google Scholar] [CrossRef]
- Fan, M.; Xu, J.; Li, D.; Chen, Y. Response of Precipitation in Tianshan to Global Climate Change Based on the Berkeley Earth and ERA5 Reanalysis Products. Remote Sens. 2022, 14, 519. [Google Scholar] [CrossRef]
- Li, B.; Li, Y.; Chen, Y.; Zhang, B.; Shi, X. Recent fall Eurasian cooling linked to North Pacific sea surface temperatures and a strengthening Siberian high. Nat. Commun. 2020, 11, 5202. [Google Scholar] [CrossRef] [PubMed]
- Song, C.; Huang, B.; Ke, L. Modeling and analysis of lake water storage changes on the Tibetan Plateau using multi-mission satellite data. Remote Sens. Environ. 2013, 135, 25–35. [Google Scholar] [CrossRef]
- Cheng, J.; Song, C.; Liu, K.; Ke, L.; Chen, T.; Fan, C. Regional assessment of the potential risks of rapid lake expansion impacting on the Tibetan human living environment. Environ. Earth Sci. 2021, 80, 166. [Google Scholar] [CrossRef]
- Song, C.; Huang, B.; Ke, L.; Richards, K. Seasonal and abrupt changes in the water level of closed lakes on the Tibetan Plateau and implications for climate impacts. J. Hydrol. 2014, 514, 131–144. [Google Scholar] [CrossRef]
- Abileah, R.; Vignudelli, S.; Scozzari, A. A completely remote sensing approach to monitoring reservoirs water volume. Int. Water Technol. J. 2011, 1, 63–77. [Google Scholar]
- Gibbons, J.; Chakraborti, S. Nonparametric Statistical Inference, 4th ed.; Marcel Dekker, Inc.: New York, NY, USA, 2003; pp. 4–10. [Google Scholar]
- Xu, J. Mathematical Methods in Contemporary Geography, 3rd ed.; Higher Education Press: Beijing, China, 2017; pp. 133–138. [Google Scholar]
- Hamed, K.; Ramachandra Rao, A. A modified Mann-Kendall trend test for autocorrelated data. J. Hydrol. 1998, 204, 182–196. [Google Scholar] [CrossRef]
- Wang, J. Determining the most accurate program for the Mann-Kendall method in detecting climate mutation. Theor. Appl. Climatol. 2020, 142, 847–854. [Google Scholar] [CrossRef]
- Zhang, J.; Zhou, J.; Zhang, G.; Ji, Y.; Zeng, Y.; Fan, W.; Aikelamu, A. Climate- and human-driven variations in lake area and number in North Xinjiang, China. Int. J. Remote Sens. 2021, 42, 469–485. [Google Scholar] [CrossRef]
- Jiang, X.; Fan, C.; Liu, K.; Chen, T.; Cao, Z.; Song, C. Centenary covariations of water salinity and storage of the largest lake of Northwest China reconstructed by machine learning. J. Hydrol. 2022, 612, 128095. [Google Scholar] [CrossRef]
- Su, Y.; Guo, B.; Zhou, Z.; Zhong, Y.; Min, L. Spatio-Temporal Variations in Groundwater Revealed by GRACE and Its Driving Factors in the Huang-Huai-Hai Plain, China. Sensors 2020, 20, 922. [Google Scholar] [CrossRef] [PubMed]
- Zhang, L.; Yi, S.; Wang, Q.; Chang, L.; Tang, H.; Sun, W. Evaluation of GRACE mascon solutions for small spatial scales and localized mass sources. Geophys. J. Int. 2019, 218, 1307–1321. [Google Scholar] [CrossRef]
- Li, J.; Bai, J.; Wang, Y. Time Series Area of the Ayakkum Lake and Its Response to Climate Change. Arid Zone Res. 2018, 35, 85–95. [Google Scholar]
- Li, Y.; Liu, X.; Li, Y.; Gao, F. Analysis of water surface area variation of Ulungur Lake based on multi-source remote sensing data. Express Water Resour. Hydropower Inf. 2021, 42, 29–33+48. [Google Scholar]
- Li, Y.; Chen, Y.; Zhang, Q.; Fang, G. Analysis of the change in water level and its influencing factors on Bosten Lake from 1960 to 2018. Arid Zone Res. 2021, 38, 48–58. [Google Scholar]
- Chen, Y.; Li, Z.; Fan, Y.; Wang, H.; Fang, G. Research progress on the impact of climate change on water resources in the arid region of Northwest China. Acta Geogr. Sin. 2014, 69, 1295–1304. [Google Scholar]
- Zhang, Q.; Chen, Y.; Li, Z.; Sun, C.; Xiang, Y.; Liu, Z. Spatio-Temporal Development of Vegetation Carbon Sinks and Sources in the Arid Region of Northwest China. Int. J. Environ. Res. Public Health 2023, 20, 3608. [Google Scholar] [CrossRef]
- Brown, I. Assessing climate change risks to the natural environment to facilitate cross-sectoral adaptation policy. Philos. Trans. R. Soc. A-Math. Phys. Eng. Sci. 2018, 376, 20170297. [Google Scholar] [CrossRef]
- Deng, H.; Chen, Y.; Li, Q.; Lin, G. Loss of terrestrial water storage in the Tianshan mountains from 2003 to 2015. Int. J. Remote Sens. 2019, 40, 8342–8358. [Google Scholar] [CrossRef]
- Khan, M.; Shakya, S.; Vu, H.; Ahn, J.; Nam, G. Water Environment Policy and Climate Change: A Comparative Study of India and South Korea. Sustainability 2019, 11, 3284. [Google Scholar] [CrossRef]
- Lankford, B.; Pringle, C.; McCosh, J.; Shabalala, M.; Hess, T.; Knox, J. Irrigation area, efficiency and water storage mediate the drought resilience of irrigated agriculture in a semi-arid catchment. Sci. Total Environ. 2023, 859, 160263. [Google Scholar] [CrossRef] [PubMed]
Figure 1.
Distribution of six typical lakes in Xinjiang NO.: GS(2019)3333.

Figure 2.
The quadratic models of lake area and lake water level (a) Ulungur Lake; (b) Manas Lake; (c) Bosten Lake; (d) Ayakkum Lake; (e) Aqqikkol Lake; (f) Aksayquin Lake.
Figure 2.
The quadratic models of lake area and lake water level (a) Ulungur Lake; (b) Manas Lake; (c) Bosten Lake; (d) Ayakkum Lake; (e) Aqqikkol Lake; (f) Aksayquin Lake.

Figure 3.
Annual water level changes (a) Ulungur Lake; (b) Manas Lake; (c) Bosten Lake; (d) Ayakkum Lake; (e) Aqqikkol Lake; (f) Aksayquin Lake.
Figure 3.
Annual water level changes (a) Ulungur Lake; (b) Manas Lake; (c) Bosten Lake; (d) Ayakkum Lake; (e) Aqqikkol Lake; (f) Aksayquin Lake.

Figure 4.
Variation of lake area from 2000 to 2020 (a) Ulungur Lake; (b) Manas Lake; (c) Bosten Lake; (d) Ayakkum Lake; (e) Aqqikkol Lake; (f) Aksayquin Lake.
Figure 4.
Variation of lake area from 2000 to 2020 (a) Ulungur Lake; (b) Manas Lake; (c) Bosten Lake; (d) Ayakkum Lake; (e) Aqqikkol Lake; (f) Aksayquin Lake.

Figure 5.
Annual variation of lake storages in 2000–2020 (a) Ulungur Lake; (b) Manas Lake; (c) Bosten Lake; (d) Ayakkum Lake; (e) Aqqikkol Lake; (f) Aksayquin Lake.
Figure 5.
Annual variation of lake storages in 2000–2020 (a) Ulungur Lake; (b) Manas Lake; (c) Bosten Lake; (d) Ayakkum Lake; (e) Aqqikkol Lake; (f) Aksayquin Lake.

Figure 6.
Statistical curve of the MK method test of accumulative lake storage changes (a) Ulungur Lake; (b) Bosten Lake.
Figure 6.
Statistical curve of the MK method test of accumulative lake storage changes (a) Ulungur Lake; (b) Bosten Lake.

Figure 7.
Variations in equivalent water mass on Xinjiang from GRACE satellite gravimetry.

Figure 8.
Precipitation of six lakes in Xinjiang from 2000 to 2020 (a) Ulungur Lake; (b) Manas Lake; (c) Bosten Lake; (d) Ayakkum Lake; (e) Aqqikkol Lake; (f) Aksayquin Lake.
Figure 8.
Precipitation of six lakes in Xinjiang from 2000 to 2020 (a) Ulungur Lake; (b) Manas Lake; (c) Bosten Lake; (d) Ayakkum Lake; (e) Aqqikkol Lake; (f) Aksayquin Lake.

Figure 9.
Temperature of six lakes in Xinjiang from 2000 to 2020 (a) Ulungur Lake; (b) Manas Lake; (c) Bosten Lake; (d) Ayakkum Lake; (e) Aqqikkol Lake; (f) Aksayquin Lake.
Figure 9.
Temperature of six lakes in Xinjiang from 2000 to 2020 (a) Ulungur Lake; (b) Manas Lake; (c) Bosten Lake; (d) Ayakkum Lake; (e) Aqqikkol Lake; (f) Aksayquin Lake.

Figure 10.
Water consumption of prefecture-level cities where six lakes are located.


Table 1.
List of six typical lakes and their main characteristics.
| Lake Name | Lon() Lat() | Elevation (m) | Area (km) | Mean Temperature () | Annual Precipitation (mm) | Replenishment Source | Lake Type |
|---|---|---|---|---|---|---|---|
| Ulungur | 87.2854 47.2568 | 478 | 854.89 | 3.4 | 116.5 | Ulungur river and Irtysh river | Plain freshwater lake |
| Manas | 85.9688 45.7981 | 244 | 263.88 | 8.8 | 63.7 | Manas river | Plain saltwater lake |
| Bosten | 86.7480 41.9688 | 1050 | 961.84 | 9 | 66 | Kaidu river | Transition freshwater lake |
| Ayakkum | 89.4271 37.5554 | 3876 | 616.34 | 0 | 100–200 | Ixakpatti river and Se Sikeya river | Plateau saltwater lake |
| Aqqikkol | 88.4063 37.0764 | 4251 | 354.71 | −1.5 | 150 | Aqqikkol river | Plateau saltwater lake |
| Aksayquin | 79.8229 35.2134 | 4844 | 165.96 | −8 | Less than 100 | Aksayquin river | Plateau saltwater lake |
Table 2.
The temporal span of observational water level data for six lakes.
| Lakes | Begin | End |
|---|---|---|
| Ulungur | 5 March 2000 | 28 December 2020 |
| Manas | 20 March 2016 | 12 December 2020 |
| Bosten | 1 October 2002 | 19 December 2020 |
| Ayakkum | 13 April 2000 | 19 December 2020 |
| Aqqikkol | 13 March 2016 | 30 December 2020 |
| Aksayquin | 28 October 2002 | 22 October 2014 |
Table 3.
Distribution of annual relative rates of change in the areas of six lakes.
| Lakes | ||||||
|---|---|---|---|---|---|---|
| Ulungur | 19 | 1 | ||||
| Manas | 8 | 3 | 1 | 2 | 6 | |
| Bosten | 7 | 8 | 5 | |||
| Ayakkum | 2 | 3 | 15 | |||
| Aqqikkol | 6 | 14 | ||||
| Aksayquin | 1 | 7 | 11 | 1 |
Table 4.
Z statistic of Mann–Kendall test of lake dynamics for six lakes from 2000 to 2020.
| Lakes | Area | Level | Accumulative Storage Changes |
|---|---|---|---|
| Ulungur | 3.96 *** | 3.05 *** | 3.02 *** |
| Manas | 1.90 ** | 0.09 | −1.01 |
| Bosten | −2.14 ** | −2.14 ** | −1.72 ** |
| Ayakkum | 6.13 *** | 5.95 *** | 5.87 *** |
| Aqqikkol | 6.31 *** | 6.31 *** | 6.13 *** |
| Aksayquin | 6.19 *** | 5.41*** | 5.35 *** |
** and *** represent significance at the level of 5% and 1% respectively.
Disclaimer/Publisher’s Note: The statements, opinions and data contained in all publications are solely those of the individual author(s) and contributor(s) and not of MDPI and/or the editor(s). MDPI and/or the editor(s) disclaim responsibility for any injury to people or property resulting from any ideas, methods, instructions or products referred to in the content. |
© 2023 by the authors. Licensee MDPI, Basel, Switzerland. This article is an open access article distributed under the terms and conditions of the Creative Commons Attribution (CC BY) license (https://creativecommons.org/licenses/by/4.0/).
Share and Cite
MDPI and ACS Style
Huang, Z.; Xu, J.; Zheng, L. Long-Term Change of Lake Water Storage and Its Response to Climate Change for Typical Lakes in Arid Xinjiang, China. Water 2023, 15, 1444. https://doi.org/10.3390/w15081444
AMA Style
Huang Z, Xu J, Zheng L. Long-Term Change of Lake Water Storage and Its Response to Climate Change for Typical Lakes in Arid Xinjiang, China. Water. 2023; 15(8):1444. https://doi.org/10.3390/w15081444
Chicago/Turabian StyleHuang, Zijin, Jianhua Xu, and Lilin Zheng. 2023. "Long-Term Change of Lake Water Storage and Its Response to Climate Change for Typical Lakes in Arid Xinjiang, China" Water 15, no. 8: 1444. https://doi.org/10.3390/w15081444
Note that from the first issue of 2016, this journal uses article numbers instead of page numbers. See further details here.