

Integrating Non-Targeted Ecosystem Services into Assessment of Natural Stormwater Treatment Systems
by
 and
and
Jennifer T. Le
1,*,†,
Jennifer P. Gonzalez
1,
Richard T. Carson
2,
Richard F. Ambrose
3 and
Lisa A. Levin
1 1
Center for Marine Biodiversity and Conservation, Scripps Institution of Oceanography, University of California San Diego, San Diego, CA 92093, USA
2
Department of Economics, University of California San Diego, San Diego, CA 92093, USA
3
Department of Environmental Health Sciences, University of California Los Angeles, Los Angeles, CA 90095, USA
*
Author to whom correspondence should be addressed.
†
Current Address: The Bureau of Ocean Energy Management, Sterling, VA 20166, USA.
Water 2023, 15(8), 1460; https://doi.org/10.3390/w15081460
Submission received: 9 February 2023
/
Revised: 31 March 2023
/
Accepted: 3 April 2023
/
Published: 8 April 2023
(This article belongs to the Special Issue Urban Runoff Control and Sponge City Construction II)
Abstract
:Natural stormwater treatment systems (NTS) are built ecosystems designed to capture and treat stormwater runoff via natural processes. Although NTS design typically targets water services, the biological communities associated with NTS (i.e., plants, animals, and microbes) can provide non-targeted functions that can result in ecosystem services, such as biodiversity, pollination, and climate regulation, or in some cases disservices. Additional co-benefits of NTS include recreation, education and outreach opportunities, and aesthetic value. A review of NTS ecosystem services and co-benefits is provided with specific examples from Los Angeles County, highlighting the need for ecosystem services indicators, standard measurements, and monitoring. As NTS become globally widespread, best practices must include the ability to holistically assess NTS performance in ways that extend beyond water treatment services. Three models are presented that can be used to evaluate NTS performance. Such information can be important in advancing NTS design, choosing spatial placement, and making choices between NTS and more traditional stormwater treatment options.
1. Introduction
Development and urbanization transform landscapes by replacing vegetation with impermeable surfaces. Subsequent precipitation events can lead to altered levels of water infiltration, modified water flows, and introduction of contaminants into stormwater runoff [1,2]. As a result, flooding and property damage, increased safety and health risks, and environmental damage can occur [3]. Urban planners and developers have traditionally addressed stormwater runoff issues by building drainage systems that connect directly to large bodies of water (e.g., streams, oceans) or treatment plants.
Natural stormwater treatment systems (NTS) are an alternative urban runoff management strategy [4]. NTS (also referred to as low-impact development or sustainable drainage systems) are human-made systems that use natural processes (e.g., gravity-driven hydrology, plant absorption of water and nutrients) to capture and treat urban runoff. We use the term NTS to encompass the different types of installations following current usage by collaborators [5,6]. They come in different forms: bioretention systems (e.g., biofilters, bioswales, rain gardens), infiltration basins and trenches, permeable pavements, dry wells and ponds, treatment wetlands, and combinations of these. They are part of a larger framework that now is often referred to as the sponge city [7]. The sponge city concept was developed in China to address urban water issues through “natural storage, natural infiltration, and natural purification” [8]. A sponge city seeks to retain rainwater, prevent flooding, and increase water quality through natural and semi-natural solutions [7,9]. The focus of this paper is on bioretention systems (i.e., biofilters) because they are explicitly intended to host biological communities as part of their design and less oriented toward hardscape infrastructure; however, they can offer numerous, often unrecognized benefits beyond the water services targeted in their initial design.
NTS can support diverse ecosystem services, defined as the direct and indirect benefits humans obtain from ecosystems [10,11] (Figure 1). Non-water (i.e., non-targeted) ecosystem services associated with NTS have long been acknowledged [5,12] and are only beginning to be meaningfully considered by spatial planning [13,14], engineering-based design, monitoring programs [15], and economic valuation efforts [16], which have been generally limited to targeted water functions. Ecosystem services described for other green spaces (e.g., parks, green roofs, urban forests) include offsetting carbon emissions [17,18], cooling local temperatures [19], cultural services (e.g., recreation, education and outreach, aesthetic value; [20]), and benefits to human health and well-being [21]. The incorporation of ecosystem services and other co-benefits into NTS design can present urban planners and developers with additional benefits, costs, and tradeoffs to consider [22,23].
We use Los Angeles County to focus this first comprehensive overview of NTS services because it hosts a dense human population near the coast where urban runoff has a large influence on local water quality [24], is in a Mediterranean climatic zone where periodic droughts are common, and expects to experience hydrological changes due to climate change [25]. Los Angeles County also has policy in place to encourage NTS infrastructure. California has passed several propositions to protect water supply and quality (e.g., AB-1471 2014). In 2004, Los Angeles passed Proposition O, which allowed the city to issue up to 500 million USD to fund projects that improve local water quality. In 2012, Los Angeles adopted its Low Impact Development Ordinance (RA-2012-0175) requiring development and redevelopment projects that alter impervious areas to mitigate runoff by capturing precipitation and utilizing natural resources where possible. A subsequent low impact development standards manual was published in 2014 [26]. As a result of these environmental conditions and political momentum, green infrastructure and NTS have been broadly distributed throughout Los Angeles County (Figure 2 [27]; https://www.arcgis.com/apps/dashboards/c41e288cd1cf4bf18b28404423c58735 (accessed on 31 January 2023)) and continue to be implemented. This study uses a small subset of Los Angeles NTS to illustrate potential ecosystem services.
This paper is a narrowly focused literature review on targeted and non-targeted ecosystem services associated with NTS using Los Angeles County to provide specific geographic context. As there is an existing wealth of literature on targeted water services [28], they are reviewed here in summary for presentation alongside non-targeted ecosystem services. No attempt is made to systematically review the larger literature that is growing rapidly and, at some point, will be able to support informative meta-analyses concerning specific structures and functions underlying NTS. However, there are elements of a semi-systematic review in its broad coverage of multidisciplinary research [29]. The present lack of quantitative hydrologic and ecological NTS information in the context we examine highlights the need for robust data collection. Measurement of ecosystem services and indicators is seen as the starting point. However, U.S. regulatory frameworks, specifically a series of Presidential executive orders [30], require cost–benefit assessment of different options so the translation from biophysical impacts to the monetary valuation comparisons policymakers need is emphasized. An ecosystem services framework can offer alternative design options that maximize overall NTS value and introduce areas of improvement for urban stormwater management [31].
2. Targeted Water Services
2.1. Stormwater Infiltration
NTS are designed to capture stormwater runoff for infiltration or reuse and have been shown to be effective [32], although methods to evaluate infiltration vary [33]. Most bioretention systems are oriented vertically, using gravity to direct water flow through several layers that generally consist of a ponding area with vegetation, porous filter media, and a drainage zone (Figure 3). Infiltration rates can vary widely depending on variables such as size [34], age [35], filter media [36,37], and other design factors [38]. For example, NTS with internal water storage or submerged zones can have elevated levels of infiltration, evapotranspiration, and nutrient removal (specifically denitrification) but may not be suitable for areas with impermeable soils [39]. Another example is an underdrain that can help ensure desired water retention times but can be prone to clogging [40]. Vegetation also plays a role by intercepting precipitation and water flows [41] and preventing clogging of filter media to maintain infiltration capacity [42,43]. Additionally, with proper design, evapotranspiration by plants can contribute significantly to reduced volumes of stormwater runoff [44,45].
Stormwater infiltration is important in urban areas with low permeable surface area that are prone to flooding and changes in groundwater recharge [3,46]. Los Angeles lacks the infrastructure to handle large volumes of stormwater [47], and flooding can occur with heavy rainfall resulting from atmospheric rivers. This issue is occurring in a region that experiences episodic drought [48], highlighting the need for proper stormwater management and use, which can include NTS as a strategy that provides additional benefits.
2.1.1. Flood Control
Flood risk is measured as a combination of hazard (e.g., runoff volume, base and peak flows, flood plain) and vulnerability (e.g., infrastructure, population density). Fluvial flooding is caused by overflow of river or lake systems, whereas pluvial flooding is caused by extreme or heavy rainfall. By altering landscapes and hydrology, urbanization can lead to an increased flood risk for both types [49]. NTS have been shown to significantly reduce runoff volume and the magnitude of high-flow events by capturing and storing stormwater runoff. Three bioretention cells in humid continental Ohio reduced both runoff by 45.6% on average and peaks flows ranging from 24 to 96%, performing best when peak flows occurred before the bulk of rainfall volume [50]. During the 13 months of observation, 140 storm events were recorded with antecedent dry periods ranging from 0.3 to 20 days and maximum peak flows of 105 L s−1 [50]. In humid subtropical North Carolina, 125 storm events were observed over 22 months with antecedent dry periods ranging from 0.3 to 31.3 days and maximum peak flows of approximately 38 L s−1 [51]. The study found that a Filterra™ system in an impervious parking lot captured 72% of runoff volume and reduced peak flows by 57% [51]. Hatt et al. (2009) found an average of 33% reduction in runoff volume, as well as an 80% reduction in peak flow reductions in three bioretention systems in Australia. Data were collected during 32 natural and simulated storm events with maximum peak flows of approximately 40 L s−1 and an average return interval of 3 months for simulated events [42]. In a more recent field study, Bonneau et al. (2020) reported a 35% reduction in stormwater volume and an 80% reduction in peak flow in a bioretention basin in Australia during rainfall events over 3 years, with average peak flows of approximately 33 L s−1 [52]. Relative to Australia, southern California generally has larger NTS built exclusively for groundwater recharge and longer dry periods that can decrease contaminant removal rates [53].
Most Los Angeles NTS exhibited visual indicators of flood control services: permeable surfaces that allow for water infiltration, graded landscaping to help direct runoff, and ponding areas designed to temporarily store water. For example, Elmer Avenue Green Street was constructed specifically to address street flooding during precipitation events by incorporating bioswales, biofilters, permeable pavements, and rain barrels [54]. However, additional data are needed to confirm whether they are effective. Spatially explicit measurements for flood hazard may be relevant (e.g., soil porosity, basin size, changes to magnitude and timing of flood peaks; [55]), as well as those for flood resilience (e.g., population and area exposed to changes in flood frequency; [56]). There may be a return period at which NTS infiltration rates and storage capacity can no longer provide flood control services, which likely depends on NTS characteristics such as size, filter media, and maintenance frequency [57]. Additionally, Los Angeles is expected to experience a sea level rise in some areas, which may make some types of NTS (e.g., treatment wetlands) that can serve as living shorelines more suitable than others [58].
The value of flood control has been studied in the context of wetlands [59], generally by assessing differences in property damage along a spectrum of wetland area (e.g., reduction in damages as proxied by replacement cost). Brander et al. (2006) conducted a meta-analysis to estimate the value of flood control by wetlands that resulted in a median of 20-30 USD (1995) per hectare annually [60]. Watson et al. (2016) estimated a net present value of less than 100 USD per hectare of wetland annually, which may be lower than comparable studies due to the small beneficiary population [61]. NTS generally operate on a more localized scale than major wetland restoration projects, so one unknown is how different NTS designs vary in their spatial extent of flood control.
2.1.2. Groundwater Recharge
Groundwater is used by more than half the U.S. population, and its recharge is an essential component of the water cycle [62]. Major sources of recharge in urban environments include runoff infiltration and leakages from the water supply and sewage systems [46]. Urbanization can decrease groundwater recharge due to the installation of impermeable surfaces [1]. However, the importation of large volumes of water to meet demand in highly populated urban areas can also lead to significant leakages and water recharge.
NTS can contribute to groundwater recharge by providing permeable surfaces and pore space in their filter media that allow stormwater runoff to pass into the soil subsurface. The Avalon Green Alley project in south Los Angeles is designed to allow water to percolate into the soil and recharge the water table [63]. Beneath the permeable pavement of the green alley, catch basins store stormwater temporarily, where it can be bioremediated before flowing into surrounding soil. Quantifying groundwater recharge can be challenging, but several methods exist to do so, such as physical measurements [64] and numerical modeling techniques [65].
The value of groundwater recharge can be calculated using various methods; the most appropriate is dependent on the end-use of the water. For example, in 2010, California withdrew 12,700 million gallons of groundwater per day, of which approximately 22.2% was used for domestic purposes [62]. The value of groundwater recharge can therefore be associated with the price of water to consumers. Replacement costs can also be used to assign a value to groundwater recharge. Artificial groundwater recharge is the spread of water on land to increase infiltration or the injection of water directly into the aquifer; its cost can provide an estimate of the value of groundwater recharge. These actions have associated costs and can be used to estimate a value for the same service performed by NTS.
2.2. Improved Water Quality
As stormwater runoff flows over urban surfaces, it can acquire contaminants such as polycyclic aromatic hydrocarbons (PAH), pesticides, pharmaceuticals, and other organic pollutants [66]. The “first flush” phenomenon is defined as elevated levels of stormwater pollution at the beginning of storm events [67,68]. First flush can be difficult to model because it is dependent on a variety of factors, such as climate, precipitation, catchment size, and land use type [68]. Southern California receives little precipitation and has long periods without rainfall, even during the “wet” season, which allows for the build-up of contaminants and results in first flush. These contaminants can then enter larger bodies of water (e.g., rivers, oceans) and degrade the local environment [69]. Many highly urban areas, such as Los Angeles, are coastal; this can exacerbate the issue of water quality because stormwater runoff can drain directly into the ocean with little opportunity (i.e., distance) for treatment. Treatment can depend on NTS water retention times, which are influenced by storage basin depth and type and amount of filter media [70]. Short retention times do not allow for adequate biofiltration, but long retention times can present hazards in the form of flood risk and mosquito reproduction [71], so there are tradeoffs to consider.
There is a range of common urban pollutants in stormwater runoff; these include heavy metals (e.g., PAH, Cd, Cu), total suspended solids and nutrients (mainly nitrogen and phosphorus), and pathogens. Müller et al. (2020) provides a comprehensive review of sources [72]. Heavy metals can persist in the environment and accumulate in sediment, plants, and animals, leading to the degradation of environmental and human health [73]. The input of excess nutrients and organics into streams, lakes, and the ocean (i.e., eutrophication) can be damaging to local ecosystems by generating harmful algal blooms, hypoxia, and anoxia [74]. Pathogens also pose a risk to human health through exposure (e.g., from recreation activities and stormwater reuse). Lim et al. (2015) found that captured stormwater can be used for toilet flushing with acceptable risk, but it does not meet required standards for showering and food-crop irrigation [75]. Beach closures and advisories are often the result of bacteria levels exceeding water quality standards [76]. In addition to the threat to human health, the resulting closures have associated economic costs, e.g., less use of parking lots, restaurants, and shopping [77].
NTS remove contaminants through several pathways. Physical filtration removes debris, particle-bound contaminants, and suspended solids, which can lead to clogging and subsequent deterioration of bioremediation functions. Informed NTS design, such as plant selection, can help maintain infiltration capacity [43]. Contaminant molecules can also be removed from runoff by adsorption (sticking of contaminant molecules onto porous surfaces with uneven or leftover attractive forces [78]) and assimilation (uptake of contaminants by plants; [79]). Adsorption can be enhanced with soil amendments, such as biochar; the type of amendment may depend on the targeted contaminant [78]. A significant portion of bioremediation is performed by soil microbial communities that can be stimulated by moisture [80]. In drought-prone areas such as southern California, extended dry conditions can decrease microbial abundance and activity, which can negatively impact enzyme activity and nutrient cycling [81]. Drought-resistant microbes can be introduced to NTS soil to help promote plant growth and continued phytoremediation under stressful conditions [82]. NTS can prevent contaminants from traveling further to pollute local bodies of water, but they can also concentrate pollutants in plants and filter media [83]. These concentrated contaminants can leach into surrounding soils, e.g., due to lower oxygen levels that increase metal solubility. As a result, some maintenance is likely required to prevent build up and transport of contaminants into the environment [28]. Maintenance costs, such as for plant or substrate renewal, can be uncertain [84] but potentially minimized through good design and regular inspection [85].
Contaminant removal may be the most well-studied service provided by NTS. Figure 4 shows examples of systems installed to remove debris and contaminants from runoff. Water infiltration systems can be installed into sidewalk tree wells to capture urban runoff before it can reach larger bodies of water. The Filterra™ system (Contech Engineered Solutions, West Chester, PA, USA) has been shown to effectively filter suspended solids, phosphorous, nitrogen, and zinc, with mean removal efficiency of 92%, 54%, 33%, and 66%, respectively [51]. The removal rates of heavy metals (copper, zinc, lead, and cadmium) by bioretention systems can be quite high (above 90%) [75], but not in all cases. Smolek et al. (2017) found that the Filterra™ system did not remove copper [51]. The type of filter media can influence the removal of metals, which accumulate in the top 5 cm of soil [75]. Heavy metal concentrations are unlikely to exceed soil quality standards for human health over the NTS lifetime [83]. However, ecological thresholds may be reached to varying extents. For example, Waara and Johansson (2022) measured concentrations of cadmium, copper, zinc, silver, and antimony that put aquatic organisms at risk in Swedish stormwater ponds [86]. In contrast, heavy metal concentrations in stormwater ponds in Denmark did not pose a risk to habitat function but were reflected in biomass so ecological risk could increase over time [87]. Sediment and nutrient removal by NTS have also been found to be relatively high (more than 50% in most cases) in several laboratory experiments [88,89]. However, at a watershed-level, NTS may be better suited for reducing contaminant load (the rate at which contaminants are discharged) into local waters rather than meeting concentration-based water quality standards [90]. Although these laboratory experiments provide a deep understanding of how NTS may function under specified conditions (e.g., dry vs. wet conditions, high vs. low temperatures), in situ studies are also needed to put laboratory experiments into context. How NTS operate over both long (e.g., months to seasons) and short (e.g., period of a storm) time scales are an open question, as is how the timing of water quality measurements (e.g., beginning or end of the storm, post-saturation) can influence perceived effectiveness.
There are many studies that estimate the value of improved water quality using a variety of methods, with the two most common being a production function approach and contingent valuation. A production function approach can value improved water quality by comparing the cost of alternative methods for contaminant removal, such as a stormwater treatment plant. This is the approach generally used by Stanford’s Natural Capital project [91] coupled with a measure of replacement cost. Several of their water-related modules of the InVEST workbench (i.e., urban flood risk mitigation, urban stormwater retention, water purification) can be useful starting points for examining the impacts of different NTS and can often accept location-specific parameter values [92,93,94,95]. Contingent valuation, including discrete choice experiments, asks a sample of respondents about their willingness to pay (WTP) for a spectrum of water quality [96,97]. The specific variant of a method is dependent on the fate of the stormwater and the final ecosystem service it provides, e.g., improved intake water quality for drinking water or improved water quality in lakes, rivers, and streams that can host higher levels of biodiversity.
3. Non-Targeted Ecosystem Services
NTS can provide a range of non-targeted ecosystem services, linked to their utilization of natural structures and functions, and other co-benefits [98,99]. Filter media and plant communities, which increase infiltration and remove contaminants, host biodiversity that contributes to ecological processes that can result in beneficial ecosystem services [6]. These ecosystem services (or costs, in the case of disservices) are not generally considered during the design and assessment of NTS. One unique feature of NTS is that they are human made so can be designed to provide specific benefits, which are discussed here to further expand design options that can enhance NTS value.
3.1. Biodiversity
Vegetated NTS act as man-made ecosystems that contain a diversity of plants, animals, and microbes from which ecosystem services can be generated [5,100] (Figure 5). They provide patches of habitat within an urban landscape and potentially act as corridors through which organisms can move. This can be important for population connectivity and resilience in a changing environment due to removal of natural habitat, habitat fragmentation, and climate change [101].
Whereas NTS biodiversity (here loosely defined to encompass plant, animal, and microbial species richness, abundance, and distribution) can be measured using a range of accepted methods (e.g., visual surveys, fauna collections, eDNA surveys), how this biodiversity translates into ecosystem services is more complex and will need targeted studies. There can be synergies between NTS design and landscape architecture, such as planning larger project areas [102], adaptive and flexible systems [103], and the redevelopment of un- or underutilized land [104,105]. Plants act as ecosystem engineers in bioretention systems, influencing both hydrological and ecological features and, therefore, plant selection can affect many of the services discussed in this paper [105]. Vegetation captures precipitation [41], undergoes evapotranspiration [44,45], maintains media porosity with roots, and assimilates pollutants [43]. Plants determine photosynthesis and respiration rates, organic matter in soil, and, ultimately, carbon sequestration and storage in NTS [106]. Additionally, plant communities influence microbial and infaunal communities, which subsequently impact function. Despite this, plant selection in NTS design typically emphases stress tolerance and competitiveness rather than specific factors influencing ecosystem services [107]. Microbial communities in NTS are most often assessed in the literature with respect to the harmful taxa present (e.g., fecal-indicator bacteria; [108]) or as functional groups (i.e., denitrification, greenhouse gas emissions). Fauna, except in wetland settings, are usually not considered in NTS design, despite their role in facilitating targeted functions and services. Mehring et al. (2016) identify common biofilter taxa, such as Megadrilacea (earthworms), Enchytraeidae (potworms), and Collembola (springtails) [109]. Earthworms are known to increase water infiltration via burrows [110], whereas springtails can impact plant growth and nutrient cycling [6]. As a result, these soil invertebrates can be considered ecosystem engineers that move and aerate soil, shaping the microbial, floral, and faunal communities from which more ecosystem services can stem. Because urban NTS can receive more water than native ecosystems, they can host elevated biodiversity of local soil invertebrates relative to natural habitats [111]. Higher biodiversity can be beneficial if they enhance service provision or detrimental if they involve invasive species that disrupt function. Wetland bird species contribute to local diversity and provide recreational services in the form of birdwatching. NTS also have the potential to provide bird habitat patches within an urban landscape [112].
Studies exist on the economic value of biodiversity in urban and engineered settings (e.g., constructed wetlands, agriculture) [113]. These employ the standard suite of non-market valuation techniques [114]: the production function approach, contingent valuation, travel cost analysis, and/or the hedonic property pricing methods to estimate society’s willingness to pay (WTP) for biodiversity and its conservation. The production function approach tends to be used when the NTS alters an input to some process such as sewage treatment so that it is possible to estimate the reduction in cost of that activity relative to the status quo without the NTS. Contingent valuation is a stated preference approach that is widely employed because it can largely emulate the other techniques by constructing the relevant market in a survey context. Travel cost analysis is heavily used when NTS influence the quantity or quality of outdoor recreation. This method is based on the notion that it costs time and money to travel to the recreational site. Variation in those costs acts like a market price influencing the amount of the recreational activity undertaken. Hedonic pricing tends to be used when an ecosystem service is incorporated in housing or land prices in a manner similar to school quality. The value of NTS biodiversity has not been assessed, but studies in urban ecosystems may be a useful starting point. For example, Dupras et al. (2014) estimated that urban forests in the Greater Montreal area in Canada host biodiversity that creates a value of CAD (2013) 2623 per hectare annually [115]. Biodiversity associated with other human-made ecosystems, such as agricultural land [116], may also be relevant.
3.2. Climate Regulation Related to Carbon
Carbon dioxide emissions are the largest contributor to anthropogenic climate change [117] and, as a result, climate-regulating services related to carbon (i.e., carbon sequestration and storage) have become increasingly important, especially in urban areas that contribute disproportionately to global emissions [118]. NTS plants have the potential to contribute to this effort by converting atmospheric carbon dioxide into biomass through photosynthesis. How long this carbon is subsequently stored is dependent on several factors. Although some carbon is quickly rereleased during respiration, some is stored as plant biomass and soil detrital compounds. Turnover rates vary with type of biomass, soil moisture, soil oxygenation, soil organic matter, and microbial communities [119,120]. Some bioretention systems contain saturated or submerged zones designed to create anaerobic conditions for denitrification [88,121] but may also help prevent microbial breakdown of organic matter.
Quantifying carbon sequestration and storage would necessitate measurements that include net carbon fluxes, soil and plant carbon density, and biomass turnover rates. This has been performed in urban green spaces and could also be performed in NTS. Nowak et al. (2013) estimated annual carbon sequestration in U.S. urban forests to be 25.6 million tons [122], which at 36 USD (2015) per ton of carbon [123], has a value of over 900 million USD (2015) annually. On smaller scales, green roofs have also been shown to sequester carbon and decrease carbon emissions due to lowered electricity usage for cooling [124,125]. NTS likely operate on scales more similar to green roofs than urban forests. The Stanford Natural Capital InVEST Workbench [91] has developed modules that allow for assessing carbon sequestration that may also be useful in specific contexts [126,127,128]. The monetary valuation of any carbon sequestered from the U.S. regulatory vantage point is driven by the standardized social cost per ton of carbon promulgated by the U.S. Environmental Protection Agency [129].
3.3. Micro-Climate Regulation
Micro-climate regulation is complex and highly dependent on geographic context. In addition to physically storing carbon, increased green space can reduce air and surface temperatures [19,130], reducing electricity use and emissions of greenhouse gases. The urban heat island effect occurs due to increased air temperature in urban settings relative to undeveloped areas as a result of replacing vegetation with pavement [131,132]. Pavements, such as asphalt and cement, have lower surface albedo than natural vegetation and therefore absorb more radiative energy. Non-vegetated surfaces also convert absorbed radiative energy into convective heat, which contributes to the urban heat island effect at higher rates than vegetation; these rates are dependent on the thermal properties of the material [133]. Evapotranspiration also contributes to plant regulation of micro-climates by increasing the amount of water in the air, i.e., humidity. In tropical contexts, increased humidity can counteract air cooling effects [134]. However, in arid southern California, the decrease in air temperature can be more important than the increased humidity in preventing heat impacts and mortality [135]. Additionally, vegetation can provide shade. Even small green spaces (e.g., green roofs) can have a significant impact on microclimate [19]. Factors that affect microclimate regulation include UV intensity, wind, and size of the green space.
The value of microclimate regulation by urban green space can, in many instances, be calculated using avoided costs methods, which can be seen here as a variant of the production function method. For example, if a green space makes an area cooler, people are likely not to run their air conditioning for as long or as intensively, in the same way as would be achieved by better insulation. The energy savings produced could be used to assign an economic value to the microclimate regulating services provided by the green space.
3.4. Pollination
Animal-mediated pollination is an important ecological process that supports many benefits. For example, bee pollination can increase agricultural crop quantity, food quality, and market value [136]. However, bee populations have been declining due to changing land use and management, pesticides, pollution, higher pathogen prevalence, and climate change [137]. Additionally, development and urbanization cause habitat fragmentation, which can lead to changes in species and functional diversity [138]. NTS can provide patches of habitat and refuge for animals within urban areas. Pollinators, such as bees and birds, can connect these habitat patches as they move among plants to feed and collect pollen (Figure 6). Increased suitable habitat and connectivity may facilitate the recovery of pollinator populations and create more resilient communities that can recover from disturbances, e.g., disease or long periods of intense drought [139]. Habitat patches have been shown to maintain distinct bee communities that, in aggregate, retain a significant amount of local species diversity [140].
Pollination services are typically seen as an input to the agricultural process, with improvements to pollination associated with increases in agricultural productivity [141]. They have also been evaluated in urban settings. For instance, Breeze et al. (2015) estimated the WTP for non-market pollination services in the United Kingdom using a contingent valuation survey deploying a discrete choice experiment [142]. Their estimates suggest taxpayers are willing to pay GBP 13.4 annually per person to maintain these benefits. Visual indicators for potential pollination services include the presence of animal-pollinators (e.g., bees, birds) as well as flowering plants. Quantification of this service requires data on the frequency of animal-to-flower visits as well as connectivity among NTS and other areas.
3.5. Other Co-Benefits
The following co-benefits have been separated from other ecosystem services because their provision does not directly employ ecological processes. However, biodiversity and ecological processes associated with NTS can enhance these co-benefits.
3.5.1. Recreation
NTS can have built-in public spaces that human communities can utilize. Walking trails, bike lanes, benches, and wildlife viewing sites can provide recreational services (Figure 7). The recreational use of urban green spaces can depend on amenities such as dog areas, playgrounds, barbeque areas, and landscaping [143]. Urban green spaces have been linked to improvements in physical and mental health [21,144,145]. They have also been linked to more active and healthy lifestyles overall [146]. In Los Angeles County, which is the most populous county in California [147], these types of spaces can be important in the midst of a densely populated, heavily urbanized area. The travel cost method is most often used to calculate the value of recreational services [148] but may not be appropriate for hyper-local neighborhood amenities if there is little to no cost associated with access. Contingent valuation and hedonic pricing have also been employed [149]. Sociocultural and socioeconomic characteristics may play a role: people of color and lower-income communities utilize urban green spaces at lower rates than other groups [150,151]. In Porto, Portugal, Graça et al. (2018) found that lower socioeconomic areas have the most green space, but they are unlikely to be developed in ways that provide services to the community [152]. This suggests the possibility that poorer communities can be served by NTS that enhance existing green spaces in a way that make them more accessible.
3.5.2. Education and Outreach
NTS present an opportunity for education and public outreach regarding stormwater issues, pollution, watershed and urban ecology, urban planning and management, and climate change. For example, Ocean View Growing Grounds (OVGG, San Diego, CA, USA) is a community garden within a food desert (defined as an area that lacks access to fresh produce and whole foods (often in low socioeconomic areas)) that utilizes bioswales to prevent flooding. UC San Diego researchers have partnered with community leaders to host outreach events about hydrology, soil, and urban ecology. Greater understanding and awareness of NTS and the services they provide may lead to safer gardening practices and more efficient water use. In Los Angeles, many of the sites have educational information posted about the project, their goals, and their motivations (Figure 8). As part of the Elmer Avenue Green Street project, local residents participated in the planning and design processes, actively engaging in stormwater issues and how to address them.
3.5.3. Aesthetic Value and Other Non-Use Values
Aesthetic value has been attributed to urban green spaces [153], which can increase surrounding property value [154]. NTS may provide similar services to enhance visual, auditory, and olfactory environmental features that have been linked to human well-being [155,156]. Green roofs and walls can dampen road traffic noise by up to 7.5 dBA [157]. Urban green spaces provide habitat for “natural” sounds (e.g., birds), which are preferred over traffic noises [158]. Exposure to green spaces has also been associated with better cognitive development [159] and reduced physiological stress [158].
3.6. Disservices and Unanticipated Costs
NTS can potentially introduce undesired services, such as installation of unattractive elements, accumulation of pollutants, and proliferation of disease vectors. The aesthetics of NTS may not be favorable to all people, especially when they are not regularly maintained. Regular maintenance can not only help plant survival but also prevent build-up of debris and pollutants, which NTS are designed to intercept. Heavy metals can leach into surrounding soil and groundwater [42,160]. It is also possible that NTS, despite having vegetation, can be sites of net greenhouse gas emissions (carbon dioxide and methane) rather than carbon sinks [161]. Ponding areas, which allow microbial communities to remove contaminants, can also provide habitat for mosquitoes that pose health hazards in the form of infectious diseases and allergies. For example, two Los Angeles NTS sites had advisories about West Nile virus and its carriers (August 2016). Vegetation and soil media can also provide habitat for urban pests, such as rodents and ticks [162].
Increases in urban green space have been linked to decreases in violent crime [163]; however, the potential of urban parks to help foster various types of crime is well known. An account of assault was cited in the South Los Angeles Wetland Park (http://abc7.com/news/arrest-made-in-connection-to-sex-assault-attempts-in-south-la-park/1297020/ (accessed on 31 January 2023)). These issues can generally be avoided at some cost, whether it is more frequent monitoring, improved lighting, or increased maintenance. The main warning here is that whereas these costs are not usually prohibitively expensive, they do need to be considered during planning and budgeting processes.
4. Potential Quantitative Models to Assess Ecosystem Services Performance in Natural Stormwater Treatment Systems
One approach to better internalize ecosystem services associated with NTS into decision making is to (1) determine the quantity or rate at which the ecosystem service is provided (i.e., biophysical value) and (2) determine the value (whether economic or not) of that quantity or rate. Although non-targeted ecosystem services are acknowledged [12], field studies that quantify these services are still lacking [164]. Here, we highlight three potential models for ecosystem services performance assessment in NTS that can be used as a starting point and improved upon as more data become available.
Benefit transfer approaches use regression models, often built on meta-analyses, to provide an estimate of the dependent variable (i.e., the rate or value of an ecosystem service). Examples of potential explanatory variables include study site size, geographic location, scale of the study (e.g., local, regional, national, global), gross domestic product per capita, valuation method, and sample size. These preliminary estimates can then be used further, such as in cost–benefit analysis, because primary studies are not always feasible.
Stochastic frontier analysis (SFA) and data envelopment analysis (DEA) are production function modelling techniques that create a “best practice frontier” as a benchmark of efficiency [165,166]. This benchmark is generated using input and output data from multiple sources (e.g., firms, projects, NTS), creating one scenario (normalized to be the best practice frontier) against which the efficiency for other scenarios can be compared and evaluated. Thus, these approaches provide a measure of how efficient a particular NTS is at providing an ecosystem service relative to a benchmark and by extension to competing NTS configurations. SFA includes a stochastic error term that may make it suitable for urban systems that are subject to environmental variation, e.g., drought and precipitation events. However, SFA requires an a priori assumption regarding the production function form, i.e., the mathematical relationship between inputs and outputs (e.g., Cobb–Douglas, Leontief), which can have a substantive influence on results if it does not provide a reasonably good approximation to the actual production function.
DEA is a nonparametric approach that does not require prior knowledge of the production function form but has the weakness that it does not formally accommodate idiosyncratic random shocks. DEA handles multiple outputs better than SFA, which may make it more appropriate for NTS-associated ecosystem services. A recent comparison of DEA and SFA for rice production is contained in [167].
The benefit transfer approaches, SFA, and DEA results can be used to evaluate how well an NTS site is performing and may help point to how to improve its functioning. Table 1 provides a characterization of benefit transfer, DEA, and SFA from the perspective of NTS ecosystem services.
We would like to have been able to directly compare results from an SFA and DEA analysis for our Los Angeles sites. This cannot be easily performed due to the lack of readily available data. There are no standard data collection or monitoring programs for Los Angeles NTS. This makes it difficult to compare across time and across sites, and to date the authors know of no monitoring of ecosystem services associated with NTS. More intensive monitoring and a standardized set of protocols for reporting such data could help identify transparent and effective management strategies [169], e.g., timing of maintenance, and improve the above quantitative models for more accurate estimates of value and efficiency. In situ, mesocosm studies are also needed to evaluate NTS performance under actual environmental conditions [79]. Other questions that still need to be addressed include how networks of NTS compare with single systems regarding both targeted and non-targeted ecosystem services and how NTS operate over time.
Nonmonetary valuation approaches may be required for some ecosystem services, such as cultural ones that are difficult or inappropriate to assign a monetary value. For example, a deliberative mapping survey was used to assess the local perception of and assign a social value to landscape services provided by the Mekong Delta in Vietnam [170]. Other non-monetary valuation approaches include interviews, oral histories, scaling (e.g., “very good” through “very bad”, numerical 1–10), and ranking options into an order [171]. Another alternative to monetary valuation is the use of benefit-relevant indicators that link ecological responses to management decisions and human well-being [172]. These indicators can support environmental decision making both on their own and as a step towards valuation [172].
5. Conclusions
Because NTS, such as bioretention systems and treatment wetlands, rely on natural structures and functions, they provide built ecosystems that can support a host of targeted and non-targeted benefits. A lack of standardized monitoring data and programs makes it difficult to assess whether these systems are generating the services they are built to provide as well as any potential co-benefits. The proposed ecosystem service measurements and indicators presented above are a first step towards quantification, verification of their utility, and identification of design improvements. Although there are few data on the quantification of these NTS benefits specifically, examples from relevant systems can be used to get an idea of how these processes may work and on what scale. There also exist many valuation techniques that can be employed to assign a value to these ecosystem services for incorporation into urban design and management given the widespread use of cost–benefit analyses in decision making. Most NTS are implemented to meet water quality regulations and, although expensive, some of these costs may be offset by the value of non-targeted ecosystem services provided. However, long-term monitoring is necessary to assess whether the benefits of non-targeted services actually accrue, and research is needed to determine how to optimize their collective performance. Better understanding the co-benefits provided could also garner support for the use of NTS from local governing bodies and the public. In places such as southern California, where water issues are in sharp focus in policy debates, effective management of stormwater runoff can reduce flooding and enhance the water supply while improving microclimate, wildlife habitat, biodiversity, pollination, recreation, education, or other valuable services. Consideration of non-targeted ecosystem services by NTS can provide one tool to help urban planners, community groups, and developers make better decisions.
Author Contributions
Conceptualization, L.A.L., R.F.A., R.T.C. and J.T.L.; field investigation, J.P.G., J.T.L. and L.A.L.; writing—original draft preparation, J.T.L. and J.P.G.; writing—review and editing, J.T.L., L.A.L., R.T.C. and R.F.A.; funding acquisition, L.A.L., R.T.C. and R.F.A. All authors have read and agreed to the published version of the manuscript.
Funding
This work was supported by the University of Southern California Sea Grant [grant numbers USC NOAA 61207781, USC NOAA 75199714] and the University of California Office of the President [grant number UCOP MRP-17-455083].
Data Availability Statement
No new data were created or analyzed in this study. Data sharing is not applicable to this article.
Acknowledgments
The authors would like to thank Dale Squires and Andrew Mehring for insightful comments and suggestions, Jessica Aceret for illustrations, Brandon Winfrey for field site access, and Katie Galloway and Laura Walsh for field assistance. We thank the editors and two anonymous reviewers for their thoughts and insight and alerting us to new references.
Conflicts of Interest
The authors declare no conflict of interest.
References
- Walsh, C.J.; Roy, A.H.; Feminella, J.W.; Cottingham, P.D.; Groffman, P.M.; Morgan, R.P., II. The Urban Stream Syndrome: Current Knowledge and the Search for a Cure. J. N. Am. Benthol. Soc. 2005, 24, 706–723. [Google Scholar] [CrossRef]
- McGrane, S.J. Impacts of Urbanisation on Hydrological and Water Quality Dynamics, and Urban Water Management: A Review. Hydrol. Sci. J. 2016, 61, 2295–2311. [Google Scholar] [CrossRef] [Green Version]
- Hossain, M.K.; Meng, Q. A Fine-Scale Spatial Analytics of the Assessment and Mapping of Buildings and Population at Different Risk Levels of Urban Flood. Land Use Policy 2020, 99, 104829. [Google Scholar] [CrossRef]
- Wendling, L.A.; Holt, E.E. Integrating Engineered and Nature-Based Solutions for Urban Stormwater Management. In Women in Water Quality. Women in Engineering and Science; O’Bannon, D., Ed.; Springer: Berlin/Heidelberg, Germany, 2020. [Google Scholar]
- Rippy, M.A.; Pierce, G.; Feldman, D.; Winfrey, B.; Mehring, A.S.; Holden, P.A.; Ambrose, R.; Levin, L.A. Perceived Services and Disservices of Natural Treatment Systems for Urban Stormwater: Insight from the next Generation of Designers. People Nat. 2022, 4, 481–504. [Google Scholar] [CrossRef]
- Mehring, A.S.; Levin, L.A. Potential Roles of Soil Fauna in Improving the Efficiency of Rain Gardens Used as Natural Stormwater Treatment Systems. J. Appl. Ecol. 2015, 52, 1445–1454. [Google Scholar] [CrossRef]
- Hamidi, A.; Ramayandi, B.; Sorial, G. Sponge City-An Emerging Concept in Sustainable Water Resource Management: A Scientometric Analysis. Resour. Environ. Sustain. 2021, 1, 100028. [Google Scholar] [CrossRef]
- Yin, D.; Xu, C.; Jia, H.; Yang, Y.; Sun, C.; Wang, Q.; Liu, S. From Pilot Exploration to Systemic Demonstration. Water 2022, 14, 1531. [Google Scholar] [CrossRef]
- Li, H.; Ding, L.; Ren, M.; Li, C.; Wang, H. Sponge City Construction in China: A Survey of the Challenges and Opportunities. Water 2017, 9, 594. [Google Scholar] [CrossRef] [Green Version]
- Millennium Ecosystem Assessment. In Ecosystems and Human Well-Being: Synthesis; Island Press: Washington, DC, USA, 2005; ISBN 1597260401.
- Haines-Young, R.; Potschin, M. CICES V5. 1. Guidance on the Application of the Revised Structure; Fabis Consulting Ltd.: Nottingham, UK, 2018. [Google Scholar]
- U.S. Environmental Protection Agency. Benefits of Low Impact Development: How LID Can Protect Your Community’s Resources; U.S. Environmental Protection Agency: Washington, DC, USA, 2012.
- Liu, Z.; Yang, Y.; Hou, J.; Jia, H. Decision-Making Framework for GI Layout Considering Site Suitability and Weighted Multi-Function Effectiveness: A Case Study in Beijing Sub-Center. Water 2022, 14, 1765. [Google Scholar] [CrossRef]
- Jia, H.; Liu, Z.; Xu, C.; Chen, Z.; Zhang, X.; Xia, J.; Yu, S.L. Adaptive Pressure-Driven Multi-Criteria Spatial Decision-Making for a Targeted Placement of Green and Grey Runoff Control Infrastructures. Water Res. 2022, 212, 118126. [Google Scholar] [CrossRef]
- Chen, Y.; Wang, Y.; Liew, J.H.; Wang, P.L. Development of a Methodological Framework for Evaluating Biodiversity of Built Urban Green Infrastructures by Practitioners. J. Clean. Prod. 2021, 303, 127009. [Google Scholar] [CrossRef]
- Jia, H.; Yao, H.; Tang, Y.; Yu, S.L.; Zhen, J.X.; Lu, Y. Development of a Multi-Criteria Index Ranking System for Urban Runoff Best Management Practices (BMPs) Selection. Environ. Monit. Assess. 2013, 185, 7915–7933. [Google Scholar] [CrossRef] [PubMed]
- Kavehei, E.; Jenkins, G.A.; Lemckert, C.; Adame, M.F. Carbon Stocks and Sequestration of Stormwater Bioretention/Biofiltration Basins. Ecol. Eng. 2019, 138, 227–236. [Google Scholar] [CrossRef]
- Shafique, M.; Xue, X.; Luo, X. An Overview of Carbon Sequestration of Green Roofs in Urban Areas. Urban For. Urban Green. 2020, 47, 126515. [Google Scholar] [CrossRef]
- Erlwein, S.; Zölch, T.; Pauleit, S. Regulating the Microclimate with Urban Green in Densifiying Cities: Joint Assessment on Two Scales. Build. Environ. 2021, 205, 108233. [Google Scholar] [CrossRef]
- Dickinson, D.C.; Hobbs, R.J. Cultural Ecosystem Services: Characteristics, Challenges and Lessons for Urban Green Space Research. Ecosyst. Serv. 2017, 25, 179–194. [Google Scholar] [CrossRef]
- Houlden, V.; Weich, S.; Jarvis, S.; Rees, K. The Relationship between Greenspace and the Mental Wellbeing of Adults: A Systematic Review. PloS ONE 2018, 13, e0203000. [Google Scholar] [CrossRef] [Green Version]
- BenDor, T.K.; Shandas, V.; Miles, B.; Belt, K.; Olander, L. Ecosystem Services and U.S. Stormwater Planning: An Approach for Improving Urban Stormwater Decisions. Environ. Sci. Policy 2018, 88, 92–103. [Google Scholar] [CrossRef] [Green Version]
- Elliot, R.; Motzny, A.; Majd, S.; Chavez, F.; Laimer, D.; Orlove, B.; Culligan, P. Identifying Linkages between Urban Green Infrastructure and Ecosystem Services Using an Expert Opinion Methodology. Ambio 2020, 49, 569–583. [Google Scholar] [CrossRef]
- Kessouri, F.; McWilliams, J.C.; Bianchi, D.; Sutula, M.; Renault, L.; Deutsch, C.; Feely, R.A.; McLaughlin, K.; Ho, M.; Howard, E.M.; et al. Coastal Eutrophication Drives Acidification, Oxygen Loss, and Ecosystem Change in a Major Oceanic Upwelling System. Proc. Natl. Acad. Sci. USA 2021, 118, 1–8. [Google Scholar] [CrossRef]
- Huang, X.; Swain, D.L. Climate Change Is Increasing the Risk of a California Megaflood. Sci. Adv. 2022, 8, 1–14. [Google Scholar] [CrossRef] [PubMed]
- County of Los Angeles Department of Public Works. Low Impact Development Standards Manual. 2014. Available online: https://dpw.lacounty.gov/ldd/lddservices/docs/Low_Impact_Development_Standards_Manual.pdf (accessed on 31 January 2023).
- Levin, L.; Le, J.; Gonzalez, J.; Ambrose, R. Biofilter Catalog and Database for the Los Angeles Region. 2017. Available online: https://dornsife.usc.edu/assets/sites/291/docs/Publications/Levin_et_al._2017_Biofilter_Report.pdf (accessed on 31 January 2023).
- Yang, F.; Fu, D.; Zevenbergen, C.; Rene, E.R. A Comprehensive Review on the Long-Term Performance of Stormwater Biofiltration Systems (SBS): Operational Challenges and Future Directions. J. Environ. Manag. 2022, 302, 113956. [Google Scholar] [CrossRef]
- Snyder, H. Literature Review as a Research Methodology: An Overview and Guidelines. J. Bus. Res. 2019, 104, 333–339. [Google Scholar] [CrossRef]
- Dudley, S.; Mannix, B. Improving Regulatory Benefit-Cost Analysis. J. Law Polit. 2018, 34, 1. [Google Scholar]
- Caro, C.; Marques, J.C.; Cunha, P.P.; Teixeira, Z. Ecosystem Services as a Resilience Descriptor in Habitat Risk Assessment Using the InVEST Model. Ecol. Indic. 2020, 115, 106426. [Google Scholar] [CrossRef]
- Tirpak, R.A.; Afrooz, A.N.; Winston, R.J.; Valenca, R.; Schiff, K.; Mohanty, S.K. Conventional and Amended Bioretention Soil Media for Targeted Pollutant Treatment: A Critical Review to Guide the State of the Practice. Water Res. 2021, 189, 116648. [Google Scholar] [CrossRef]
- Rammal, M.; Berthier, E. Runoff Losses on Urban Surfaces during Frequent Rainfall Events: A Review of Observations and Modeling Attempts. Water 2020, 12, 2777. [Google Scholar] [CrossRef]
- Berretta, C.; Aiello, A.; Jensen, H.S.; Al, E. Influenc of Design and Media Amendments on the Performance of Stormwater Biofilters. Proc. ICE-Water Manag. 2018, 171, 87–98. [Google Scholar]
- Le Coustumer, S.; Fletcher, T.D.; Deletic, A.; Barraud, S.; Poelsma, P. The Influence of Design Parameters on Clogging of Stormwater Biofilters: A Large-Scale Column Study. Water Res. 2012, 46, 6743–6752. [Google Scholar] [CrossRef]
- Sileshi, R.; Pitt, R.E.; Clark, S.E. Statistical Analyses of Flow Rates of Stormwater Treatment Bioretention Media. Water Environ. Res. 2019, 91, 877–887. [Google Scholar] [CrossRef]
- Skorobogatov, A.; He, J.; Chu, A.; Valeo, C.; van Duin, B. The Impact of Media, Plants and Their Interactions on Bioretention Performance: A Review. Sci. Total Environ. 2020, 715, 136918. [Google Scholar] [CrossRef] [PubMed]
- Askarizadeh, A.; Rippy, M.A.; Fletcher, T.D.; Feldman, D.L.; Peng, J.; Bowler, P.; Mehring, A.S.; Winfrey, B.K.; Vrugt, J.A.; Aghakouchak, A.; et al. From Rain Tanks to Catchments: Use of Low-Impact Development To Address Hydrologic Symptoms of the Urban Stream Syndrome. Environ. Sci. Technol. 2015, 49, 11264–11280. [Google Scholar] [CrossRef] [PubMed] [Green Version]
- Minnesota Pollution Control Agency. MPCA Bioretention Terminology. Minnesota Stormwater Man. 2015, 1–9. Available online: https://stormwater.pca.state.mn.us/index.php?title=Main_Page (accessed on 31 January 2023).
- Bouwer, H. Artificial Recharge of Groundwater: Hydrogeology and Engineering. Hydrogeol. J. 2002, 10, 121–142. [Google Scholar] [CrossRef] [Green Version]
- Berland, A.; Shiflett, S.A.; Shuster, W.D.; Garmestani, A.S.; Goddard, H.C.; Herrmann, D.L.; Hopton, M.E. The Role of Trees in Urban Stormwater Management. Landsc. Urban Plan. 2017, 162, 167–177. [Google Scholar] [CrossRef] [Green Version]
- Hatt, B.E.; Fletcher, T.D.; Deletic, A. Hydrologic and Pollutant Removal Performance of Stormwater Biofiltration Systems at the Field Scale. J. Hydrol. 2009, 365, 310–321. [Google Scholar] [CrossRef]
- Payne, E.G.I.; Pham, T.; Deletic, A.; Hatt, B.E.; Cook, P.L.M.; Fletcher, T.D. Which Species? A Decision-Support Tool to Guide Plant Selection in Stormwater Bio Fi Lters. Adv. Water Resour. 2018, 113, 86–99. [Google Scholar] [CrossRef]
- Sharkey, L.J. The Performance of Bioretention Areas in North Caroline: A Study of Water Quality, Water Quantity, and Soil Media; North Caroline State University: Raleigh, NC, USA, 2006. [Google Scholar]
- Thom, J.K.; Szota, C.; Coutts, A.M.; Fletcher, T.D.; Livesley, S.J. Transpiration by Established Trees Could Increase the Efficiency of Stormwater Control Measures. Water Res. 2020, 173, 115597. [Google Scholar] [CrossRef]
- Minnig, M.; Moeck, C.; Radny, D.; Schirmer, M. Impact of Urbanization on Groundwater Recharge Rates in Dübendorf, Switzerland. J. Hydrol. 2018, 563, 1135–1146. [Google Scholar] [CrossRef] [Green Version]
- Sheng, J.; Wilson, J.P. Watershed Urbanization and Changing Flood Behavior across the Los Angeles Metropolitan Region. Nat. Hazards 2009, 48, 41–57. [Google Scholar] [CrossRef]
- Seager, R.; Ting, M.; Li, C.; Naik, N.; Cook, B.; Nakamura, J.; Liu, H. Projections of Declining Surface-Water Availability for the Southwestern United States. Nat. Clim. Chang. 2013, 3, 482–486. [Google Scholar] [CrossRef] [Green Version]
- Park, K.; Lee, M.H. The Development and Application of the Urban Flood Risk Assessment Model for Reflecting upon Urban Planning Elements. Water 2019, 11, 920. [Google Scholar] [CrossRef] [Green Version]
- Winston, R.J.; Dorsey, J.D.; Hunt, W.F. Quantifying Volume Reduction and Peak Flow Mitigation for Three Bioretention Cells in Clay Soils in Northeast Ohio. Sci. Total Environ. 2016, 553, 83–95. [Google Scholar] [CrossRef] [PubMed]
- Smolek, A.P.; Anderson, A.R.; Hunt, W.F. Hydrologic and Water-Quality Evaluation of a Rapid-Flow Biofiltration Device. J. Environ. Eng. 2018, 144, 1–13. [Google Scholar] [CrossRef]
- Bonneau, J.; Fletcher, T.D.; Costelloe, J.F.; Poelsma, P.J.; James, R.B.; Burns, M.J. The Hydrologic, Water Quality and Flow Regime Performance of a Bioretention Basin in Melbourne, Australia. Urban Water J. 2020, 17, 303–314. [Google Scholar] [CrossRef]
- Ambrose, R.F.; Winfrey, B.K. Comparison of Stormwater Biofiltration Systems in Southeast Australia and Southern California. WIREs Water 2015, 2, 131–146. [Google Scholar] [CrossRef] [Green Version]
- Belden, E.; Antos, M.; Kristy, M.; Steele, N.L.C. Sustainable Infrastructure: The Elmer Avenue Neighborhood Retrofit. 2012. Available online: https://urbancoast.org/wp-content/uploads/2014/10/V3_13_EdwardBelden.pdf (accessed on 31 January 2023).
- Quinn, N.; Bates, P.D.; Neal, J.; Smith, A.; Wing, O.; Sampson, C.; Smith, J.; Heffernan, J. The Spatial Dependence of Flood Hazard and Risk in the United States. Water Resour. Res. 2019, 55, 1890–1911. [Google Scholar] [CrossRef] [Green Version]
- Nofal, O.M.; van de Lindt, J.W. Understanding Flood Risk in the Context of Community Resilience Modeling for the Built Environment: Research Needs and Trends. Sustain. Resilient Infrastruct. 2022, 7, 171–187. [Google Scholar] [CrossRef]
- Qin, Y. Urban Flooding Mitigation Techniques: A Systematic Review and Future Studies. Water 2020, 12, 3579. [Google Scholar] [CrossRef]
- Aerts, J.C.J.H.; Barnard, P.L.; Botzen, W.; Grifman, P.; Hart, J.F.; De Moel, H.; Mann, A.N.; de Ruig, L.T.; Sadrpour, N. Pathways to Resilience: Adapting to Sea Level Rise in Los Angeles. Ann. N. Y. Acad. Sci. 2018, 1427, 1–90. [Google Scholar] [CrossRef] [Green Version]
- Barbier, E.B. The Value of Coastal Wetland Ecosystem Services; Elsevier: Amsterdam, The Netherlands, 2018; ISBN 9780444638939. [Google Scholar]
- Brander, L.M.; Van Beukering, P.; Cesar, H.S.J. The Recreational Value of Coral Reefs: A Meta-Analysis. Ecol. Econ. 2007, 63, 209–218. [Google Scholar] [CrossRef] [Green Version]
- Watson, K.B.; Ricketts, T.; Galford, G.; Polasky, S.; O’Niel-Dunne, J. Quantifying Flood Mitigation Services: The Economic Value of Otter Creek Wetlands and Floodplains to Middlebury, VT. Ecol. Econ. 2016, 130, 16–24. [Google Scholar] [CrossRef] [Green Version]
- Maupin, M.A.; Kenny, J.F.; Hutson, S.S.; Lovelace, J.K.; Barber, N.L.; Linsey, K.S. Estimated Use of Water in the United States in 2010. 2014; U.S. Geological Survey Circular 1405. Available online: https://pubs.usgs.gov/circ/1405/pdf/circ1405.pdf (accessed on 31 January 2023).
- Lindt, R.; Callahan, C.; DeShazo, J.R.; Bieber, E. Lessons Learned from Previous Projects for Green Alley Development in Los Angeles & Beyond. LA, USA. 2014. Available online: https://www.tpl.org/wp-content/uploads/2015/05/ca-green-alley-avalon-green-alleys-demo-project.pdf (accessed on 31 January 2023).
- Kazmierczak, J.; Muller, S.; Nilsson, B.; Postma, D.; Czejak, J.; Sebok, E.; Jessen, S.; Karan, S.; Stenvig Jensen, C.; Edelvang, K.; et al. Groundwater Flow and Heterogeneous Discharge into a Seepage Lake: Combined Use of Physical Methods and Hydrochemical Tracers. Water Resour. Res. 2016, 52, 9109–9130. [Google Scholar] [CrossRef]
- Reitz, M.; Sanford, W.E.; Senay, G.B.; Cazenas, J. Annual Estimates of Recharge, Quick-Flow Runoff, and Evapotranspiration for the Contiguous U.S. Using Empirical Regression Equations. J. Am. Water Resour. Assoc. 2017, 53, 961–983. [Google Scholar] [CrossRef]
- Masoner, J.R.; Kolpin, D.W.; Cozzarelli, I.M.; Barber, L.B.; Burden, D.S.; Foreman, W.T.; Forshay, K.J.; Furlong, E.T.; Groves, J.F.; Hladik, M.L.; et al. Urban Stormwater: An Overlooked Pathway of Extensive Mixed Contaminants to Surface and Groundwaters in the United States. Environ. Sci. Technol. 2019, 53, 10070–10081. [Google Scholar] [CrossRef] [PubMed] [Green Version]
- Deletic, A. The First Flush Load of Urban Surface Runoff. Water Res. 1998, 32, 2462–2470. [Google Scholar] [CrossRef]
- Maniquiz-Redillas, M.; Robles, M.E.; Cruz, G.; Reyes, N.J.; Kim, L.H. First Flush Stormwater Runoff in Urban Catchments: A Bibliometric and Comprehensive Review. Hydrology 2022, 9, 63. [Google Scholar] [CrossRef]
- Fanelli, R.M.; Prestegaard, K.L.; Palmer, M.A. Urban Legacies: Aquatic Stressors and Low Aquatic Biodiversity Persist despite Implementation of Regenerative Stormwater Conveyance Systems. Freshw. Sci. 2019, 38, 818–833. [Google Scholar] [CrossRef]
- Guo, J.C.Y.; Luu, T.M. Operation of Cap Orifice in a Rain Garden. J. Hydrol. Eng. 2015, 20, 1–6. [Google Scholar] [CrossRef]
- Hunt, W.F.; Greenway, M.; Moore, T.C.; Brown, R.A.; Kennedy, S.G.; Line, D.E.; Lord, W.G. Constructed Storm-Water Wetland Installation and Maintenance: Are We Getting It Right? J. Irrig. Drain. Eng. 2011, 137, 469–474. [Google Scholar] [CrossRef]
- Müller, A.; Österlund, H.; Marsalek, J.; Viklander, M. The Pollution Conveyed by Urban Runoff: A Review of Sources. Sci. Total Environ. 2020, 709, 136125. [Google Scholar] [CrossRef] [PubMed]
- Kumar, M.; Gogoi, A.; Kumari, D.; Borah, R. Review of Perspective, Problems, Challenges, and Future Scenario of Metal Contamination in the Urban Environment. J. Hazard. Toxic Radioact. Waste 2017, 21, 290–307. [Google Scholar] [CrossRef]
- Hallett, C.S.; Valesini, F.J.; Clarke, K.R.; Hoeksema, S.D. Effects of a Harmful Algal Bloom on the Community Ecology, Movements and Spatial Distributions of Fishes in a Microtidal Estuary. Hydrobiologia 2016, 763, 267–284. [Google Scholar] [CrossRef]
- Lim, H.S.; Lim, W.; Hu, J.Y.; Ziegler, A.; Ong, S.L. Comparison of Filter Media Materials for Heavy Metal Removal from Urban Stormwater Runoff Using Biofiltration Systems. J. Environ. Manag. 2015, 147, 24–33. [Google Scholar] [CrossRef] [PubMed]
- Searcy, R.T.; Boehm, A.B. A Day at the Beach: Enabling Coastal Water Quality Prediction with High-Frequency Sampling and Data-Driven Models. Environ. Sci. Technol. 2021, 55, 1908–1918. [Google Scholar] [CrossRef]
- Pendleton, L.; Kildow, J. The Non-Market Value of California’s Beaches. Shore Beach 2006, 74, 34–37. [Google Scholar]
- Rathi, B.S.; Kumar, P.S. Application of Adsorption Process for Effective Removal of Emerging Contaminants from Water and Wastewater. Environ. Pollut. 2021, 280, 116995. [Google Scholar] [CrossRef]
- Payne, E.G.I.; Fletcher, T.D.; Russell, D.G.; Grace, M.R.; Cavagnaro, T.R.; Evrard, V.; Deletic, A.; Hatt, B.E.; Cook, P.L.M. Temporary Storage or Permanent Removal? The Division of Nitrogen between Biotic Assimilation and Denitrification in Stormwater Biofiltration Systems. PLoS ONE 2014, 9, e90890. [Google Scholar] [CrossRef] [Green Version]
- Badin, A.; Monier, A.; Volatier, L.; Geremia, R.; Delolme, C.; Bedell, J. Structural Stability, Microbial Biomass and Community Composition of Sediments Affected by the Hydric Dynamics of an Urban Stormwater Infiltration Basin. Environ. Microbiol. 2011, 61, 885–897. [Google Scholar] [CrossRef]
- Bogati, K.; Walczak, M. The Impact of Drought Stress on Soil Microbial Community, Enzyme Activities and Plants. Agronomy 2022, 12, 189. [Google Scholar] [CrossRef]
- Ma, Y.; Rajkumar, M.; Zhang, C.; Freitas, H. Inoculation of Brassica Oxyrrhina with Plant Growth Promoting Bacteria for the Improvement of Heavy Metal Phytoremediation under Drought Conditions. J. Hazard. Mater. 2016, 320, 36–44. [Google Scholar] [CrossRef] [PubMed]
- Al-Ameri, M.; Hatt, B.; Le Coustumer, S.; Fletcher, T.; Payne, E.; Deletic, A. Accumulation of Heavy Metals in Stormwater Bioretention Media: A Field Study of Temporal and Spatial Variation. J. Hydrol. 2018, 567, 721–731. [Google Scholar] [CrossRef]
- Irvine, K.N.; Chua, L.H.C.; Hua’an, Z.; Qi, L.E.; Xuan, L.Y. Nature-Based Solutions to Manage Particle-Bound Metals in Urban Stormwater Runoff: Current Design Practices and Knowledge Gaps. J. Soils Sediments 2022, 1–18. [Google Scholar] [CrossRef]
- Al-Rubaei, A.M.; Engström, M.; Viklander, M.; Blecken, G.T. Long-Term Hydraulic and Treatment Performance of a 19-Year Old Constructed Stormwater Wetland—Finally Maturated or in Need of Maintenance? Ecol. Eng. 2016, 95, 73–82. [Google Scholar] [CrossRef]
- Waara, S.; Johansson, F. Ecological Risk Assessment of Trace Elements Accumulated in Stormwater Ponds within Industrial Areas. Environ. Sci. Pollut. Res. 2022, 29, 27026–27041. [Google Scholar] [CrossRef]
- Søberg, L.C.; Vollertsen, J.; Blecken, G.T.; Nielsen, A.H.; Viklander, M. Bioaccumulation of Heavy Metals in Two Wet Retention Ponds. Urban Water J. 2016, 13, 697–709. [Google Scholar] [CrossRef]
- Zinger, Y.; Blecken, G.T.; Fletcher, T.D.; Viklander, M.; Deletić, A. Optimising Nitrogen Removal in Existing Stormwater Biofilters: Benefits and Tradeoffs of a Retrofitted Saturated Zone. Ecol. Eng. 2013, 51, 75–82. [Google Scholar] [CrossRef]
- Kuoppamäki, K.; Pflugmacher Lima, S.; Scopetani, C.; Setälä, H. The Ability of Selected Filter Materials in Removing Nutrients, Metals, and Microplastics from Stormwater in Biofilter Structures. J. Environ. Qual. 2021, 50, 465–475. [Google Scholar] [CrossRef]
- Boehm, A.B.; Bell, C.D.; Fitzgerald, N.J.M.; Gallo, E.; Higgins, C.P.; Hogue, T.S.; Luthy, R.G.; Portmann, A.C.; Ulrich, B.A.; Wolfand, J.M. Biochar-Augmented Biofilters to Improve Pollutant Removal from Stormwater-Can They Improve Receiving Water Quality? Environ. Sci. Water Res. Technol. 2020, 6, 1520–1537. [Google Scholar] [CrossRef] [Green Version]
- Stanford Natural Capital Project. Available online: https://naturalcapitalproject.stanford.edu/software/invest (accessed on 4 March 2023).
- Ouyang, Z.; Zheng, H.; Xiao, Y.; Polasky, S.; Liu, J.; Xu, W.; Wang, Q.; Zhang, L.; Xio, Y.; Rao, E.; et al. Improvements in Ecosystem Services from Investments in Natural Capital. Science 2016, 352, 1455–1459. [Google Scholar] [CrossRef]
- Redhead, J.W.; Stratford, C.; Sharps, K.; Jones, L.; Ziv, G.; Clarke, D.; Oliver, T.H.; Bullock, J.M. Empirical Validation of the InVEST Water Yield Ecosystem Service Model at a National Scale. Sci. Total Environ. 2016, 569–570, 1418–1426. [Google Scholar] [CrossRef] [Green Version]
- Benra, F.; De Frutos, A.; Gaglio, M.; Álvarez-Garretón, C.; Felipe-Lucia, M.; Bonn, A. Mapping Water Ecosystem Services: Evaluating InVEST Model Predictions in Data Scarce Regions. Environ. Model. Softw. 2021, 138, 104982. [Google Scholar] [CrossRef]
- Salata, S.; Garnero, G.; Barbieri, C.A.; Giaimo, C. The Integration of Ecosystem Services in Planning: An Evaluation of the Nutrient Retention Model Using InVEST Software. Land 2017, 6, 48. [Google Scholar] [CrossRef] [Green Version]
- Carson, R.T.; Mitchell, R.C. The Value of Clean Water: The Public’s Willingness to Pay for Boatable, Fishable, and Swimmable Quality Water. Water Resour. Res. 1993, 29, 2445–2454. [Google Scholar] [CrossRef] [Green Version]
- Chatterjee, C.; Triplett, R.; Johnson, C.K.; Ahmed, P. Willingness to Pay for Safe Drinking Water: A Contingent Valuation Study in Jacksonville, FL. J. Environ. Manag. 2017, 203, 413–421. [Google Scholar] [CrossRef] [PubMed]
- Levin, L.A.; Mehring, A.S. Optimization of Bioretention Systems through Application of Ecological Theory. Wiley Interdiscip. Rev. Water 2015, 2, 259–270. [Google Scholar] [CrossRef]
- Hobbie, S.E.; Grimm, N.B. Nature-Based Approaches to Managing Climate Change Impacts in Cities. Philos. Trans. R. Soc. B Biol. Sci. 2020, 375, 20190124. [Google Scholar] [CrossRef] [Green Version]
- Science for Environment Policy. In Ecosystem Services and Biodiversity; 2015.
- Aavik, T.; Helm, A. Restoration of Plant Species and Genetic Diversity Depends on Landscape-Scale Dispersal. Restor. Ecol. 2018, 26, S92–S102. [Google Scholar] [CrossRef]
- Kiers, A.H.; Krimmel, B.; Larsen-Bircher, C.; Hayes, K.; Zemenick, A.; Michaels, J. Different Jargon, Same Goals: Collaborations between Landscape Architects and Ecologists to Maximize Biodiversity in Urban Lawn Conversions. Land 2022, 11, 1665. [Google Scholar] [CrossRef]
- Dreiseitl, H. Water and Sustainable Design; 2020. [Google Scholar]
- Tan, K.W. A Greenway Network for Singapore. Landsc. Urban Plan. 2006, 76, 45–66. [Google Scholar] [CrossRef]
- Song, Y.; Kirkwood, N.; Maksimović, Č.; Zhen, X.; O’Connor, D.; Jin, Y.; Hou, D. Nature Based Solutions for Contaminated Land Remediation and Brownfield Redevelopment in Cities: A Review. Sci. Total Environ. 2019, 663, 568–579. [Google Scholar] [CrossRef] [PubMed]
- Heimann, M.; Reichstein, M. Terrestrial Ecosystem Carbon Dynamics and Climate Feedbacks. Nature 2008, 451, 289–292. [Google Scholar] [CrossRef] [PubMed] [Green Version]
- Krauss, L.; Rippy, M. Adaptive Strategy Biases in Engineered Ecosystems: Implications for Plant Community Dynamics and the Provisioning of Ecosystem Services to People. People Nat. 2022, 4, 1644–1663. [Google Scholar] [CrossRef]
- Kranner, B.; Afrouz, A.; Fitzgerald, N.; Boehm, A. Fecal Indicator Bacteria and Virus Removal in Stormwater Biofilters: Effects of Biochar, Media Saturation, and Field Conditioning. PLoS ONE 2019, 14, e0222719. [Google Scholar] [CrossRef]
- Mehring, A.S.; Hatt, B.E.; Kraikittikun, D.; Orelo, B.D.; Rippy, M.A.; Grant, S.B.; Gonzalez, J.P.; Jiang, S.C.; Ambrose, R.F.; Levin, L.A. Soil Invertebrates in Australian Rain Gardens and Their Potential Roles in Storage and Processing of Nitrogen. Ecol. Eng. 2016, 97, 138–143. [Google Scholar] [CrossRef]
- Capowiez, Y.; Gilbert, F.; Vallat, A.; Poggiale, J.C.; Bonzom, J.M. Depth Distribution of Soil Organic Matter and Burrowing Activity of Earthworms—Mesocosm Study Using X-Ray Tomography and Luminophores. Biol. Fertil. Soils 2021, 57, 337–346. [Google Scholar] [CrossRef]
- Ge, B.; Mehring, A.S.; Levin, L.A. Urbanization Alters Belowground Invertebrate Community Structure in Semi-Arid Regions: A Comparison of Lawns, Biofilters and Sage Scrub. Landsc. Urban Plan. 2019, 192, 103664. [Google Scholar] [CrossRef]
- Evans, B.A.; Gawlik, D.E. Urban Food Subsidies Reduce Natural Food Limitations and Reproductive Costs for a Wetland Bird. Sci. Rep. 2020, 10, 1–12. [Google Scholar] [CrossRef]
- Hanley, N.; Perrings, C. The Economic Value of Biodiversity. Annu. Rev. Resour. Econ. 2019, 11, 355–375. [Google Scholar] [CrossRef]
- Champ, P.; Boyle, K.; Brown, T. (Eds.) A Primer on Nonmarket Valuation, 2nd ed.; Springer International Publishing: Dordrecht, The Netherlands, 2017. [Google Scholar]
- Dupras, J.; Alam, M.; Reveret, J.P. Economic Value of Greater Montreal’s Non-Market Ecosystem Services in a Land Use Management and Planning Perspective. Can. Geogr. 2014, 59, 93–106. [Google Scholar] [CrossRef]
- Gallai, N.; Salles, J.M.; Settele, J.; Vaissière, B.E. Economic Valuation of the Vulnerability of World Agriculture Confronted with Pollinator Decline. Ecol. Econ. 2009, 68, 810–821. [Google Scholar] [CrossRef]
- IPCC. Climate Change 2021: The Physical Science Basis. 2021. Available online: https://www.ipcc.ch/report/ar6/wg1/ (accessed on 31 January 2023).
- Global Platform for Sustainable Cities São Paolo Statement on Urban Sustainability: A Call to Integrate Our Responses to Climate Change, Biodiversity Loss, and Social Inequality. Available online: https://www.thegpsc.org (accessed on 4 October 2019).
- Galbraith, D.; Malhi, Y.; Affum-Baffoe, K.; Castanho, A.; CE, D. Residence Times of Woody Biomass in Tropical Forests. Plant Ecol. Divers. 2013, 6, 139–157. [Google Scholar] [CrossRef]
- Pronk, G.J.; Mellage, A.; Milojevic, T.; Smeaton, C.M.; Engel, K.; Neufeld, J.D.; Rezanezhad, F.; Van Cappellen, P. Carbon Turnover and Microbial Activity in an Artificial Soil under Imposed Cyclic Drainage and Imbibition. Vadose Zone J. 2020, 19, 1–16. [Google Scholar] [CrossRef] [Green Version]
- Li, K.; Fang, F.; Wang, H.; Wang, C.; Chen, Y.; Guo, J.; Wang, X.; Jiang, F. Pathways of N Removal and N2O Emission from a One-Stage Autotrophic N Removal Process under Anaerobic Conditions. Sci. Rep. 2017, 7, 1–10. [Google Scholar] [CrossRef] [Green Version]
- Nowak, D.J.; Greenfield, E.J.; Hoehn, R.E.; Lapoint, E. Carbon Storage and Sequestration by Trees in Urban and Community Areas of the United States. Environ. Pollut. 2013, 178, 229–236. [Google Scholar] [CrossRef] [PubMed] [Green Version]
- U.S. Environmental Protection Agency. Social Cost of Carbon; U.S. Environmental Protection Agency: Washington, DC, USA, 2016.
- Getter, K.; Rowe, D.; Robertson, G.; Cregg, B.; Andresen, J. Carbon Sequestration Potential of Extensive Green Roofs. Environ. Sci. Technol. 2009, 43, 7564–7570. [Google Scholar] [CrossRef]
- Seyedabadi, M.R.; Eicker, U.; Karimi, S. Plant Selection for Green Roofs and Their Impact on Carbon Sequestration and the Building Carbon Footprint. Environ. Chall. 2021, 4, 100119. [Google Scholar] [CrossRef]
- Lyu, R.; Mi, L.; Zhang, J.; Xu, M.; Li, J. Modeling the Effects of Urban Expansion on Regional Carbon Storage by Coupling SLEUTH-3r Model and InVEST Model. Ecol. Res. 2019, 34, 380–393. [Google Scholar] [CrossRef]
- Babbar, D.; Areendran, G.; Sahana, M.; Sarma, K.; Raj, K.; Sivadas, A. Assessment and Prediction of Carbon Sequestration Using Markov Chain and InVEST Model in Sariska Tiger Reserve, India. J. Clean. Prod. 2021, 278, 123333. [Google Scholar] [CrossRef]
- González-García, A.; Arias, M.; García-Tiscar, S.; Alcorlo, P.; Santos-Martín, F. National Blue Carbon Assessment in Spain Using InVEST: Current State and Future Perspectives. Ecosyst. Serv. 2022, 53, 101397. [Google Scholar] [CrossRef]
- U.S. Environmental Protection Agency Social Cost of Greenhouse Gases. Available online: https://www.epa.gov/environmental-economics/scghg (accessed on 4 March 2023).
- Li, P.; Wang, Z.H. Environmental Co-Benefits of Urban Greening for Mitigating Heat and Carbon Emissions. J. Environ. Manag. 2021, 293, 112963. [Google Scholar] [CrossRef]
- Oke, T. The Energetic Basis of the Urban Heat Island. Q. J. R. Meteorol. Soc. 1982, 108, 1–24. [Google Scholar] [CrossRef]
- Stewart, I.D.; Oke, T.R. Local Climate Zones for Urban Temperature Studies. Bull. Am. Meteorol. Soc. 2012, 93, 1879–1900. [Google Scholar] [CrossRef]
- Stache, E.; Schilperoort, B.; Ottelé, M.; Jonkers, H.M. Comparative Analysis in Thermal Behaviour of Common Urban Building Materials and Vegetation and Consequences for Urban Heat Island Effect. Build. Environ. 2022, 213, 108489. [Google Scholar] [CrossRef]
- Meili, N.; Acero, J.A.; Peleg, N.; Manoli, G.; Burlando, P.; Fatichi, S. Vegetation Cover and Plant-Trait Effects on Outdoor Thermal Comfort in a Tropical City. Build. Environ. 2021, 195, 107733. [Google Scholar] [CrossRef]
- Kalkstein, L.S.; Eisenman, D.P.; de Guzman, E.B.; Sailor, D.J. Increasing Trees and High-Albedo Surfaces Decreases Heat Impacts and Mortality in Los Angeles, CA. Int. J. Biometeorol. 2022, 66, 911–925. [Google Scholar] [CrossRef]
- Porto, R.G.; de Almeida, R.F.; Cruz-Neto, O.; Tabarelli, M.; Viana, B.F.; Peres, C.A.; Lopes, A.V. Pollination Ecosystem Services: A Comprehensive Review of Economic Values, Research Funding and Policy Actions. Food Secur. 2020, 12, 1425–1442. [Google Scholar] [CrossRef]
- Dicks, L.V.; Breeze, T.D.; Ngo, H.T.; Senapathi, D.; An, J.; Aizen, M.A.; Basu, P.; Buchori, D.; Galetto, L.; Garibaldi, L.A.; et al. A Global-Scale Expert Assessment of Drivers and Risks Associated with Pollinator Decline. Nat. Ecol. Evol. 2021, 5, 1453–1461. [Google Scholar] [CrossRef]
- Haddad, N.M.; Brudvig, L.A.; Clobert, J.; Davies, K.F.; Gonzalez, A.; Holt, R.D.; Lovejoy, T.E.; Sexton, J.O.; Austin, M.P.; Collins, C.D.; et al. Habitat Fragmentation and Its Lasting Impact on Earth’s Ecosystems. Sci. Adv. 2015, 1, e1500052. [Google Scholar] [CrossRef] [Green Version]
- Kremen, C.; Williams, N.M.; Aizen, M.A.; Gemmill-Herren, B.; LeBuhn, G.; Minckley, R.; Packer, L.; Potts, S.G.; Roulston, T.; Steffan-Dewenter, I.; et al. Pollination and Other Ecosystem Services Produced by Mobile Organisms: A Conceptual Framework for the Effects of Land-Use Change. Ecol. Lett. 2007, 10, 299–314. [Google Scholar] [CrossRef]
- Hung, K.-L.J.; Kingston, J.M.; Albrecht, M.; Holway, D.A.; Kohn, J.R. The Worldwide Importance of Honey Bees as Pollinators in Natural Habitats. Proc. R. Soc. B Biol. Sci. 2018, 285, 20172140. [Google Scholar] [CrossRef] [Green Version]
- IPBES Conceptual Framework for the Intergovernmental Science-Policy Platform on Biodiversity and Ecosystem Services. Curr. Opin. Environ. Sustain. 2014, IPBES-2/4, 231–269.
- Breeze, T.D.; Bailey, A.P.; Potts, S.G.; Balcombe, K.G. A Stated Preference Valuation of the Non-Market Benefits of Pollination Services in the UK. Ecol. Econ. 2015, 111, 76–85. [Google Scholar] [CrossRef]
- Veitch, J.; Ball, K.; Crawford, D.; Abbott, G.; Salmon, J. Park Improvements and Park Activity: A Natural Experiment. Am. J. Prev. Med. 2012, 42, 616–619. [Google Scholar] [CrossRef] [Green Version]
- Van Den Berg, A.E.; Maas, J.; Verheij, R.A.; Groenewegen, P.P. Social Science & Medicine Green Space as a Buffer between Stressful Life Events and Health Q. Soc. Sci. Med. 2010, 70, 1203–1210. [Google Scholar] [CrossRef] [PubMed] [Green Version]
- Hartig, T.; Mitchell, R.; De Vries, S.; Frumkin, H. Nature and Health. Annu. Rev. Public Health 2014, 35, 207–228. [Google Scholar] [CrossRef] [Green Version]
- Coombes, E.; Jones, A.P.; Hillsdon, M. The Relationship of Physical Activity and Overweight to Objectively Measured Green Space Accessibility and Use. Soc. Sci. Med. 2010, 70, 816–822. [Google Scholar] [CrossRef] [Green Version]
- U.S. Census Bureau Population Density Data. Available online: https://www.census.gov/quickfacts/fact/table/losangelescountycalifornia,CA/PST045222 (accessed on 13 January 2023).
- More, T.A.; Stevens, T.; Allen, P.G. Valuation of Urban Parks. Landsc. Urban Plan. 1988, 15, 139–152. [Google Scholar] [CrossRef]
- Łaszkiewicz, E.; Czembrowski, P.; Kronenberg, J. Can Proximity to Urban Green Spaces Be Considered a Luxury? Classifying a Non-Tradable Good with the Use of Hedonic Pricing Method. Ecol. Econ. 2019, 161, 237–247. [Google Scholar] [CrossRef]
- Ward, C.D.; Parker, C.M.; Shackleton, C.M. The Use and Appreciation of Botanical Gardens as Urban Green Spaces in South Africa. Urban For. Urban Green. 2010, 9, 49–55. [Google Scholar] [CrossRef] [Green Version]
- Byrne, J.; Wolch, J.; Zhang, J. Planning for Environmental Justice in an Urban National Park. J. Environ. Plan. Manag. 2009, 52, 365–392. [Google Scholar] [CrossRef]
- Graça, M.; Alves, P.; Gonçalves, J.; Nowak, D.J.; Hoehn, R.; Farinha-marques, P.; Cunha, M. Landscape and Urban Planning Assessing How Green Space Types a Ff Ect Ecosystem Services Delivery in Porto, Portugal. Landsc. Urban Plan. 2018, 170, 195–208. [Google Scholar] [CrossRef]
- Southon, G.E.; Jorgensen, A.; Dunnett, N.; Hoyle, H.; Evans, K.L. Biodiverse Perennial Meadows Have Aesthetic Value and Increase Residents’ Perceptions of Site Quality in Urban Green-Space. Landsc. Urban Plan. 2017, 158, 105–118. [Google Scholar] [CrossRef] [Green Version]
- Wolch, J.R.; Byrne, J.; Newell, J.P. Urban Green Space, Public Health, and Environmental Justice: The Challenge of Making Cities “Just Green Enough”. Landsc. Urban Plan. 2014, 125, 234–244. [Google Scholar] [CrossRef] [Green Version]
- Deng, L.; Luo, H.; Ma, J.; Huang, Z.; Sun, L.X.; Jiang, M.Y.; Zhu, C.Y.; Li, X. Effects of Integration between Visual Stimuli and Auditory Stimuli on Restorative Potential and Aesthetic Preference in Urban Green Spaces. Urban For. Urban Green. 2020, 53, 126702. [Google Scholar] [CrossRef]
- Reyes-Riveros, R.; Altamirano, A.; De La Barrera, F.; Rozas-Vásquez, D.; Vieli, L.; Meli, P. Linking Public Urban Green Spaces and Human Well-Being: A Systematic Review. Urban For. Urban Green. 2021, 61, 127105. [Google Scholar] [CrossRef]
- Van Renterghem, T.; Hornikx, M.; Forssen, J.; Botteldooren, D. The Potential of Building Envelope Greening to Achieve Quietness. Build. Environ. 2013, 61, 34–44. [Google Scholar] [CrossRef] [Green Version]
- Hedblom, M.; Gunnarsson, B.; Iravani, B.; Knez, I.; Schaefer, M.; Thorsson, P.; Lundström, J.N. Reduction of Physiological Stress by Urban Green Space in a Multisensory Virtual Experiment. Sci. Rep. 2019, 9, 1–11. [Google Scholar] [CrossRef] [Green Version]
- Dadvand, P.; Nieuwenhuijsen, M.J.; Esnaola, M.; Forns, J.; Basagaña, X.; Alvarez-Pedrerol, M.; Rivas, I.; López-Vicente, M.; De Castro Pascual, M.; Su, J.; et al. Green Spaces and Cognitive Development in Primary Schoolchildren. Proc. Natl. Acad. Sci. USA 2015, 112, 7937–7942. [Google Scholar] [CrossRef] [Green Version]
- Hermawan, A.A.; Jung, D.Y.; Talei, A. Removal Process of Nutrients and Heavy Metals in Tropical Biofilters. E3S Web Conf. 2018, 65, 1–11. [Google Scholar] [CrossRef] [Green Version]
- Le, J. Characterization of Ecosystem Services Associated with Deep-Sea Habitats and Natural Stormwater Treatment Systems and Their Incorporation into Environmental Management; University of California: San Diego, CA, USA, 2020. [Google Scholar]
- Hansford, K.M.; Fonville, M.; Gillingham, E.L.; Coipan, E.C.; Pietzsch, M.E.; Krawczyk, A.I.; Vaux, A.G.C.; Cull, B.; Sprong, H.; Medlock, J.M. Ticks and Borrelia in Urban and Peri-Urban Green Space Habitats in a City in Southern England. Ticks Tick-Borne Dis. 2017, 8, 353–361. [Google Scholar] [CrossRef] [PubMed]
- Bogar, S.; Beyer, K.M. Green Space, Violence, and Crime: A Systematic Review. Trauma Violence Abus. 2016, 17, 160–171. [Google Scholar] [CrossRef] [PubMed]
- Prudencio, L.; Null, S.E. Stormwater Management and Ecosystem Services: A Review. Environ. Res. Lett. 2018, 13, 033002. [Google Scholar] [CrossRef]
- Charnes, A.; Cooper, W.; Rhodes, E. Measuring the Efficiency of Decision Making Units. Eur. J. Oper. Res. 1978, 2, 429–444. [Google Scholar] [CrossRef]
- Aigner, D.; Lovell, C.A.K.; Schmidt, P. Formulation and Estimation of Stochastic Frontier Production Function Models. J. Econ. 1977, 6, 21–37. [Google Scholar] [CrossRef]
- Hossain, M.K.; Kamil, A.A.; Baten, M.A.; Mustafa, A. Stochastic Frontier Approach and Data Envelopment Analysis to To-Tal Factor Productivity and Efficiency Measurement of Bangladeshi Rice. PLoS ONE 2012, 7, e46081. [Google Scholar] [CrossRef] [Green Version]
- Chen, C.; Delmas, M.; Lieberman, M. Production Frontier Methodologies and Efficiency as a Performance Measure in Strategic Management Research. Strateg. Manag. J. 2015, 36, 19–36. [Google Scholar] [CrossRef] [Green Version]
- Brauman, K.A.; Bremer, L.L.; Hamel, P.; Ochoa-Tocachi, B.F.; Roman-Dañobeytia, F.; Bonnesoeur, V.; Arapa, E.; Gammie, G. Producing Valuable Information from Hydrologic Models of Nature-Based Solutions for Water. Integr. Environ. Assess. Manag. 2022, 18, 135–147. [Google Scholar] [CrossRef] [PubMed]
- Loc, H.H.; Diep, N.T.H.; Tuan, V.T.; Shimizu, Y. An Analytical Approach in Accounting for Social Values of Ecosystem Services in a Ramsar Site: A Case Study in the Mekong Delta, Vietnam. Ecol. Indic. 2018, 89, 118–129. [Google Scholar] [CrossRef]
- Hirons, M.; Comberti, C.; Dunford, R. Valuing Cultural Ecosystem Services. Annu. Rev. Environ. Resour. 2016, 41, 545–574. [Google Scholar] [CrossRef]
- Olander, L.P.; Johnston, R.J.; Tallis, H.; Kagan, J.; Maguire, L.A.; Polasky, S.; Urban, D.; Boyd, J.; Wainger, L.; Palmer, M. Benefit Relevant Indicators: Ecosystem Services Measures That Link Ecological and Social Outcomes. Ecol. Indic. 2018, 85, 1262–1272. [Google Scholar] [CrossRef]
Figure 1.
Diagram of targeted and non-targeted ecosystem services associated with natural stormwater treatment systems (a bioretention system pictured here) and methods used to assign a value to them.
Figure 1.
Diagram of targeted and non-targeted ecosystem services associated with natural stormwater treatment systems (a bioretention system pictured here) and methods used to assign a value to them.

Figure 2.
Location of natural stormwater treatment systems in Los Angeles County [27]. Blue indicates sites visited in 2015. Purple indicates sites visited in 2016. View the interactive Google map here: https://goo.gl/76sswN (accessed on 31 January 2023).
Figure 2.
Location of natural stormwater treatment systems in Los Angeles County [27]. Blue indicates sites visited in 2015. Purple indicates sites visited in 2016. View the interactive Google map here: https://goo.gl/76sswN (accessed on 31 January 2023).

Figure 3.
Diagram of a bioretention system with vertical layers.

Figure 4.
Examples of Los Angeles systems designed to remove debris and contaminants from runoff: (a) biofilter along Elmer Avenue Paseo, (b) biofilter in the Avalon Green Alley, and (c) Filterra™ bioretention system on Grand Boulevard.
Figure 4.
Examples of Los Angeles systems designed to remove debris and contaminants from runoff: (a) biofilter along Elmer Avenue Paseo, (b) biofilter in the Avalon Green Alley, and (c) Filterra™ bioretention system on Grand Boulevard.

Figure 5.
Examples of biodiversity that can support ecosystem services in Los Angeles natural stormwater treatment systems: (a) plant diversity at the South Los Angeles Wetland Park, (b) Bicknell manzanita tree as a bee attractant, and (c) signage illustrating the biodiversity of the Ballona Freshwater Marsh.

Figure 6.
Flowering plants that could provide pollination services observed in bioretention systems at: (a) Elmer Avenue, (b) Bicknell Avenue, (c) Grand Boulevard, and (d) Los Angeles Zoo.
Figure 6.
Flowering plants that could provide pollination services observed in bioretention systems at: (a) Elmer Avenue, (b) Bicknell Avenue, (c) Grand Boulevard, and (d) Los Angeles Zoo.

Figure 7.
Visual indicators of recreation at Los Angeles natural stormwater treatment systems: (a) walking trail on Elmer Avenue Paseo, and (b,c) signage and drinking fountains at South Los Angeles Wetlands Park.
Figure 7.
Visual indicators of recreation at Los Angeles natural stormwater treatment systems: (a) walking trail on Elmer Avenue Paseo, and (b,c) signage and drinking fountains at South Los Angeles Wetlands Park.

Figure 8.
Examples of education and outreach services provided by natural stormwater treatment systems: (a) South Los Angeles Wetlands Park, (b) Ballona Freshwater Marsh, and (c) students conducting fieldwork as part of the National Science Foundation Partnerships for International Research and Education.


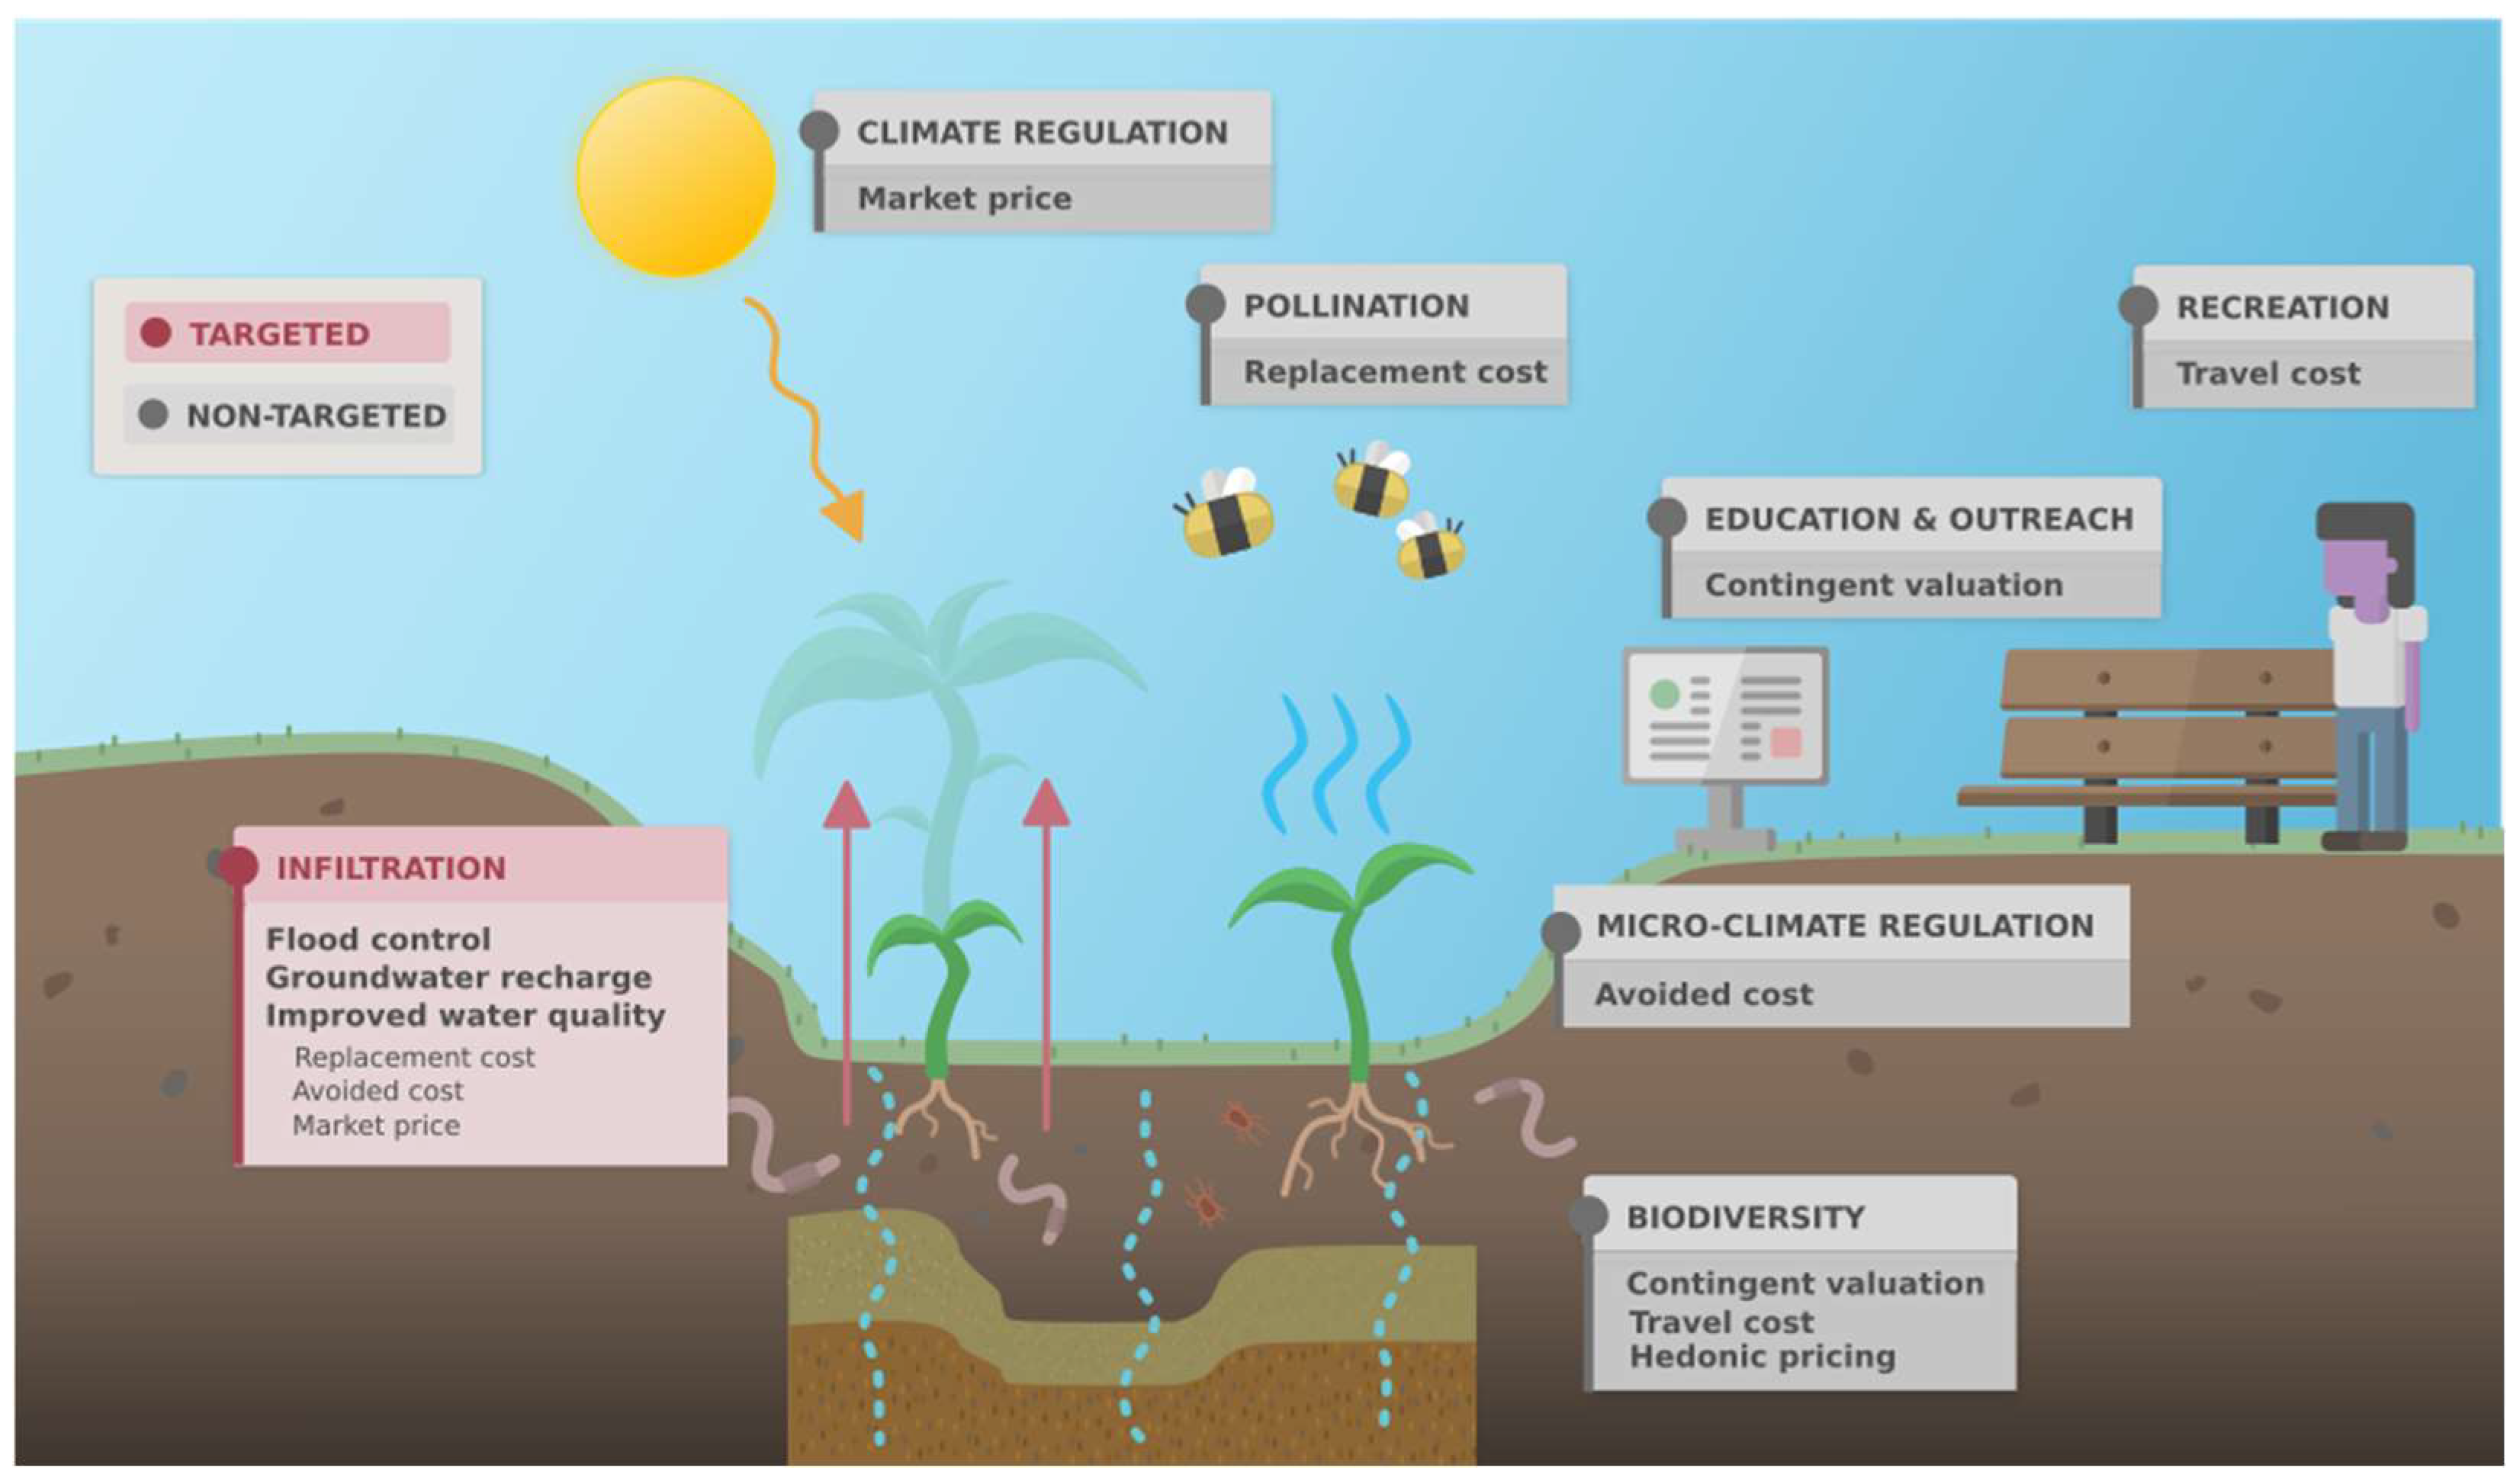
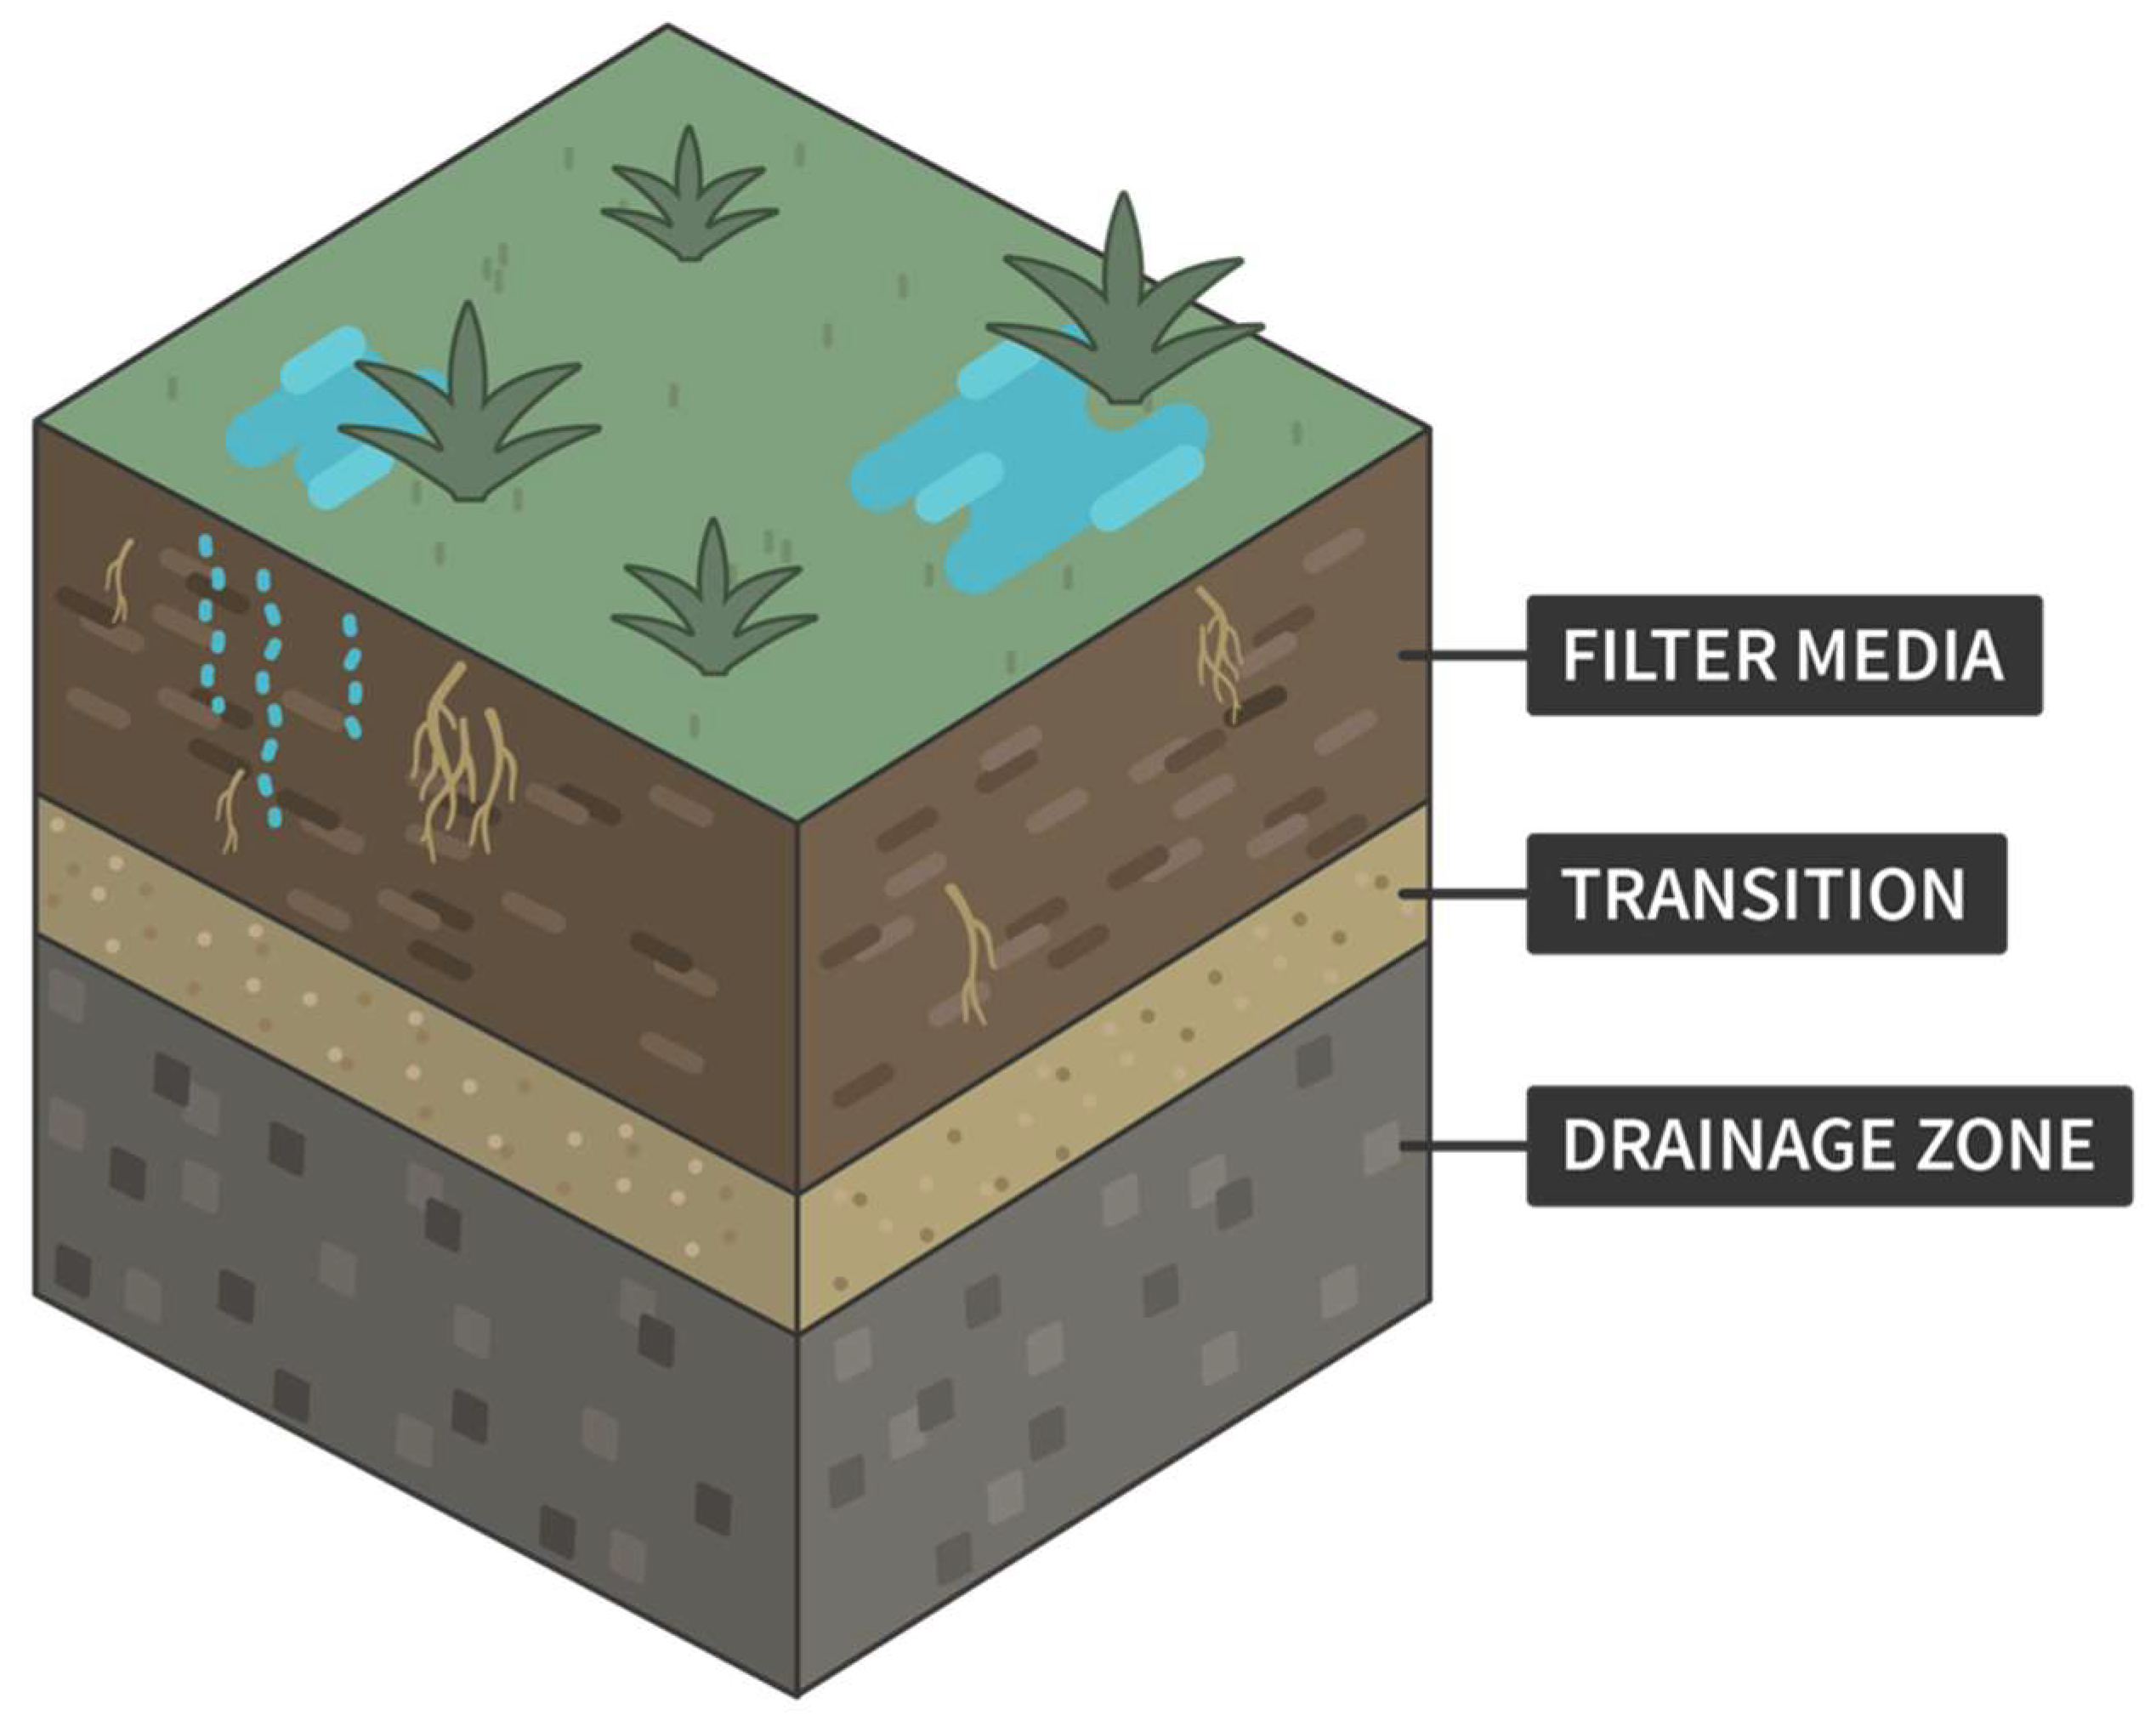
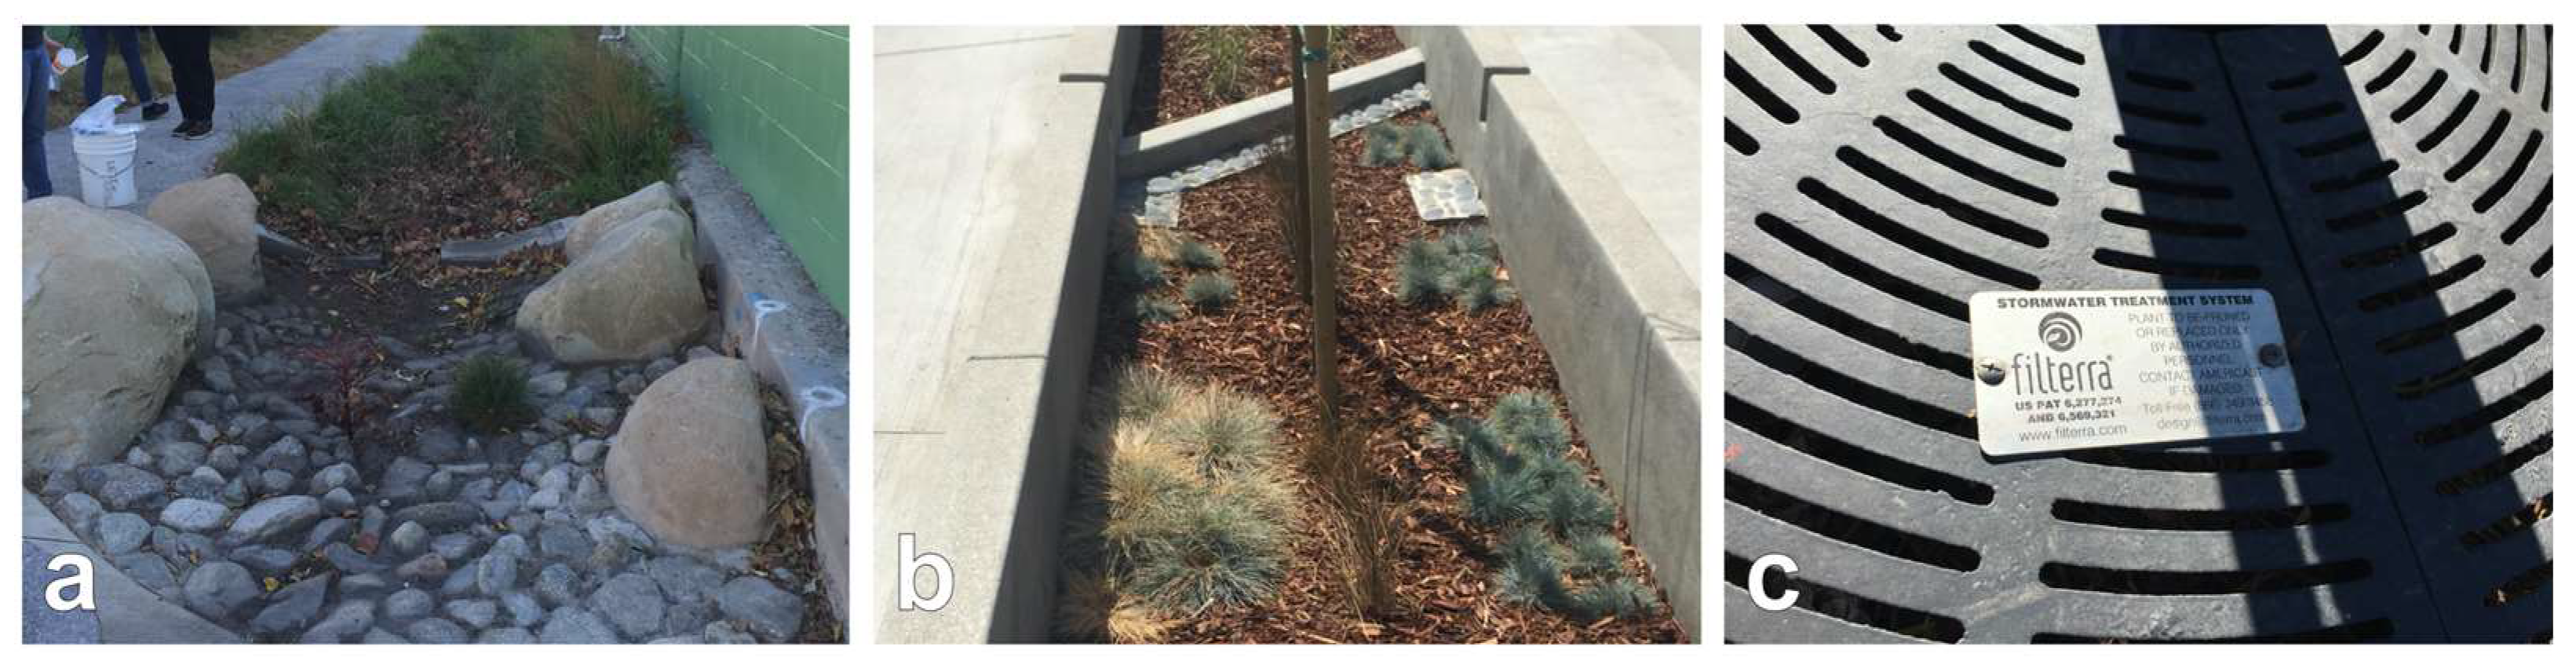
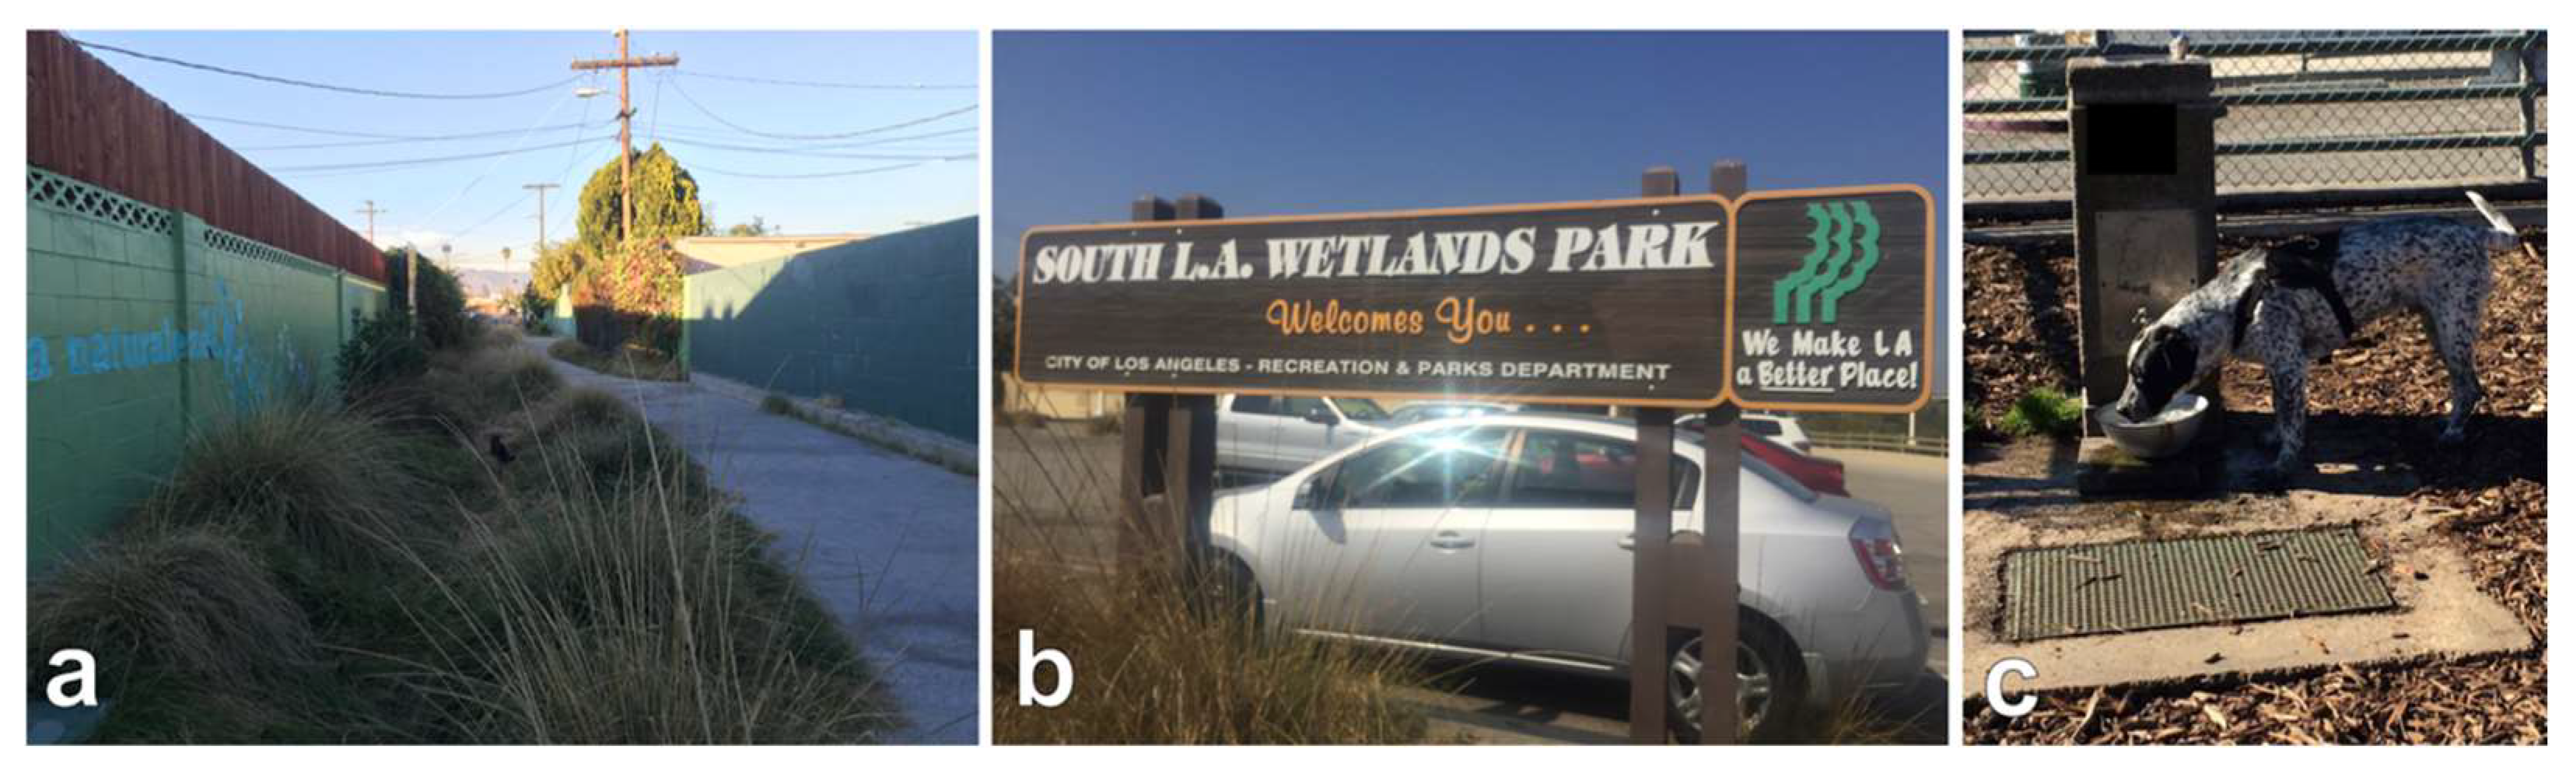
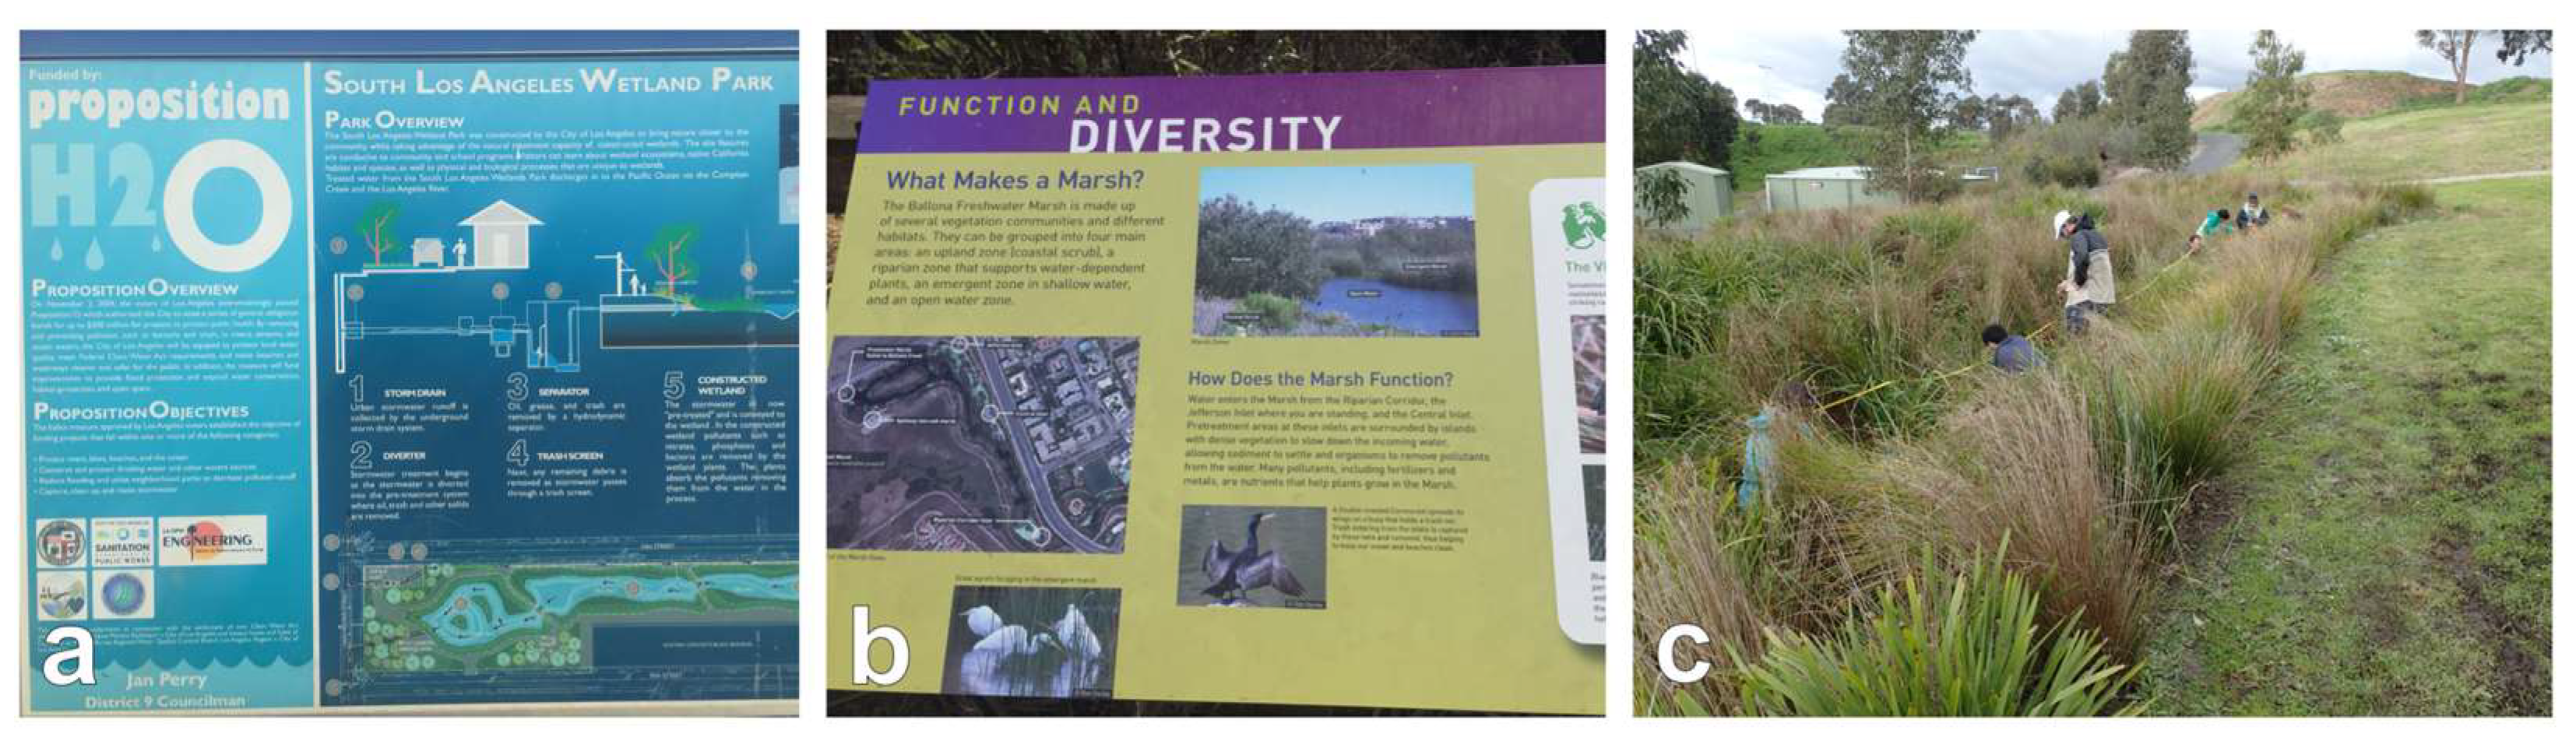
Table 1.
Advantages and disadvantages of benefit transfer approaches, stochastic frontier analysis, and data envelopment analysis for assessing the value of ecosystem services in natural stormwater treatment systems. Adapted from [168].
Table 1.
Advantages and disadvantages of benefit transfer approaches, stochastic frontier analysis, and data envelopment analysis for assessing the value of ecosystem services in natural stormwater treatment systems. Adapted from [168].
| Benefit Transfer Approaches | Stochastic Frontier Analysis | Data Envelopment Analysis | |
|---|---|---|---|
| Assumptions | Policy site is equitable to study site | A priori production function | Deterministic approach |
| Error | due to differences in site characteristics | Incorporated as stochastic variable | cannot be separated from inefficiency |
| Multiple outputs | Single ecosystem service | Weighted basket of ecosystem services | Allows for multiple ecosystem services |
| Relationship to independent variables | Relationship built into regression model | Relationship built into regression model | Need additional regression model |
| Interpretation of results | Associated value and drivers | Benchmark for efficiency | Benchmark for efficiency |
Disclaimer/Publisher’s Note: The statements, opinions and data contained in all publications are solely those of the individual author(s) and contributor(s) and not of MDPI and/or the editor(s). MDPI and/or the editor(s) disclaim responsibility for any injury to people or property resulting from any ideas, methods, instructions or products referred to in the content. |
© 2023 by the authors. Licensee MDPI, Basel, Switzerland. This article is an open access article distributed under the terms and conditions of the Creative Commons Attribution (CC BY) license (https://creativecommons.org/licenses/by/4.0/).
Share and Cite
MDPI and ACS Style
Le, J.T.; Gonzalez, J.P.; Carson, R.T.; Ambrose, R.F.; Levin, L.A. Integrating Non-Targeted Ecosystem Services into Assessment of Natural Stormwater Treatment Systems. Water 2023, 15, 1460. https://doi.org/10.3390/w15081460
AMA Style
Le JT, Gonzalez JP, Carson RT, Ambrose RF, Levin LA. Integrating Non-Targeted Ecosystem Services into Assessment of Natural Stormwater Treatment Systems. Water. 2023; 15(8):1460. https://doi.org/10.3390/w15081460
Chicago/Turabian StyleLe, Jennifer T., Jennifer P. Gonzalez, Richard T. Carson, Richard F. Ambrose, and Lisa A. Levin. 2023. "Integrating Non-Targeted Ecosystem Services into Assessment of Natural Stormwater Treatment Systems" Water 15, no. 8: 1460. https://doi.org/10.3390/w15081460
Note that from the first issue of 2016, this journal uses article numbers instead of page numbers. See further details here.