
Reverse Salt Flux Effect on Dewatering Chlorella vulgaris in a Forward Osmosis System

1
Department of Civil, Environmental and Construction Engineering, University of Central Florida, Orlando, FL 32816, USA
2
Department of Civil Engineering, King Saud University, Riyadh 11451, Saudi Arabia
*
Author to whom correspondence should be addressed.
Water 2023, 15(8), 1462; https://doi.org/10.3390/w15081462
Submission received: 8 March 2023
/
Revised: 2 April 2023
/
Accepted: 6 April 2023
/
Published: 8 April 2023
(This article belongs to the Special Issue Biological Processes for Water and Wastewater Treatment)
Abstract
:Microalgae shows a high potential to produce biofuel and forward osmosis (FO) has been proposed as a promising dewatering process for algal biomass separation from water. However, the effect of reverse salt flux (RSF) on algal biomass during the dewatering process using FO has not been completely explored. This study was to investigate the effect of different types of salt and their concentrations on algal biomass in terms of conductivity, settling velocity, and lipid contents in FS during a simulated FO-driven dewatering of Chlorella vulgaris microalgae. Three draw solution (DS) salts (NaCl, KCl and NH4Cl) were evaluated in RSF-simulating batch tests. The salt diffusion from the DS to the algal feed solution (FS) caused a static growth of algal biomass while increasing lipid content up to 14.8% at 8 mM NH4Cl. With the addition of the different salts, pH was maintained to the optimal algal thriving range (7.2–10.6), but the presence of salt stressed the algal cells and inhibited photosynthesis and algal growth within the experimental conditions. The settling velocity of the algal cells improved with the increase of salt content from 8 to 80 mM of each DS. It seemed that cell division could be accelerated in the presence of NH4Cl, and microscopic images showed a change in the algal cell size distribution, which may negatively affect algal settleability. DS salt in an FO-algal harvesting system should be selected based on the final algal properties and constituents required.
1. Introduction
Microalgae have a high potential for the production of biofuel, biodiesel, supplemental nutrient and feedstock. Depending on the conditions of cultivation, microalgae can vary in the constituent ratios of carbohydrates, lipids, and proteins [1,2]. The cultivation of microalgae can be achieved with a low impact on natural resources. For example, algae can grow using secondary treated wastewater as a nutrient source which can serve as a polishing stage in wastewater treatment. In the presence of sunlight, algae can utilize carbon dioxide (CO2) in exhaust gas from power plants [3,4].
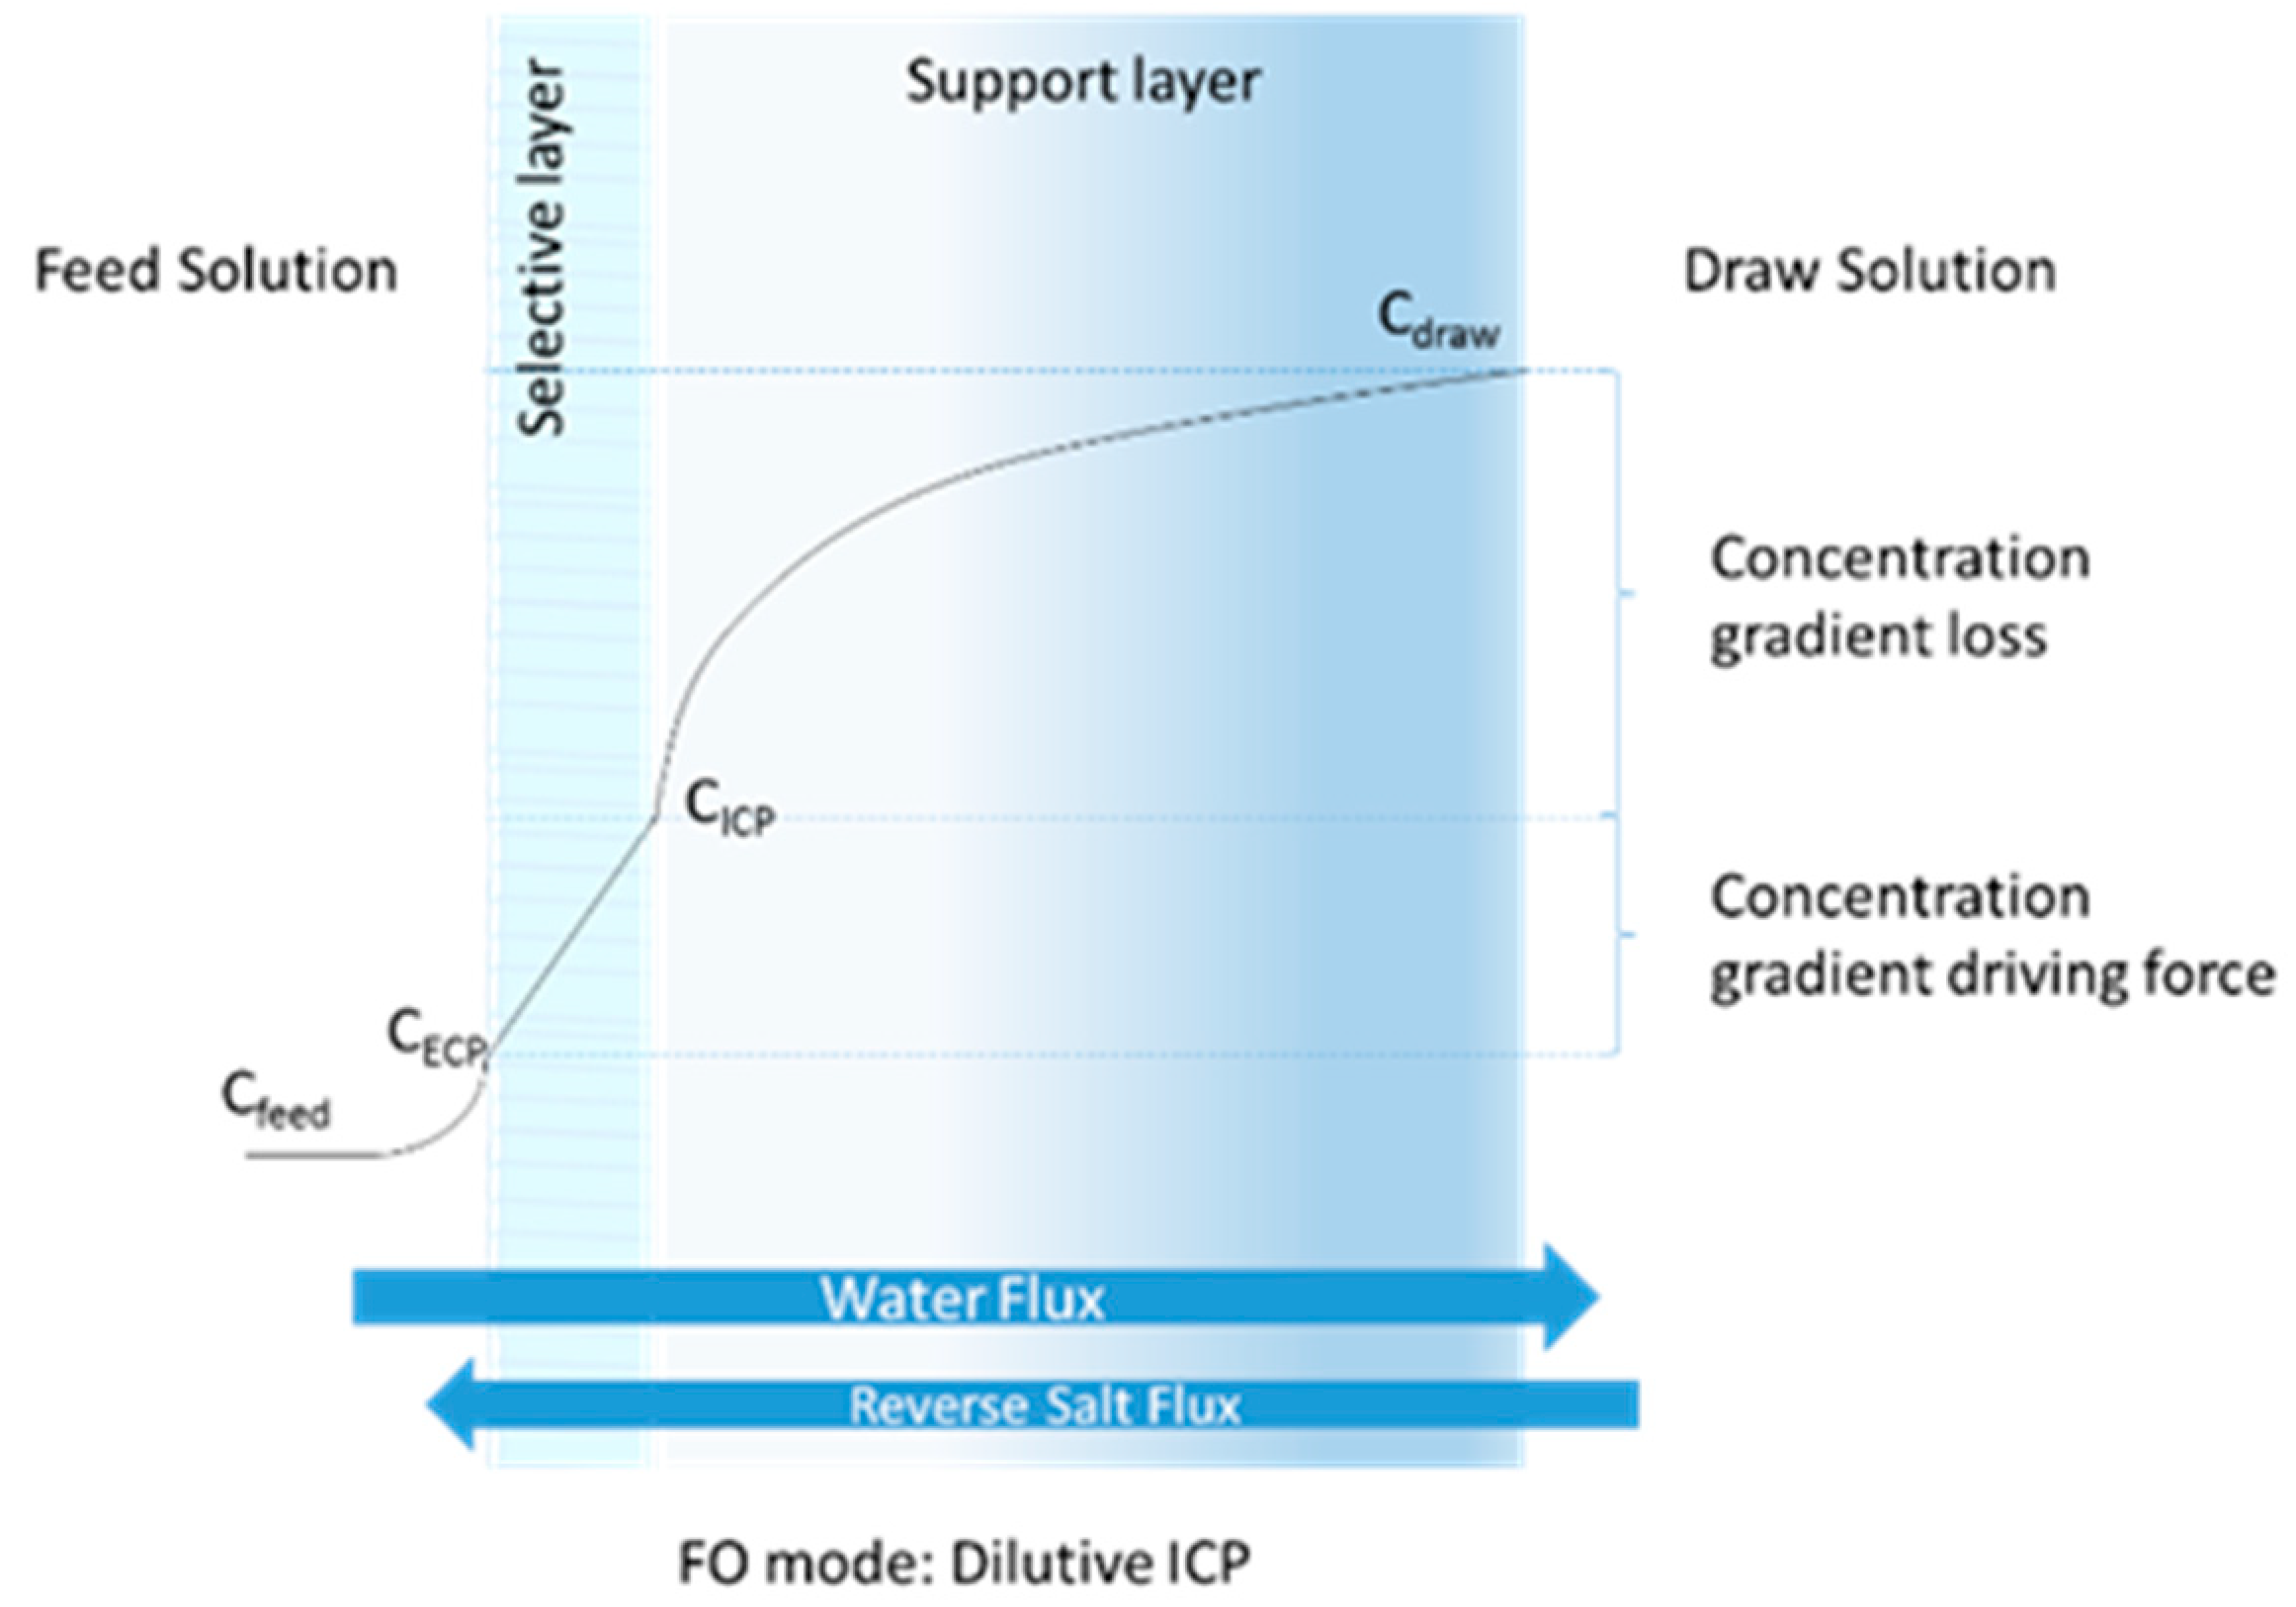
The use of forward osmosis (FO) membranes as an attempt to harvest grown algae in a sustainable way has been studied for the past decade. FO has the capacity to preserve energy by utilizing osmotic pressure to concentrate and harvest microalgae while producing clean water. FO requires two salt concentration gradient solutions to interact on the opposite sides of the membrane surface: draw solution (DS) and feed solution (FS). The DSs used in FO systems are preferred to be economical, abundant, non-toxic and easy to regenerate. In best practice, the diluted DS would be directly utilized in other applications, such as fertigation or as a feed solution in desalination plants [5,6]. Using the DS, the FO system can reduce the volume of the algal FS to approximately 20% [7]. However, during this process, salts can flow backward from the DS to the algal FS by diffusion, which is called reverse salt flux (RSF) (Figure 1). The accumulation of salts in a feed solution due to RSF can decrease water flux and inhibit the biological activities of the microalgae [8]. The hypothesis taken into account is that the RSF can enhance the growth rate of algal during the algal dewatering, as it can be considered as an additional nutrient source in the case of NH4Cl and KCl. Moreover, specific salt concentrations can cause algal toxicity, which may lead to algal degradation. The low RSF concentrations may enhance algal growth and lipid content for some salts, while the salts might create a growth inhibition with the high concentration [1,9,10,11]. pH can change with each salt, which can also affect algal characteristics. The added salts can also affect the algal excretion (dissolved organic content) [12], which can adversely impact the process of algal separation via membranes or settling.
The concentration of the salts transferring from the DS to the algal FS varies depending on the concentration gradient between DS and FS, the type of salt, and the membrane configuration. In our previous study with three different types of DS (NaCl, KCl and NH4Cl) [7], it was found that at a DS concentration between 0.5–1.0 M, the RSF can vary with 0.7–1.7 g m−2 h−1, resulting in different salt concentrations between 8 and 80 mM after running for 1–2 days under the cross-flow velocities (CFVs) at 5 cm s−1. The concentration and type of salt can affect algal growth, composition, metabolism, photosynthesis and morphology [2,13]. RSF in FO has been widely studied in terms of membrane fouling and permeate flux loss [14]. However, the effect of RSF on algal biomass during the dewatering process using FO is not completely understood.
The objective of this study was to investigate the effect of different types of salt and their concentrations on algal biomass in terms of conductivity, settling velocity, and lipid contents in FS during a simulated FO-driven dewatering of C. vulgaris. Specific salts can have different interactions with enzyme channel use, and the ratio between potassium and sodium can stress the bioenergetic processes of photosynthesis [13]. NaCl, KCl and NH4Cl were selected to represent salts for RSF in a FO system [7]. For practical applications, NaCl simulates seawater or brine effluent from desalination plants, while KCl and NH4Cl represent fertilizer salts that can be used as DS to extract water and later be used in fertigation. Three different DS concentrations were applied: 8, 32, and 80 mM [7]. pH and conductivity were continuously monitored during the algal dewatering FO process. Lipid contents in microalgal biomass were measured to investigate the effect of salt on algal biomass in terms of potential bioenergy production (e.g., biodiesel). Settleability and morphology changes of microalgae were also investigated overtime during the FO operation.
2. Materials and Methods
2.1. FO System
A custom-made bench-scale FO system was used to investigate water flux, RSF, and fouling of a new flat sheet PES FO membrane (Aquaporin–Sterlitech, Kent, WA, USA) with an active surface area of 12.5 cm2. The system consisted of an FS tank (0.5 L) and DS tank (15 L) [7]. In the previous study [7], the salts used in the FO operation showed effects on water flux and the final algal biomass properties, including color. In this study, the RSF was considered to be a potential contributor to stressing algal biomass in FS and possibly altering algal metabolism in FS. Upon that, the experiments were designed to investigate the effect of the NaCl, KCl and NH4Cl salts on the algal culture. The RSF concentrations used in the experiments were determined in the previous FO operation with 2 days of hydraulic retention time (HRT) [7].
2.2. Algal Species and Cultivation
Chlorella vulgaris microalgae (UTEX 2714, Austin, TX, USA) was cultivated in a 4 L photo-bioreactor at room temperature (23.0 ± 0.2 °C). The system was aerated with filtered ambient air to supply CO2 (0.04%) under continuous white fluorescent light illumination (light intensity: 159–189 µmol m−2 s−1 PAR) (06-662-63, Fisher). Modified Bold’s Basal Medium (BBM) was used as growth media which consisted of (mg per liter): 175 KH2PO4; 25 CaCl2·2H2O; 75 MgSO4·7H2O; 250 NaNO3; 75 Na2HPO4; 25 NaCl; 10 Na2EDTA·2H2O; 6.2 NaOH; 4.98 FeSO4·7H2O; 0.001 mL H2SO4 (concentrated); 11.5 H3BO3, and a Trace Metal Solution of 2.86 H3BO3; 1.81 MnCl2·4H2O; 0.222 ZnSO4·7H2O; 0.079 CuSO4·5H2O; 0.0494 Co(NO3)2·6H2O [15,16]. The algal concentration was monitored to be maintained in the exponential growth phase at a concentration of about 0.37 g L−1 dry algal biomass. The pH and conductivity of the algal solution were 10.0 ± 0.5 and 700–800 µS cm−1, respectively.
2.3. Analytical Methods
Conductivity was measured to monitor salt depletion or uptake (Hach HQ40d Portable multi-parameter meter) in FS. pH change was monitored over time (Hach HQ40d). pH values of healthy C. vulgaris solutions range from 8.0–11.0. Total suspended solids (TSS) (standard methods 2540) and optical density (OD) (DR5000 portable spectrophotometer, Hach, CO, USA) were measured to determine the dry biomass of the algal solution. Microscopic and visual observations of the bulk algal solution were carried out to identify the color change and morphology of the microalgae using microscopy (Omax 40-2500X LED digital trinocular lab microscope, AmScope, CA, USA). Settling velocity was measured using graduated cylinders (100 mL Borosilicate, Karter Scientific, LA, USA), which was monitored using a time-lapse image recorder. Lipid cell content was determined at the end of the experiments by using a modified gravimetric determination of the total lipids [17].
2.4. Experimental Protocol
Several batch experiments were conducted to investigate the salt effects on algal biomass due to RSF during the FO operation. For each batch test, salts were added to a 500 mL algal FS. The algae used in the experiments were in the exponential growth phase (OD = 3 abs @ wavelength of 685 nm) with a concentration of 0.37 g L−1. The experiment duration was 2 days to simulate the HRT used in the previous FO system [7], where the RSF in the FO system was found for different CFVs and DS concentrations. The salt concentrations due to RSF in this study were 8, 32, and 80 mM for each salt, covering the spectrum of the salt concentrations found in the FS of the previous study when 80% of dewatering was completed [7]. The associated algal morphological changes from the RSF in FS were determined with three DSs. Table 1 displays the matrix of conditions with different applied salt dosing. All experiments were conducted at room temperature (23 ± 0.2 °C).
3. Results
RSF is the reverse permeation of a DS across an asymmetric membrane in a FO operation. There are a few studies on RSF in FO operations. For example, Ferby et al. (2020) demonstrated that RSF from DS into an FS could result in several negative effects, such as decreased water flux and inhibition of biological activities, and proposed a strategy to reduce solute buildup [8]. Phillip et al. (2010) conducted model predictions based on experiments related to the reverse permeation in the FO operation, showing that the reverse flux selectivity, the ratio of the forward water flux to the reverse solute flux, is an important parameter in FO design [14]. This study investigated the effects of types and concentrations of DS on algal cells in terms of lipid production and settling velocity, as well as general water quality, such as pH and conductivity.
3.1. pH
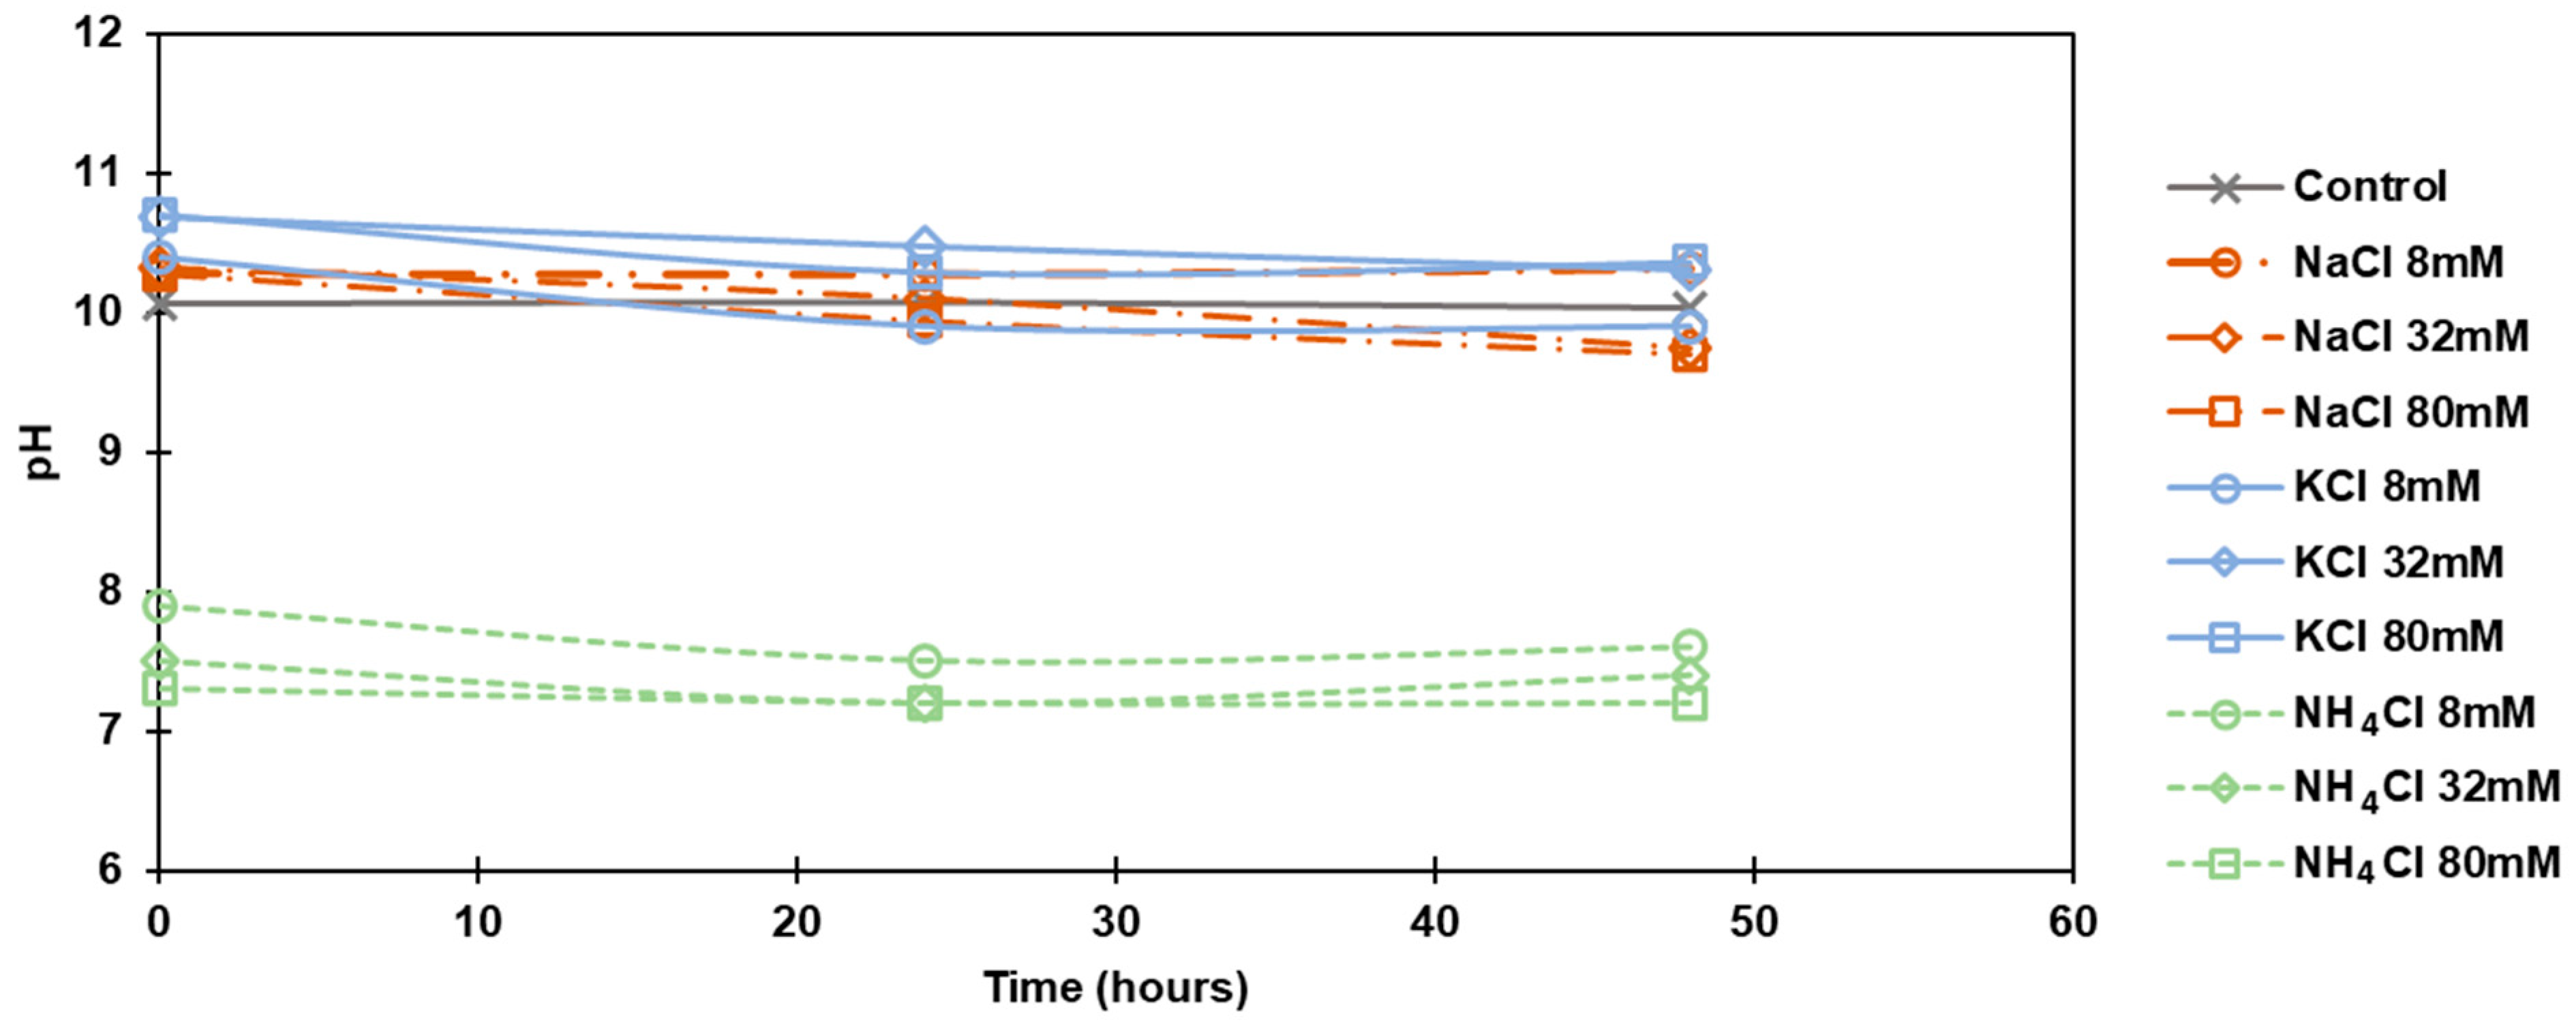
pH was found to decrease slightly with time. The initial pH of the cultivated algal solution was around 10.0 without salt. When NaCl was introduced to the algal solution, there was a 0.3 increase in pH and for KCl pH increase was about 0.2 to 0.6, while NH4Cl immediately decreased pH to a pH drop to 7.2–7.9 with the different concentrations (8, 32, and 80 mM). Figure 2 displays the pH changes in FS over time with the addition of NaCl, KCl, or NH4Cl of different concentrations.
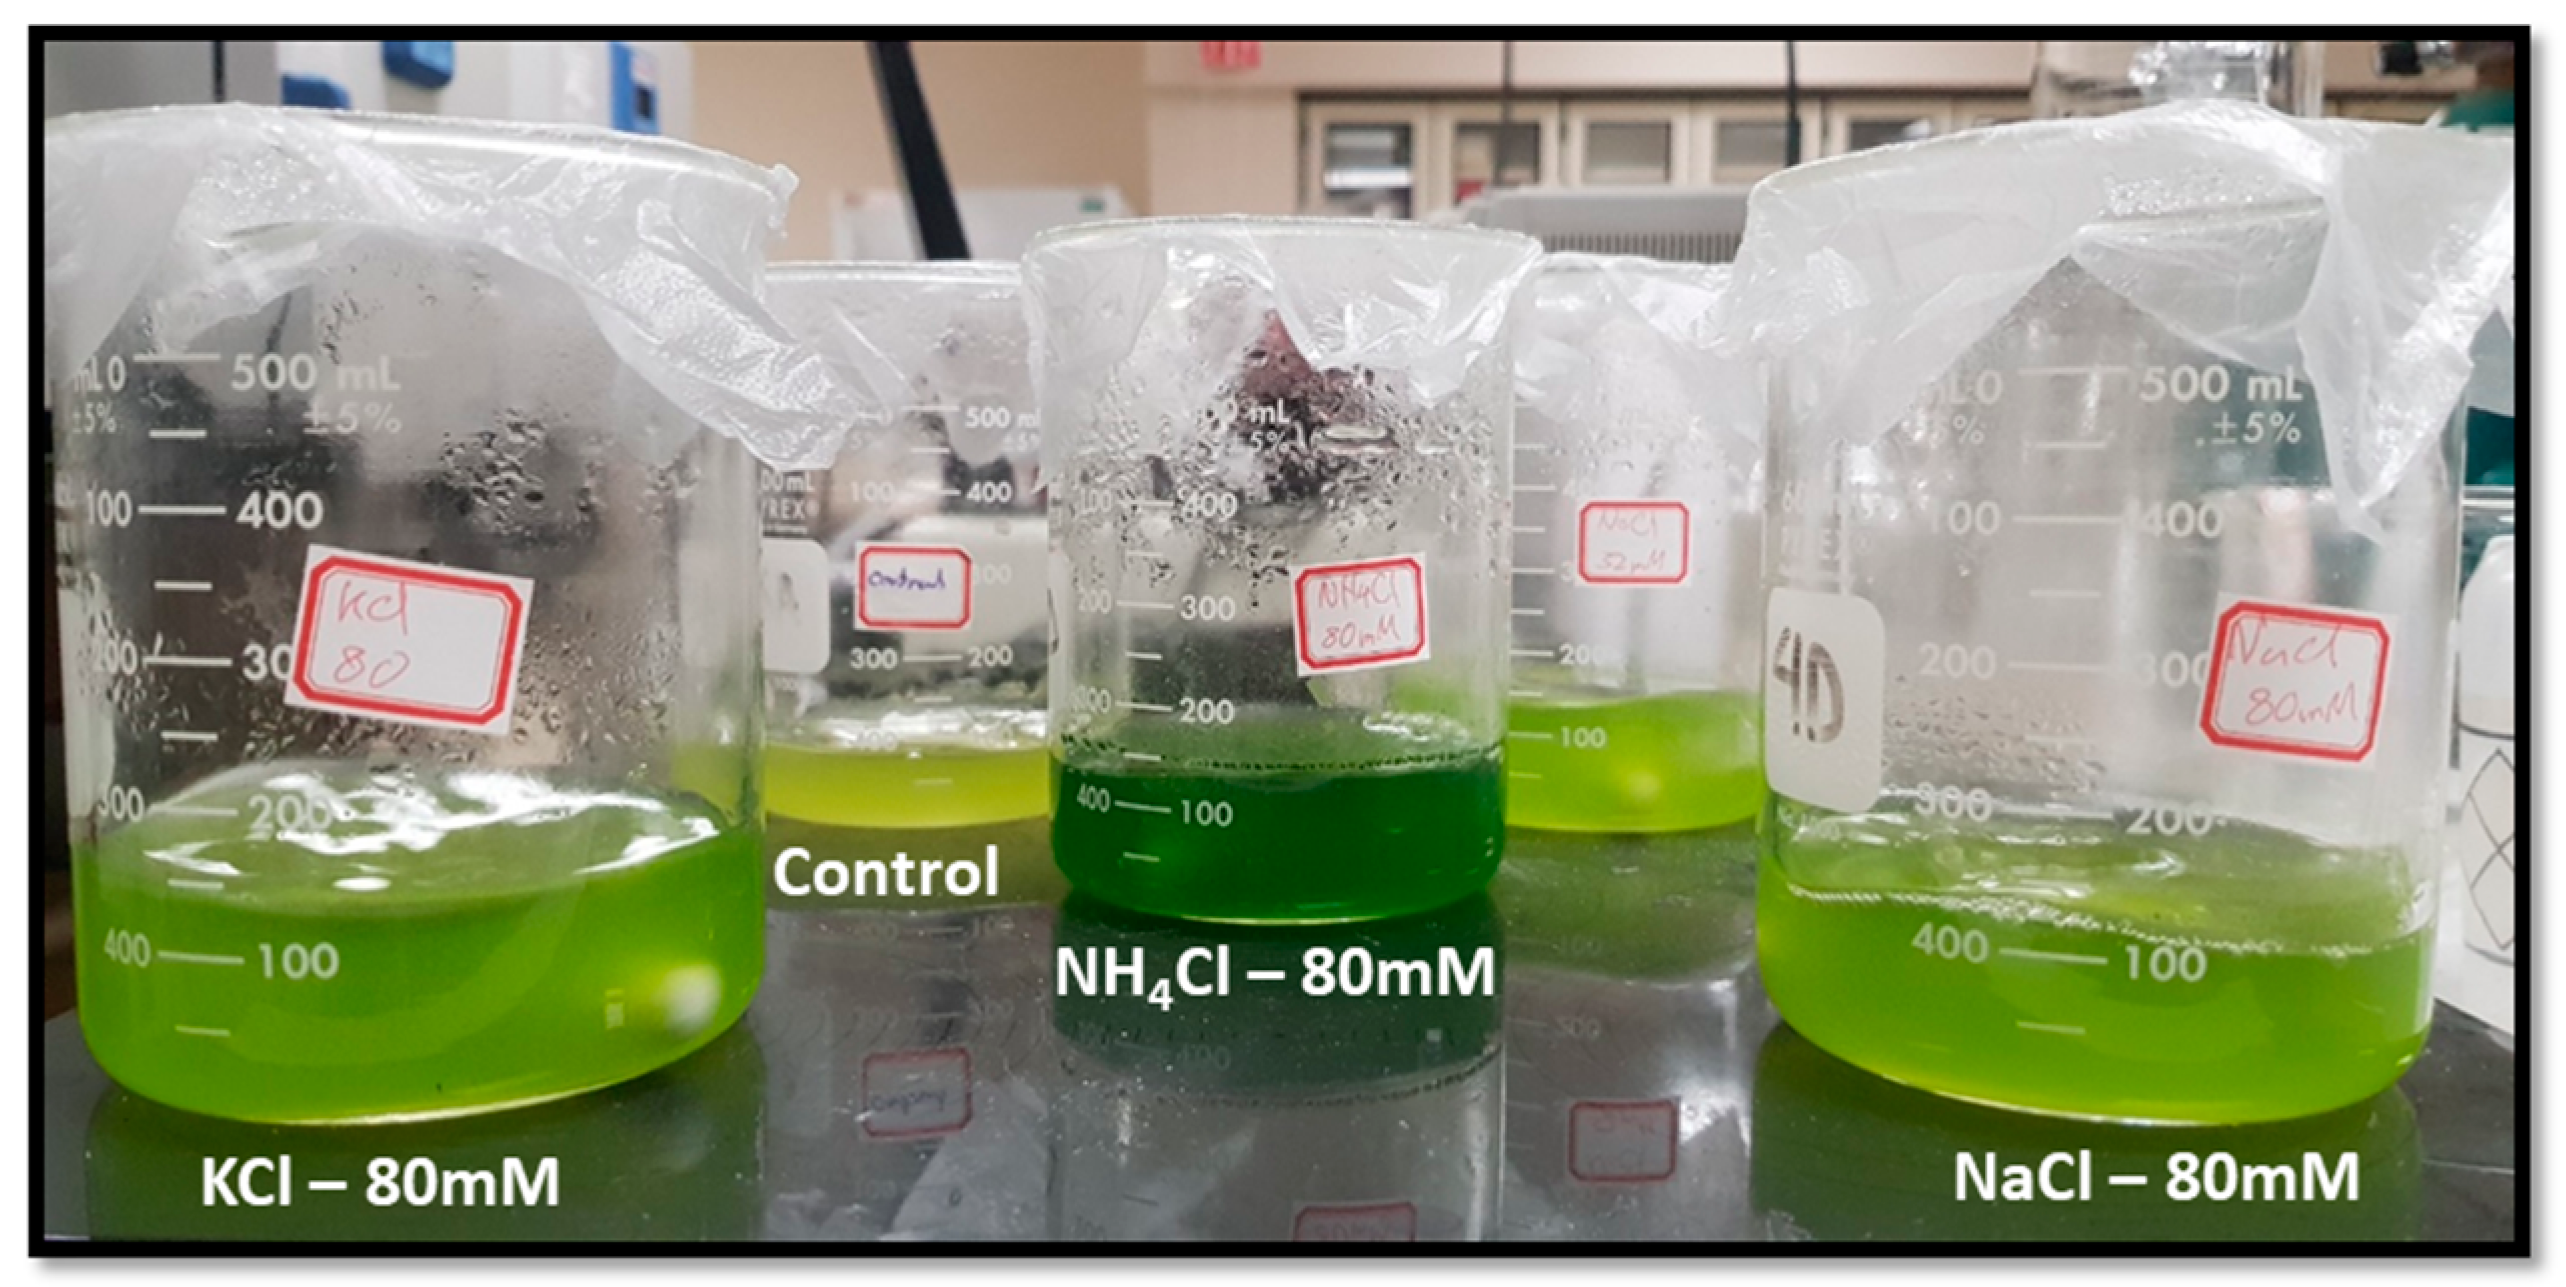
Visibly, the addition of salt changed the color of the algal solutions in FS (Figure 3). In particular, the addition of NH4Cl significantly affected algal growth, making the solution dark green, probably due to the mitosis [18]. The growth of C. vulgaris containing NH4Cl was different compared to NaCl and KCl. The addition of NH4Cl altered pH from the initial pH of 10 to the range of 7.2–7.9. The drop in pH to a neutral level showed no negative impact on the growth nor algal viability, as algae can thrive in even lower pH changes [19,20].
3.2. Conductivity
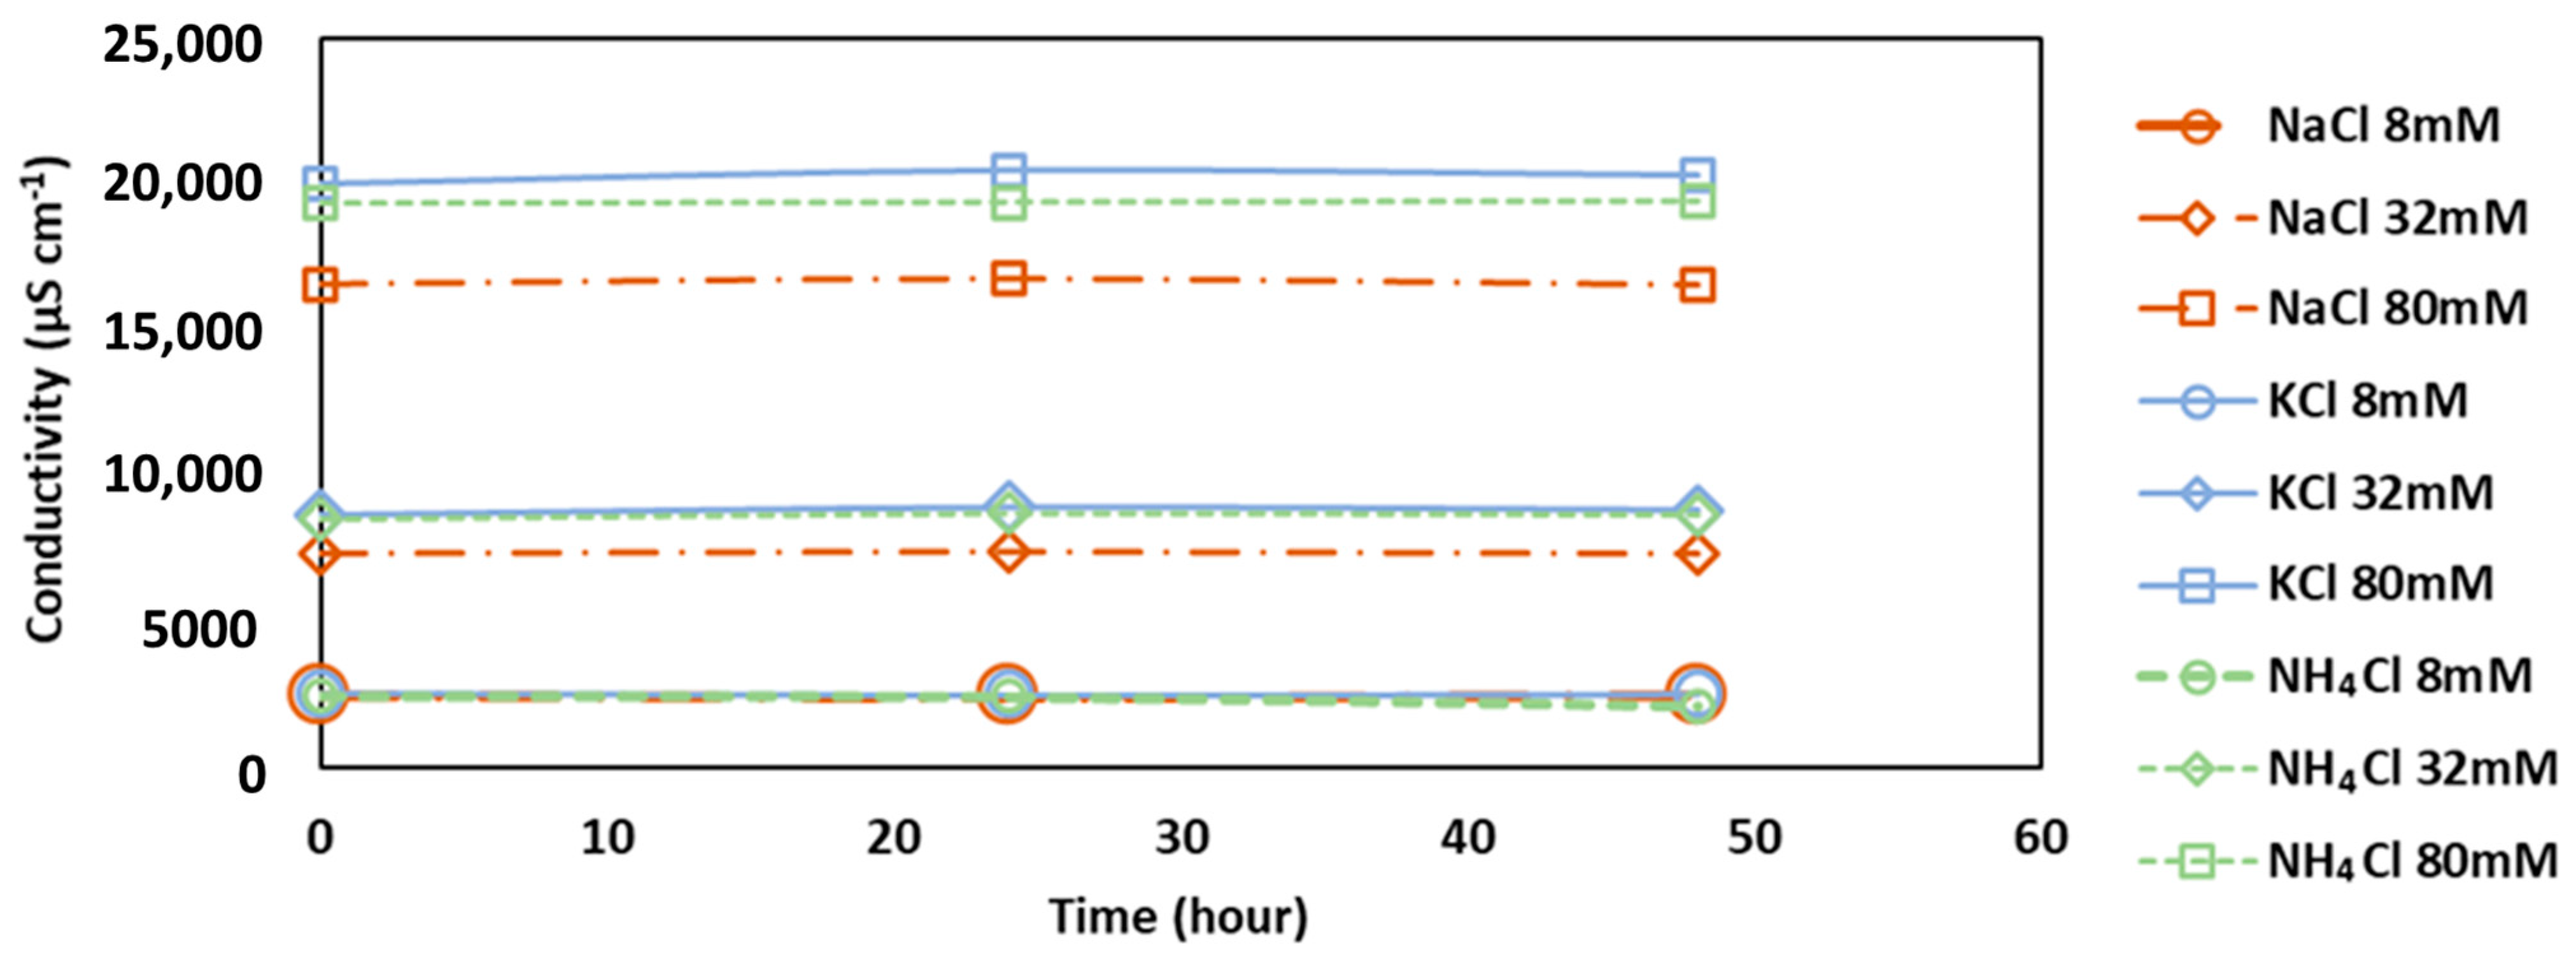
It was observed that the addition of salt as a simulated RSF affected the conductivity of algal FS, increasing the conductivity with the salt concentrations (Figure 4). Over time, the conductivity changes were also measured. At 8, 32 and 80 mM of KCl addition, the conductivity decreased 10, 160, and 300 µS cm−1, respectively, which is equivalent to about 0.4, 70 and 155 mg L−1 of KCl mg L−1 being removed. The conductivity in the FS decreased as the KCl dose increased, and this would be from the salt assimilation by algae. On the other hand, NH4Cl showed an increase in conductivity around 160–250 µS cm−1. For the conductivity increase with the addition of NH4Cl, it seems that the algal cells may release organic matters, which contributes to an increase in conductivity (equivalent to 20 mg L−1 of NaCl). It was also reported that electrolyte leakage from damaged cells could increase conductivity in the presence of an NH4Cl [21]. Another explanation can be that the addition of NH4Cl had accelerated the cell division [18]; this would have led to micro-releases of electrolytes adding to conductivity. NaCl showed no significant changes in conductivity over time.
3.3. Lipid Content
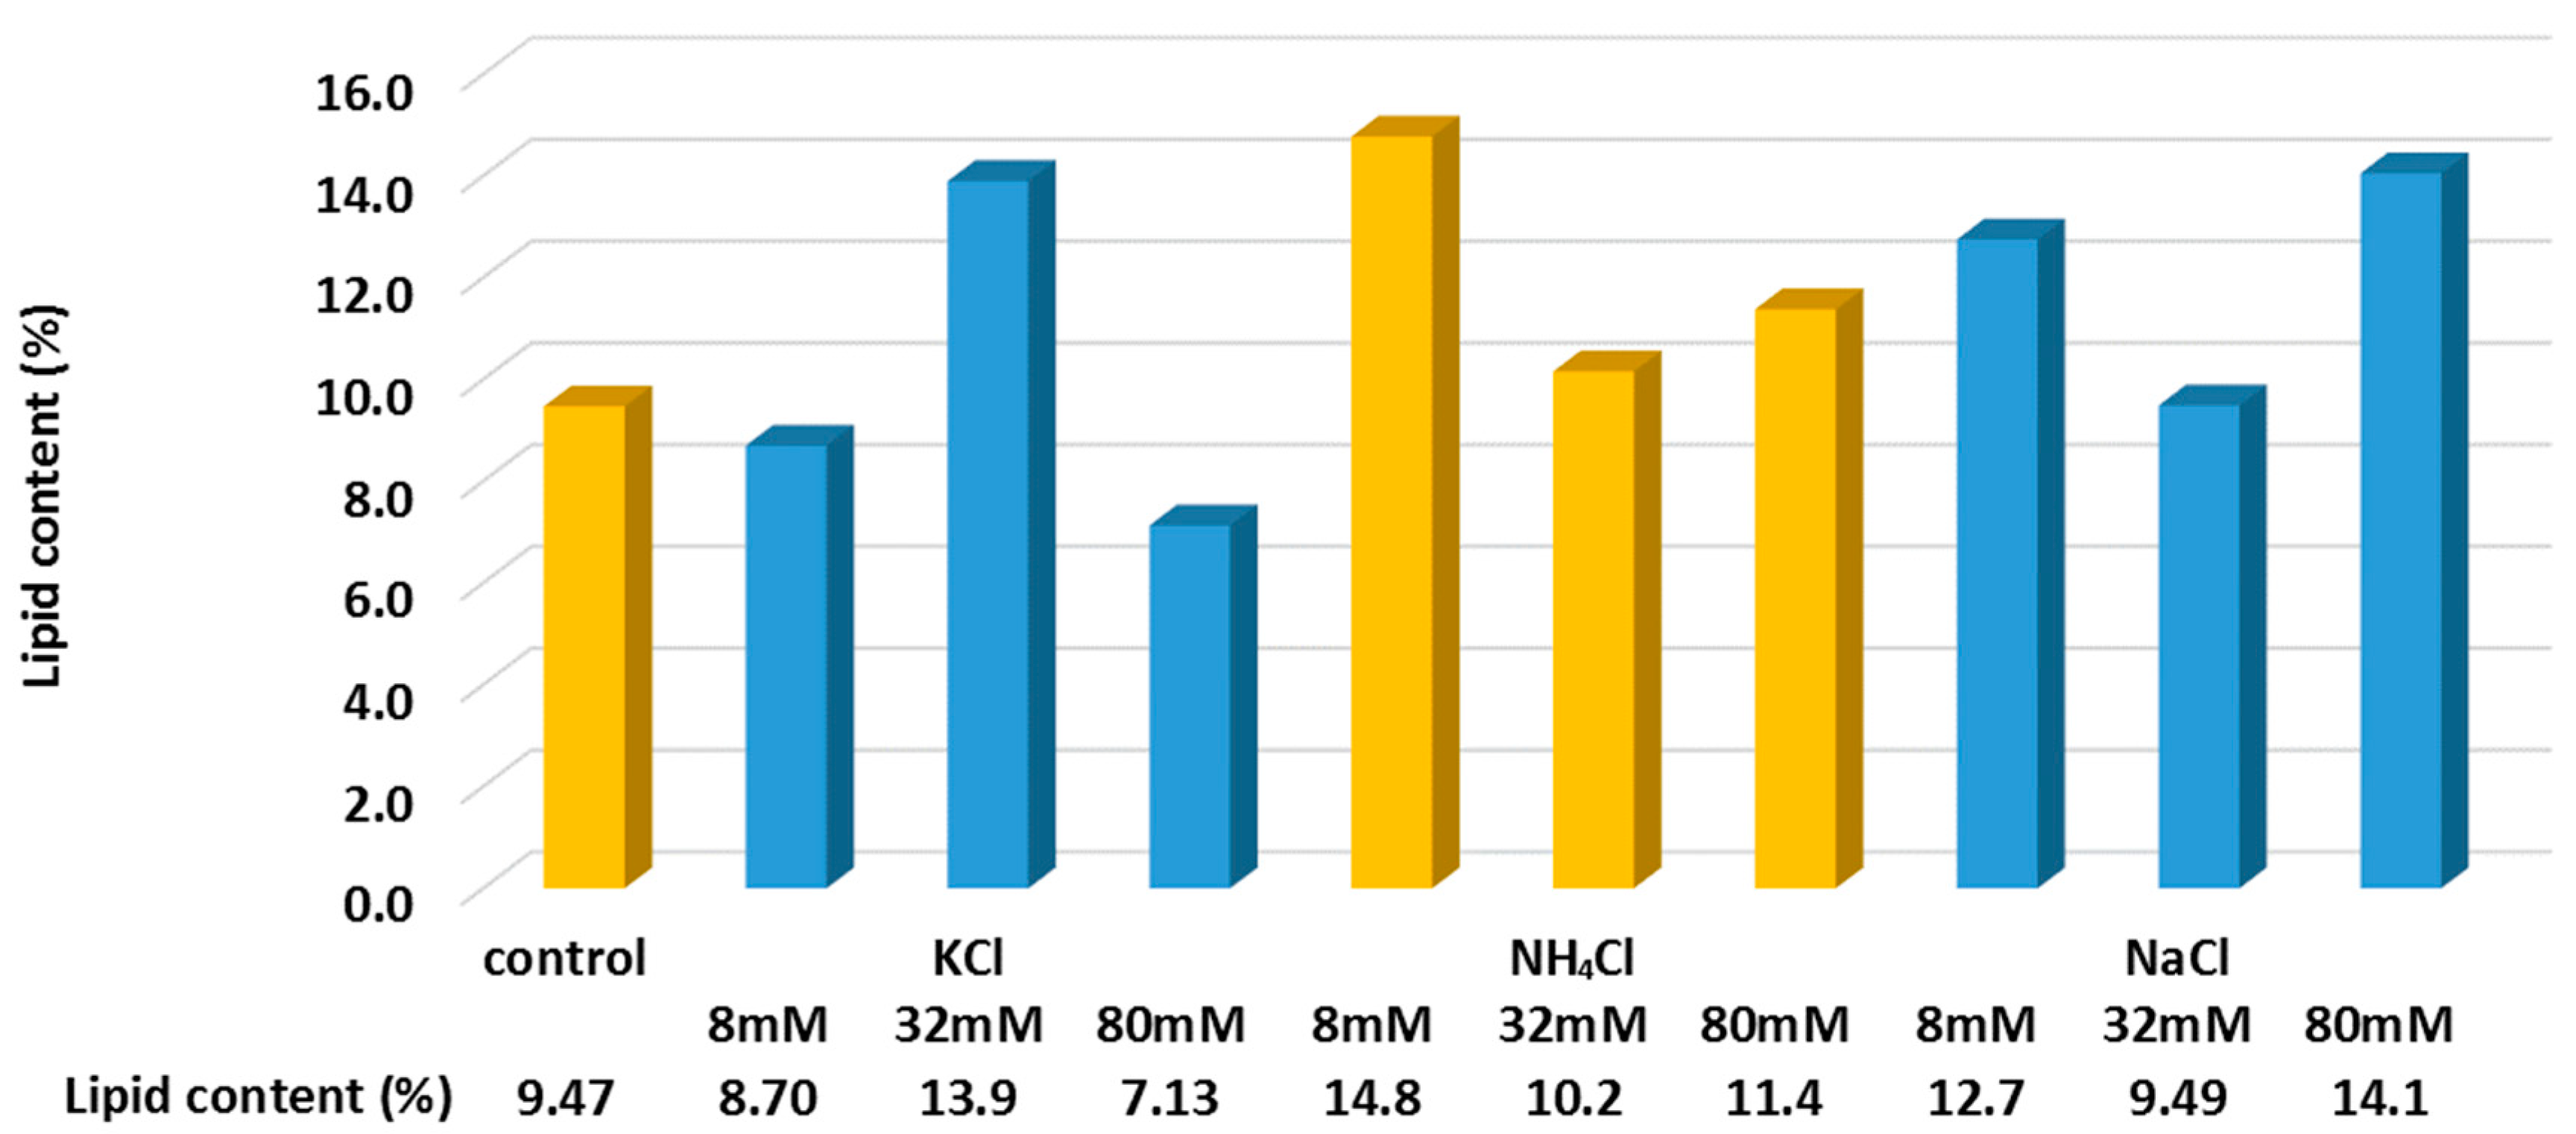
Lipid analysis was conducted at the end of the experiment (i.e., after 48 h) to investigate how RSF can affect the biofuel productivity of C. vulgaris in FS (Figure 5). For the initial concentration of 0.37 g L−1 of dry algal biomass (OD685: 3 abs), the lipid content was about 9.47% (w/w) of the algal biomass. Each salt showed a different effect on the C. vulgaris cells’ lipid accumulation. The lipid contents (%) after 48 h of the addition of KCl showed an adverse effect on lipid accumulation except for 32 mM. It is known that nitrate reductase inhibition is triggered by the presence of KCl [22], limiting the formation of protein in the algal cells and later stressing the algal to promote lipid accumulation. However, the two-day duration was not sufficient for KCl to show a clear trend in lipid cell generation. NaCl showed an increase in lipid content ranging from 0.2 to 49% with different salt concentrations between 8, 32 and 80 mM. In general, it is known that the increase in NaCl causes growth loss while enhancing the lipid accumulation [9,10,23]. This study showed that a low NaCl concentration of 8 mM for 2 days could improve the lipid accumulation of the algal cell from 9.47 to 14.8%. For ammonia, it was reported that the presence of ammonia (e.g., 2.0–2.5 mM) could function as a growth and photosynthesis inhibitor for various species of algal [24]. In this study, the concentrations of ammonia were much higher (e.g., 8, 32 and 80 mM) compared to the previous work [24], and similar to NaCl, NH4Cl showed an enhanced lipid accumulation within the two days ranging from 8 to 56%. 8 mM of NH4Cl showed the highest lipid content of 14.8%.
3.4. Settling Velocity
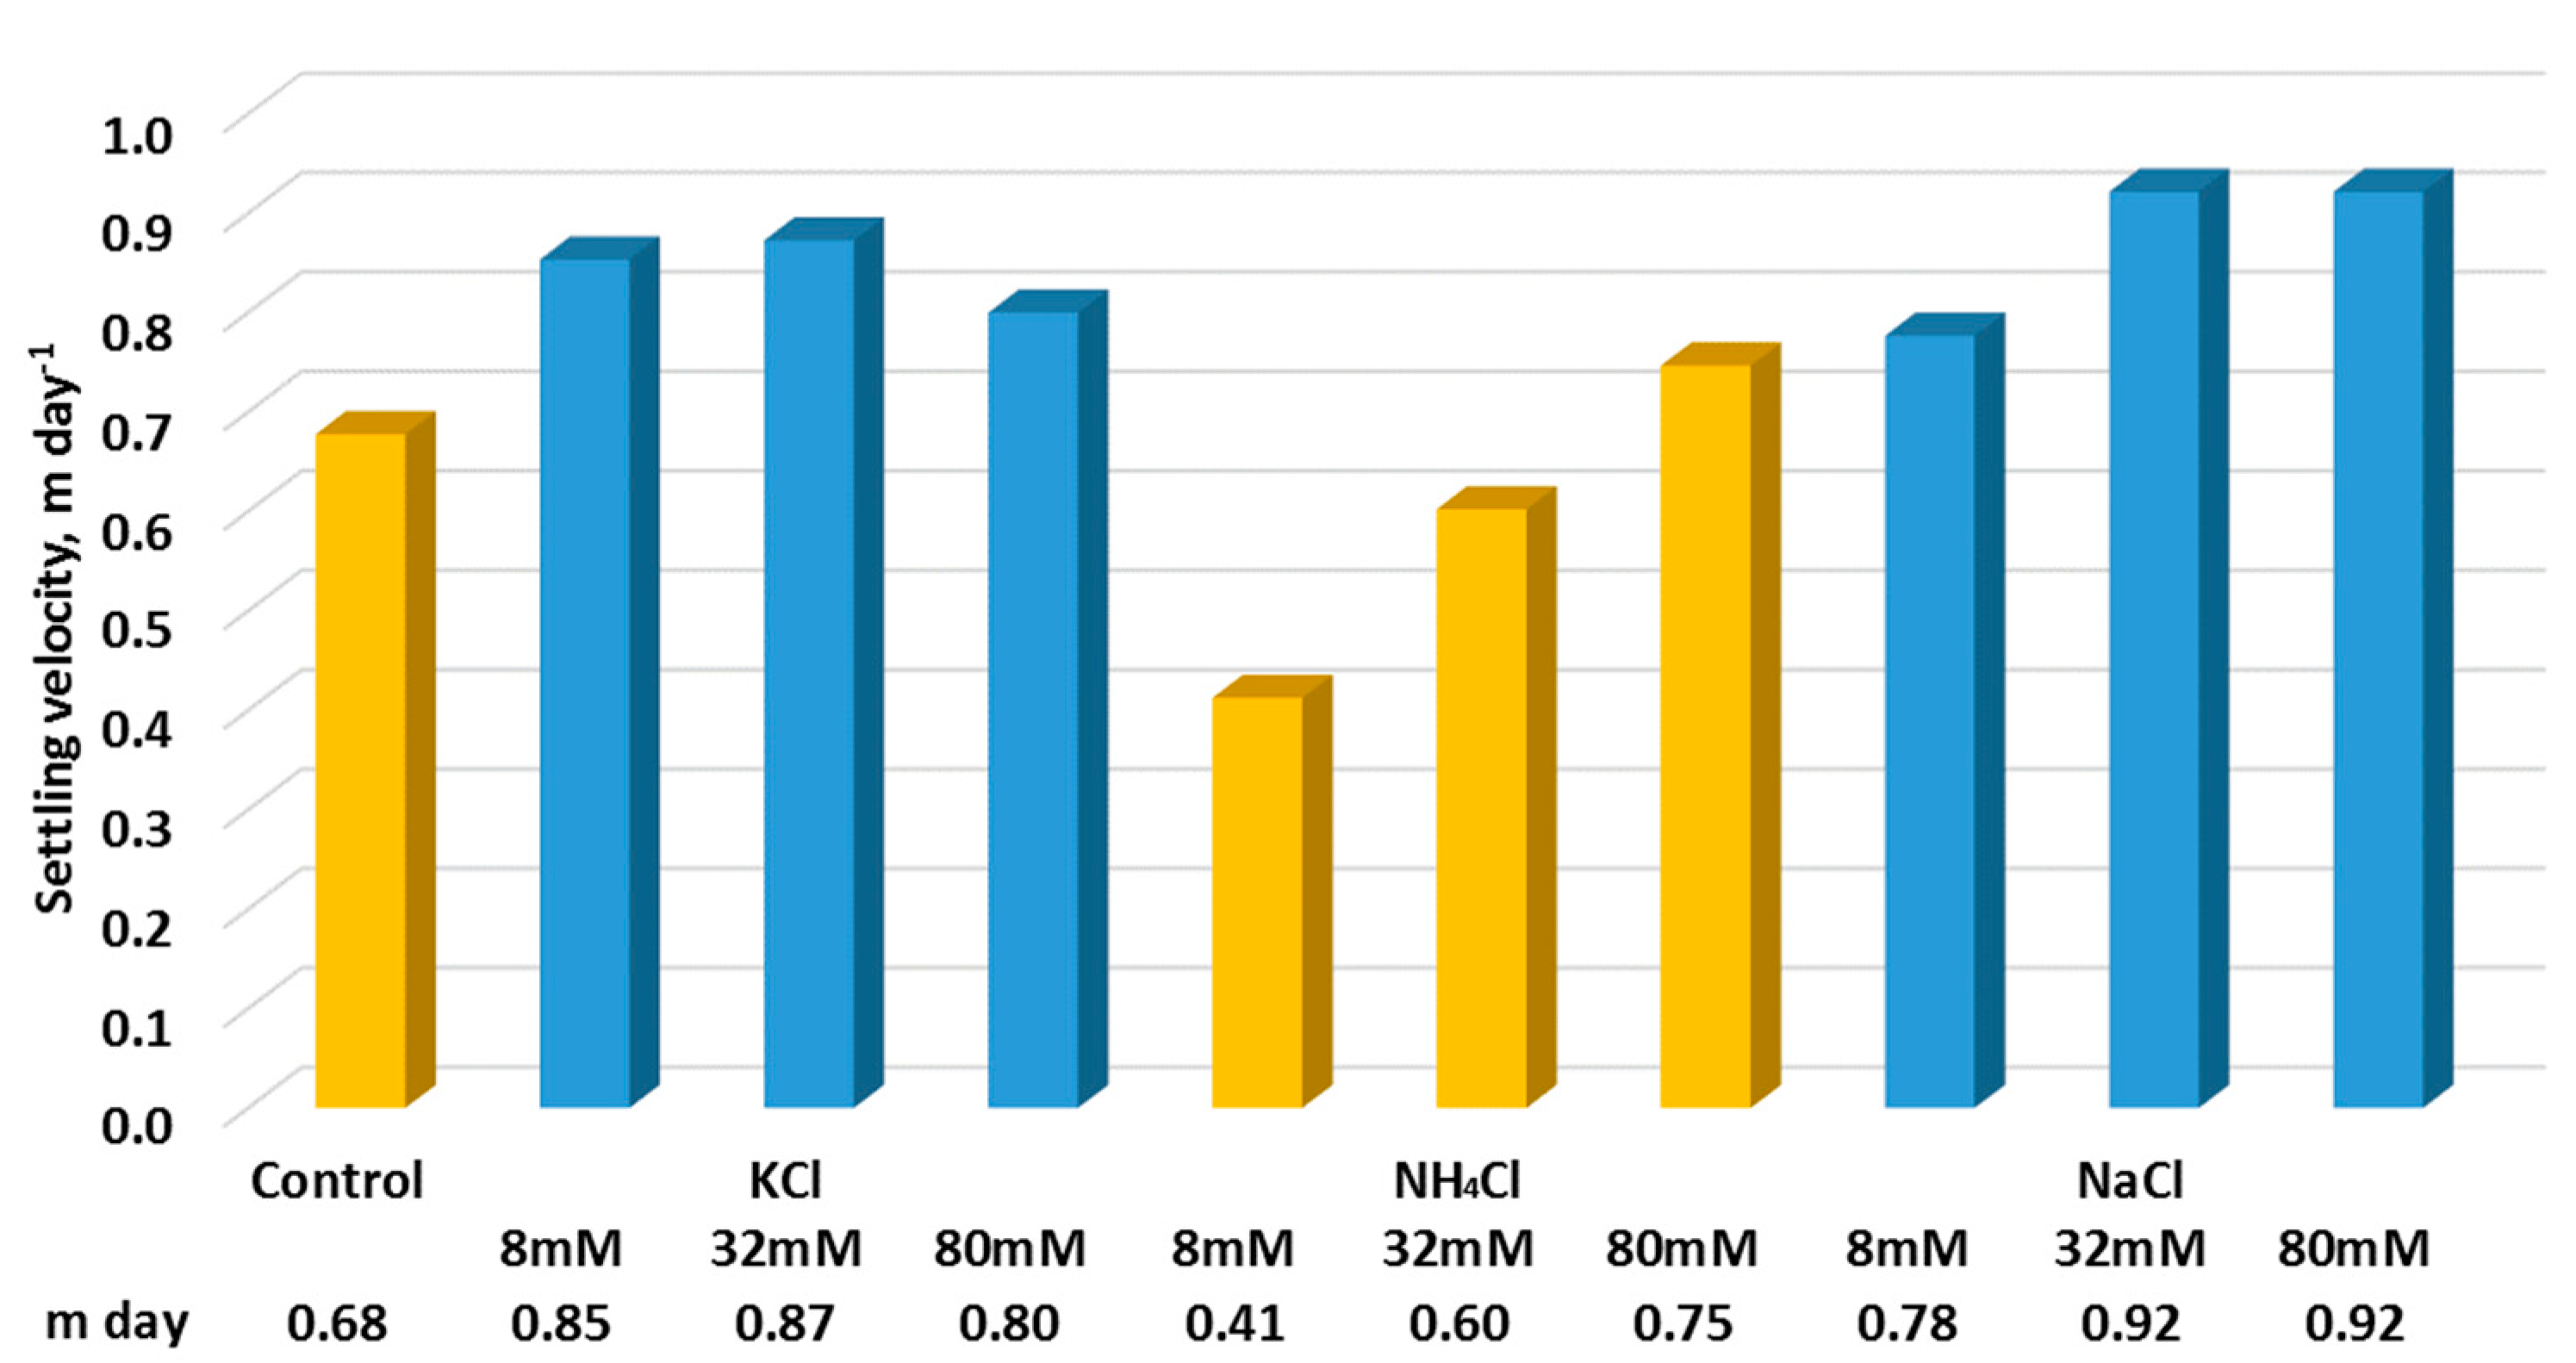
The overall trend of settling velocity showed that with the addition of KCl and NaCl increased the settling velocity (Figure 6). The increased settling velocity for KCl and NaCl may be possible, probably due to the ability of the salt to strengthen specific attributes of water, such as the density and surface tension [25], causing more resistance on the C. vulgaris. In the case of NH4Cl, the low concentration of 8 mM showed an adverse effect on the settling ability, but with the increased NH4Cl concentrations, the settling velocity was increased, but up to a similar level of the initial settling velocity.
In general, it was found that when the salt concentration increased, the settling velocity was enhanced. Even in very high concentrations (e.g., 15, 30, and 45% of NaCl), it was reported that the settling velocity was also found to increase [10]. The increase in the ionic strength seemed to enhance the settling velocity.
3.5. Algal Biomass
In the FO simulated conditions, the effect of the added salts was minimal on the algal biomass changes (Table 2). The algal cells seemed to be delayed growth by the salt effect. In the presence of KCl, there was a fluctuating change in the dry algal biomass. Compared to the initial concentration of 0.370 g L−1, the addition of 8 mM KCl showed the highest increase to 0.379 ± 0.023 g L−1. The addition of 32 mM and 80 mM KCl showed a decrease in the algal concentration to 0.377 ± 0.015 and 0.366 ± 0.012 g L−1, respectively. When NH4Cl was added to algal FS, the concentration of the algal biomass decreased to 0.358 ± 0.014 g L−1 from the initial concentration of 0.370 g L−1. NaCl had an increase in dry biomass concentration to 0.382 ± 0.009, 0.382 ± 0.009, and 0.385 ± 0.013 g L−1, respectively, after the addition of 8, 32 and 80 mM NaCl. It was found that there was a correlation between the density of the biomass (g L−1) and the settling velocity (m day−1). Lower algal biomass in FS after the addition of NH4Cl resulted in lower settling velocity.
3.6. Microscopic Investigation
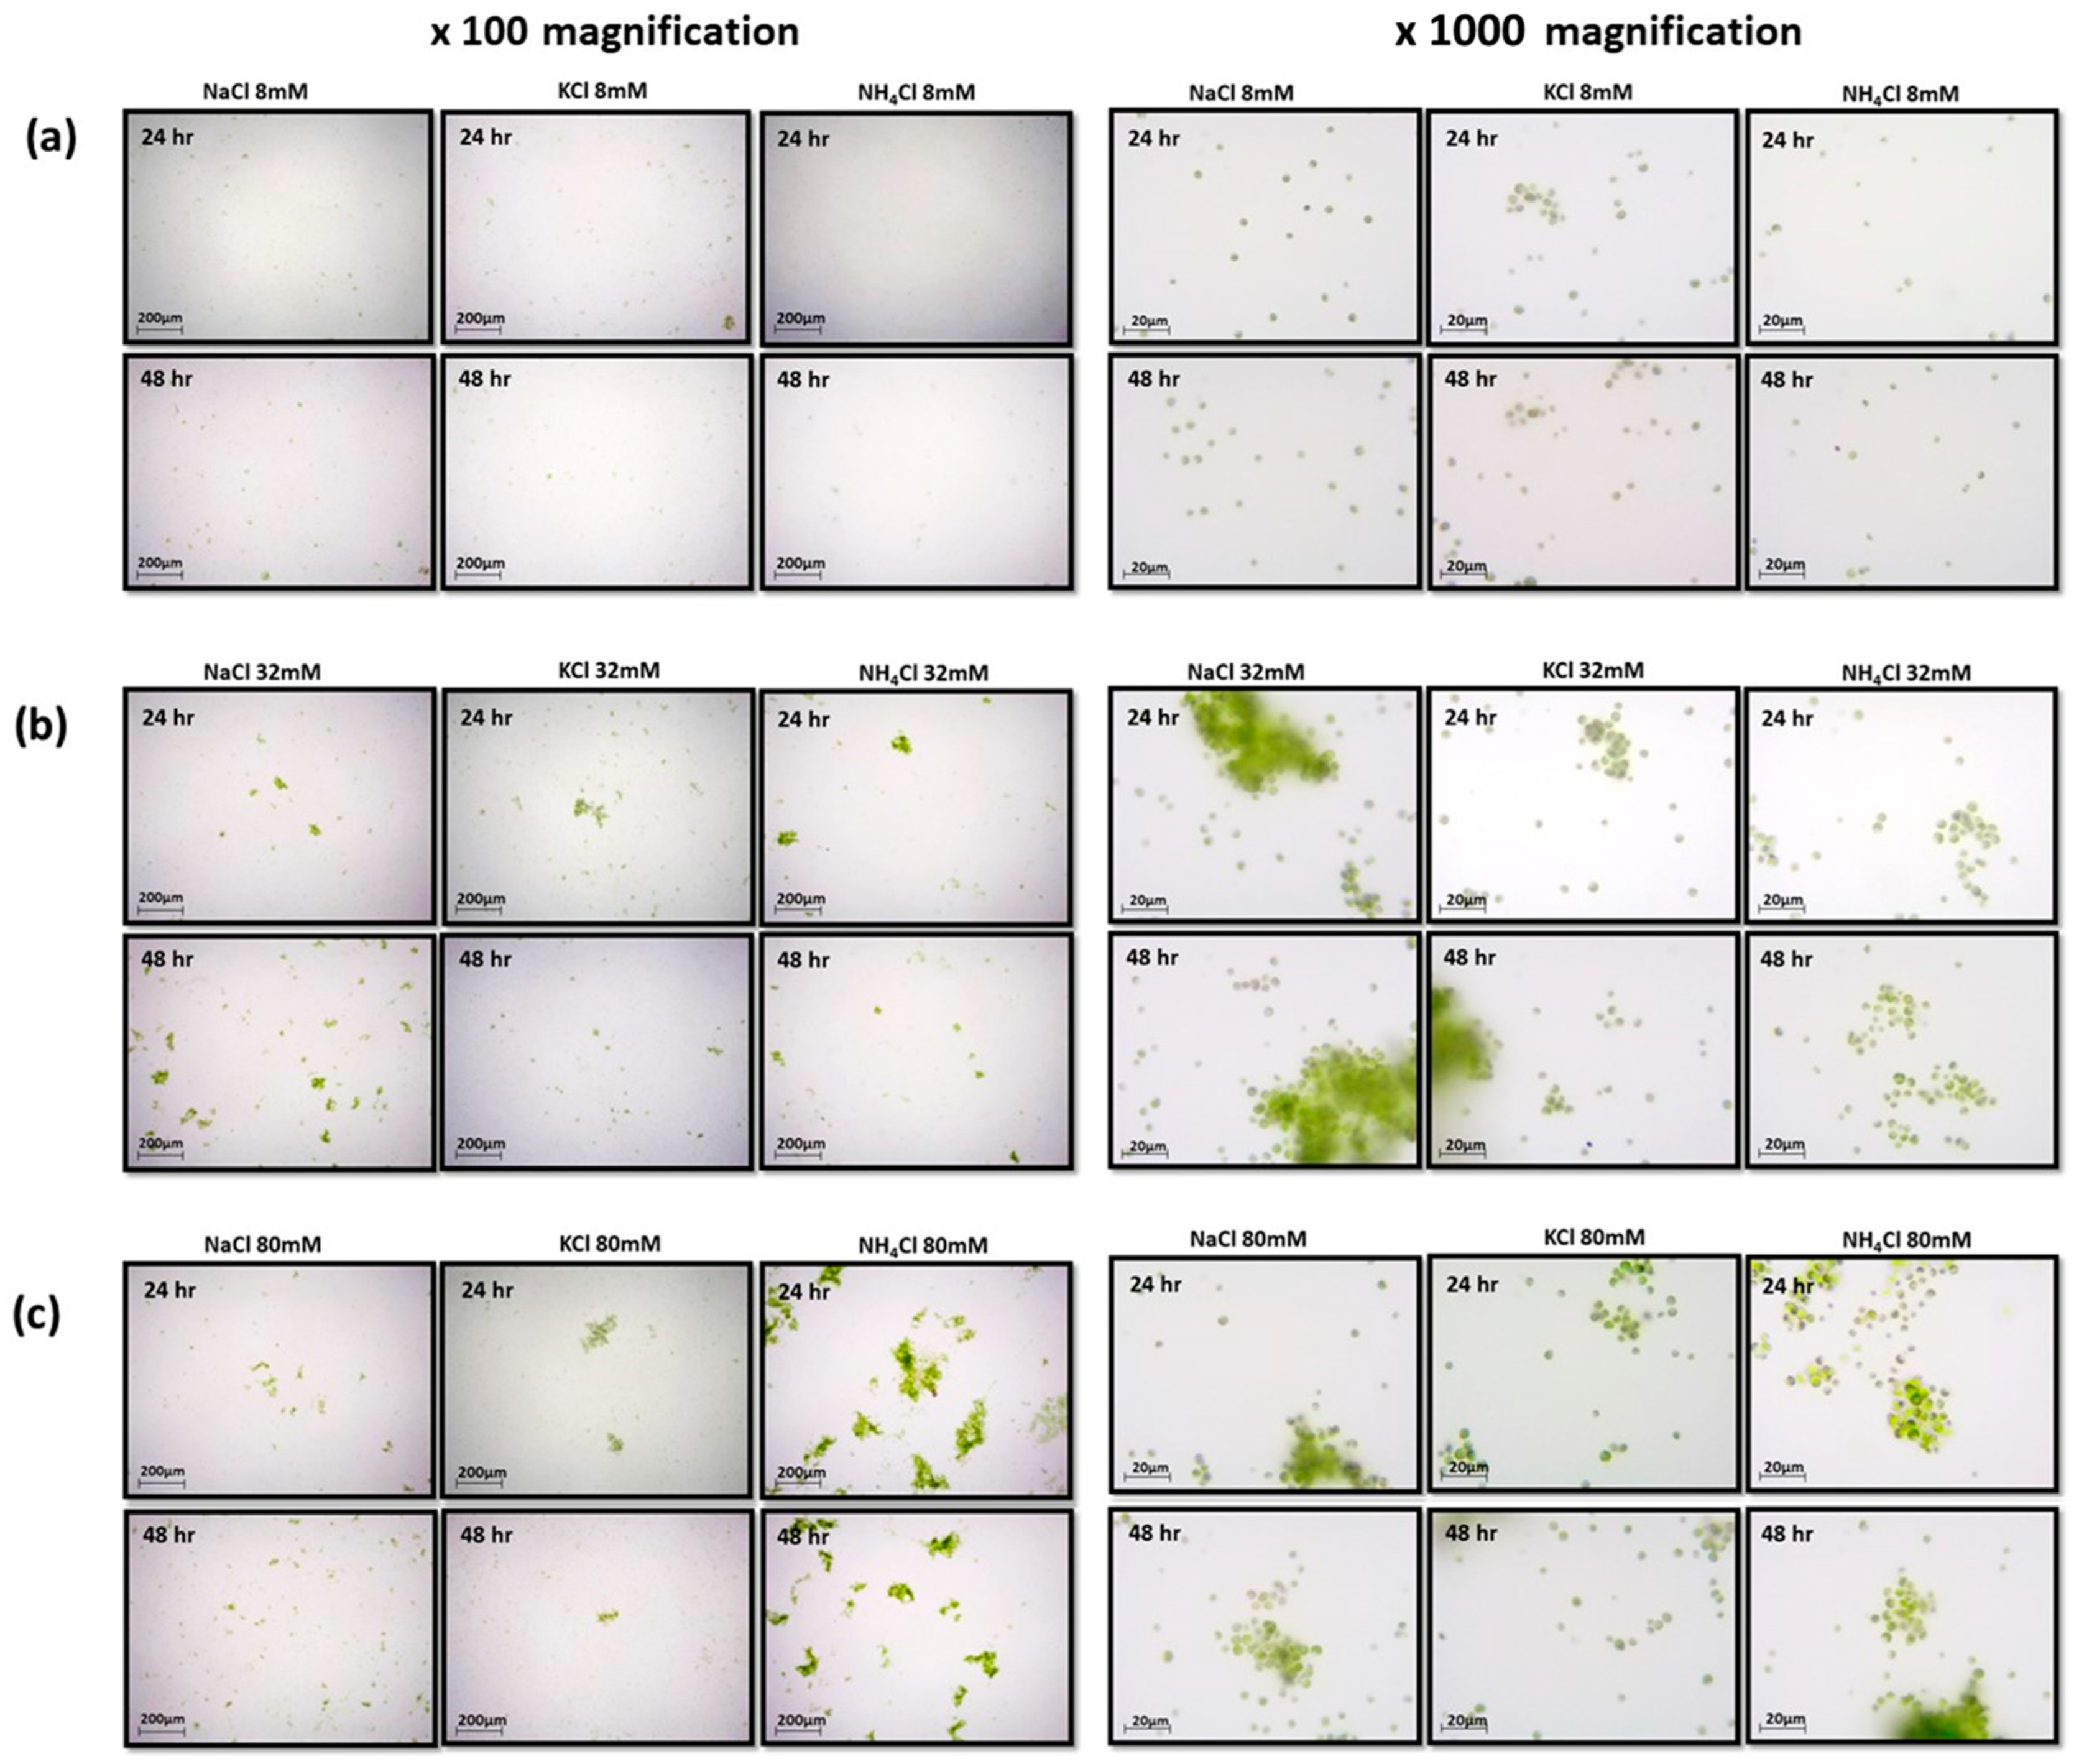
Compared to the microscopic image of algal cells before the salt application (Figure 7), microscopic images after the RSF applications showed minimal variations in the algal morphology and cell colony formation (Figure 8). The average size of C. vulgaris was 3–5 μm. The microscopic images were collected with a magnification of 100 and 1000 times. The images with 100 times magnification show an overall picture of algal cell distribution (e.g., aggregates or scattering). The microscopic images with 1000 times magnification provided details of the algal cell morphology. The control algal sample had scattered algal cells throughout the 2-day period. Duplicate samples were examined at times 0, 24 and 48 h for each salt concentration. Long-term exposure is expected to further affect growth, morphology and aggregate formation. However, based on the relatively short retention time in a FO system (e.g., a few days), it was sufficient to monitor the reactions for 48 h.
For the initial concentration of 8 mM, all samples had similar algal distribution to the control with well-distributed cells (Figure 8a). The addition of low concentrations (i.e., 8 mM) for the three salts showed no clear formation of coagulation or aggregates of cells, and no clear morphological variation was noticed for all salts. The increase in the salt concentration (e.g., 32 mM) developed more groupings of algal cells (Figure 8b). This can be an indicator of the destabilization of the algal cells’ surface charge by the addition of salts which lead to the coagulation and agglomeration of algal cells. The algal aggregate formation was observed in the solutions dosed with NaCl and less in KCl and NH4Cl, while KCl had the least grouping formation compared to NH4Cl (Figure 8b). At the high concentrations of 80 mM, NH4Cl showed large algal aggregate formation (Figure 8c). For NH4Cl, it appears that there was an accelerated cell division, and this phenomenon could have caused algal cells to develop settling resistance in addition to algal cell excretions (e.g., dissolved organic matter). NaCl and KCl also showed an increase in the formation of algal aggregates compared to concentrations of 8 and 32 mM. The microscopic images with a magnification of 1000 times showed that the increase of dose to 80 mM showed a more aggregate of algal cells (Figure 8c).
4. Conclusions
During the operation of FO, C. vulgaris microalgae, with its high potential for biofuel production, can develop morphological and compositional alteration when subjected to RSF within a short time frame. This study simulated the RSF with the addition of different types of salt and concentrations to the algal FS. Overall, C. vulgaris showed a static growth phase while increasing lipid contents in algal biomass up to 14.8% in two days. The settling velocity of the algal cells was found to improve with the increase of salt content from 8 to 80 mM up to 38%. It was found that NH4Cl can accelerate C. vulgaris cell division, altering the cell size distribution and reducing the settleability of the algal particles in the solution. pH was found to be within the optimal algal thriving pH (7.2–10.6), but the presence of salt stressed the microalgae, which inhibited growth and photosynthesis. Such a study can contribute to determining the future treatment of the algal product and its suitable usage. The RSF caused by DS in an FO was found to modify algal cell characteristics; future work should monitor algal cell components (e.g., protein, carbohydrates and lipid content) in FO operations, with microbial fatty acid profiles and amino acid composition analyses to determine the optimal algal use as a final product.
Author Contributions
Conceptualization, F.M.M. and W.H.L.; methodology, F.M.M.; validation, F.M.M.; formal analysis, F.M.M.; data curation, F.M.M.; writing—original draft preparation, F.M.M.; writing—review and editing, J.-H.H., S.S. and W.H.L.; visualization, F.M.M.; supervision, W.H.L.; project administration, W.H.L.; funding acquisition, W.H.L. All authors have read and agreed to the published version of the manuscript.
Funding
This work was supported by the U.S. Environmental Protection Agency [Grant Number: SU836132].
Data Availability Statement
All data included in this study are available upon request by contact with the corresponding author.
Conflicts of Interest
The authors declare no conflict of interest.
References
- Lv, J.-M.; Cheng, L.-H.; Xu, X.-H.; Zhang, L.; Chen, H.-L. Enhanced lipid production of Chlorella vulgaris by adjustment of cultivation conditions. Bioresour. Technol. 2010, 101, 6797–6804. [Google Scholar] [CrossRef] [PubMed]
- Wang, Y.; Guo, W.; Yen, H.-W.; Ho, S.-H.; Lo, Y.-C.; Cheng, C.-L.; Ren, N.; Chang, J.-S. Cultivation of Chlorella vulgaris JSC-6 with swine wastewater for simultaneous nutrient/COD removal and carbohydrate production. Bioresour. Technol. 2015, 198, 619–625. [Google Scholar] [CrossRef] [PubMed]
- Hwang, J.-H.; Church, J.; Lee, S.-J.; Park, J.; Lee, W.H. Use of microalgae for advanced wastewater treatment and sustainable bioenergy generation. Environ. Eng. Sci. 2016, 33, 882–897. [Google Scholar] [CrossRef] [Green Version]
- Azov, Y. Effect of pH on inorganic carbon uptake in algal cultures. Appl. Environ. Microbiol. 1982, 43, 1300–1306. [Google Scholar] [CrossRef] [Green Version]
- Ge, Q.; Ling, M.; Chung, T.-S. Draw solutions for forward osmosis processes: Developments, challenges, and prospects for the future. J. Membr. Sci. 2013, 442, 225–237. [Google Scholar] [CrossRef]
- Phuntsho, S.; Shon, H.K.; Hong, S.; Lee, S.; Vigneswaran, S. A novel low energy fertilizer driven forward osmosis desalination for direct fertigation: Evaluating the performance of fertilizer draw solutions. J. Membr. Sci. 2011, 375, 172–181. [Google Scholar] [CrossRef]
- Munshi, F.M.; Church, J.; McLean, R.; Maier, N.; Sadmani, A.H.M.A.; Duranceau, S.J.; Lee, W.H. Dewatering algae using an aquaporin-based polyethersulfone forward osmosis membrane. Sep. Purif. Technol. 2018, 204, 154–161. [Google Scholar] [CrossRef]
- Ferby, M.; Zou, S.; He, Z. Reduction of reverse solute flux induced solute buildup in the feed solution of forward osmosis. Environ. Sci. Water Res. Technol. 2020, 6, 423–435. [Google Scholar] [CrossRef]
- Yeesang, C.; Cheirsilp, B. Effect of nitrogen, salt, and iron content in the growth medium and light intensity on lipid production by microalgae isolated from freshwater sources in Thailand. Bioresour. Technol. 2011, 102, 3034–3040. [Google Scholar] [CrossRef]
- Church, J.; Hwang, J.-H.; Kim, K.-T.; McLean, R.; Oh, Y.-K.; Nam, B.; Joo, J.C.; Lee, W.H. Effect of salt type and concentration on the growth and lipid content of Chlorella vulgaris in synthetic saline wastewater for biofuel production. Bioresour. Technol. 2017, 243, 147–153. [Google Scholar] [CrossRef]
- Yeh, K.-L.; Chang, J.-S. Effects of cultivation conditions and media composition on cell growth and lipid productivity of indigenous microalga Chlorella vulgaris ESP-31. Bioresour. Technol. 2012, 105, 120–127. [Google Scholar] [CrossRef] [PubMed]
- Discart, V.; Bilad, M.R.; Marbelia, L.; Vankelecom, I.F.J. Impact of changes in broth composition on Chlorella vulgaris cultivation in a membrane photobioreactor (MPBR) with permeate recycle. Bioresour. Technol. 2014, 152, 321–328. [Google Scholar] [CrossRef] [PubMed]
- Sudhir, P.; Murthy, S.D.S. Effects of salt stress on basic processes of photosynthesis. Photosynthetica 2004, 42, 481–486. [Google Scholar] [CrossRef]
- Phillip, W.A.; Yong, J.S.; Elimelech, M. Reverse Draw Solute Permeation in Forward Osmosis: Modeling and Experiments. Environ. Sci. Technol. 2010, 44, 5170–5176. [Google Scholar] [CrossRef]
- Kline, L.M.; Hayes, D.G.; Womac, A.R.; Labbe, N. Simplified determination of lignin content in hard and soft woods via UV-spectrophotometric analysis of biomass dissolved in ionic liquids. BioResources 2010, 5, 1366–1383. [Google Scholar]
- Stein, J.R. Handbook of Phycological Methods: Culture Methods and Growth Measurements; CUP Archive: Cambridge, UK, 1979; Volume 1. [Google Scholar]
- Bligh, E.G.; Dyer, W.J. A rapid method of total lipid extraction and purification. Can. J. Biochem. Physiol. 1959, 37, 911–917. [Google Scholar] [CrossRef]
- McAuley, P.; Cook, C. Effects of host feeding and dissolved ammonium on cell division and nitrogen status of zooxanthellae in the hydroid Myrionema amboinense. Mar. Biol. 1994, 121, 343–348. [Google Scholar] [CrossRef]
- Hargreaves, J.; Whitton, B. Effect of pH on growth of acid stream algae. Br. Phycol. J. 1976, 11, 215–223. [Google Scholar] [CrossRef] [Green Version]
- Mayo, A.W. Effects of temperature and pH on the kinetic growth of unialga Chlorella vulgaris cultures containing bacteria. Water Environ. Res. 1997, 69, 64–72. [Google Scholar] [CrossRef]
- Liu, J.; Xiong, Z.; Li, T.; Huang, H. Bioaccumulation and ecophysiological responses to copper stress in two populations of Rumex dentatus L. from Cu contaminated and non-contaminated sites. Environ. Exp. Bot. 2004, 52, 43–51. [Google Scholar] [CrossRef]
- Heimer, Y.M. The effects of sodium chloride, potassium chloride and glycerol on the activity of nitrate reductase of a salt-tolerant and two non-tolerant plants. Planta 1973, 113, 279–281. [Google Scholar] [CrossRef] [PubMed]
- Heredia-Arroyo, T.; Wei, W.; Ruan, R.; Hu, B. Mixotrophic cultivation of Chlorella vulgaris and its potential application for the oil accumulation from non-sugar materials. Biomass Bioenergy 2011, 35, 2245–2253. [Google Scholar] [CrossRef]
- Abeliovich, A.; Azov, Y. Toxicity of ammonia to algae in sewage oxidation ponds. Appl. Environ. Microbiol. 1976, 31, 801–806. [Google Scholar] [CrossRef] [PubMed] [Green Version]
- Winkler, M.K.H.; Bassin, J.P.; Kleerebezem, R.; van der Lans, R.G.J.M.; van Loosdrecht, M.C.M. Temperature and salt effects on settling velocity in granular sludge technology. Water Res. 2012, 46, 5445–5451. [Google Scholar] [CrossRef] [PubMed]
Figure 1.
Permeate flux and reverse salt flux (RSF) on a FO membrane configuration. Internal and external concentration polarization (ICP and ECP) in a FO membrane selective layer FO.
Figure 1.
Permeate flux and reverse salt flux (RSF) on a FO membrane configuration. Internal and external concentration polarization (ICP and ECP) in a FO membrane selective layer FO.

Figure 2.
pH changes in FS over time with the addition of NaCl, KCl and NH4Cl of different salt concentrations.
Figure 2.
pH changes in FS over time with the addition of NaCl, KCl and NH4Cl of different salt concentrations.

Figure 3.
The visual effects of different salts (simulating RSF in a FO operation) on color changes of the C. vulgaris solutions. The picture was taken after 2 days of the addition of salts.
Figure 3.
The visual effects of different salts (simulating RSF in a FO operation) on color changes of the C. vulgaris solutions. The picture was taken after 2 days of the addition of salts.

Figure 4.
Conductivity changes of FS over time for the addition of NaCl, KCl and NH4Cl under different salt concentrations. Original algae conductivity was 750 ± 50 µS cm−1.
Figure 4.
Conductivity changes of FS over time for the addition of NaCl, KCl and NH4Cl under different salt concentrations. Original algae conductivity was 750 ± 50 µS cm−1.

Figure 5.
Lipid content (%) change in algal biomass in FS after 2 days of the addition of NaCl, KCl, and NH4Cl under different salt concentrations.
Figure 5.
Lipid content (%) change in algal biomass in FS after 2 days of the addition of NaCl, KCl, and NH4Cl under different salt concentrations.

Figure 6.
Settling velocity of C. vulgaris subjected to different salt concentrations of NaCl, KCl and NH4Cl.
Figure 6.
Settling velocity of C. vulgaris subjected to different salt concentrations of NaCl, KCl and NH4Cl.

Figure 7.
Microscopic images (×1000 time magnification) of the control algal FS.

Figure 8.
Microscopic images (×100 and ×1000 time magnification) of the algal FS after 48 h of exposure to different salt concentrations (NaCl, KCl and NH4Cl): (a) 8 mM, (b) 32 mM, and (c) 80 mM.
Figure 8.
Microscopic images (×100 and ×1000 time magnification) of the algal FS after 48 h of exposure to different salt concentrations (NaCl, KCl and NH4Cl): (a) 8 mM, (b) 32 mM, and (c) 80 mM.


Table 1.
Experimental conditions to test the effect of DS salts on algae.
| Draw Solution (mM) | Draw Solution (mg L−1) | Feed Solution (g L−1) | ||
|---|---|---|---|---|
| NaCl | KCl | NH4Cl | ||
| 8 | 467.5 | 596.4 | 427.9 | 0.37 dry C. vulgaris biomass |
| 32 | 1870.1 | 2385.6 | 1711.7 | |
| 80 | 4675.2 | 5964.1 | 4279.3 | |
Table 2.
Algal biomass (dry biomass, g L−1) changes with different salt concentrations. The initial concentration was 0.370 g L−1.
Table 2.
Algal biomass (dry biomass, g L−1) changes with different salt concentrations. The initial concentration was 0.370 g L−1.
| KCl | NH4Cl | NaCl | |
|---|---|---|---|
| 8 mM | 0.379 ± 0.023 | 0.358 ± 0.014 | 0.382 ± 0.009 |
| 32 mM | 0.377 ± 0.015 | 0.361 ± 0.007 | 0.382 ± 0.009 |
| 80 mM | 0.366 ± 0.012 | 0.358 ± 0.014 | 0.385 ± 0.013 |
Disclaimer/Publisher’s Note: The statements, opinions and data contained in all publications are solely those of the individual author(s) and contributor(s) and not of MDPI and/or the editor(s). MDPI and/or the editor(s) disclaim responsibility for any injury to people or property resulting from any ideas, methods, instructions or products referred to in the content. |
© 2023 by the authors. Licensee MDPI, Basel, Switzerland. This article is an open access article distributed under the terms and conditions of the Creative Commons Attribution (CC BY) license (https://creativecommons.org/licenses/by/4.0/).
Share and Cite
MDPI and ACS Style
Munshi, F.M.; Hwang, J.-H.; Stoll, S.; Lee, W.H. Reverse Salt Flux Effect on Dewatering Chlorella vulgaris in a Forward Osmosis System. Water 2023, 15, 1462. https://doi.org/10.3390/w15081462
AMA Style
Munshi FM, Hwang J-H, Stoll S, Lee WH. Reverse Salt Flux Effect on Dewatering Chlorella vulgaris in a Forward Osmosis System. Water. 2023; 15(8):1462. https://doi.org/10.3390/w15081462
Chicago/Turabian StyleMunshi, Faris M., Jae-Hoon Hwang, Stephanie Stoll, and Woo Hyoung Lee. 2023. "Reverse Salt Flux Effect on Dewatering Chlorella vulgaris in a Forward Osmosis System" Water 15, no. 8: 1462. https://doi.org/10.3390/w15081462
Note that from the first issue of 2016, this journal uses article numbers instead of page numbers. See further details here.