

Degradation of Dimethylacetamide from Membrane Production through Constructed Wetlands—Pathways, Ecotoxicological Effects and Consequences for Chemical Analysis
 ,
,
Abstract
:1. Introduction
2. Materials and Methods
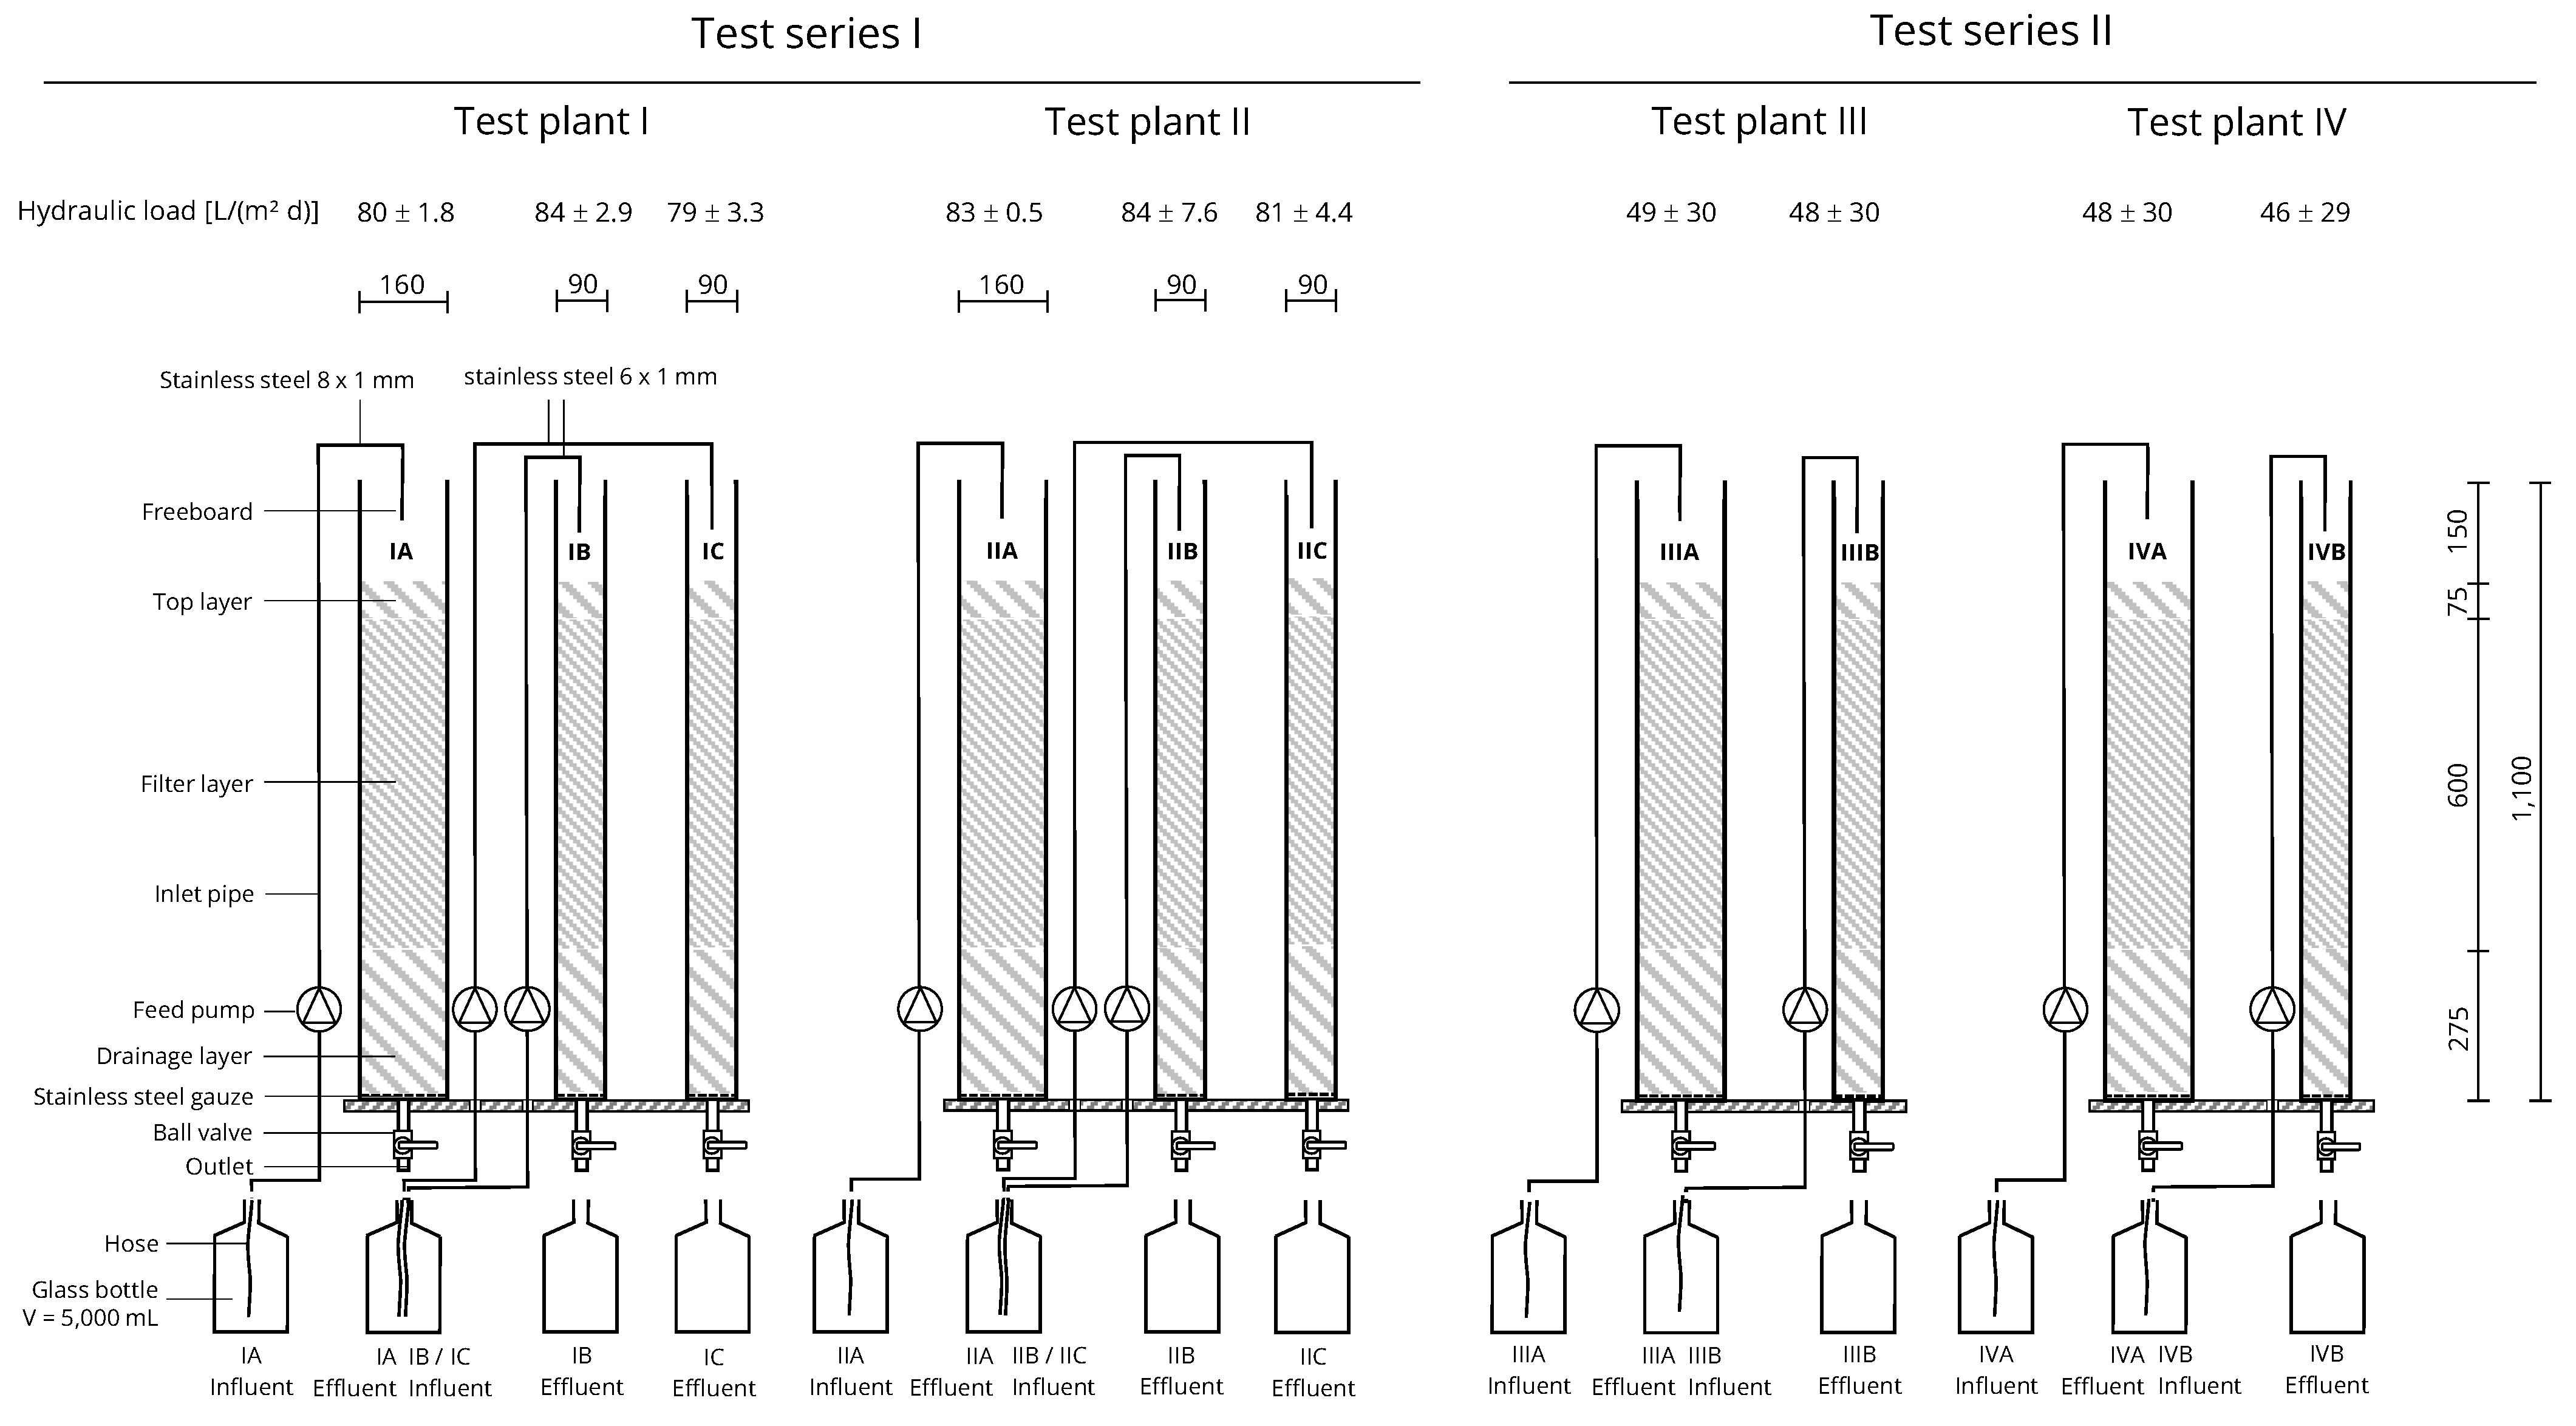
2.1. Test Setup
2.1.1. Lab-Scale Plants
2.1.2. Substrate Used
2.1.3. Test Series
2.1.4. Operation and Sampling
2.2. Analytical Methods
2.2.1. Chemical Analyses
2.2.2. Microbial Composition
2.2.3. Genomic Analysis of DMAc Degradation Pathways
2.2.4. In Vitro Bioassays
2.3. Balancing
2.4. Data Analysis
3. Results
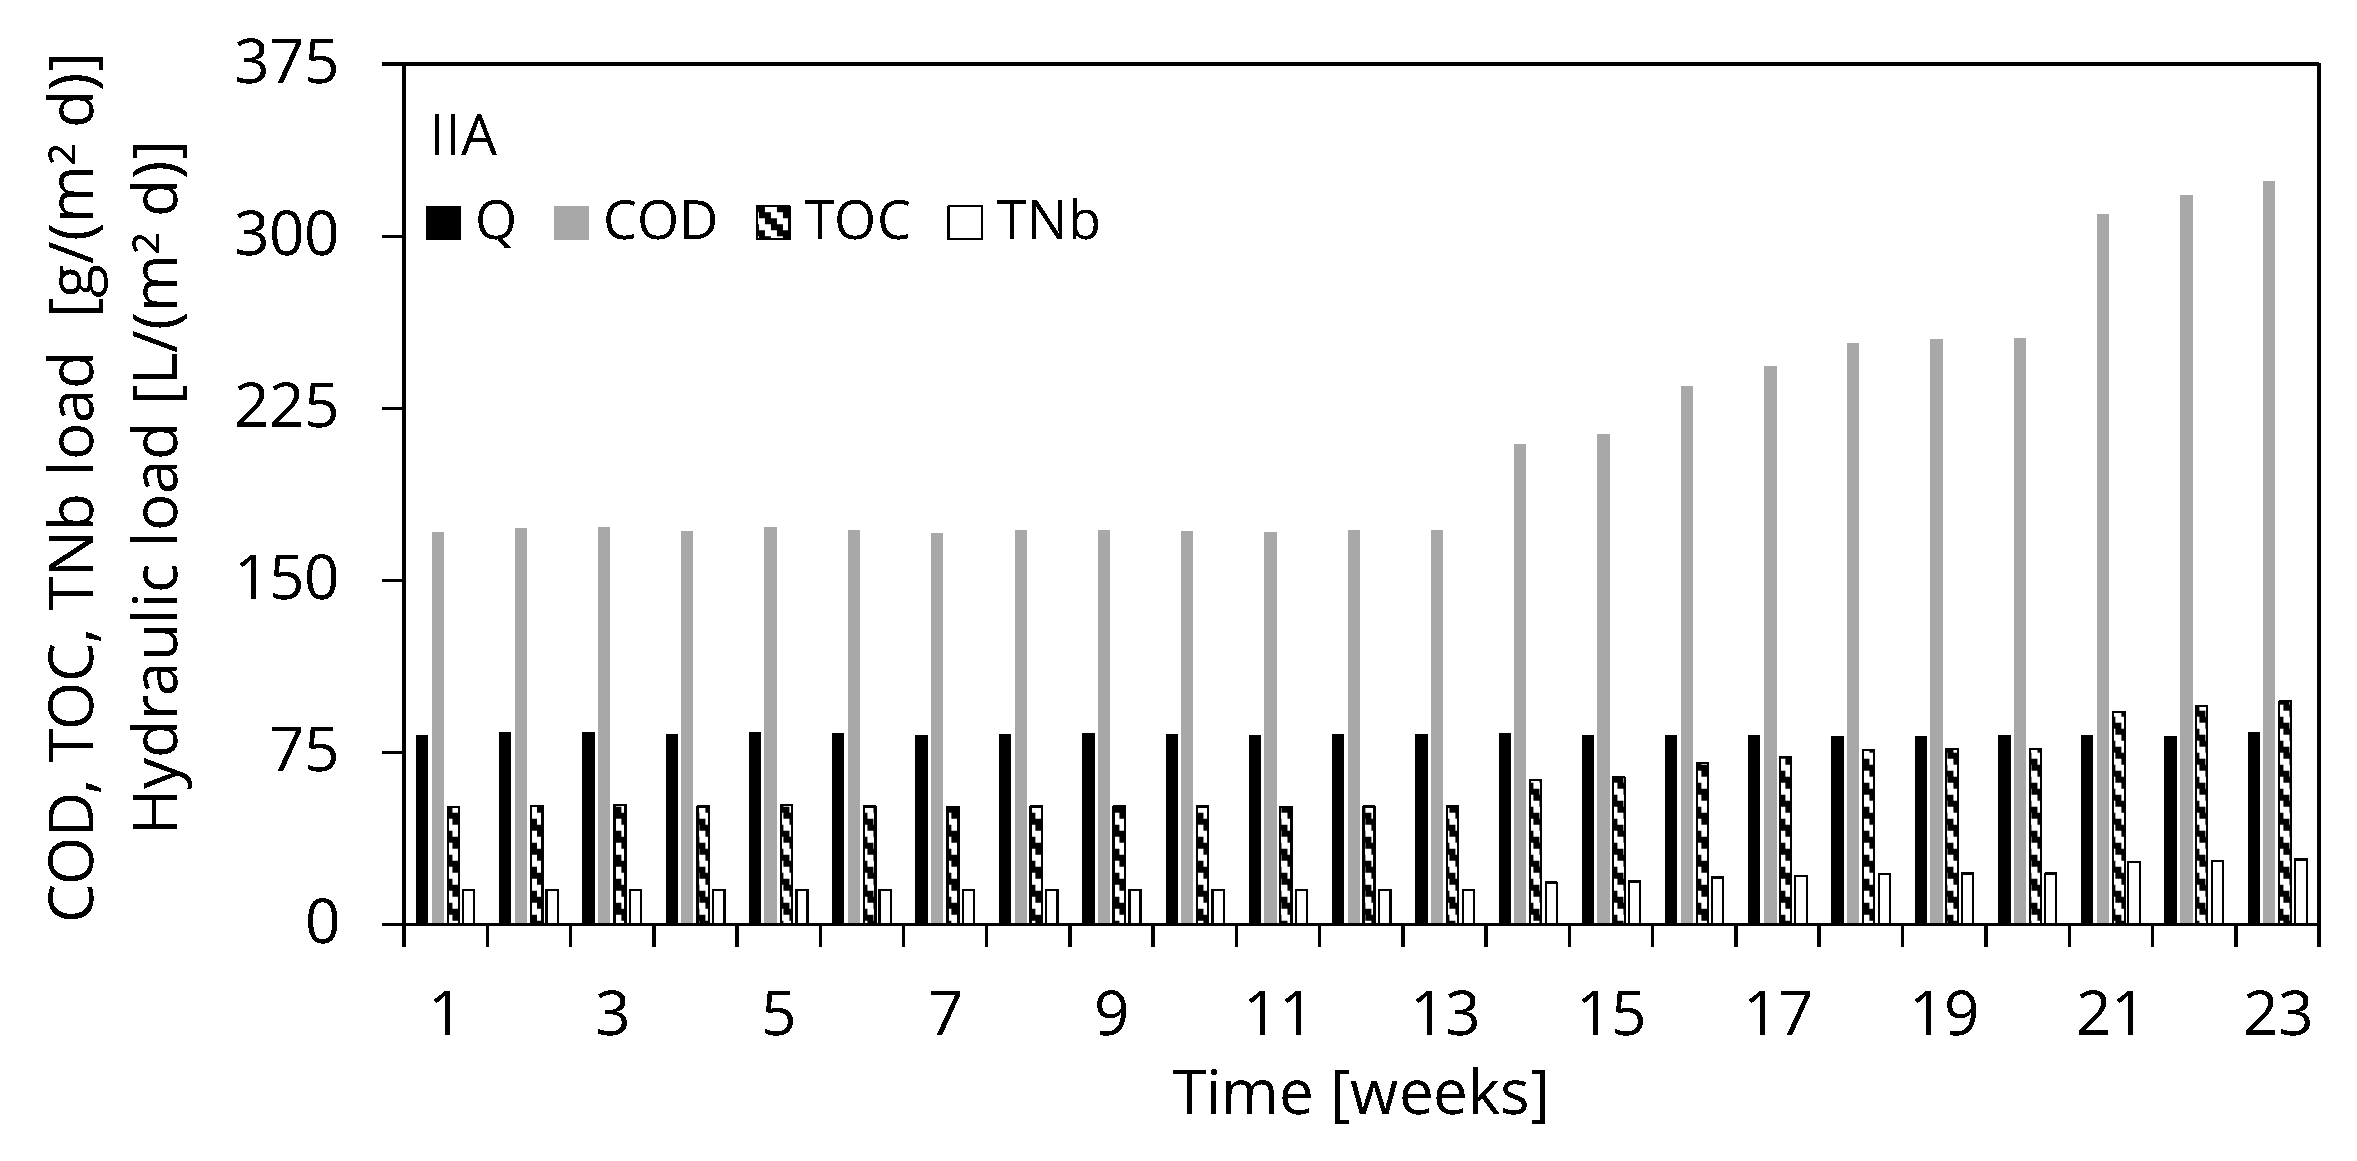
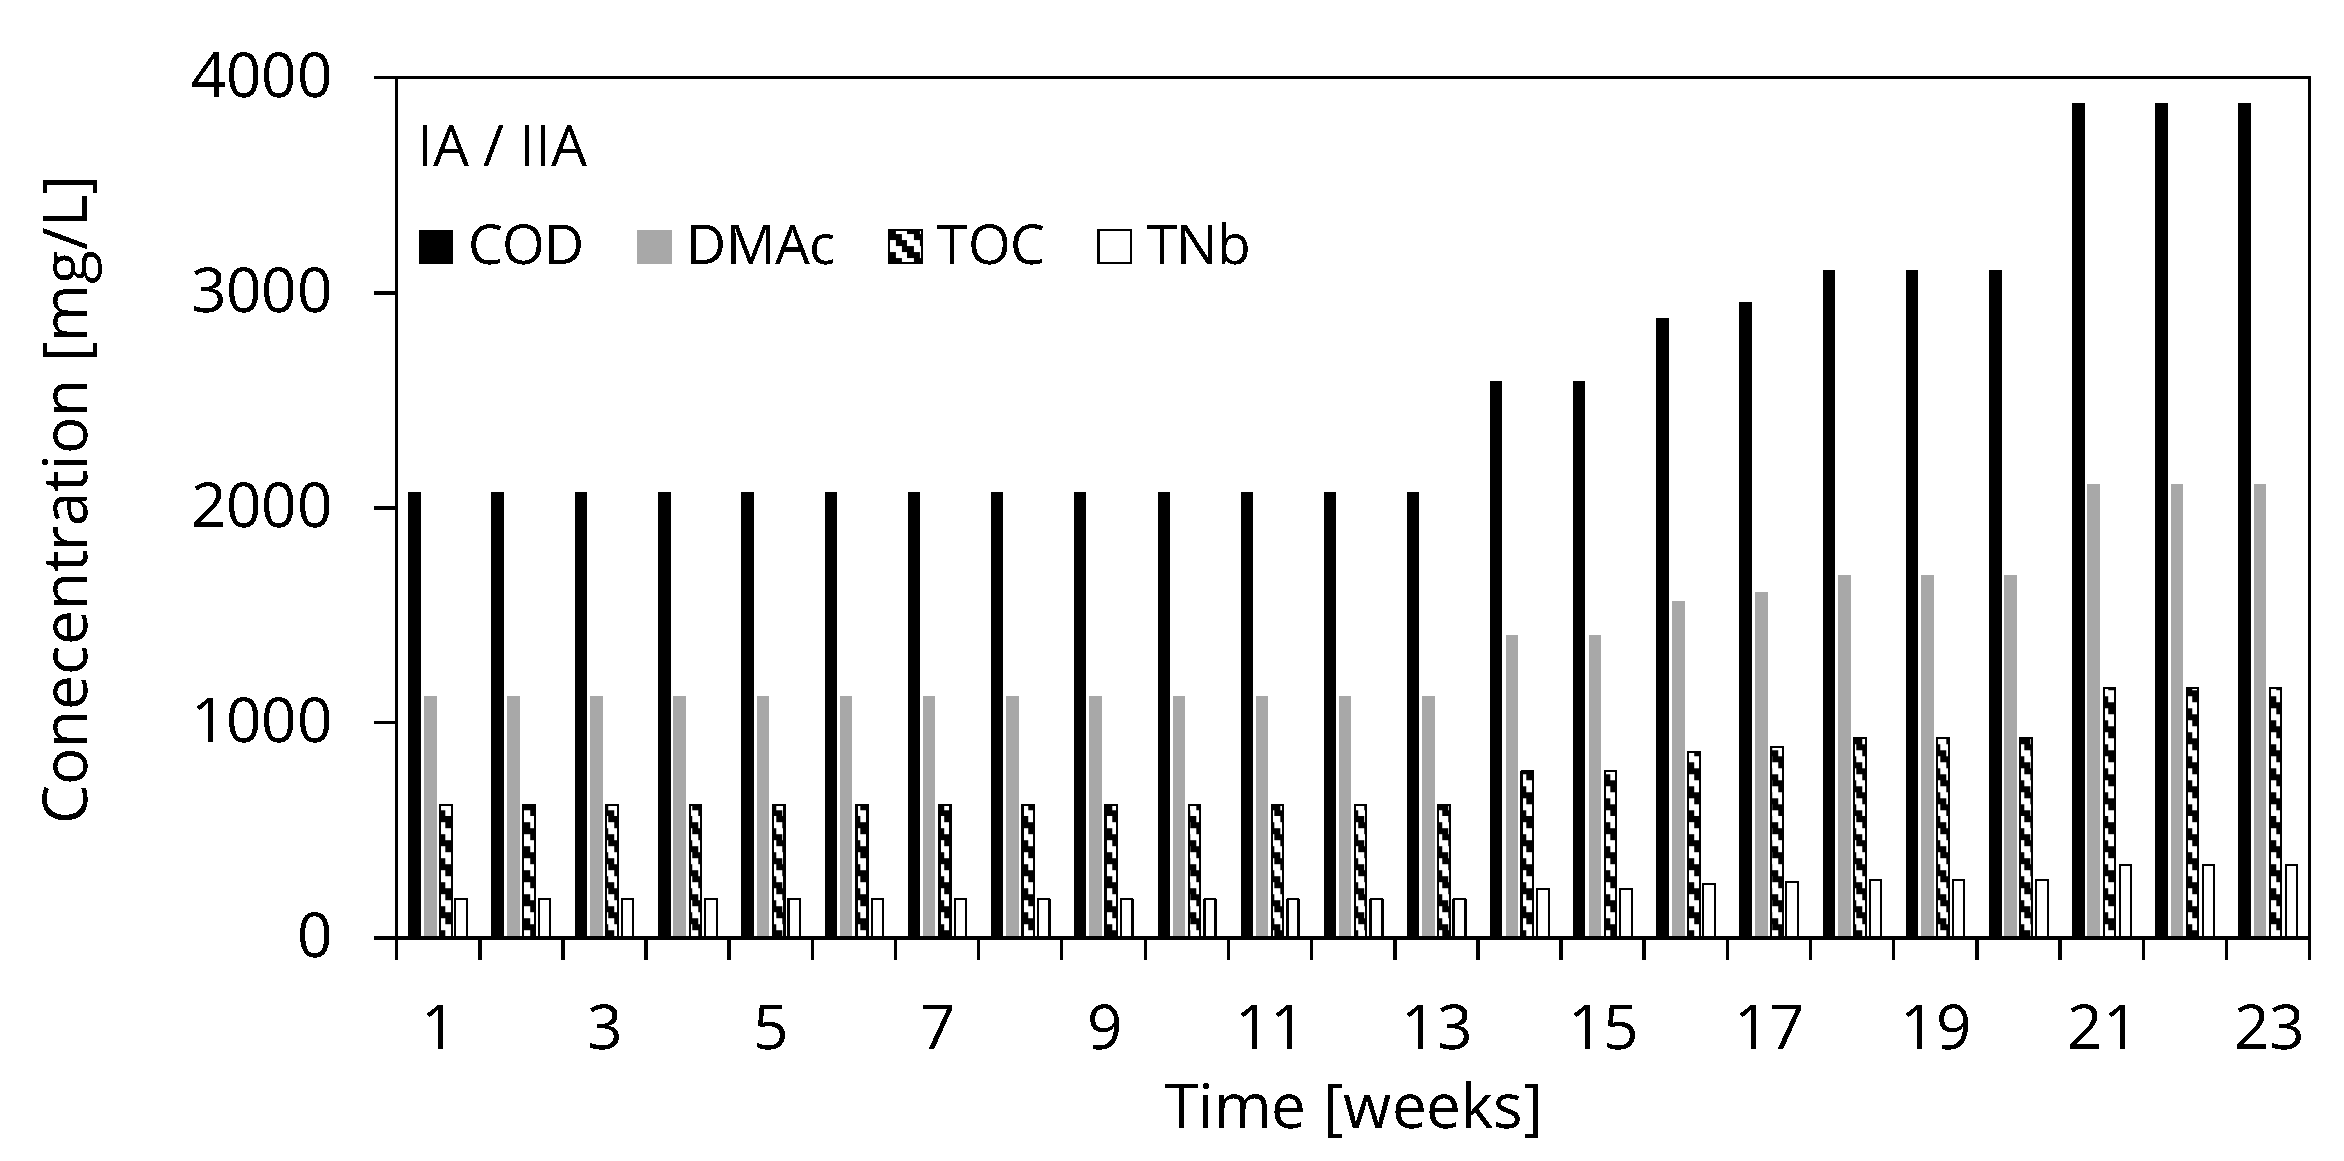
3.1. Inflow Load
3.1.1. First Test Series
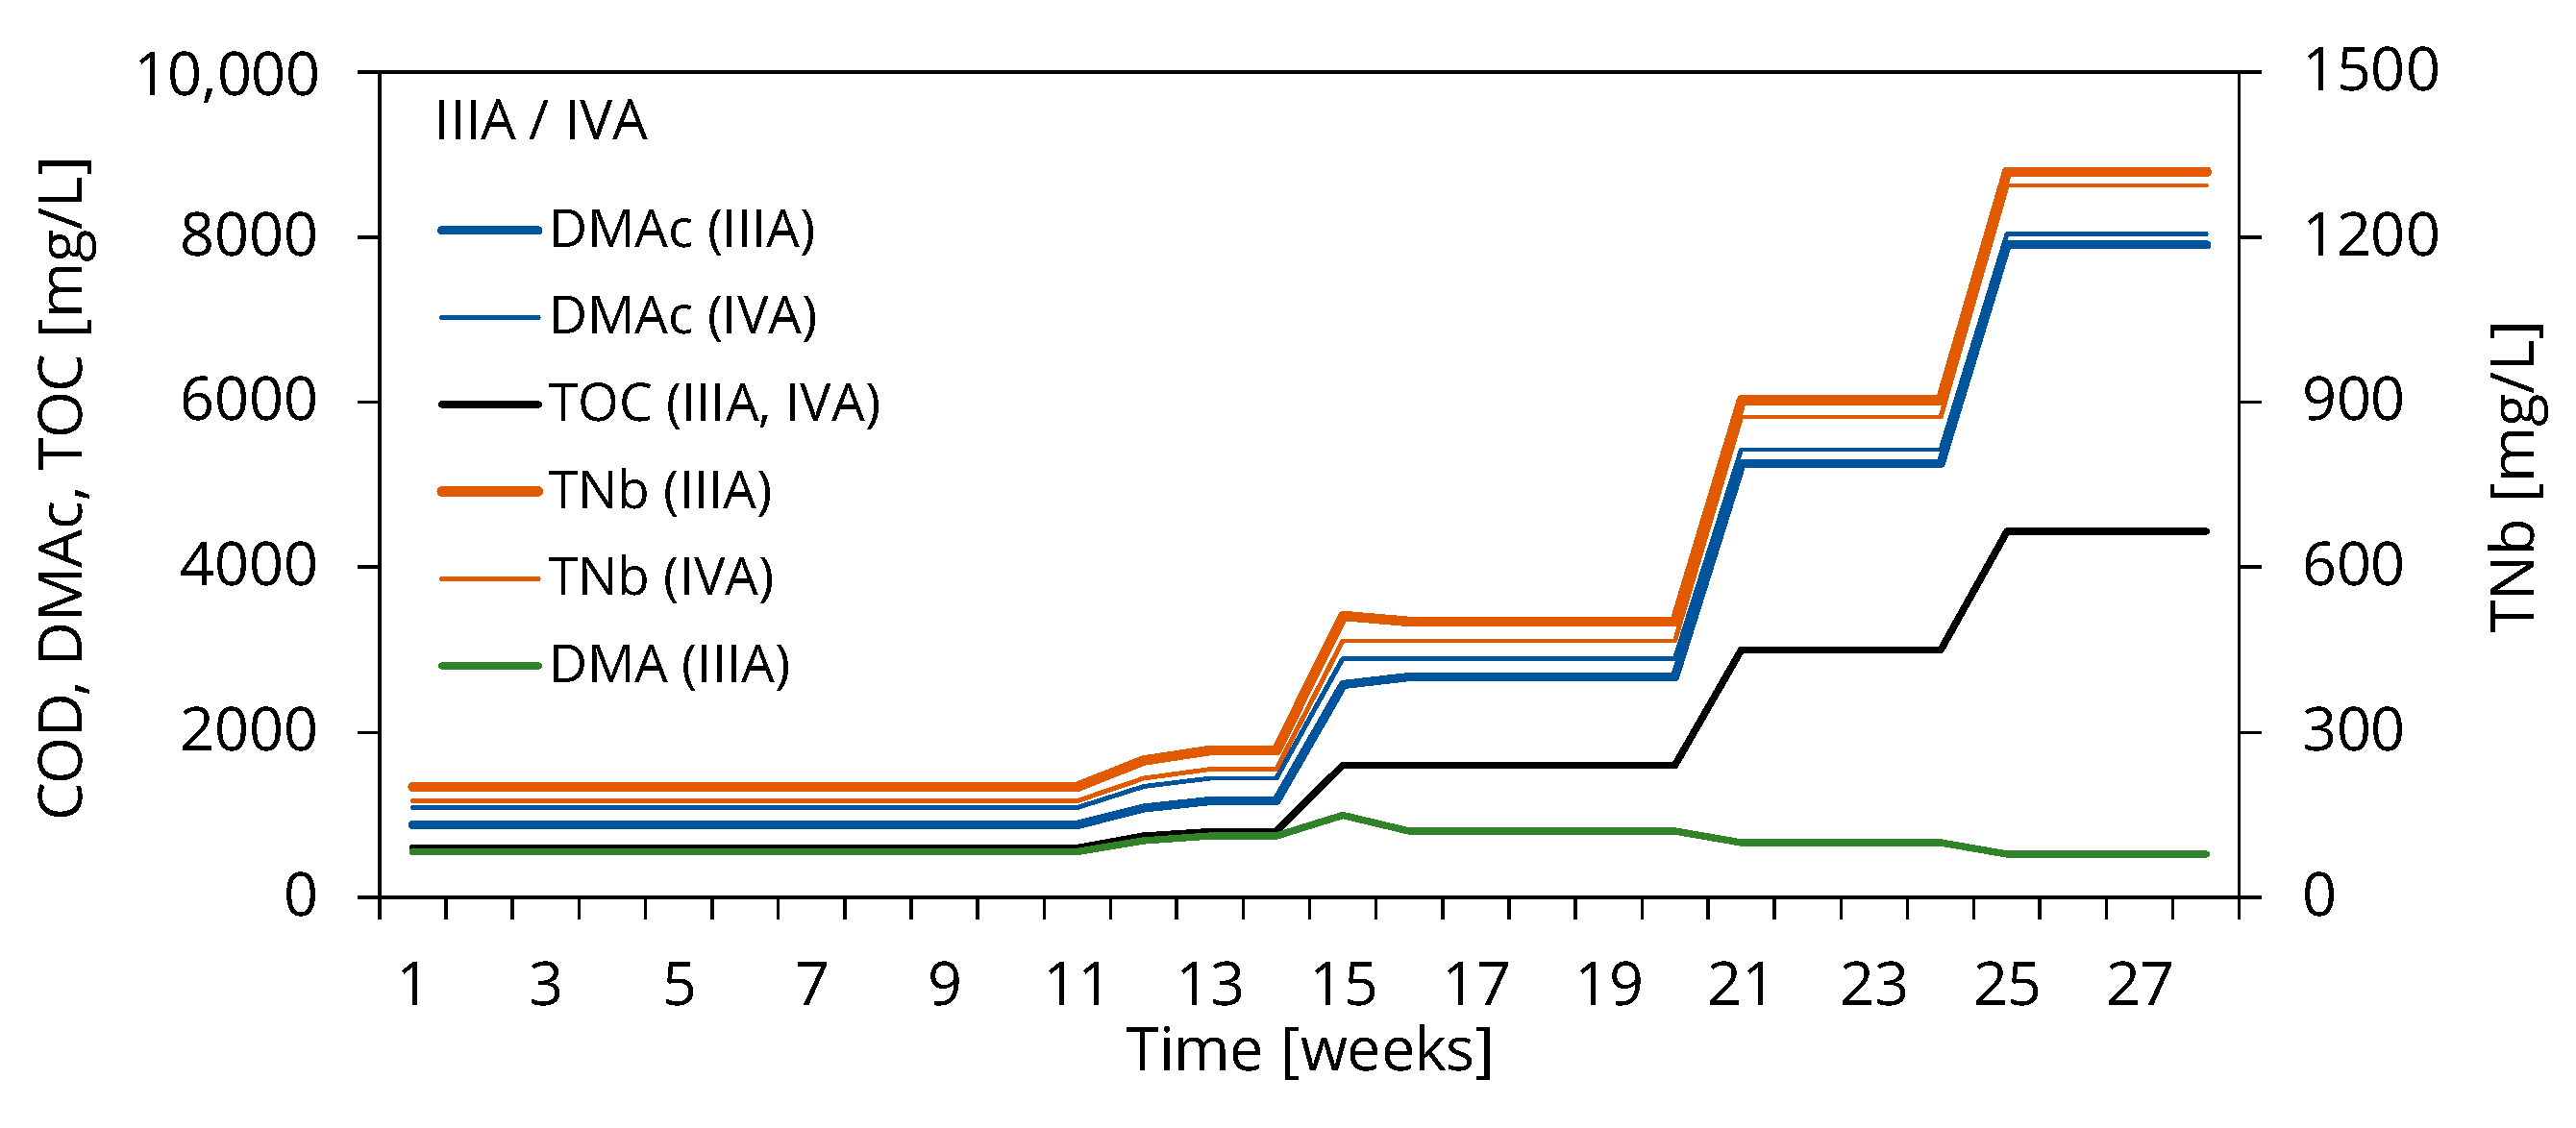
3.1.2. Second Test Series
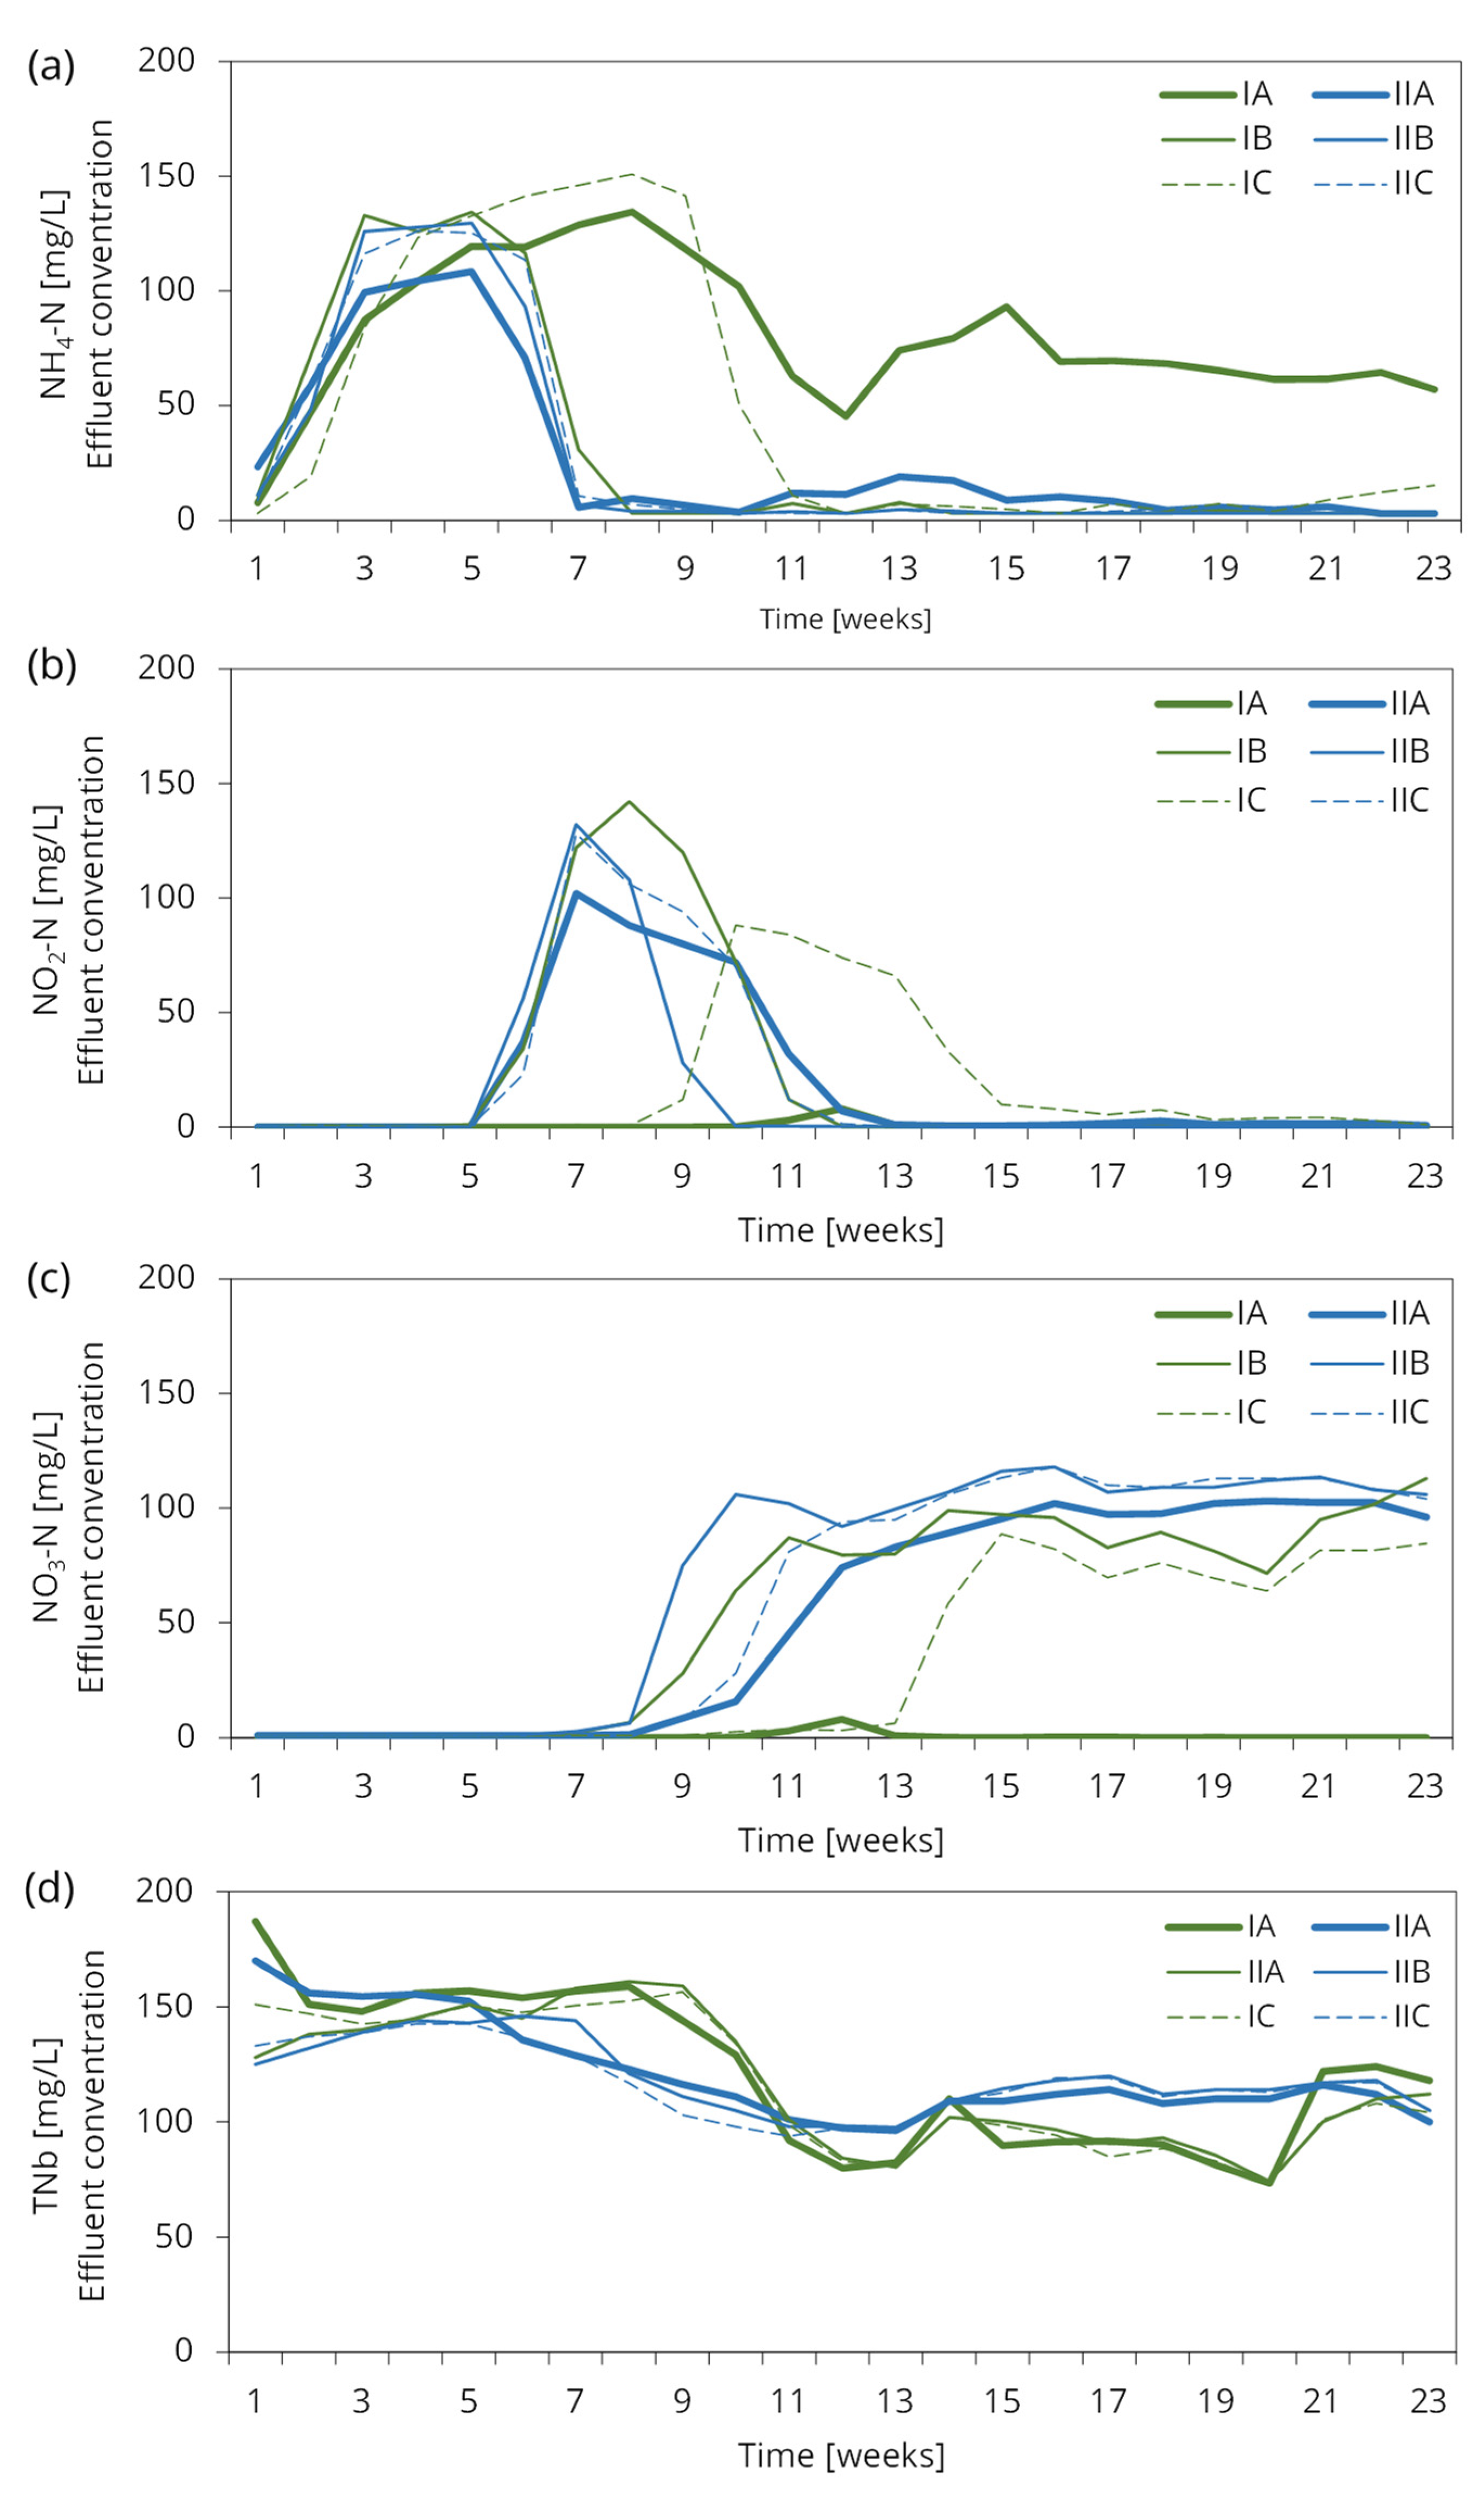
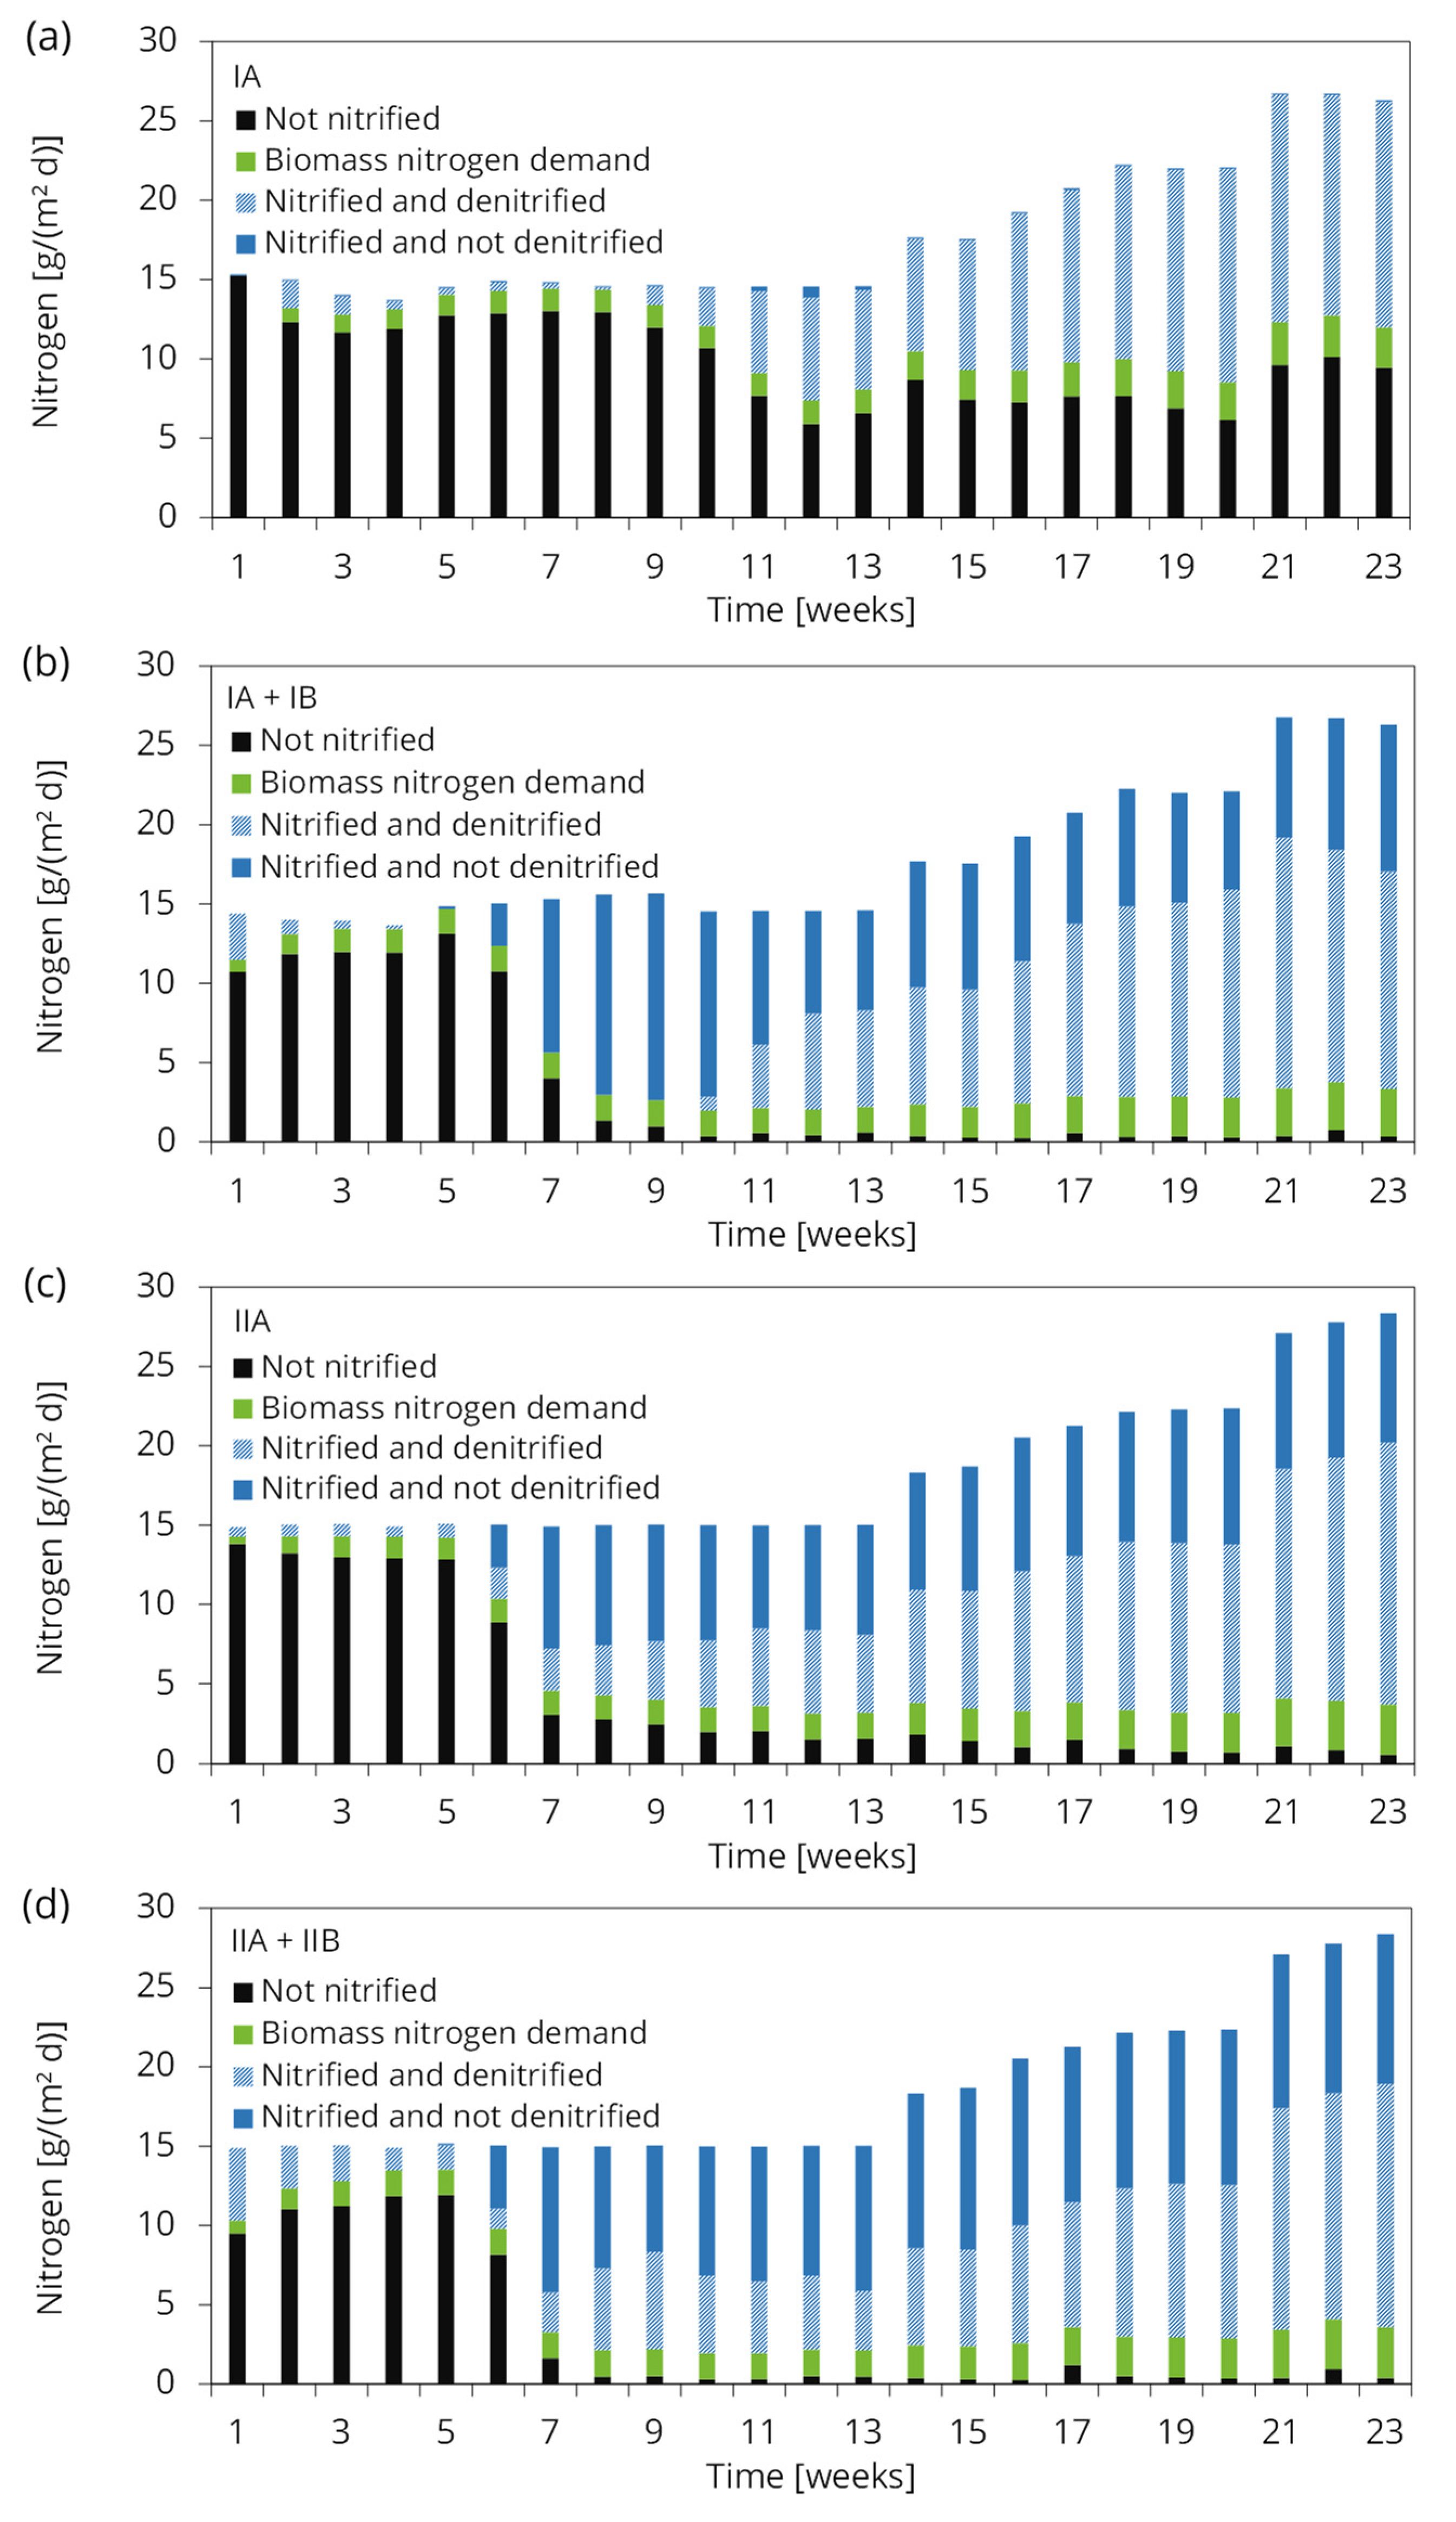
3.2. Results of the First Test Series
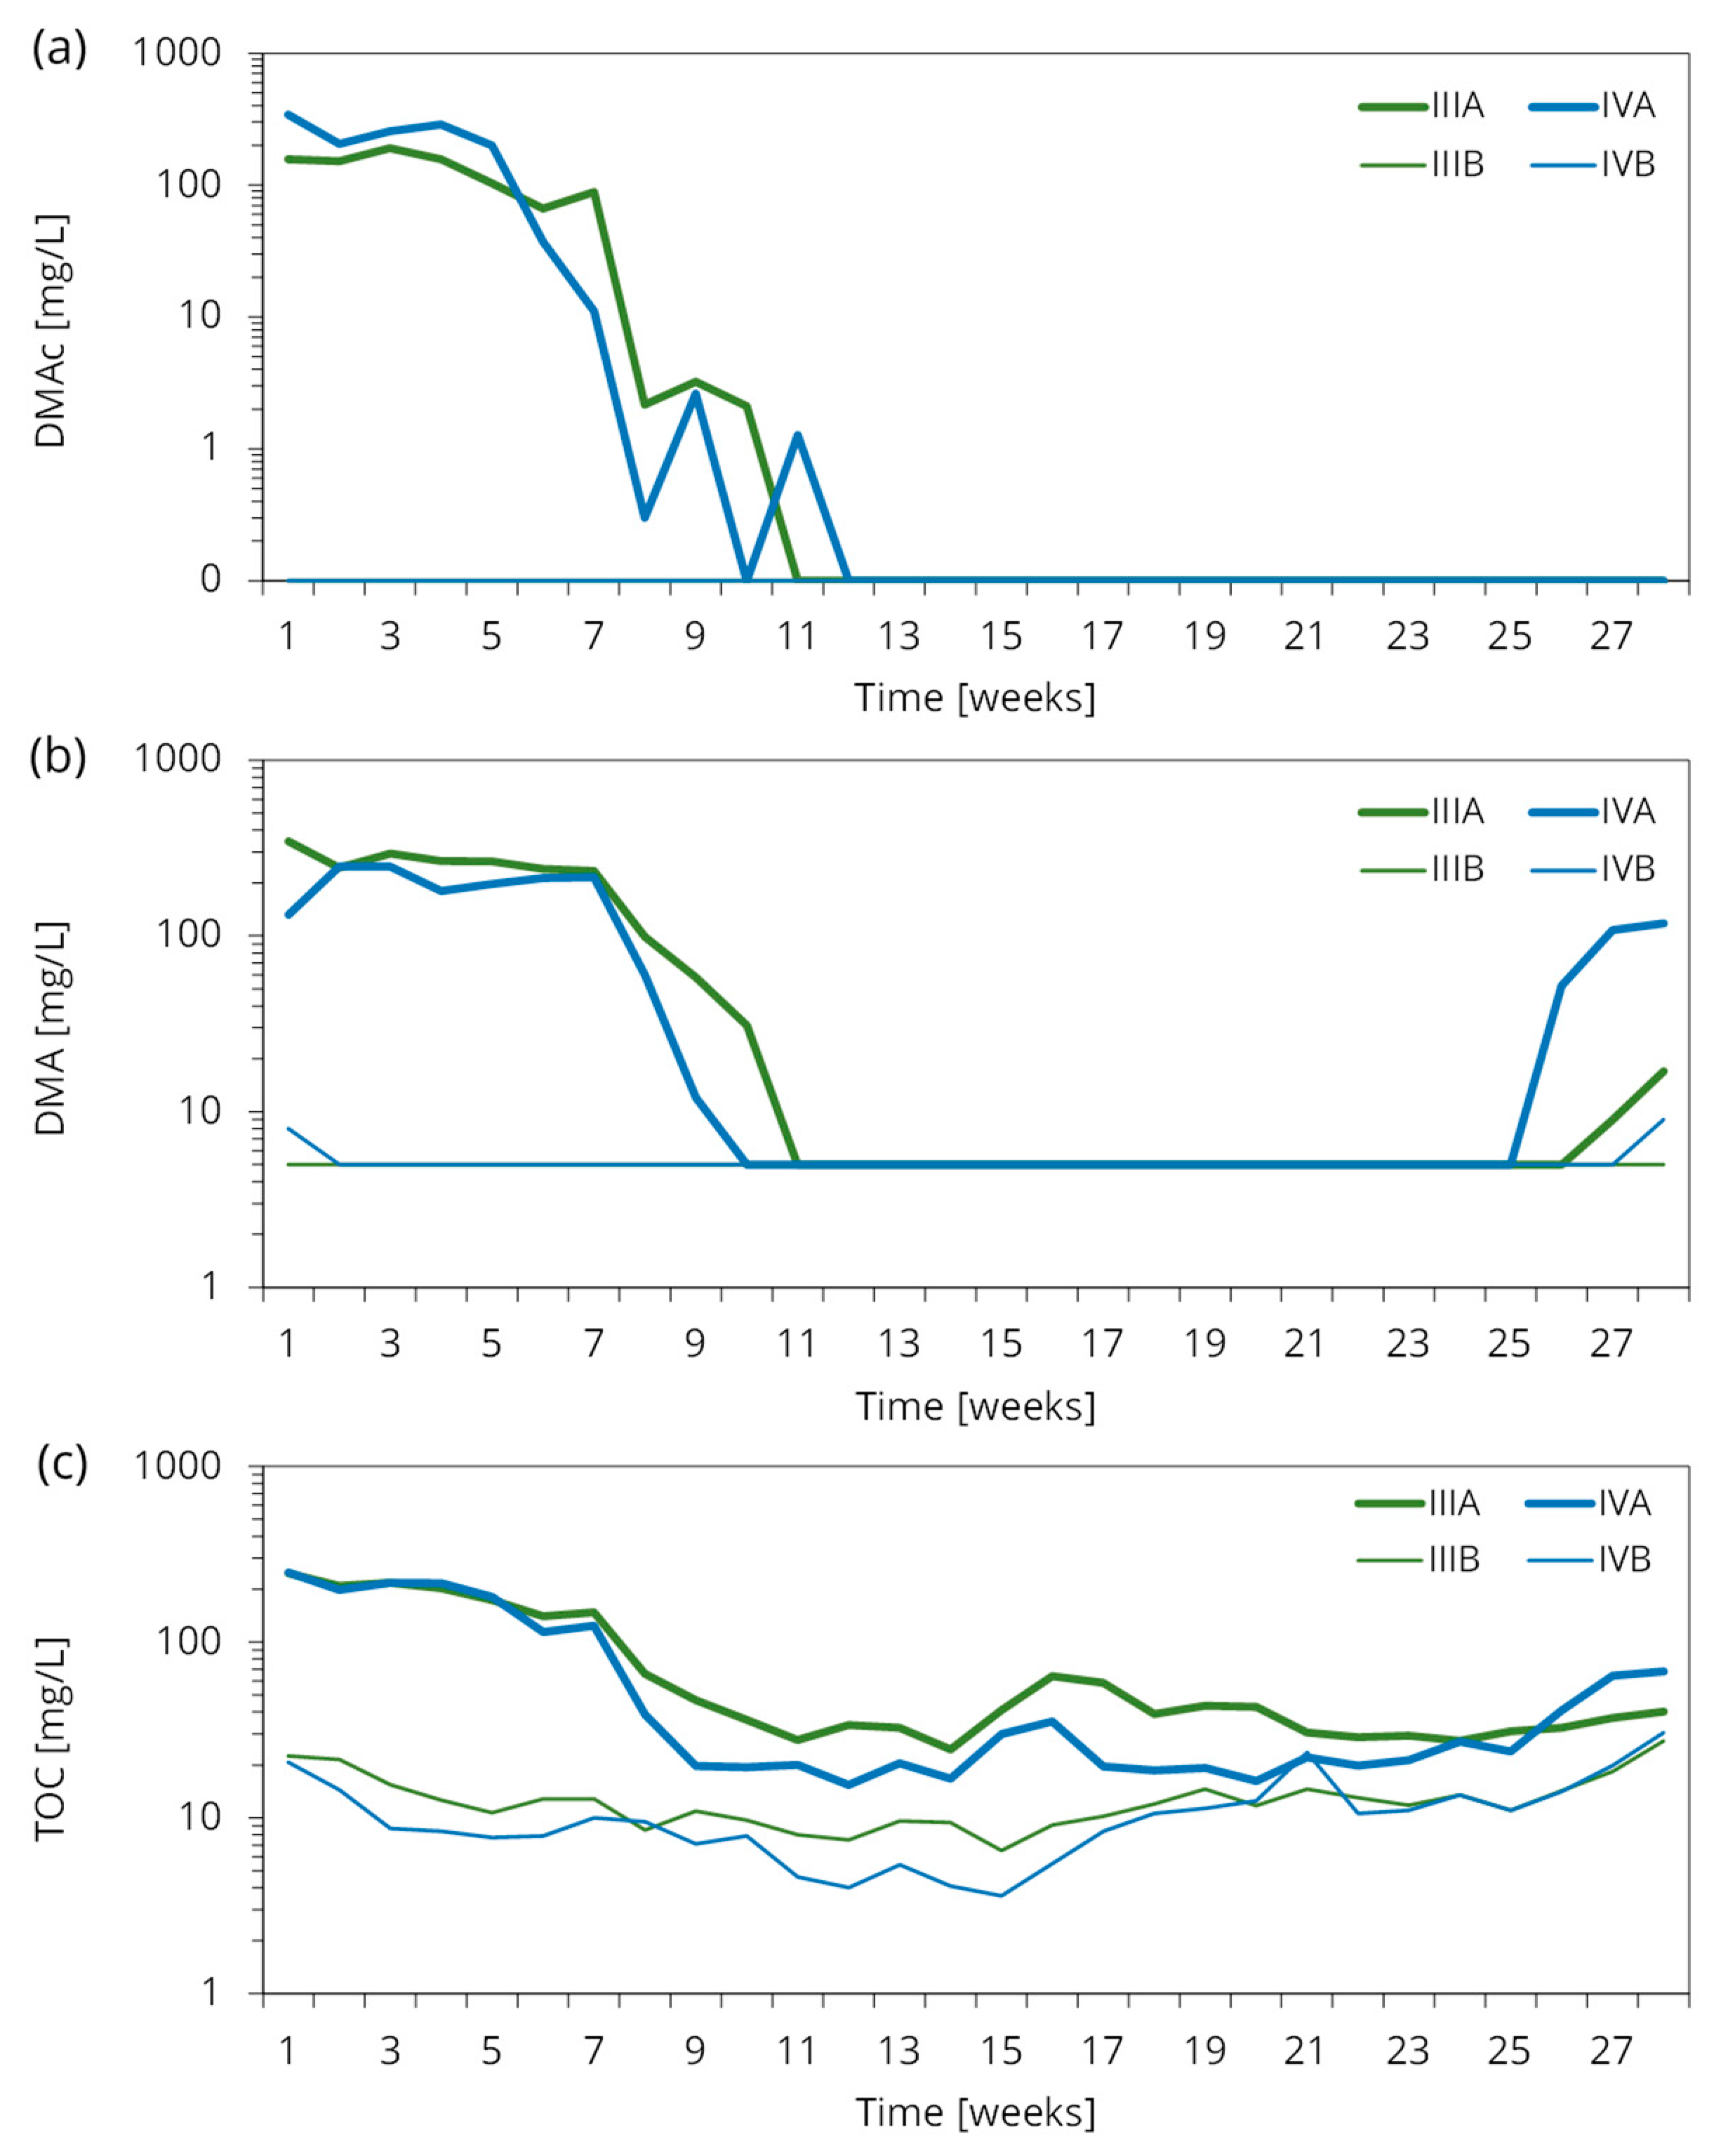
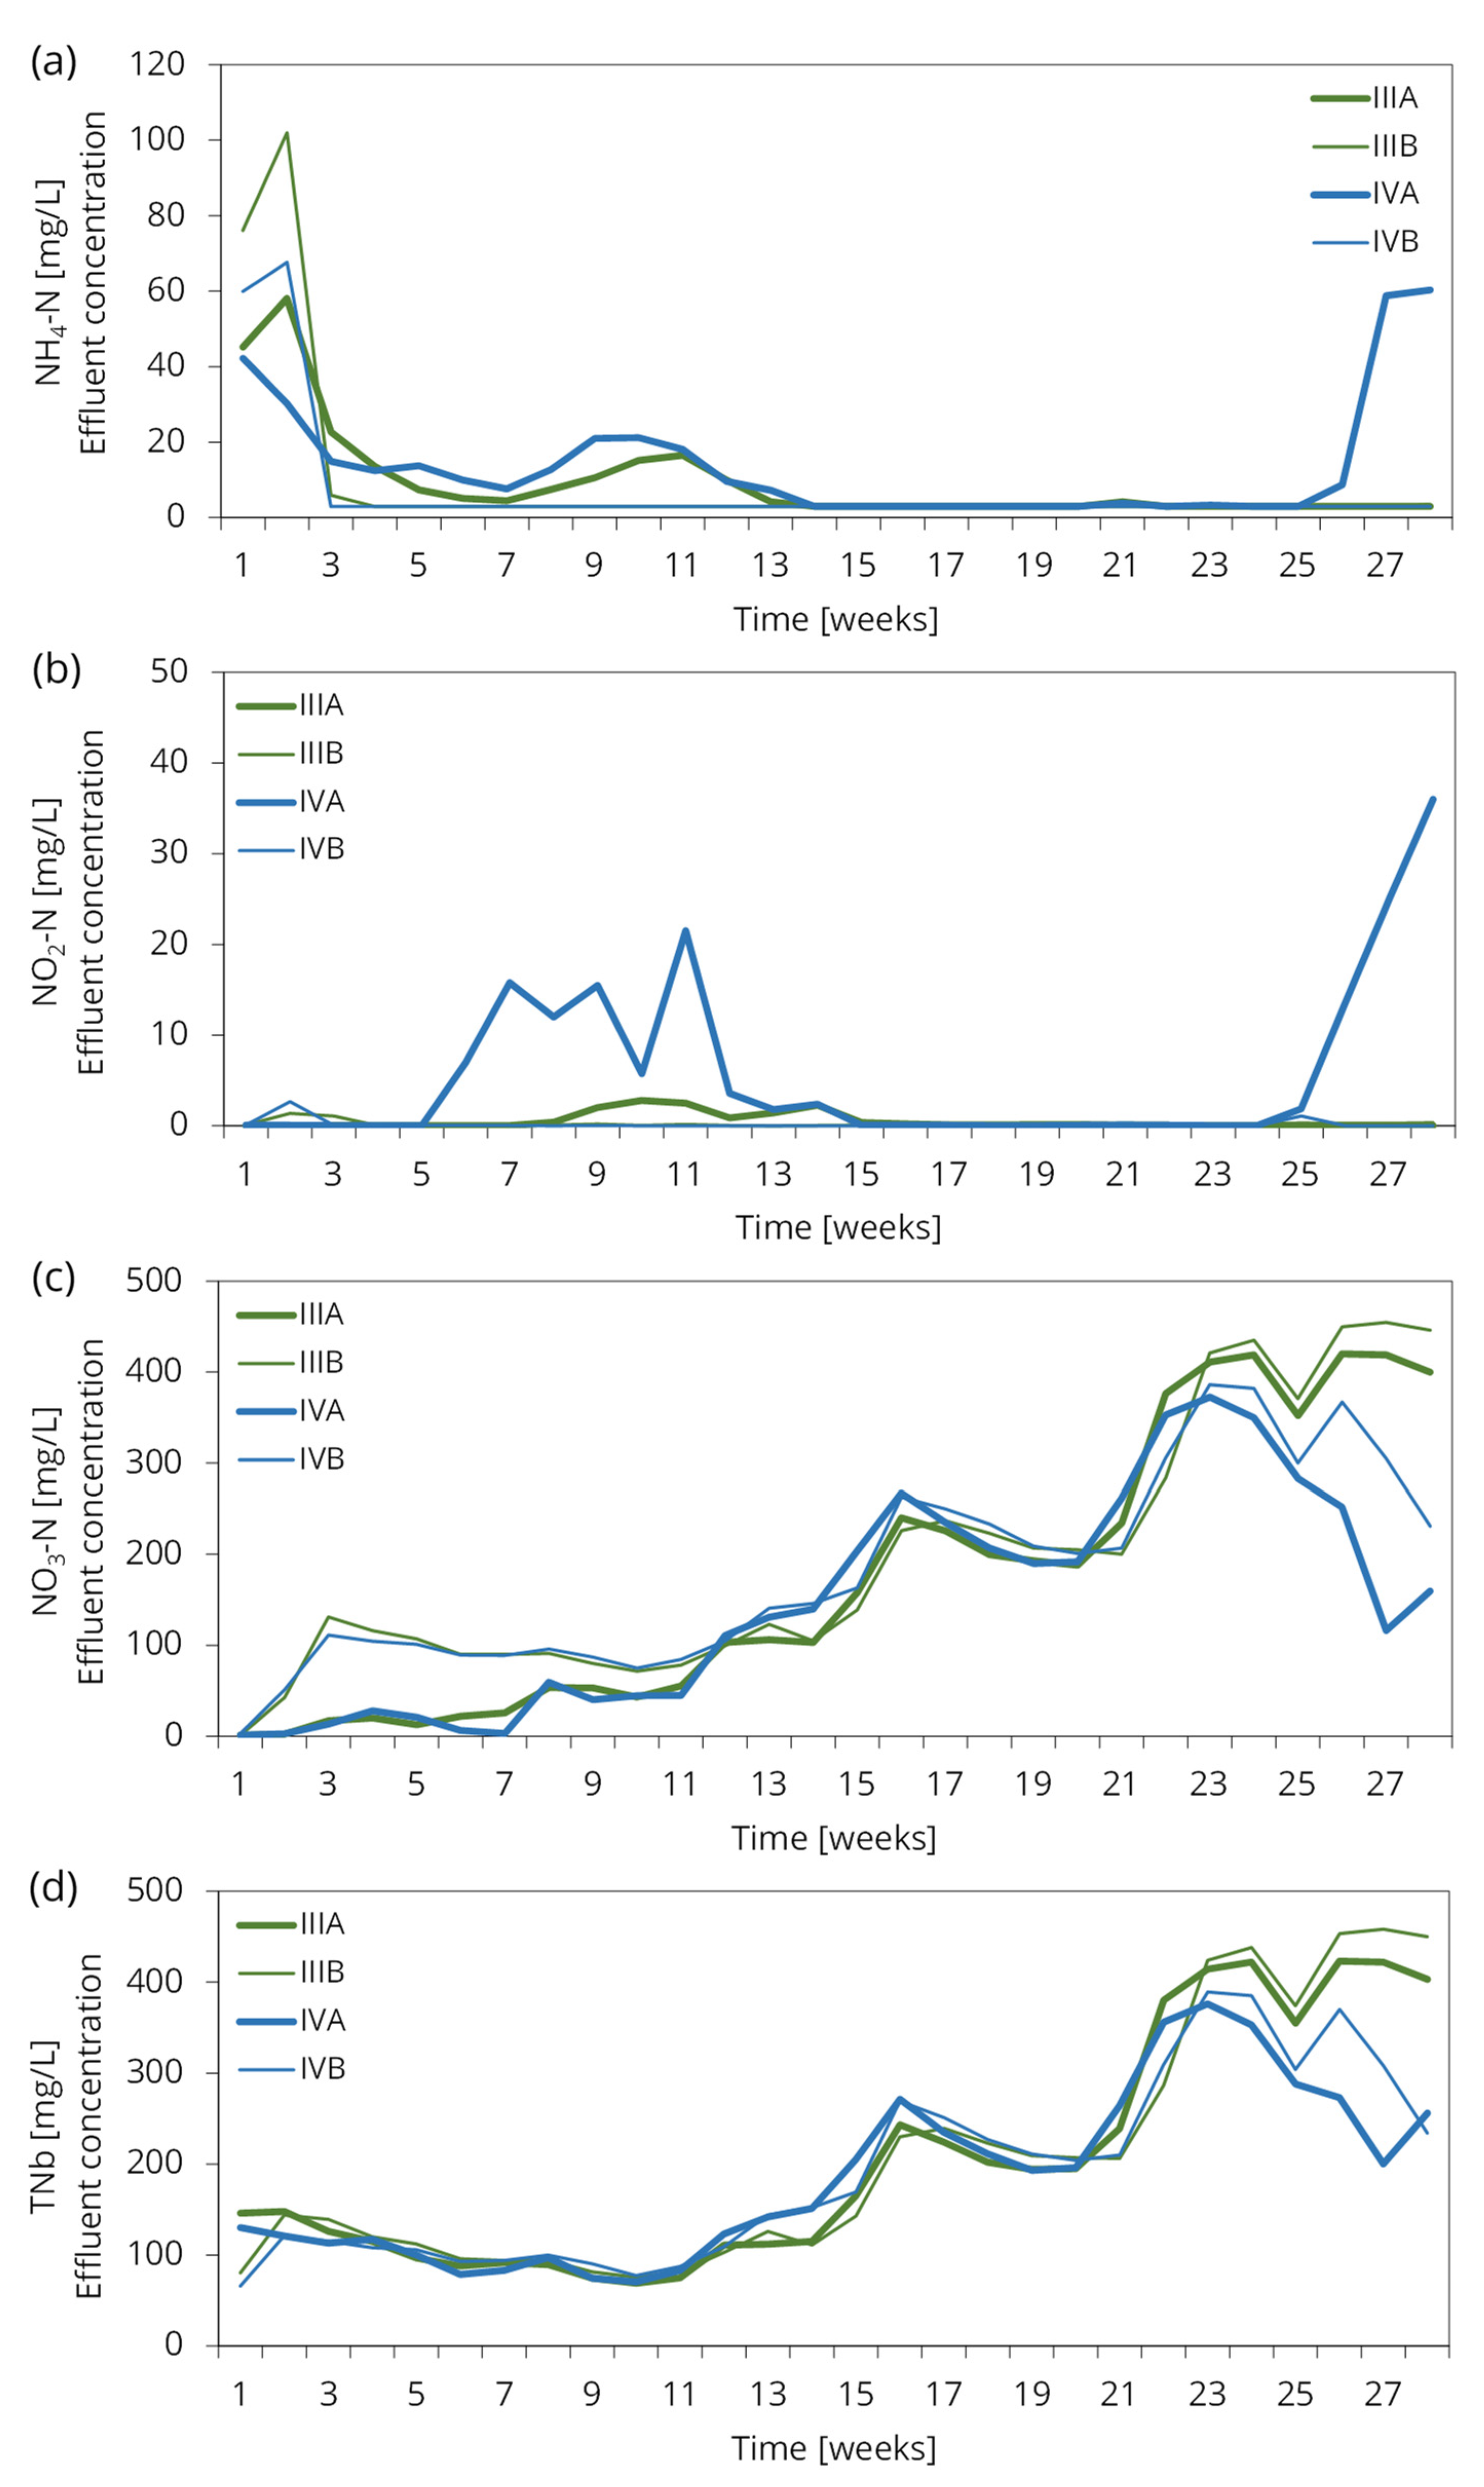
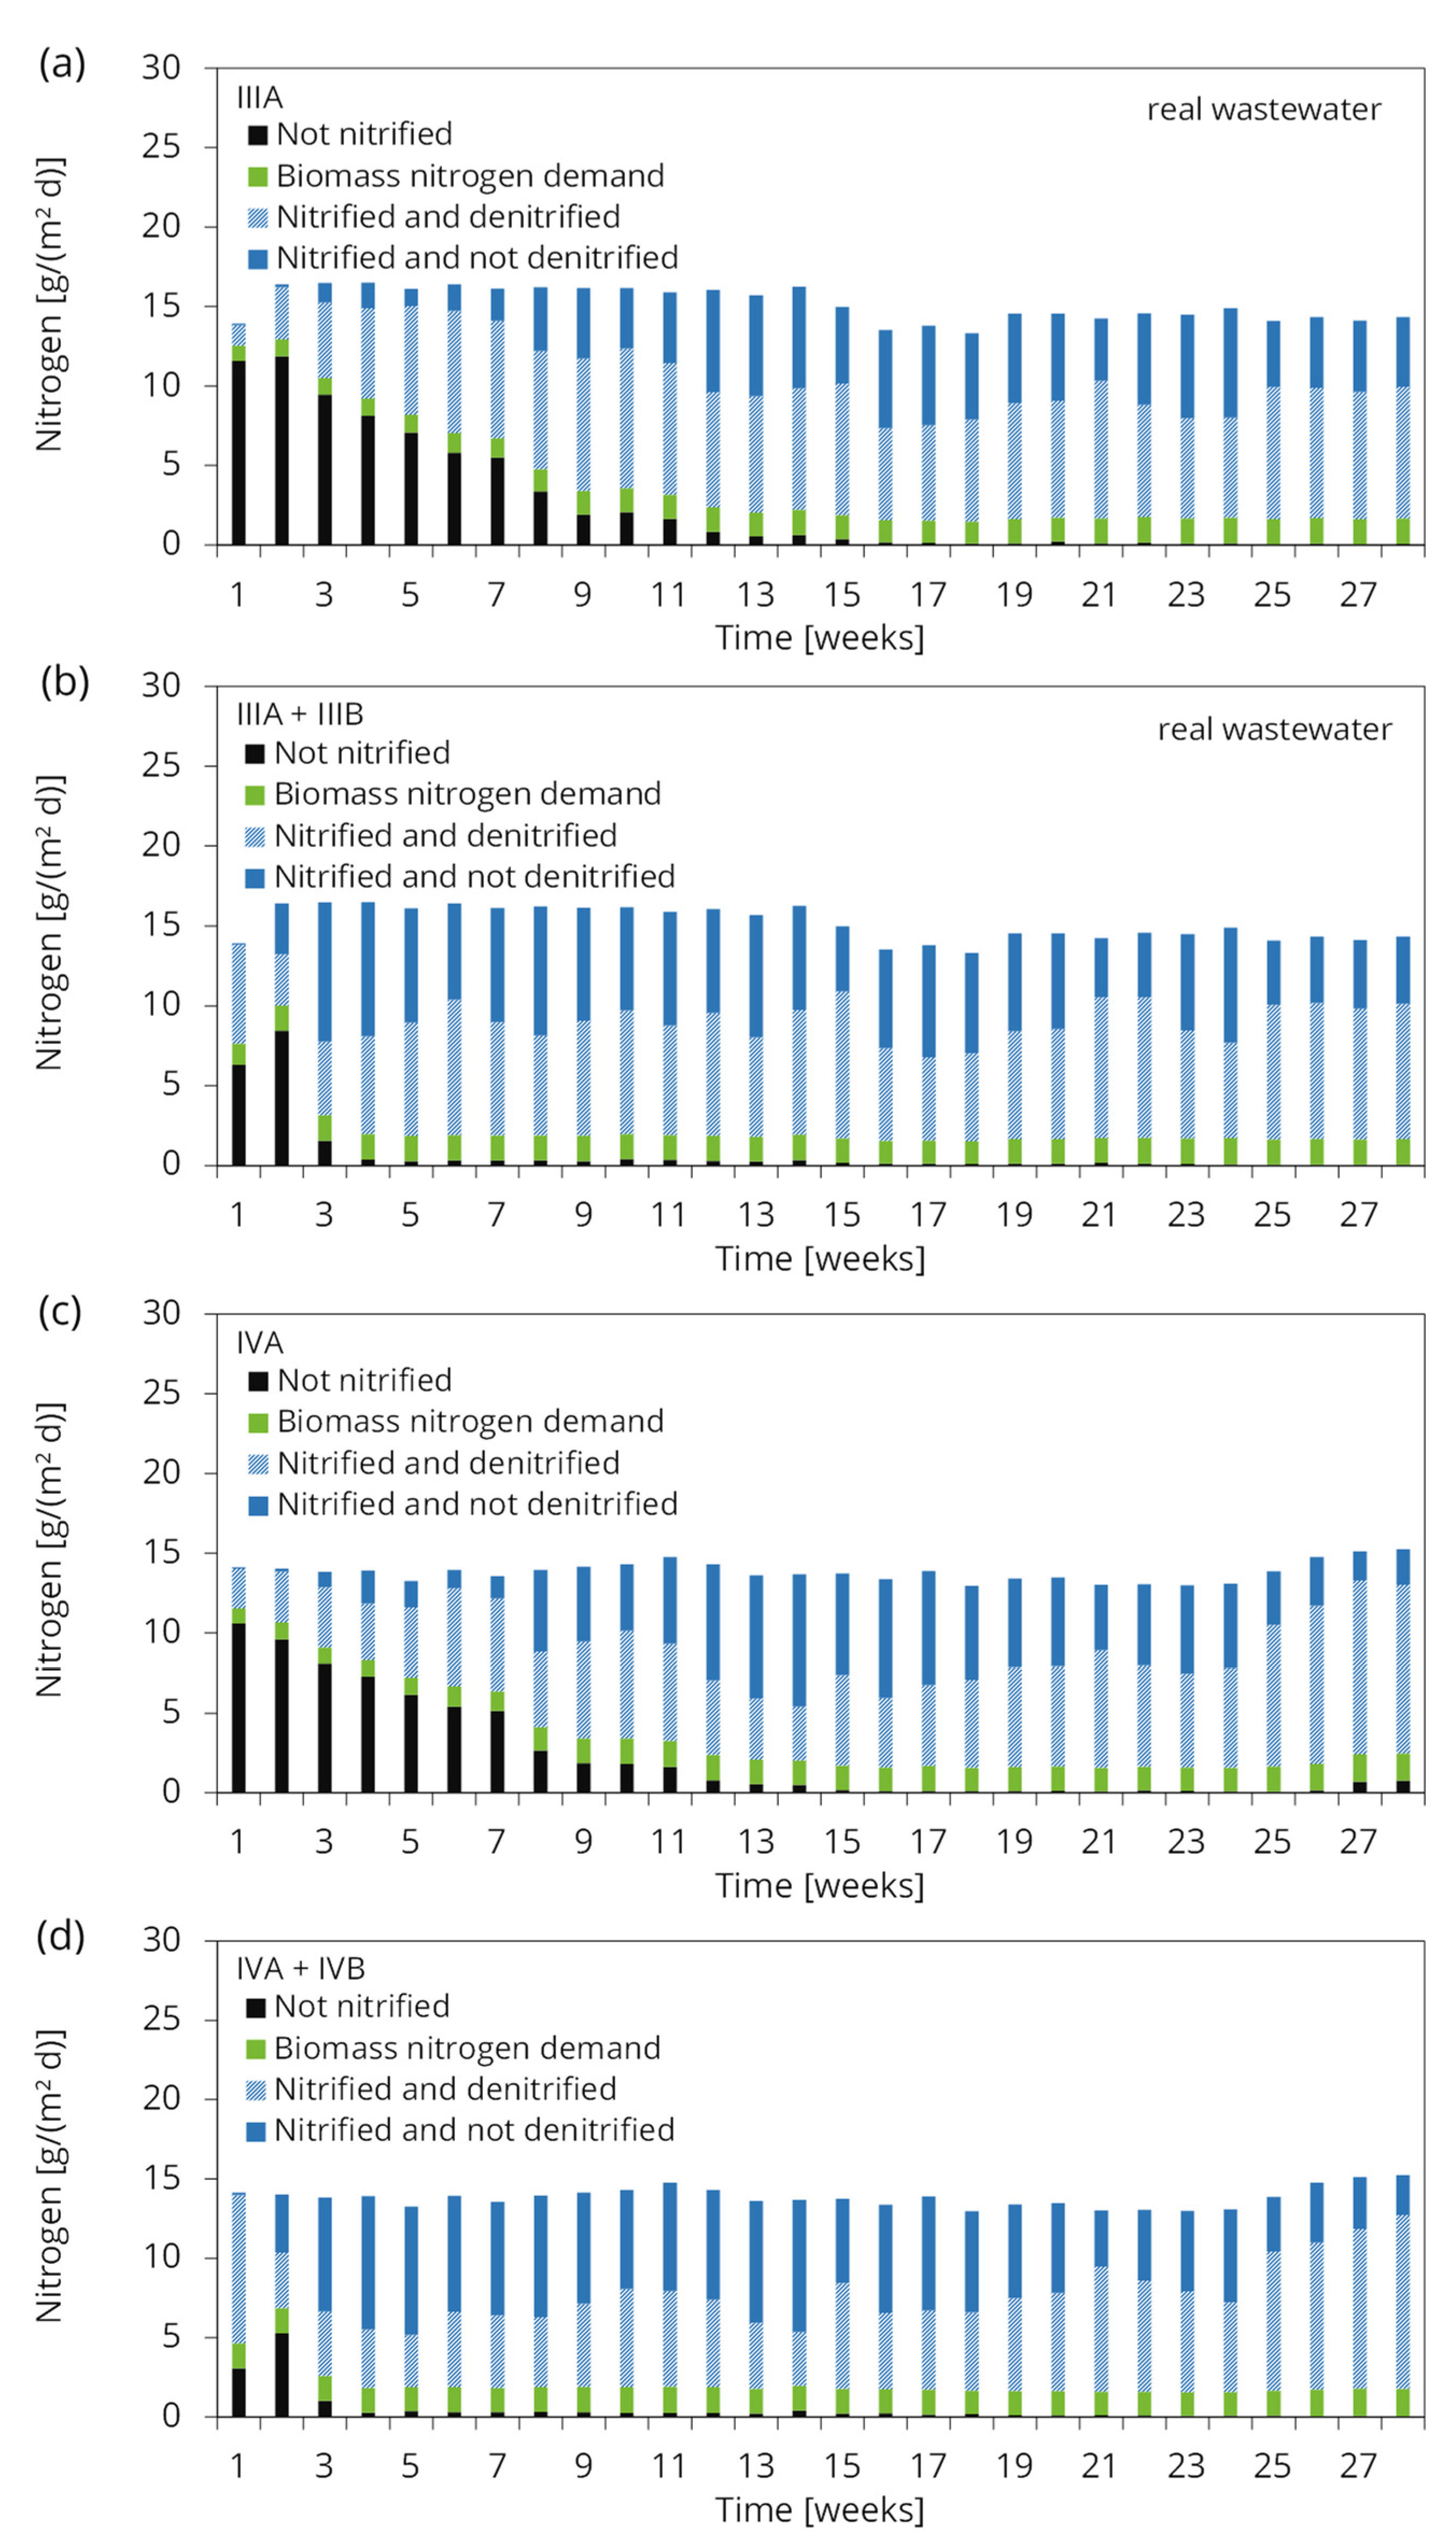
3.3. Results of the Second Test Series
4. Discussion
4.1. Effect of the Grain Size Distribution on the Removal Rate
4.2. Effect of the pH Value on the Removal Rate
4.3. Maximum Loading
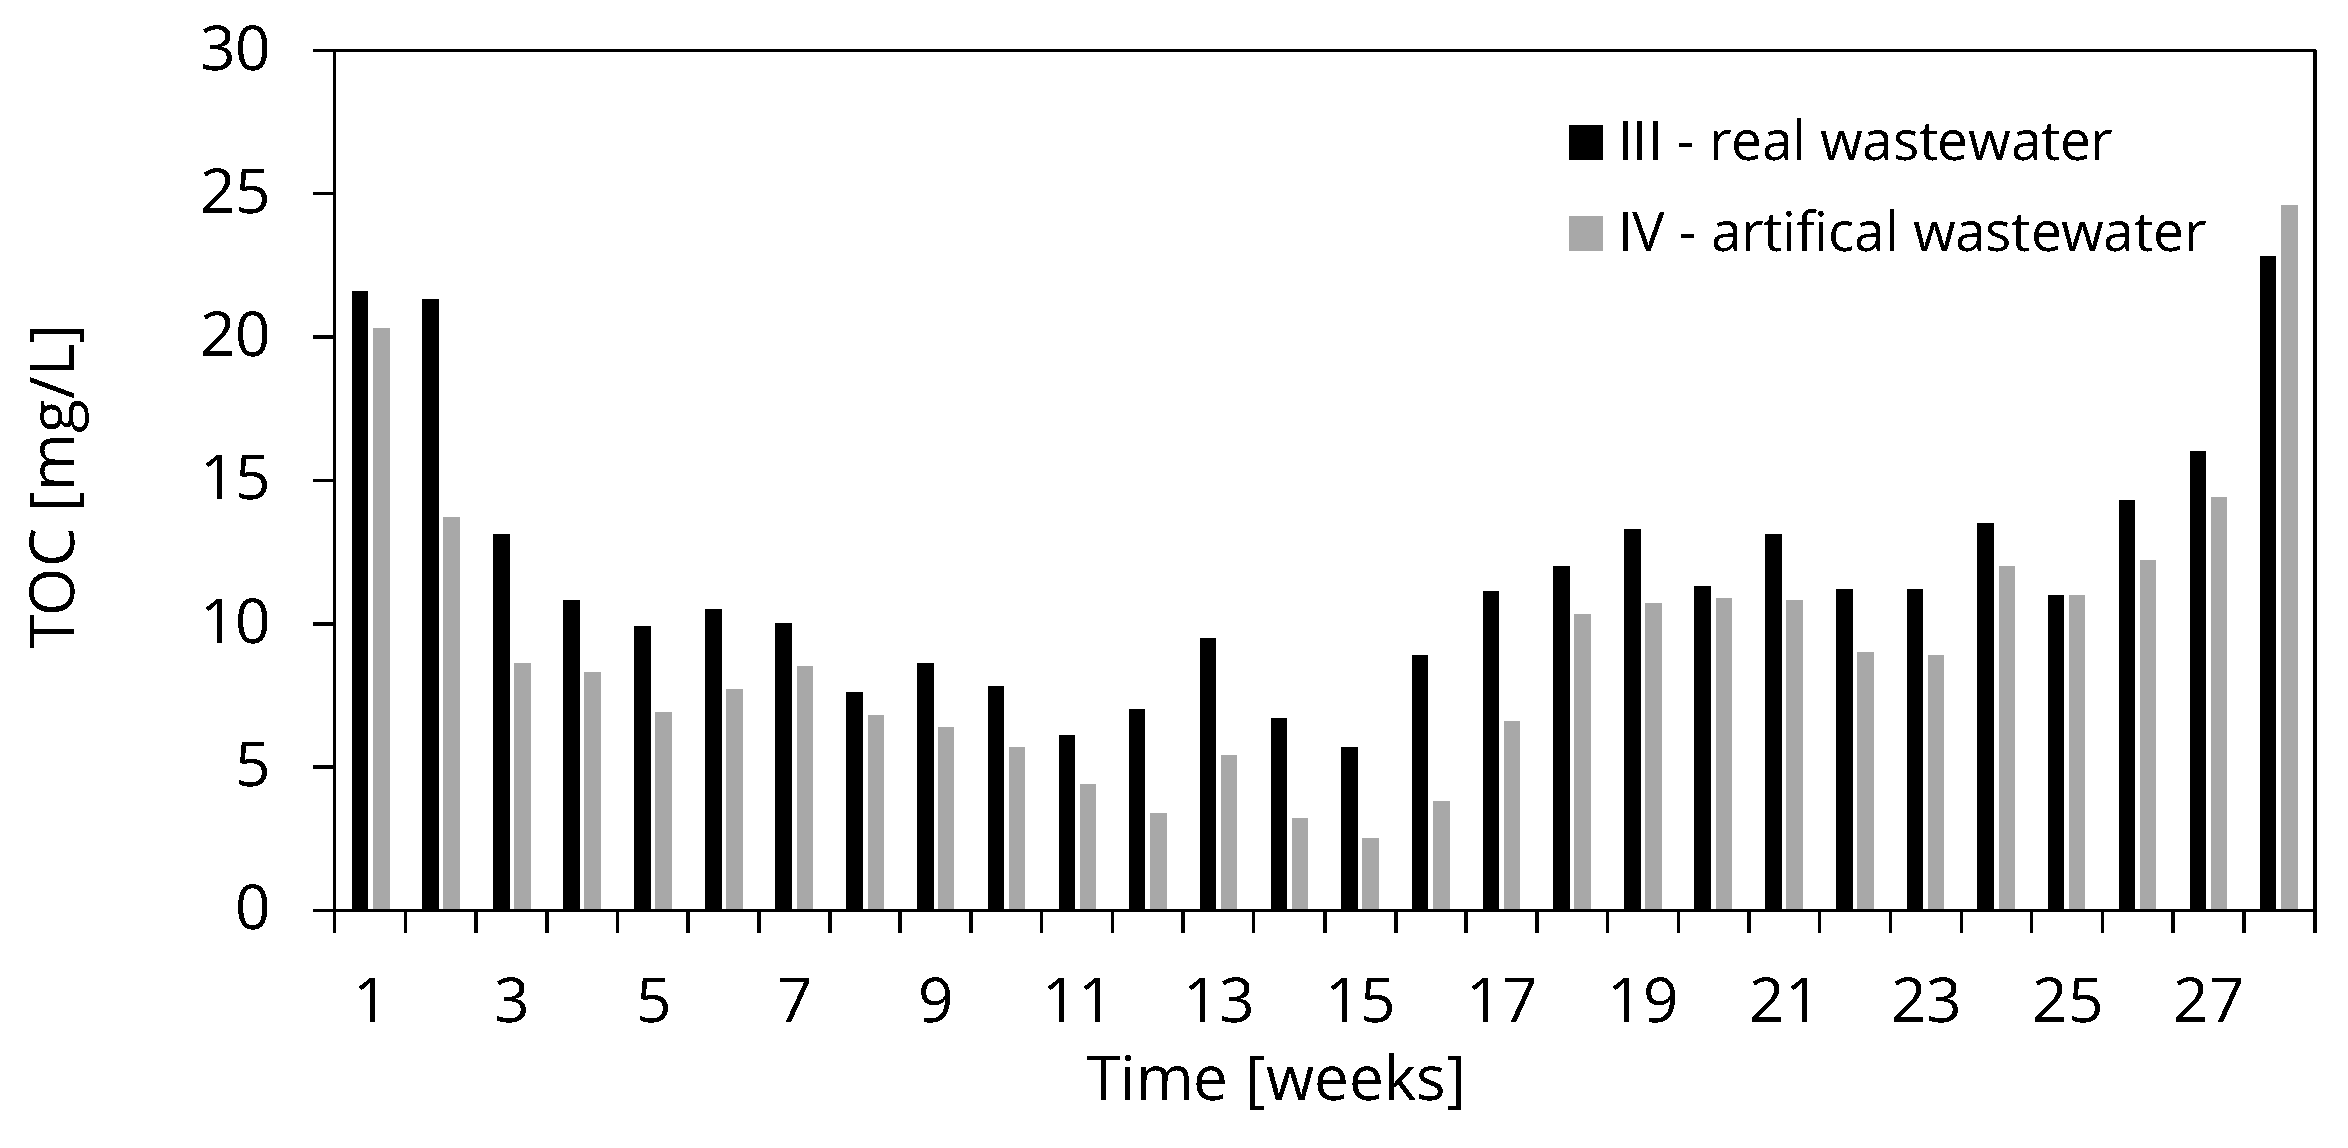
4.4. Comparability between Artificial and Real Wastewater
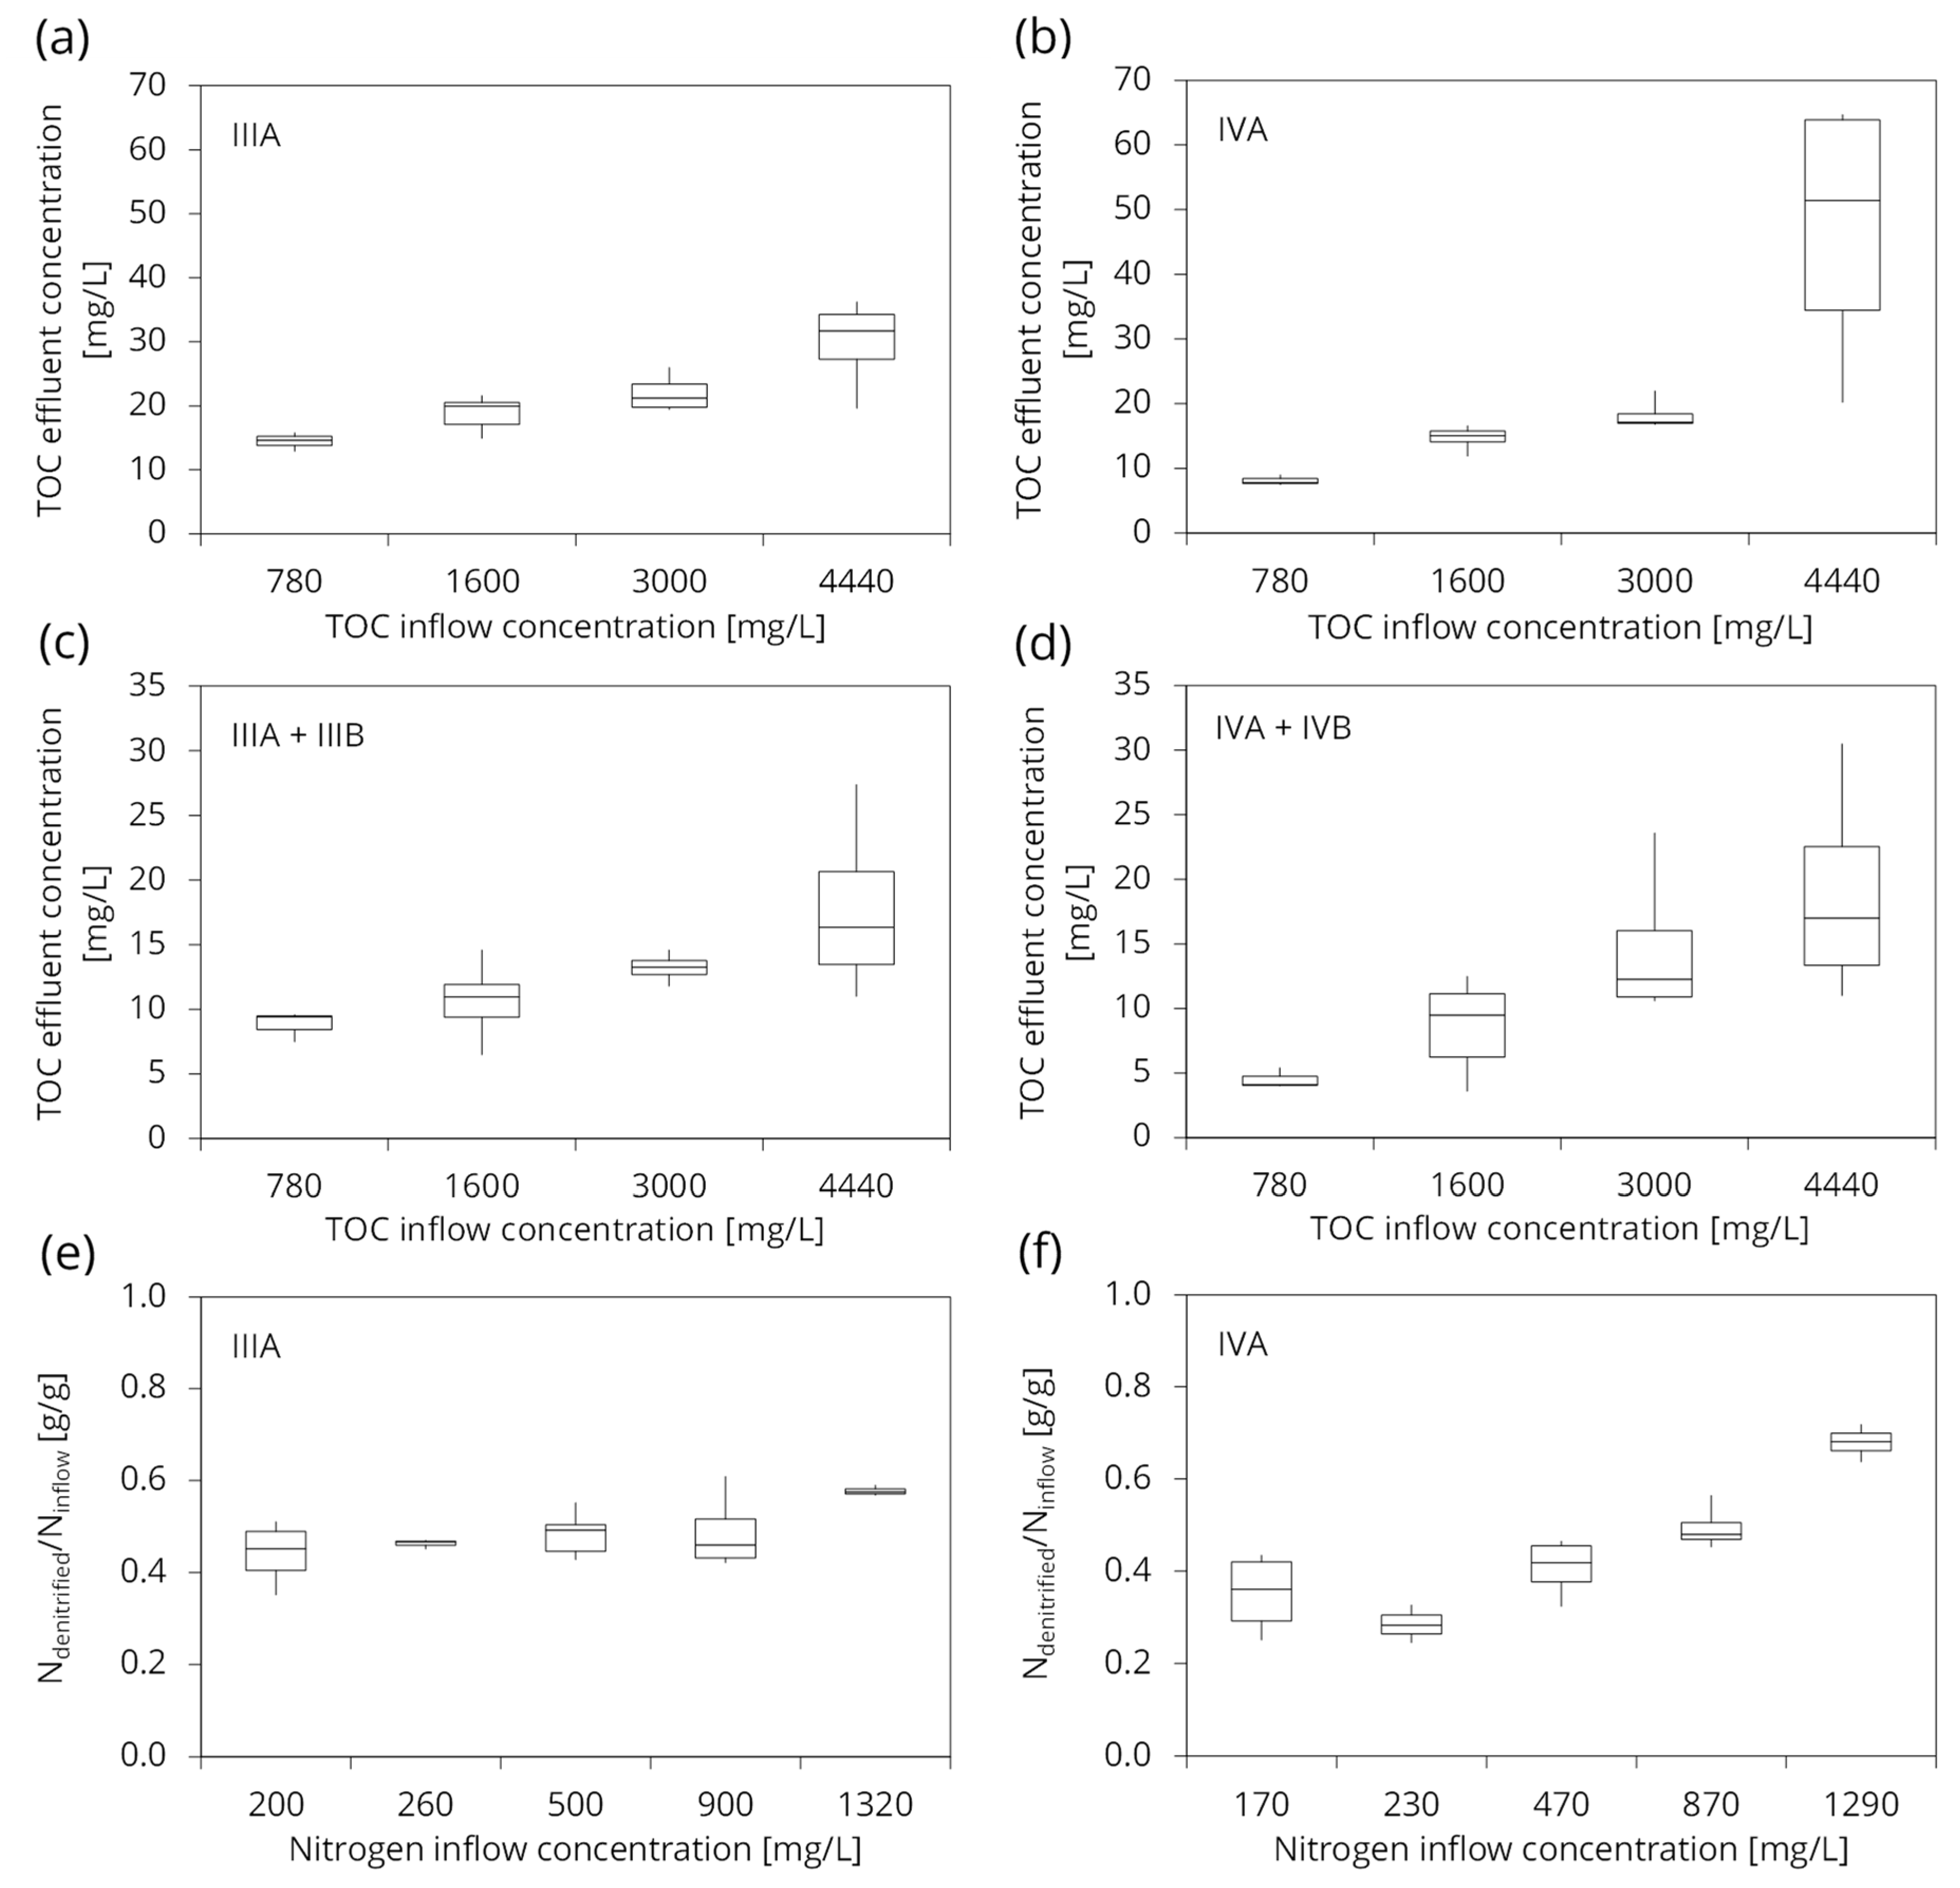
4.5. Impact of the Inflow Concentration on the Effluent Concentration
4.6. Effects of Seeding on the Start-Up Phase
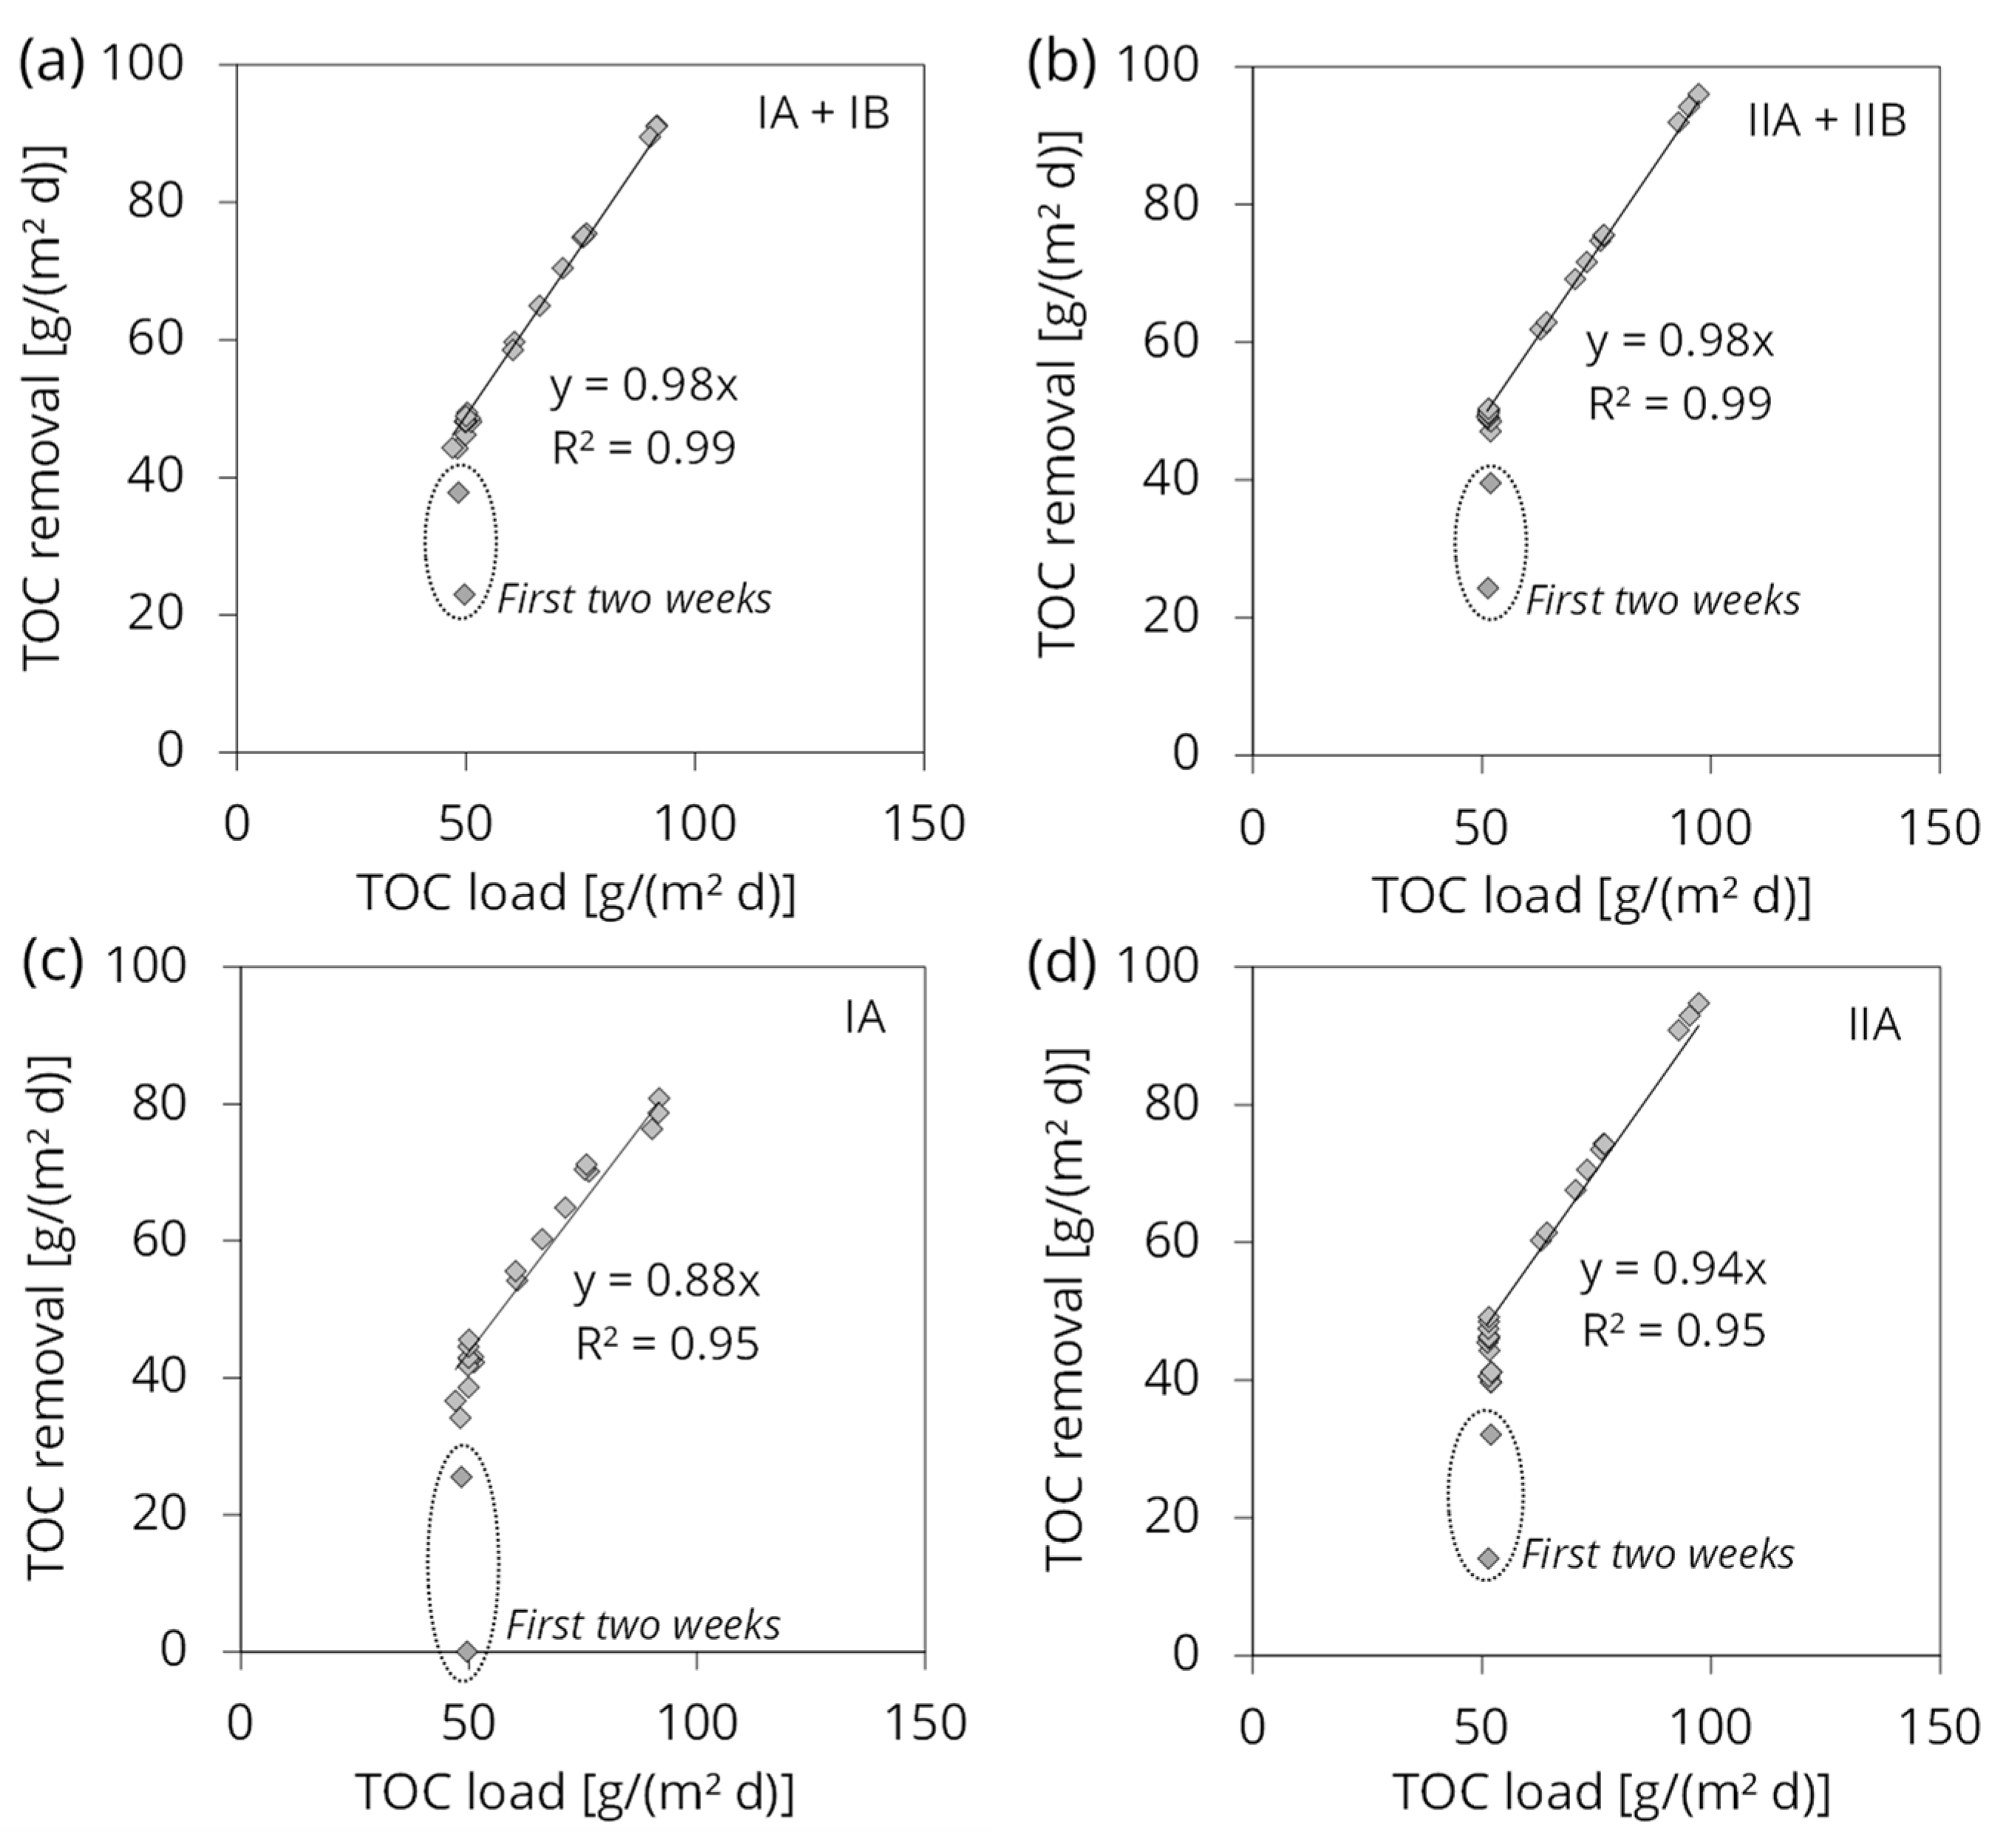
4.7. Assessment of the Removal Rates
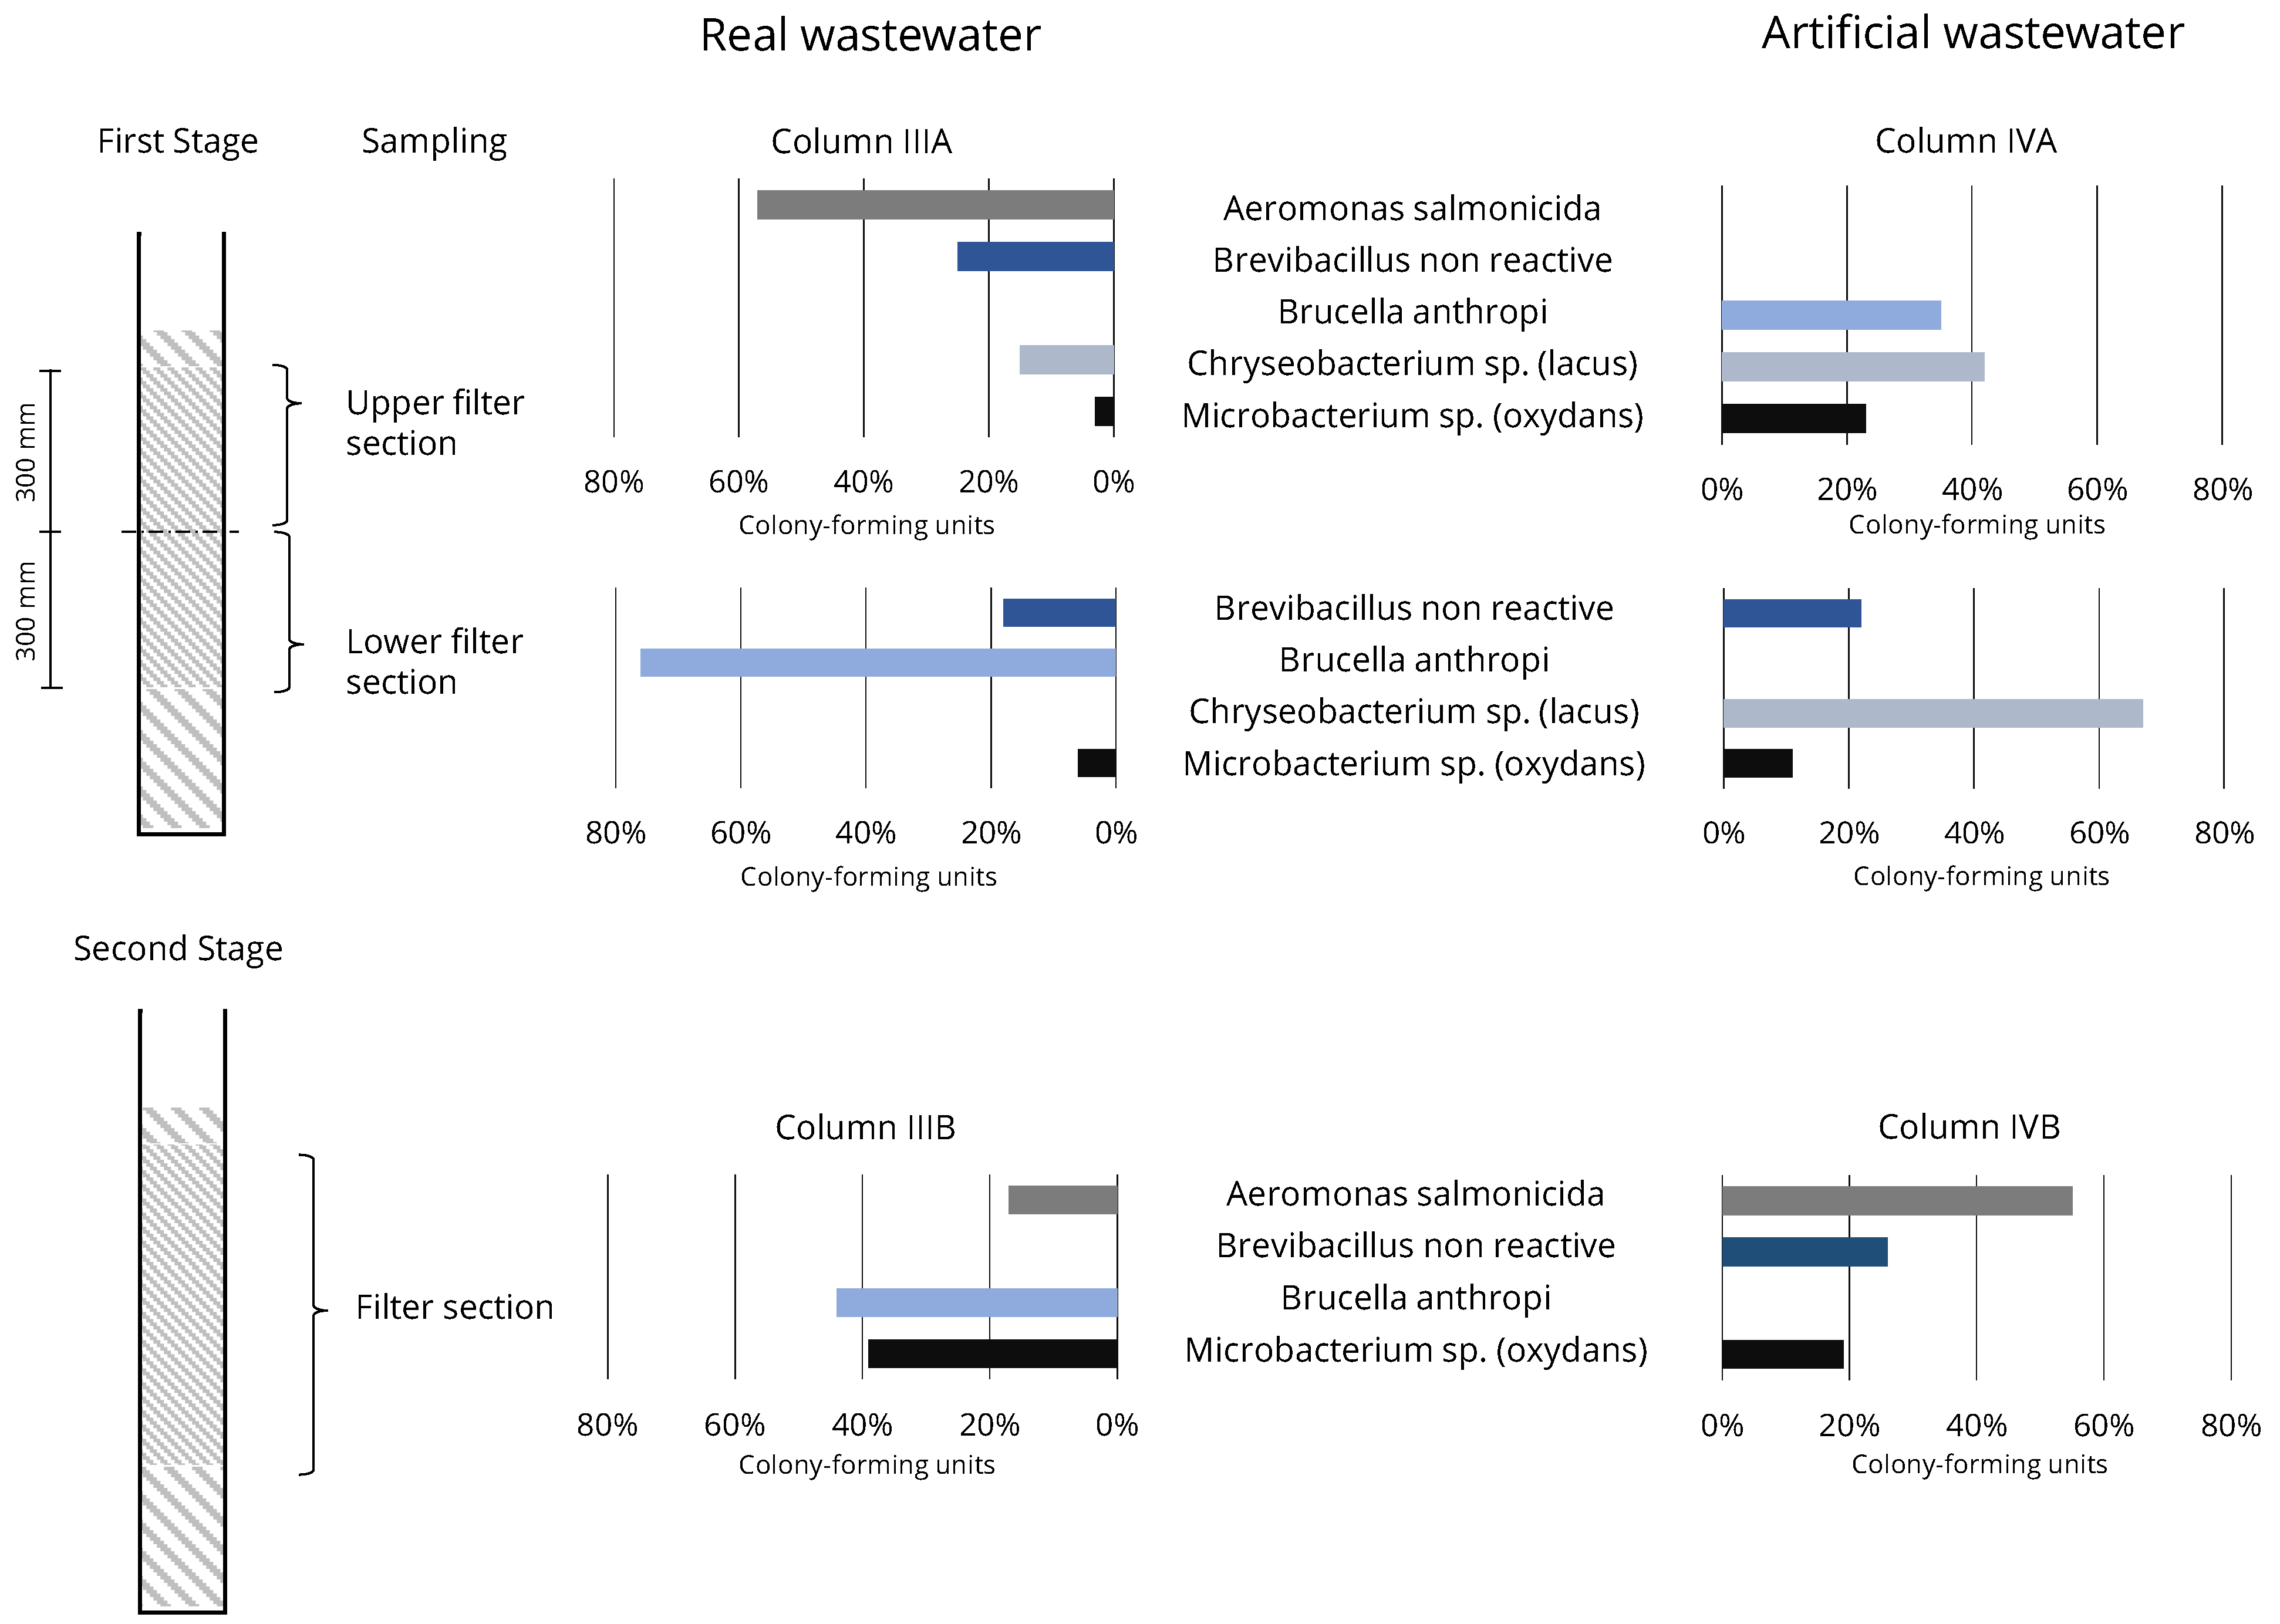
4.8. Degradation Pathways and Microbial Composition
4.9. Evaluation of the COD Analyses
4.10. Ecotoxicological Effects
4.11. Recommendations
5. Conclusions
Author Contributions
Funding
Data Availability Statement
Acknowledgments
Conflicts of Interest
Appendix A. Tables

| Parameter | Unit | First Stage | Combination | ||||
|---|---|---|---|---|---|---|---|
| IA | IIA | IA + IB | IA + IC | IIA + IIB | IIA + IIC | ||
| LA,TOC | [g/(m2 d)] | 61 ± 15 | 63 ± 16 | 61 ± 15 | 61 ± 15 | 63 ± 16 | 63 ± 16 |
| 47–92 | 51–97 | 47–92 | 47–92 | 51–97 | 51–97 | ||
| ηTOC | [%] | 81 ± 20 | 88 ± 16 | 94 ± 11 | 90 ± 18 | 94 ± 11 | 93 ± 13 |
| 0–94 | 28–98 | 46–99 | 25–99 | 47–99 | 38–99 | ||
| CTOC,feed | [mg/L] | 768 ± 197 | 768 ± 197 | 768 ± 197 | 768 ± 197 | 768 ± 197 | 768 ± 197 |
| 621–1164 | 621–1164 | 621–1164 | 621–1164 | 621–1164 | 621–1164 | ||
| CTOC,eff | [mg/L] | 129 ± 118 | 77 ± 94 | 34 ± 65 | 56 ± 97 | 37 ± 71 | 44 ± 76 |
| 54–623 | 23–450 | 6.5–319 | 12–443 | 9.2–350 | 13–374 | ||
| LA,DMAc | [g/(m2 d)] | 111 ± 28 | 115 ± 29 | 111 ± 28 | 111 ± 28 | 115 ± 29 | 115 ± 29 |
| 85–166 | 93–176 | 85–166 | 85–166 | 93–176 | 93–176 | ||
| ηDMAc | [%] | 93 ± 20 | 95 ± 14 | 98 ± 8.1 | 97 ± 11 | 98 ± 8.4 | 98 ± 9.3 |
| 10–100 | 37–100 | 61–100 | 47–100 | 60–100 | 56–100 | ||
| CDMAc,feed | [mg/L] | 1391 ± 357 | 1391 ± 357 | 1391 ± 357 | 1391 ± 357 | 1391 ± 357 | 1391 ± 357 |
| 1125–2109 | 1125–2109 | 1125–2109 | 1125–2109 | 1125–2109 | 1125–2109 | ||
| CDMAc,eff | [mg/L] | 71 ± 217 | 50 ± 151 | 18 ± 87 | 25 ± 119 | 21 ± 101 | 22 ± 100 |
| 0.1–1017 | 0.1–714 | 0.1–415 | 0.1–568 | 0.1–484 | 0.1–482 | ||
| CDMA,eff | [mg/L] | 98 ± 62 | 53 ± 69 | 22 ± 58 | 44 ± 110 | 20 ± 51 | 22 ± 50 |
| 25–255 | 5.0–285 | 5.0–235 | 5.0–383 | 5.0–222 | 5.0–211 | ||
| LA,TKN | [g/(m2 d)] | 18 ± 4.5 | 18 ± 4.6 | 18 ± 4.5 | 18 ± 4.5 | 18 ± 4.6 | 18 ± 4.6 |
| 14–27 | 15–28 | 14–27 | 14–27 | 15–28 | 15–28 | ||
| ηTKN | [% TKNfeed] | 38 ± 25 | 69 ± 34 | 73 ± 36 | 61 ± 39 | 78 ± 32 | 76 ± 34 |
| 5.5–72 | 7.8–97 | 10–99 | 2–98 | 21–99 | 20–99 | ||
| ηnitrification | [% TKNfeed] | 31 ± 23 | 62 ± 32 | 66 ± 35 | 54 ± 37 | 69 ± 30 | 67 ± 32 |
| 0.6–61 | 4.6–87 | 1.2–89 | 1.1–87 | 10–87 | 9.7–88 | ||
| ηdentrification | [% TKNfeed] | 31 ± 23 | 30 ± 18 | 29 ± 24 | 32 ± 23 | 32 ± 14 | 33 ± 16 |
| 0.0–61 | 4.1–58 | 0.0–60 | 0.0–63 | 8.5–54 | 9.2–59 | ||
| CTKN,feed | [mg/L] | 224 ± 58 | 224 ± 58 | 224 ± 58 | 224 ± 58 | 224 ± 58 | 224 ± 58 |
| 181–340 | 181–340 | 181–340 | 181–340 | 181–340 | 181–340 | ||
| CTKN,eff | [mg/L] | 123 ± 34 | 52 ± 60 | 41 ± 58 | 66 ± 68 | 38 ± 56 | 39 ± 59 |
| 71–191 | 6.2–167 | 3.0–149 | 4.4–152 | 3.0–143 | 3.0–143 | ||
| CNH4-N,eff | [mg/L] | 80 ± 31 | 26 ± 35 | 30 ± 48 | 47 ± 59 | 26 ± 45 | 27 ± 45 |
| 7.8–134 | 3.0–108 | 3.0–134 | 3.0–151 | 3.0–130 | 3.0–126 | ||
| CNO3-N,eff | [mg/L] | 1.1 ± 0.1 | 53 ± 46 | 56 ± 43 | 34 ± 38 | 69 ± 51 | 62 ± 52 |
| 1.0–1.6 | 1–103 | 1.0–113 | 1.0–89 | 1.0–118 | 1.0–118 | ||
| CNO2-N,eff | [mg/L] | 0.6 ± 1.7 | 19 ± 33 | 22 ± 45 | 18 ± 29 | 14 ± 36 | 19 ± 39 |
| 0.0–8.0 | 0.0–102 | 0.0–142 | 0.0–88 | 0.0–132 | 0.0–128 | ||
| Parameter | Unit | First Stage | Combination | ||
|---|---|---|---|---|---|
| IIIA | IVA | IIIA + IIIB | IVA + IVB | ||
| LA,TOC | [g/(m2 d)] | 47 ± 2.1 | 47 ± 2.1 | 47 ± 2.1 | 47 ± 2.1 |
| 42–49 | 44–52 | 42–49 | 44–52 | ||
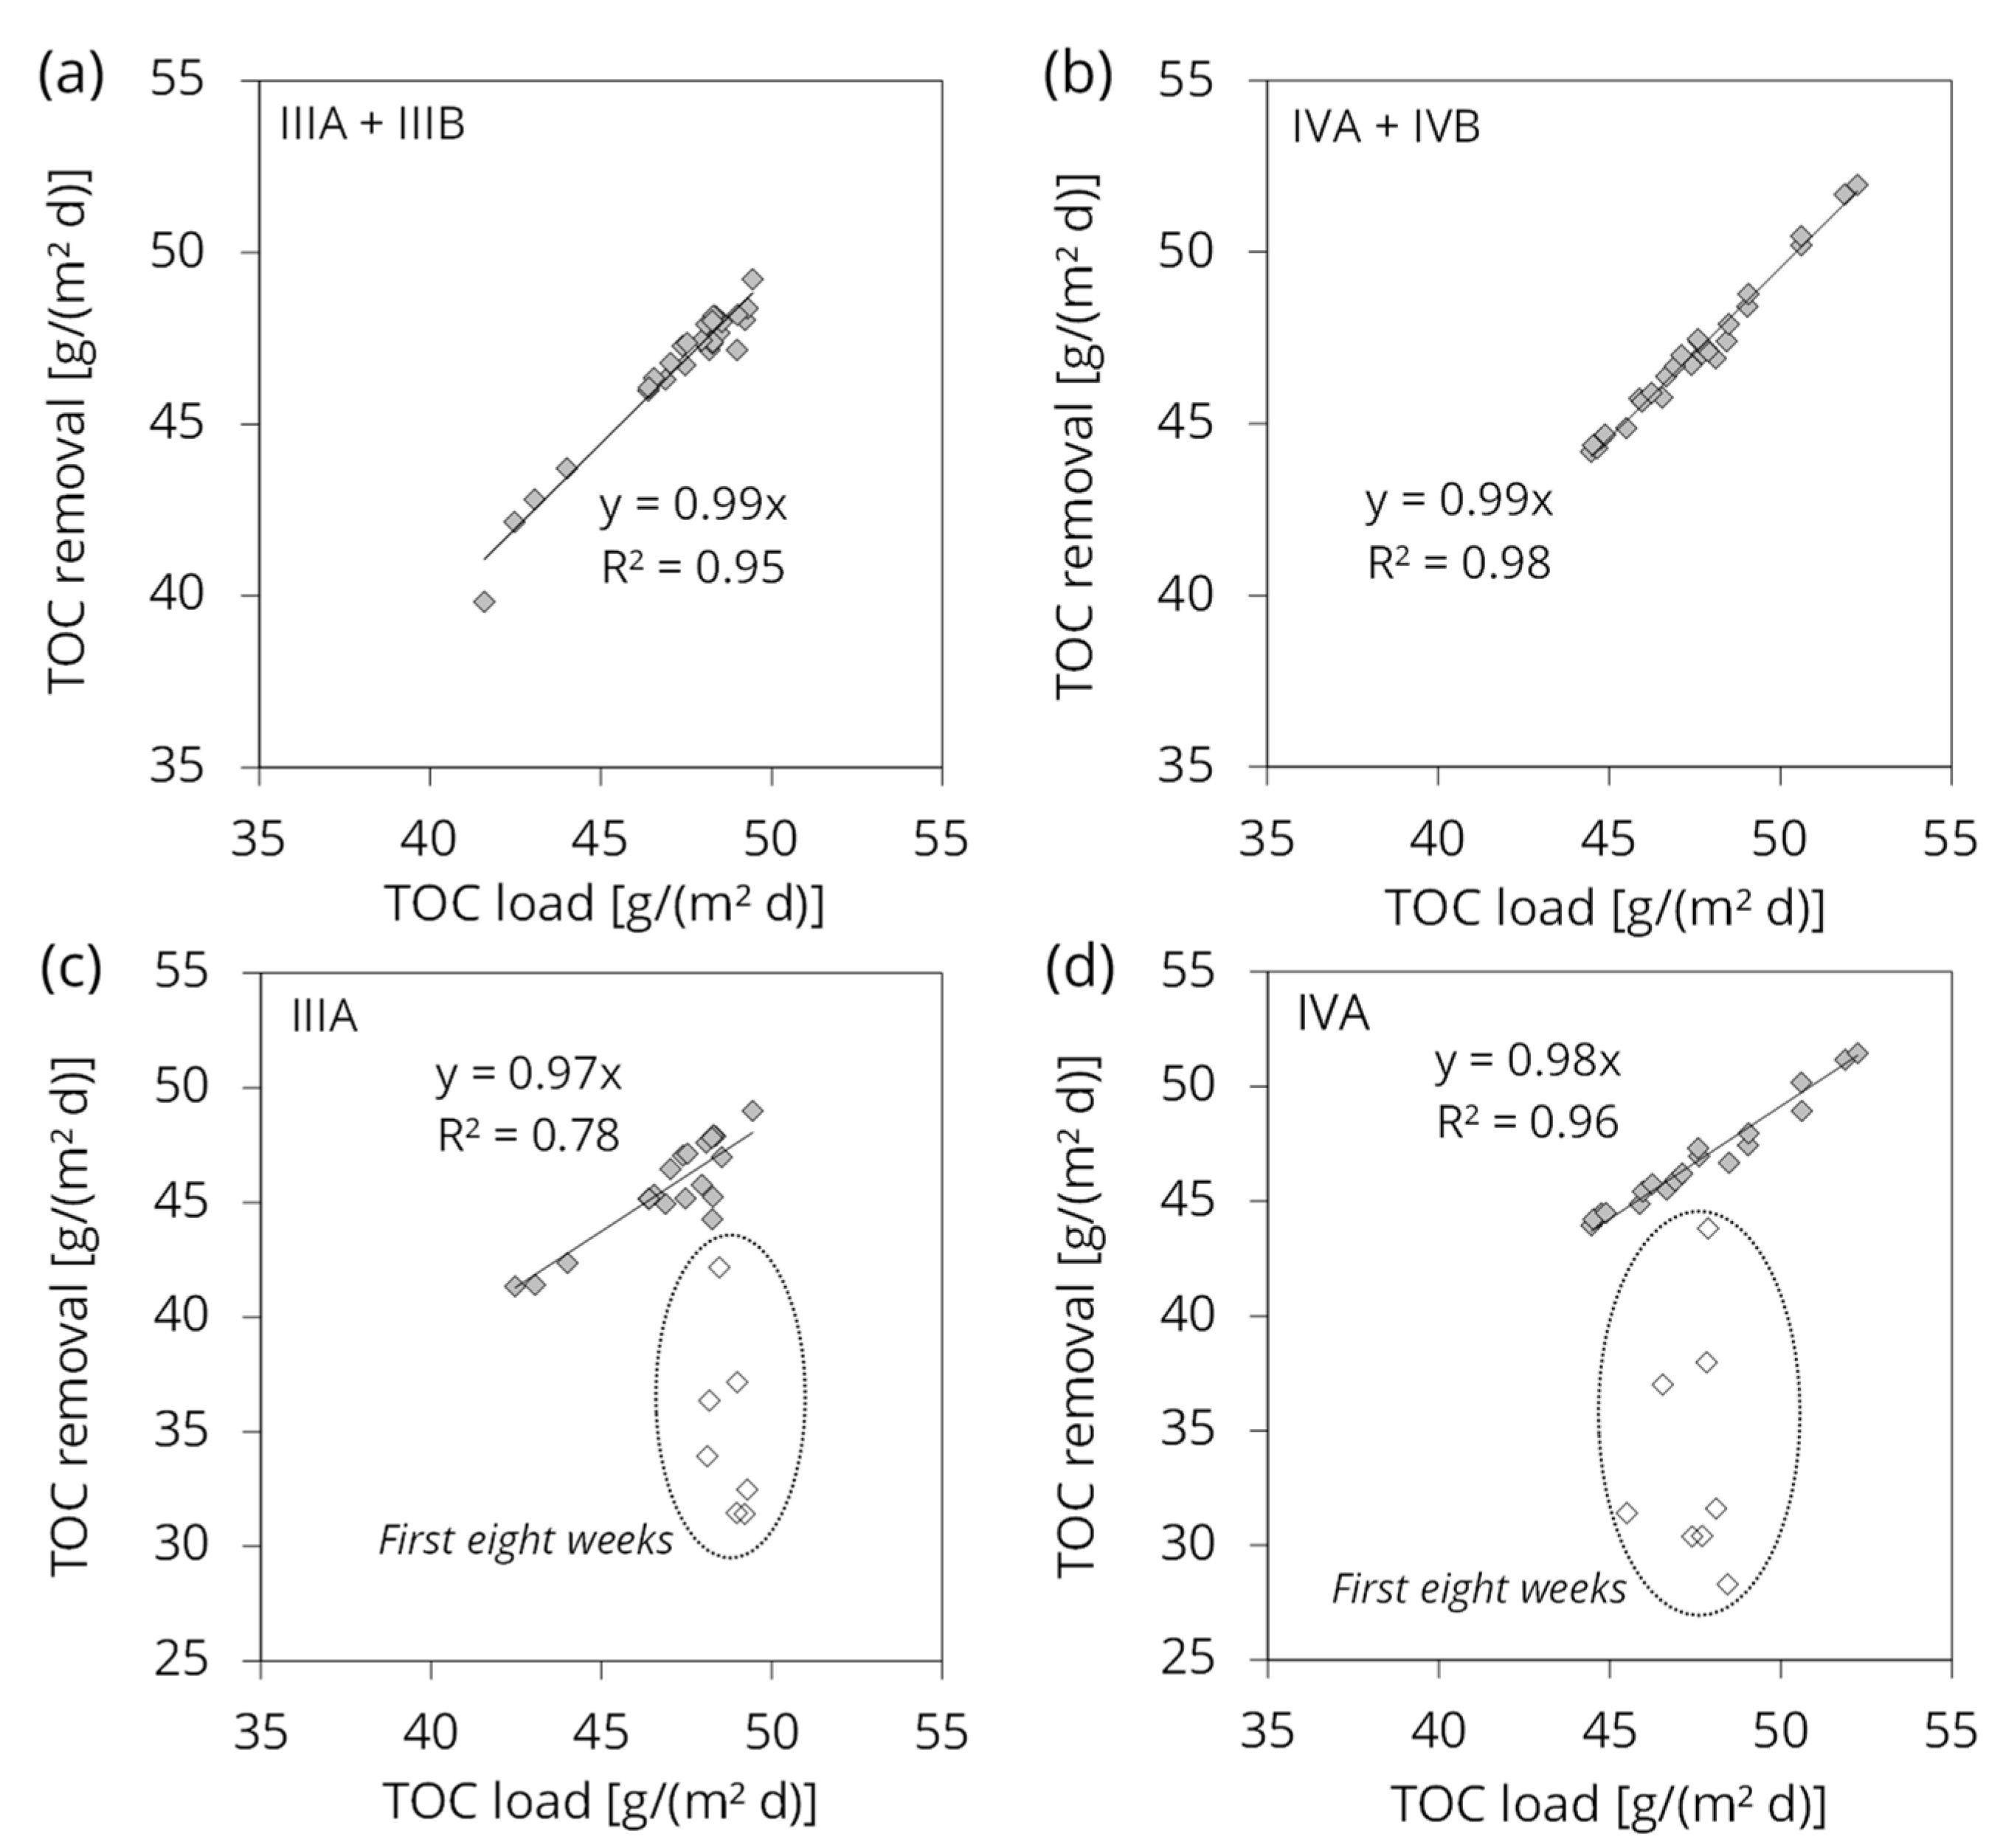
| ηTOC | [%] | 90 ± 12 | 91 ± 14 | 99 ± 1.0 | 99 ± 0.6 |
| 64–99 | 58–99 | 96–100 | 98–100 | ||
| CTOC,feed | [g/L] | 1.7 ± 1.4 | 1.7 ± 1.4 | 1.7 ± 1.4 | 1.7 ± 1.4 |
| 0.6–4.4 | 0.6–4.4 | 0.6–4.4 | 0.6–4.4 | ||
| CTOC,eff | [mg/L] | 64 ± 74 | 67 ± 75 | 13 ± 4.7 | 11 ± 6.3 |
| 13–244 | 15–249 | 6.5–27 | 3.6–31 | ||
| LA,DMAc | [g/(m2 d)] | 76 ± 6.3 | 86 ± 3.8 | 76 ± 6.3 | 86 ± 3.8 |
| 69–87 | 81–95 | 69–87 | 81–95 | ||
| ηDMAc | [%] | 96 ± 7.2 | 95 ± 9.8 | 100 ± 0.0 | 100 ± 0.0 |
| 79–100 | 68–100 | 100 | 100 | ||
| CDMAc.feed | [g/L] | 2.9 ± 2.6 | 3.1 ± 2.5 | 2.9 ± 2.6 | 3.1 ± 2.5 |
| 0.9–7.9 | 1.1–8.0 | 0.9–7.9 | 1.1–8.0 | ||
| CDMAc,eff | [mg/L] | 37 ± 64 | 54 ± 107 | 0.1 ± 0.0 | 0.1 ± 0.0 |
| 0.1–190 | 0.1–343 | 0.1 | 0.1 | ||
| CDMA,eff | [mg/L] | 125 ± 130 | 91 ± 102 | 5.0 ± 0.0 | 5.0 ± 0.7 |
| 5.0–346 | 5.0–248 | 5.0–5.0 | 5.0–8.0 | ||
| LA,TKN | [g/(m2 d)] | 15 ± 1.1 | 14 ± 0.6 | 15 ± 1.1 | 14 ± 0.6 |
| 13–16 | 13–15 | 13–16 | 13–15 | ||
| ηTKN | [% TKNfeed] | 83 ± 23 | 82 ± 26 | 95 ± 12 | 96 ± 7.8 |
| 0–100 | 0–99 | 49–100 | 62–100 | ||
| ηnitrification | [% TKNfeed | 79 ± 16 | 77 ± 17 | 85 ± 12 | 85 ± 7.7 |
| 36–89 | 34–88 | 39–89 | 51–88 | ||
| ηdentrification | [% TKNfeed] | 46 ± 11 | 42 ± 14 | 46 ± 10 | 43 ± 14 |
| 9.4–61 | 18–72 | 20–62 | 25–72 | ||
| CTKN,feed | [mg/L] | 532 ± 406 | 502 ± 407 | 532 ± 406 | 502 ± 407 |
| 201–1318 | 175–1294 | 201–1318 | 175–1294 | ||
| CTKN,eff | [mg/L] | 33 ± 44 | 35 ± 39 | 11 ± 23 | 9.5 ± 16 |
| 3.0–146 | 3.9–131 | 3.2–103 | 3.1–68 | ||
| CNH4-N,eff | [mg/L] | 9.5 ± 13 | 14 ± 16 | 9.3 ± 23 | 7.3 ± 16 |
| 3.0–58 | 3.0–60 | 3.0–102 | 3.0–68 | ||
| CNO3-N,eff | [mg/L] | 173 ± 152 | 146 ± 119 | 197 ± 140 | 182 ± 107 |
| 1.0–420 | 1.0–373 | 1.0–455 | 3.0–386 | ||
| CNO2-N,eff | [mg/L] | 0.5 ± 0.9 | 5.8 ± 9.4 | 0.2 ± 0.3 | 0.2 ± 0.5 |
| 0–2.8 | 0–36 | 0–1.4 | 0–2.7 | ||
Appendix B. Figures


References
- Dong, X.; Lu, D.; Harris, T.A.L.; Escobar, I.C. Polymers and Solvents Used in Membrane Fabrication: A Review Focusing on Sustainable Membrane Development. Membranes 2021, 11, 309. [Google Scholar] [CrossRef] [PubMed]
- Figoli, A.; Marino, T.; Simone, S.; Di Nicolò, E.; Li, X.-M.; He, T.; Tornaghi, S.; Drioli, E. Towards Non-Toxic Solvents for Membrane Preparation: A Review. Green Chem. 2014, 16, 4034. [Google Scholar] [CrossRef]
- Peinemann, K.P.; Nunes, S.P. Polymermembranen. In Membranen: Grundlagen, Verfahren und Industrielle Anwendungen; Ohlrogge, K., Ebert, K., Eds.; WILEY-VCH Verlag GmbH & Co. KGaA: Weinheim, Germany, 2006; pp. 1–22. ISBN 978-3-527-30979-5. [Google Scholar]
- Zou, D.; Nunes, S.P.; Vankelecom, I.F.J.; Figoli, A.; Lee, Y.M. Recent Advances in Polymer Membranes Employing Non-Toxic Solvents and Materials. Green Chem. 2021, 23, 9815–9843. [Google Scholar] [CrossRef]
- ECHA Annex XV Restriction Report. Proposal for a Restriction. Substance Names(s): N,N-Dimethylacetamide (DMAC) and 1-Ethylpyrrolidin-2-One (NEP); European Chemicals Agency: Helsinki, Finland; Bureau REACH, National Institute for Public Health and the Environment (RIVM): Bilthoven, The Netherlands, 2022. [Google Scholar]
- German Environment Agency (Umweltbundesamt—UBA). Bekanntmachung der bereits durch die oder auf Grund der Verwaltungsvorschrift wassergefährdende Stoffe eingestuften Stoffe, Stoffgruppen und Gemische gemäß § 66 Satz 1 der Verordnung über Anlagen zum Umgang mit wassergefährdenden Stoffen. Bundesanzeiger, 10 August 2017; p. B5.
- Li, Y.; Wu, H.; Liang, X.; Rong, C.; Chen, H. Experimental Study of Waste Concentration by Mechanical Vapor Compression Technology. Desalination 2015, 361, 46–52. [Google Scholar] [CrossRef]
- Bhojani, G.; Jani, S.; Saha, N.K. Facile biodegradation of N,N-dimethylformamide, N,N-dimethylacetamide and N-methyl-2-pyrrolidone by source-derived Bacillus strain APS1 for water reclamation and reuse. J. Clean. Prod. 2022, 334, 130098. [Google Scholar] [CrossRef]
- Chen, X.; Yang, C.; Wang, W.; Ge, B.; Zhang, J.; Liu, Y.; Nan, Y. Biodegradation of N,N-Dimethylacetamide by Rhodococcus Sp. Strain B83 Isolated from the Rhizosphere of Pagoda Tree. J. Environ. Sci. 2017, 53, 88–98. [Google Scholar] [CrossRef]
- Santoshkumar, M.; Veeranagouda, Y.; Lee, K.; Karegoudar, T.B. Utilization of Aliphatic Nitrile by Paracoccus Sp. SKG Isolated from Chemical Waste Samples. Int. Biodeterior. Biodegrad. 2011, 65, 153–159. [Google Scholar] [CrossRef]
- Yuan, B.; Yao, J.; Wang, Z.; Dai, L.; Zhao, M.; Hrynsphan, D.; Tatsiana, S.; Chen, J. Increasing N,N-Dimethylacetamide Degradation and Mineralization Efficiency by Co-Culture of Rhodococcus Ruber HJM-8 and Paracoccus Communis YBH-X. Chemosphere 2022, 303, 134935. [Google Scholar] [CrossRef]
- Guo, T.; Ji, Y.; Zhao, J.; Horn, H.; Li, J. Coupling of Fe-C and Aerobic Granular Sludge to Treat Refractory Wastewater from a Membrane Manufacturer in a Pilot-Scale System. Water Res. 2020, 186, 116331. [Google Scholar] [CrossRef]
- Zhuo, M.; Abass, O.K.; Zhang, K. New Insights into the Treatment of Real N,N-Dimethylacetamide Contaminated Wastewater Using a Membrane Bioreactor and Its Membrane Fouling Implications. RSC Adv. 2018, 8, 12799–12807. [Google Scholar] [CrossRef] [PubMed] [Green Version]
- Jie, L.; Yongfeng, S.; Yae, W.; Yuexi, Z.; Jinyuan, J. Treatment of Acrylic Fiber Wastewater Treatment Using Combined Process of Iron Carbon Micro-Electrolysis and SBBR. In Proceedings of the 2011 International Conference on Computer Distributed Control and Intelligent Environmental Monitoring, Changsha, China, 19–20 February 2011; pp. 2356–2359. [Google Scholar]
- Li, J.; Yu, D.; Zhang, P. Partial Nitrification in a Sequencing Batch Reactor Treating Acrylic Fiber Wastewater. Biodegradation 2013, 24, 427–435. [Google Scholar] [CrossRef] [PubMed]
- Xie, J.; Chang, Y.; Chen, C.; Ma, J.; Liu, H.; Cui, H.; Zhang, T.C. Bioelectrochemical Systems with a Cathode of Stainless-Steel Electrode for Treatment of Refractory Wastewater: Influence of Electrode Material on System Performance and Microbial Community. Bioresour. Technol. 2021, 342, 125959. [Google Scholar] [CrossRef] [PubMed]
- Behrouzeh, M.; Abbasi, M.; Osfouri, S.; Dianat, M.J. Treatment of DMSO and DMAC Wastewaters of Various Industries by Employing Fenton Process: Process Performance and Kinetics Study. J. Environ. Chem. Eng. 2020, 8, 103597. [Google Scholar] [CrossRef]
- Li, J.; Luan, Z.; Yu, L.; Ji, Z. Pretreatment of Acrylic Fiber Manufacturing Wastewater by the Fenton Process. Desalination 2012, 284, 62–65. [Google Scholar] [CrossRef]
- Li, W.; Chen, M.; Zhong, Z.; Zhou, M.; Xing, W. Hydroxyl Radical Intensified Cu2O NPs/H2O2 Process in Ceramic Membrane Reactor for Degradation on DMAc Wastewater from Polymeric Membrane Manufacturer. Front. Environ. Sci. Eng. 2020, 14, 102. [Google Scholar] [CrossRef]
- Yuan, Y.; Geng, F.; Shi, B.; Lai, B. Simultaneous Thermal Activation of Persulfate/Fenton System for High-Concentration N,N-Dimethylacetamide Degradation: Parameter Optimization and Degradation Mechanism. Environ. Eng. Sci. 2019, 36, 12–22. [Google Scholar] [CrossRef]
- Zhou, M.; Li, W.; Chen, M.; Zhong, Z.; Xing, W. Synthesis of CuxCo3−xO4 Nanocatalyst for Degradation of Nitrogenous Organic Wastewater in Fenton-like Membrane Reactor. Appl. Water Sci. 2022, 12, 57. [Google Scholar] [CrossRef]
- Xiong, Z.; Li, J.; Li, Y.; Yuan, Y.; Jiang, Y.; Yao, G.; Lai, B. Simultaneously Enhanced Degradation of N,N-Dimethylacetamide and Reduced Formation of Iron Sludge by an Efficient Electrolysis Catalyzed Ozone Process in the Presence of Dissolved Silicate. J. Hazard. Mater. 2021, 406, 124725. [Google Scholar] [CrossRef]
- Cooper, P. A Review of the Design and Performance of Vertical-Flow and Hybrid Reed Bed Treatment Systems. Water Sci. Technol. 1999, 40, 1–9. [Google Scholar] [CrossRef]
- von Felde, K.; Kunst, S. N- and COD-Removal in Vertical-Flow Systems. Water Sci. Technol. 1997, 35, 79–85. [Google Scholar] [CrossRef]
- Vymazal, J. Removal of Nutrients in Various Types of Constructed Wetlands. Sci. Total Environ. 2007, 380, 48–65. [Google Scholar] [CrossRef] [PubMed]
- Dotro, G.; Langergraber, G.; Molle, P.; Nivala, J.; Puigagut, J.; Stein, O.; von Sperling, M. Treatment Wetlands; Biological Wastewater Treatment Series; IWA Publishing: London, UK, 2017; Volume 7, ISBN 978-1-78040-877-4. [Google Scholar]
- Schalk, T.; Marx, C.; Haupt, A.; Kühn, V.; Krebs, P. Long-Term Effects of Sulfide on Ammonia Oxidation and Nitrite Accumulation in a Seasonally Loaded Vertical Flow Constructed Wetland. Wetlands 2020, 40, 205–222. [Google Scholar] [CrossRef]
- Cooper, P. Constructed Wetlands and Reed-Beds: Mature Technology for the Treatment of Wastewater from Small Populations. Water Environ. J. 2001, 15, 79–85. [Google Scholar] [CrossRef]
- Martinez-Guerra, E.; Jiang, Y.; Lee, G.; Kokabian, B.; Fast, S.; Truax, D.D.; Martin, J.L.; Magbanua, B.S.; Gude, V.G. Wetlands for Wastewater Treatment. Water Env. Res. 2015, 87, 1095–1126. [Google Scholar] [CrossRef] [PubMed]
- Masi, F.; Rochereau, J.; Troesch, S.; Ruiz, I.; Soto, M. Wineries Wastewater Treatment by Constructed Wetlands: A Review. Water Sci. Technol. 2015, 71, 1113–1127. [Google Scholar] [CrossRef]
- Paing, J.; Serdobbel, V.; Welschbillig, M.; Calvez, M.; Gagnon, V.; Chazarenc, F. Treatment of High Organic Content Wastewater from Food-Processing Industry with the French Vertical Flow Constructed Wetland System. Water Sci. Technol. 2015, 72, 70–76. [Google Scholar] [CrossRef]
- Pascual, A.; De la Varga, D.; Soto, M.; Van Oirschot, D.; Kilian, R.M.; Álvarez, J.A.; Carvalho, P.; Brix, H.; Arias, C.A. Aerated Constructed Wetlands for Treatment of Municipal and Food Industry Wastewater. In Constructed Wetlands for Industrial Wastewater Treatment; Alexandros, S., Ed.; Wiley: Hoboken, NJ, USA, 2018; ISBN 978-1-119-26834-5. [Google Scholar]
- Haberl, R.; Grego, S.; Langergraber, G.; Kadlec, R.H.; Cicalini, A.-R.; Dias, S.M.; Novais, J.M.; Aubert, S.; Gerth, A.; Thomas, H.; et al. Constructed Wetlands for the Treatment of Organic Pollutants. J. Soils Sediments 2003, 3, 109–124. [Google Scholar] [CrossRef]
- Al-Isawi, R.H.K.; Sani, A.; Almuktar, S.A.A.A.N.; Scholz, M. Vertical-Flow Constructed Wetlands Treating Domestic Wastewater Contaminated by Hydrocarbons. Water Sci. Technol. 2015, 71, 938–946. [Google Scholar] [CrossRef]
- van Afferden, M.; Rahman, K.Z.; Mosig, P.; De Biase, C.; Thullner, M.; Oswald, S.E.; Müller, R.A. Remediation of Groundwater Contaminated with MTBE and Benzene: The Potential of Vertical-Flow Soil Filter Systems. Water Res. 2011, 45, 5063–5074. [Google Scholar] [CrossRef]
- Rahim, F.; Abdullah, S.R.S.; Abu Hasan, H.; Kurniawan, S.B.; Mamat, A.; Yusof, K.A.; Ambak, K.I. A Feasibility Study for the Treatment of 1,2-Dichloroethane-Contaminated Groundwater Using Reedbed System and Assessment of Its Natural Attenuation. Sci. Total Environ. 2022, 814, 152799. [Google Scholar] [CrossRef]
- German Standard DWA-A 262; Grundsätze für Bemessung, Bau und Betrieb von Kläranlagen mit bepflanzten und unbepflanzten Filtern zur Reinigung häuslichen und kommunalen Abwassers (DWA Principles for Dimensioning, Construction and Operation of Wastewater Treatment Plants with Planted and Unplanted Filters for Treatment of Domestic and Municipal Wastewater); DWA (Ed.) German Association for Water, Wastewater and Waste (DWA): Hennef, Germany, 2017; ISBN 978-3-88721-547-7. [Google Scholar]
- Nivala, J.; van Afferden, M.; Hasselbach, R.; Langergraber, G.; Molle, P.; Rustige, H.; Nowak, J. The New German Standard on Constructed Wetland Systems for Treatment of Domestic and Municipal Wastewater. Water Sci. Technol. 2018, 78, 2414–2426. [Google Scholar] [CrossRef] [Green Version]
- Czjzek, M.; Santos, J.-P.D.; Pommier, J. Crystal Structure of Oxidized Trimethylamine N-Oxide Reductase from Shewanella Massilia at 2.5 AÊ Resolution. J. Mol. Biol. 1998, 284, 435–447. [Google Scholar] [CrossRef]
- Eberhardt, J.; Santos-Martins, D.; Tillack, A.F.; Forli, S. AutoDock Vina 1.2.0: New Docking Methods, Expanded Force Field, and Python Bindings. J. Chem. Inf. Model. 2021, 61, 3891–3898. [Google Scholar] [CrossRef] [PubMed]
- Trott, O.; Olson, A.J. AutoDock Vina: Improving the Speed and Accuracy of Docking with a New Scoring Function, Efficient Optimization, and Multithreading. J. Comput. Chem. 2010, 31, 455–461. [Google Scholar] [CrossRef] [Green Version]
- Reifferscheid, G.; Dill, F.; Fieblinger, D.; Gminski, R.; Grummt, H.-J.; Hafner, C.; Hollert, H.; Kunz, S.; Rodrigo, G.; Stopper, H.; et al. Untersuchung von Abwasserproben auf Gentoxizität. (Measurement of Genotoxicity in Wastewater Samples—Results of a Collaborative Study on the in Vitro Micronucleus Test in the Context of Standardisation According to ISO). Umweltwiss. Und Schadst. Forsch. 2007, 19, 7–16. [Google Scholar] [CrossRef]
- Sommaggio, L.R.D.; Mazzeo, D.E.C.; Pamplona-Silva, M.T.; Marin-Morales, M.A. Evaluation of the Potential Agricultural Use of Biostimulated Sewage Sludge Using Mammalian Cell Culture Assays. Chemosphere 2018, 199, 10–15. [Google Scholar] [CrossRef] [Green Version]
- Kim, H.; Xue, X. Detection of Total Reactive Oxygen Species in Adherent Cells by 2′,7′-Dichlorodihydrofluorescein Diacetate Staining. J. Vis. Exp. 2020, 2020, e60682. [Google Scholar] [CrossRef]
- Graumans, M.H.F.; van Hove, H.; Schirris, T.; Hoeben, W.F.L.M.; van Dael, M.F.P.; Anzion, R.B.M.; Russel, F.G.M.; Scheepers, P.T.J. Determination of Cytotoxicity Following Oxidative Treatment of Pharmaceutical Residues in Wastewater. Chemosphere 2022, 303, 135022. [Google Scholar] [CrossRef]
- Badr, D.M.; Hafez, H.F.; Agha, A.M.; Shouman, S.A. The Combination of α-Tocopheryl Succinate and Sodium Selenite on Breast Cancer: A Merit or a Demerit? Oxidative Med. Cell. Longev. 2016, 2016, 4741694. [Google Scholar] [CrossRef] [Green Version]
- Lanza-Jacoby, S.; Cheng, G. 3,3′-Diindolylmethane Enhances Apoptosis in Docetaxel-Treated Breast Cancer Cells by Generation of Reactive Oxygen Species. Pharm. Biol. 2018, 56, 407–414. [Google Scholar] [CrossRef] [Green Version]
- Roesslein, M.; Hirsch, C.; Kaiser, J.-P.; Krug, H.; Wick, P. Comparability of in Vitro Tests for Bioactive Nanoparticles: A Common Assay to Detect Reactive Oxygen Species as an Example. IJMS 2013, 14, 24320–24337. [Google Scholar] [CrossRef] [PubMed] [Green Version]
- Magdeburg, A.; Stalter, D.; Schlüsener, M.; Ternes, T.; Oehlmann, J. Evaluating the Efficiency of Advanced Wastewater Treatment: Target Analysis of Organic Contaminants and (Geno-)Toxicity Assessment Tell a Different Story. Water Res. 2014, 50, 35–47. [Google Scholar] [CrossRef] [PubMed]
- McBride, G.B.; Tanner, C.C. Modelling Biofilm Nitrogen Transformations in Constructed Wetland Mesocosms with Fluctuating Water Levels. Ecol. Eng. 1999, 14, 93–106. [Google Scholar] [CrossRef]
- Rao, P.S.C.; Jessup, R.E. Simulation of Nitrogen Dynamics in Flooded Soils. Soil Sci. 1984, 138, 54–62. [Google Scholar] [CrossRef]
- Sikora, F.J.; Tong, Z.; Behrends, L.L.; Steinberg, S.L.; Coonrod, H.S. Ammonium Removal in Constructed Wetlands with Recirculating Subsurface Flow: Removal Rates and Mechanisms. Water Sci. Technol. 1995, 32, 193–202. [Google Scholar] [CrossRef]
- Gamar-Nourani, L.; Blondeau, K.; Simonet, J.-M. Influence of Culture Conditions on Exopolysaccharide Production by Lactobacillus Rhamnosus Strain C83. J. Appl. Microbiol. 1998, 85, 664–672. [Google Scholar] [CrossRef]
- McKinley, J.W.; Siegrist, R.L. Soil Clogging Genesis in Soil Treatment Units Used for Onsite Wastewater Reclamation: A Review. Crit. Rev. Environ. Sci. Technol. 2011, 41, 2186–2209. [Google Scholar] [CrossRef]
- Nevo, Z.; Mitchell, R. Factors Affecting Biological Clogging of Sand Associated with Ground Water Recharge. Water Res. 1967, 1, 231–236. [Google Scholar] [CrossRef]
- Rubol, S.; Freixa, A.; Carles-Brangarí, A.; Fernàndez-Garcia, D.; Romaní, A.M.; Sanchez-Vila, X. Connecting Bacterial Colonization to Physical and Biochemical Changes in a Sand Box Infiltration Experiment. J. Hydrol. 2014, 517, 317–327. [Google Scholar] [CrossRef]
- Zhou, Y.; Luo, S.; Yu, B.; Zhang, T.; Li, J.; Zhang, Y. A Comparative Analysis for the Development and Recovery Processes of Different Types of Clogging in Lab-Scale Vertical Flow Constructed Wetlands. Env. Sci. Pollut. Res. 2018, 25, 24073–24083. [Google Scholar] [CrossRef]
- Boutin, C.; Prost-Boucle, S. Vertical Flow Constructed Wetlands Subject to Load Variations: An Improved Design Methodology Connected to Outlet Quality Objectives. Water Sci. Technol. 2015, 72, 817–823. [Google Scholar] [CrossRef]
- Veeranagouda, Y.; Emmanuel Paul, P.V.; Gorla, P.; Siddavattam, D.; Karegoudar, T.B. Complete Mineralisation of Dimethylformamide by Ochrobactrum Sp. DGVK1 Isolated from the Soil Samples Collected from the Coalmine Leftovers. Appl. Microbiol. Biotechnol. 2006, 71, 369–375. [Google Scholar] [CrossRef] [PubMed]
- Sanjeev Kumar, S.; Kumar, M.S.; Siddavattam, D.; Karegoudar, T.B. Generation of Continuous Packed Bed Reactor with PVA–Alginate Blend Immobilized Ochrobactrum Sp. DGVK1 Cells for Effective Removal of N,N-Dimethylformamide from Industrial Effluents. J. Hazard. Mater. 2012, 199–200, 58–63. [Google Scholar] [CrossRef] [PubMed]
- Wang, J.; Liu, X.; Jiang, X.; Zhang, L.; Hou, C.; Su, G.; Wang, L.; Mu, Y.; Shen, J. Facilitated Bio-Mineralization of N,N-Dimethylformamide in Anoxic Denitrification System: Long-Term Performance and Biological Mechanism. Water Res. 2020, 186, 116306. [Google Scholar] [CrossRef]
- Chudoba, J.; Zeis, K. Kinetics of Oxidation of Lower Aliphatic Amines and Pyridine Derivatives by the Dichromate Method. Acta Hydrochim. Hydrobiol. 1975, 3, 275–282. [Google Scholar] [CrossRef]
- Janicke, W. Chemische Oxidierbarkeit organischer Wasserinhaltsstoffe (Chemical Oxidizability of Organic Water Components); WaBoLu-Berichte, Berichtsreihe des Bundesgesundheitsamtes (Report series of the German Federal Health Agency); Dietrich Reimer Verlag: Berlin, Germany, 1983; ISBN 3-496-02164-0. [Google Scholar]
- Anderson, J.E.; Mueller, S.A.; Kim, B.R. Incomplete Oxidation of Ethylenediaminetetraacetic Acid in Chemical Oxygen Demand Analysis. Water Environ. Res. 2007, 79, 1043–1049. [Google Scholar] [CrossRef] [PubMed]
- Kim, Y.-C.; Sasaki, S.; Yano, K.; Ikebukuro, K.; Hashimoto, K.; Karube, I. Relationship between Theoretical Oxygen Demand and Photocatalytic Chemical Oxygen Demand for Specific Classes of Organic Chemicals. Analyst 2000, 125, 1915–1918. [Google Scholar] [CrossRef]
- Balimandawa, M.; de Meester, C.; Léonard, A. The Mutagenicity of Nitrite in the Salmonella/Microsome Test System. Mutat. Res. Genet. Toxicol. 1994, 321, 7–11. [Google Scholar] [CrossRef] [PubMed]
- Reifferscheid, G.; Ziemann, C.; Fieblinger, D.; Dill, F.; Gminski, R.; Grummt, H.-J.; Hafner, C.; Hollert, H.; Kunz, S.; Rodrigo, G.; et al. Measurement of Genotoxicity in Wastewater Samples with the in Vitro Micronucleus Test—Results of a Round-Robin Study in the Context of Standardisation According to ISO. Mutat. Res. Genet. Toxicol. Environ. Mutagen. 2008, 649, 15–27. [Google Scholar] [CrossRef]
- Finlayson, K.A.; van de Merwe, J.P.; Leusch, F.D.L. Review of Ecologically Relevant in Vitro Bioassays to Supplement Current in Vivo Tests for Whole Effluent Toxicity Testing—Part 2: Non-Apical Endpoints. Sci. Total Environ. 2022, 851, 158094. [Google Scholar] [CrossRef]
- Kuo, B.; Beal, M.A.; Wills, J.W.; White, P.A.; Marchetti, F.; Nong, A.; Barton-Maclaren, T.S.; Houck, K.; Yauk, C.L. Comprehensive Interpretation of in Vitro Micronucleus Test Results for 292 Chemicals: From Hazard Identification to Risk Assessment Application. Arch. Toxicol. 2022, 96, 2067–2085. [Google Scholar] [CrossRef] [PubMed]
- Tarpey, M.M.; Wink, D.A.; Grisham, M.B. Methods for Detection of Reactive Metabolites of Oxygen and Nitrogen: In Vitro and in Vivo Considerations. Am. J. Physiol. Regul. Integr. Comp. Physiol. 2004, 286, R431–R444. [Google Scholar] [CrossRef] [PubMed] [Green Version]
- Eckenfelder, W.W.; Ford, D.L.; Englande, A.J. Industrial Water Quality, 4th ed.; McGraw-Hill: New York, NY, USA, 2009; ISBN 978-0-07-154866-3. [Google Scholar]
- Water Environment Federation (Ed.) Operation of Municipal Wastewater Treatment Plants, 6th ed.; Manual of practice No. 11; WEF Press; McGraw Hill: New York, NY, USA, 2008; ISBN 978-0-07-154367-5. [Google Scholar]


| Trial no. | Combination | 1st Stage | 2nd Stage | Feed | ||
|---|---|---|---|---|---|---|
| Column | Grain Size | Column | Grain Size | |||
| 1 | IA + IB | IA | 2–4 mm | IB | 0–2 mm | DMAc |
| IA + IC | IA | 2–4 mm | IC | 2–4 mm | DMAc | |
| IIA + IIB | IIA | 2–8 mm | IIB | 0–2 mm | DMAc | |
| IIA + IIC | IIA | 2–8 mm | IIC | 2–4 mm | DMAc | |
| 2 | IIIA + IIIB | IIIA | 2–8 mm | IIIB | 0–2 mm | Wastewater |
| IVA + IVB | IVA | 2–8 mm | IVB | 0–2 mm | DMAc | |
| Parameter | Unit | Charge 1 | Charge 2 |
|---|---|---|---|
| Dimethylacetamide (DMAc) | [mg/L] | 2875 | 2287 |
| Dimethylamine (DMA) | [mg/L] | 274 | 143 |
| Total organic carbon (TOC) | [mg/L] | 1966 | 1408 |
| Chemical oxygen demand (COD) 1 | [mg/L] | 4789 | 3801 |
| Total nitrogen (TNb) | [mg/L] | 658 | 452 |
| Ammonium nitrogen (NH4-N) | [mg/L] | <3 | <3 |
| Enzyme | EC 1 | Catalyzed Process |
|---|---|---|
| Methylphosphonate transferase | 2.7.8.37 | DMAc → DMA (Candidate gene) |
| Trimethylamine-oxide aldolase | 4.1.2.32 | DMAc → DMA (Candidate gene) |
| Dimethylamine/trimethylamine dehydrogenase | 1.5.8.1 | Dimethylamine (DMA) → Methylamine |
| Methylamine dehydrogenase heavy chain | 1.4.9.1 | Methylamine → Formaldehyde |
| Dimethylformamide amidohydrolase | 3.5.1.56 | DMAc → DMA (Candidate gene) |
| Acetyl-CoA-arylethylamine-N-acetyltransferase | 2.3.1.87 | Acetyl-Coa → N-acetyl-2-arylethylamine |
| Cytochrome P450 2E1 | 1.14.14. | Oxidative demethylation of DMAc |
| Acetate kinase | 2.7.2.1 | Acetate → Acetylphosphate |
| Acetyl-CoA synthase | 6.2.1.1 | Acetate → Acetyl-CoA |
| Succinyl-Coa:acetate CoA-transferase | 2.8.3.18 | Acetate → Acetyl-CoA |
| Acetaldehyde dehydrogenase | 1.2.1.10 | Acetaldehyde → Acetyl-CoA |
| Source | Process | Parameter | Unit | DMAc | COD | TOC | TN | NH4-N |
|---|---|---|---|---|---|---|---|---|
| [12] | Electrolysis + Hydro-lysis + SBR + MBR | Feed Conc. | [mg/L] | – | 4100 | – | 150 | 15 |
| Removal | [%] | – | 98 | – | 57 2 | – | ||
| [13] 1 | Upstream denitrification + MBR | Feed Conc. | [mg/L] | 500–1700 | 1500–3000 | 450–1000 | 200–650 | – |
| Removal | [%] | 100 | 93–96 | 77–96 | – | – | ||
| [14] | Electrolysis + SBBR | Feed Conc. | [mg/L] | 25–165 | 580–810 | 180–420 | 160–350 | 70–350 |
| Removal | [%] | 98 | 78 | 58 | 58 | – | ||
| [15] | SBR | Feed Conc. | [mg/L] | 51–77 | 519–702 | – | – | 88–105 |
| Removal | [%] | – | – | – | – | – | ||
| [16] | Bioelectrical anaerobic system | Feed Conc. | [mg/L] | – | 1300–1700 | – | – | 30 |
| Removal | [%] | – | 19–31 | – | – | – | ||
| This study | Two-stage VF wetland | Feed Conc. | [mg/L] | 877–7905 | 1461–14,321 | 600–4442 | 201–1318 | – |
| Removal 3 | [%] | 100 | >99 | >99 | 58 | – |
Disclaimer/Publisher’s Note: The statements, opinions and data contained in all publications are solely those of the individual author(s) and contributor(s) and not of MDPI and/or the editor(s). MDPI and/or the editor(s) disclaim responsibility for any injury to people or property resulting from any ideas, methods, instructions or products referred to in the content. |
© 2023 by the authors. Licensee MDPI, Basel, Switzerland. This article is an open access article distributed under the terms and conditions of the Creative Commons Attribution (CC BY) license (https://creativecommons.org/licenses/by/4.0/).
Share and Cite
Schalk, T.; Schubert, S.; Rollberg, A.; Freitag-Stechl, D.; Schubert, A.; Elena, A.X.; Koch, C.; Krebs, P. Degradation of Dimethylacetamide from Membrane Production through Constructed Wetlands—Pathways, Ecotoxicological Effects and Consequences for Chemical Analysis. Water 2023, 15, 1463. https://doi.org/10.3390/w15081463
Schalk T, Schubert S, Rollberg A, Freitag-Stechl D, Schubert A, Elena AX, Koch C, Krebs P. Degradation of Dimethylacetamide from Membrane Production through Constructed Wetlands—Pathways, Ecotoxicological Effects and Consequences for Chemical Analysis. Water. 2023; 15(8):1463. https://doi.org/10.3390/w15081463
Chicago/Turabian StyleSchalk, Thomas, Sara Schubert, Anja Rollberg, Dirk Freitag-Stechl, Annika Schubert, Alan Xavier Elena, Christian Koch, and Peter Krebs. 2023. "Degradation of Dimethylacetamide from Membrane Production through Constructed Wetlands—Pathways, Ecotoxicological Effects and Consequences for Chemical Analysis" Water 15, no. 8: 1463. https://doi.org/10.3390/w15081463