Article

Tuning the Optical Properties of ZnO by Co and Gd Doping for Water Pollutant Elimination

1
Department of Physics, Abdul Wali Khan University Mardan, Mardan 23200, Pakistan
2
Department of Physics, University of Poonch Rawalakot, Rawalakot 12350, Pakistan
3
Department of Physics, International Islamic University H-10, Islamabad 44000, Pakistan
4
Nanomaterials Research Group, Physics Division, PINSTECH, Islamabad 45650, Pakistan
5
Department of Materials Engineering, NED University of Engineering and Technology, Karachi 75270, Pakistan
6
HITEC Schools and Colleges, HIT, Taxila 47070, Pakistan
7
National Institute of Lasers and Optronics College Pakistan Institute of Engineering and Applied Sciences, Nilore, Islamabad 45650, Pakistan
8
Prince Sultan bin Abdulaziz International Prize for Water Chair, Prince Sultan Institute for Environmental, Water and Desert Research, King Saud University, Riyadh 11451, Saudi Arabia
9
Department of Agricultural Engineering, College of Food and Agriculture Sciences, King Saud University, Riyadh 11451, Saudi Arabia
10
Plant Production Department, College of Food & Agriculture Sciences, King Saud University, Riyadh 11451, Saudi Arabia
11
Department of Botany, University of Poonch Rawalakot, Rawalakot 12350, Pakistan
*
Authors to whom correspondence should be addressed.
Water 2023, 15(8), 1470; https://doi.org/10.3390/w15081470
Submission received: 2 March 2023 / Revised: 3 April 2023 / Accepted: 6 April 2023 / Published: 9 April 2023

Abstract

:
In the present study, pure, Co, Gd, and Co/Gd di-doped ZnO nanoparticles were synthesized via the co-precipitation synthesis route. The prepared samples were characterized through different techniques such as the X-ray diffraction method (XRD), scanning electron microscopy (SEM), UV-Vis spectroscopy, photoluminescence (PL)spectroscopy, and an impedance analyzer and vibrating sample magnetometer (VSM). The XRD pattern shows ZnO’s wurtzite hexagonal crystal structure; moreover, the shifting of characteristic peaks toward the lower angle indicates the inclusion of Co and Co/Gd in the ZnO host lattice. SEM micrographs show various morphologies such as rods, the agglomeration of particles, and spherical nanoparticles. The UV-Vis spectroscopy reveals that the absorption increased in the visible region and there was a substantial redshift for the doped samples. The bandgap decreased from 3.34 to 3.18 eV for the doped samples. The PL spectra show near-edge and inter-band transitions; the origin of inter-band transitions is attributed to the defect states present within the bands. The dielectric constant is strongly frequency dependent and decreases with Co and Co/Gd doping, while the electrical conductivity increases. A VSM study indicates that pure ZnO is diamagnetic, while the Co and Co/Gd doped ZnO nanoparticles showed ferromagnetic behavior. Under UV-visible light irradiation, the Co/Gd-ZnO nanoparticles showed higher photocatalytic activity than the ZnO nanoparticles. The enhanced photocatalytic activity may be attributed to a decreased bandgap with doping.

1. Introduction

The chemical industry’s significant growth has led to the release of increasingly large quantities of resistant dye effluent into water resources, causing ecological problems. Dye-contaminated wastewater adversely affects marine life and also poses a threat to human health and well-being. Therefore, researchers worldwide are interested in finding efficient methods to degrade dye-polluted wastewater, which is a significant challenge [1]. Clean water is vital to human existence, as all domestic, commercial, and industrial operations require it as a fundamental necessity. To achieve environmental benefits at a reasonable cost, several industries employ water treatment facilities to eliminate pollution from wastewater [2]. This approach aids in enhancing water quality for various purposes, including drinking. Numerous treatments, such as recycling processes, are employed in the industrial sector to purify contaminated water. Due to their potential applications in various fields, semiconducting nanomaterials have garnered significant attention from researchers. These applications include electronic devices, solar energy harvesting devices, drug delivery, water purification, pharmaceutical industries, biosensors, and ceramics [3]. Among them, an important semiconductor material is Zinc oxide (ZnO), which has a large bandgap of 3.37 eV at room temperature. It has a wurtzite hexagonal structure with lattice constants a = 3.2491 Å and c = 5.2062 Å. ZnO has an exciton binding energy of 60 meV [4,5]. ZnO is one of the most commonly used metal oxide photocatalysts due to its high photocatalytic activity, stability, and low cost. However, the wide bandgap of ZnO limits its absorption of visible light, which accounts for only 5% of solar radiation, and thus limits its photocatalytic activity [6]. To overcome this limitation, doping with transition and rare earth metal ions alone has been extensively studied to enhance the photocatalytic activity of ZnO [7,8]. Doping with transition metal ions, such as cobalt (Co), nickel (Ni), and iron (Fe), has been reported to enhance the photocatalytic activity of ZnO by creating new energy levels within the bandgap, narrowing the bandgap, and facilitating the separation of photogenerated electron-hole pairs [7,9]. Similarly, doping with rare earth metal ions, such as gadolinium (Gd), cerium (Ce), and lanthanum (La), has been reported to enhance the photocatalytic activity of ZnO due to their unique electronic structures and strong absorption in the visible light region [10,11]. Among the transition and rare earth metal ions, Co and Gd have been studied for their photocatalytic properties. Co-doped ZnO has been reported to exhibit enhanced photocatalytic activity for the degradation of various organic pollutants, such as methyl orange, rhodamine B, and methylene blue (MB) [12,13]. Similarly, Gd-doped ZnO has been reported to exhibit enhanced photocatalytic activity for the degradation of various organic pollutants, such as tetracycline, methyl orange, and MB [11,14]. MB is a commonly used dye in various industries, and it is also used in medical and laboratory applications. MB is known to be persistent and difficult to degrade, and its degradation products can be harmful to the environment and human health [15]. Therefore, studying the degradation of MB is important for developing effective methods for treating wastewater and contaminated environments.
Although Co-doped ZnO and Gd-doped ZnO nanostructures have been extensively studied separately in recent years due to their potential applications in various fields, the simultaneous doping of Co and Gd in ZnO has not been extensively investigated. The reason for this is that the simultaneous doping of Co and Gd in ZnO is a challenging process. Both Co and Gd have different ionic radii and oxidation states, which makes their incorporation into the ZnO lattice difficult. Moreover, the introduction of two dopants simultaneously can result in the formation of secondary phases, which can affect the properties of the doped ZnO nanostructures. This work aims to investigate the simultaneous effect of Co and Gd on the physics and photocatalytic activity of ZnO nanostructures. Our study shows that the dielectric, magnetic, and photocatalytic properties of ZnO can be enhanced by the co-doping of Co and Gd.

2. Materials and Methods

2.1. Materials

The synthesis of material zinc nitrate hexahydrate had the formula Zn(NO3)2·6H2O, cobalt nitrate hexahydrate had the formula Co(NO3)2·6H2O, gadolinium nitrate hexahydrate had the formula Gd(NO3)3·6H2O. Each had a purity of 99.9% and were purchased from Sigma-Aldrich. Furthermore, sodium hydroxide (NaOH) was utilized as a precipitating agent.

2.2. Sample Preparation

ZnO nanoparticles were synthesized through the co-precipitation method with four different doping variations: undoped, Co-doped, Gd-doped, and Co/Gd co-doped. A total of 8.924 g of zinc nitrate hexahydrate (3M) was dissolved in 100 mL of deionized water. The solution was constantly stirred at 50 °C until it completely dissolved. A total of 1 M solution of NaOH (3.999 g) was dissolved in 100 mL of DI water and this NaOH solution was introduced dropwise in a zinc nitrate hexahydrate solution until the pH of the solution reached 10 at room temperature [16]. The reaction yielded precipitates which were then subjected to centrifugation and washed with deionized water to remove impurities. The resulting white precipitates were dehydrated at 90 °C for 24 h, followed by annealing at 600 °C for two hours [17]. To synthesize Co-doped, Gd-doped, and Co/Gd-doped ZnO, the appropriate precursors (zinc nitrate hexahydrate, cobalt nitrate hexahydrate (0.174 g) and gadolinium nitrate hexahydrate (0.270 g)) were mixed in 100 mL of deionized water under continuous stirring. The NaOH was added drop by drop for the same pH as above. The obtained precipitates likewise were cleaned by centrifugation and dehydrated at 90 °C for 24 h in an oven and annealed at 600 °C for two hours in a furnace. The prepared samples were named pure ZnO, Co-doped ZnO, Gd-doped ZnO, and Co/Gd dual-doped ZnO.
The chemical reaction for the pure ZnO and Co- and Gd-doped samples are given below.
For the pure ZnO:
Zn (NO3)2.6H2O + 2NaOH →2NaNO3+ Zn(OH)2 + 6H2O
Zn(OH)2+ 2NaOH →2Na+ + [Zn(OH)4]−2
[Zn(OH)4]2− + 2NaOH→ZnO + 7H2O + 2NaNO3
For the Co-doped samples:
Co (NO3)2.6H2O + 2NaOH →2NaNO3+ Co(OH)2 + 6H2O
Co(OH)2 + 2NaOH→2Na+ + [Co(OH)4]−2
[Co(OH)4]2−+ 2NaOH→CoO + 7H2O + 2NaNO3
For the Gd-doped samples:
Gd (NO3)3.6H2O + 3NaOH →3NaNO3+ Gd(OH)3+ 6H2O
Gd(OH)3 + NaOH→Na+ + [Gd(OH)4]−1
[Gd(OH)4]−1 + NaOH→GdO + H2O + NaNO3

2.3. Characterization

The analysis of the samples comes after the synthesis. Using the diffraction of X-ray method (XRD), the synthesized samples were characterized by using a BRUKER D-8 ADVANCE X-ray diffractometer instrument with copper kα (λ = 1.54060 Å) radiation. The phase configuration and crystal structure of the prepared samples were evaluated and scanning electron microscopy (SEM) (SEM MODEL MAIA3 TESCAN) was employed for the surface morphological investigation of the samples. An energy-dispersive X-ray spectrometer, known as EDAX, was used to find out the composition of the chemicals. UV-visible (HALO-DB-20, Becker & Hickl GmbH, Germany) and photoluminescence spectroscopy (model FLS1000, Becker & Hickl GmbH, Germany) were employed to examine optical characteristics. For the investigation of electrical properties such as the dielectric constant and conductivities of the samples, an impedance analyzer (Agilent 4294A, Bell Electronics NW, Inc. Santa Clara, CA, USA) in the frequency range of 40–108 Hz was used. A vibrating sample magnetometer (Lake Shore 8600 VSM, Cryotronics, Inc. Westerville, OH, USA) was used to investigate magnetization in the magnetic field range of ±6 Oe. The degradation of methylene blue (MB) dye was also used to test the photocatalytic activity of the samples.

3. Results and Discussion

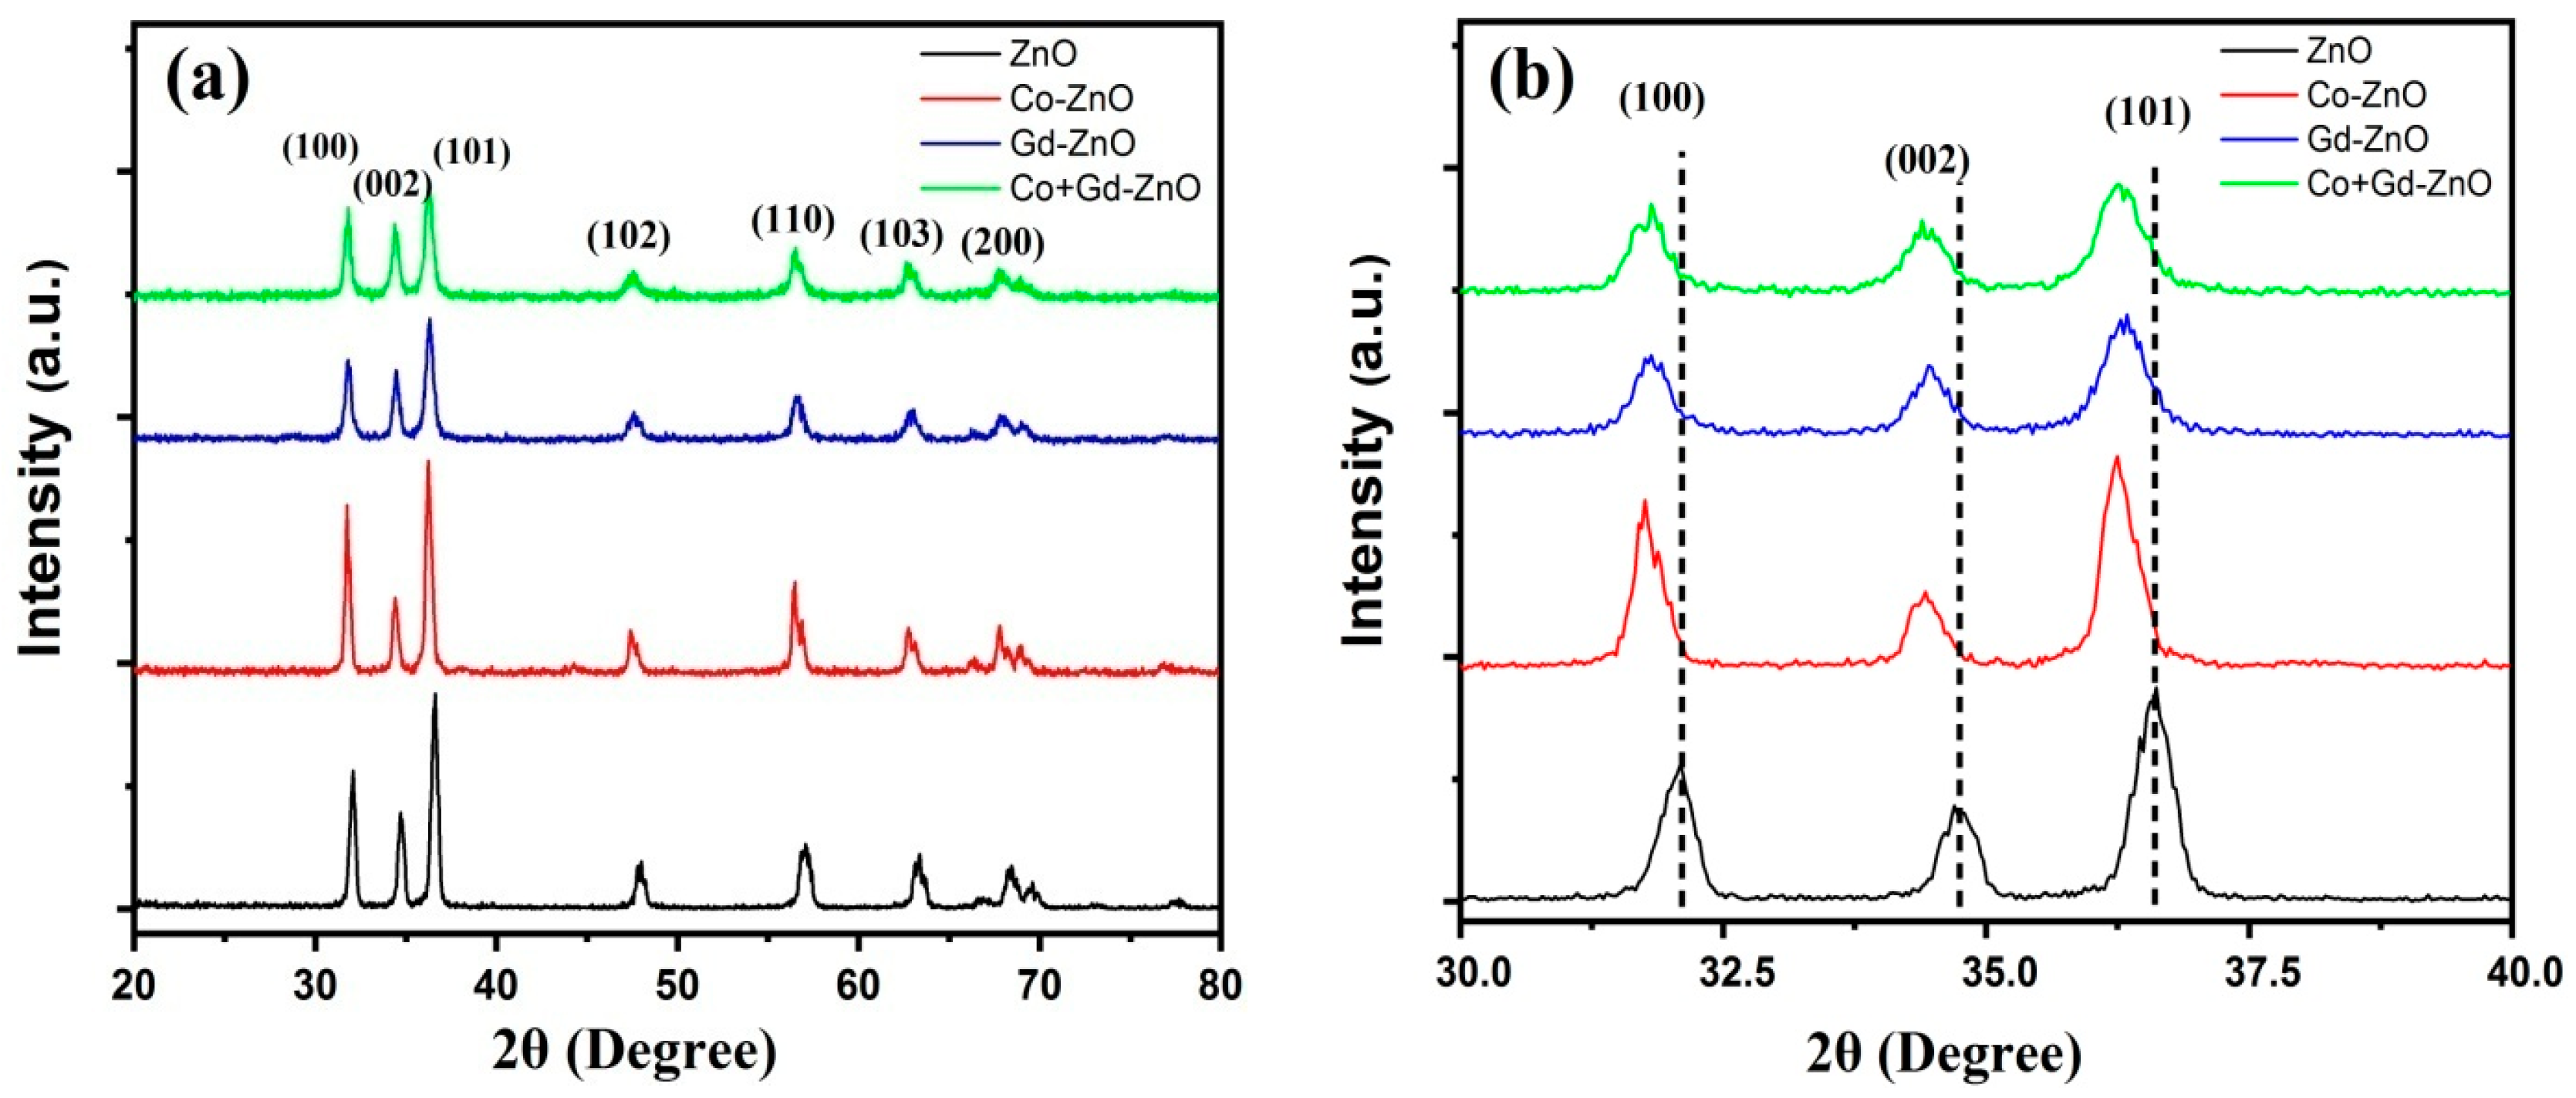
3.1. X-ray Diffraction Analysis

The results from the XRD graph of undoped, Co, Gd, and Co/Gd dual-doped nanoparticles of ZnO are shown in Figure 1a. All synthesized samples are polycrystalline, as seen by the XRD pattern. All the peaks in the XRD pattern indicating the wurtzite hexagonal structure of ZnO matched with the (JPCDs card no. 01-075-0576) diffraction peaks occurring at the angle 2θ = 32.10°, which corresponds to the planes (100), 34.80° (002), 36.58° (101), 47.77° (102), 56.84° (110), 57.37° (103), 63.29° (200), and 68.50° (112). There is no extra peak found in the XRD pattern. Figure 1b indicates the peak shift of the major peak in the XRD pattern that occurs at the angle 2θ = 36.33o, corresponding to the plane (101). The figure clearly shows that a peak is shifting across the plane towards a lower angle. The peak shift is because the ionic radii Zn+2 (0.74 Å) are different from that of Co+2 (0.72 Å) and Gd+3 (1.05 Å). The XRD results confirm the successful inclusion of Co and Gd in the ZnO matrix [17]. For pure ZnO, the high-intensity peak with a narrow width indicates the excellent crystalline hexagonal wurtzite structure. For dopant samples, it can be observed that the peaks are broadened and the intensity decreased, pointing towards the low crystalline structure.
The crystal structure factor (a and c) and volume of the unit cell (V) of the pure and doped samples were estimated by using the subsequent equations [18].
1 d 2 = 4 3 h 2 + h k + k 2 a 2 + l 2 c 2
V = 0.866 a 2 × c
where a, b, and c are the crystal structure parameters, d is the interplanar separation between two planes, and h, k, and l denote the corresponding planes’ miller indices.
Bragg’s equation is used to compute the inter-planner spacing.
2 d sin θ = n λ
The volume of the unit cell for un-doped ZnO was 47.30Å3 corresponding to lattice factors a = b = 3.2427 Å and c = 5.1948 Å. The volume for Co-added nanoparticles of ZnO enlarged to 47.77 Å3 corresponding to lattice factors a = b = 3.2530 Å and c = 5.2130 Å. For Gd-doped ZnO, the value of the unit cell volume is 47.82 Å3, corresponding to factors of lattice a = b = 3.2541 Å and c = 5.2150 Å, and is further increased to V= 48.45 Å3 for dual-doped samples corresponding to lattice parameters a = b = 3.271 Å and c = 5.230 Å. The lattice parameters of ZnO can increase upon Co and Gd doping, even though the Co ionic radii are smaller than that of Zn, due to the complex interplay between several factors that influence the crystal structure. When Co or Gd ions are substituted for Zn ions in ZnO, there is a distortion of the crystal lattice, which can result in a change in the crystal structure. The distortion arises from the different electronic configurations and coordination environments of the Co and Gd ions compared to Zn ions [19,20]. These differences can lead to a relaxation of the crystal lattice, which causes an increase in the lattice parameters. Additionally, the presence of Co or Gd ions can introduce defects or vacancies in the crystal structure, which can also contribute to lattice parameter changes [21].
For the calculation of the crystallite size of the samples, both the Debye Scherer’s equation (Equation (4)) and Williamson–Hall method (Equation (5)) were employed, while the microstrains ( ε ) were calculated from the Williamson–Hall method [22,23].
D = K λ β c o s θ
B t o t a l c o s θ = ε ( 4 s i n θ ) + K λ L
where “λ” represents the incident wavelength of X-rays, K is constant, the diffraction angle is θ, and β is the full/complete width and the point of half maximum (FWHM).From the above relation, the βtotalcosθ versus sinθ was plotted to obtain the strain component from the slope (ε), and the size component was deduced from the intercept (Kλ/L).
The crystallite size of pure ZnO estimated by Debye Scherer’s equation is 23.57 ± 0.7 nm, for Co-doped ZnO the crystallite size is 19.98 ± 0.8 nm, for Gd-doped ZnO the value of crystallite size is 17.06 ± 0.5 nm, and for Co/Gd dual-doped ZnO nanoparticles the crystallite size is 14.51 ± 0.9 nm. A variation in crystallite size has been reported for doping Dy and Al in ZnO nanopowders [24,25]. Similarly, the microstrains for pure ZnO were found to be 5.94 × 10⁻³ ± 6.4 × 10⁻⁵, which increased to 6.02 × 10⁻³ ± 4.2 × 10⁻⁵ for Co-ZnO. For Gd-ZnO and Co/Gd-ZnO the microstrains were estimated to be 6.21 × 10⁻³ ± 1.8 × 10⁻⁵and 6.35 × 10⁻³ ± 1.2 × 10⁻⁵, respectively.
The decrease in crystallite size of ZnO by doping may be attributed to a combination of factors, including the formation of defects, the change in lattice parameters, and the introduction of strain in the crystal structure. Mesaros et al. (2015) showed that the crystallite size of Co-doped ZnO nanoparticles decreased with an increasing Co-doping concentration [26]. This effect is attributed to the formation of defects in the crystal structure due to the substitution of Zn2+ ions with Co2+ ions. The defects can act as nucleation sites for crystal growth, leading to a decrease in the crystallite size. Similarly, Ab Rasid et al. (2015) found that the crystallite size of Gd-doped ZnO thin films decreased with an increasing Gd doping concentration [27]. This effect is attributed to the change in lattice parameters and the introduction of strain in the crystal structure due to the substitution of Zn2+ ions with Gd3+ ions. The lattice parameters of the Gd-doped ZnO thin films increased with the increasing Gd doping concentration, leading to a mismatch with the lattice parameters of the undoped ZnO. This mismatch can introduce strain in the crystal structure, which can lead to a decrease in the crystallite size. Peak position, crystallite size, FWHM, and the volume of the unit cell of non-doped and added samples are shown in Table 1.

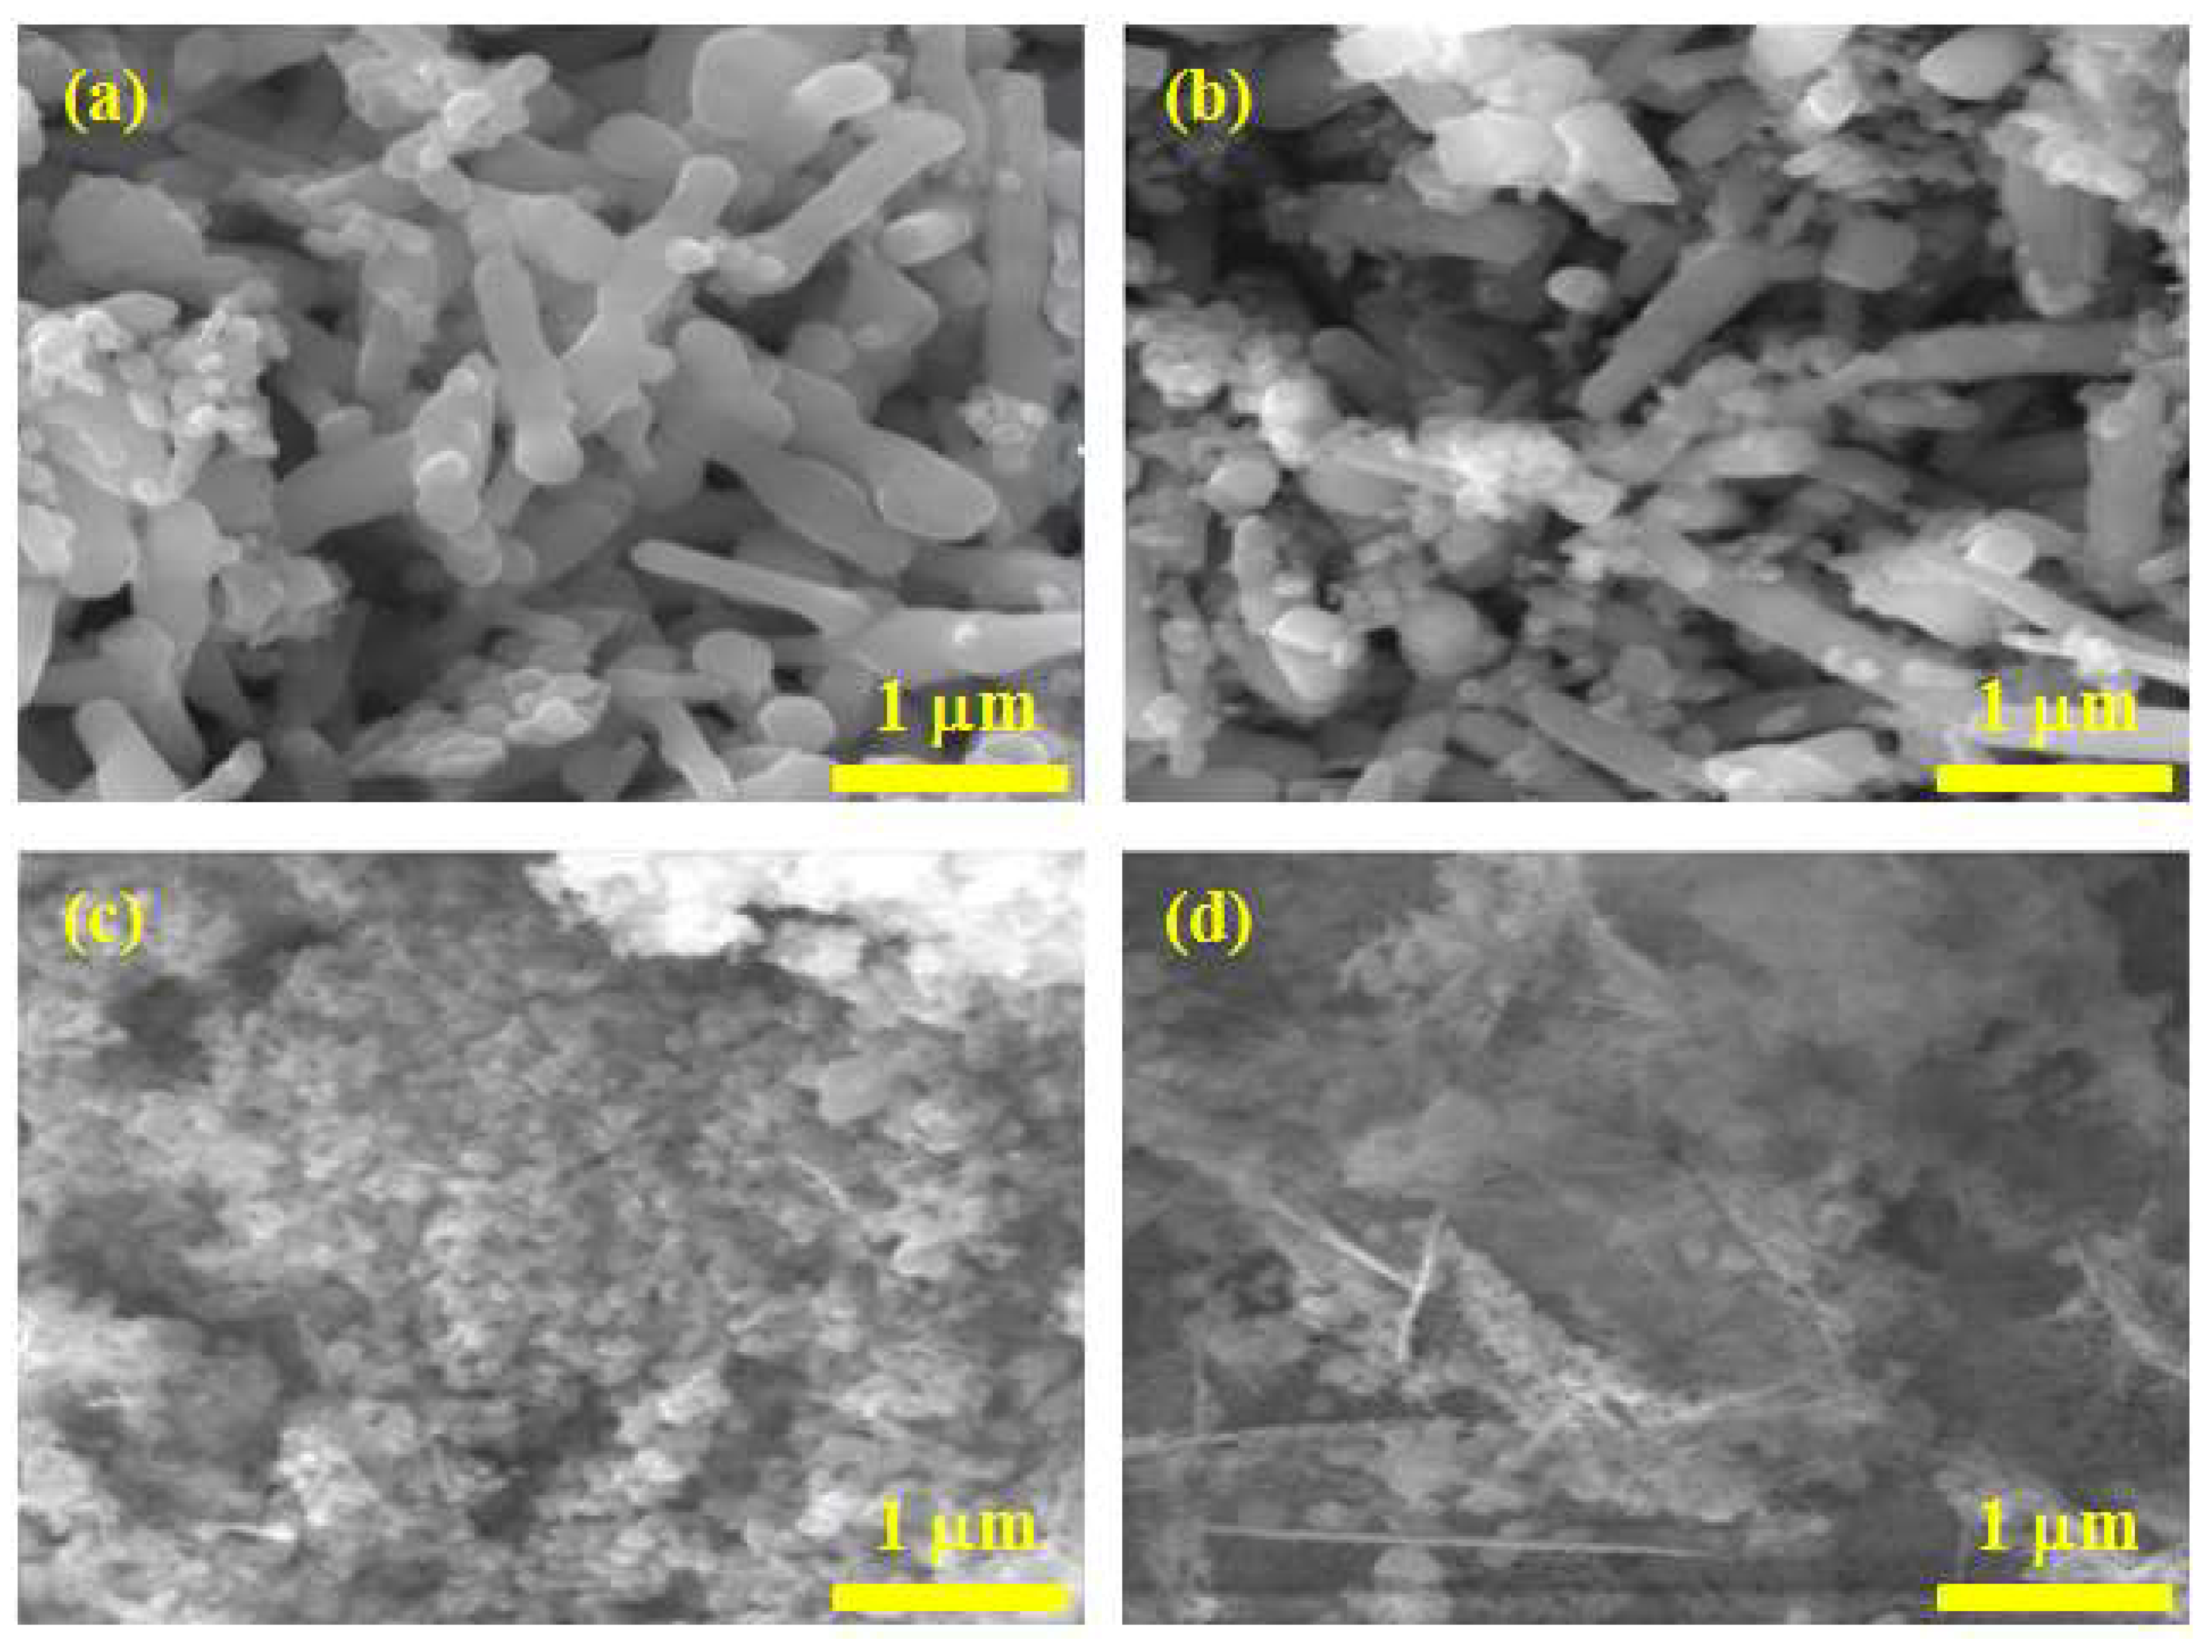
3.2. Scanning Electron Microscope Analysis

A scanning electron microscope (SEM) was employed to examine the surface morphology of the synthesized samples. The SEM micrographs of pure, Co, Gd, and Co/Gd-doped ZnO are shown in Figure 2a–d. Depending on the type of dopant ion integrated, several morphologies can be seen. For pure ZnO, the SEM micrograph indicates that all the nanoparticles possess rod and flower-like morphologies with less agglomeration and uniformly distributed particles, as shown in Figure 2a. The undoped ZnO has a nearly hexagonal-shaped structure and is uniformly presented, as supported by our XRD. In Figure 2b, the surface morphology of Co-doped ZnO is shown, which reveals that the rod and flower-like shape of tightly packed nanoparticles is due to an increase in agglomeration between the particles. In Figure 2c, the exterior morphology of Gd-added nanoparticles of ZnO is shown, which indicates the rod-like morphologies with the increase in agglomeration. In Figure 2d, the exterior morphology of Co and Gd dual-added ZnO nanoparticles is shown, which indicates that the design has less shape of highly bound nanoparticles with a high increase in agglomeration. Doping caused a decrease in the average size of the spherical entity, as dopants filled the gaps within the ZnO nanostructure, resulting in smaller nanostructures [28]. The incorporation of Co and Gd into ZnO nanoparticles can cause a number of changes in their structure and properties, including alterations to their dimensional characteristics. This is because the introduction of foreign atoms into a crystal lattice can disrupt its regularity and cause defects such as vacancies, interstitials, and dislocations. In the case of ZnO nanoparticles, the incorporation of Co and Gd can lead to the formation of new phases or a change in the crystal structure, which can in turn affect the size, shape, and morphology of the nanoparticles [29,30]. These findings highlight how Co and Gd inclusion can fragment ZnO nanoparticles and alter their size.

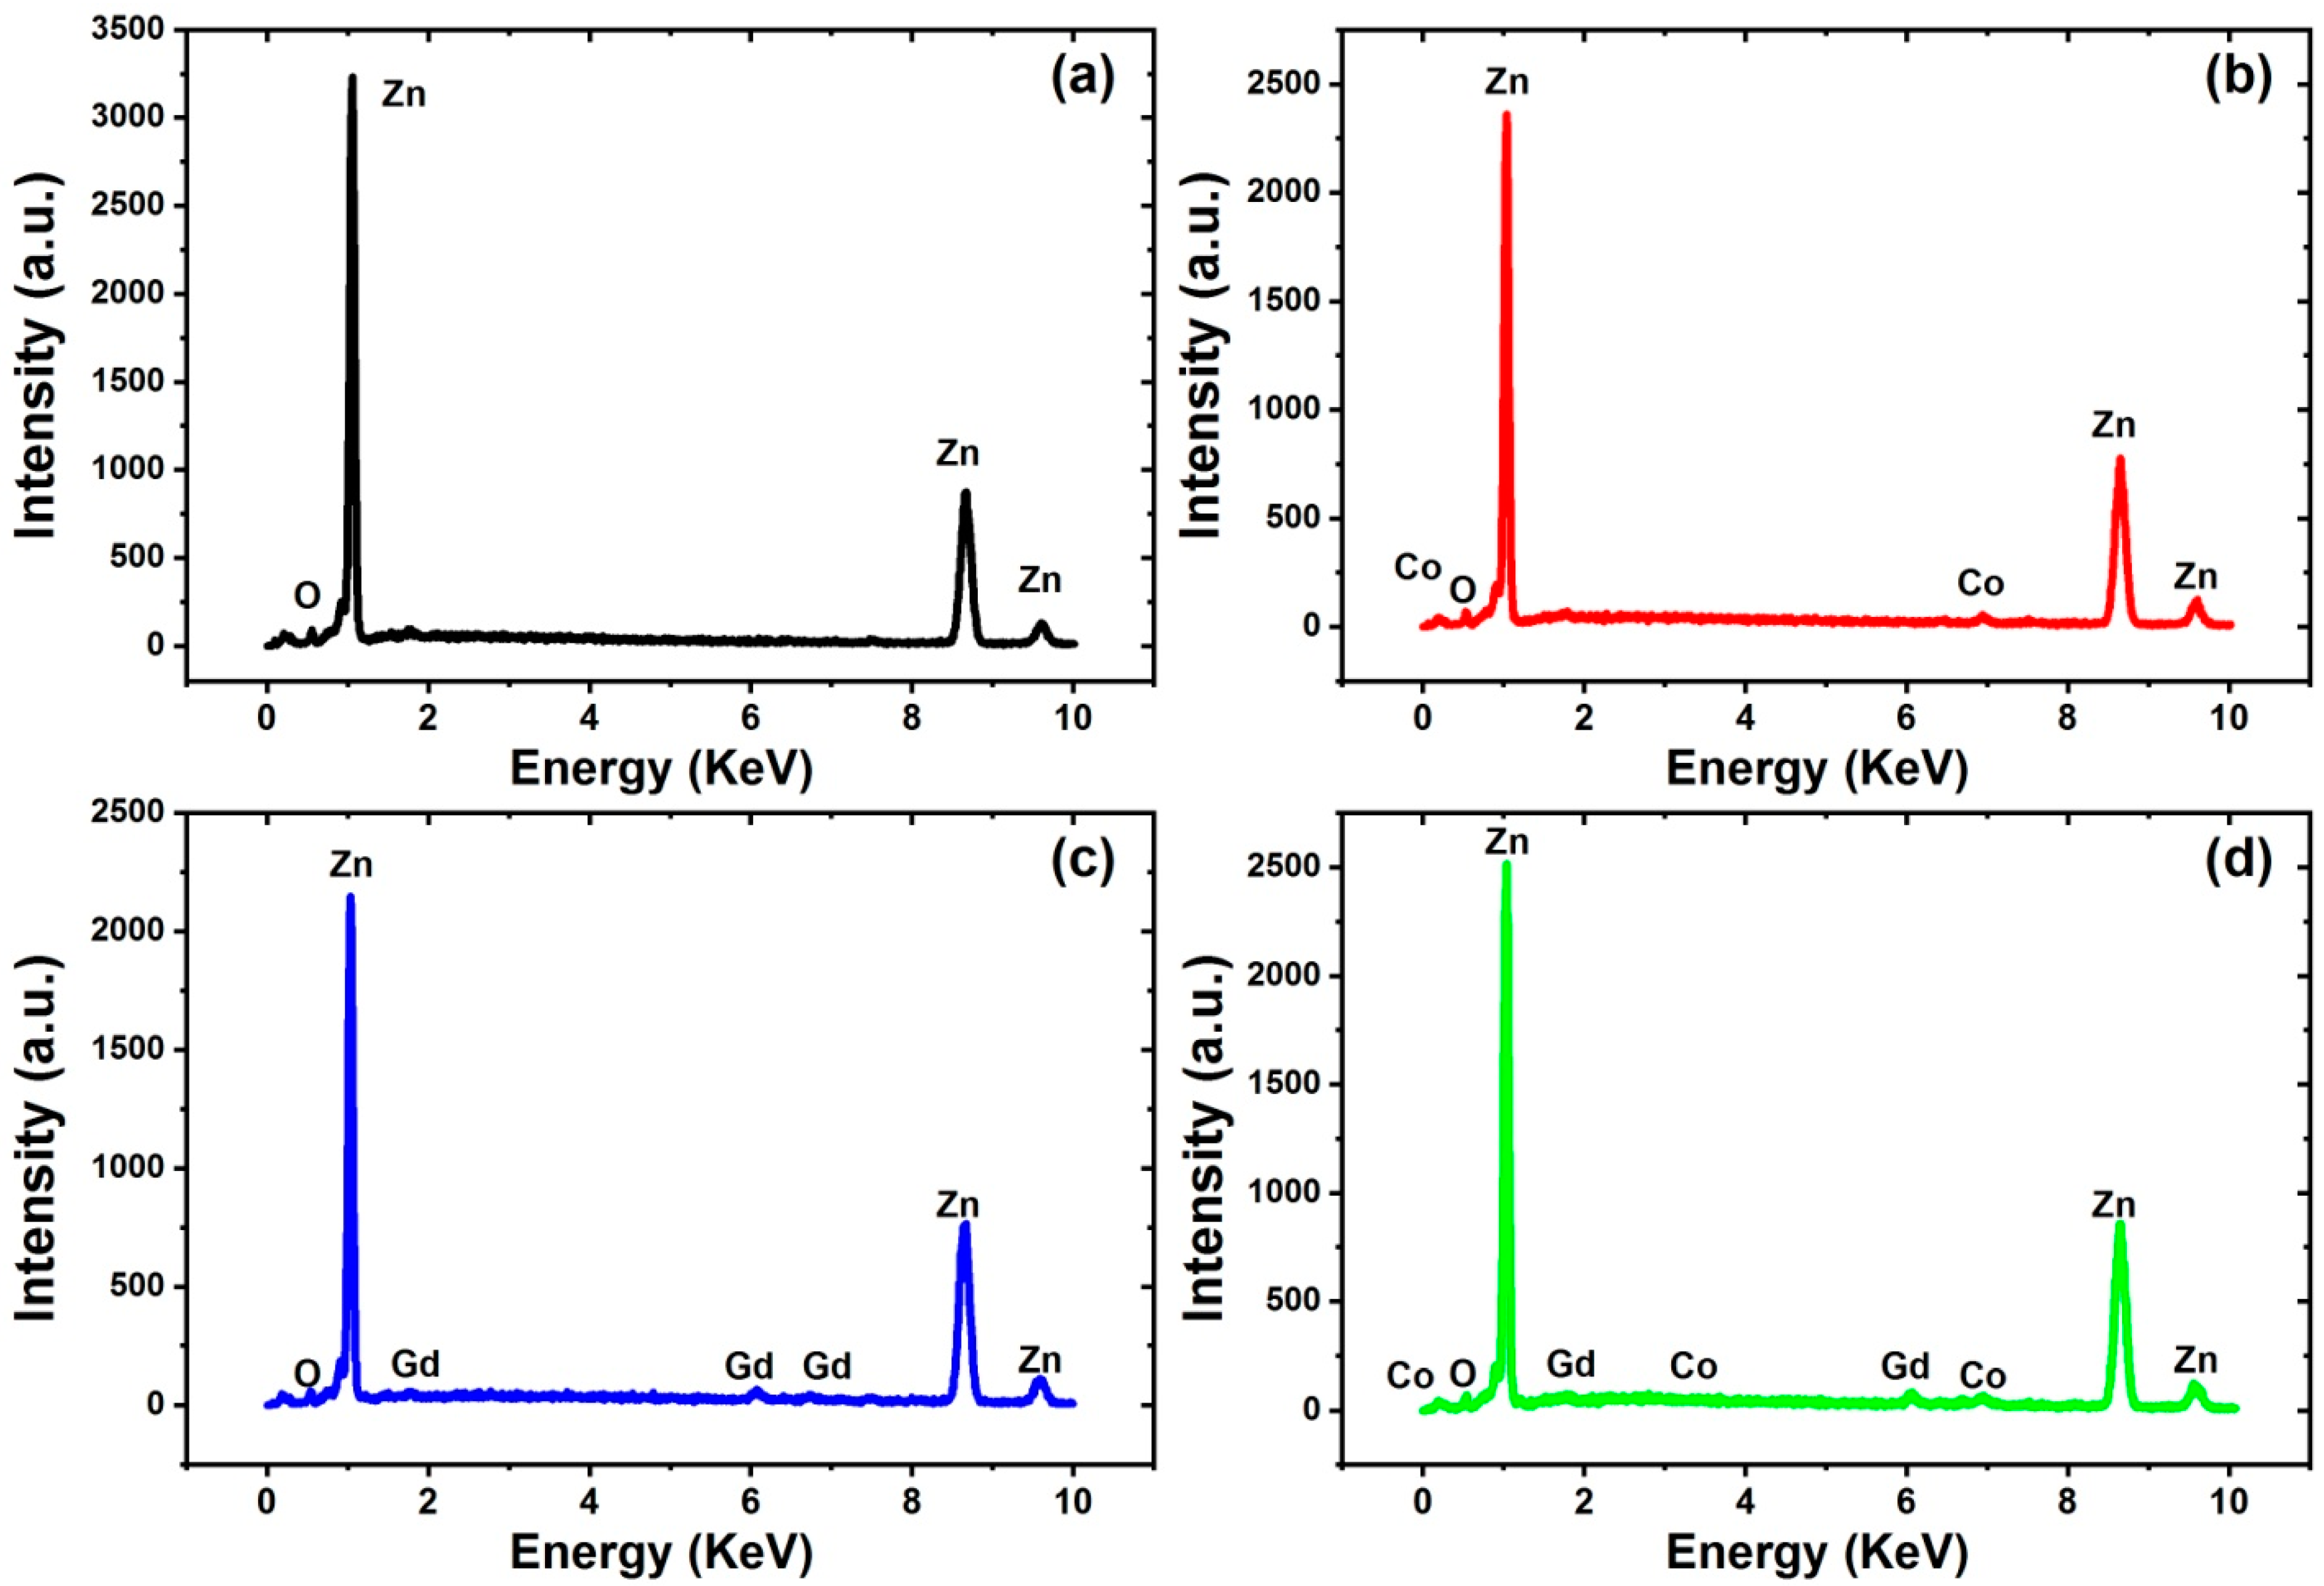
3.3. Energy Dispersive X-ray Spectrometer

For the identification of elements contained in pure and doped ZnO samples, the energy-dispersive X-ray(EDX) is used. The EDX spectrum validates that all the selective elements of Zn, Co, Gd, and O were present. From the spectra of ZnO nanoparticles, as shown in Figure 3a, it can be seen that the most abundant element is Zn followed by O. Similarly, for Co-doped ZnO, the characteristic elements are Zn, Co, and O, as shown in Figure 3b. The doping of Gd and Gd/Co in ZnO can be reflected in the EDX spectrum, as shown in Figure 3c,d. Table 2 shows the elemental composition of the synthesized samples. All samples displayed uniform constituents of the elements regardless of the sample’s selected areas. The EDX analysis revealed that the produced samples were free of impurities and that the composition of the obtained samples closely matched the stoichiometric ratio.

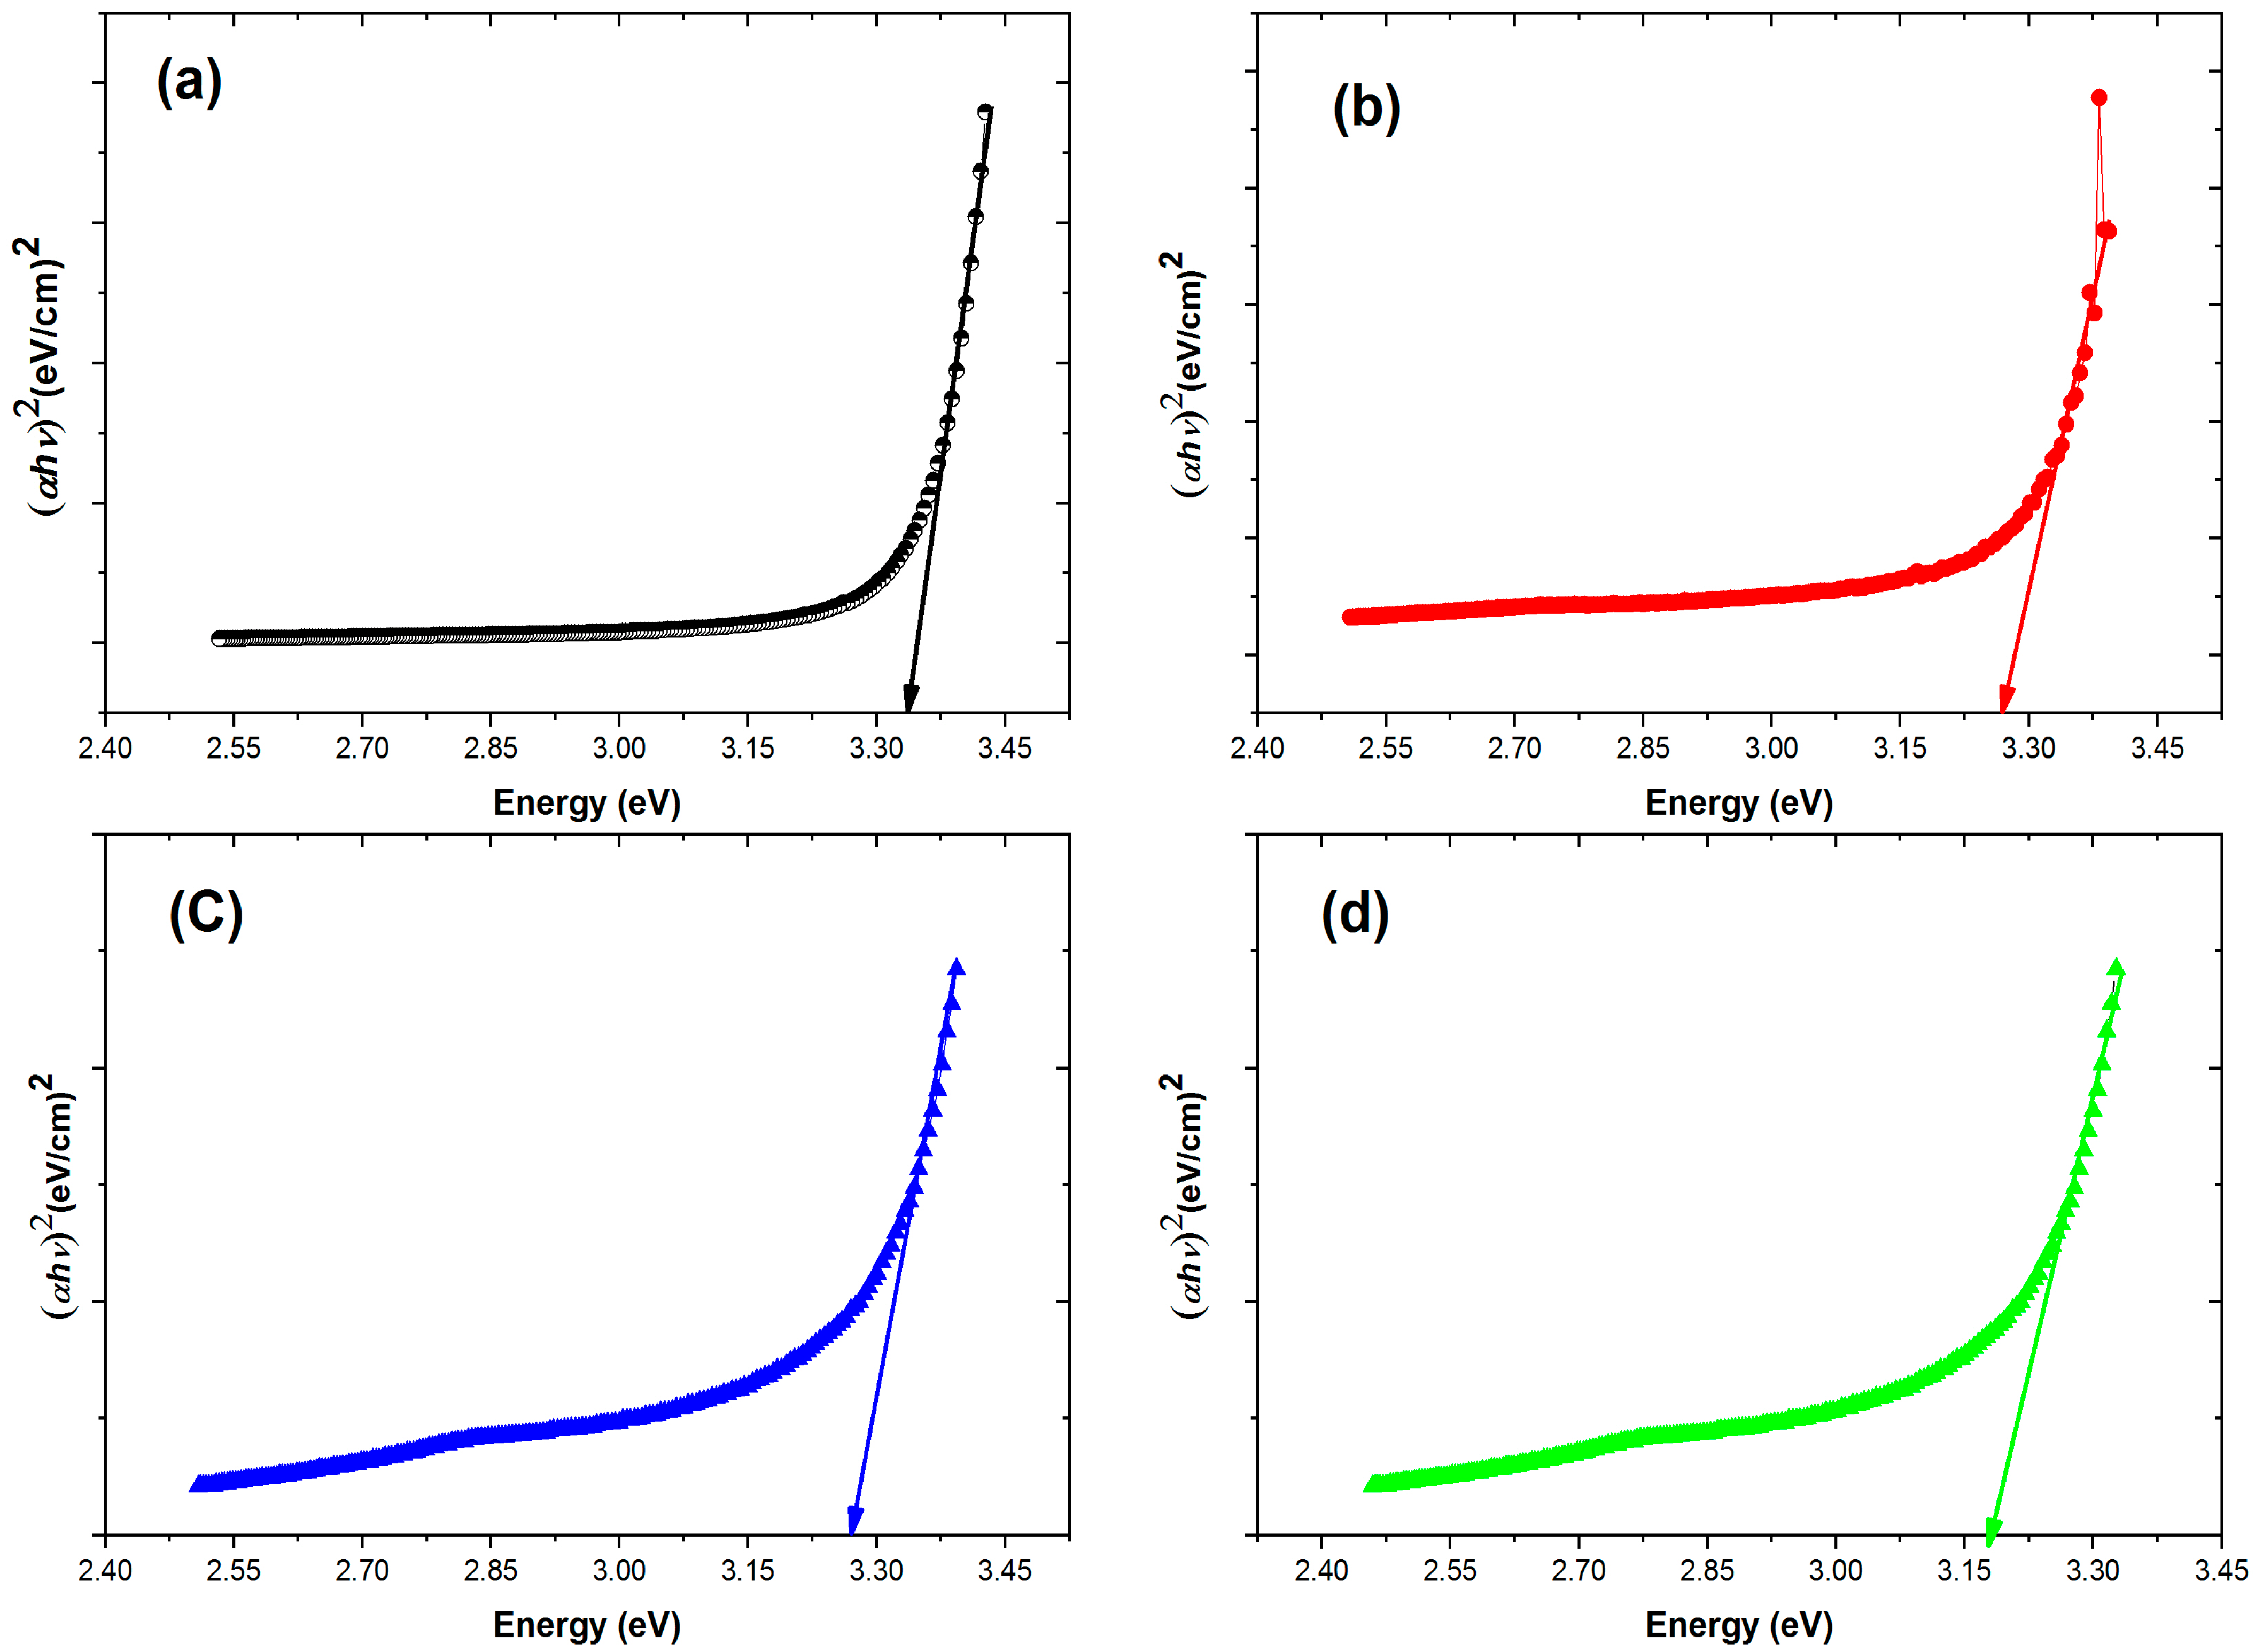
3.4. Optical Properties

To examine the optical properties of synthesized samples, ultraviolet-visible spectroscopy is used. The absorption spectrum of pure ZnO, Co-added ZnO, Gd-added ZnO, and Co/Gd-added ZnO at room temperature are revealed in Figure 4 in the wavelength range of 290 nm to 900 nm. The entire sample absorption behavior indicates remarkable absorption edges between 350 nm and 400 nm. The absorption spectra of ZnO nanoparticles doped with Co and Gd show a solid enrichment in the absorption region compared to pure and single-doped ZnO. It is evident from the absorbance spectra that the absorption enlarged with doping. This variation in bandgap may be due to differences in crystallite size, and increased distortion between the dopant and ZnO host lattice defects are induced, such as the removal of oxygen vacancies with doping [17,31].
In the absorbance spectra, the absorption edge of pure ZnO is found at 356 nm, which resembles the excitation of electrons from the valance to the conduction band. It can be observed that absorption edges shifted towards a wavelength at the higher end (known as redshift) for added samples. The redshift in the absorption edge is ascribed to an expansion of the surface area, oxygen vacancies, and the replacement of Zn ions in the ZnO lattice by Co and Gd ions.
The energy bandgap of all the samples that were synthesized chemically was premeditated by the formula of Tauc, as given by equation 6 [32,33].
α h ν = A ( h ν E g ) n
The ‘α’ is the factor showing absorption (intended by using equation α = 2.303 × A/t where A represents the material absorbance and t is the cuvette thickness width), ‘h’ is the Plank’s constant, ‘ν’ is the frequency of the incident photon, and ‘Eg’ is the energy gap of the band. The rate of n is ½ for a direct bandgap and 2 for a bandgap that is indirect in nature. The bandgap of the optical nature of prepared samples was calculated by extrapolating the linear portion of hν versus the (𝛼hν)2 plots to the x-axis [34,35].
Figure 5a–d indicates the extrapolation curves of prepared un-doped ZnO, Co-doped, Gd-doped, and Co/Gd-added ZnO nanoparticles. The estimated gap energy of pure ZnO was found to be 3.34 eV (±0.015 eV), which closely matches the bulk gap value of ZnO (3.37 eV). In the case of Co-doped, Gd-doped, and Co/Gd-doped ZnO samples, the bandgap values were also determined with a ± 0.015 eV variation. The bandgap values for these doped samples were found to be 3.28 eV, 3.27 eV, and 3.18 eV, respectively (Table 3). The decrement in the bandgap of metal oxides has been studied by many researchers previously. The decrease in bandgap and increment in absorbance may be due to the replacement of Co2+/Gd3+ ions in the pure ZnO lattice, which creates defects. This change in bandgap indicates Co2+ and Gd3+ incorporated into the Zn2+ lattice. The decrease in bandgap and increase in absorbance spectra of Co- and Gd-doped ZnO samples as compared to pure ZnO is due to the strong quantum confinement effect and the high surface-to-volume ratio of the nanoparticles [36]. Quantum confinement occurs when the size of the nanoparticles becomes comparable to the wavelength of the electrons in the material, leading to a modification of the electronic structure of the material and a decrease in the bandgap. Additionally, the high surface-to-volume ratio of nanoparticles increases their surface area, which enhances their reactivity with the environment and leads to modifications in their electronic structure, resulting in an increase in the absorbance spectra [37]. Replacing a Zn atom in ZnO with Co and Gd ions had two significant effects. Firstly, it brought the impurity bands closer to the lower edge of the conduction band. Secondly, the resulting bandgap became narrow due to the strong orbital coupling between Co or Gd and O. These findings underscore the crucial role of the Co and Gd doping concentration in modifying the bandgap of the synthesized materials [38].

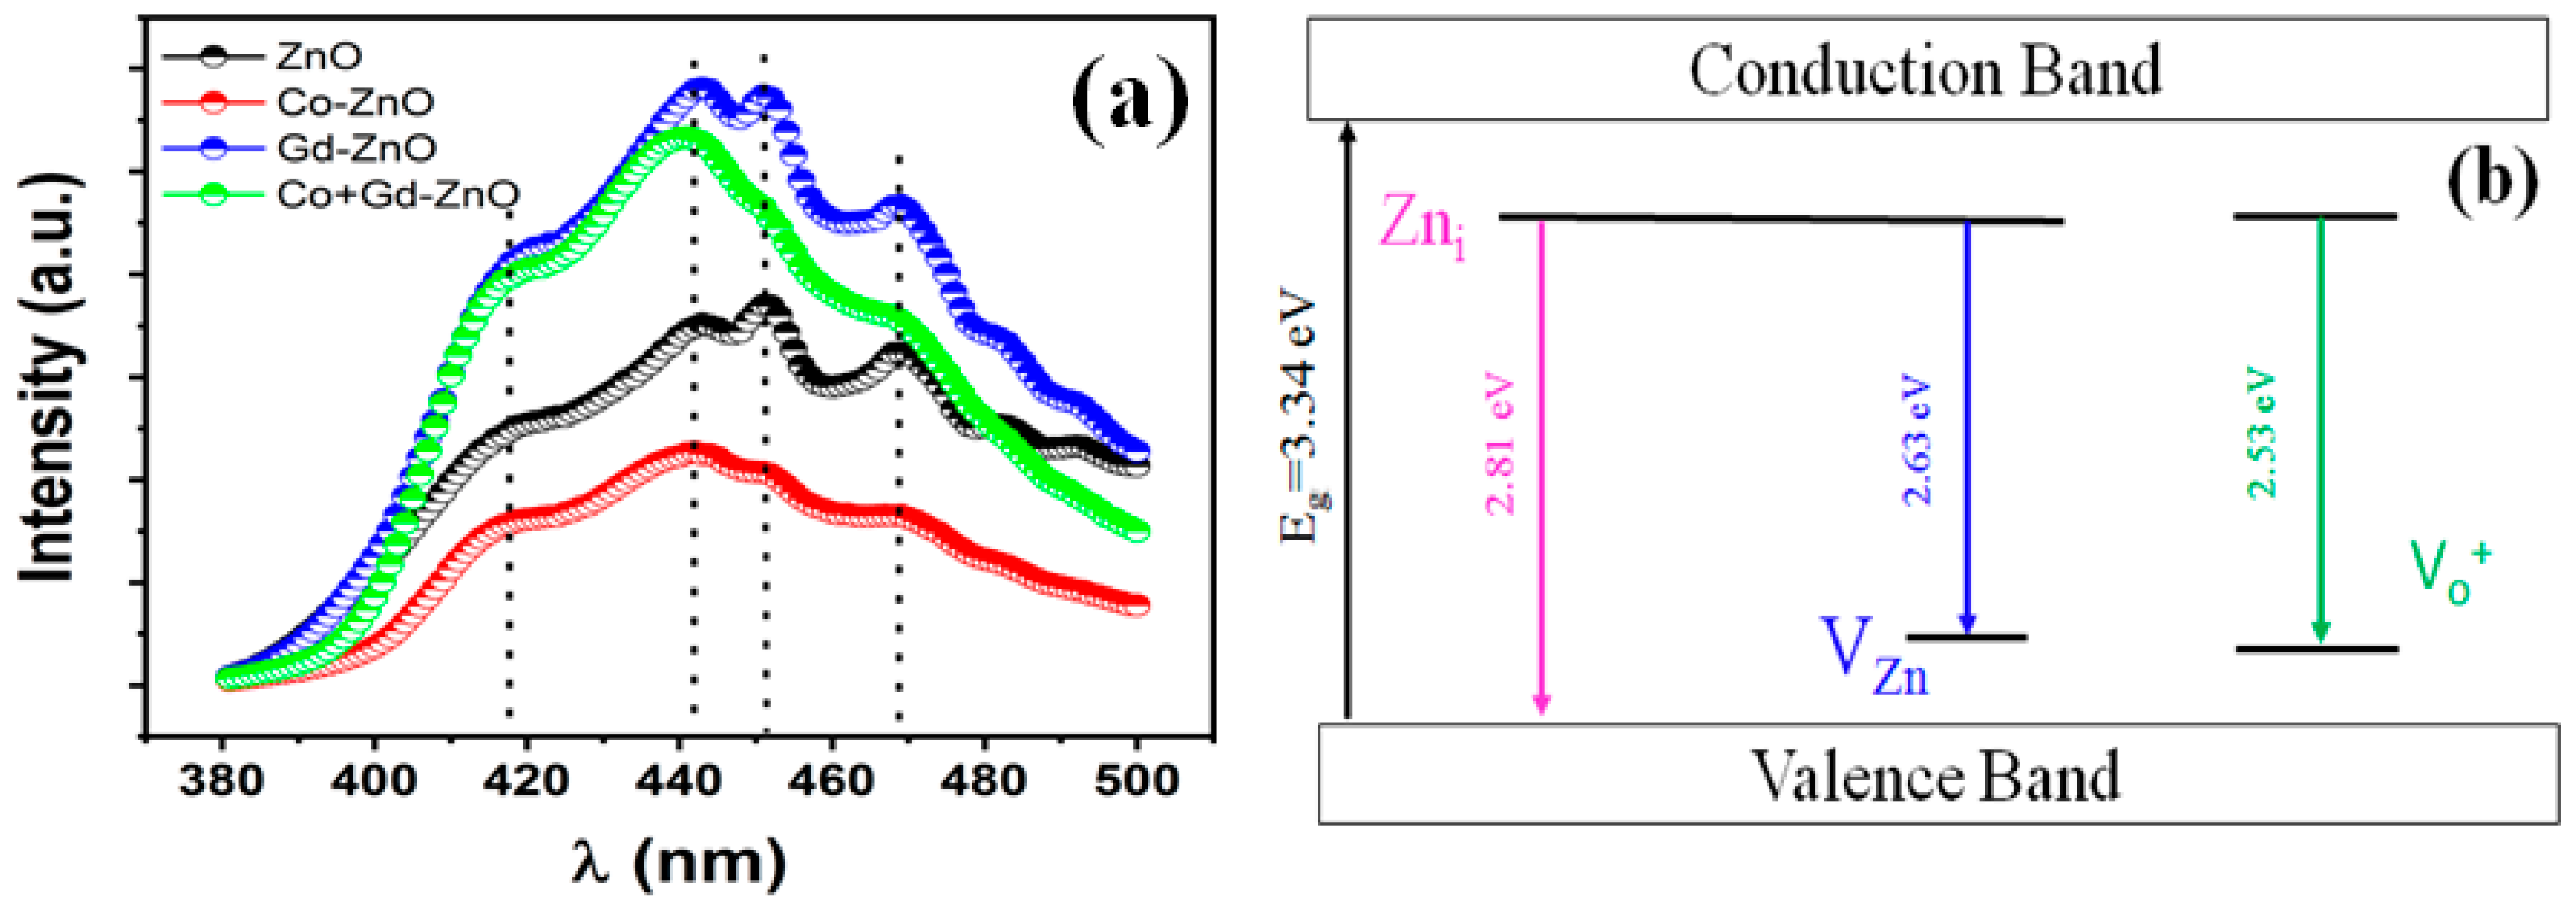
3.5. Photoluminescence Spectroscopy

To study the electronic structure and discrete energy levels, induced doping photoluminescence (PL) spectroscopy is used. In Figure 6a, PL spectroscopy at room temperature for pure ZnO, Co-added ZnO, Gd-added, and Co/Gd-added ZnO nanoparticles over the wavelength range of 380 nm to 500 nm samples are displayed. The PL intensity is directly related to the defects within the samples at the nano scale range. All samples’ PL spectra consist of two emission bands, one corresponding to intense UV emission and the other to broad deep-level emission, as shown in Figure 6b. For the synthesis of ZnO nanoparticles, the emission peak occurs around 410 nm with corresponding energy of 3.02 eV; this is ascribed to band-to-band transition. The peak emission at 440 nm (2.81 eV) is the violet emission to the top of the valance band. The multiple emission peaks in the wavelength range of 430–470 nm with corresponding energy of 2.63–2.88 eV is the blue emission. Finally, a green emission around 490 nm (2.53 eV) to the bottom of the conduction band is also observed [39]. The violet emission is ascribed to interstitial zinc level (Zni) electronic transition to the peak of VB. The blue emission is due to the Zni level electronic transition to the zinc vacancy level (VZn) and the green emission is due to the singly occupied oxygen vacancy (Vo+) [40]. PL spectroscopy can be used to determine the type of oxygen vacancy present in two-sized ZnO nanocrystals by analyzing their emission spectra. The position of the PL peak provides information about the type of vacancy, with a green emission indicating monovalent vacancies and blue emission indicating divalent vacancies [40]. The reason for this is that the lattice distortion brought on by the inclusion of dopant ions such asCo+2 and Gd3+ with different ionic radii in the ZnO lattice structure led to the formation of the ant-site oxygen inside the ZnO structure. From the figure, it can also be noticed that the intensity spectrum of Gd-doped and Co/Gd di-doped samples is very high as compared to pure ZnO and co-doped ZnO, indicating that more defects are introduced to the system. In the synthesized samples, PL results indicate the suitable amount of defects such as oxygen vacancies which support the analysis of the magnetic data [41].

3.6. Electrical Properties

3.6.1. Dielectric Properties

Figure 7a shows the constant of dielectric against the applied frequency for pure ZnO, Co-added, and Co/Gd di-added ZnO nanoparticles at ambient temperature. The dielectric characteristics were measured using an analyzer of impedance at a different frequency, i.e., from 41 Hz to 1.5 × 10⁷ Hz. Sequentially, to determine the constant of dielectric, the samples were converted into circular shape pellets by pressing the nanopowder at 10 tons for 1 min. For the removal of porosity, the pellets were heated at 400 °C for two hours. The diameter of the pellets was 10 mm. These pellets were coated with a silver paste to make electrical contacts. Equation (7) was used to get the constant dielectric of pure ZnO, Co-added ZnO, and Co/Gd-added ZnO.
ε r = C d ε o A
where ‘εr’ is the dielectric constant, C represents the capacitance, the thickness of the pellets is ‘d’, and ‘A’ is the areal cross-section of the pellets. Figure 7a indicates that the dielectric constant for all the samples shows a decreasing trend, with the increase in frequency and the dielectric constant for all samples nearly constant at higher frequencies. Pure ZnO has a greater dielectric constant than doped ZnO at lower frequencies. With the rise in frequency, the reduction in εr indicated the oxide-based nanoparticle’s behavior [42].
The observed manners of dielectric constant can be explained based on the oxygen vacancies [42]; the region at the interface contains oxygen vacancies that create dipole moments that can be polarized in the presence of (low) frequency that results in high dielectric constant at low frequency. The dielectric constant is frequency independent at higher frequencies because the dipoles and alternating field are severely mismatched.

3.6.2. Electrical Conductivity

Figure 7b displays the electrical conductivity (σac) of unmodified, Co-modified, and Co/Gd di-modified ZnO nanoparticles as a function of frequency at ambient temperature. Equation (8) describes how doped ZnO, Co-doped ZnO, and Co/Gd di-doped ZnO nanoparticles conduct electricity.
σ a c = ε o ε ω
where εo is the free space permittivity, ε″ is the dielectric constant and ω = 2πf where f is the frequency. It is clear that the electrical conductivity depends upon the dielectric loss and frequency. With increasing frequency, all samples’ conductivity rises. Especially at higher frequencies, the electrical conductivity of ZnO and Co-added ZnO improved largely [43]. At the initial stage, in low frequency, the boost in conductivity is neglectable. This is due to the fact that, at a region of low frequency, the charge carriers possess insufficient energy to transport between the grains. At high frequencies, acceptable energy is provided to charge carriers to break the potential barrier, and the materials become conductive. At lower frequency, the enhancement of electrical conductivity is almost negligible but slowly increased with the frequency, but at a higher frequency, a strong enhancement of conductivity was achieved rapidly. To explain the electrical conductivity as a function of the frequency, a hopping model can be used [18]. At a low-frequency region, the conductivity is almost constant because the transportation of charges takes place at different paths. However, the transportation occurs at high frequency through the hopping of the charge carrier. With the increase in applied frequency, the enhancement of charge carrier ions occurred; thus, electrical conductivity increased. Two mechanisms can be used to explain the conductivity. One of them is the electrical energy associated with the high frequency, which is efficiently promoted between the charge carrier hopping. Secondly, in the high frequency range, there is an improvement of dielectric relaxation of the polarization of ZnO nanoparticles [44]. Undoped ZnO conduction comes from intrinsic defects as donors/acceptors. Co-doped ZnO creates acceptor levels, leading to electron hopping. Gd-doped ZnO creates donor levels, causing electron hopping [45].

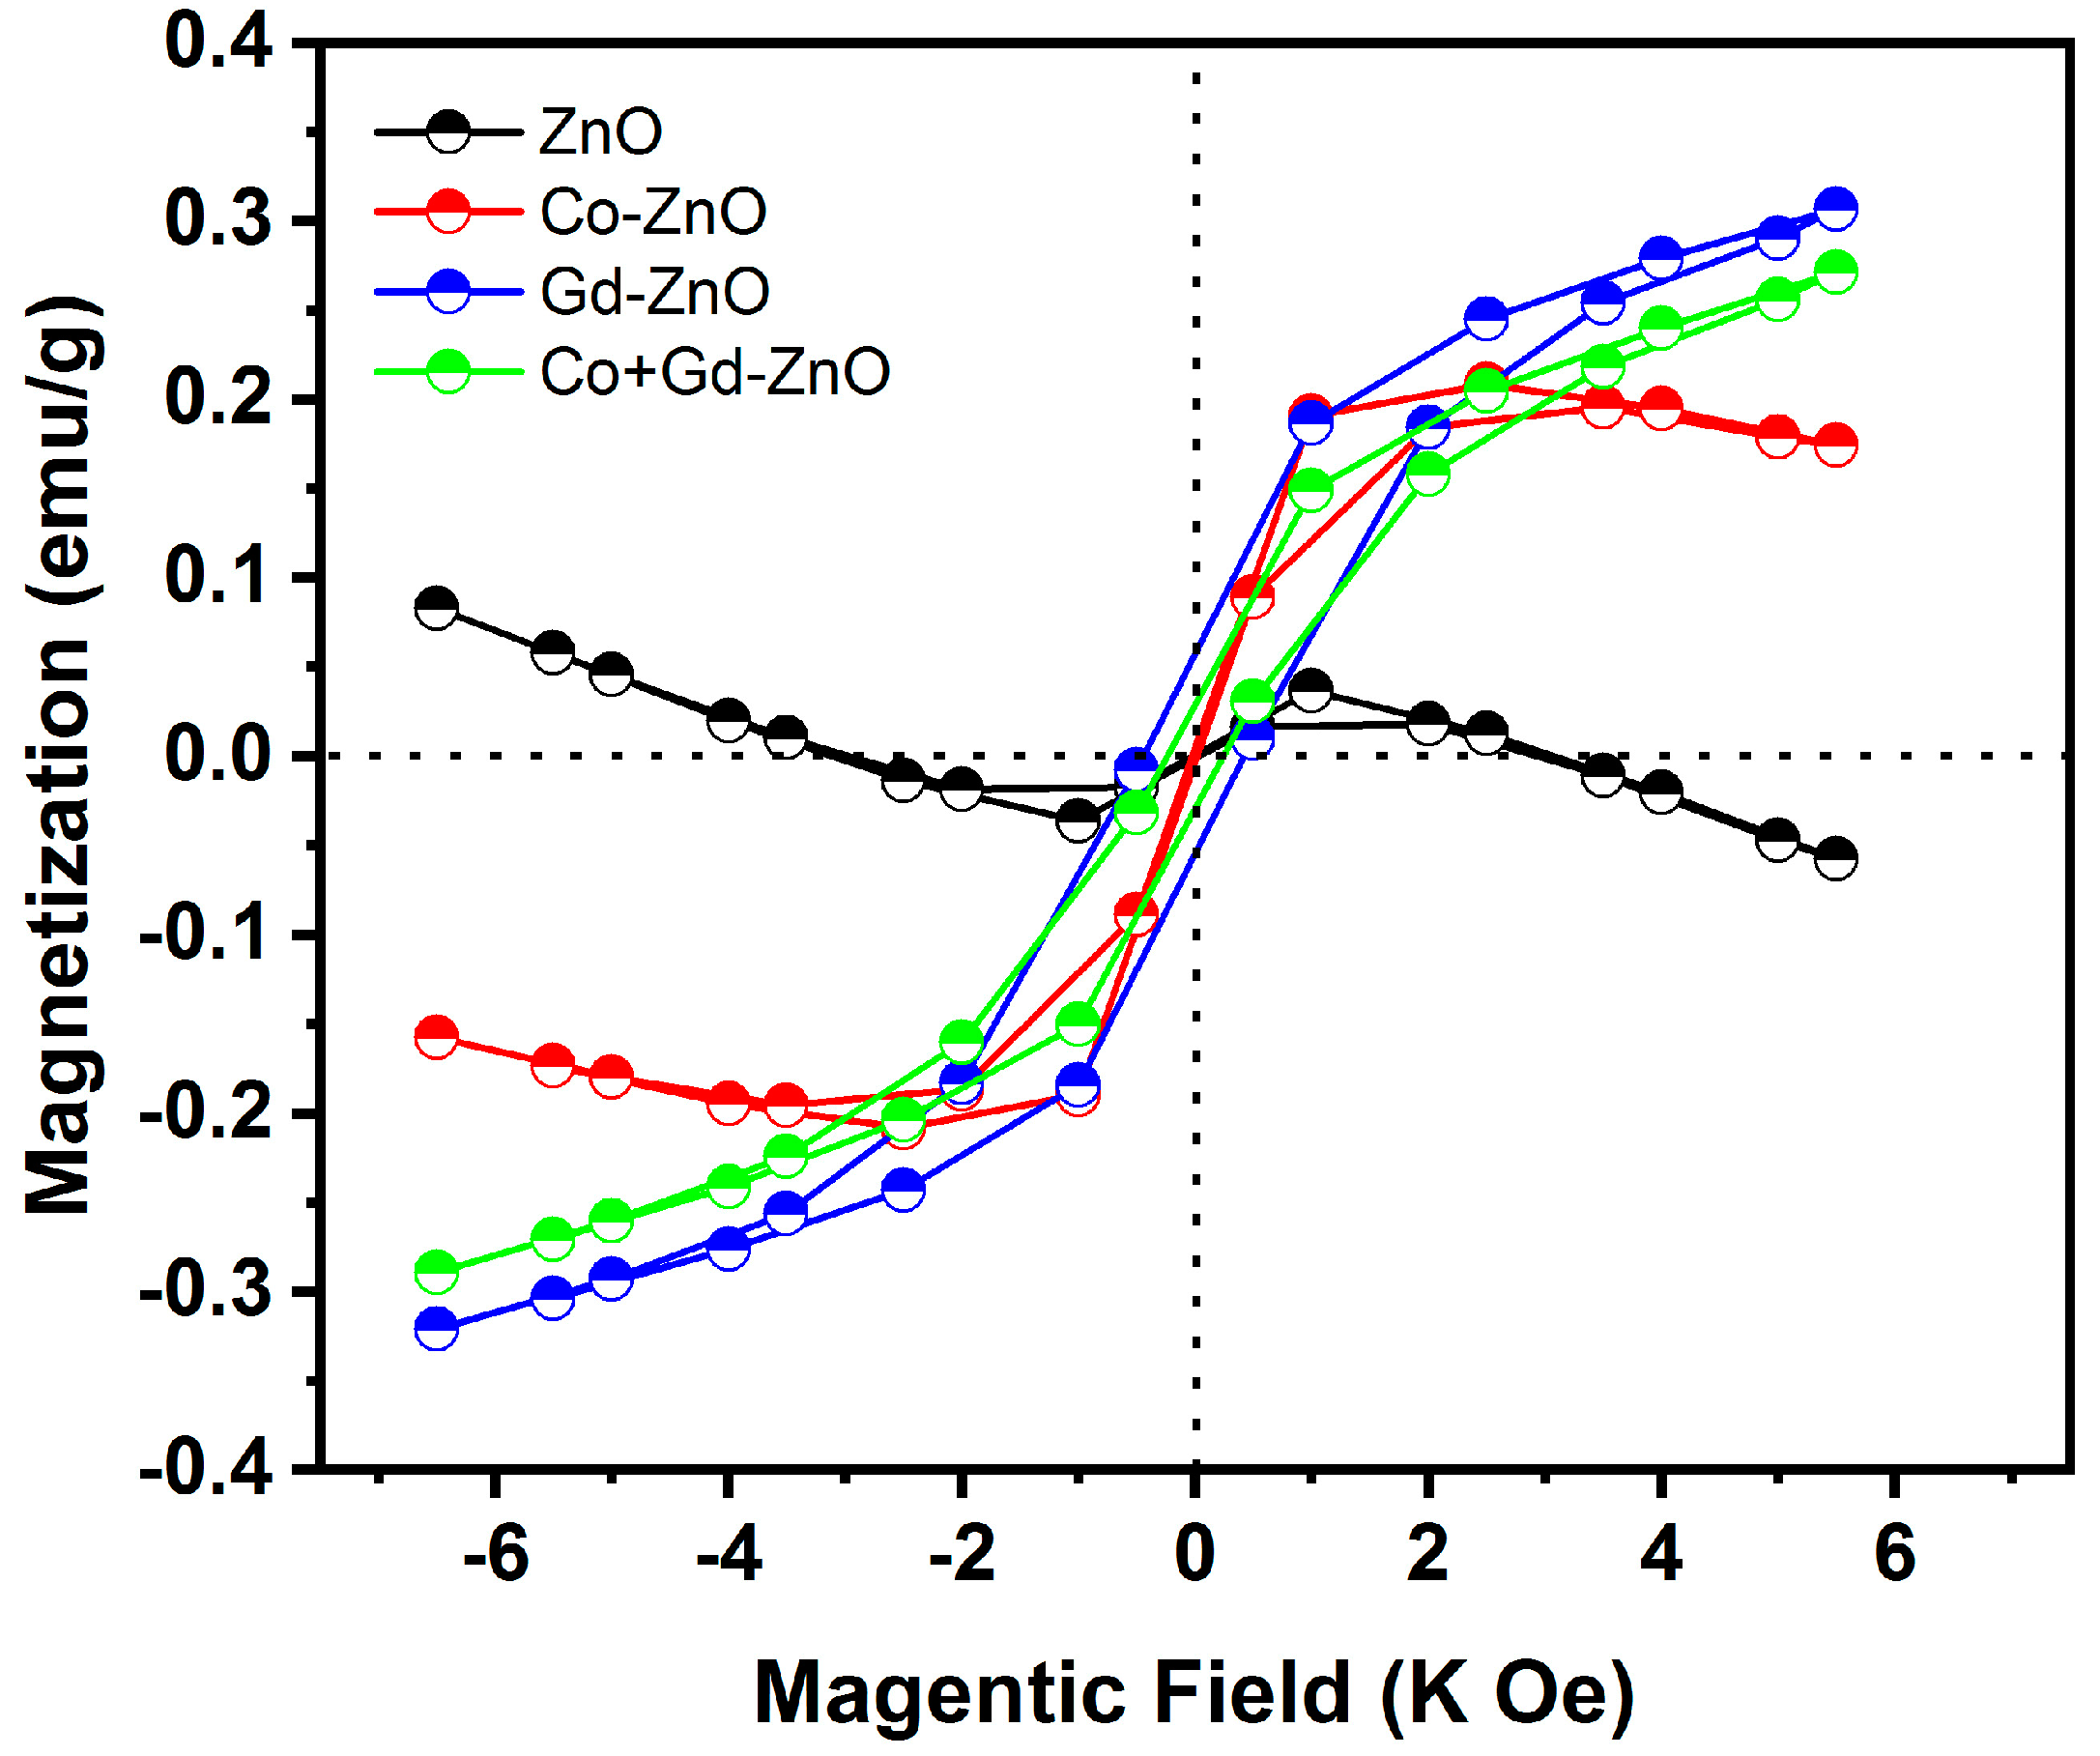
3.7. Magnetic Properties

A vibrating sample magnetometer (VSM) was employed to investigate the magnetic characteristics of the samples. Figure 8 displays the magnetization as a function of the B-field curve for all synthetic samples containing pure ZnO, 2% Co-doped ZnO, 2% Gd-doped ZnO, and 2% Co/Gd-ZnO nanoparticles. It is clear from the figure that pure ZnO is diamagnetic. This diamagnetic nature is due to the valence state of Zn2+, which means it has lost two electrons from its neutral state. The electronic configuration of Zn2+ is 3d10, which means that all the d orbitals are fully occupied by electrons, and there are no unpaired electrons available for ferromagnetic behavior. Since there are no unpaired electrons in the d orbitals of Zn2+ in ZnO, the material does not exhibit ferromagnetic behavior [46]. The figure shows a clear trend of increasing ferromagnetic behavior in the doped ZnO samples. For the synthesized sample, the magnetization is stronger for Gd-doped and Co/ Gd dual-doped samples in contrast to single Co-doped ZnO. The remanent magnetization (Mr), coercive field (Hc), and saturation magnetization (Ms) is also observed to enhance the doped samples (Table 4).
With doping, ferromagnetism has been reported for all doped samples. For the synthesized sample, the magnetization is stronger for Gd-doped and Co/Gd dual-added samples in contrast to single Co-doped ZnO. Therefore, the doping of RE with TE plays an effective role in RFTM in the metal oxide [47]. The rare earth metal Gd has highly dominant ferromagnetic behavior, which is due to the locally induced carriers, or singly ionized oxygen vacancies (Vo+) that are brought about by trapped Gd3+ ions. Because of its partially full 5d and 4f energy levels, which can simultaneously create d-d (exchange interactions between nearby Gd ions) and 5d (internal Gd ion) exchange interactions, Gd is one of the most significant RE magnetic impurity atoms. Moreover, there is a significant s-f exchange interaction between the Gd and Zn bonds. Kumar et al. (2014) also reported that an increase in saturation magnetization can be attributed to oxygen vacancies, which generate long-range ferromagnetism as the doping of Gd ions, in turn, increase the oxygen vacancies [48]. Moreover, the addition of cobalt (Co) creates oxygen vacancy defects in the hexagonal structure due to the difference in the oxygen state of Co and Zn. ZnO has a hexagonal wurtzite crystal structure where the Zn+2 ions occupy the lattice state and the oxygen atoms are arranged in a close pack arrangement between them. When Co is added to ZnO, it can substitute for some of the Zn+2 ions in the lattice. However, the Co has a higher oxygen state (Co+2, Co+3) than Zn+2. This difference in oxidation state can create oxygen vacancies in the hexagonal structure to maintain charge neutrality [49]. When Co2+ and Gd3+ ions are substituted simultaneously at Zn sites, intrinsic donor defects such as oxygen vacancy defects (Vo), interstitial zinc defects (Zni), and defects caused by Gd-O, etc., are undoubtedly introduced [16]. These defects serve as active F-exchange centers and trap trapped free electrons, shifting the Fermi level inside the conduction band [18]. As a result, Co 3d and Gd 5d electrons contribute to the electrons at the bottom border of the conduction band, which can establish s-d magnetic exchange coupling to introduce spin split states via the aforementioned impurity-defect complex. In the current work, in photoluminescence spectra, induced defects (Vo, Zni, VZn, etc.) have been seen and identified, which supports the idea of a magnetic origin.

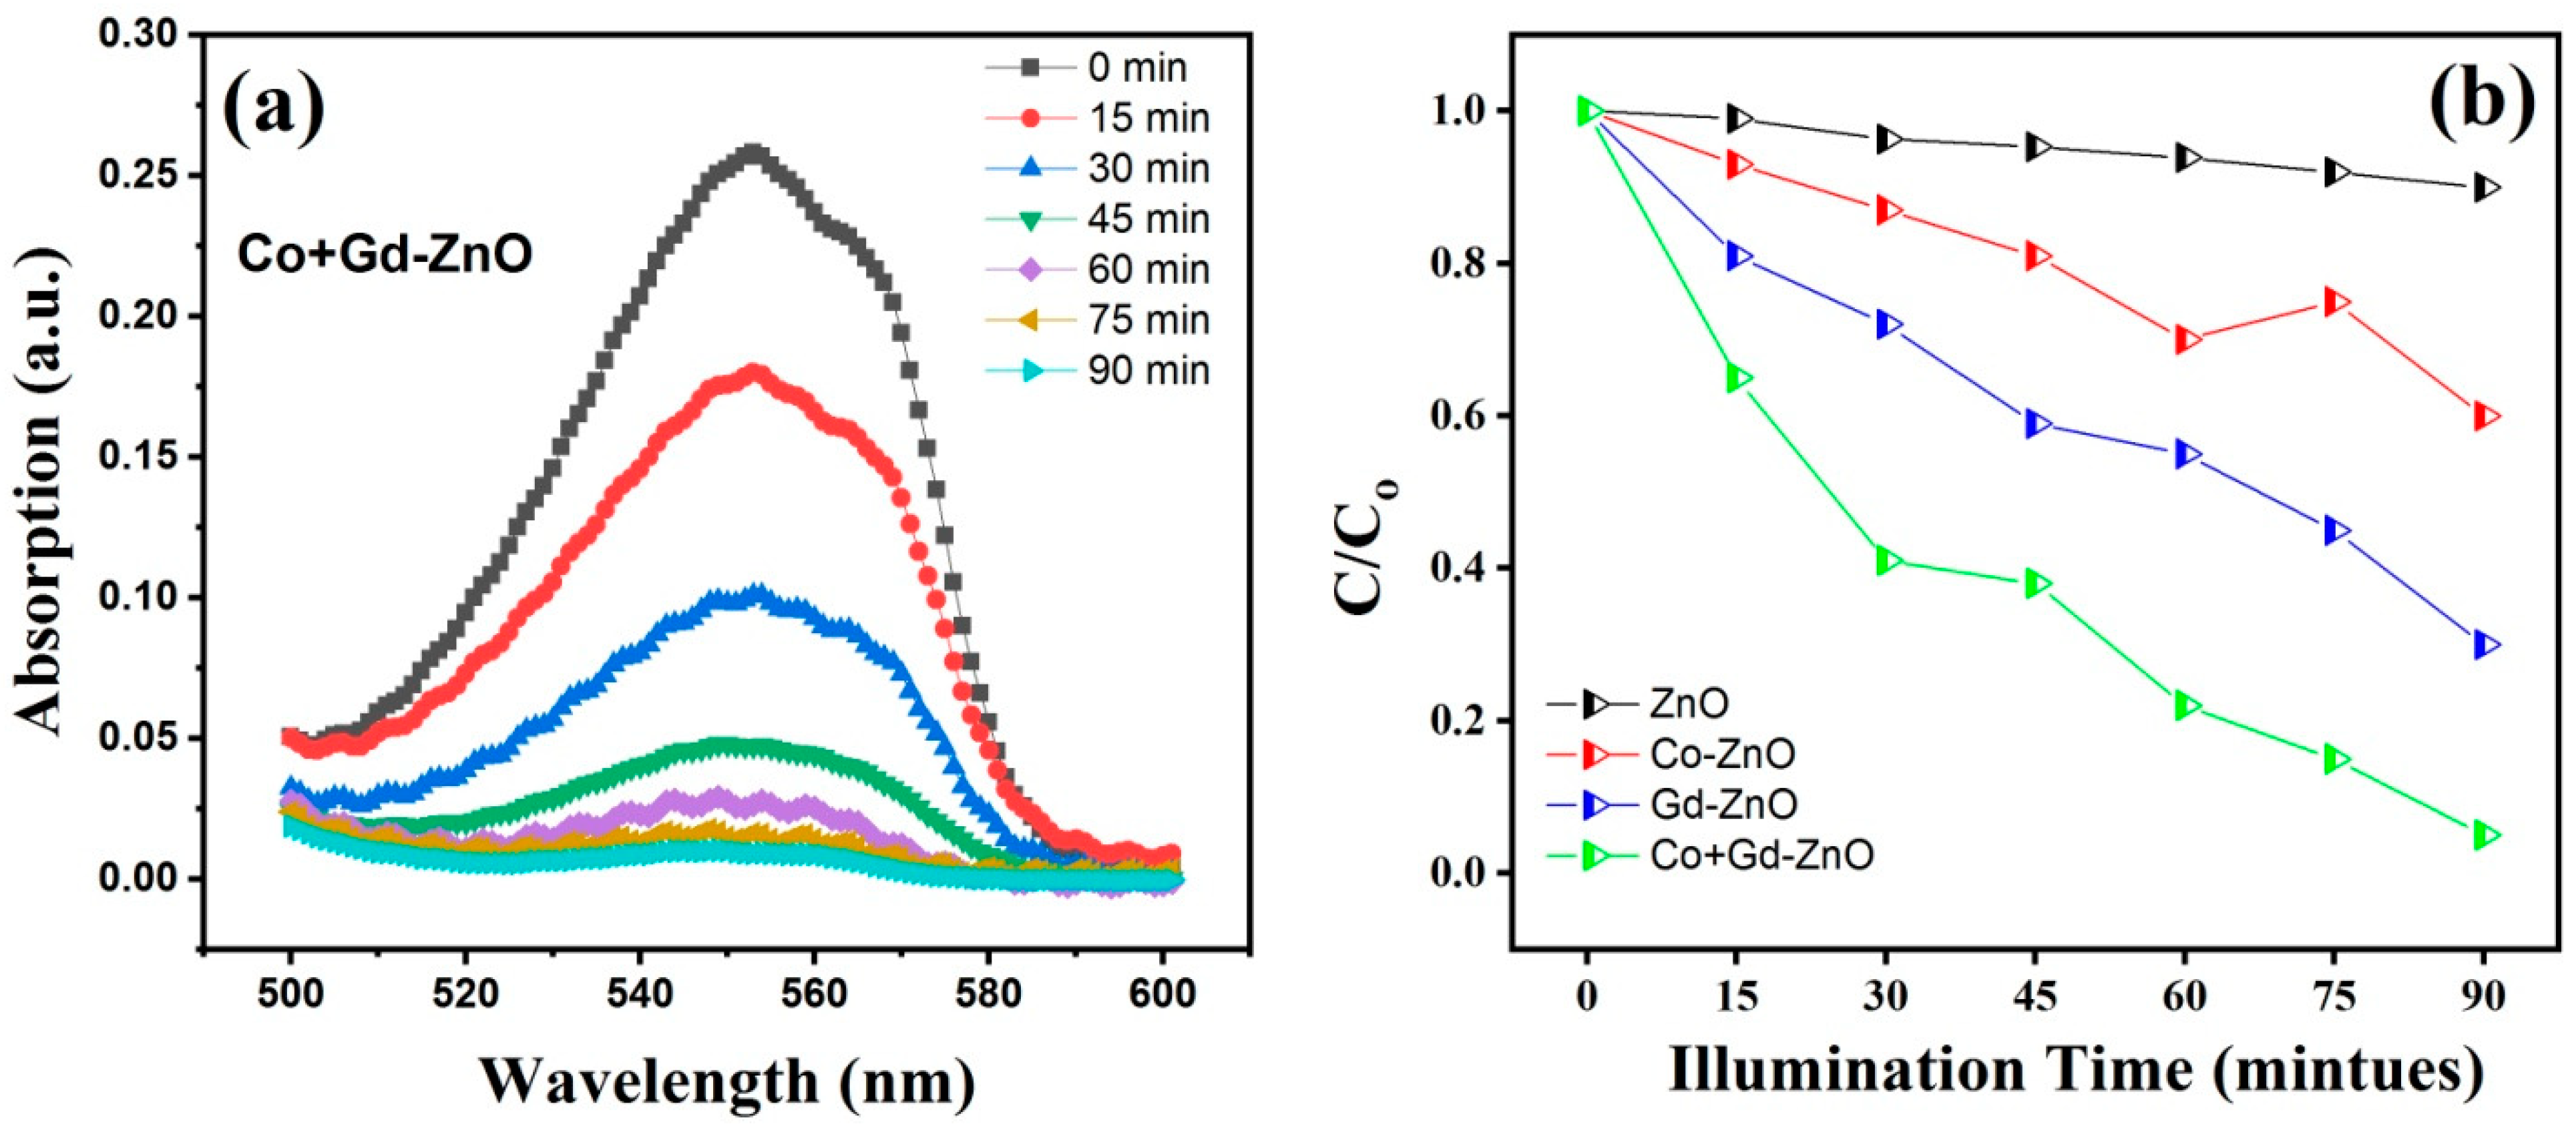
3.8. Photocatalytic Activity

The methylene blue (MB) degradation was used to evaluate the photocatalytic degradation abilities of all the synthesized samples under visible light irradiation. A halogen lamp (250 W) was used as the light source to irradiate the specimens with the MB pollutant. To prepare the specimens, 40 mg of each sample was added to 100 mL of 40 mg/L dye solution, and the mixture was allowed to achieve an adsorption-desorption equilibrium on the photocatalytic surface by leaving it in the dark for 60 min. The suspension was then continuously stirred while illuminated by light, and the (C/Co) ratio was plotted as a function of irradiation time to derive the dye degradation kinetic curve. The prepared Co-Gd-ZnO sample was tested against MB, and its photodegradation activity is shown in Figure 9a. When the sample absorbed visible light, it generated valence band holes and conduction band electrons, which acted as catalysts in oxidation and reduction reactions on the semiconductor surface. Upon irradiation, the reaction was carried out, and a noticeable decrease in the absorbance of dye MB was observed. Figure 9b illustrates the MB dye’s rate of photodegradation at various time intervals while being exposed to all the synthesized nanocatalysts under visible light illumination. The photodegradation rate (C/Co) of pure ZnO was almost negligible due to its large bandgap of 3.34 eV, which prevented it from being triggered under solar radiation. Under these conditions, the dye degraded by only 10.5% in 90 min. In contrast, doped ZnO nanocrystals exhibited higher photocatalytic activities and photodegradation rates than pure ZnO nanocrystals, with a maximum photocatalytic activity of more than 93% for Co-Gd-ZnO under the same conditions. The decreased bandgap for the doped sample may explain the enhanced photocatalytic efficiency. When ZnO is doped with Co, Gd, and Co/Gd, it introduces additional energy levels in the bandgap of the material, which can improve the photocatalytic performance. One of the mechanisms by which this can occur is through the creation of oxygen vacancies in the ZnO lattice. Oxygen vacancies are defects in the ZnO lattice where oxygen atoms are missing from their usual lattice sites [50]. These vacancies can act as trapping sites for electrons and holes, which are generated when ZnO is exposed to light. Without these defects, the electrons and holes can quickly recombine and lose their energy, reducing the efficiency of the photocatalytic process [51,52]. When Co and Gd are doped into ZnO, they can create additional oxygen vacancies in the lattice. Co and Gd ions have different sizes and charges compared to Zn and O ions, which can lead to lattice distortions and the creation of vacancies. These vacancies act as additional trapping sites for electrons and holes, further reducing recombination and enhancing the photocatalytic performance [53]. Table 5 compares the photocatalytic activity of MB for various photocatalysts with existing work.

4. Conclusions

Using the co-precipitation approach, pure, Co, Gd, and Co/Gd di-doped nanoparticles of ZnO were synthesized. Without a secondary phase, XRD measurements disclosed that the nanoparticles of ZnO have a hexagonal wurtzite crystal structure. We found that the structural parameters depends on dopants and the crystallite size is enhanced with Co, Gd, and Co/Gd doping in ZnO. The nanoparticles were shaped similarly to rods, as revealed by the SEM analysis, and EDX analysis verified the stoichiometric ratio of the essential elements. The Co, Gd, and Co/Gd-doped ZnO displayed a redshift in the UV-Vis spectroscopy. This also showed how dual doping in ZnO may be used to modify the bandgap and optical absorbance of ZnO nanoparticles. Owing to doping-induced defect states, the PL spectra showed various characteristic peaks. According to the magnetic data, strong magnetization is attained as a result of well-built ferromagnetic pairing linking the 3d localized electrons of Co2+ and the localized charge carrier originated by Gd3+ ions, which has been constrained by defects such as oxygen vacancies. When exposed to UV-visible light, the Co/Gd-ZnO nanoparticles exhibited greater photocatalytic efficacy than ZnO.

Author Contributions

Conceptualization, A.S., D.A. and N.I.; data curation, K.S., A.S. and D.A.; formal analysis, W.H.S. and G.A.; funding acquisition, H.O.E.; investigation, K.S., A.S., D.A. and G.A.; methodology, K.S. and A.A. (Akhtar Ali); project administration, F.H., A.U.S. and K.S.A.; resources, A.S., D.A., A.A. (Akhtar Ali), A.A. (Abed Alataway), A.Z.D., H.O.E. and M.A.-Y.; software, F.H.; supervision, F.H.; writing—original draft, A.S., D.A., N.I. and A.U.S.; writing—review and editing, K.S., A.S., D.A., W.H.S., A.U.S., A.A. (Abed Alataway), A.Z.D., H.O.E., M.A.-Y. and K.S.A. All authors have read and agreed to the published version of the manuscript.

Funding

This research was funded by the Deanship of Scientific Research, King Saud University, through the Vice Deanship of Scientific Research Chairs; Research Chair of Prince Sultan bin Abdul aziz International Prize for Water.

Data Availability Statement

The datasets used and/or analyzed during the current study are available from the corresponding author upon reasonable request.

Acknowledgments

The authors extend their appreciation to the Deanship of Scientific Research, King Saud University, for funding through the Vice Deanship of Scientific Research Chairs; Research Chair of Prince Sultan bin Abdul aziz International Prize for Water. The authors also acknowledge the financial support extended by the Higher Education Commission of Pakistan (HEC) via the National Research Program for Universities (NRPU) Project No. 20-16971/NRPU/R&D/HEC/2021 2021.

Conflicts of Interest

The authors declare no conflict of interest.

References

  1. Tao, X.; Liu, D.; Cong, W.; Huang, L. Controllable synthesis of starch-modified ZnMgAl-LDHs for adsorption property improvement. Appl. Surf. Sci. 2018, 457, 572–579. [Google Scholar] [CrossRef]
  2. Hafeez, M.; Afyaz, S.; Khalid, A.; Ahmad, P.; Khandaker, M.U.; Sahibzada, M.U.K.; Ahmad, I.; Khan, J.; Alhumaydhi, F.A.; Emran, T.B. Synthesis of cobalt and sulphur doped titanium dioxide photocatalysts for environmental applications. J. King Saud Univ. Sci. 2022, 34, 102028. [Google Scholar] [CrossRef]
  3. Annu, A.A.; Ahmed, S. Green synthesis of metal, metal oxide nanoparticles, and their various applications. Handb. Ecomater. 2018, 2018, 1–45. [Google Scholar]
  4. Almoussawi, M.; Abdallah, A.; Habanjar, K.; Awad, R. Effect of (Sm, Co) co-doping on the structure and electrical conductivity of ZnO nanoparticles. Mater. Res. Express 2020, 7, 105011. [Google Scholar] [CrossRef]
  5. Gherbi, B.; Laouini, S.E.; Meneceur, S.; Bouafia, A.; Hemmami, H.; Tedjani, M.L.; Thiripuranathar, G.; Barhoum, A.; Menaa, F. Effect of pH value on the bandgap energy and particles size for biosynthesis of ZnO nanoparticles: Efficiency for photocatalytic adsorption of methyl orange. Sustainability 2022, 14, 11300. [Google Scholar] [CrossRef]
  6. Hezam, A.; Drmosh, Q.; Ponnamma, D.; Bajiri, M.A.; Qamar, M.; Namratha, K.; Zare, M.; Nayan, M.; Onaizi, S.A.; Byrappa, K. Strategies to enhance ZnO photocatalyst’s performance for water treatment: A comprehensive review. Chem. Rec. 2022, 22, e202100299. [Google Scholar] [CrossRef]
  7. Samadi, M.; Zirak, M.; Naseri, A.; Khorashadizade, E.; Moshfegh, A.Z. Recent progress on doped ZnO nanostructures for visible-light photocatalysis. Thin Solid Film. 2016, 605, 2–19. [Google Scholar] [CrossRef] [Green Version]
  8. Daksh, D.; Agrawal, Y.K. Rare earth-doped zinc oxide nanostructures: A review. Rev. Nanosci. Nanotechnol. 2016, 5, 1–27. [Google Scholar] [CrossRef]
  9. Lee, K.M.; Lai, C.W.; Ngai, K.S.; Juan, J.C. Recent developments of zinc oxide based photocatalyst in water treatment technology: A review. Water Res. 2016, 88, 428–448. [Google Scholar] [CrossRef]
  10. Hu, B.; Sun, Q.; Zuo, C.; Pei, Y.; Yang, S.; Zheng, H.; Liu, F. A highly efficient porous rod-like Ce-doped ZnO photocatalyst for the degradation of dye contaminants in water. Beilstein J. Nanotechnol. 2019, 10, 1157–1165. [Google Scholar] [CrossRef]
  11. Selvaraj, S.; Mohan, M.K.; Navaneethan, M.; Ponnusamy, S.; Muthamizhchelvan, C. Synthesis and photocatalytic activity of Gd doped ZnO nanoparticles for enhanced degradation of methylene blue under visible light. Mater. Sci. Semicond. Process. 2019, 103, 104622. [Google Scholar] [CrossRef]
  12. Zhang, J.; Xu, X.; Zhang, W.; Huang, Y.; Zhang, P. Visible-light driven photocatalytic performance of eco-friendly cobalt-doped ZnO nanoarrays: Influence of morphology, cobalt doping, and photocatalytic efficiency. Spectrochim. Acta Part A Mol. Biomol. Spectrosc. 2022, 274, 121103. [Google Scholar] [CrossRef] [PubMed]
  13. Bharat, T.; Mondal, S.; Gupta, H.; Singh, P.; Das, A. Synthesis of doped zinc oxide nanoparticles: A review. Mater. Today Proc. 2019, 11, 767–775. [Google Scholar] [CrossRef]
  14. Yayapao, O.; Thongtem, T.; Phuruangrat, A.; Thongtem, S. Synthesis and characterization of highly efficient Gd doped ZnO photocatalyst irradiated with ultraviolet and visible radiations. Mater. Sci. Semicond. Process. 2015, 39, 786–792. [Google Scholar] [CrossRef]
  15. Khan, I.; Saeed, K.; Zekker, I.; Zhang, B.; Hendi, A.H.; Ahmad, A.; Ahmad, S.; Zada, N.; Ahmad, H.; Shah, L.A. Review on methylene blue: Its properties, uses, toxicity and photodegradation. Water 2022, 14, 242. [Google Scholar] [CrossRef]
  16. Vijayaprasath, G.; Murugan, R.; Hayakawa, Y.; Ravi, G. Optical and magnetic studies on Gd doped ZnO nanoparticles synthesized by co-precipitation method. J. Lumin. 2016, 178, 375–383. [Google Scholar] [CrossRef]
  17. Safeen, A.; Safeen, K.; Shafique, M.; Iqbal, Y.; Ahmed, N.; Rauf Khan, M.A.; Asghar, G.; Althubeiti, K.; Al Otaibi, S.; Ali, G.; et al. The effect of Mn and Co dual-doping on the structural, optical, dielectric and magnetic properties of ZnO nanostructures. RSC Adv. 2022, 12, 11923–11932. [Google Scholar] [CrossRef]
  18. Asghar, G.; Asri, S.; Khusro, S.N.; Tariq, G.H.; Awan, M.; Irshad, M.; Safeen, A.; Iqbal, Y.; Shah, W.H.; Anis-ur-Rehman, M. Enhanced magnetic properties of barium hexaferrite. J. Electron. Mater. 2020, 49, 4318–4323. [Google Scholar] [CrossRef]
  19. Kaphle, A.; Borunda, M.F.; Hari, P. Influence of cobalt doping on residual stress in ZnO nanorods. Mater. Sci. Semicond. Process. 2018, 84, 131–137. [Google Scholar] [CrossRef]
  20. Marinho, J.Z.; de Paula, L.F.; Longo, E.; Patrocinio, A.O.; Lima, R.C. Effect of Gd 3+ doping on structural and photocatalytic properties of ZnO obtained by facile microwave-hydrothermal method. SN Appl. Sci. 2019, 1, 1–13. [Google Scholar] [CrossRef] [Green Version]
  21. Das, S.; Das, S.; Das, D.; Sutradhar, S. Tailoring of room temperature ferromagnetism and electrical properties in ZnO by Co (3d) and Gd (4f) element co-doping. J. Alloy. Compd. 2017, 691, 739–749. [Google Scholar] [CrossRef]
  22. Ali, A.; Shah, W.H.; Safeen, A.; Ali, L.; Tufail, M.; Ullah, Z.; Safeen, K.; Eldin, S.M.; R Ali, M.; Sohail, M. Effect of Ca doping on the arbitrary canting of magnetic exchange interactions in La1-xCaxMnO3 nanoparticles. Front. Mater. 2023, 10, 1117793. [Google Scholar] [CrossRef]
  23. Khan, R.; Althubeiti, K.; Algethami, M.; Rahman, N.; Sohail, M.; Mao, Q.; Zaman, Q.; Ullah, A.; Ilyas, N.; Afzal, A.M. Observation of quantum criticality in antiferromagnetic based (Ce1− xYx) 2Ir3Ge5 Kondo-Lattice system. J. Magn. Magn. Mater. 2022, 556, 169361. [Google Scholar] [CrossRef]
  24. Hamdi, S.; Smaoui, H.; Guermazi, S.; Leroy, G.; Duponchel, B. Enhancing the structural, optical and electrical conductivity properties of ZnO nanopowders through Dy doping. Inorg. Chem. Commun. 2022, 109819. [Google Scholar] [CrossRef]
  25. Ahammed, N.; Hassan, M.S.; Hassan, M. Effects of aluminum (Al) incorporation on structural, optical and thermal properties of ZnO nanoparticles. Mater. Sci. -Pol. 2018, 36, 419–426. [Google Scholar] [CrossRef] [Green Version]
  26. Mesaros, A.; Ghitulica, C.D.; Popa, M.; Mereu, R.; Popa, A.; Petrisor Jr, T.; Gabor, M.; Cadis, A.I.; Vasile, B.S. Synthesis, structural and morphological characteristics, magnetic and optical properties of Co doped ZnO nanoparticles. Ceram. Int. 2014, 40, 2835–2846. [Google Scholar] [CrossRef]
  27. Ab Rasid, N.F.; Tawil, S.N.M.; Norhidayah, C.A.; Sahdan, M.Z. Influence of Gd doping on the structural and optical properties of ZnO. Appl. Mech. Mater. 2015, 773, 672–676. [Google Scholar] [CrossRef] [Green Version]
  28. Muktaridha, O.; Adlim, M.; Suhendrayatna, S.; Ismail, I. Progress of 3d metal-doped zinc oxide nanoparticles and the photocatalytic properties. Arab. J. Chem. 2021, 14, 103175. [Google Scholar] [CrossRef]
  29. Panigrahy, B.; Aslam, M.; Bahadur, D. Aqueous synthesis of Mn-and Co-doped ZnO nanorods. J. Phys. Chem. C 2010, 114, 11758–11763. [Google Scholar] [CrossRef]
  30. Abdel Ghafar, H.H.; Radwan, E.K.; El-Wakeel, S.T. Removal of hazardous contaminants from water by natural and zwitterionic surfactant-modified clay. ACS Omega 2020, 5, 6834–6845. [Google Scholar] [CrossRef] [Green Version]
  31. Safeen, A.; Safeen, K.; Ullah, R.; Zulfqar; Shah, W.H.; Zaman, Q.; Althubeiti, K.; Al Otaibi, S.; Rahman, N.; Iqbal, S.; et al. Enhancing the physical properties and photocatalytic activity of TiO2 nanoparticles via cobalt doping. RSC Adv. 2022, 12, 15767–15774. [Google Scholar] [CrossRef] [PubMed]
  32. Phan, T.-L.; Yu, S. Optical and Magnetic Properties of Zn1–x Mn x O Nanorods Grown by Chemical Vapor Deposition. J. Phys. Chem. C 2013, 117, 6443–6453. [Google Scholar] [CrossRef]
  33. Safeen, K.; Micheli, V.; Bartali, R.; Gottardi, G.; Safeen, A.; Ullah, H.; Laidani, N. Synthesis of conductive and transparent Nb-doped TiO2 films: Role of the target material and sputtering gas composition. Mater. Sci. Semicond. Process. 2017, 66, 74–80. [Google Scholar] [CrossRef]
  34. Rajwali, K.; Ming-Hu, F. Dielectric and magnetic properties of (Zn, Co) co-doped SnO2 nanoparticles. Chin. Phys. B 2015, 24, 127803. [Google Scholar] [CrossRef]
  35. Safeen, K.; Micheli, V.; Bartali, R.; Gottardi, G.; Safeen, A.; Ullah, H.; Laidani, N. Influence of intrinsic defects on the electrical and optical properties of TiO2: Nb films sputtered at room temperature. Thin Solid Film. 2018, 645, 173–179. [Google Scholar] [CrossRef]
  36. Saadi, H.; Rhouma, F.; Benzarti, Z.; Bougrioua, Z.; Guermazi, S.; Khirouni, K. Electrical conductivity improvement of Fe doped ZnO nanopowders. Mater. Res. Bull. 2020, 129, 110884. [Google Scholar] [CrossRef]
  37. Ahmed, F.; Arshi, N.; Anwar, M.; Danish, R.; Koo, B.H. Morphological evolution of ZnO nanostructures and their aspect ratio-induced enhancement in photocatalytic properties. RSC Adv. 2014, 4, 29249–29263. [Google Scholar] [CrossRef]
  38. Manikandan, A.; Manikandan, E.; Meenatchi, B.; Vadivel, S.; Jaganathan, S.; Ladchumananandasivam, R.; Henini, M.; Maaza, M.; Aanand, J.S. Rare earth element (REE) lanthanum doped zinc oxide (La: ZnO) nanomaterials: Synthesis structural optical and antibacterial studies. J. Alloy. Compd. 2017, 723, 1155–1161. [Google Scholar] [CrossRef] [Green Version]
  39. Galdámez-Martinez, A.; Santana, G.; Güell, F.; Martínez-Alanis, P.R.; Dutt, A. Photoluminescence of ZnO nanowires: A review. Nanomaterials 2020, 10, 857. [Google Scholar] [CrossRef]
  40. Ji, H.; Cai, C.; Zhou, S.; Liu, W. Structure, photoluminescence, and magnetic properties of Co-doped ZnO nanoparticles. J. Mater. Sci. Mater. Electron. 2018, 29, 12917–12926. [Google Scholar] [CrossRef]
  41. Prabakar, C.; Muthukumaran, S.; Raja, V. Influence of defects on the structural, optical, photoluminescence and magnetic properties of Cr/Mn dual doped ZnO nanostructures. Chem. Phys. Impact 2021, 2, 100019. [Google Scholar] [CrossRef]
  42. Khan, R.; de Araujo, C.I.L.; Khan, T.; Khattak, S.A.; Ahmed, E.; Khan, A.; Ullah, B.; Khan, G.; Safeen, K.; Safeen, A. Effect of thermal calcination on the structural, dielectric and magnetic properties of (ZnO–Ni) semiconductor. J. Mater. Sci. Mater. Electron. 2019, 30, 3396–3404. [Google Scholar] [CrossRef]
  43. Zubair, M.; Khan, A.; Hua, T.; Ilyas, N.; Fashu, S.; Afzal, A.M.; Safeen, M.A.; Khan, R. Oxygen vacancies induced room temperature ferromagnetism and enhanced dielectric properties in Co and Mn co-doped ZnO nanoparticles. J. Mater. Sci. Mater. Electron. 2021, 32, 9463–9474. [Google Scholar]
  44. Khan, R.; Fashu, S. Effect of annealing on Ni-doped ZnO nanoparticles synthesized by the co-precipitation method. J. Mater. Sci. Mater. Electron. 2017, 28, 10122–10130. [Google Scholar] [CrossRef]
  45. Wang, J.; Chen, R.; Xiang, L.; Komarneni, S. Synthesis, properties and applications of ZnO nanomaterials with oxygen vacancies: A review. Ceram. Int. 2018, 44, 7357–7377. [Google Scholar] [CrossRef]
  46. Kapilashrami, M.; Xu, J.; Ström, V.; Rao, K.V.; Belova, L. Transition from ferromagnetism to diamagnetism in undoped ZnO thin films. Appl. Phys. Lett. 2009, 95, 033104. [Google Scholar] [CrossRef]
  47. Obeid, M.M.; Jappor, H.R.; Al-Marzoki, K.; Al-Hydary, I.A.; Edrees, S.J.; Shukur, M.M. Unraveling the effect of Gd doping on the structural, optical, and magnetic properties of ZnO based diluted magnetic semiconductor nanorods. RSC Adv. 2019, 9, 33207–33221. [Google Scholar] [CrossRef] [PubMed] [Green Version]
  48. Kumar, S.; Sahare, P. Gd3+ incorporated ZnO nanoparticles: A versatile material. Mater. Res. Bull. 2014, 51, 217–223. [Google Scholar] [CrossRef]
  49. Birajdar, S.D.; Khirade, P.P.; Humbe, A.V.; Jadhav, K. Presence of intrinsic defects and transition from diamagnetic to ferromagnetic state in Co2+ ions doped ZnO nanoparticles. J. Mater. Sci. Mater. Electron. 2016, 27, 5575–5583. [Google Scholar] [CrossRef]
  50. Chithira, P.; John, T.T. Correlation among oxygen vacancy and doping concentration in controlling the properties of cobalt doped ZnO nanoparticles. J. Magn. Magn. Mater. 2020, 496, 165928. [Google Scholar] [CrossRef]
  51. Low, J.; Yu, J.; Jaroniec, M.; Wageh, S.; Al-Ghamdi, A.A. Heterojunction photocatalysts. Adv. Mater. 2017, 29, 1601694. [Google Scholar] [CrossRef] [PubMed]
  52. Mubeen, K.; Irshad, A.; Safeen, A.; Aziz, U.; Safeen, K.; Ghani, T.; Khan, K.; Ali, Z.; ul Haq, I.; Shah, A. Band Structure Tuning of ZnO/CuO Composites for Enhanced Photocatalytic Activity. J. Saudi Chem. Soc. 2023, 101639. [Google Scholar] [CrossRef]
  53. Das, A.; Patra, M.; Bhagavathiachari, M.; Nair, R.G. Defect-induced visible-light-driven photocatalytic and photoelectrochemical performance of ZnO–CeO2 nanoheterojunctions. J. Alloy. Compd. 2021, 858, 157730. [Google Scholar] [CrossRef]
  54. Liu, X.Y.; Li, J. S-scheme heterojunction ZnO/g-C3N4 shielding polyester fiber composites for the degradation of MB. Semicond. Sci. Technol. 2021, 36, 045025. [Google Scholar] [CrossRef]
  55. Gu, Y.; Su, Y.; Chen, D.; Geng, H.; Li, Z.; Zhang, L.; Zhang, Y. Hydrothermal synthesis of hexagonal CuSe nanoflakes with excellent sunlight-driven photocatalytic activity. CrystEngComm 2014, 16, 9185–9190. [Google Scholar] [CrossRef]
  56. Liu, J.; Luo, Z.; Han, W.; Zhao, Y.; Li, P. Preparation of ZnO/Bi2WO6 heterostructures with improved photocatalytic performance. Mater. Sci. Semicond. Process. 2020, 106, 104761. [Google Scholar] [CrossRef]
  57. Sakib, A.A.M.; Masum, S.M.; Hoinkis, J.; Islam, R.; Molla, M.A.I. Synthesis of CuO/ZnO nanocomposites and their application in photodegradation of toxic textile dye. J. Compos. Sci. 2019, 3, 91. [Google Scholar] [CrossRef] [Green Version]
Figure 1. (a): XRD pattern of pure, Co, Gd, and Co/Gd dual-doped nanoparticles of ZnO; (b) XRD graph of (101) plane showing shifting of the peak towards lower angles.
Water 15 01470 g001
Figure 2. SEM image of (a) ZnO, (b) ZnO with the element Co doping, (c) ZnO with the element Gd doping, and (d) ZnO with Co/Gd doping.
Water 15 01470 g002
Figure 3. EDX spectrum of (a) pure ZnO (b) Co-added ZnO (c) Gd-added ZnO and (d) Co/Gd-added ZnO.
Water 15 01470 g003
Figure 4. UV-Vis spectrum of pure, Co, Gd, and Co/Gd-added ZnO.
Water 15 01470 g004
Figure 5. Tauc plot for (a) pure ZnO, (b) Co-added ZnO, (c) Gd-added ZnO, and (d) Co/Gd-added ZnO.
Water 15 01470 g005
Figure 6. (a) PL spectra of pure, Co-doped, Gd-doped, and Co/Gd di-doped ZnO; (b) energy level diagram of the defects states.
Water 15 01470 g006
Figure 7. (a) Dielectric constant and (b) AC electrical conductivity for pure, Co-doped, and Co/Gd di-doped ZnO as a function of frequency.
Water 15 01470 g007
Figure 8. Magnetization curve of pure, Co-doped, Gd-doped, and Co/Gd dual-doped ZnO nanoparticles.
Water 15 01470 g008
Figure 9. (a) Degradation of MB with Co-Gd-ZnO sample as a photocatalyst; (b) degradation rate for all the synthesized samples.
Water 15 01470 g009
Table 1. Peak position, crystallite size, FWHM, and volume of the unit cell of the samples.
Samples2θ (Degree)FWHM
(β) (rad)
D (nm), by Scherrer EquationD (nm), by W-H MethodMicrostrain× 10−3
(Error × 10−5)
Lattice ParametersUnit Cell Volume (Å3)
a = b (Å)c (Å)
ZnO36.58°0.371023.57 ± 0.735.8 ± 0.85.94 ± 6.43.24275.194847.30
Co-ZnO36.25°0.437119.98 ± 0.831.2 ± 0.96.02 ± 4.23.25305.213047.77
Gd-ZnO36.31°0.512117.06 ± 0.528.5 ± 1.16.21 ± 1.83.25415.215047.82
Co + Gd-ZnO36.28°0.602114.51 ± 0.925.2 ± 0.56.35 ± 1.23.27105.23048.45
Table 2. EDX analysis of pure and added nanoparticles of ZnO.
SampleAtomic Percentage (%)Weight Percentage (%)
ZnOCoGdTotalZnOCoGdTotal
ZnO42.6357.370010075.2224.7800100
Co-ZnO47.9751.900.13010078.9120.900.190100
Gd-ZnO47.552.1800.3210077.8121.8300.36100
Co + Gd-ZnO59.6439.460.390.5010085.1013.780.470.65100
Table 3. Optical bandgap of ZnO, Co-added, Gd-added, and Co/Gd ZnO nanoparticles.
S. No.SampleBandgap (eV)
1Pure ZnO3.34
2Co-doped ZnO3.28
3Gd-doped ZnO3.27
4Co/Gd-doped ZnO3.18
Table 4. Parameters of magnetic properties for all the samples.
SampleCoercive Field
(Oe)
Remanent Magnetization (emu/g)Saturation Magnetization (emu/g)
ZnO0.5030.0010.038
Co-ZnO0.9700.0070.211
Gd-ZnO1.0020.0290.273
Co + Gd-ZnO1.0100.0580.307
Table 5. Comparison table for degradation of dye.
CatalystModel Dye PollutantDegradation TimeDegradation RateSource of LightReference
ZnO-g-C3N4@PETMB120 min92%Visible light irradiation[54]
CuSe nanoflakesMB90 min76%Sunlight[55]
ZnO/Bi2WO6MB120 min90%250 W Hg lamp[56]
ZnO/CuOMB120 min91%Sunlight[57]
Co-Gd-ZnOMB90 min93.1%Xe lampPresent work
Disclaimer/Publisher’s Note: The statements, opinions and data contained in all publications are solely those of the individual author(s) and contributor(s) and not of MDPI and/or the editor(s). MDPI and/or the editor(s) disclaim responsibility for any injury to people or property resulting from any ideas, methods, instructions or products referred to in the content.

