
Are Water Level Fluctuations and Pelagic Water Quality in Lake Kinneret Directly Related? Perspectives of Nutrient Dynamics


MIGAL Galilee Scientific Research Institute, P.O. Box 831, Kiryat Shmone 11016, Israel
Water 2023, 15(8), 1473; https://doi.org/10.3390/w15081473
Submission received: 7 March 2023
/
Revised: 3 April 2023
/
Accepted: 4 April 2023
/
Published: 10 April 2023
(This article belongs to the Special Issue The Impact of Water Level Changes (Frequency and Amplitude) on Water Quality in Lakes)
Abstract
:Long-term records of Water Level Fluctuations (WLF) and nutrient dynamics in Lake Kinneret have indicated an independence between them. The winter’s high WLF with nutrient-rich conditions and the summer’s low WLF with nutrient-poor conditions are recurrent states. Are Water Level Fluctuations and Lake Kinneret’s pelagic water quality related directly or indirectly? Overall, the results found that WLF and nutrient dynamics in the pelagic zone of Lake Kinneret are not co-partners, but independent escorts. The common periodical (monthly) distribution of nutrient concentrations in the epilimnion of Lake Kinneret indicates that a 20 m deep epilimnion formed following a decline in water input, temperature, and evaporation elevation, resulting in the decline of WL. There was a seasonal correlation between summer’s natural conditions and pelagic nutrients’ deficiency. Low WL in summer is the result of natural subtropical climate conditions, whilst dry or high rainfall seasons induce water input modification and consequently, the WL decline of nutrient inputs and independent followers.
1. Introduction
The geographic location of Lake Kinneret is between: Latitude: 32°53′44″ and 32°42′15″; and Longitude: 35°38′55″ and 35°31′52″. Lake Kinneret is a warm Monomictic lake stratified from May through mid-December. The thermal stratification is stable as a result of a high range of temperature between 15 °C in winter and slightly above 30 °C in the upper part of the epilimnion. During summer stratification, the hypolimnion is anoxic and reductive, containing high concentrations of sulfides, orthophosphate, and other forms of dissolved phosphorus, CO2, ammonium, and also, sporadically, methane gas. During summer stratification, the 20 m deep epilimnion is rich in oxygen and poor in nutrients. The climatological conditions in Lake Kinneret’s drainage basin are subtropical with long, dry, and hot summers and short (app. 4 months), wet (rainfall and river discharges), and cold winters. Consequently, water and external nutrients’ inputs from the catchment sharply decline in summer whilst the internal flux of bioavailable nutrients from the sediments in hypolimnetic waters enhanced in summer and partly fluxed into the epilimnion during destratification and turnover periods. Additional wind-transported eolic dust deposition is fluxed into the epilimnion as well. Most of the phosphorus supply in the lake is outsourced (erosion and dust deposition), whilst internal contributions originate from bottom sediments, achieved during the summer. The objective of the present study is to formulate the status of Water Level Fluctuations (WLF) on the quality of Lake Kinneret’s pelagic water and its functional impact priorities. The period of 1969–2001 was selected as a test case. In this period, the impact of climate change was minimal and hydrological management was therefore normal with minimal exceptions. The computerization of the data was set for a later time when significant management changes were implemented but not yet completed. WLF magnitude is a critical issue of lake management design. Since the early 1970s, Lake Kinneret has been the only natural freshwater lake in the Israeli supply’s multipurposed ecological services, where drinking water supply is the principal service. Consequently, the management of WL altitudes’ limitations are critical as a result of pumping capacity during the drought season. The uppermost potential during heavy rainfall and discharge yield is critical. Moreover, WL management of the exceptions of lower and uppermost WL implementations dictate not only capacity of supply, but also suspected water quality. The present paper tries to answer that question with past information aimed at beneficial future propositions. General information and morphometric values of Lake Kinneret under the highest permitted WL include the following:
- Water surface—169.5 km2;
- Maximum depth—48 m;
- Lake Volume—4471 × 106 m3
Upper and lowermost WL regulation: 213.0 and 208.8 mbsl (meter below sea level), respectively.
1.1. Data Sources
- (1)
- Kinneret Limnological Laboratory, IOLR; Nutrient concentration data (1969–2001) includes all collected samples from all sampling stations (A, C, D, F, G, H, K), all discrete depths (Meters: 1, 3, 5, 10, 15, 20, 30, 40), all dates: Total Nitrogen—35,352 samples; Total Phosphorus—41,916 samples; Nitrate—35,489 samples; Ammonium—42,182 samples; Sulfate. 27,093 samples;
- (2)
- Mekorot—National Water Supply Company;
- (3)
- Israel Hydrological Service;
- (4)
- National Water Authority;
- (5)
- TAHAL—Water Planning for Israel.
The routine sampling program in Lake Kinneret has been carried out by the Kinneret Limnological Laboratory, IOLR, since 1969. Sampling was routinely conducted in seven stations in the pelagic zone at 10 discrete depths on a weekly-biweekly basis, and also occasionally in the littoral zone. Additional information was supplied by the national water authorities and Mekorot, the national water supply company.
Kinneret Limnological Laboratory, IOLR; Nutrient concentration data (1969–2001) includes all collected samples from all sampling stations (A, C, D, F, G, H, K), all discrete depths (Meters: 1, 3, 5, 10, 15, 20, 30, 40), all dates: Total Nitrogen—35,352 samples; Total Phosphorus—41,916 samples; Nitrate—35,489 samples; Ammonium—42,182 samples; Sulfate. 27,093 samples.
1.2. Methods
The hydrological year starts in October and ends in the next calendar year on the 31st of September. Therefore, the maximum WL altitude is measured in May and the minimum Wl is measured in November. The annual mean WL level is the average of the hydrological year.
Computation of salt load is based on multiplication of the periodical chloride concentration by the periodical lake volume (monthly, annually, or multi-annually).
1.3. Statistical Methods
STATA 17 statistical tests of Lowess smoother, linear regression, and fractional polynomial regressions were used.
1.4. Results
The regressive relation analysis (linear regression) between WL in Lake Kinneret and nutrients’ standing stock concentrations was carried out with the results provided in Table 1.
The Jordan River is the major supplier of water and external water-mediated nutrients to Lake Kinneret. Therefore, the correlation between the Jordan River’s discharge and the WLF in Lake Kinneret is required for further consideration about impacts on water quality. As part of this study, linear regression (r2 = 0.5971; p < 0.0001) between the Jordan River’s discharge and Lake Kinneret’s WL was indicated.
Results given in Table 1 indicate significant correlations (linear regression) between multi-annual averages of nutrient concentrations and WL in Lake Kinneret. The temporal periodical (Figure 1—1970–2018; Figure 2—1940–2018) fluctuations of discharge in the Jordan River are given in Figure 1 and Figure 2. Lowess smoother (bandwidth 0.8) evaluation of the annual (1969–2001) means of nutrient concentrations vs. annual mean of WL indicates the following trends: nitrogen (TN, NO3, NH4) decline, phosphorus forms (TP, P-Ortho.) increase, chloride concentration decline, and salt load increase. An obvious relation between the Jordan River’s discharge and Lake Kinneret’s WL was confirmed (r2 = 0.5971; p < 0.0001). Chloride concentration decline is contrary to the enhancement of the total load of salt (ton) in Lake Kinneret. The temporal fluctuations of nutrients during 1969–2001 are presented in Figure 3, Figure 4, Figure 5, Figure 6, Figure 7, Figure 8, Figure 9, Figure 10, Figure 11, Figure 12 and Figure 13.
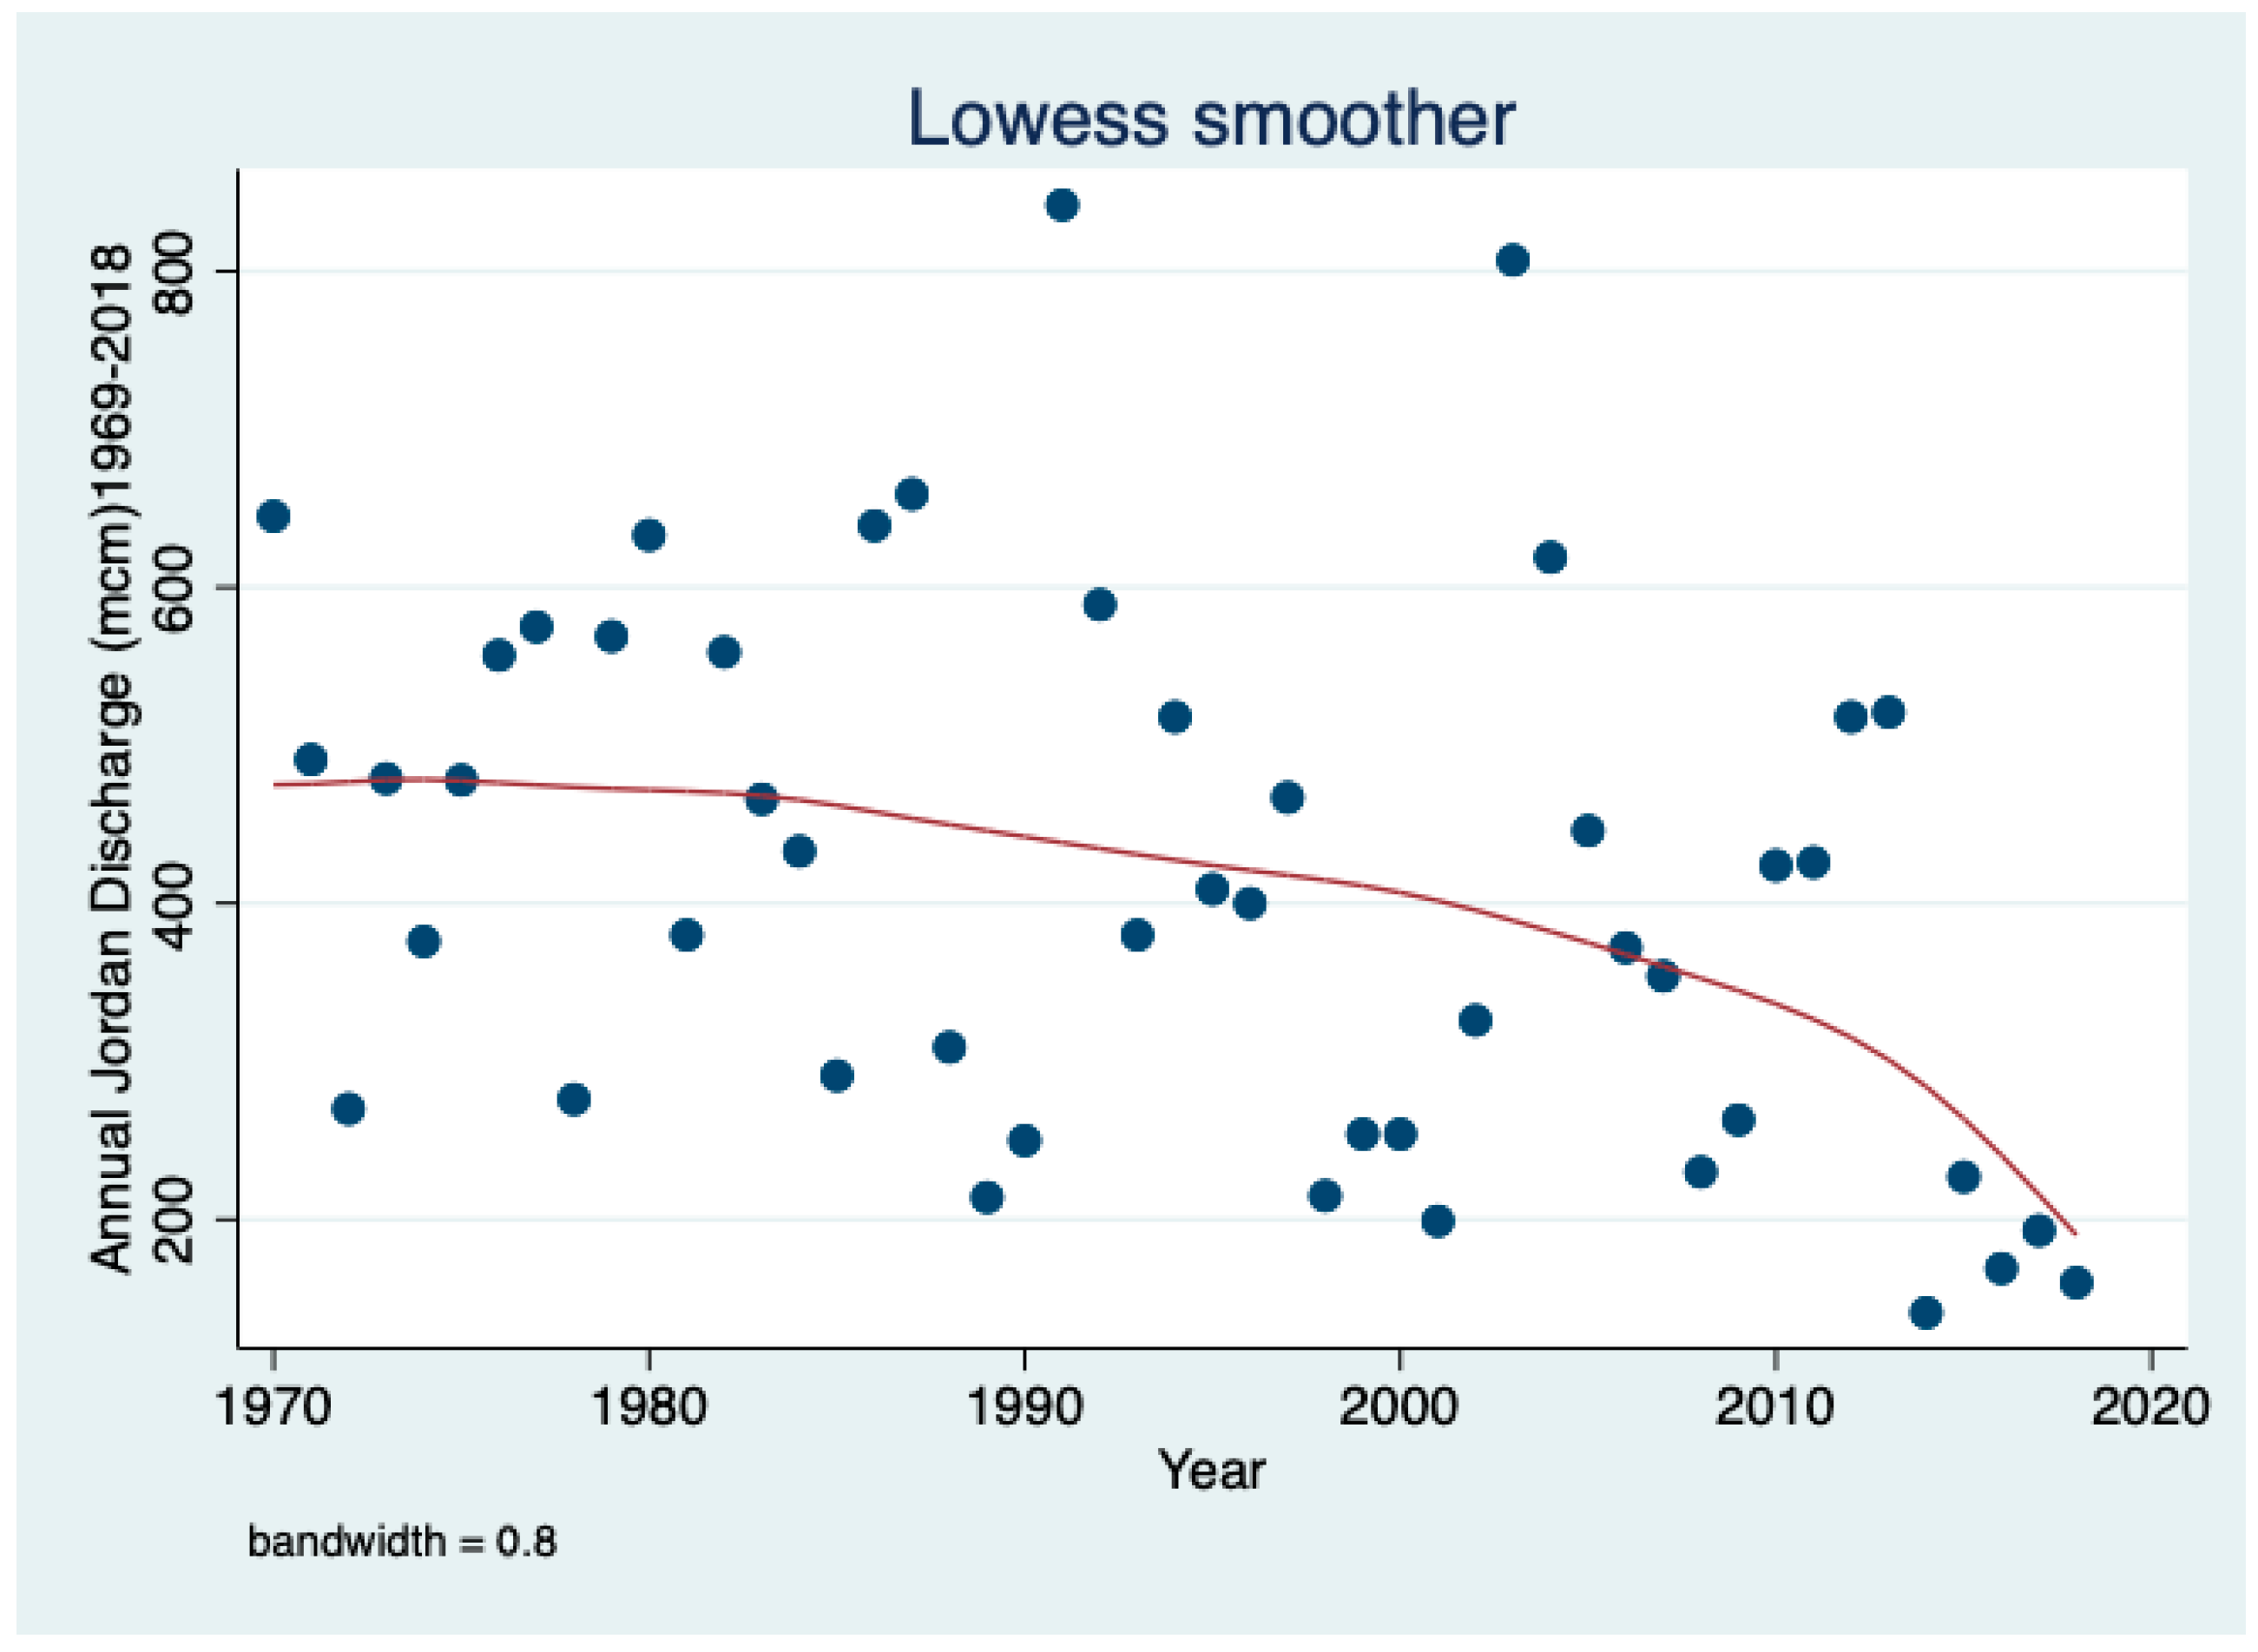
Figure 1: Trend of changes (Lowess smoother, 0.8 bandwidth) of Jordan River discharge (106 m3/year; mcm/y) during 1970–2001.
Results presented in Figure 1 indicate a continuous decline since the mid-1980s due to climate change of rainfall and discharge of the Jordan River.
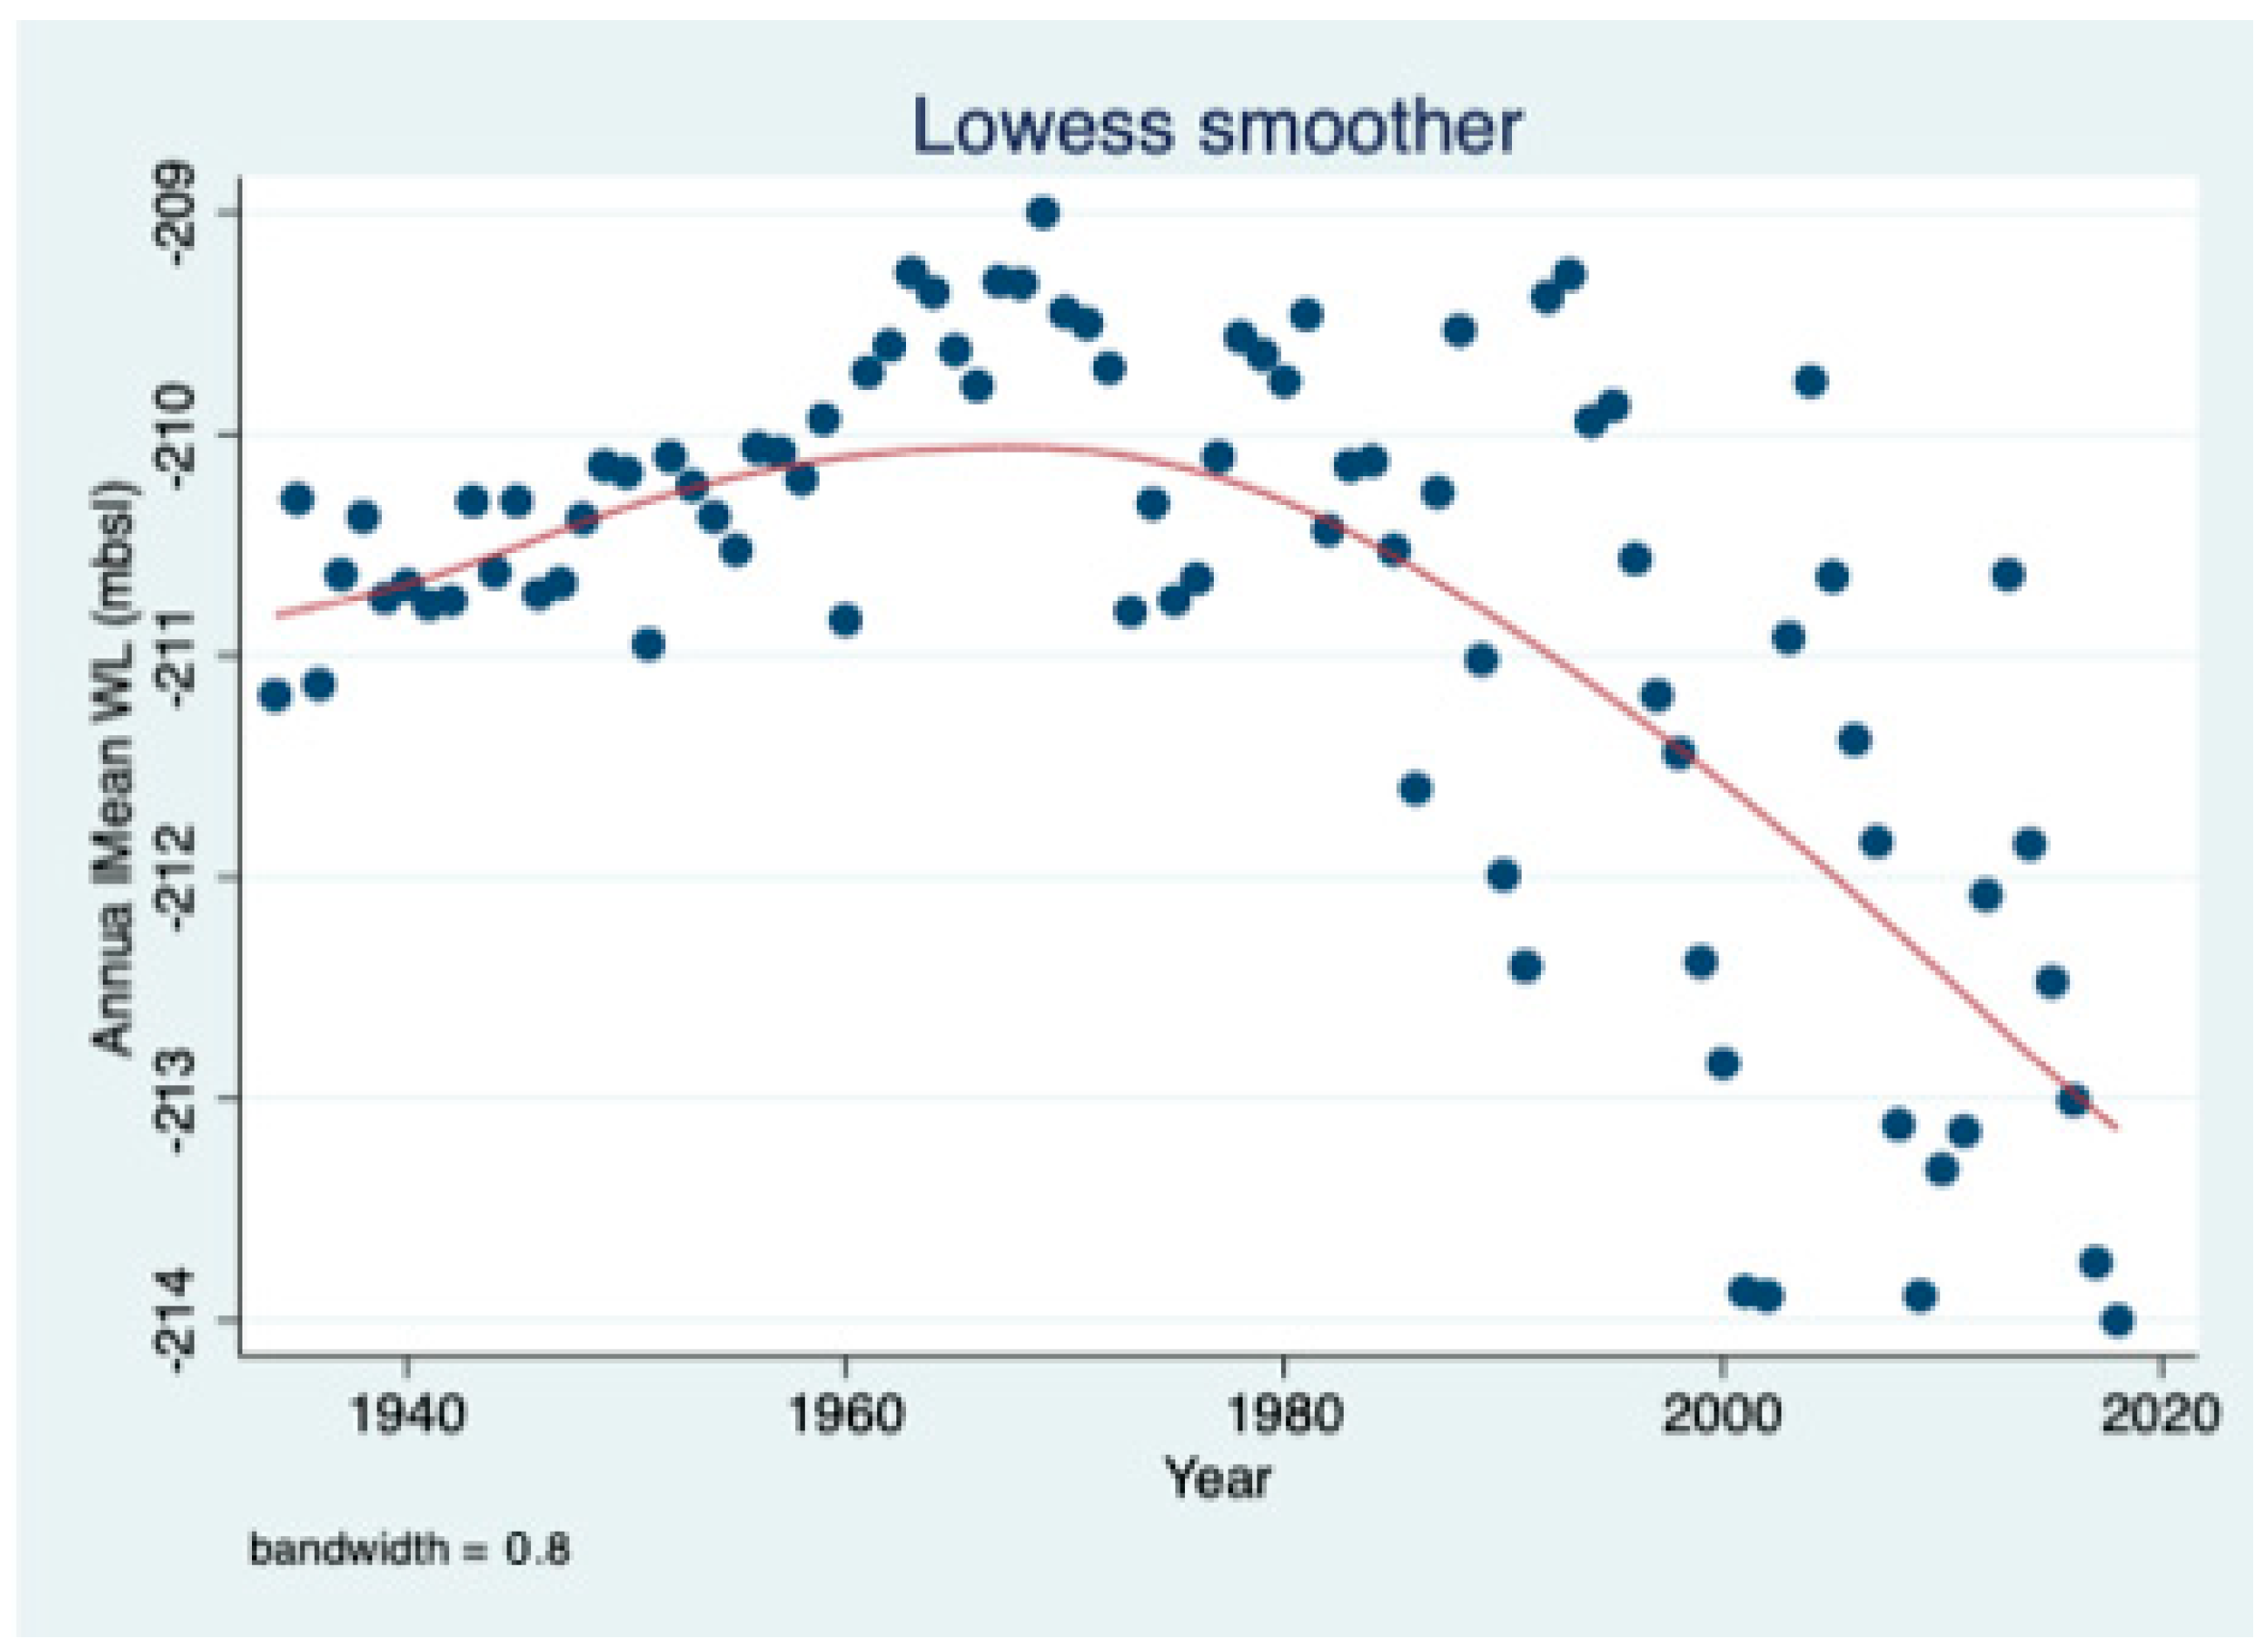
Results given in Figure 2 indicate a WL increase during the period of 1934–1970 with a continuous decline later on.
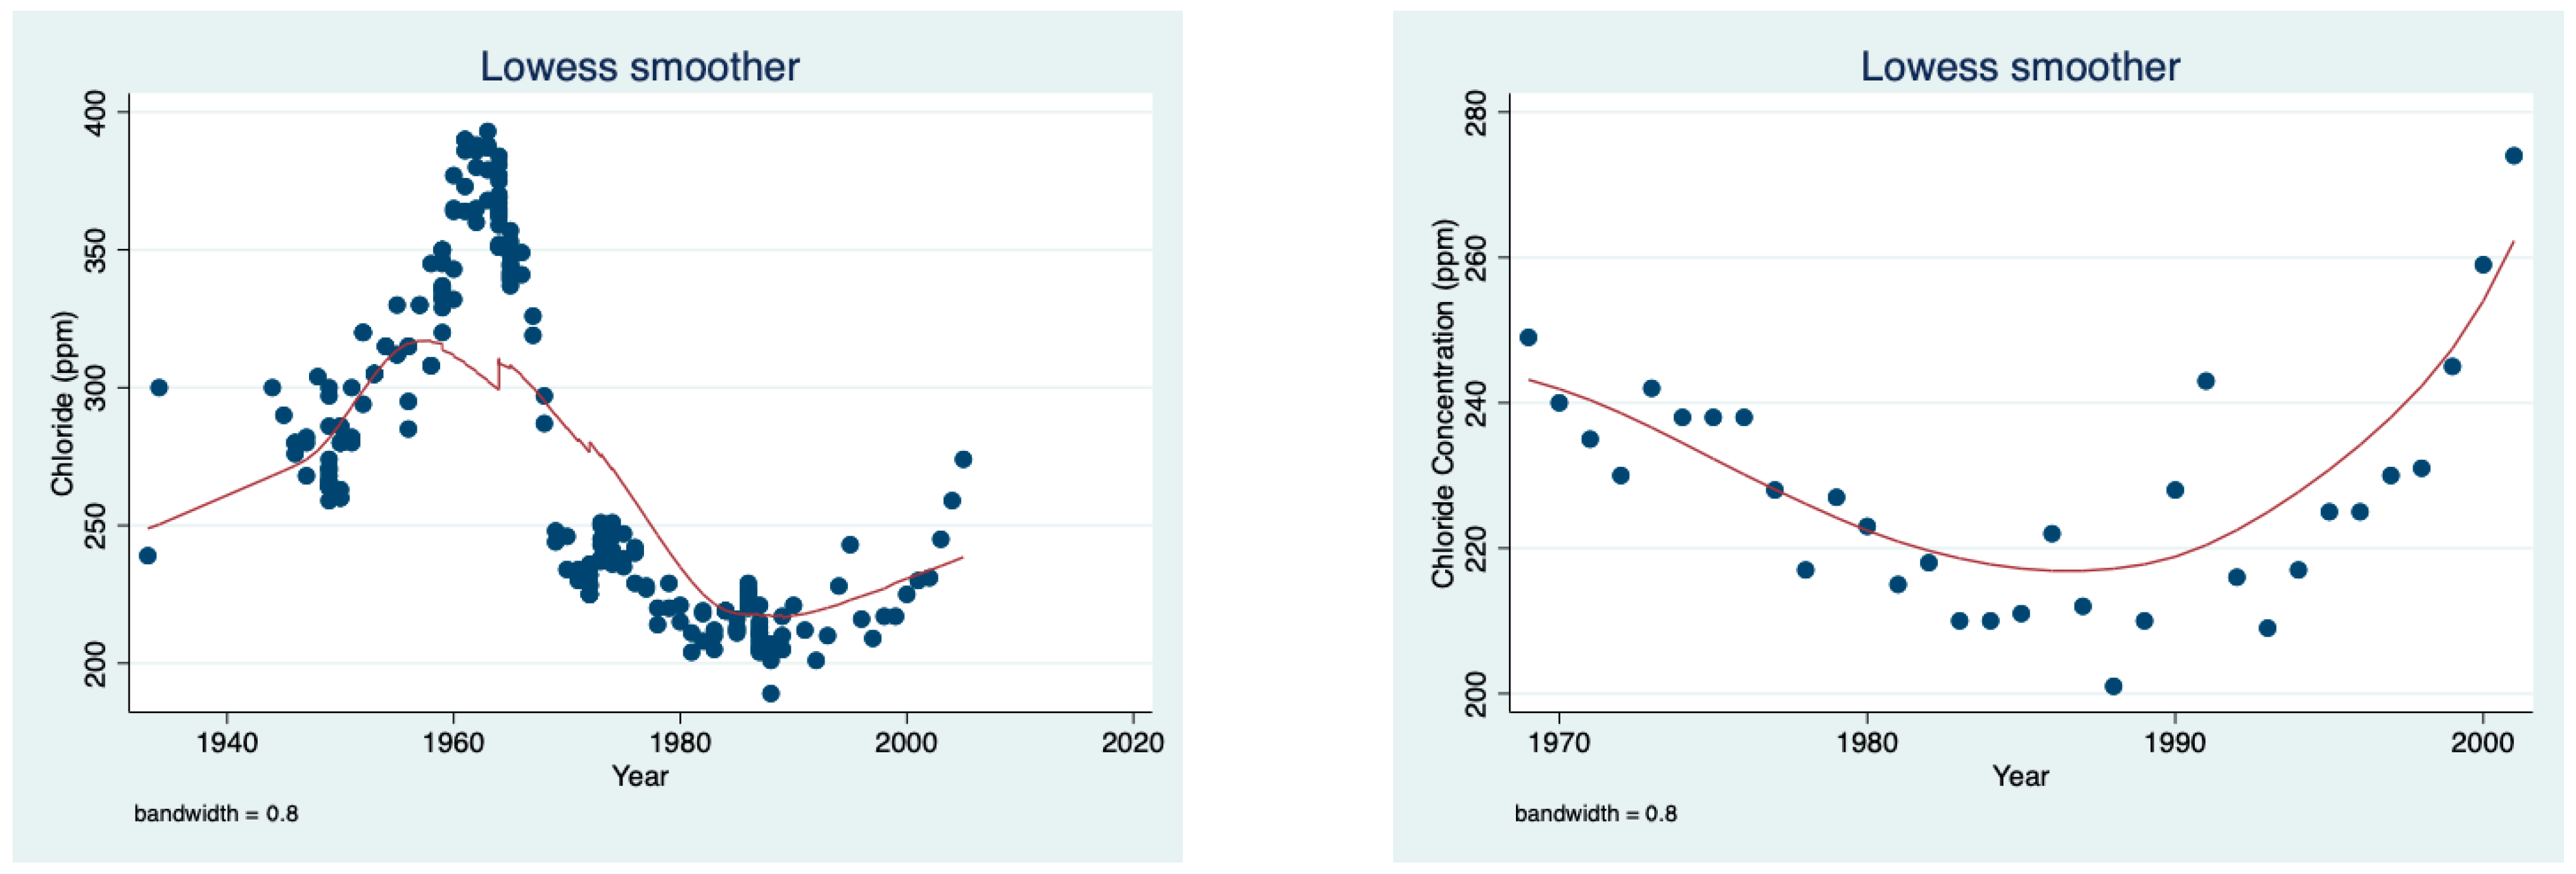
Three periodical changes are indicated: (1) an increase of salinity between 1934 and the mid-1960s; (2) a salinity decline between the mid-1960s and early 1990s, and (3) an increase of salinity from the mid-1990s onwards.
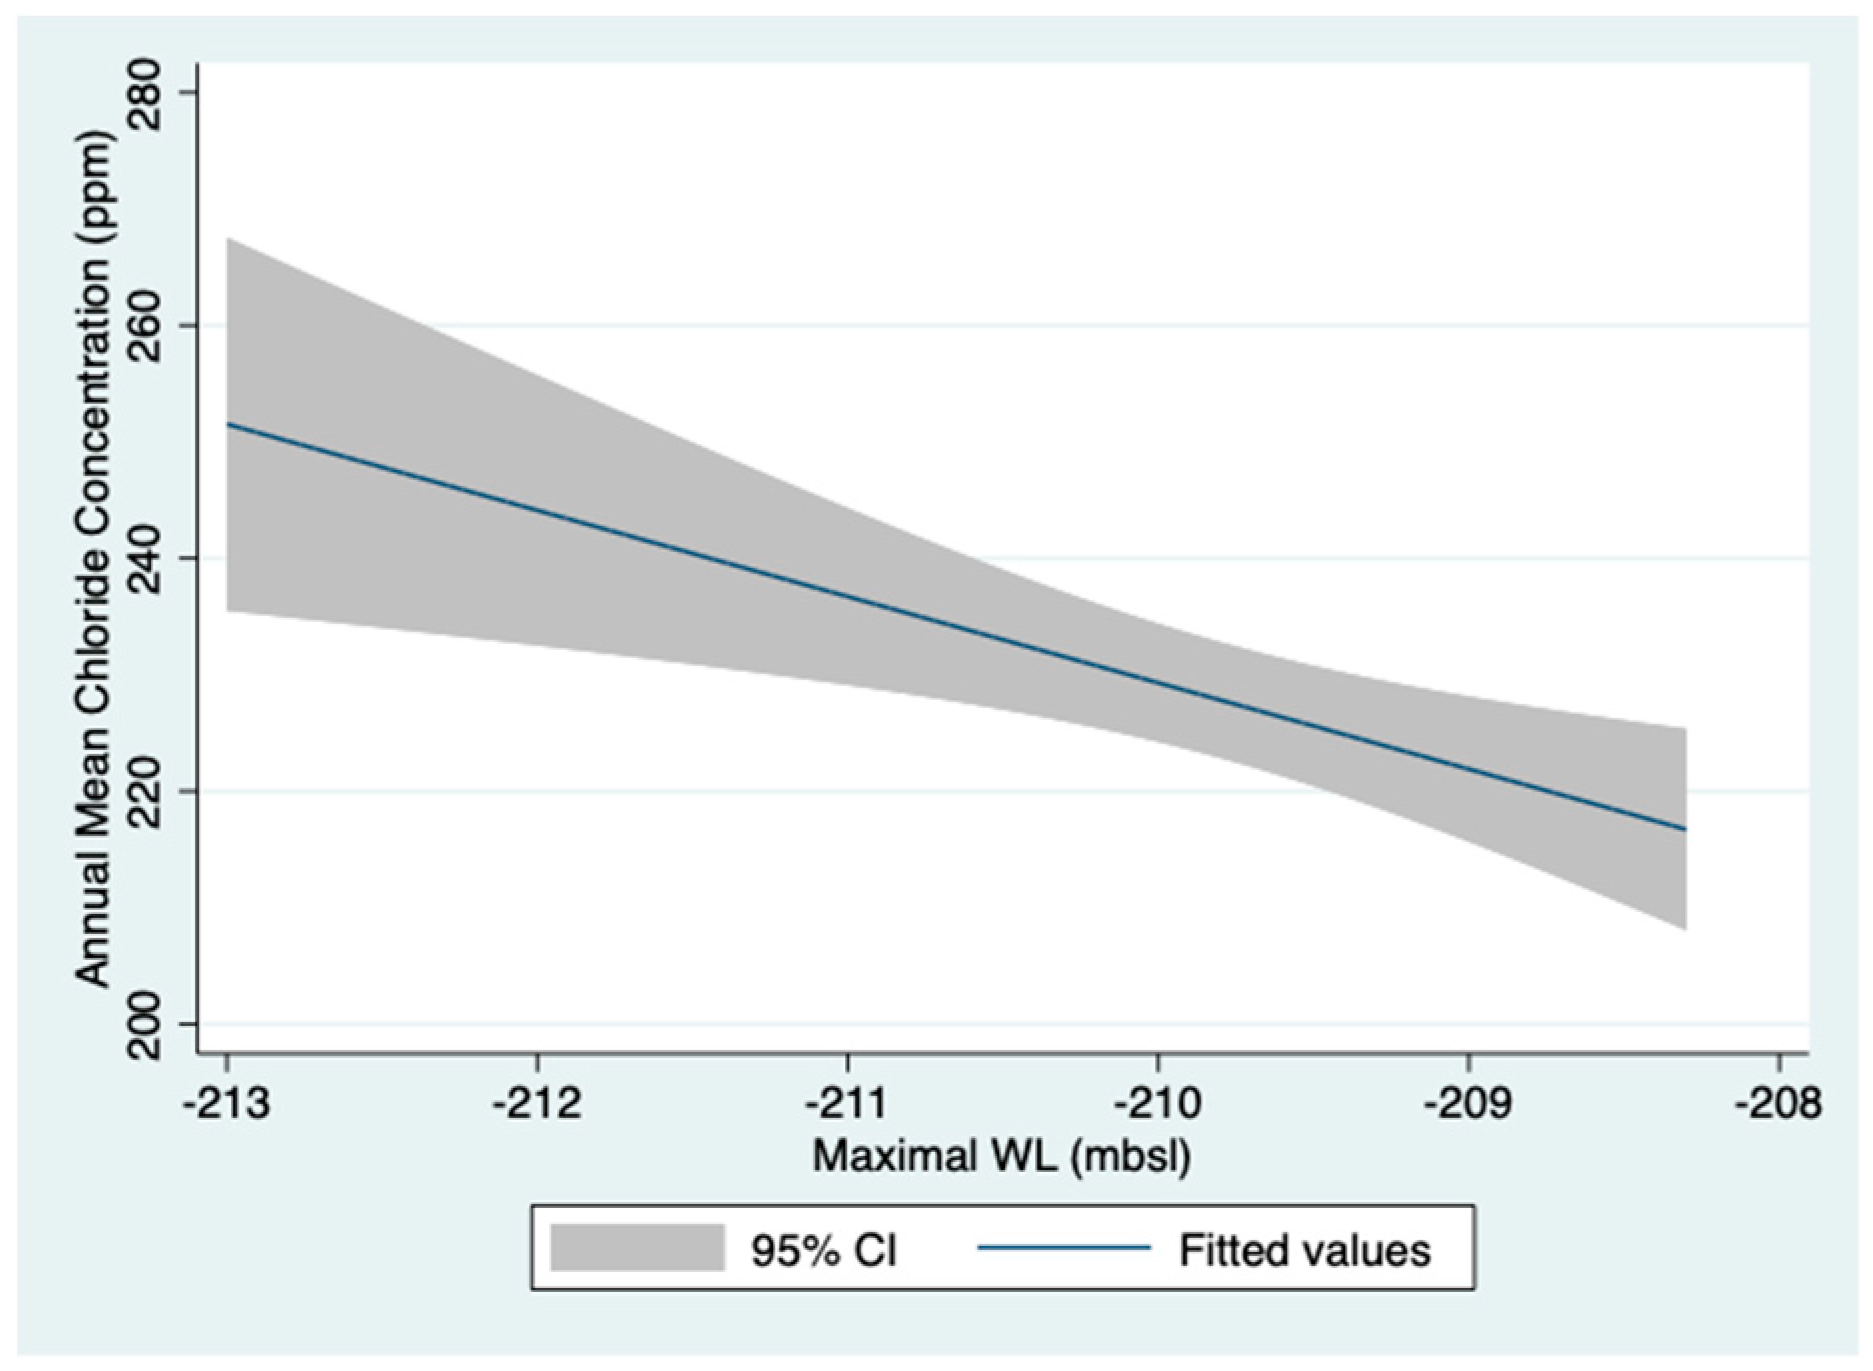
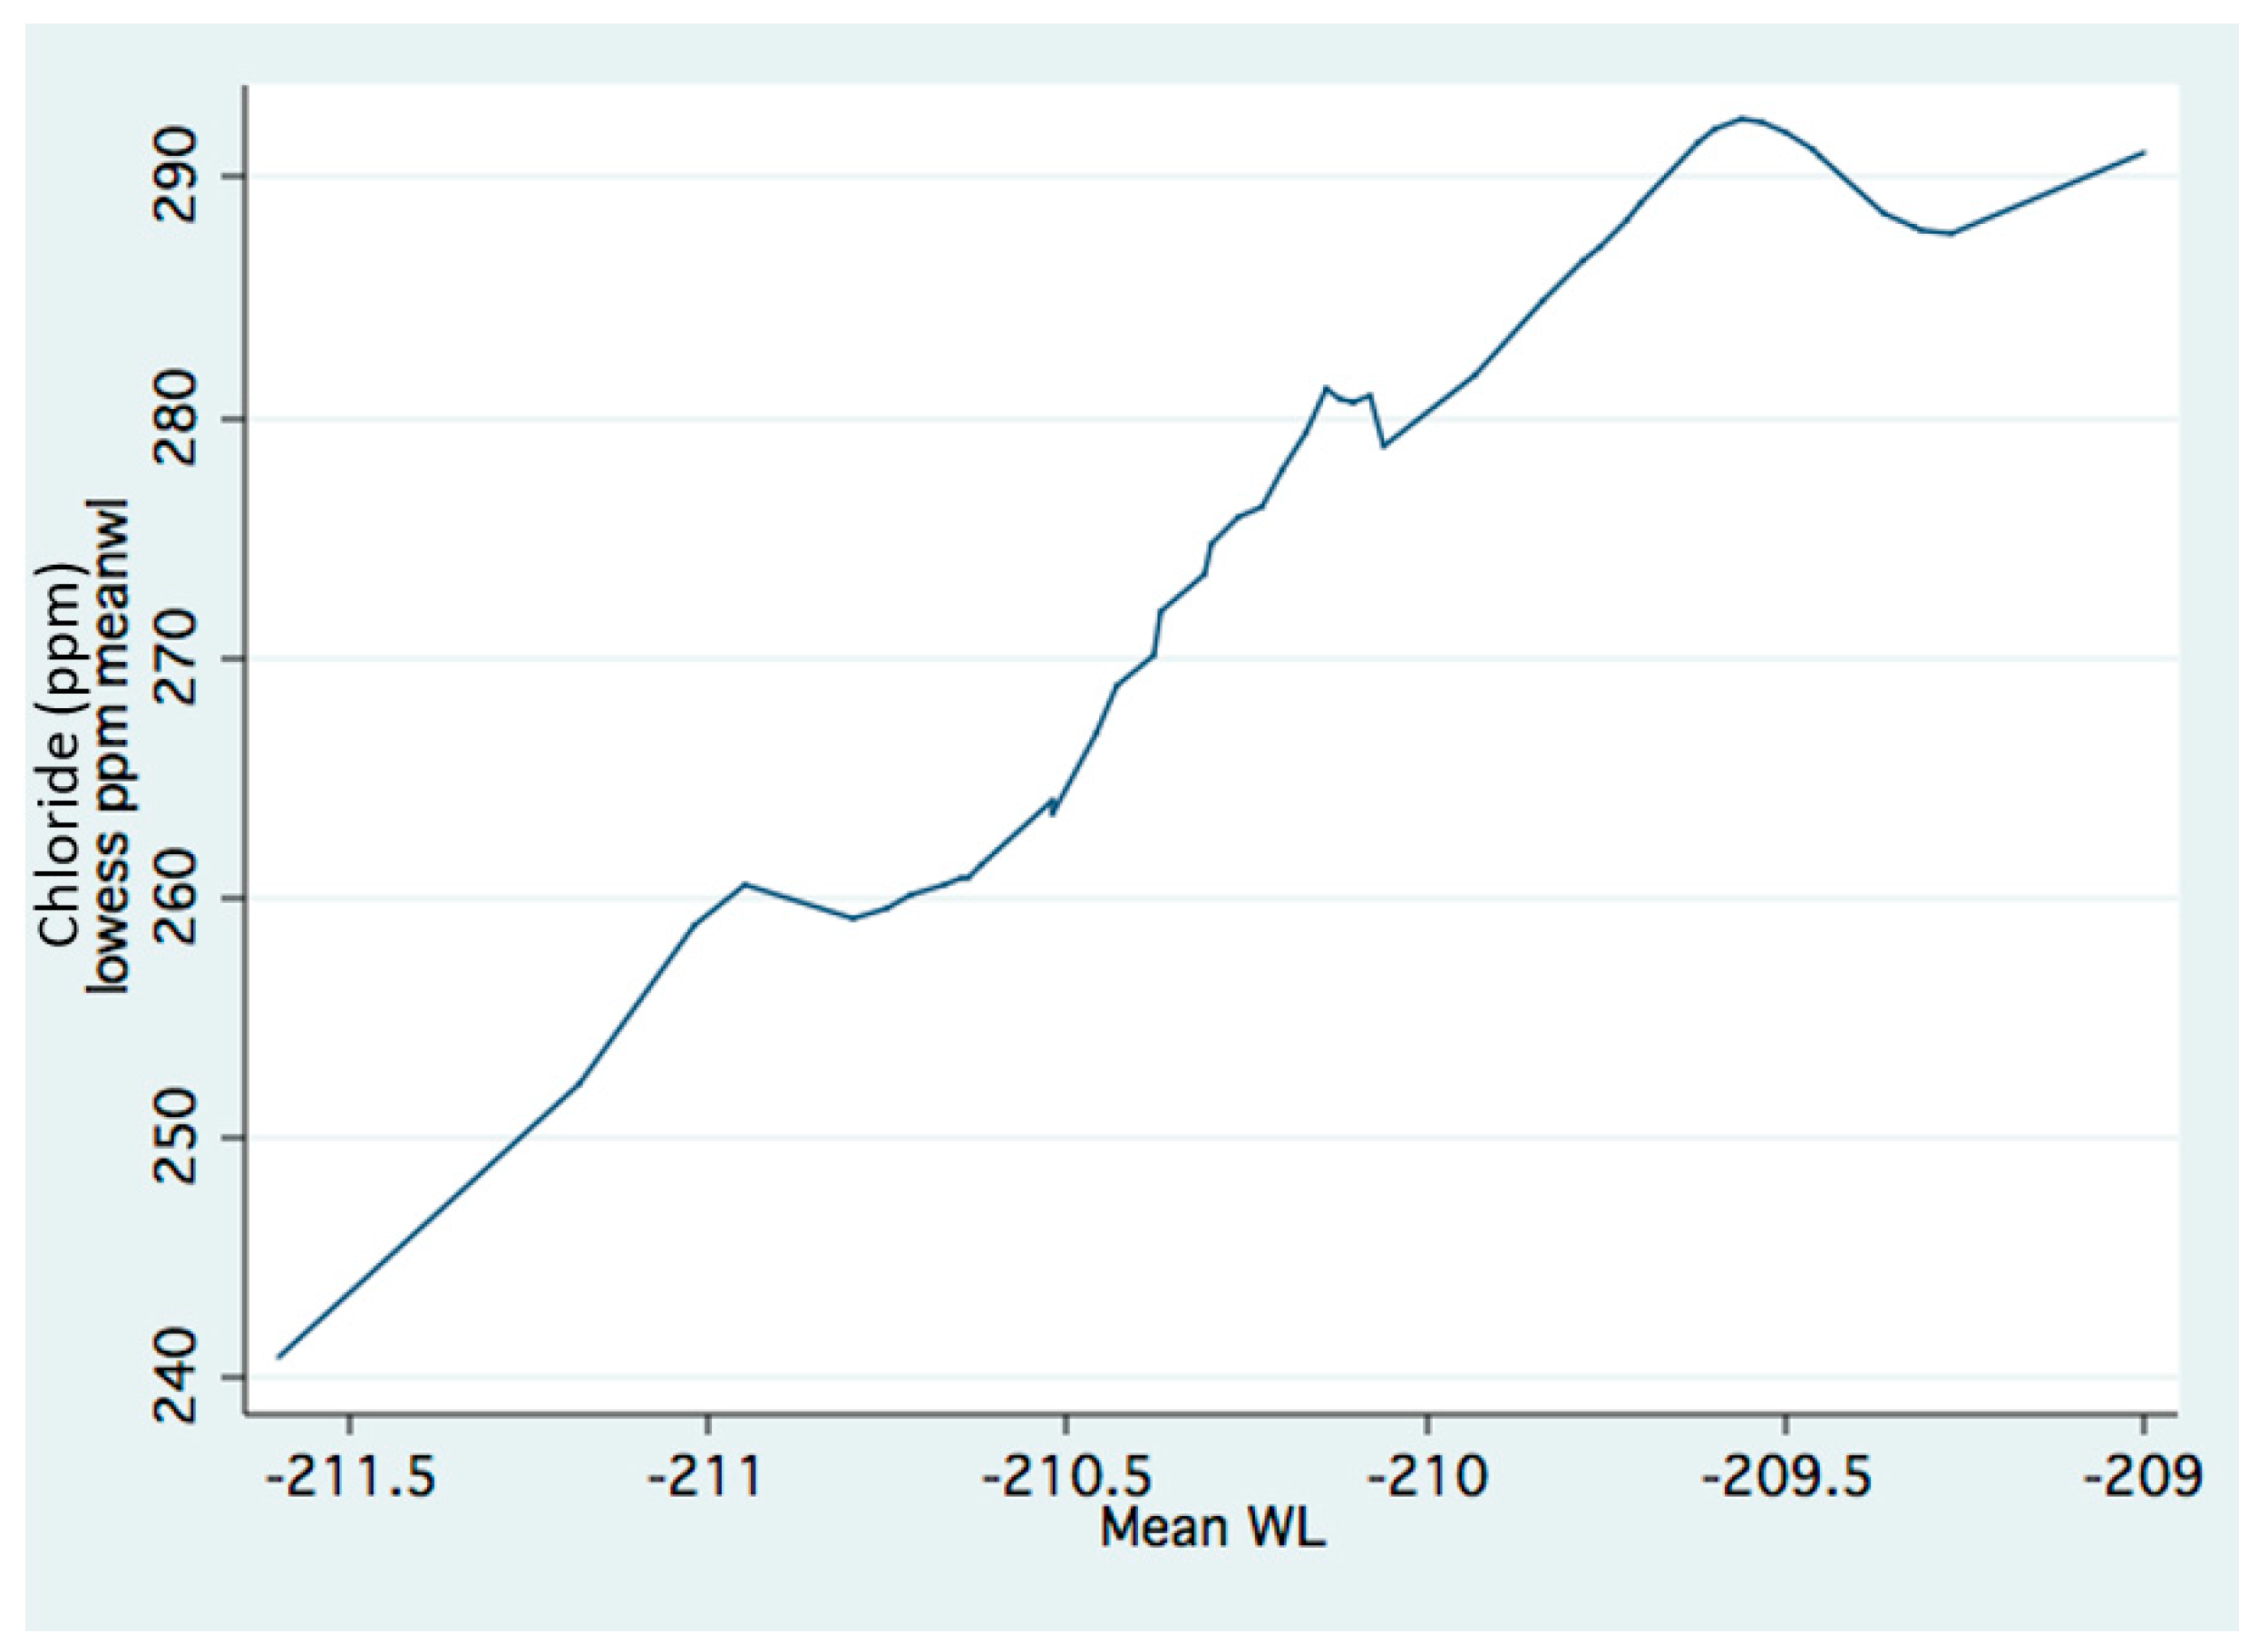
Results given in Figure 4 indicate a positive linear regression of salinity elevation and WL decline.
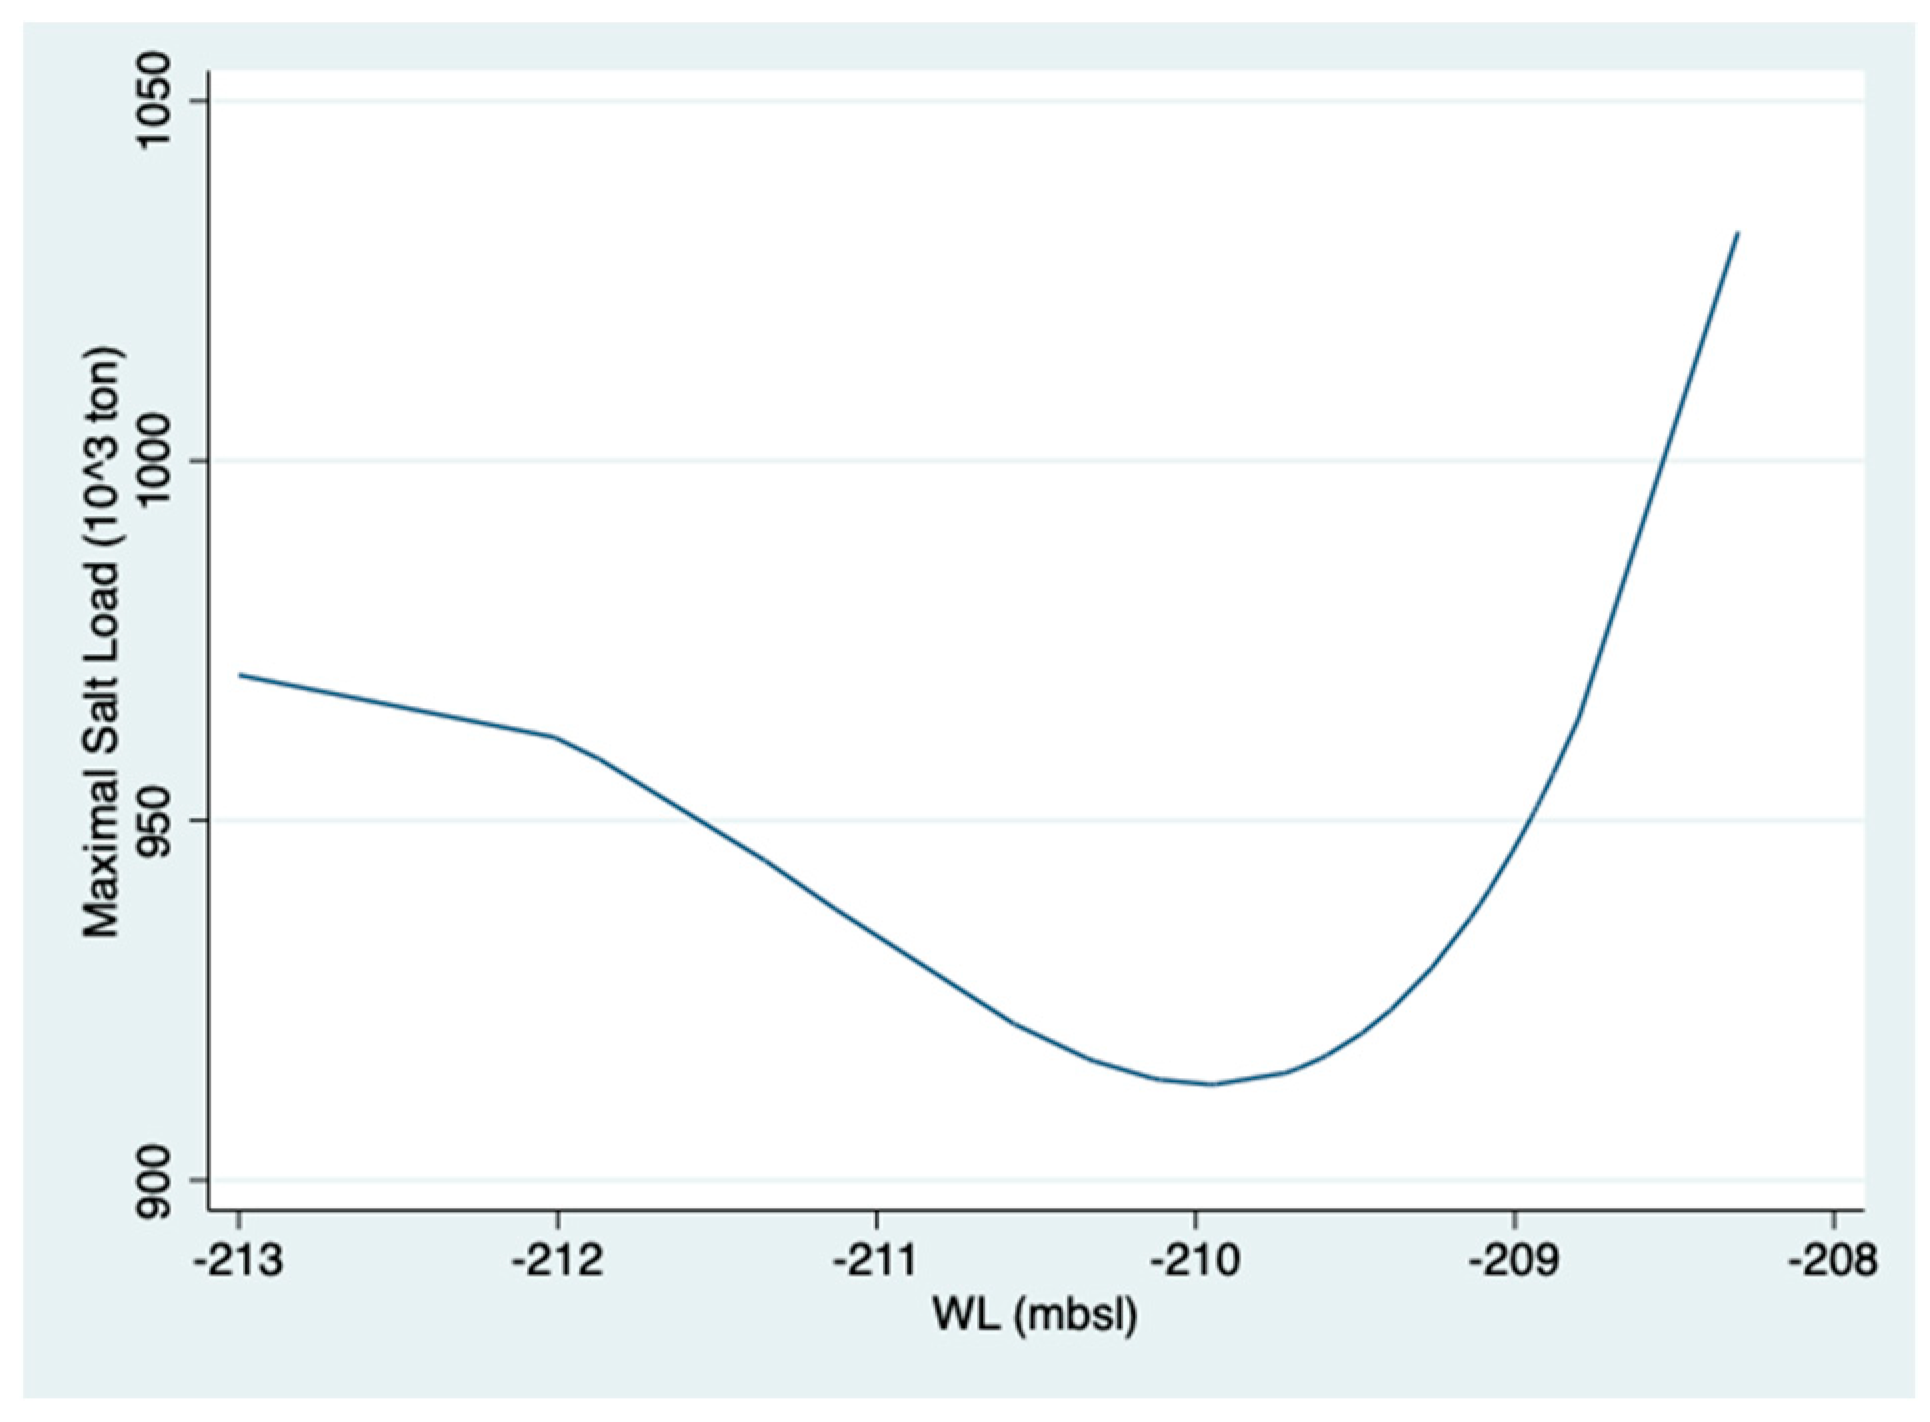
Results given in Figure 5 indicate a decline of salt load when WL increased from 213 to 210 mbsl and prominently increased when WL was elevated between 210 and 208.80 mbsl.
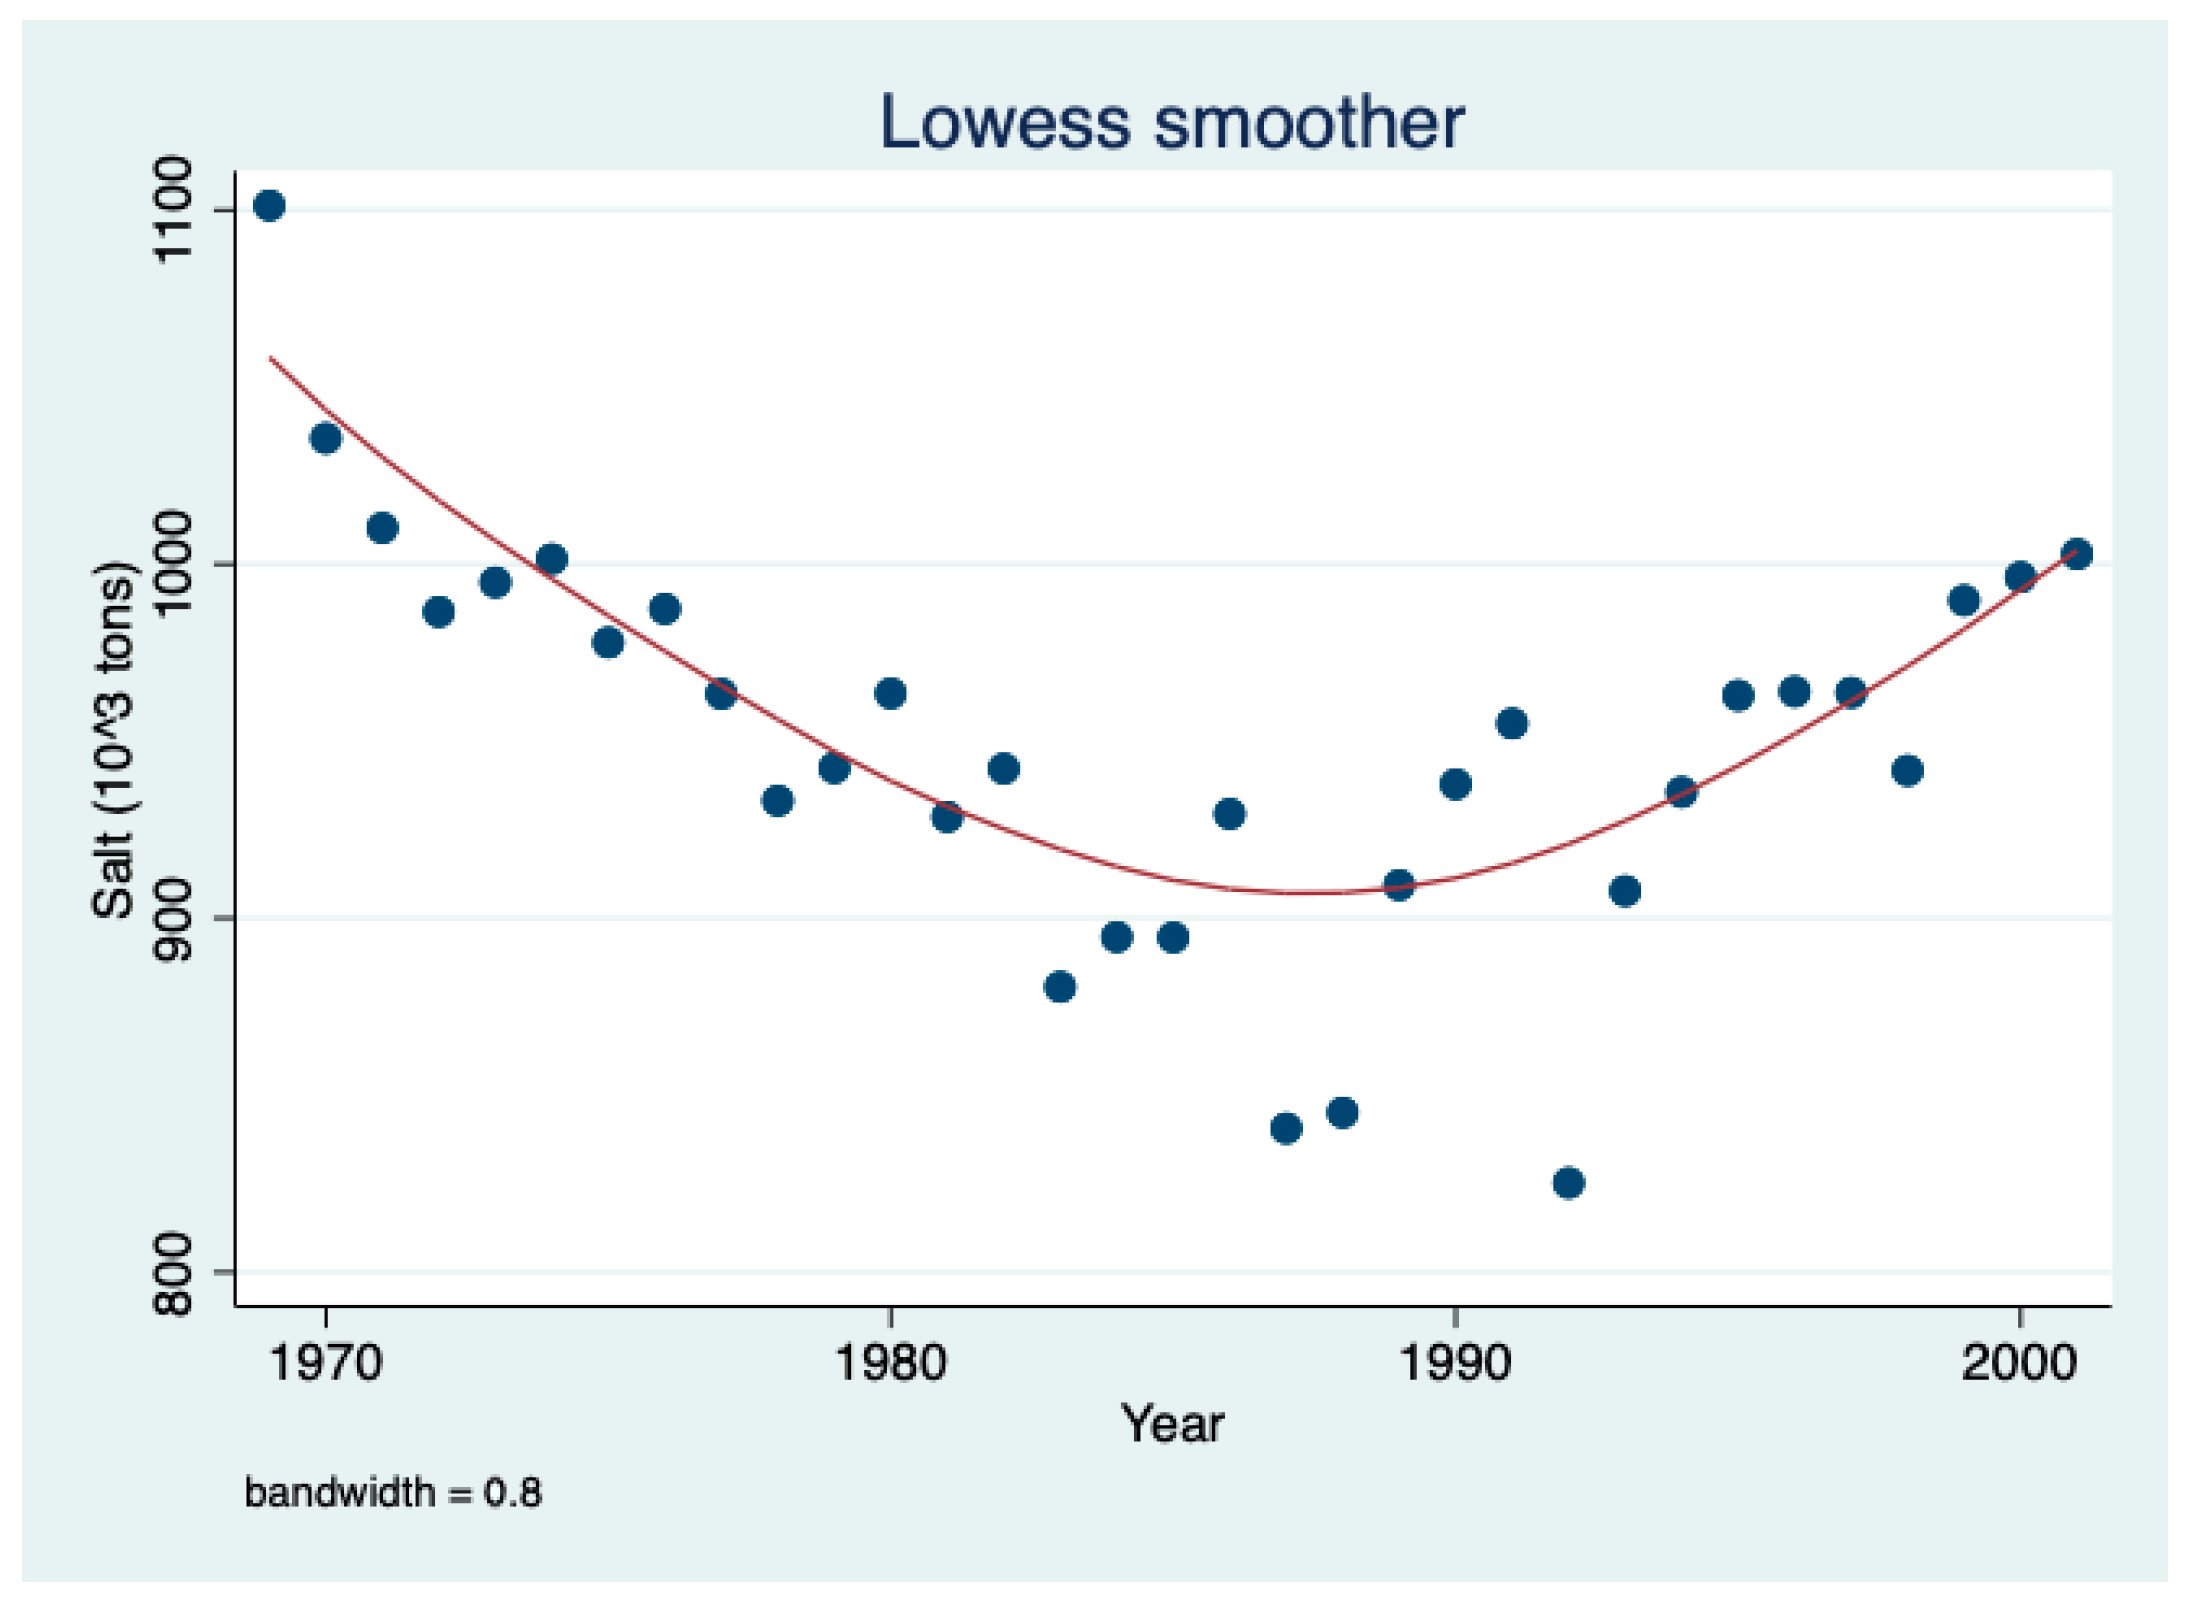
Results given in Figure 6 indicate a decline in salt load from the early 1970s to the late 1980s with an increase later.
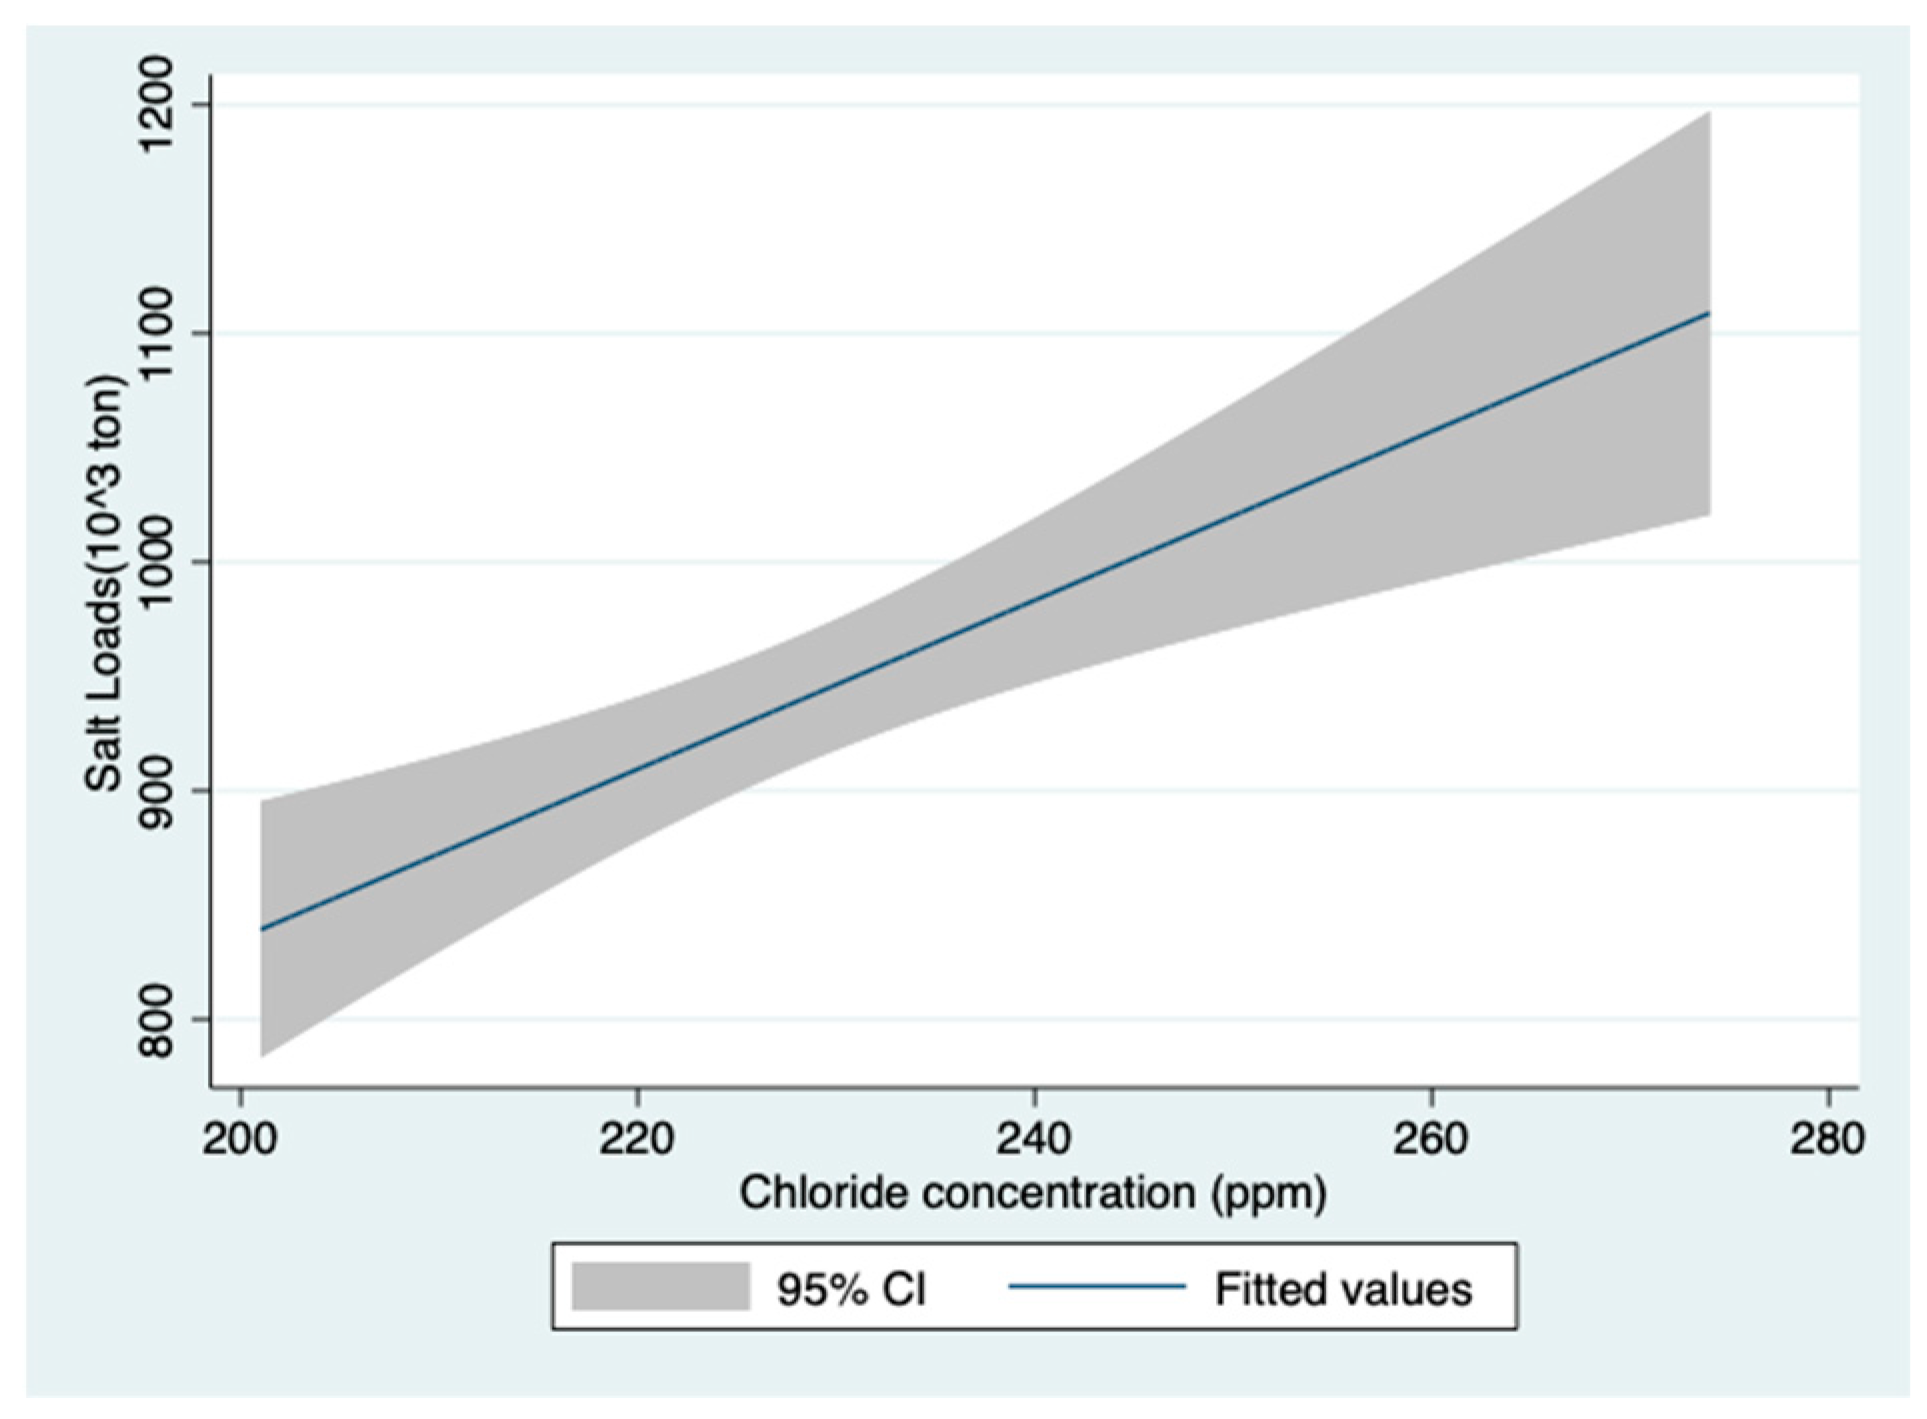
Results of the linear prediction of salt load as related to chloride concentration given in Figure 7 confirm the enhancement of the loads respective to concentration increase. It has to be considered that the load value is in respect to WL altitude i.e., lake volume. Consequently, load values are respective to both lake volume and chloride concentration.
The decline of TP concentration with respect to WL-increased altitudes above 212 mbsl is clearly indicated in Figure 8.
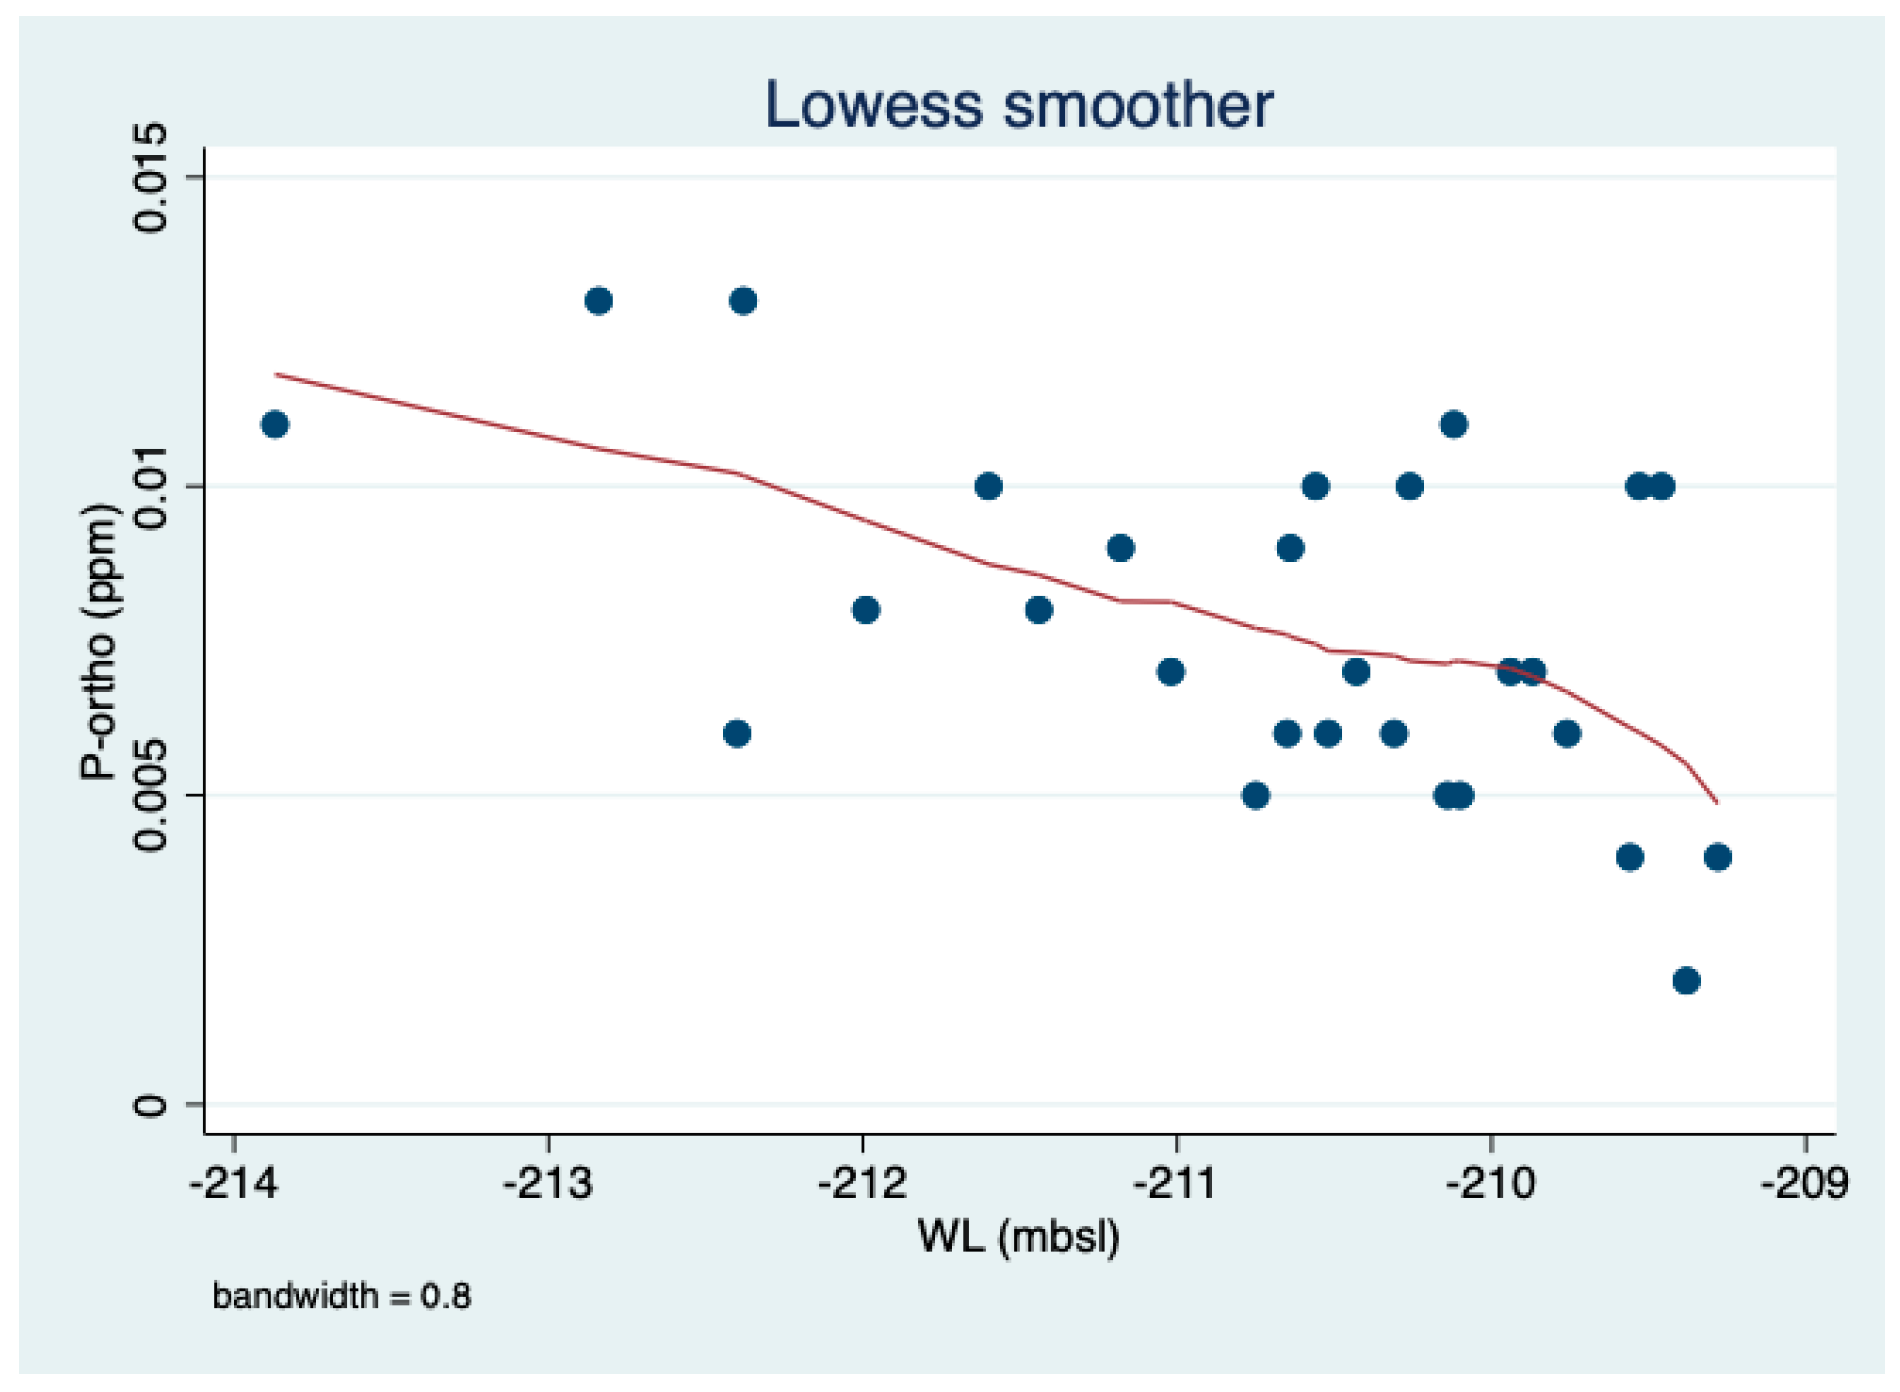
The decline of orthophosphate concentration with respect to increased WL altitudes from 214 to 209 mbsl is clearly indicated in Figure 9.
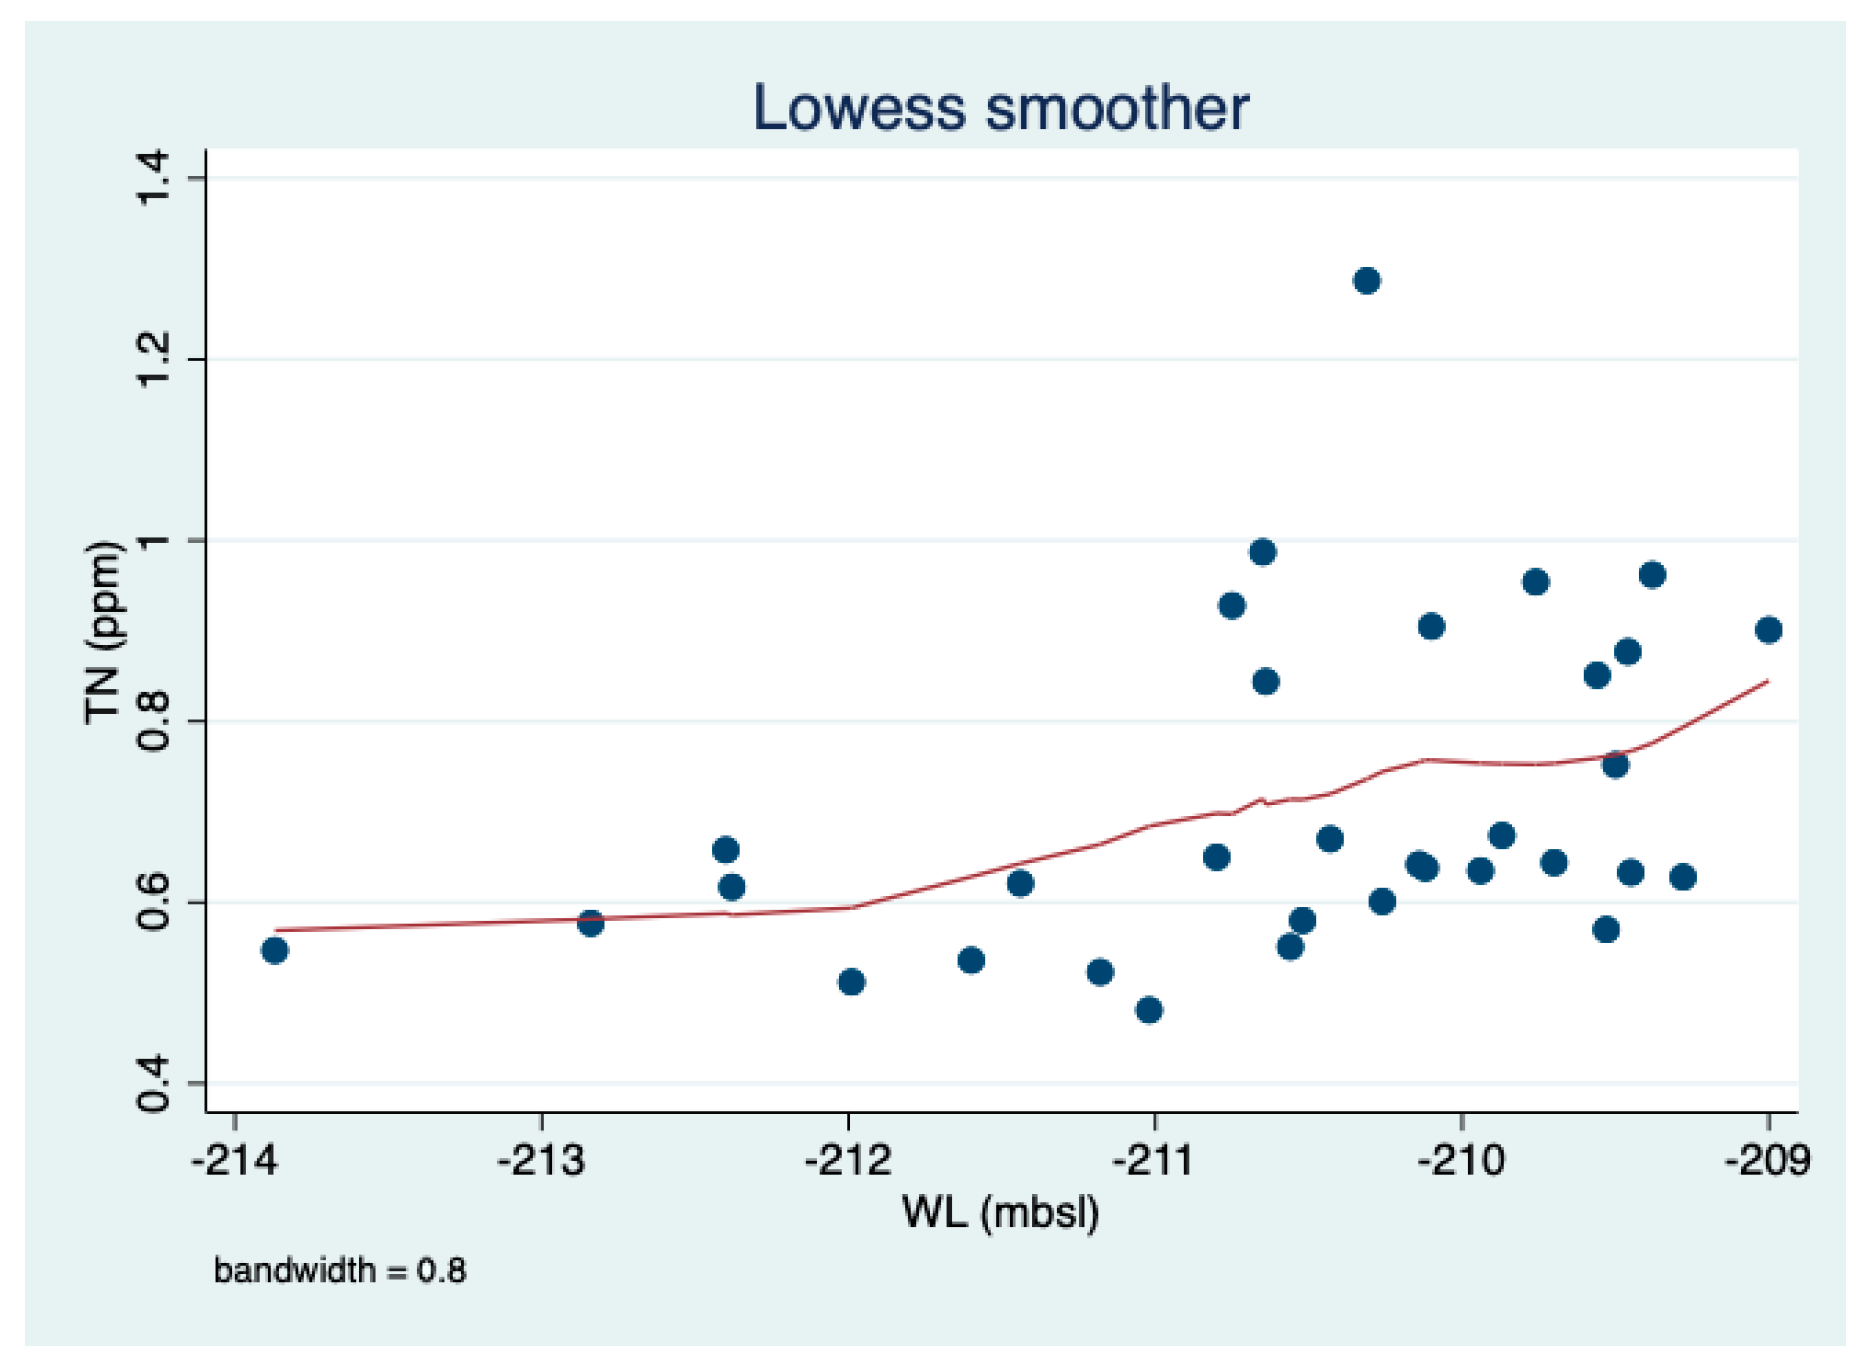
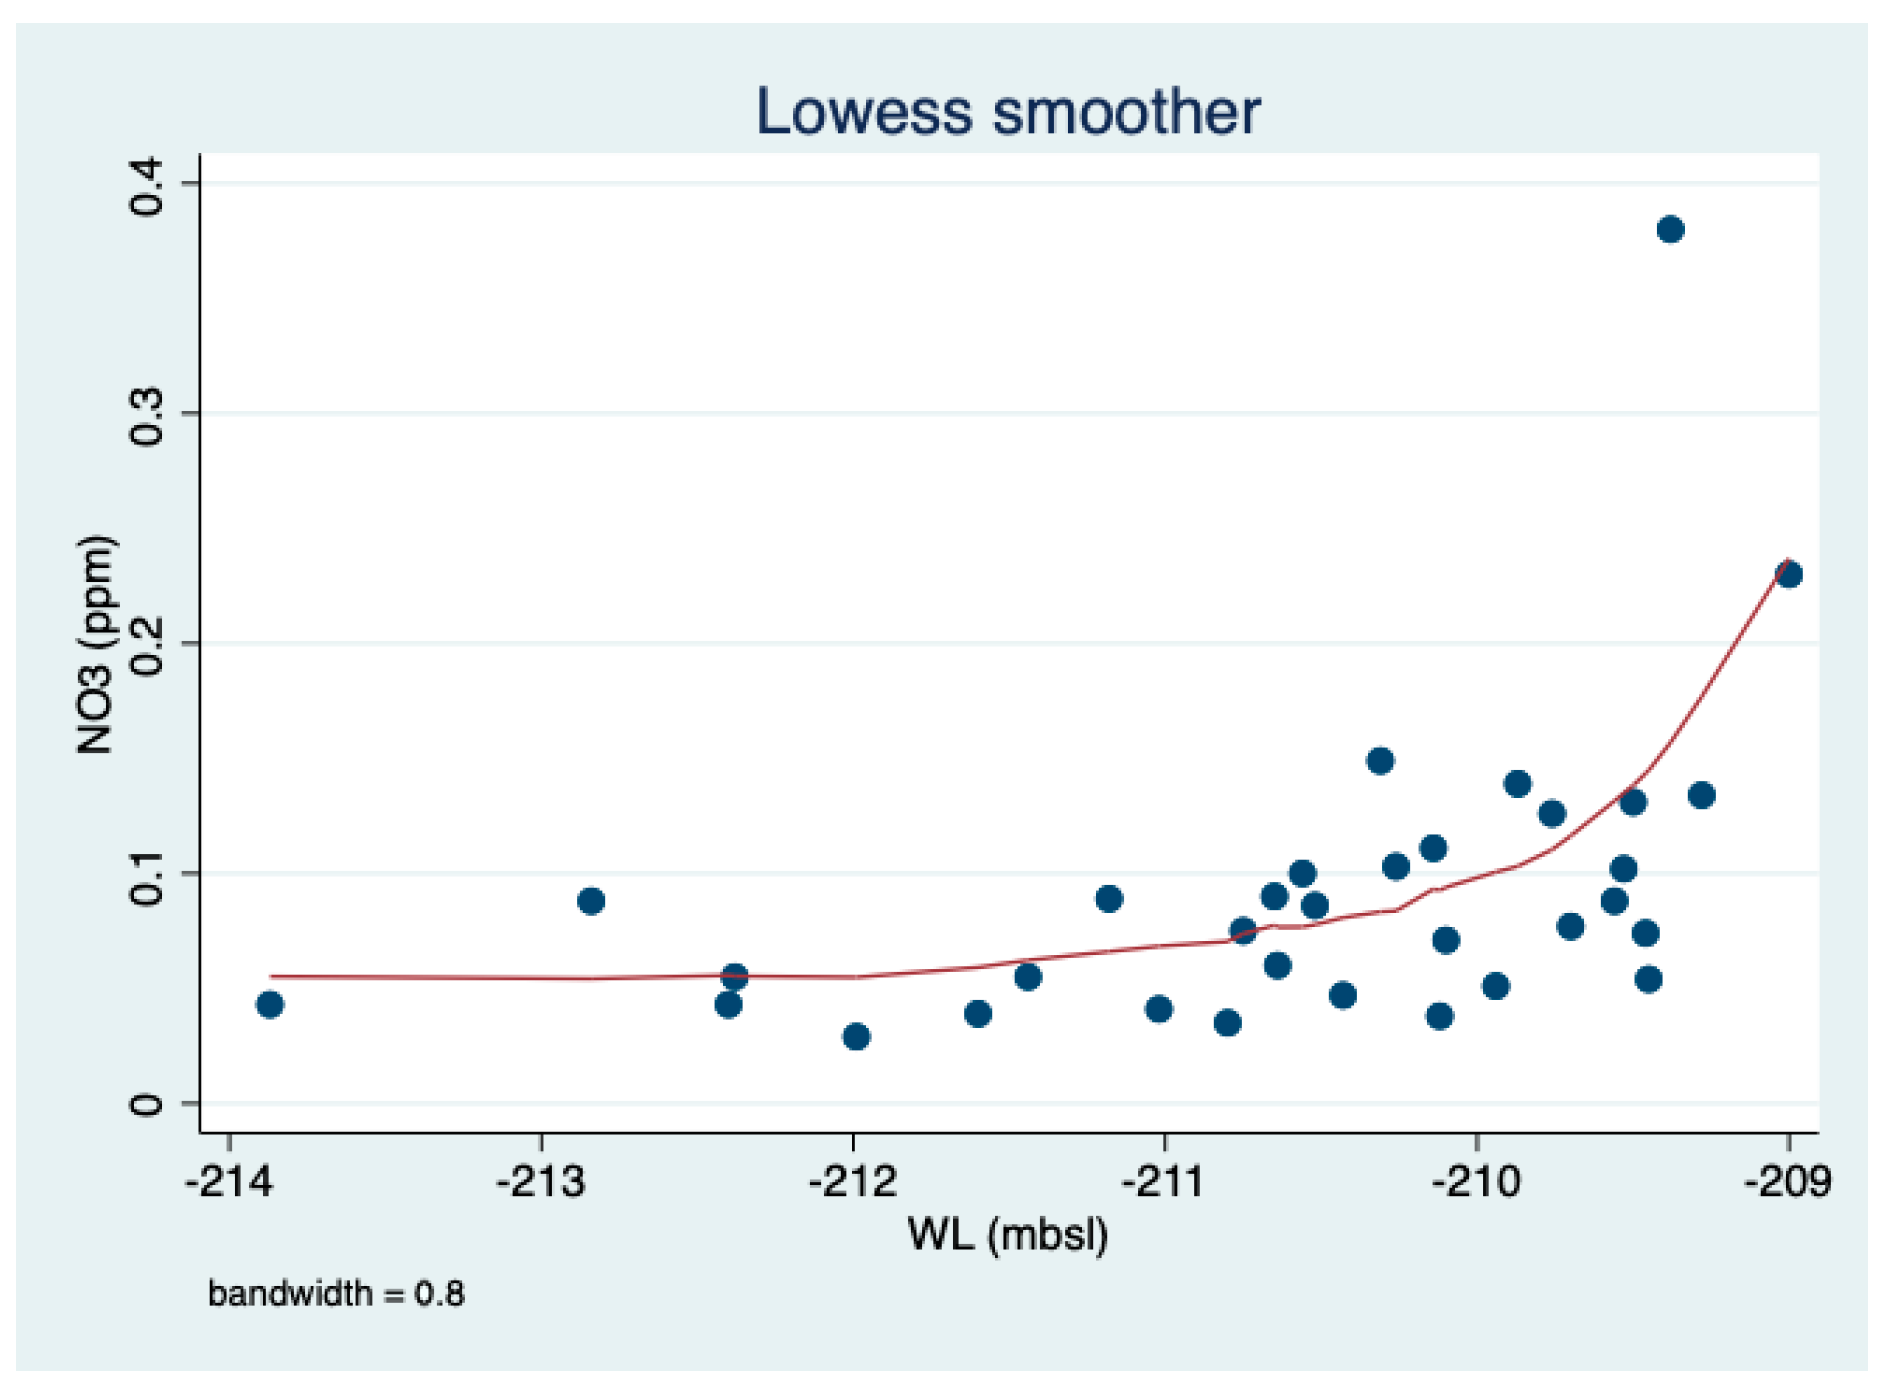
The increase of TN and NO3 concentration respective to WL elevation is documented in Figure 10 and Figure 11. The prominent increase occurs at the WL range between 211–209 mbsl, though the relation between the upper range of WL (211–209 mbsl) is a result of the enhancement of the Jordan River’s discharge.
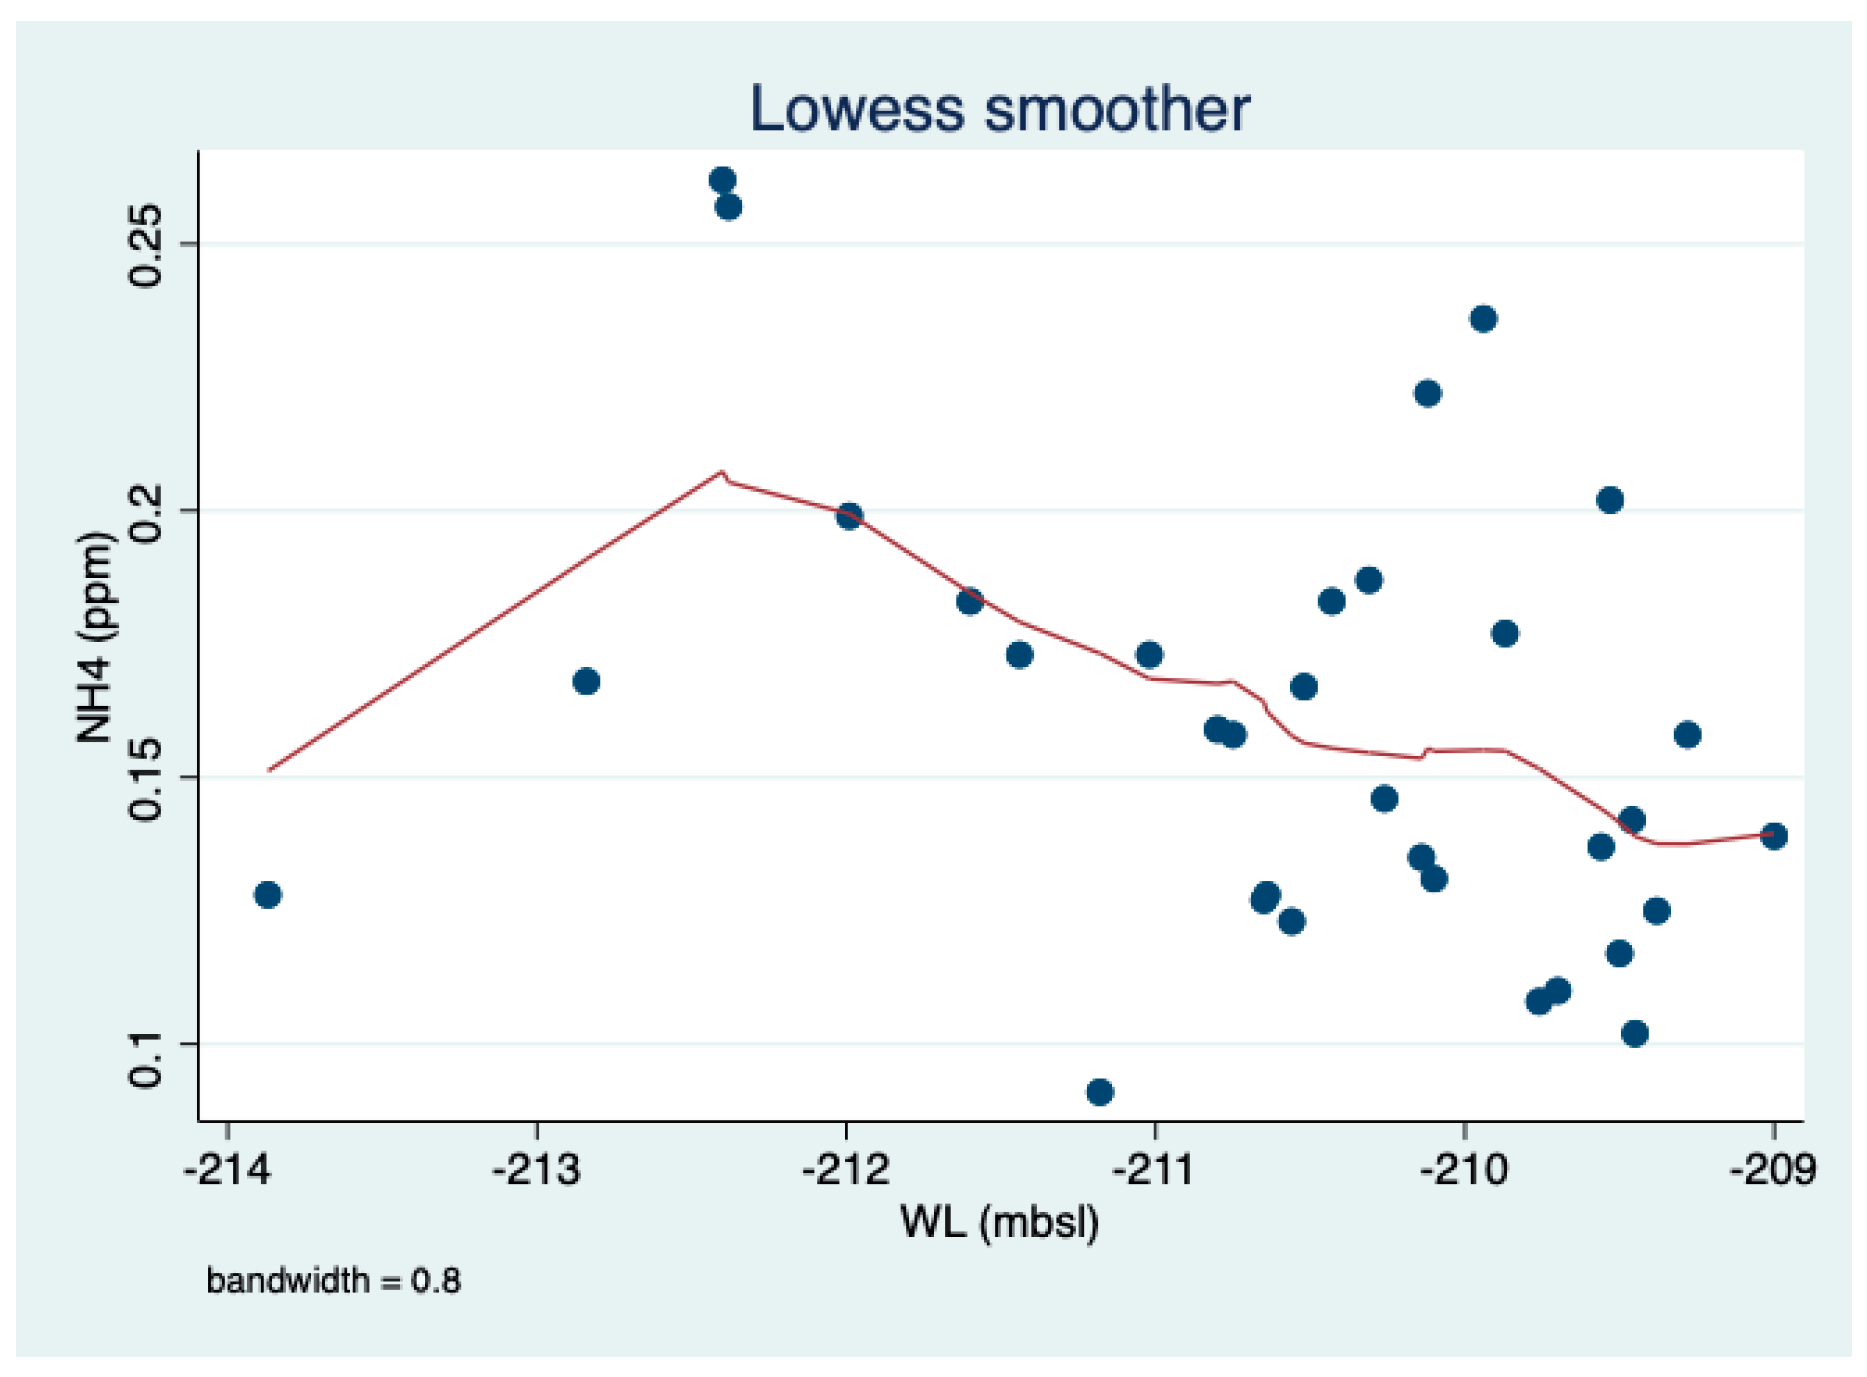
Contrary to other nitrogen forms (TN, NO3), results given in Figure 12 indicated a declining trend of ammonium concentration in relation to WL elevation. The major source of ammonium is in the hypolimnion during the stratification period, therefore, when the Jordan River’s discharge is enhanced and WL is rising in the winter, ammonium load stays stable, resulting in its decline in concentration.
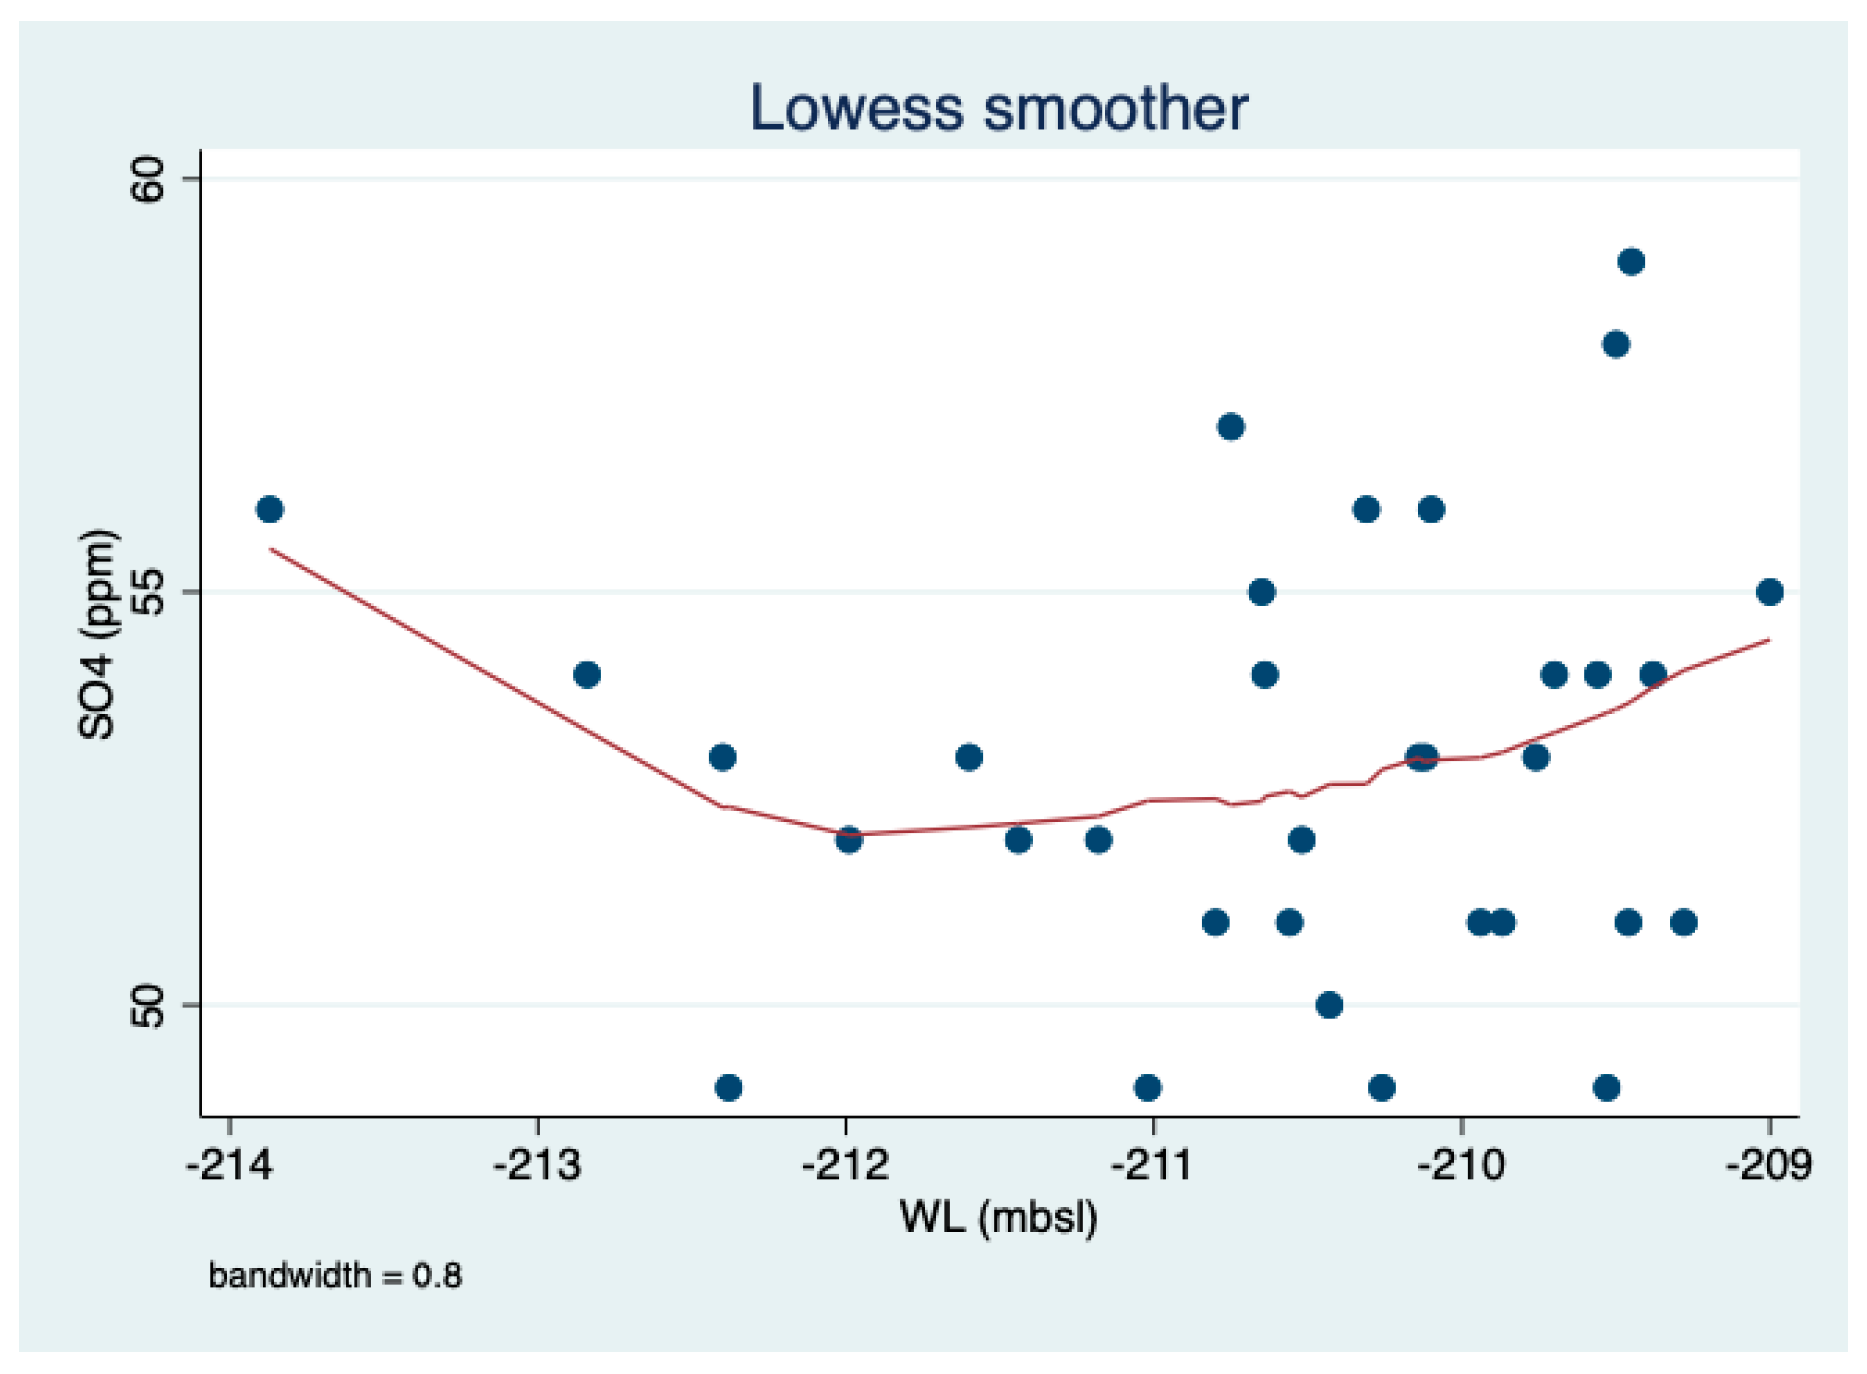
The changes of SO4 in relation to WL fluctuations indicate minor changes.
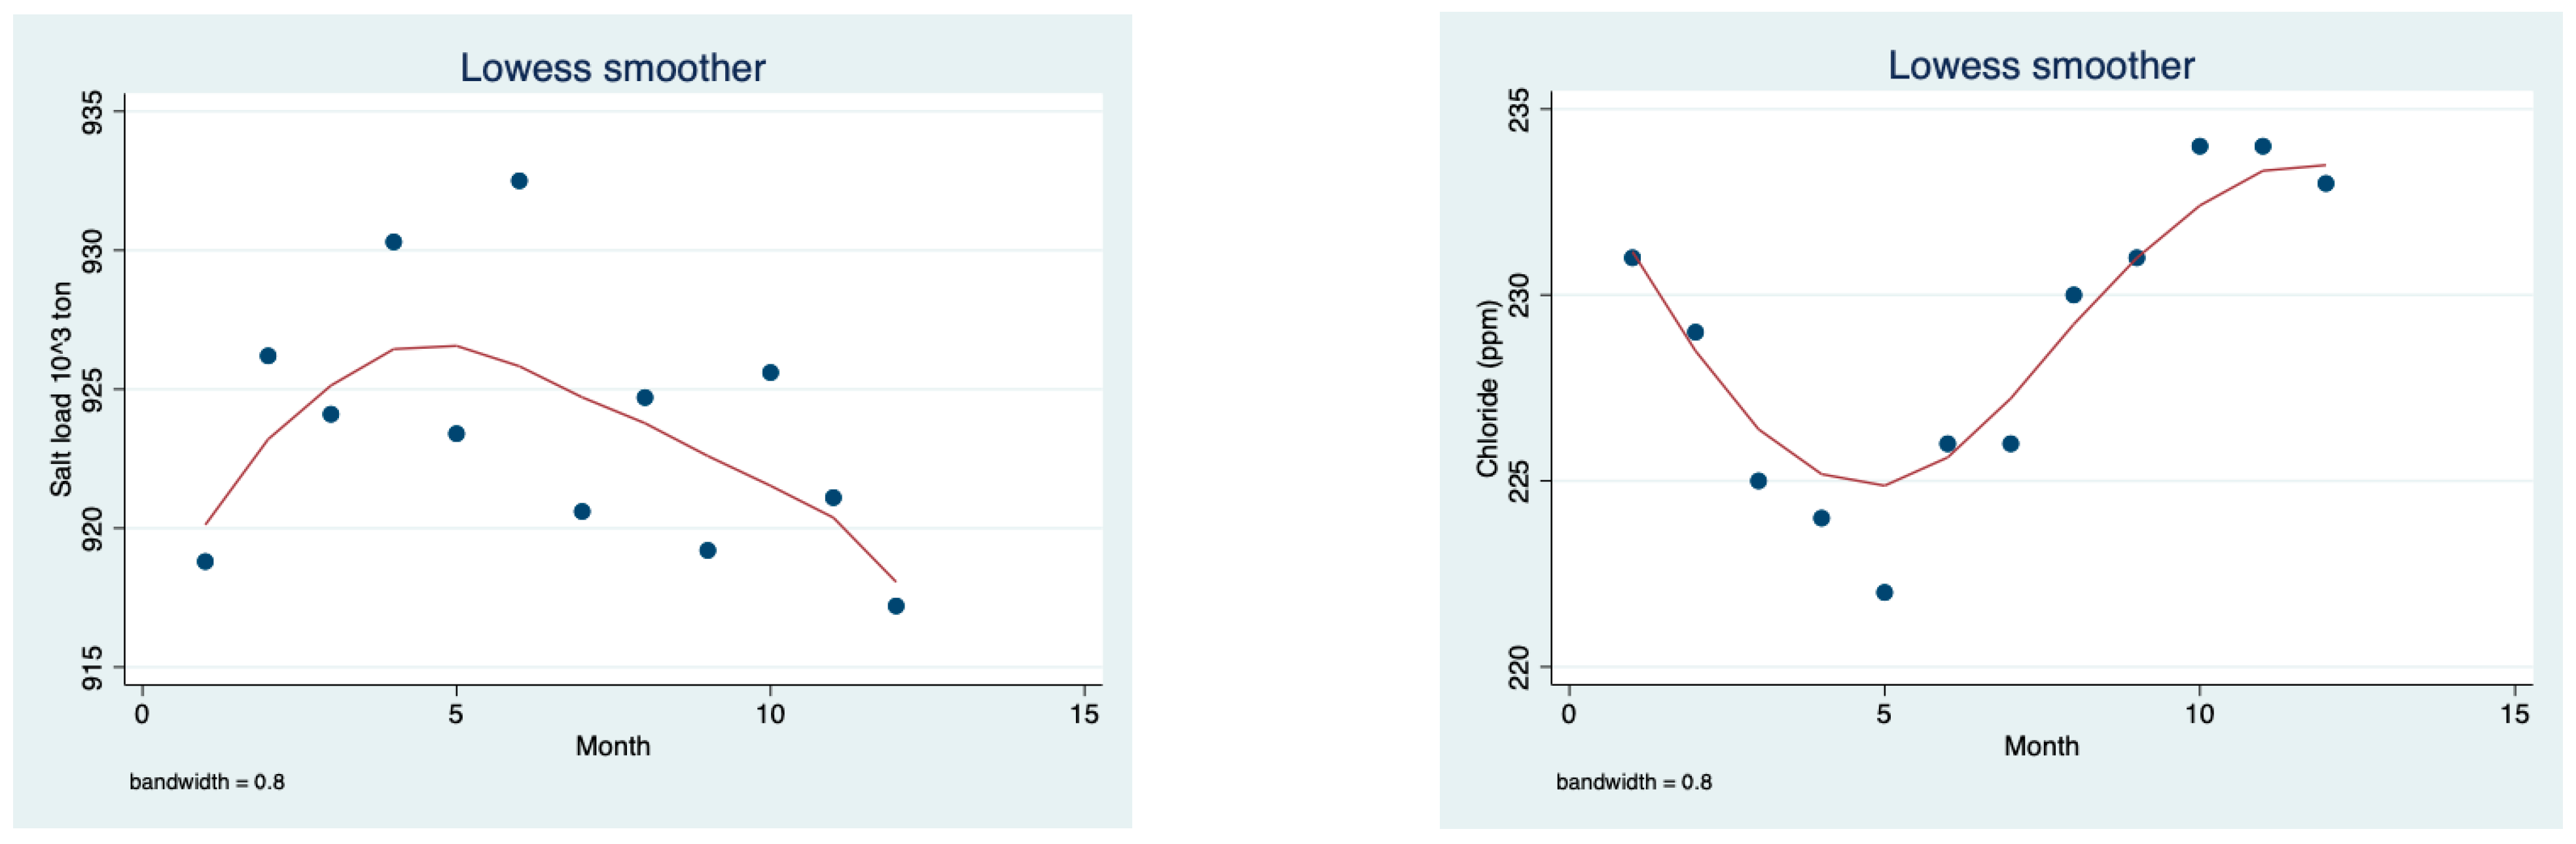
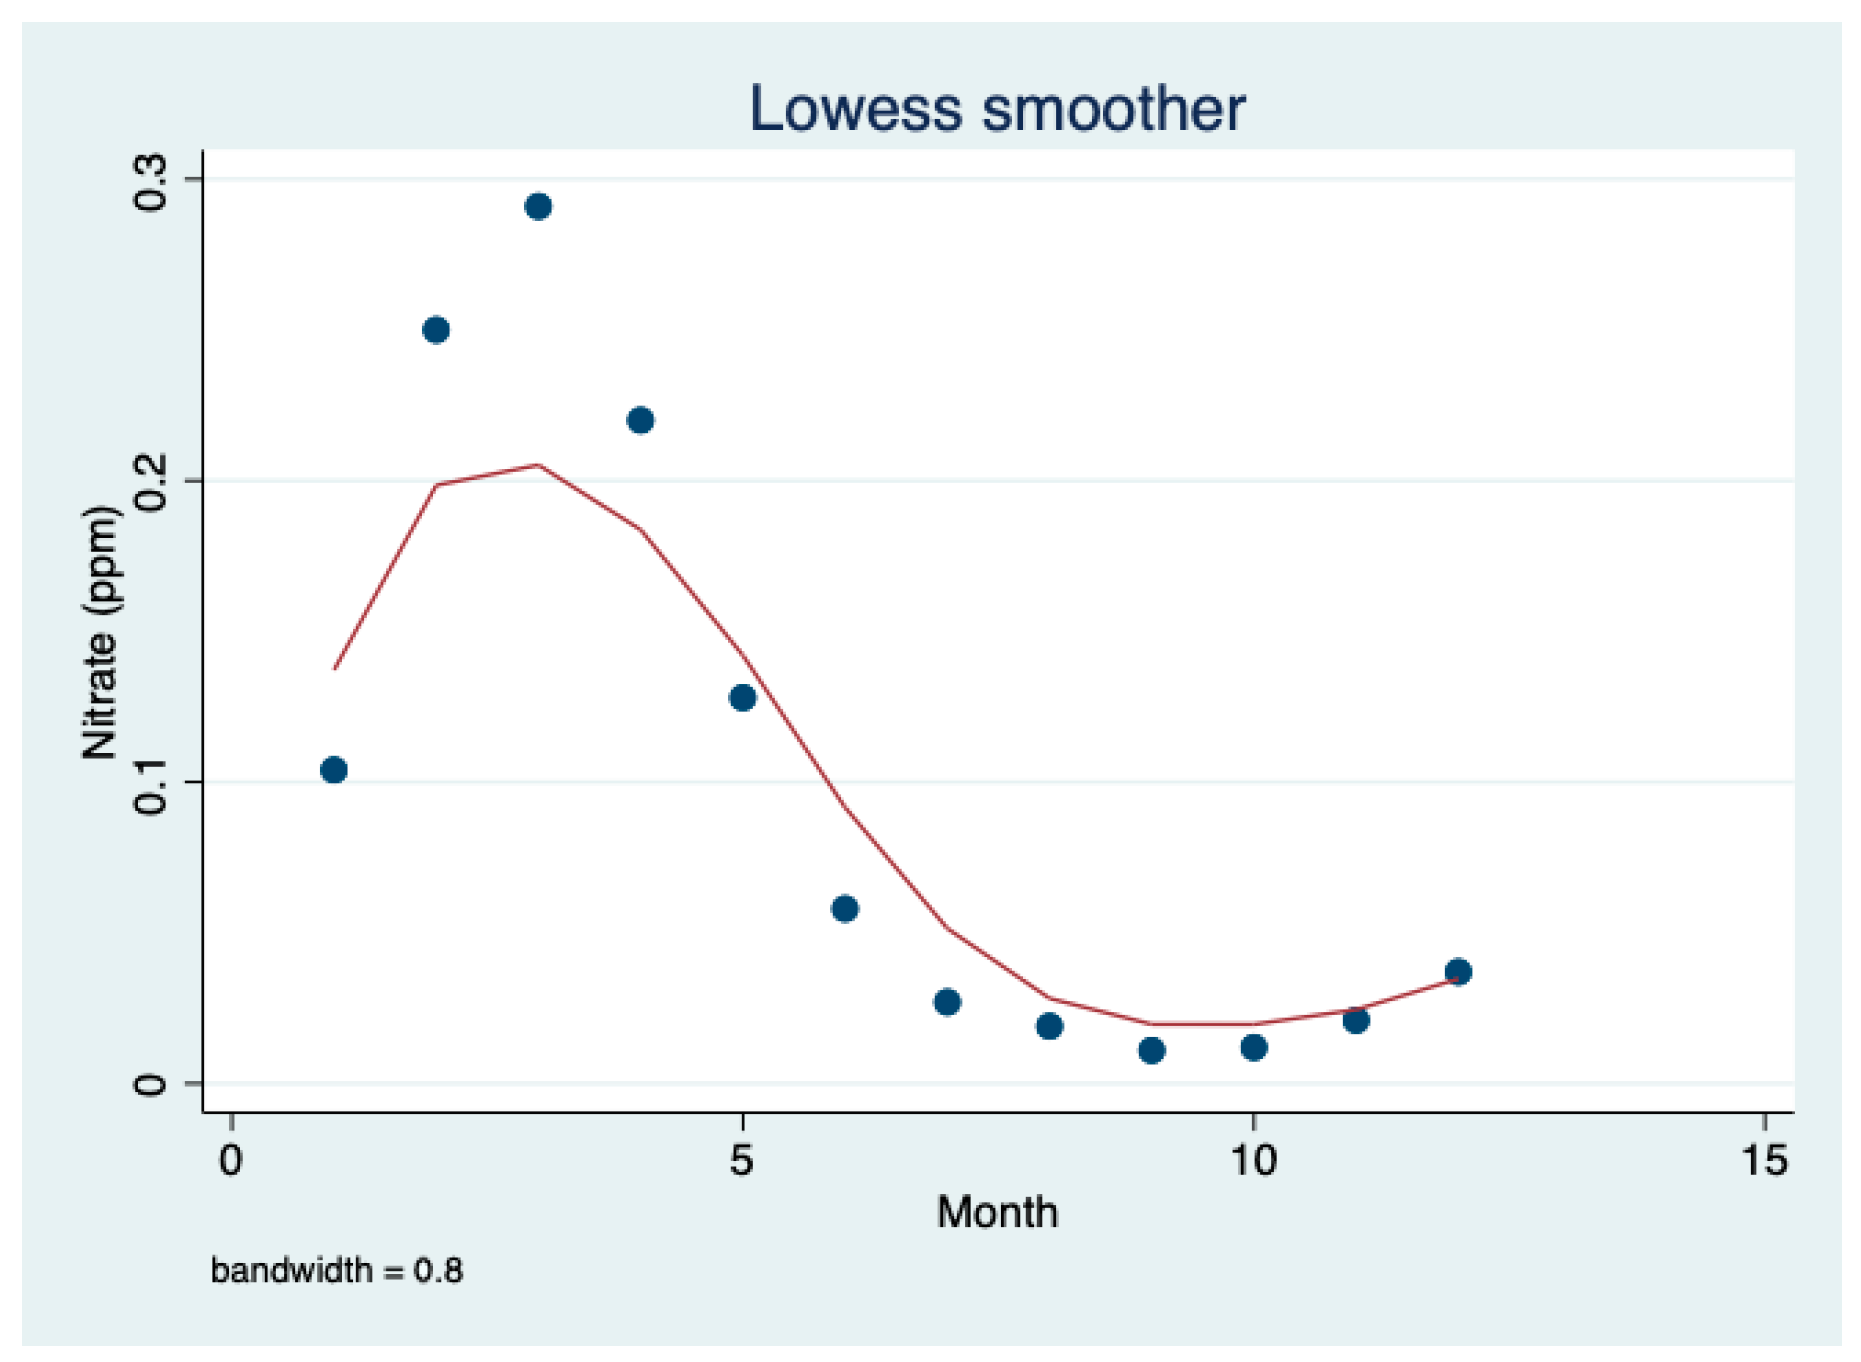
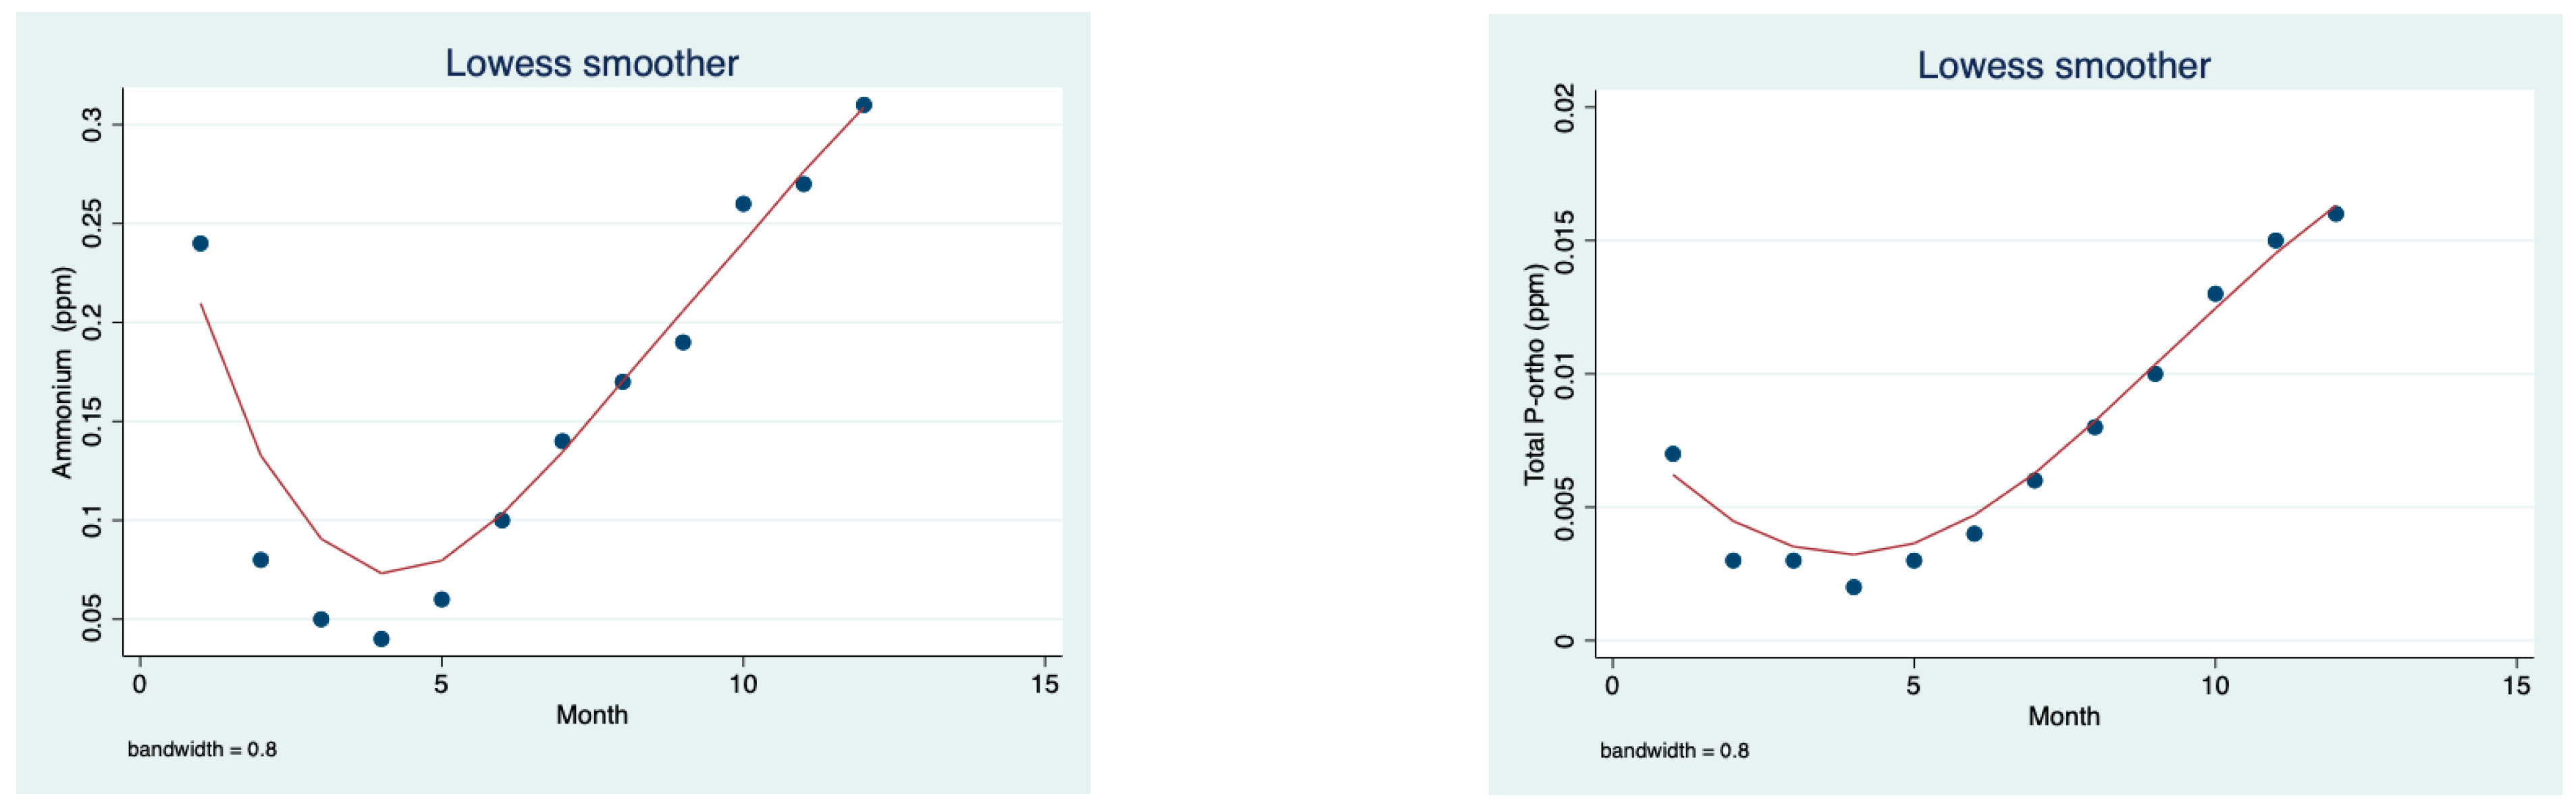
In Figure 14, Figure 15, Figure 16, Figure 17 and Figure 18, the trends of changes occurring in the different months are shown. The figures show WL (mbsl) as related to nutrient concentrations (chloride, salt load, total phosphorus, total nitrogen, orthophosphate, and nitrate) and computed salt total loads (103 ton). The values were averaged from all sampling stations, all discrete depths, and all years between 1969 and 2001.
Results given in Figure 14 confirm the typical subtropical climate trait in Lake Kinneret’s drainage basin: winter rainfall enhances river discharge accompanied by WL elevation: maximum in May and minimum in November.
The seasonal changes of chloride and salt load are prominently the opposite.
The opposite trends of TP and TN are shown: the winter rainfall-discharge condition enhances nitrogen migration whilst the summer’s thermal structure creates reductive hypolimnion, which enhances bottom-up phosphorus migration from the bottom sediments.
The thermal stratification in summer, which is accompanied by the reductive condition in the hypolimnion, enhances the reduction of nitrogen to ammonium and phosphorus migration from the bottom sediments.
Results given in Figure 18 confirm the winter drift of nitrate from the nitrogen and organic-matter-rich content of peat soil outsourced from the Hula Valley, resulting from oxidized peat soil nitrate production. During spring-summer-fall, river discharge sharply declined, followed by a reduction of nitrate migration as confirmed in Figure 18.
Results given in Figure 19 indicate the implementation of water storing policy in Lake Kinneret and consequently, a chloride concentration enhancement and WL increase. The water storage policy is implemented by dam closure and actual minimum pumping as was managed recently.
Results given in Figure 20 and additional information indicated a decline of chloride concentration of 39 ppm (327–288) between October 2018 and June 2019 whilst the salt load was enhanced by 36,000 tons, although a pump of 136.2 mcm pelagic lake water was removed [2].
Results presented in Figure 21 represent the implementation of water storing policy: water stocked accumulation and reduced exchange i.e., lake volume enhancement.
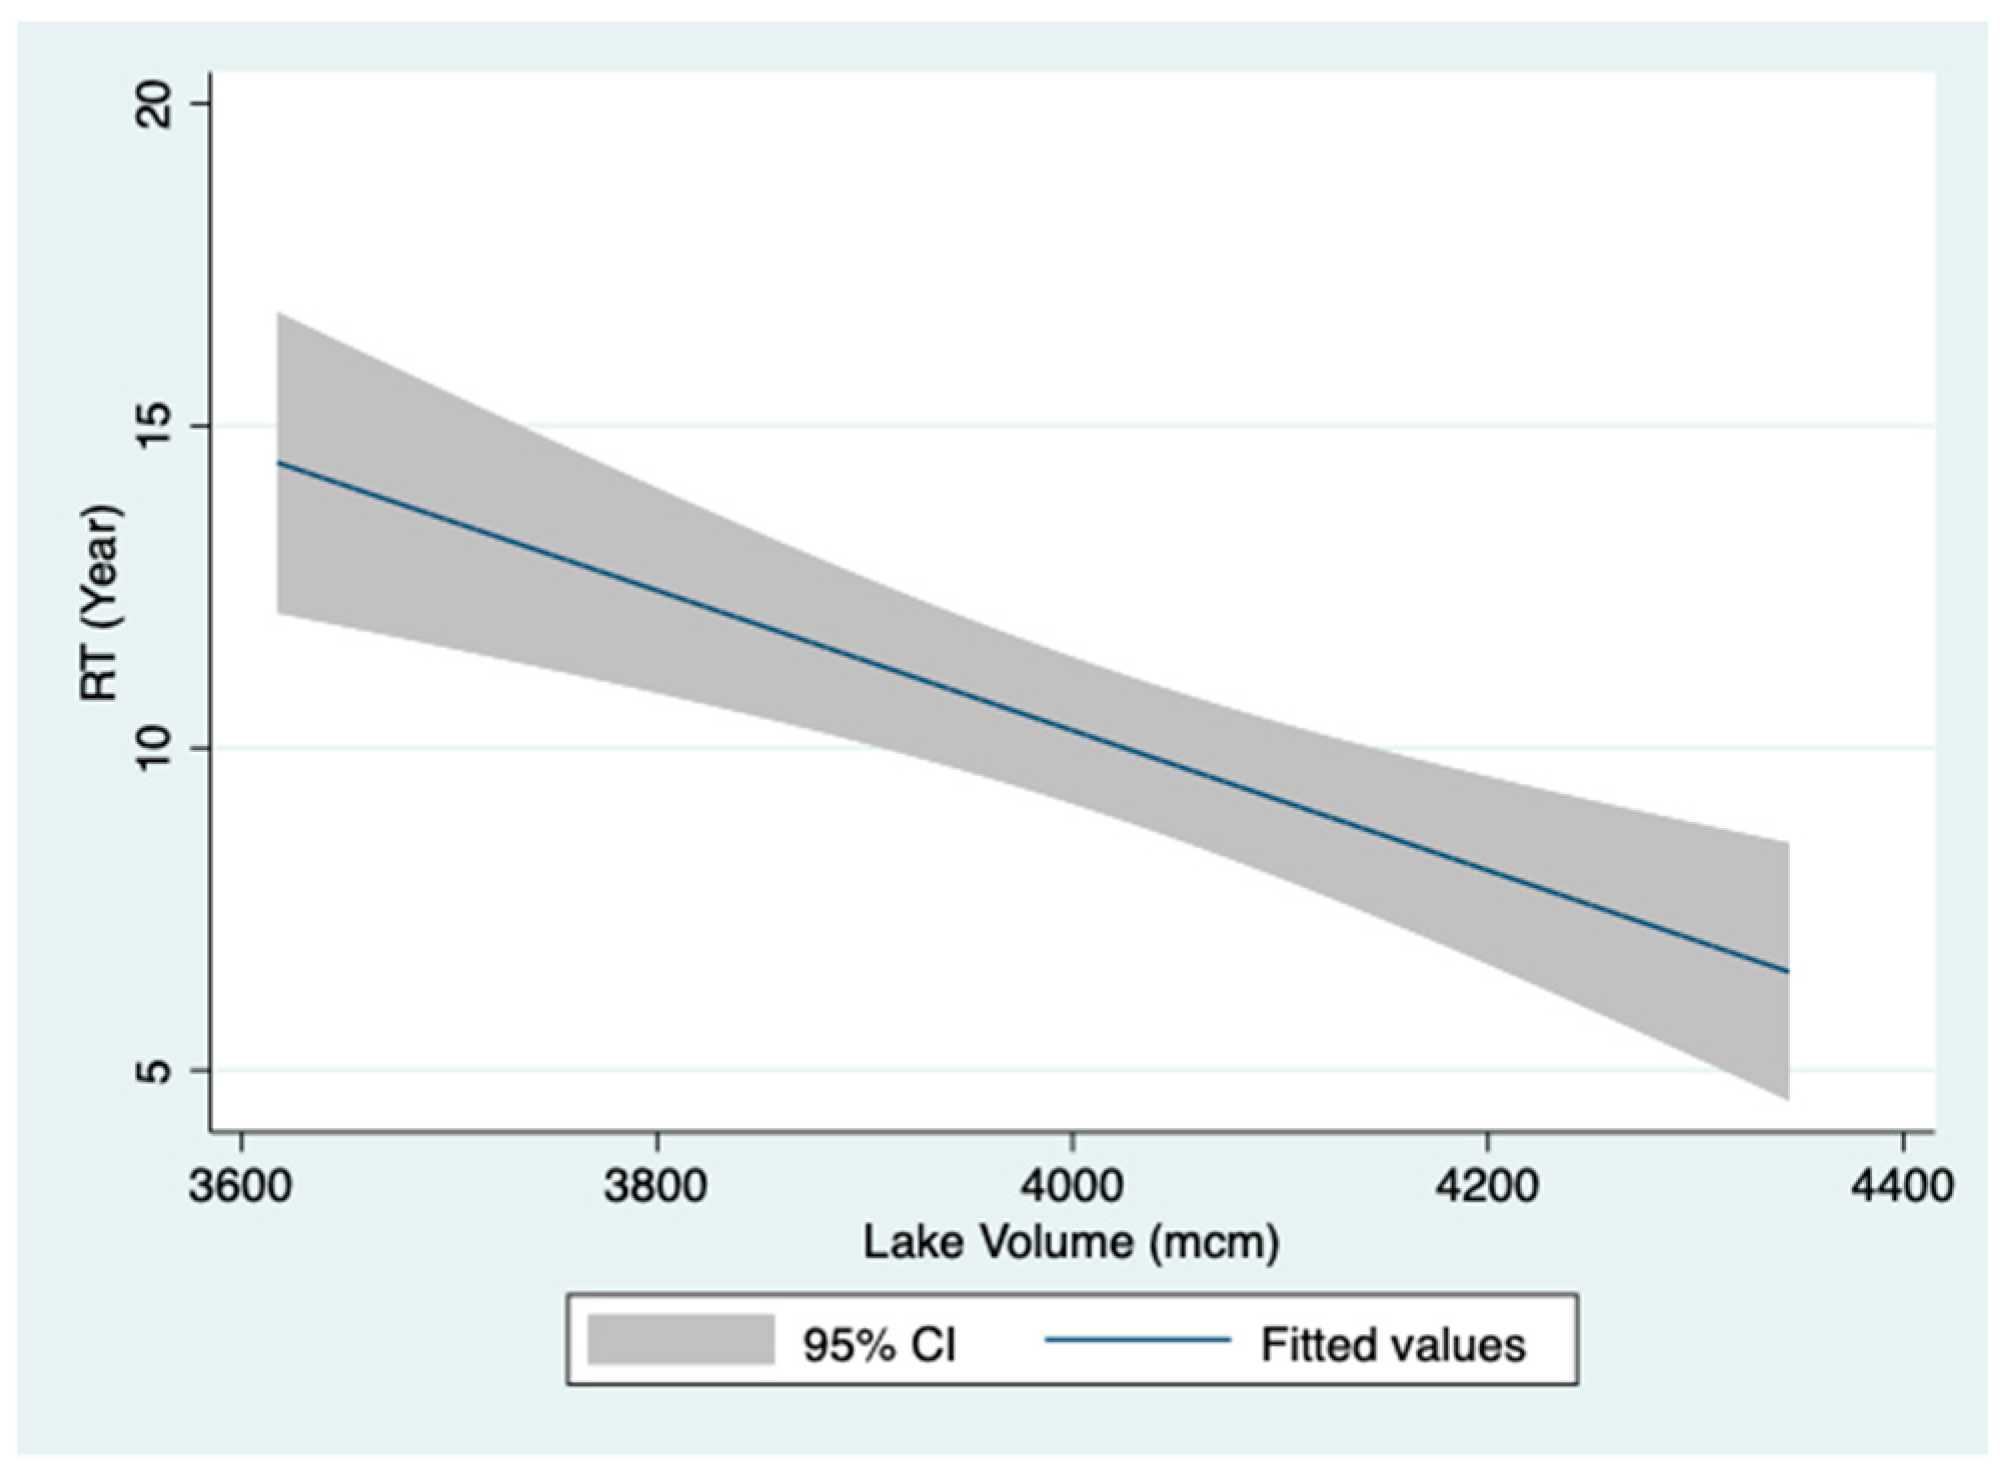
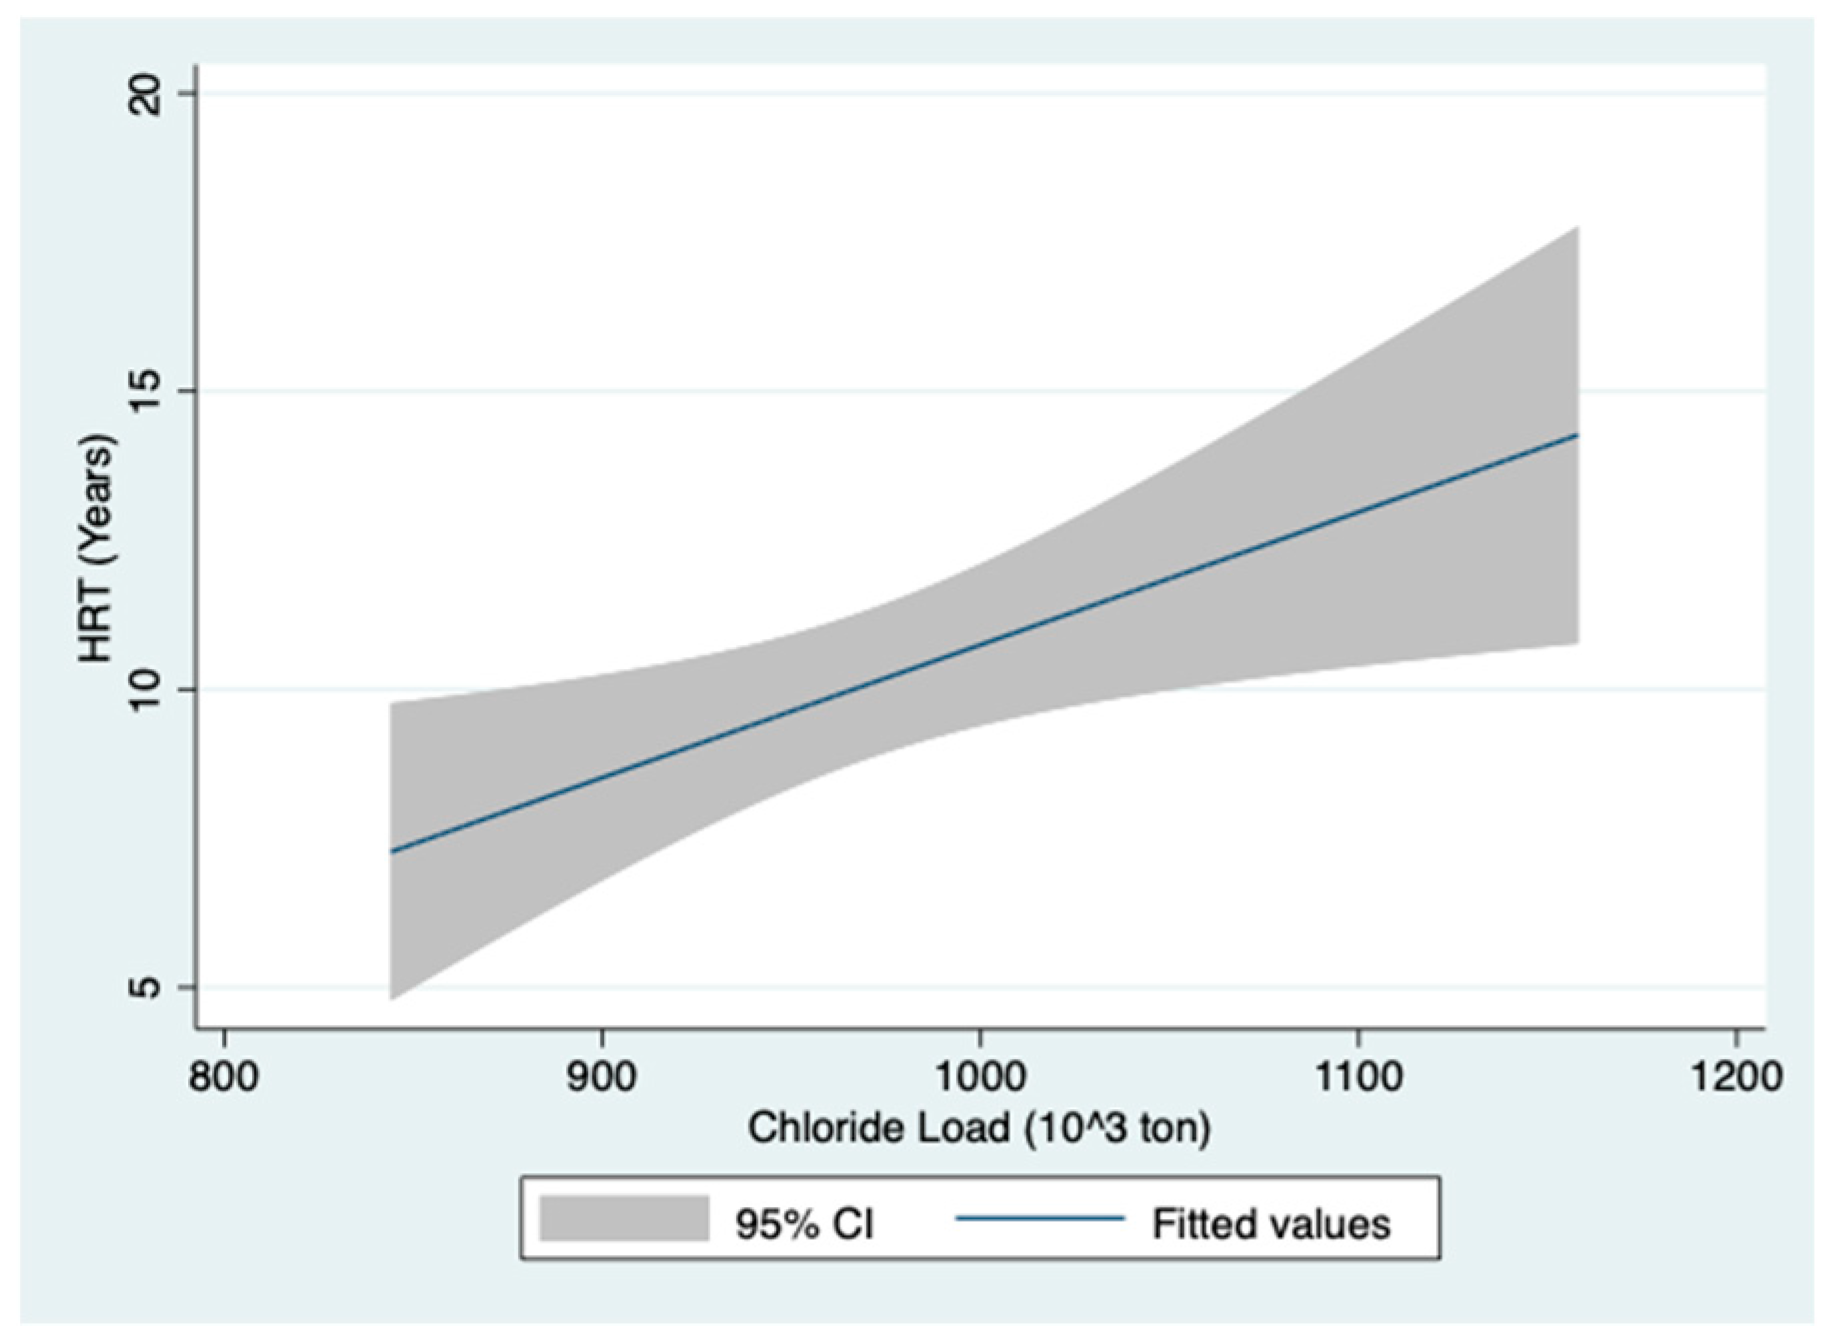
The consequence of Figure 21 is given in Figure 22: the longer the Hydraulic residence time (HRT), the greater the salt load.
Results given in Table 2 indicate timing variabilities of the occurrence of the maximal and minimal values. Figure 1 and Figure 2 indicate a temporal trend of river discharge and WL decline since the early 1980s whilst the timing of the different nutrients’ periodical maximum and minimum concentrations is different: Figure 4 represents a decline of chloride concentration when WL increases whilst (Figure 5) salt load represents a decline when WL elevates from 213 to 210 and is enhanced when WL increases from 210 to 208 mbsl. The temporal patterns of WL, river discharge, chloride concentration, and salt load fluctuations are confirmed in Figure 1, Figure 2, Figure 3, Figure 4, Figure 5 and Figure 6. The positive correlation between chloride concentration and salt load is presented in Figure 7. Though a positive correlation between WL and salt load was documented, the changes in nitrogen and phosphorus nutrient concentrations are different. Phosphate declined (Figure 8 and Figure 9) and nitrogen enhanced (Figure 10 and Figure 11) when WL was elevated. Ammonium behaves differently from TN and nitrate because its existence is dependent on hypolimnetic reductive conditions, which is the result of summer stratification. The fluctuation magnitude of sulfate concentration is minor (Figure 13). These data conclusively support a suggestion about the absence of a direct impact of WLF on nutrient dynamics.
2. Discussion
Water level decline, or fluctuations in Lake Kinneret, were previously studied [3,4,5,6,7,8,9]. Intensive attention was attributed internationally to Water Level Fluctuations (WLF) in lakes and reservoirs, aimed particularly at beachfront protection and the impact of severe droughts, flooding, inundation, overwhelming, fish spawning grounds damage, and to a lesser extent, the open pelagic water quality (among others: [10,11,12,13,14,15,16,17,18,19]).
A speculative hypothetical assumption, partly based on international documentation, about the impacts of when WLF was declining, on nutrient dynamics and eutrophication in freshwater lakes was published [8]. The consequences of nutrient dynamics in Lake Kinneret’s hypolimnion when WL was declining were mentioned earlier in this paper. Nevertheless, a further consequent indication of the impact on water quality in the epilimnion of the pelagic zone or even a trend of temporal eutrophication was forecast but not evidently confirmed [8]. The hypothesis of pelagic water quality deterioration in Lake Kinneret affected by WLF is rejected in this paper. Results given in this paper, as well as previously [9], confirm the indirect impact of WLF, which is a follow-up response to other environmental parameters. Internal loading is tightly associated with the thermal structure in Lake Kinneret, but epilimnetic consequences are not confirmed [8]. The long-term accumulation of nutrients in Lake Kinneret’s ecosystem was not confirmed. Moreover, the long-term development of nitrogen deficiency and phosphorus sufficiency in the pelagic zone probably supported the HFCB outbreak that was previously documented [20]. Lake Kinneret is not a closed system, and it intensively interacts with the terrestrial surroundings. Climate changes significantly affected nutrient loading dynamics and the epilimnetic standing stocks in Lake Kinneret that resulted from hydrological features (rainfall, river discharge), but the direct involvement of WLF is not confirmed. WLF is undoubtedly affecting the littoral ecosystem [3,4,5,8,21], nevertheless, its impact on the pelagic zone is insignificant. The dramatic change of the phytoplankton community structure in Lake Kinneret was widely documented [7,22,23], whilst its relation to WLF was found to be insignificant and indirect. Through a long history, 9000 years of Lake Kinneret’s ecosystem, WLF events were numerous within a high range of amplitudes, 207–217 [24,25], and presently (1933–2022), 6.57 mbsl accompanied the carried out anthropogenic and natural modification; consequent eutrophication was not confirmed.
The research hypothesis about the ecological close relations between WLF and pelagic water quality in freshwater lakes, particularly Lake Kinneret, is therefore defined as independence. WLF’s impact on the pelagic water quality in Lake Kinneret aimed at a resolved unequivocal solution is probably an indifferent or apathetic equilibrium: no reasonable conclusion of yes or no. Substantiation of WLF towards eutrophication or pelagic water quality deterioration probably exists occasionally in relation to environmental changes, but the direct impact of WLF was not confirmed. Deterioration of the littoral habitat, including fish spawning grounds, were clearly confirmed [3,4,5,21]. Nevertheless, investigations about the deterioration within Lake Kinneret’s pelagic zone, such as the replacement of Peridinium blooms by harmful cyanobacteria (HFCB) [22], or the conversion of trophic status from phosphorus to nitrogen limitation, confirmed hydrological-nutrient dynamics but not WLF impact.
An outstanding thorough study focusing on the ecological impact of WLF on the shallows in the Great East African Lakes was published [21,23]. The freshwater lake shallows exposed to WLF inundations play a significant role in the development of fish communities through processes of reproduction (spawning, mating, nesting, etc.) and feeding of YOY (young of the year), and consequently, commercial harvest [8,21,26]. Nevertheless, the potential impact of WLF on water quality in the pelagic zone and the role of nutrient dynamics are not thoroughly considered. The hydrological features in freshwater lakes are, among others, key drivers in ecosystem production, and also affect the quality of its ecoservices and are partly controlled by anthropogenic involvement. Interannual and seasonal WLF control beach space inundation regimes and are significantly involved in their capacity of primary production. Nevertheless, WL decline reduces fish diversity, and their energy transfer efficiency and food chain length are reduced [21]. However, seasonal and annual inundation quite often enhance biomass production in shallows, influencing the entire lake’s ecosystem’s structure and function [21,27,28], though WLF can also enhance generation or demolish productive and diverse habitats. Water level fluctuations may promote eutrophication and cyanobacterial blooms [28,29]. An increase in WLF magnitude may also affect the lake biodiversity of zooplankton, benthic invertebrates, macrophytes, and fish [26,30,31].
The focus of the present paper is aimed at investigating if the ecological linkage between WLF and water quality in the pelagic zone of Lake Kinneret is direct or a follow-up case. In Lake Kinneret’s ecosystem, sources of nitrogen loading are mostly external whilst phosphorus loading is shared between the drainage basin, eolian dust deposition [32], and internal release from the bottom sediments during stratification. A unique transfer of phosphorus from the hypolimnion to the epilimnion is carried out during the germination of dormant Peridinium cysts [7,22,33,34]. This internal bottom-up transfer of bioavailable phosphorus from the sediments to the epilimnion was significant when the Peridinium bloom was commonly heavy. That kind of phosphorus supply accompanied by nitrogen deficiency was suggested as a key driver, which enabled the replacement of Peridinium dominance by HFCB biomass [22,33,34]. Though nutrient dynamics, supply, and availability enhanced Peridinium decline and cyanobacterial outbreak, lack of reasonable direct relation between WLF and modifications is considered.
Climate changes primarily affecting rainfall, river discharge, wind regime, evaporation, temperature, and thermal structure (stratification), followed by modification of water quality and WLF are consequent responses that indirectly modify pelagic conditions. The increase of chemically reduced forms of several nutrients, such as ammonium, sulfide, CO2, and possibly methane, occur in the anoxic hypolimnion in the summer [8]. Nevertheless, temporal respective enhancement of nutrients’ concentrations in the epilimnion of Lake Kinneret was not recorded. Moreover, a decline of nitrogen was documented [35] and the slight increase of phosphorus was assigned as another factor [34]. Taking into consideration the morphometric structure of Lake Kinneret, its geographical location, the common magnitude of WLF (1.6 m), and average 84 years of WL altitude (210.78 mbsl), the hypothesis of the conversion of Lake Kinneret from a monomictic to polymictic thermal structure is not realistic.
3. Nutrient Dynamics and Seasonality of WLF
3.1. Chloride Concentration and Salt Load
Modelling of the sub-lacustrine flux of salts into Lake Kinneret was presented by three groups of scientists [35,36,37], among which only one [36] related it to the hydraulic pressure changes produced by WLF. The other two models included the conceptive runoff-hydrological approach (RM) and the geohydrological paradigm. The subtropic climatological pattern of winter rainfall, followed by enhanced river discharge, followed by the dry season is shown in Figure 14 and Figure 15. Consequently, WL elevation in winter-spring peaked commonly in mid-May, followed by a summer-fall decline, which was minimized in November (Figure 14). Nevertheless, the lower salinity of the river waters (14 times lower than in Lake Kinneret waters) results in the lake’s chloride concentration decline in winter-spring time, as a result of the dilution effect (Figure 15) whilst the salt load in the lake increases in winter-spring. In the summer months, chloride concentration increases as a result of external inputs’ decline, which diminishes the dilution effect and reduces sub-lacustrine flux, accompanied by the enhancement of evaporation whilst therefore, the load slightly declines. The mechanism of fluctuated salinity in Lake Kinneret is dependent on two major components: freshwater input as river discharge, which enhances periodical dilution, and salts flux through sublacustrine infiltration fluxes, which is the driving force of salt accumulation (load). The ecological implication of the system interaction is comprised of short-term dilution impact in the winter and long-term salt accumulation from sub-lacustrine sources whilst WLF’s impact is not involved. Therefore, the salt balance in Lake Kinneret is not dependent on WLF and other factors are predominantly involved.
3.2. Nitrogen and Phosphorus
The conclusion about the independent relation between WLF and Lake Kinneret’s pelagic water quality is partly supported by the long-term periodicity and seasonality that is regularly recurrent of the distribution of nitrogen and phosphorus concentrations in the pelagic zone of Lake Kinneret. (Figure 16, Figure 17 and Figure 18). Nevertheless, none of the biological parameters, such as community structure of phytoplankton, zooplankton, or fish changes, are attributed to WLF. Phytoplankton and zooplankton fluctuations are attributed to bottom-up and top-down eco-forces, respectively [20,22,33]. Nitrogen contribution originates from the peat soil in the Hula Valley through water-mediated migration, therefore, its concentration in the lake is higher in the winter during discharge enhancement (Figure 16). The phosphorus input sources come from erosion in the drainage basin, eolic dust deposition, and bottom sediments during summer stratification. The summer hypolimnetic reductive conditions during stratification enhance the transfer of orthophosphate from the sediments. The annual nutrient averages in the present study refer to one value for the whole water column, therefore, hypolimnetic phosphorus enhancement has an effect on the summer mean values in spite of nutrient deficiency in Lake Kinneret’s epilimnion in the summer [33]. Negligible phosphorus contribution is due to the peat soil in the Hula Valley. It was confirmed that phosphorus contribution from the peat soil enhances during the summer when dryness of the soil is accompanied by broken linkages between the phosphorus and particulate organic matter. Enhancement of phosphorus contribution from the peat soil, wind regime, dust deposition, and reductive conditions in the hypolimnion confirm summer enhancement of the total phosphorus input into the lake (Figure 18). The summer decline of total nitrogen is due to the reduction of rainfall and discharge, followed by a diminishment of nitrate migration from the peat soil (Figure 18). The independence between phosphorus and nitrogen dynamics in Lake Kinneret’s pelagic zone and WLF is therefore confirmed. In comparison to phosphorus and nitrogen, the temporal history of chloride concentration and salt removal: during 1933–1968, dam operation was solely achieved; in the late 1960s, app. 25% of natural (Ein–Nur salty sprigs) salts input were removed, and from the early 1970s, the National Water Carrier (NWC) annually removed app. 350–400 mcm of Lake Kinneret’s pelagic waters. During the pre-NWC period, hydraulic management was controlled by climate conditions (rainfall and river discharge) and dam operation whilst water exchange was minimized and Hydraulic residence time (HRT) was longer. The result of such water balance management, accompanied by independent sub-lacustrine flux, was that the chloride concentration and total load were significantly enhanced (Figure 19 and Figure 20). Moreover, implementation of a national hydraulic policy aimed at water storing resulted in a WL increase, which reduced Hydraulic residence time (HRT) (Figure 21) but enhanced the load of salts (Figure 22).
A supportive approach is given by the evaluation of the Lake Kinneret ecosystem structure with an emphasis on the external and internal carbon sources and the trophic relations existing between the pelagic food web components whilst the WLF “compartment” is excluded [33]. Discrimination between two different trophic patterns of carbon flow was documented: (1) Peridinium and (2) nano-phytoplanktonic dominance, whilst WLF and the impact of the littoral are excluded. This is because WLF is dependent on water input regime (climate conditions) and hydraulic management whilst its impact on nutrient dynamics in Lake Kinneret’s pelagic waters is somewhat speculative. WLF is a response to water balance whilst water quality is a consequence of nutrient mass balance and trophic relations within pelagic organisms. Nevertheless, WLF is a driving ecoforce within the complex interaction of the littoral ecosystem. The different trend of change evaluated by linear regression between the Jordan River’s discharge and pelagic nutrients of chloride (ppm and ton), nitrogen, and phosphorous confirmed their independence with WLF whilst being dependent on water discharge. Discharge enhancement was followed by chloride concentration decline, salt load enhancement, and diminished phosphorus and nitrogenous elevation. The migration capacity of TN into the pelagic waters of Lake Kinneret is highly affected by water-NO3-mediated flux from the Hula Valley peat soil during the winter when WL is increasing. The nitrogen enhancement is due to external input in the winter and not to the WL increase resulting from discharge enhancement. During summer stratification, the WL declines and phosphorus is released from the bottom. Therefore, the lower the WL, the higher the phosphorus concentration, even if hypolimnetic volume is reduced.
4. Conclusive Remarks
The common periodical (monthly) distribution of nutrient concentrations in the epilimnion of Lake Kinneret indicates a 20 m deep layer rich in oxygen but poor in nutrients, following a decline in water input, temperature, and evaporation elevation, resulting in a decline of WL. An annual WLF magnitude of 0.5–2.5 m is a commonly recurrent event in Lake Kinneret. Therefore, seasonal summer conditions of nutrient deficiency in the pelagic epilimnion and low WL are a normal occurrence. WL decline is not a causation factor for nutrient decline but is instead an escorted follower. This paper defines how water level fluctuations and pelagic water quality in Lake Kinneret are indirect follow-up events. WLF and Lake Kinneret’s pelagic water quality are therefore escorts and are not co-partners.
Funding
This research received no external funding.
Data Availability Statement
The database of Kinneret Limnological Laboratory, IOLR, and the database of the Hula Project of MIGAL—Scientific Research Institute-Hula Project department.
Acknowledgments
The author acknowledges the Hula Project team and database sponsored by the MIGAL-Scientific Research Institute, and the database of the Kinneret Limnological Laboratory.
Conflicts of Interest
The author declares no conflict of interest.
References
- Serruya, C. Chapter: C: Morphometric characteristics. In Lake Kinneret Monographiae Biologicae; Dr. Junk bv Publishers: Hague, The Netherlands; Boston, MA, USA; London, UK, 1978; Volume 32, pp. 124–132. [Google Scholar]
- Ziegel, E.; Chudinov, M.; Atzmon, B.; Soibelman, Y.; Stortz-Peres, Y. Chapter—Kinneret. In Seasonal Rainfall Summary, 2021/2022 and Its Major Hydrological Characteristics; Report HIS/25/2922; Department of Surface Water and Hydrometeorology: Tel Aviv, Israel, 2022; pp. 23–30. (in Hebrew) [Google Scholar]
- Gafny, S.; Gasith, A.; Goren, M. Effect of water level fluctuation on the shore spawning of Mirogrex terraesanctae (Steinitz), (Cyprinidae) in Lake Kinneret, Israel. J. Fish Biol. 1992, 41, 863–871. [Google Scholar] [CrossRef]
- Gasith, A.; Gafny, S. Effects of water level fluctuation on the structure and function of the littoral zone. In Large Lakes: Ecological Structure and Function; Tilzer, M.M., Serruya, C., Eds.; Springer: Berlin/Heidelberg, Germany, 1990; pp. 156–171. [Google Scholar]
- Gasith, A.; Goren, M.; Gafny, S. Ecological consequences of lowering Lake Kinneret water level: Effect on breeding success of the Kinneret Sardine. In Preservation of Our World in the Wake of Change: Proceedings of the 6th International Conference of the Israeli Society for Ecology and Environmental Quality Sciences, Jerusalem, Israel, 30 June–4 July 1996; Steinberger, Y., Ed.; IEEQS: Jerusalem, Israel, 1996; pp. 569–573. [Google Scholar]
- Ostrovsky, I.; Rimmer, A.; Agnon, Y.; Koren, N. Sediment resuspension in the hypolimnion of Lake Kinneret (Israel): The impact of water level fluctuation. Ver. Int. Ver. Limnol. 2006, 29, 1625–1629. [Google Scholar]
- Serruya, C.; Pollingher, U. Lowering of water level and algal biomass in Lake Kinneret. Hydrobiologia 1977, 54, 73–80. [Google Scholar] [CrossRef]
- Zohary, T.; Ostrovsky, I. Ecological impact of excessive water level fluctuations in stratified freshwater lakes. Inl. Waters 2011, 1, 47–59. [Google Scholar] [CrossRef]
- Gophen, M. Historical Review on Water Level Changes in Lake Kinneret (Israel) and Incomparable Perspectives. Water 2023, 15, 837. [Google Scholar] [CrossRef]
- Aroviita, J.; Heiki, H. The impact of water-level regulation on littoral macroinvertebrate assemblages in boreal lakes. Hydrobiologia 2008, 613, 45–56. [Google Scholar] [CrossRef]
- Wantzen, K.M.; Rothaupt, K.-O.; Mortl, M.; Cantonati; Oth, L.T.; Fischer, P. Ecological effects of water-level fluctuations in lakes: An urgent issue. Hydrobiologia 2008, 613, 1–4. [Google Scholar] [CrossRef] [Green Version]
- Wei, A.H.; Chow-Fraser, P. Synergistic impact of water level fluctuation and invasion of Glyceria on Typha in a freshwater marsh of Lake Ontario. Aquat. Bot. 2006, 84, 63–69. [Google Scholar] [CrossRef]
- Smith, B.D.; Maitland, P.S.; Pennock, S.M. A comparative-study of water level regimes and littoral benthic communities in Scottish lochs. Biol. Conserv. 1987, 39, 291–316. [Google Scholar] [CrossRef]
- Bond, N.R.; Lake, P.S.; Arthington, A.H. The impacts of drought on freshwater ecosystems: An Australian perspective. Hydrobiologia 2008, 600, 3–16. [Google Scholar] [CrossRef] [Green Version]
- Brauns, M.; Garcia, X.F.; Pusch, M.T. Potential effects of water-level fluctuations on littoral invertebrates in lowland lakes. Hydrobiologia 2008, 613, 5–12. [Google Scholar] [CrossRef]
- Hofmann, H.; Lorke, A.; Peeters, F. Temporal scales of water-level fluctuations in lakes and their ecological implications. Hydrobiologia 2008, 613, 85–96. [Google Scholar] [CrossRef] [Green Version]
- Leira, M.; Cantonati, M. Effects of water-level fluctuations on lakes: An annotated bibliography. Hydrobiologia 2008, 613, 171–184. [Google Scholar] [CrossRef]
- Nowlin, W.H.; Davies, J.M.; Nordin, R.N.; Mazumder, A. Effects of water level fluctuation and short-term climate variation on thermal and stratification regimes of a British Columbia reservoir and lake. Lake Reserv. Manag. 2004, 20, 91–109. [Google Scholar] [CrossRef]
- Lu, J.S.; Bunn, E.; Burford, M.A. Nutrient release and uptake by littoral macrophytes during water level fluctuations. Sci. Total Environ. 2018, 622, 29–40. [Google Scholar] [CrossRef] [PubMed]
- Gophen, M.; Smith, V.H.; Nishri, A.; Threlkeld, S.T. Nitrogen Deficiency, Phosphorus Sufficiency, and the Invasion of Lake Kinneret, Israel, by N2-Fixing Cyanobacterium Aphanizomenon ovalisporum. Aquat. Sci. 1999, 1, 1–14. [Google Scholar] [CrossRef]
- Gownaris, J.; Rountos, K.J.; Kaufman, L.; Kolding, J.; Lwiza, K.M.M.; Pikitch, E.K. Water level fluctuations and the ecosystem functioning of lakes. J. Great Lakes Res. 2018, 44, 1154–1163. [Google Scholar] [CrossRef]
- Gophen, M. The Replacement of Peridinium by Cyanobacteria in Lake Kinneret (Israel): A Commentary Review. Open J. Mod. Hydrol. 2019, 9, 161–177. [Google Scholar] [CrossRef] [Green Version]
- Probst, W.N.; Stoll, S.; Peters, L.; Fischer, P.; Eckmann, R. Lake water level increase during spring affects the breeding success of bream Abramis brama (L.). Hydrobiologia 2009, 632, 211–224. [Google Scholar] [CrossRef] [Green Version]
- Hazan, D.; Stein, M.; Agnon, A.; Marco, S.; Nadel, D.; Negendank, J.F.W.; Schwabe, M.; Neev, D. The late Pleistocene-Holocene Limnological History of Lake Kinneret (Sea of Galilee). Quat. Res. 2005, 63, 60–77. [Google Scholar] [CrossRef]
- Vossel, H.; Roeser, P.; Litt, T.; Reed, J.M. Lake Kinneret Israel: New insight into Holocene regional Palaeo-climate variability based on high-resolution multi-proxy analysis. Holocene 2018, 2018, 1–16. [Google Scholar] [CrossRef] [Green Version]
- Jul-Larsen, E.; Kolding, J.; Overå, R.; Nielsen, J.R.; van Zwieten, P.A.M. Management, Co-Management or No Management? Major Dilemmas in Southern African Freshwater Fisheries 2. Case Studies; FAO Fisheries Technical Paper, No. 426/2; Food & Agriculture Organization of the United Nations: Rome, Italy, 2003; p. 271.
- Chow-Fraser, P.; Lougheed, V.; Le Thiec, V.; Crosbie, B.; Simser, L.; Lord, J. Long-term response of the biotic community to fluctuating water levels and changes in water quality in Cootes Paradise Marsh, a degraded coastal wetland of Lake Ontario. Wetl. Ecol. Manag. 1998, 6, 19–42. [Google Scholar] [CrossRef]
- Li, Q.; Xiao, J.; Ou, T.; Han, M.; Wang, J.; Chen, J.; Li, Y.; Salmaso, N. Impact of water level fluctuations on the development of phytoplankton in a large subtropical reservoir: Implications for the management of cyanobacteria. Environ. Sci. Pollut. Res. Int. 2018, 25, 1306–1318. [Google Scholar] [CrossRef]
- Bakker, E.S.; Hilt, S. Impact of water-level fluctuations on cyanobacterial blooms: Options for management. Aquat. Ecol. 2016, 50, 485–498. [Google Scholar] [CrossRef] [Green Version]
- Lopes, P.M.; Bini, L.M.; Declerck, S.A.; Farjalla, V.F.; Vieira, L.C.; Bonecker, C.C.; Lansac-Toha, F.A.; Esteves, F.A.; Bozelli, R.L. Correlates of zooplankton beta diversity in tropical lake systems. PLoS ONE 2014, 9, 109581. [Google Scholar] [CrossRef] [PubMed] [Green Version]
- Evtimova, V.V.; Donohue, I. Water-level fluctuations regulate the structure and functioning of natural lakes. Freshw. Biol. 2016, 61, 251–264. [Google Scholar] [CrossRef]
- Ganor, E.; Foner, H.A.; Gravenhost, G. The Amount and Nature of the Dustfall on Lake Kinneret (the Sea of Galilee), Israel: Flux and fractionation. Atmos. Environ. 2003, 37, 4301–4315. [Google Scholar] [CrossRef]
- Serruya, C.; Gophen, M.; Pollingher, U. Lake Kinneret: Carbon Flow Patterns and Ecosystem Management. Arch. Hydrobiol. 1980, 88, 265–302. [Google Scholar]
- Hadas, O.; Pinkas, R.; Malinsky-Rushanskiy, N.; Nishri, A.; Kaplan, A.; Rimmer, A.; Sukenik, A. Appearance and establishment of diazotrophic cyanobacteria in Lake Kinneret, Israel. Freshw. Biol. 2012, 57, 1365–2427. [Google Scholar] [CrossRef]
- Rimmer, A.; Lichinsky, Y. A Model for the Design of Salt Concentration and Production in Lake Kinneret; Final Report, T13/2007, Submitted to the Governmental Authority of Se-wage and Water; Kinneret Limnological Laboratory, IOLR: Horvat Kur, Israel, 2007; p. 25. (in Hebrew) [Google Scholar]
- Simon, E.; Mero, F. The Salination Mechanism of Lake Kinneret. J. Hydrol. 1992, 138, 327–343. [Google Scholar] [CrossRef]
- Gvirzman, H.; Garven, G.; Gvirtzman, G. Hydrogeological Modeling of the Saline Hot Springs at the Sea of Galilee, Israel. Water Resour. Res. 1997, 33, 913–926. [Google Scholar] [CrossRef] [Green Version]
Figure 1.
Lowess smoother trend of changes of annual (1970–2018) Jordan River discharge.

Figure 2.
Trend of changes (Lowess smoother) of an annual mean of Lake Kinneret water level (WL). (mbsl) during 1934–2018.
Figure 2.
Trend of changes (Lowess smoother) of an annual mean of Lake Kinneret water level (WL). (mbsl) during 1934–2018.

Figure 3.
Trend of changes (Lowess smoother, 0.8 bandwidth) of annual lake average of chloride concentration (ppm). Two periods are presented: Left—1934–2005 and Right—1969–2001.
Figure 3.
Trend of changes (Lowess smoother, 0.8 bandwidth) of annual lake average of chloride concentration (ppm). Two periods are presented: Left—1934–2005 and Right—1969–2001.

Figure 4.
Linear prediction (95% CI) of annual mean of Lake Kinneret’s chloride concentration (ppm) relative to the annual mean of Lake Kinneret’s WL altitude (mbsl) (1969–2018).
Figure 4.
Linear prediction (95% CI) of annual mean of Lake Kinneret’s chloride concentration (ppm) relative to the annual mean of Lake Kinneret’s WL altitude (mbsl) (1969–2018).

Figure 5.
Fractional polynomial regression between annual (1969–2018) maximal salt load (103 ton/lake) and annual mean of WL. Salt load is based on chloride concentration (ppm) and maximal lake volume (106 m3/year; mcm/y), which is respective to WL altitude as published in the morphometric map of Lake Kinneret by TAHAL in 1961 [1].

Figure 6.
Similar computation of salt load and annual means of WL and lake volume was applied for Figure 6 where annual maximal values and means of salinity (ppm) and WL (mbsl) and lake volume (mcm) were plotted vs. time (1969–2001).
Figure 6.
Similar computation of salt load and annual means of WL and lake volume was applied for Figure 6 where annual maximal values and means of salinity (ppm) and WL (mbsl) and lake volume (mcm) were plotted vs. time (1969–2001).

Figure 7.
Linear regression (W95% CI) between annual lake means of maximal salt load (103 ton) and chloride concentration (ppm) during 1969–2001.
Figure 7.
Linear regression (W95% CI) between annual lake means of maximal salt load (103 ton) and chloride concentration (ppm) during 1969–2001.

Figure 8.
Trend of changes (Lowess smoother, 0.8 bandwidth) of annual lake averages of TP concentration (ppm scale range: 0.01–0.03) vs. WL (mbsl) during 1969–2001.
Figure 8.
Trend of changes (Lowess smoother, 0.8 bandwidth) of annual lake averages of TP concentration (ppm scale range: 0.01–0.03) vs. WL (mbsl) during 1969–2001.

Figure 9.
Trend of changes (Lowess Smoother, 0.8 bandwidth) of annual lake averages of orthophosphate concentration (ppm scale range: 0.000–0.015) vs. WL (mbsl) during 1969–2001.
Figure 9.
Trend of changes (Lowess Smoother, 0.8 bandwidth) of annual lake averages of orthophosphate concentration (ppm scale range: 0.000–0.015) vs. WL (mbsl) during 1969–2001.

Figure 10.
Trend of changes (Lowess smoother, 0.8 bandwidth) of annual lake averages of total nitrogen (TN) concentration (ppm scale range: 0.4–1.4) with respect to WL (mbsl) during 1969–2001.
Figure 10.
Trend of changes (Lowess smoother, 0.8 bandwidth) of annual lake averages of total nitrogen (TN) concentration (ppm scale range: 0.4–1.4) with respect to WL (mbsl) during 1969–2001.

Figure 11.
Trend of changes (Lowess smoother, 0.8 bandwidth) of annual lake averages of nitrate (NO3) concentration (ppm scale range: 0.0–0.4) with respect to WL (mbsl) during 1969–2001.
Figure 11.
Trend of changes (Lowess smoother, 0.8 bandwidth) of annual lake averages of nitrate (NO3) concentration (ppm scale range: 0.0–0.4) with respect to WL (mbsl) during 1969–2001.

Figure 12.
Trend of changes (Lowess smoother, 0.8 bandwidth) of annual lake averages of ammonium concentration (ppm scale range: 0.1–0.25) vs. WL (mbsl) during 1969–2001.
Figure 12.
Trend of changes (Lowess smoother, 0.8 bandwidth) of annual lake averages of ammonium concentration (ppm scale range: 0.1–0.25) vs. WL (mbsl) during 1969–2001.

Figure 13.
Trend of changes (Lowess smoother, 0.8 bandwidth) of annual lake averages of sulfate (SO4) concentration (ppm) vs. WL (mbsl) during 1969–2001.
Figure 13.
Trend of changes (Lowess smoother, 0.8 bandwidth) of annual lake averages of sulfate (SO4) concentration (ppm) vs. WL (mbsl) during 1969–2001.

Figure 14.
Lowess smoother (0.8 bandwidth) trend of changes plot of monthly changes of WL (mbsl) (1969–2001).
Figure 14.
Lowess smoother (0.8 bandwidth) trend of changes plot of monthly changes of WL (mbsl) (1969–2001).

Figure 15.
Lowess smoother (0.8 bandwidth) trend of changes plot of monthly changes of chloride concentration (ppm) (left) and salt loads (103 tons) (right) (1969–2001).
Figure 15.
Lowess smoother (0.8 bandwidth) trend of changes plot of monthly changes of chloride concentration (ppm) (left) and salt loads (103 tons) (right) (1969–2001).

Figure 16.
Lowess smoother (0.8 bandwidth) trend of changes plot of monthly changes of nitrate concentrations (ppm scale range: 0.0–0.3) (1969–2001).
Figure 16.
Lowess smoother (0.8 bandwidth) trend of changes plot of monthly changes of nitrate concentrations (ppm scale range: 0.0–0.3) (1969–2001).

Figure 17.
Lowess smoother (0.8 bandwidth) trend of changes plot of monthly changes of ammonium (left) and total orthophosphate (right) concentrations (ppm scale range: Ammonium—0.05–0.3; P-Otho—0.00–0.020) (1969–2001).
Figure 17.
Lowess smoother (0.8 bandwidth) trend of changes plot of monthly changes of ammonium (left) and total orthophosphate (right) concentrations (ppm scale range: Ammonium—0.05–0.3; P-Otho—0.00–0.020) (1969–2001).

Figure 18.
Lowess smoother (0.8 bandwidth) trend of changes plot of monthly changes of total phosphorus (left) and total nitrogen (right) concentrations (ppm scale range: Total Phosphorus—0.018–0.026; Total Nitrogen—0.0–0.3) (1969–2001).
Figure 18.
Lowess smoother (0.8 bandwidth) trend of changes plot of monthly changes of total phosphorus (left) and total nitrogen (right) concentrations (ppm scale range: Total Phosphorus—0.018–0.026; Total Nitrogen—0.0–0.3) (1969–2001).

Figure 19.
Trend of changes (LOWESS 0.8 bandwidth) of mean annual concentration of chloride (ppm) in relation to annual mean of WL in Lake Kinneret during 1933–1969.
Figure 19.
Trend of changes (LOWESS 0.8 bandwidth) of mean annual concentration of chloride (ppm) in relation to annual mean of WL in Lake Kinneret during 1933–1969.

Figure 20.
Linear regression (95% Cl) (r2 and p values are given) between monthly means of chloride concentration (ppm) and salt load (103 tons) during the hydraulic year (October to next September), 2018–2019 (Data Source: Mekorot National Water Supply Co., Jordan districts, Laboratory and Drainage Basin Unit).

Figure 21.
Linear regression (95% CI) between annual means (1970–2020) of Hydraulic residence time (HRT) (Years) and lake volume (mcm).
Figure 21.
Linear regression (95% CI) between annual means (1970–2020) of Hydraulic residence time (HRT) (Years) and lake volume (mcm).

Figure 22.
Linear regression (95% CI) between annual means (1970–2020) of Hydraulic residence time (HRT) (Years) and salt load (103 tons).
Figure 22.
Linear regression (95% CI) between annual means (1970–2020) of Hydraulic residence time (HRT) (Years) and salt load (103 tons).


Table 1.
Results of linear regression (r2, p) between multi-annual (1969–2001) means of nutrient concentrations (ppm): Chloride, Ammonium, Total Nitrogen, Nitrate, Total Phosphorus, Ortho-Phosphate, Sulfate, and a load of Salt (103 ton) vs. mean Water Level (mbsl). Significance indication (S = significant; NS = not significant) is given.
| Nutrient | r2 | P (S; NS) |
|---|---|---|
| Chloride (ppm) | 0.4419 | 0.0002 (S) |
| Salt load (103 ton) | 0.0816 | 0.2788 (NS) |
| Ammonium (ppm) | 0.1133 | 0.0555 (NS) |
| Total Nitrogen (ppm) | 0.1586 | 0.0217 (S) |
| Nitrate (ppm) | 0.2240 | 0.0054 (S) |
| Total Phosphorus (ppm) | 0.3852 | 0.0009 (S) |
| Ortho-Phosphate (ppm) | 0.2918 | 0.0030 (S) |
| Sulfate (ppm) | 0.0046 | 0.7089 (NS) |
Table 2.
Multi-annual (1969–2001) averages (all sampling stations, all sampling dates, and discrete depths), maximum and minimum values of nutrient (total phosphorus, total nitrogen, chloride, sulfate, nitrate, ammonium) concentrations (ppm) in the pelagic waters of Lake Kinneret. The maximum and minimum annual value and respective year are indicated.
| Nutrient | Mean | Maximum | Minimum |
|---|---|---|---|
| Total Phosphorus | 0.022 | 0.029 (1998, 1999) | 0.012 (1972) |
| Total Nitrogen | 0.711 | 1.287 (1974) | 0.481 (1989) |
| Nitrate | 0.094 | 0.380 (1992) | 0.029 (1990) |
| Ammonium | 0.161 | 0.262 (1991) | 0.091 (1997) |
| Chloride | 229 | 274 (2001) | 201 (1988) |
| Sulfate | 54 | 59 (1970) | 49 (1999, 1988, 1989, 1987) |
Disclaimer/Publisher’s Note: The statements, opinions and data contained in all publications are solely those of the individual author(s) and contributor(s) and not of MDPI and/or the editor(s). MDPI and/or the editor(s) disclaim responsibility for any injury to people or property resulting from any ideas, methods, instructions or products referred to in the content. |
© 2023 by the author. Licensee MDPI, Basel, Switzerland. This article is an open access article distributed under the terms and conditions of the Creative Commons Attribution (CC BY) license (https://creativecommons.org/licenses/by/4.0/).
Share and Cite
MDPI and ACS Style
Gophen, M. Are Water Level Fluctuations and Pelagic Water Quality in Lake Kinneret Directly Related? Perspectives of Nutrient Dynamics. Water 2023, 15, 1473. https://doi.org/10.3390/w15081473
AMA Style
Gophen M. Are Water Level Fluctuations and Pelagic Water Quality in Lake Kinneret Directly Related? Perspectives of Nutrient Dynamics. Water. 2023; 15(8):1473. https://doi.org/10.3390/w15081473
Chicago/Turabian StyleGophen, Moshe. 2023. "Are Water Level Fluctuations and Pelagic Water Quality in Lake Kinneret Directly Related? Perspectives of Nutrient Dynamics" Water 15, no. 8: 1473. https://doi.org/10.3390/w15081473
Note that from the first issue of 2016, this journal uses article numbers instead of page numbers. See further details here.