
Laboratory Model Test and Field In Situ Test of Distributed Optical Fiber Monitoring of Seepage in a Karst Depression Reservoir Basin
1
Power China Guiyang Engineering Corporation Limited, Guiyang 550081, China
2
Power China Renewable Energy Co., Ltd., Beijing 100020, China
*
Author to whom correspondence should be addressed.
Water 2023, 15(8), 1477; https://doi.org/10.3390/w15081477
Submission received: 4 March 2023
/
Revised: 29 March 2023
/
Accepted: 6 April 2023
/
Published: 10 April 2023
(This article belongs to the Special Issue Application of Artificial Intelligence in Hydraulic Engineering)
Abstract
:Karst depressions are ideal places for building reservoirs and stacking wastes, but karst depressions are mostly located in areas with strong karst development, and there is a problem of karst leakage. The study of karst depression monitoring methods can provide technical support for the construction of reservoirs in karst depressions, and leakage monitoring technology based on distributed temperature sensing (DTS) has the clear advantages of a large measurement range, high precision, continuity, wide distribution, large area, etc. In this paper, a temperature-sensing optical cable is first used to conduct leakage monitoring tests in different soil media, and the temperature change curve in different media is obtained, which verifies the feasibility of the heatable temperature-sensing optical cable to identify leakage in soil media with different moisture contents. Then, for the heatable distributed temperature-sensing optical cable, the variation law of the temperature eigenvalues of the sensing optical cable under different seepage velocities is studied using the layout method wrapped with saturated medium-coarse sand, and the relationship between the seepage rate and the temperature eigenvalues was analyzed. A regression formula for quantitative analysis of leakage velocity was established; finally, the manganese slag silo project in Songtao County in Guizhou Province, China, was used to simulate different leakage conditions on site for testing, and the data were compared and analyzed to obtain the route under different conditions. The temperature distribution law of the seepage section verifies the feasibility of the application of heatable temperature-sensing optical cables in the seepage monitoring of karst depressions.
1. Introduction
Karst depressions are well sealed, and are ideal places for stacking ash, tailings, waste slag, second-class industrial solids, and hazardous wastes and building reservoirs. However, karst depressions are located in the karst vertical infiltration recharge area. Once leakage occurs, such as after building a reservoir, it may cause the reservoir to fail to store water normally. Waste storage can lead to sewage entering underground rivers and causing serious environmental incidents. Therefore, research on seepage monitoring methods for anti-seepage bodies in karst depressions can provide theoretical and technical support for the resource utilization of karst depressions and has comprehensive social and economic benefits. Currently, the methods commonly used for monitoring seepage in karst depressions include pressure pipes, seepage meters [1], and flow measurement weirs [2]. Common methods for detecting leakage in karst depressions include high-density resistivity methods [3], capacitive methods, temperature tracing methods [4], transient electromagnetic methods [5], electrical methods, and ground-penetrating radar methods [6]. These monitoring and detection methods have the common characteristic of not being able to comprehensively cover the monitored objects and often cannot detect certain locations. To improve the accuracy of monitoring and detection, a large number of sensors must be arranged at a certain density, which is extremely uneconomical. Additionally, the lifespan of sensors is limited, and it is not possible to maintain good working conditions throughout the entire lifecycle of the project. As time passes, the sensors will continue to deteriorate, leading to the inability to obtain effective data in the future.
The present study found that heat can be continuously transmitted through a medium, thus providing a new tracer quantity for monitoring the seepage flow of the structure. Among the various temperature tracking methods for seepage monitoring, the distributed fiber optic temperature sensor (DTS) has attracted the most attention. Aufleger et al. [7,8] proposed the idea of using distributed optical fibers for long-term online monitoring of earth–rock embankments and introduced the application of distributed optical fibers in water conservancy projects in a comprehensive manner, which pointed out the direction for subsequent research. Li et al. [9] analyzed the feasibility of DTS application in the leakage monitoring of the Yangtze River embankment. Li [10] developed a multiparameter optical fiber monitoring system for embankments based on DTS and verified the applicability and reliability of the monitoring system by analyzing field monitoring data. Wang et al. [11] introduced the basic principle of DTSs and their application in a concrete face rockfill dam. The comparison with traditional monitoring methods showed the advantages of this method. Wei et al. [12] and Qin et al. [13] introduced the application of DTSs in the location monitoring of leakage in the surrounding joints of concrete face rockfill dams. Tan et al. [14] verified the effectiveness of optical fiber leakage monitoring technology for core rockfill dams through dynamic simulation and model tests, which can compensate for the shortcomings of conventional monitoring methods. Harvie et al. [15] conducted an experimental study on the seepage monitoring method of tailings dams based on DTSs. Wang [16] studied the sandy soil seepage flow monitoring test based on distributed optical fiber, inferred that there is a certain linear relationship between leakage and temperature medium, carried out related research on using optical fiber to determine the location of geomembrane damage, and obtained some beneficial results. Thiele et al. [17] and Artieres et al. [18] combined distributed optical fibers with anti-seepage geotextiles commonly used in hydraulic engineering to locate and provide early warnings of structural damage through a combination of leakage detection and strain monitoring. In Vogt et al. [19], the high-precision vertical temperature distribution profile was obtained through the distributed optical fiber temperature measurement data, the temperature monitoring data were processed by the dynamic harmonic analysis method, and then the leakage velocity of the river recharge groundwater was estimated. Beck et al. [20] used two large-scale experimental studies and presented the results of the field monitoring data analysis of a dam, and DTS-based dam seepage and piping monitoring methods were introduced. Deng [21] obtained a large amount of test data by establishing a leakage test model, compiled a program to extract and organize the massive data, and determined the heating power range by preparing the test. The influence law of fiber temperature rise was identified. Liu et al. [22] applied distributed optical fiber temperature measurement technology to monitor the leakage of an underground diaphragm wall. It was proven through experiments that the use of an external, heatable optical fiber cable can monitor the temperature difference between the seepage part and the non-seepage part of the diaphragm wall well, which is the most important part of the diaphragm wall. Quantitative measurement and precise location of leakage velocity provide the basis this research. The above studies are mainly based on indoor model tests and lack in situ test verification. Moreover, most of them are aimed at dam structures and rarely involve the seepage monitoring of a karst depression reservoir basin.
This paper aims to establish a set of application systems for the leakage monitoring of karst depression reservoirs based on distributed optical fiber technology to detect leakage in time and guide repair. This paper first studies the leakage identification effect of a heatable temperature-sensing optical cable in media with different moisture contents through laboratory experiments and verifies the feasibility of the leakage monitoring application of the heated optical cable when theses temperature changes are small, which is the applicable scope of the optical cable in practical applications. The study provides guidance, then carries out a model test and quantitative analysis of the leakage rate monitoring performance of the heatable temperature-sensing optical cable. Finally, through the field simulation test of a manganese slag warehouse, it is verified that the heatable optical cable can be used in the leakage monitoring of an actual karst depression reservoir basin. The application effect provides a reference for the application of DTSs in seepage field monitoring with small temperature differences and small flow rates in the future.
2. Principle of Distributed Optical Fiber Leakage Monitoring
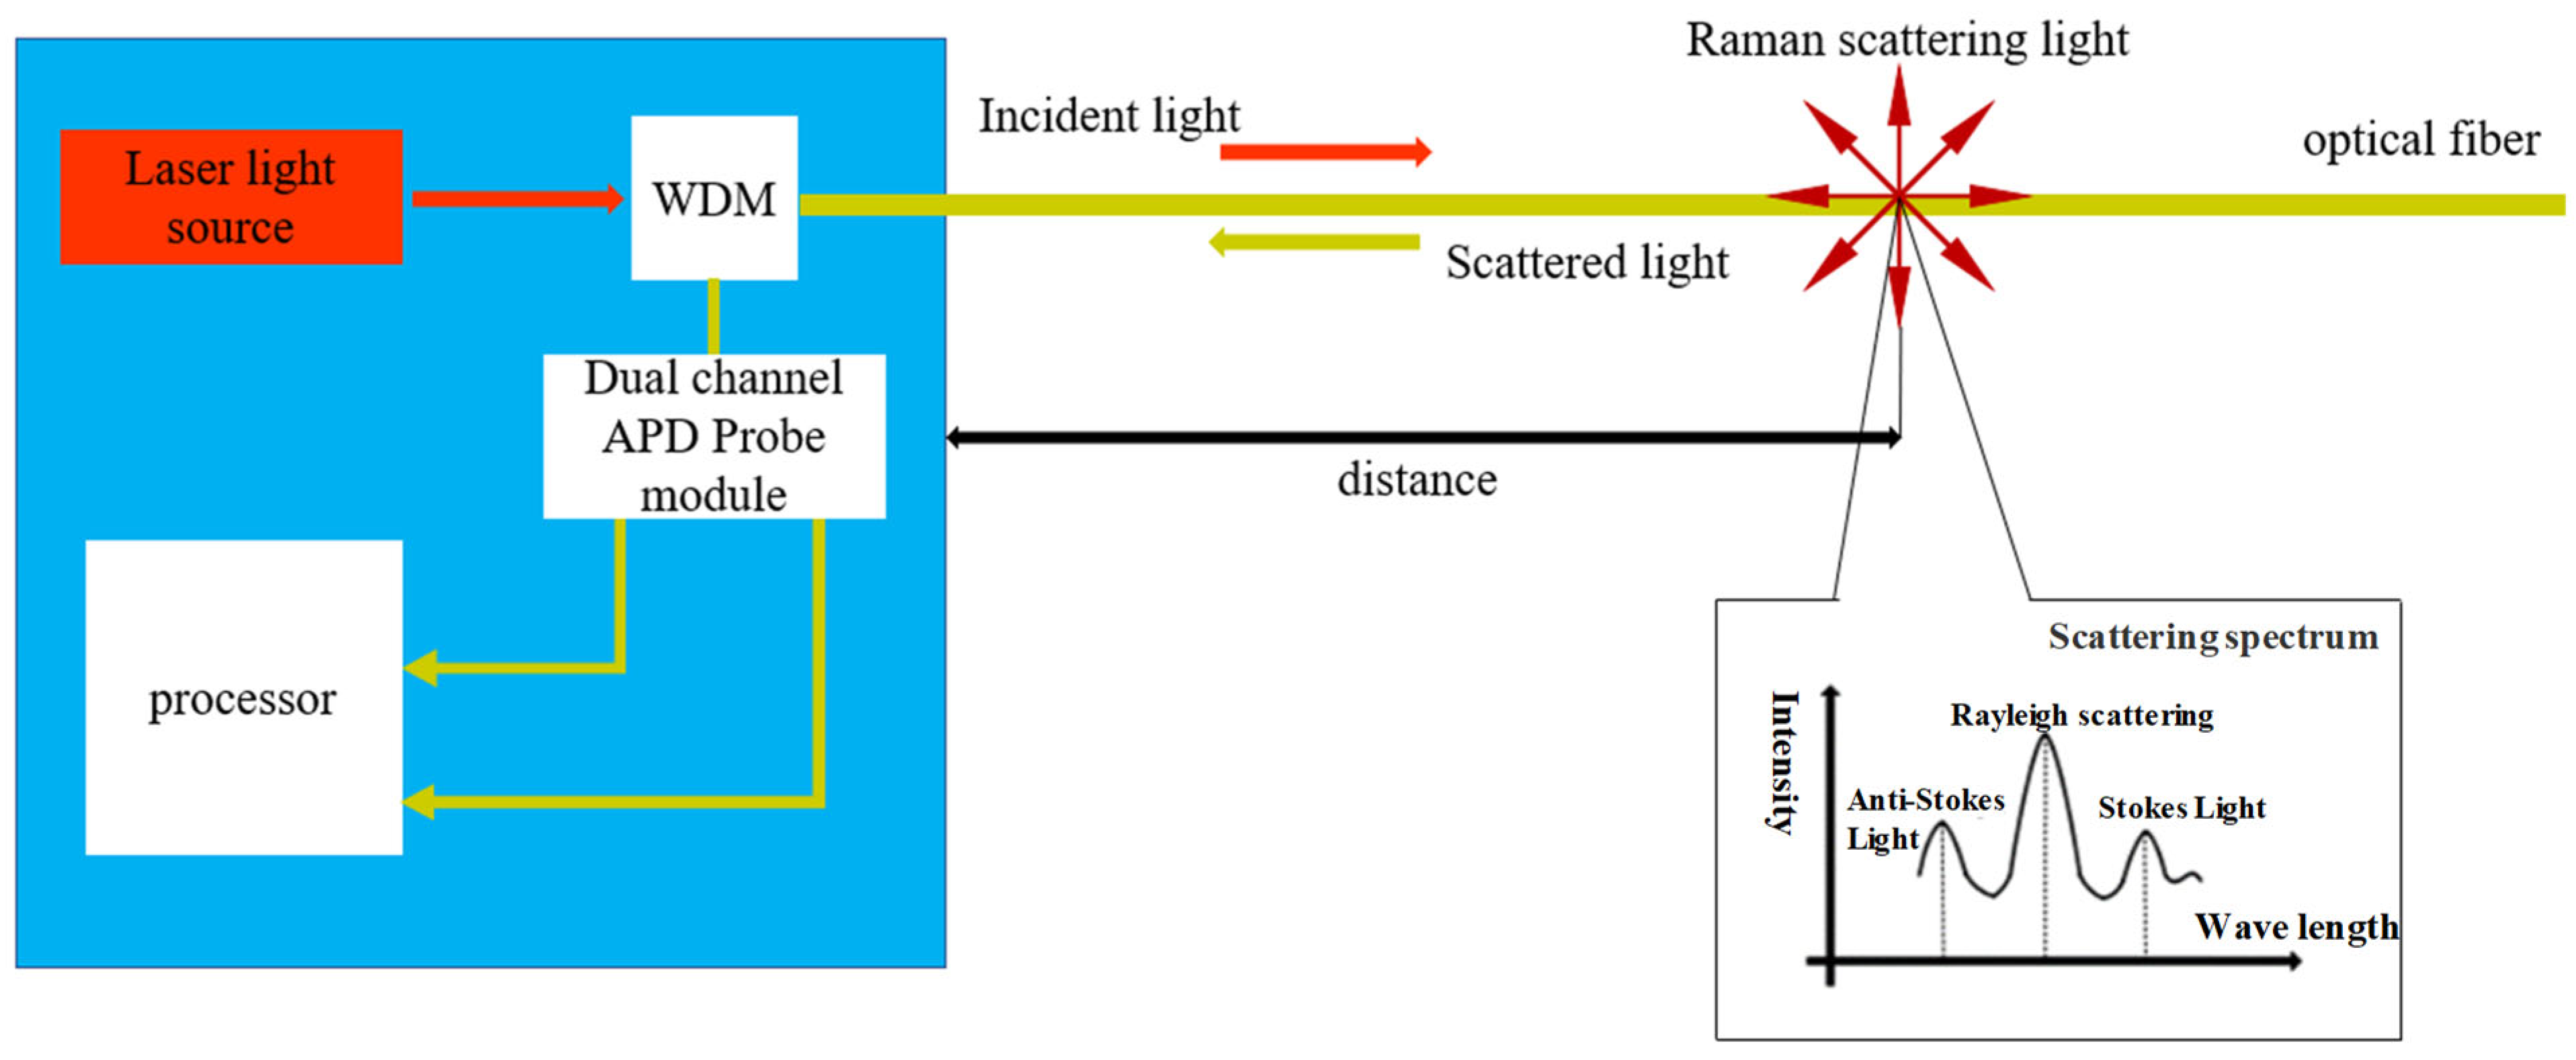
As shown in Figure 1, when the incident light quantum in the fiber collides with the fiber material molecules, an inelastic collision occurs, which is manifested in the generation of Stokes light with a longer wavelength and anti-Stokes light with a shorter wavelength. Since anti-Stokes light is more sensitive to the effects of temperature, the DTS system uses the Stokes light channel as the reference channel and the anti-Stokes light channel as the signal channel. The ratio of the two can eliminate the fluctuation in the light source signal As well as fiber bending and other nontemperature factors to acquire temperature information. The intensity ratio of Stokes light and anti-Stokes light and temperature satisfies the relationship of Formula (1):
where R (T) is a function of the temperature to be measured; and are the StOx light intensity and frequency, respectively; I b and are the anti-Stokes light intensity and frequency, respectively; c is the speed of light; is the Raman frequency shift; is Planck’s constant; is the Boltzmann constant; and T is the absolute temperature.
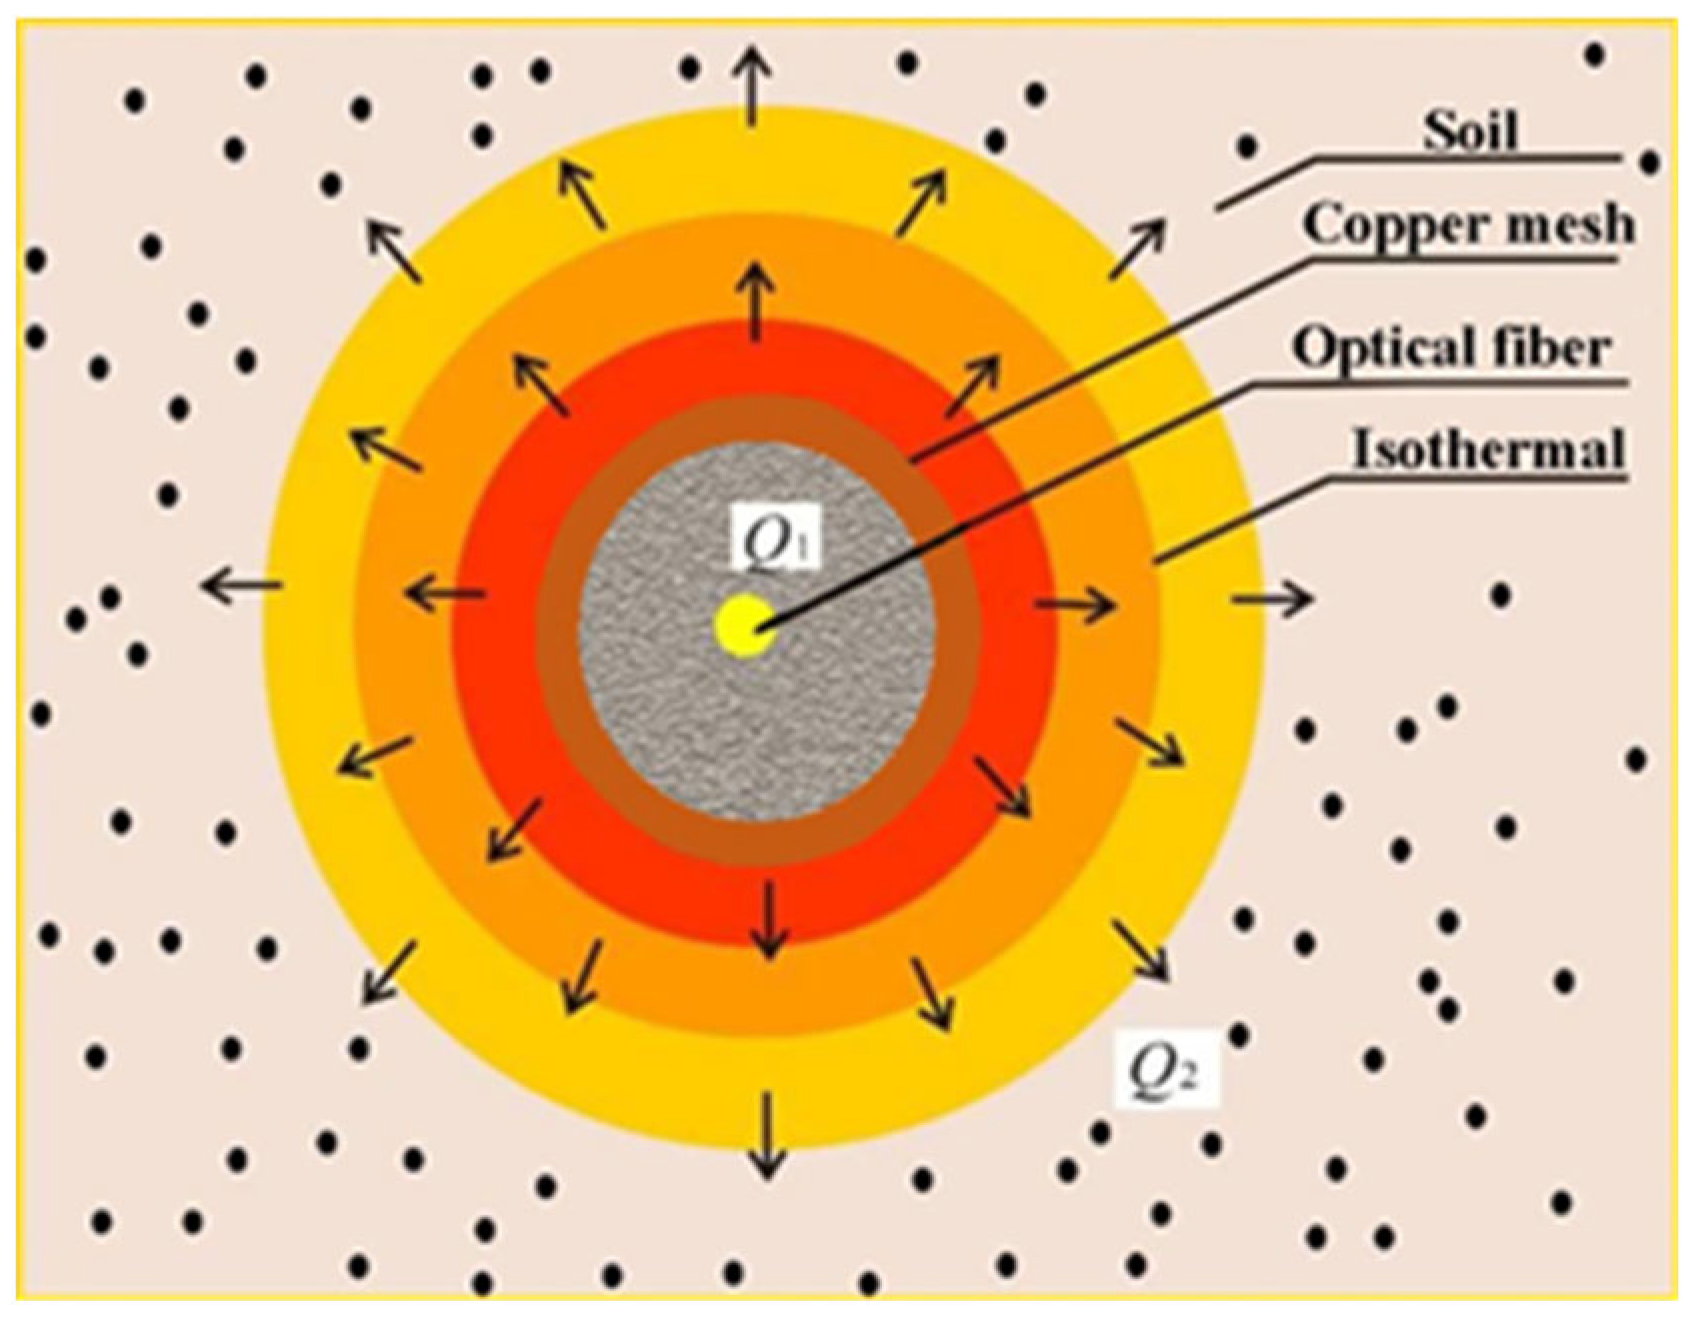
The principle of optical fiber leakage monitoring is the principle of heat dissipation, as shown in Figure 2. After the copper mesh is heated, the heat will diffuse from the inside to the outside. Then, the optical fiber monitoring system is used to measure the change in temperature, and the relationship between the temperature characteristic’s value and the moisture content during the heating process is used to measure the water field in the soil in a distributed manner. The thermal conductivity of soil varies with the moisture content. The higher the moisture content is, the stronger the thermal conductivity. The sensor or sensing optical cable with a self-heating function is implanted into the soil, and the fixed power is heated to establish the relationship between the degree of heat diffusion and the moisture content in the soil, thereby realizing the qualitative and quantitative monitoring of the moisture content of the surrounding soil. The degree of heat diffusion is represented by the temperature characteristic’s value, which is defined as follows: After heating for a period of time, the measured temperature tends to be stable. A certain characteristic time interval is selected, and multiple temperature values measured in this time interval are arithmetically averaged to obtain the temperature average value. Then, the initial temperature is subtracted to obtain the temperature characteristic value. The higher the moisture content of the soil is, the better the thermal conductivity. After the external heat source is provided for heating, the greater the degree of heat diffusion and the greater the amount of diffusion, the less the temperature can be raised and the smaller the temperature characteristic value.
In the early stage of seepage development, the seepage flow was low, and the soil moisture content increased, but there was no obvious seepage phenomenon. The moisture content of the medium near the hidden leakage location will gradually increase with continuous leakage, and the temperature characteristic values of the optical cable in different moisture content environments are not the same, so the seepage can be judged by heating the optical cable and comparing the temperature characteristic value. The occurrence of leakage events, and the specific location of leakage, can be located. When the leakage has reached a certain scale, an obvious seepage phenomenon is formed at the leakage location, and the vicinity of the leakage has been saturated. By heating the optical cable and establishing the relationship between the flow velocity and the temperature characteristic value, the mathematical expression of the flow velocity and the temperature characteristic value is derived. When the temperature characteristic value changes, the corresponding flow velocity can be obtained according to the corresponding fitting formula to judge the extent of the leakage. According to the specific situation, the identification and semiquantitative analysis of the leakage location are formed.
3. Leakage Test of Heatable Temperature-Sensing Optical Cables under Different Moisture Content Media (Sand, Phosphorus Slag)
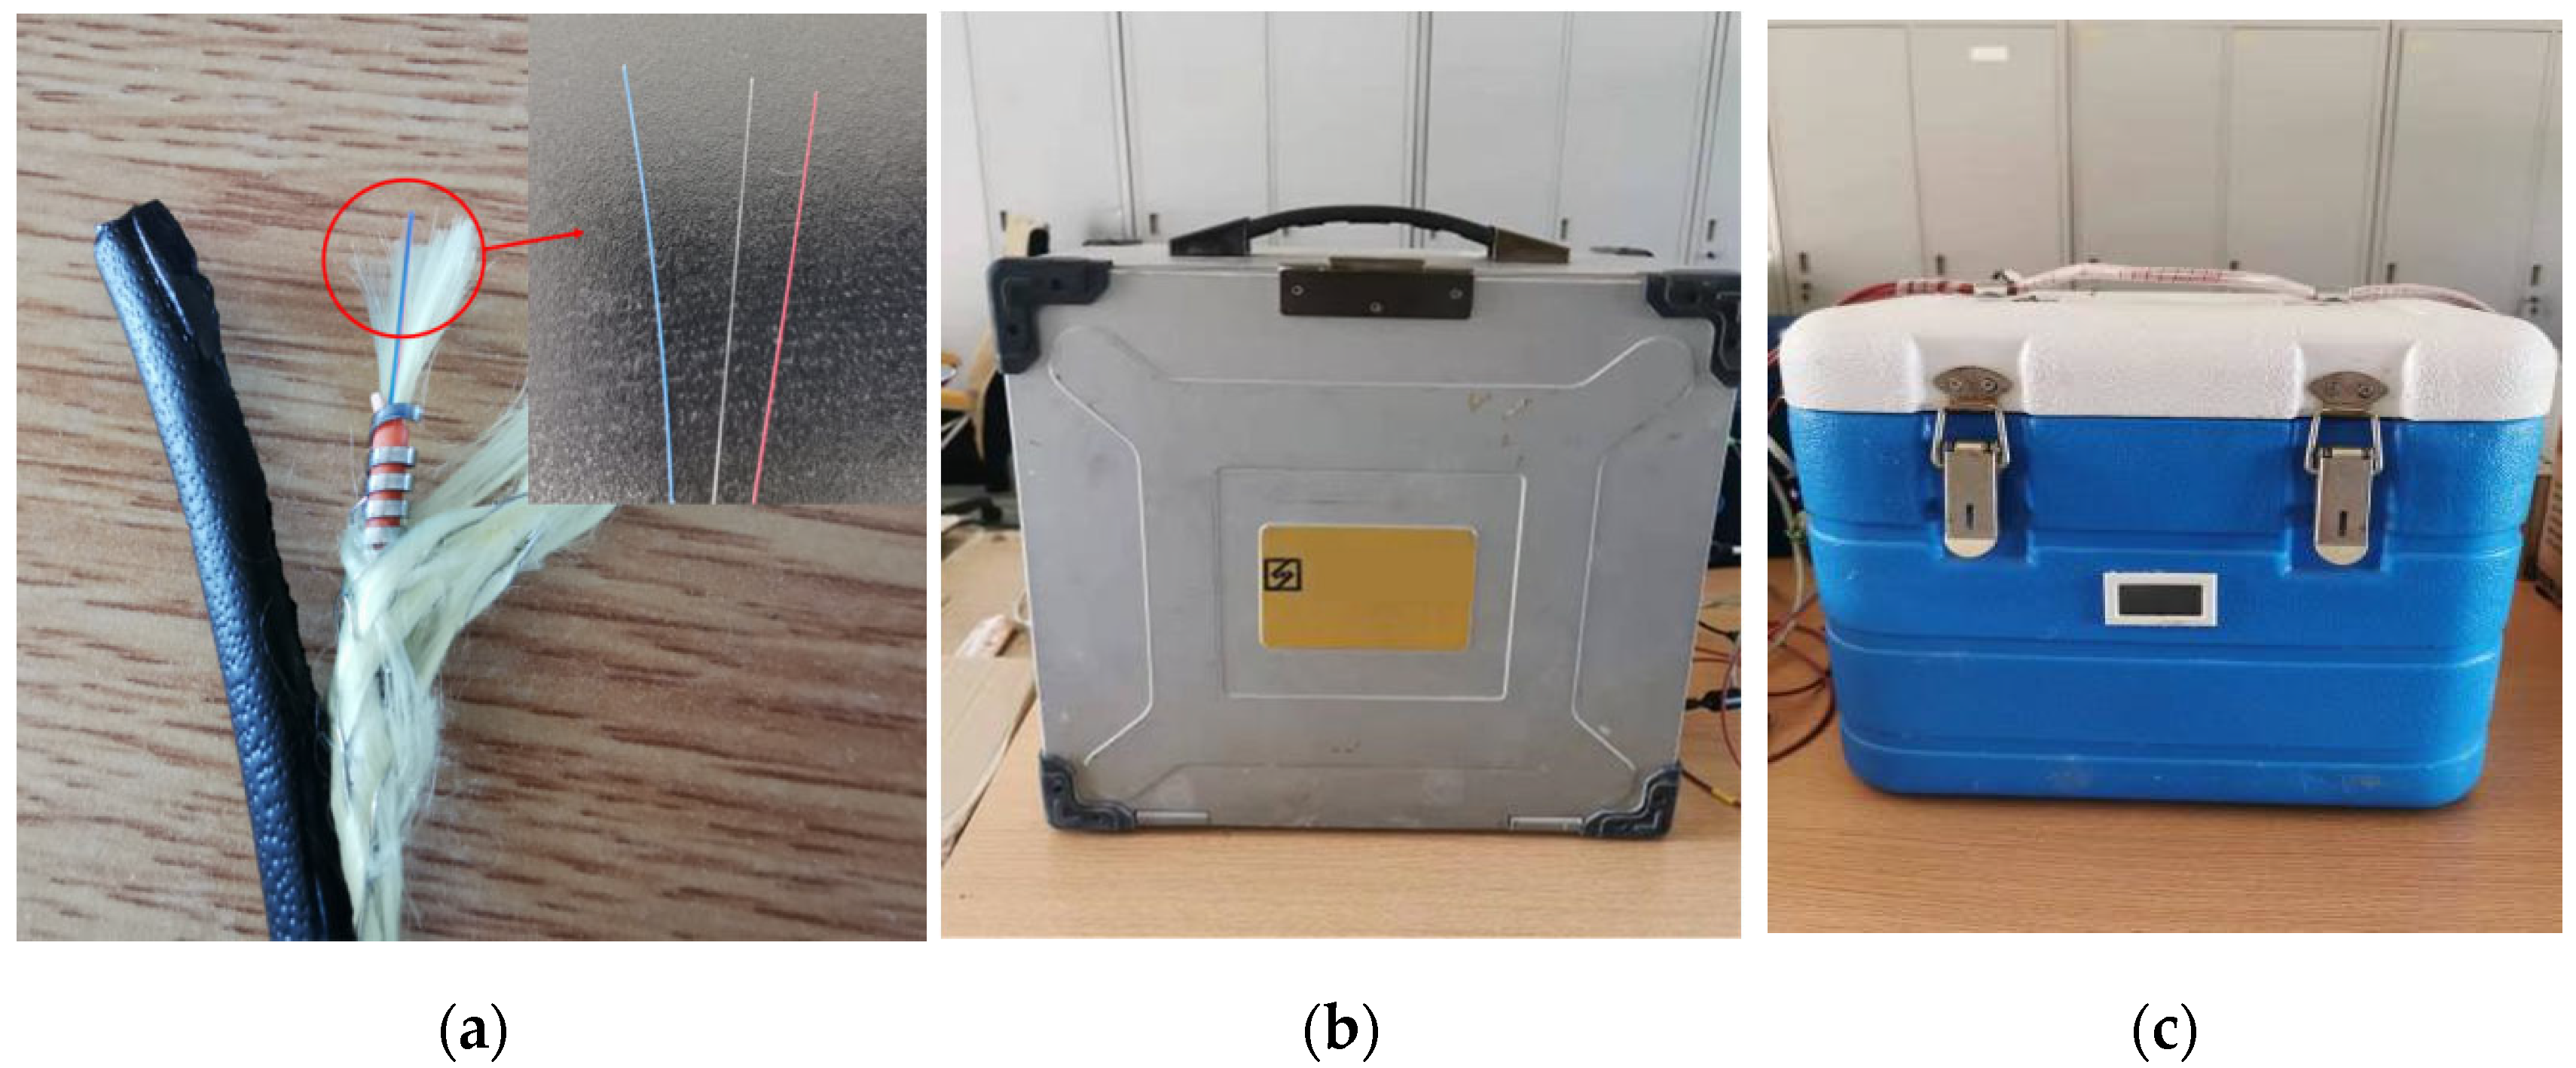
The heatable temperature-sensing optical cable selected in this test is a copper mesh heatable temperature-sensing optical cable. Its outermost layer is a black sheath, the second layer is a braided copper wire mesh wrapped with Kevlar, and the third layer is an armored tube with a sheathe and Kevlar fiber inside. The blue cable is multimode 62.5/125, the white is multimode 50/125, and the red is a single-mode cable. The average resistance of the optical cable is 0.08 Ω. When the above heatable temperature-sensing optical cable is not heated, it is regarded as a conventional temperature-sensing optical cable. The demodulation device is a DTS demodulator (suitable for the 62.5/125 fiber type), and a temperature compensation box is connected at the same time. The main test equipment used in the test is shown in Figure 3.
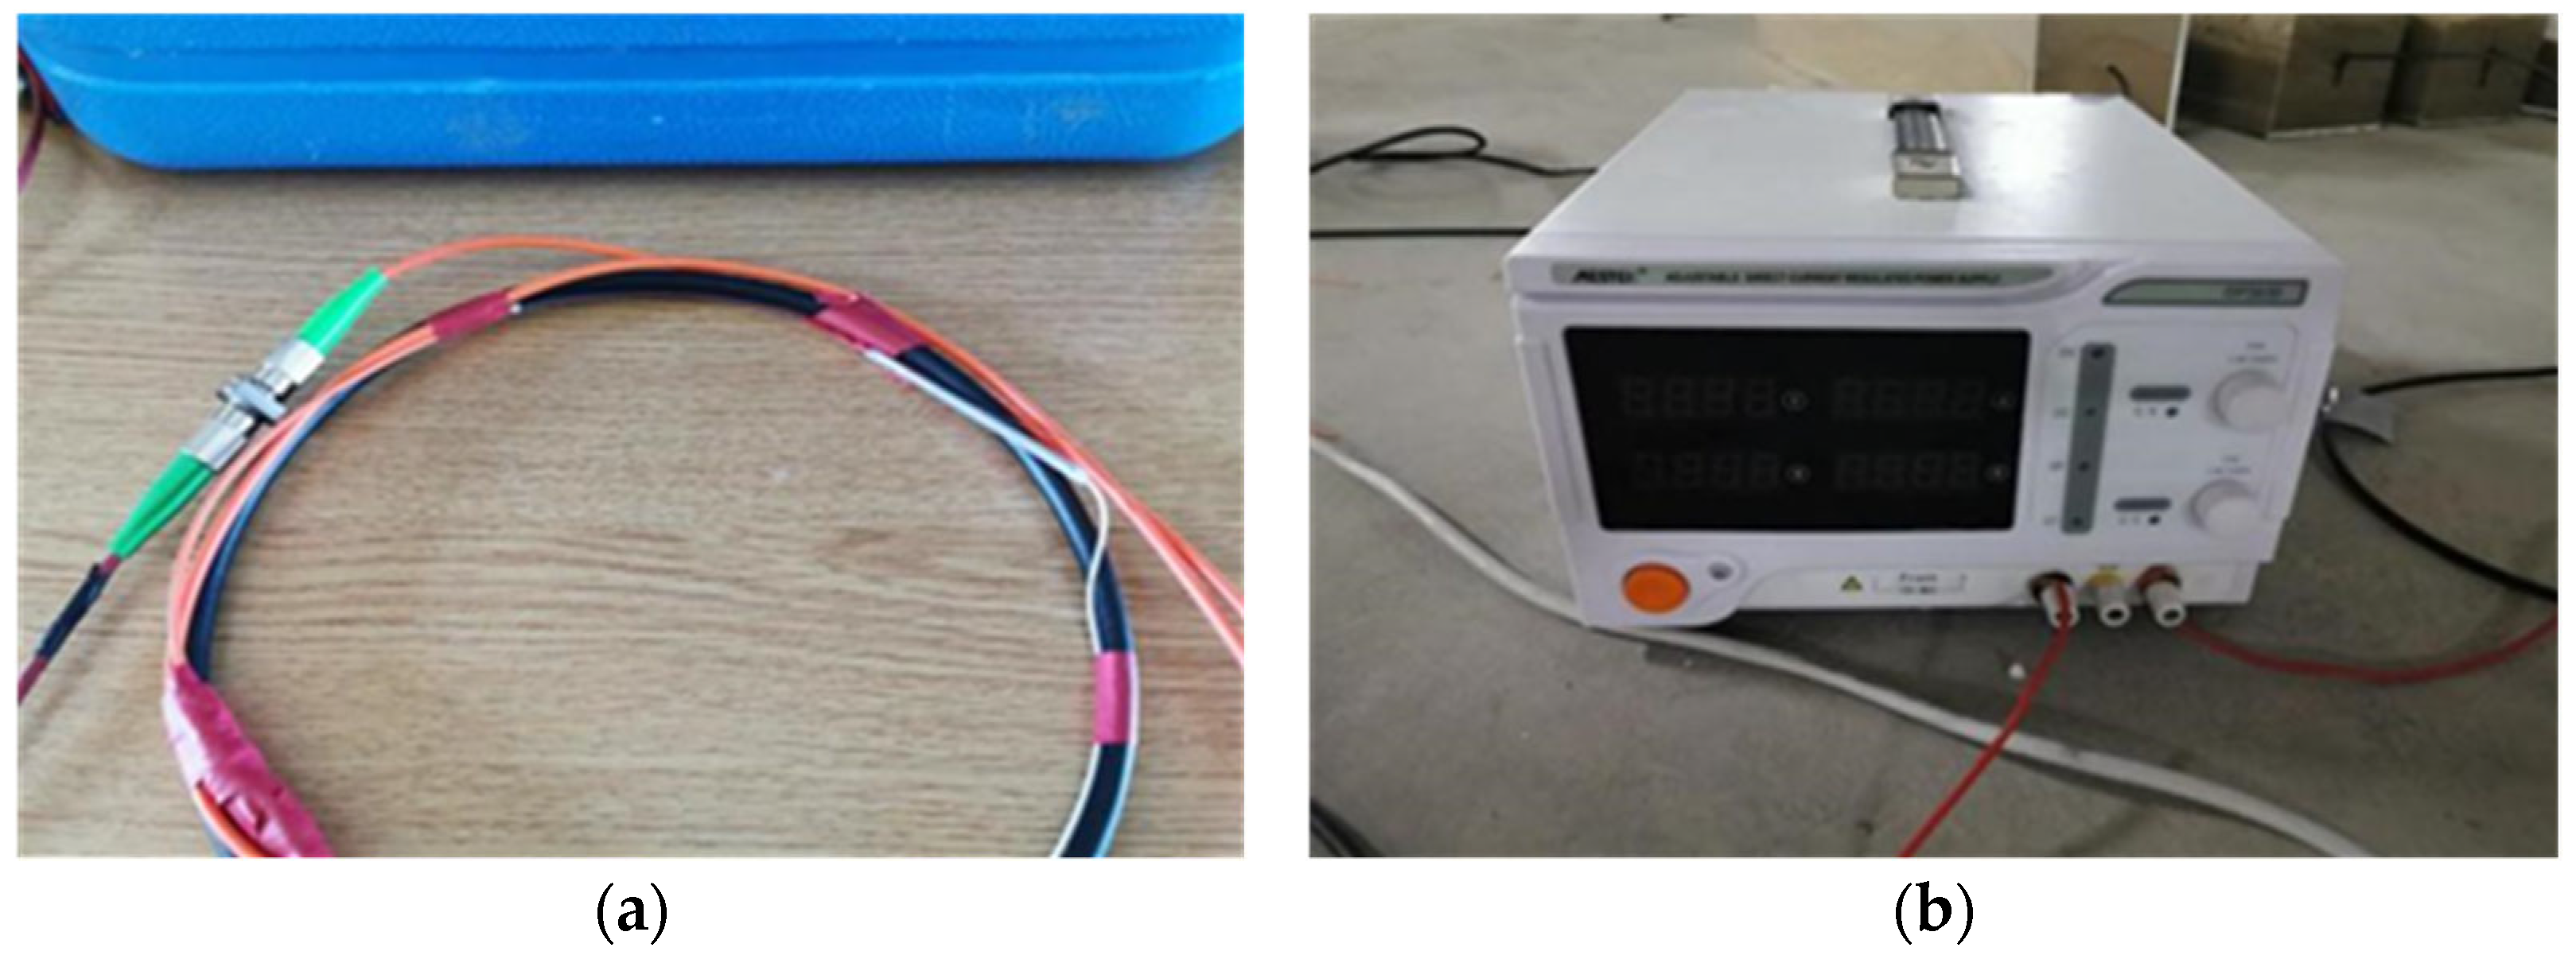
One end of the temperature-measuring cable is connected with the jumper through a fusion splicer, and the other end of the jumper is connected with the port of the temperature compensation box, as shown in Figure 4a. Then, the other port of the temperature compensation box is connected to the channel port of the DTS demodulator. One end of the data communication line is connected to the temperature compensation box, and the other end is connected to the USB interface corresponding to the DTS host. The copper wires at both ends of the heatable temperature-sensing optical cable are connected to the DC power supply through external copper wires to form a heatable loop, as shown in Figure 4b.
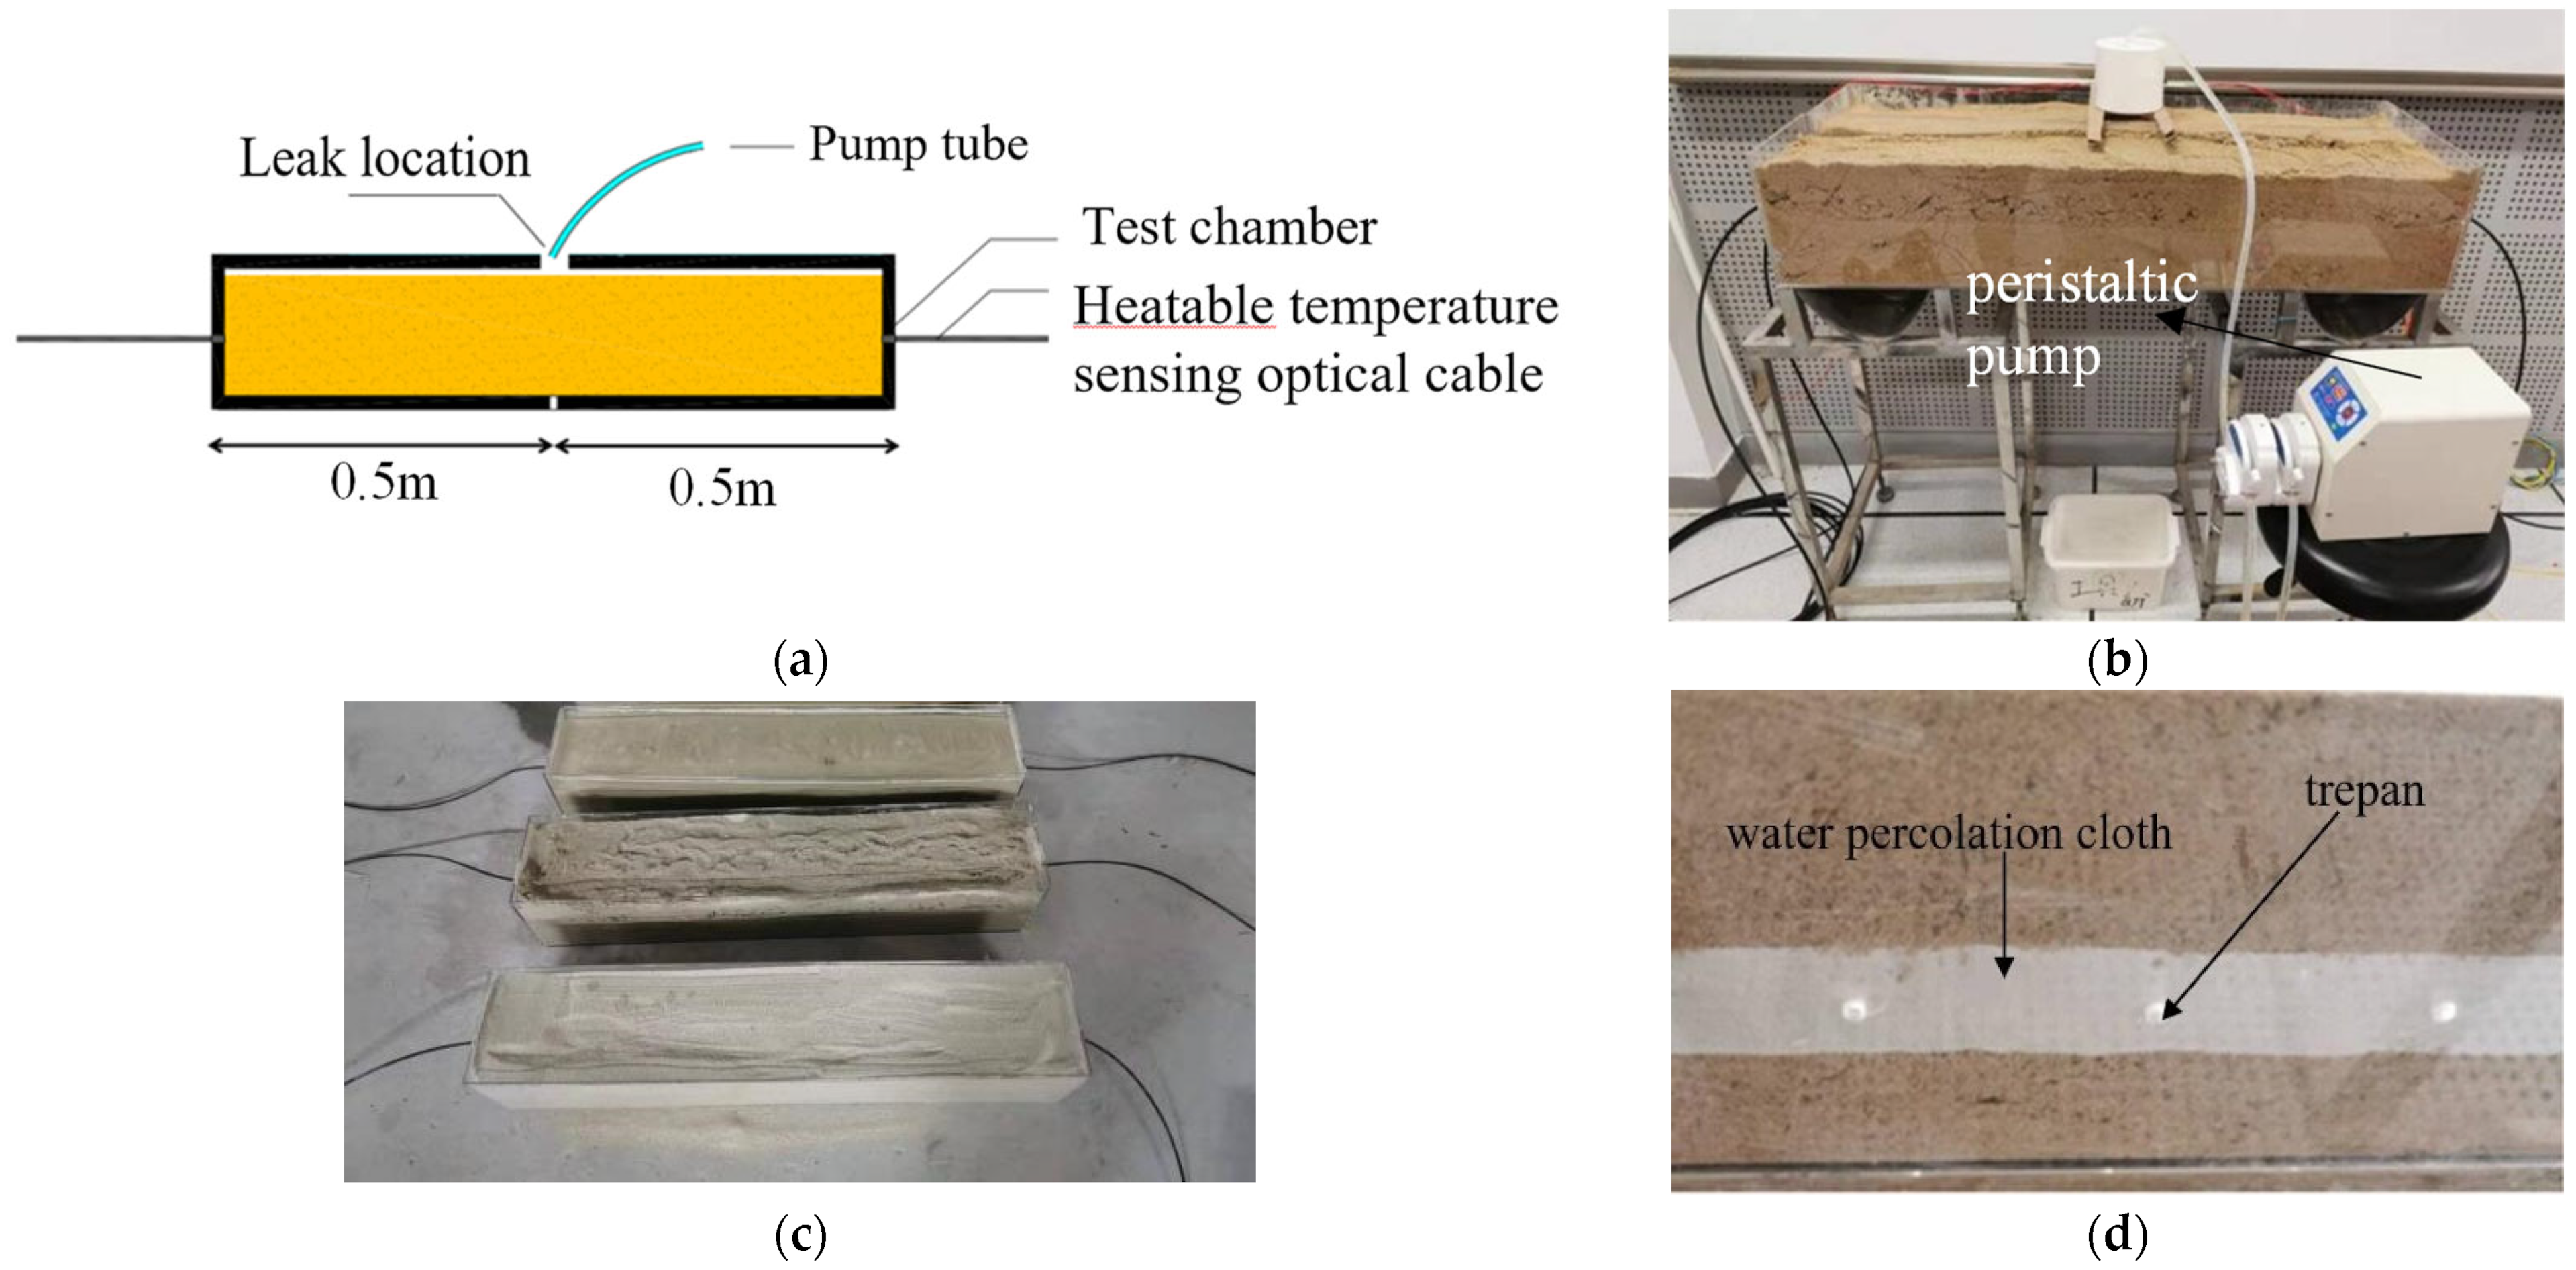
A pump tube is placed above the leakage position, and the other side of the pump tube is connected to the peristaltic pump. By controlling the peristaltic pump, the water flow enters the pump tube and flows out at the leakage position, and the water diffuses downward in the medium to simulate leakage, as shown in Figure 5a,b. The size of the acrylic box is 1 m × 0.2 m × 0.2 m, and the optical cable is straightened and buried in the medium, as shown in Figure 5c. At the same time, holes are also opened at the bottom of the box, and a permeable cloth is placed to observe whether water seeps during the leakage test, as shown in Figure 5d.
The test steps are as follows:
- (1)
- Build a test device, fill the acrylic box with the medium, and bury the optical cable in the box to straighten and fix it;
- (2)
- Before the official start of the test, check all equipment to ensure that it is operating normally and collecting data synchronously;
- (3)
- Use a hot air gun to heat the medium, observe the real-time temperature data of the DTS demodulator, and locate the part of the optical cable in the acrylic box. After the temperature of the heatable temperature-sensing optical cable has stabilized, a heating power of 5 w/m was applied to raise the temperature to a steady state. Then, the peristaltic pump was activated to start the leakage test. The speed of the peristaltic pump is controlled to 30 rpm, and the temperature curve is observed. After the temperature drops to a stable state, stop the test.
- (4)
- Process the test data, analyze the overall temperature change curve of the heatable temperature-sensing optical cable in the test section and the temperature change curve at the leakage point, and evaluate the identification effect of the heatable temperature-sensing cable under leakage conditions.
We tested the working conditions shown in Table 1 in turn and repeated the test steps. We analyzed and compared the temperature characteristic values of the optical cable in different media (sand and phosphorus slag) and the temperature change law of leakage, evaluated the leakage identification effect of the heatable temperature-sensing optical cable in dry medium, and analyzed and evaluated the leakage identification effect. The temperature response law of the heatable optical cable under different moisture contents was also observed.
3.1. Comparison of the Temperature Measurement Results of Different Media in the Dry State
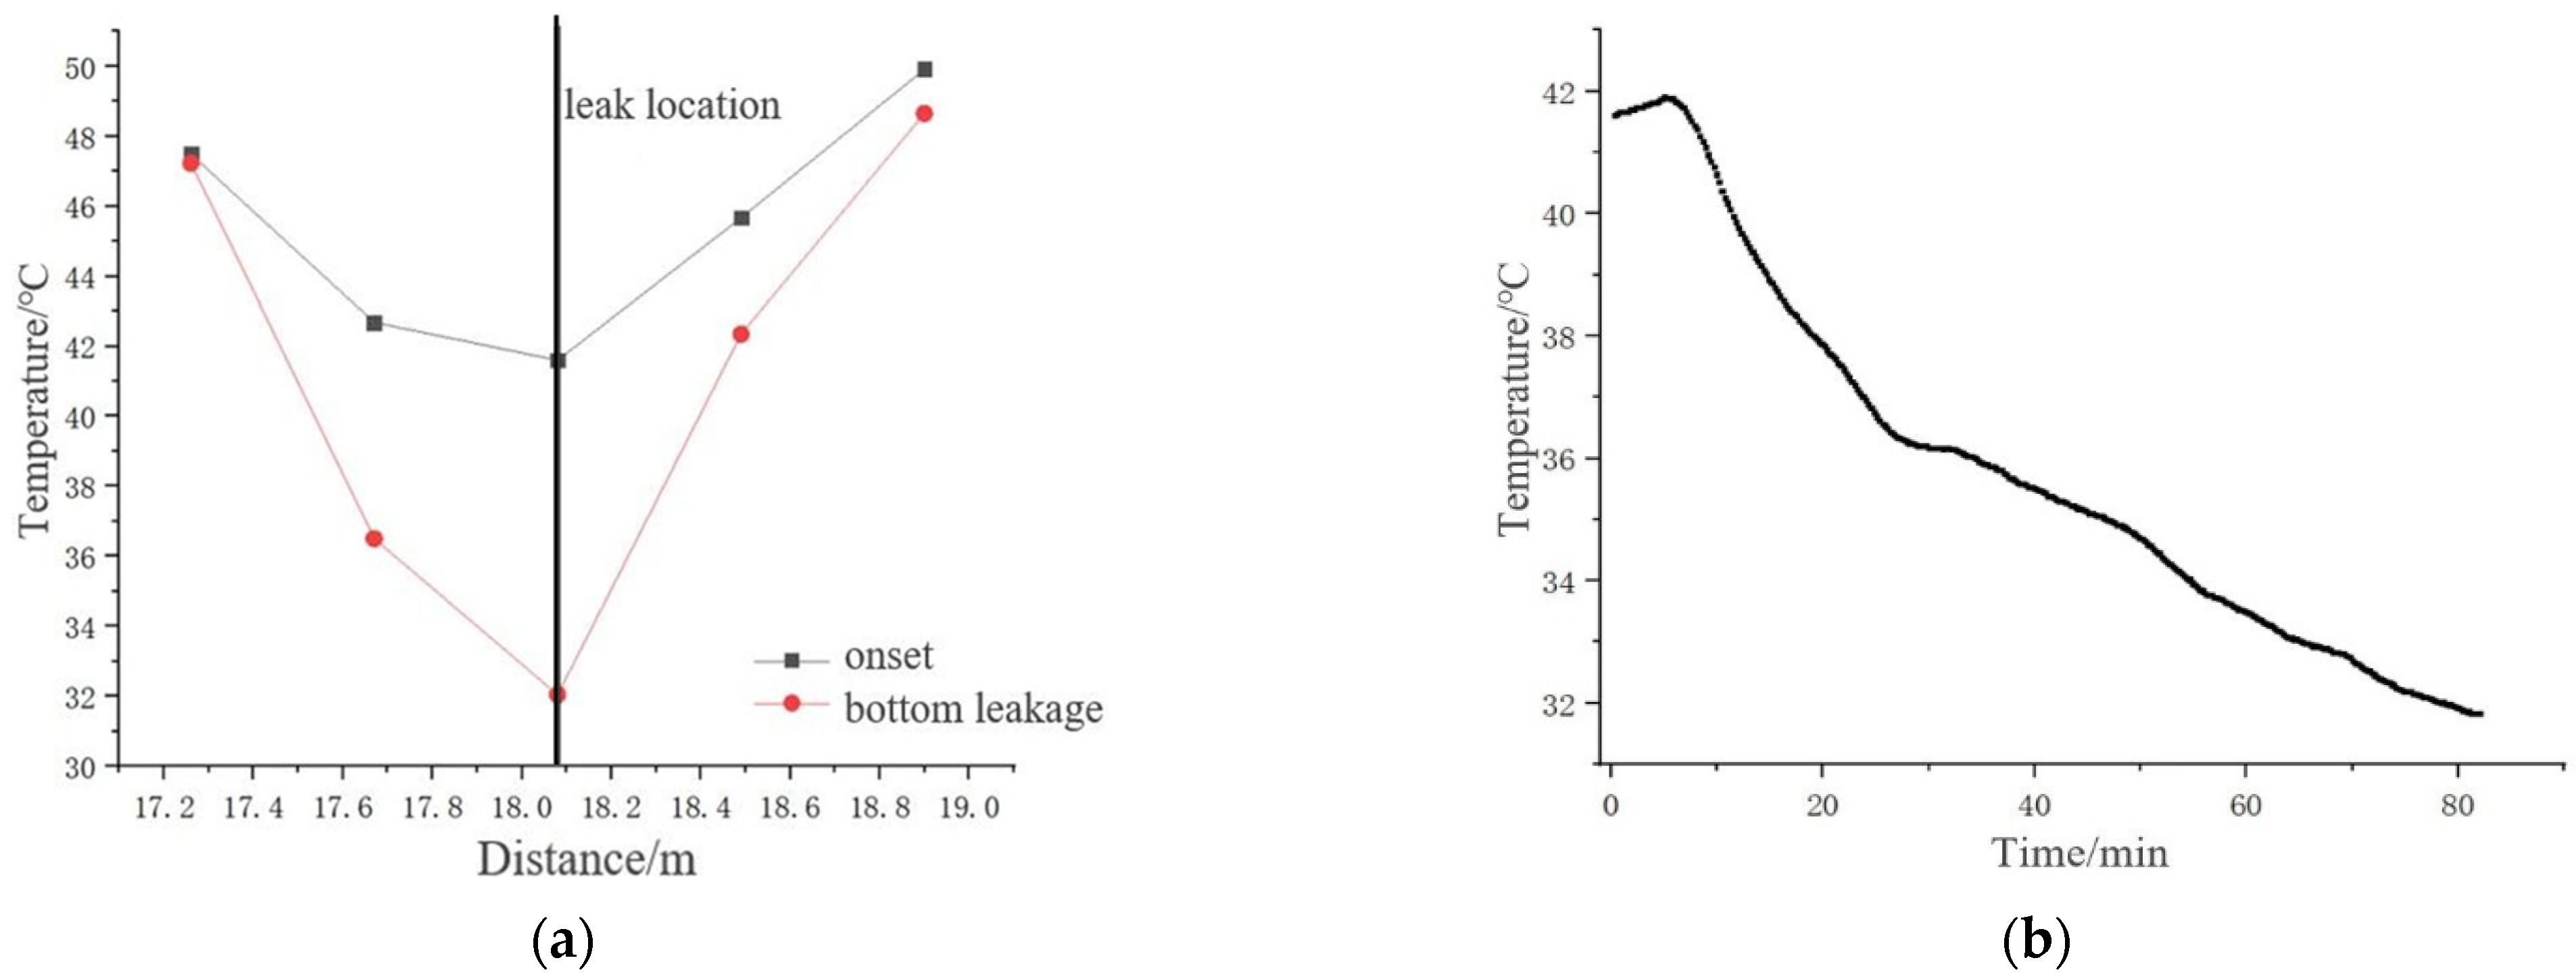
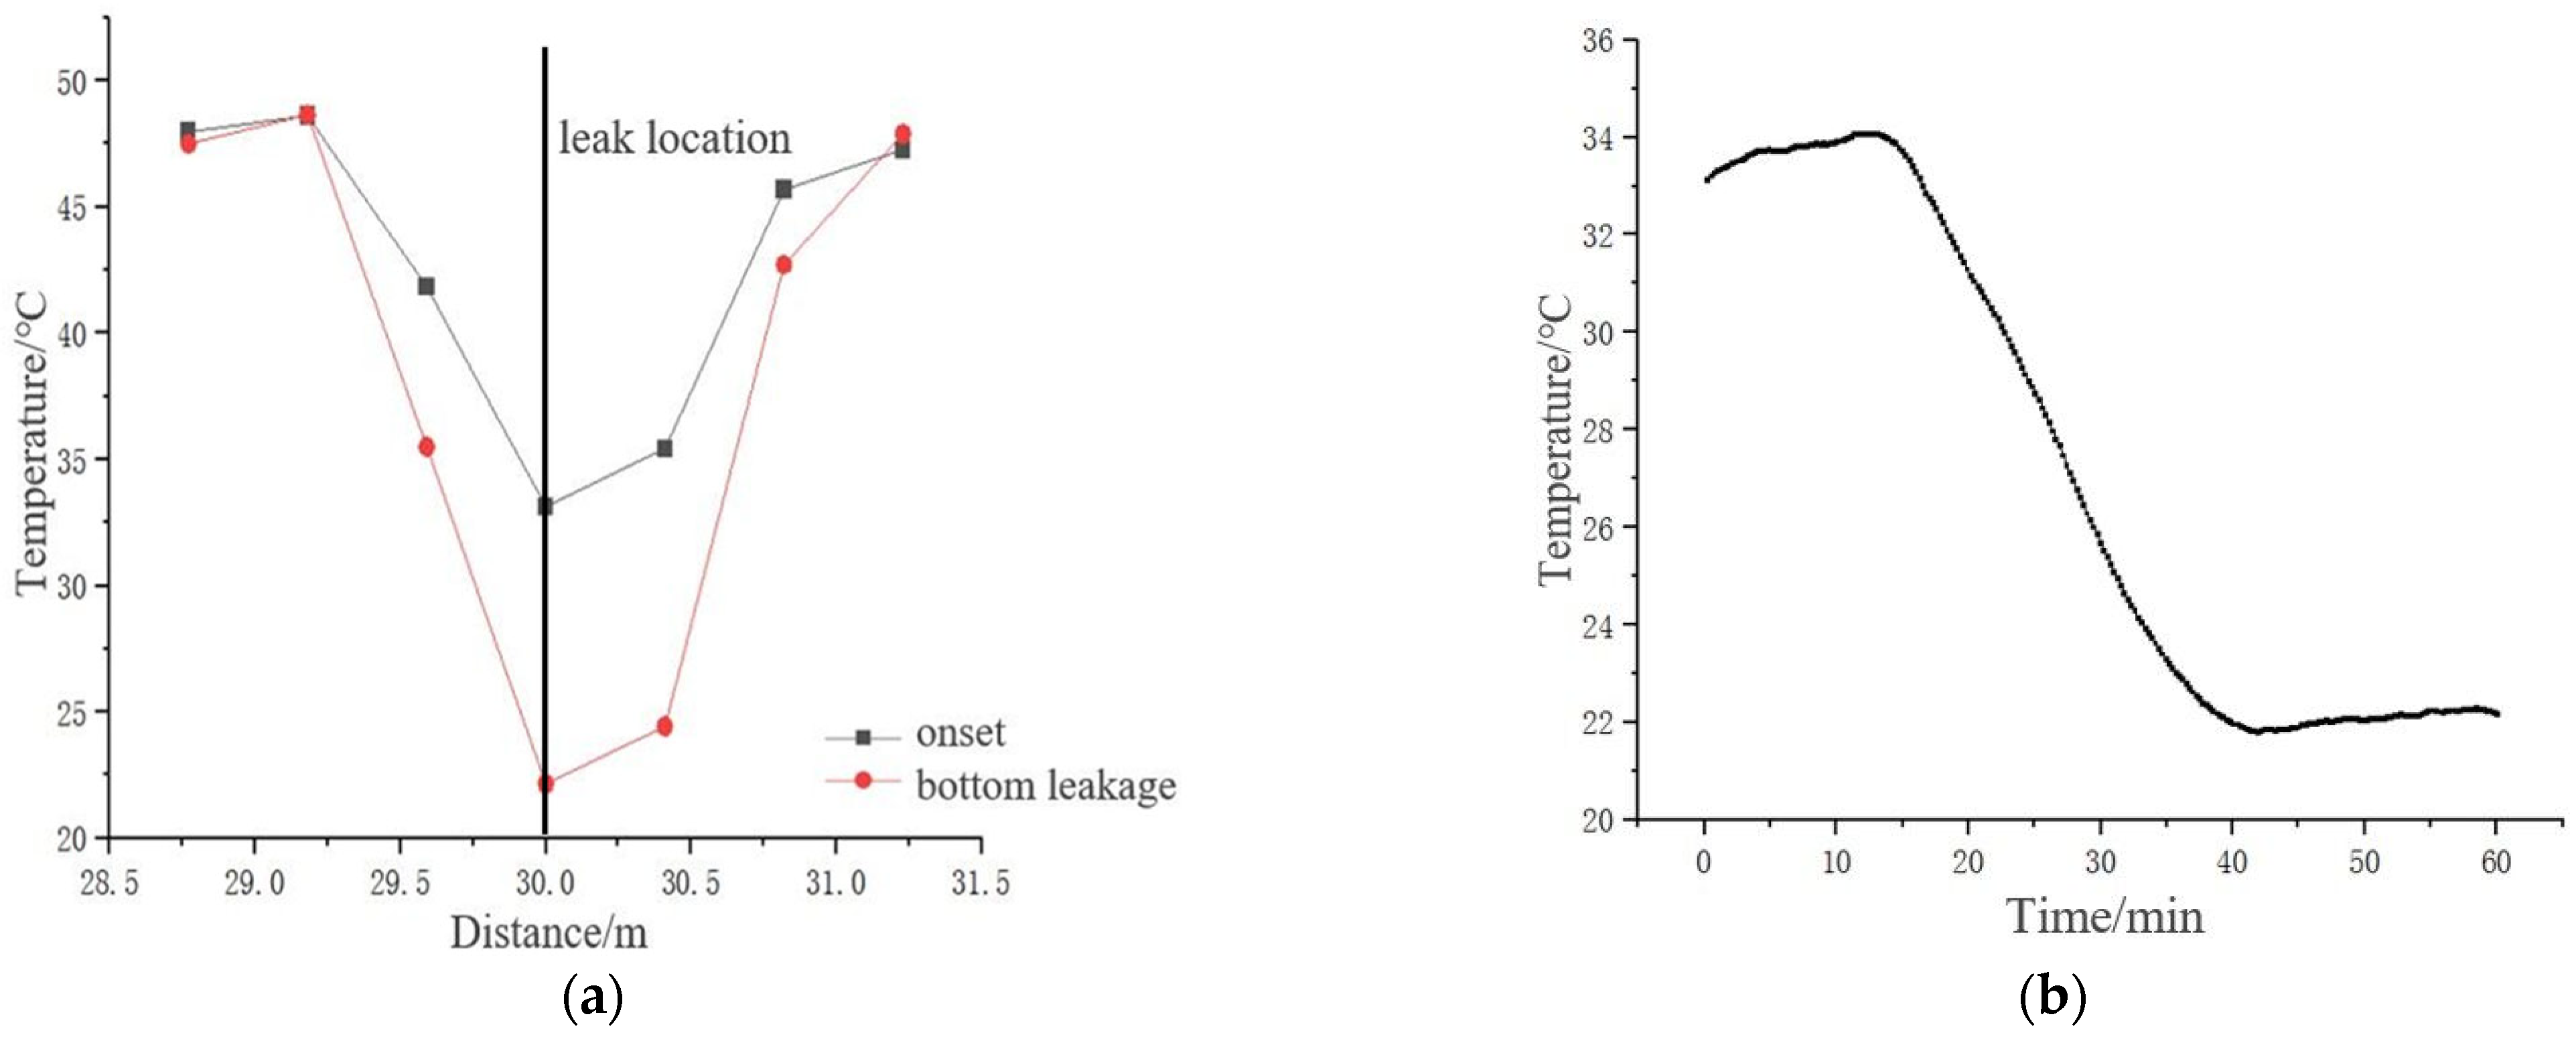
The temperature change curve at the leakage position of the optical cable in the sand medium is shown in Figure 6. The figure shows that the temperature of the optical cable changes very little before and after the leakage occurs. Based on this, the heating power was increased to 10 w/m, and the test was repeated while maintaining the same leakage conditions. The results are shown in Figure 7. For the fiber optic cable in phosphorus slag medium, the temperature change curve at the leakage position is shown in Figure 8, and the heating power is the same as that in the sandy soil, which is 10 w/m.
It can be seen from Figure 7 that the optical cable is in the dry sand medium, from the beginning of the simulated leakage to the water seepage at the bottom, and the entire leakage process is approximately 80 min. Under a heating power of 10 w/m, when leakage occurs, the temperature at the leakage position drops by approximately 10 °C, and the temperature change gradually becomes slower as the leakage continues. It can be seen from Figure 8 that when the optical cable is in the dry phosphorus slag medium, under the heating power of 10 w/m, when leakage occurs, the temperature at the leakage position remains stable for a period of time before it begins to drop, and the drop is by approximately 12 °C. The temperature change gradually slows down as the leakage continues and finally tends to be stable. However, during the whole process, there was no water leakage at the bottom, and on the surface of the device, stratification of phosphorus slag and water appeared, as shown in Figure 9. The reason for this is that after the phosphorus slag encounters water, its cohesiveness becomes very high, resulting in poor water permeability. Eventually, the phenomenon of delamination is formed.
3.2. Comparison of the Temperature Measurement Results of Different Media in the Unsaturated State
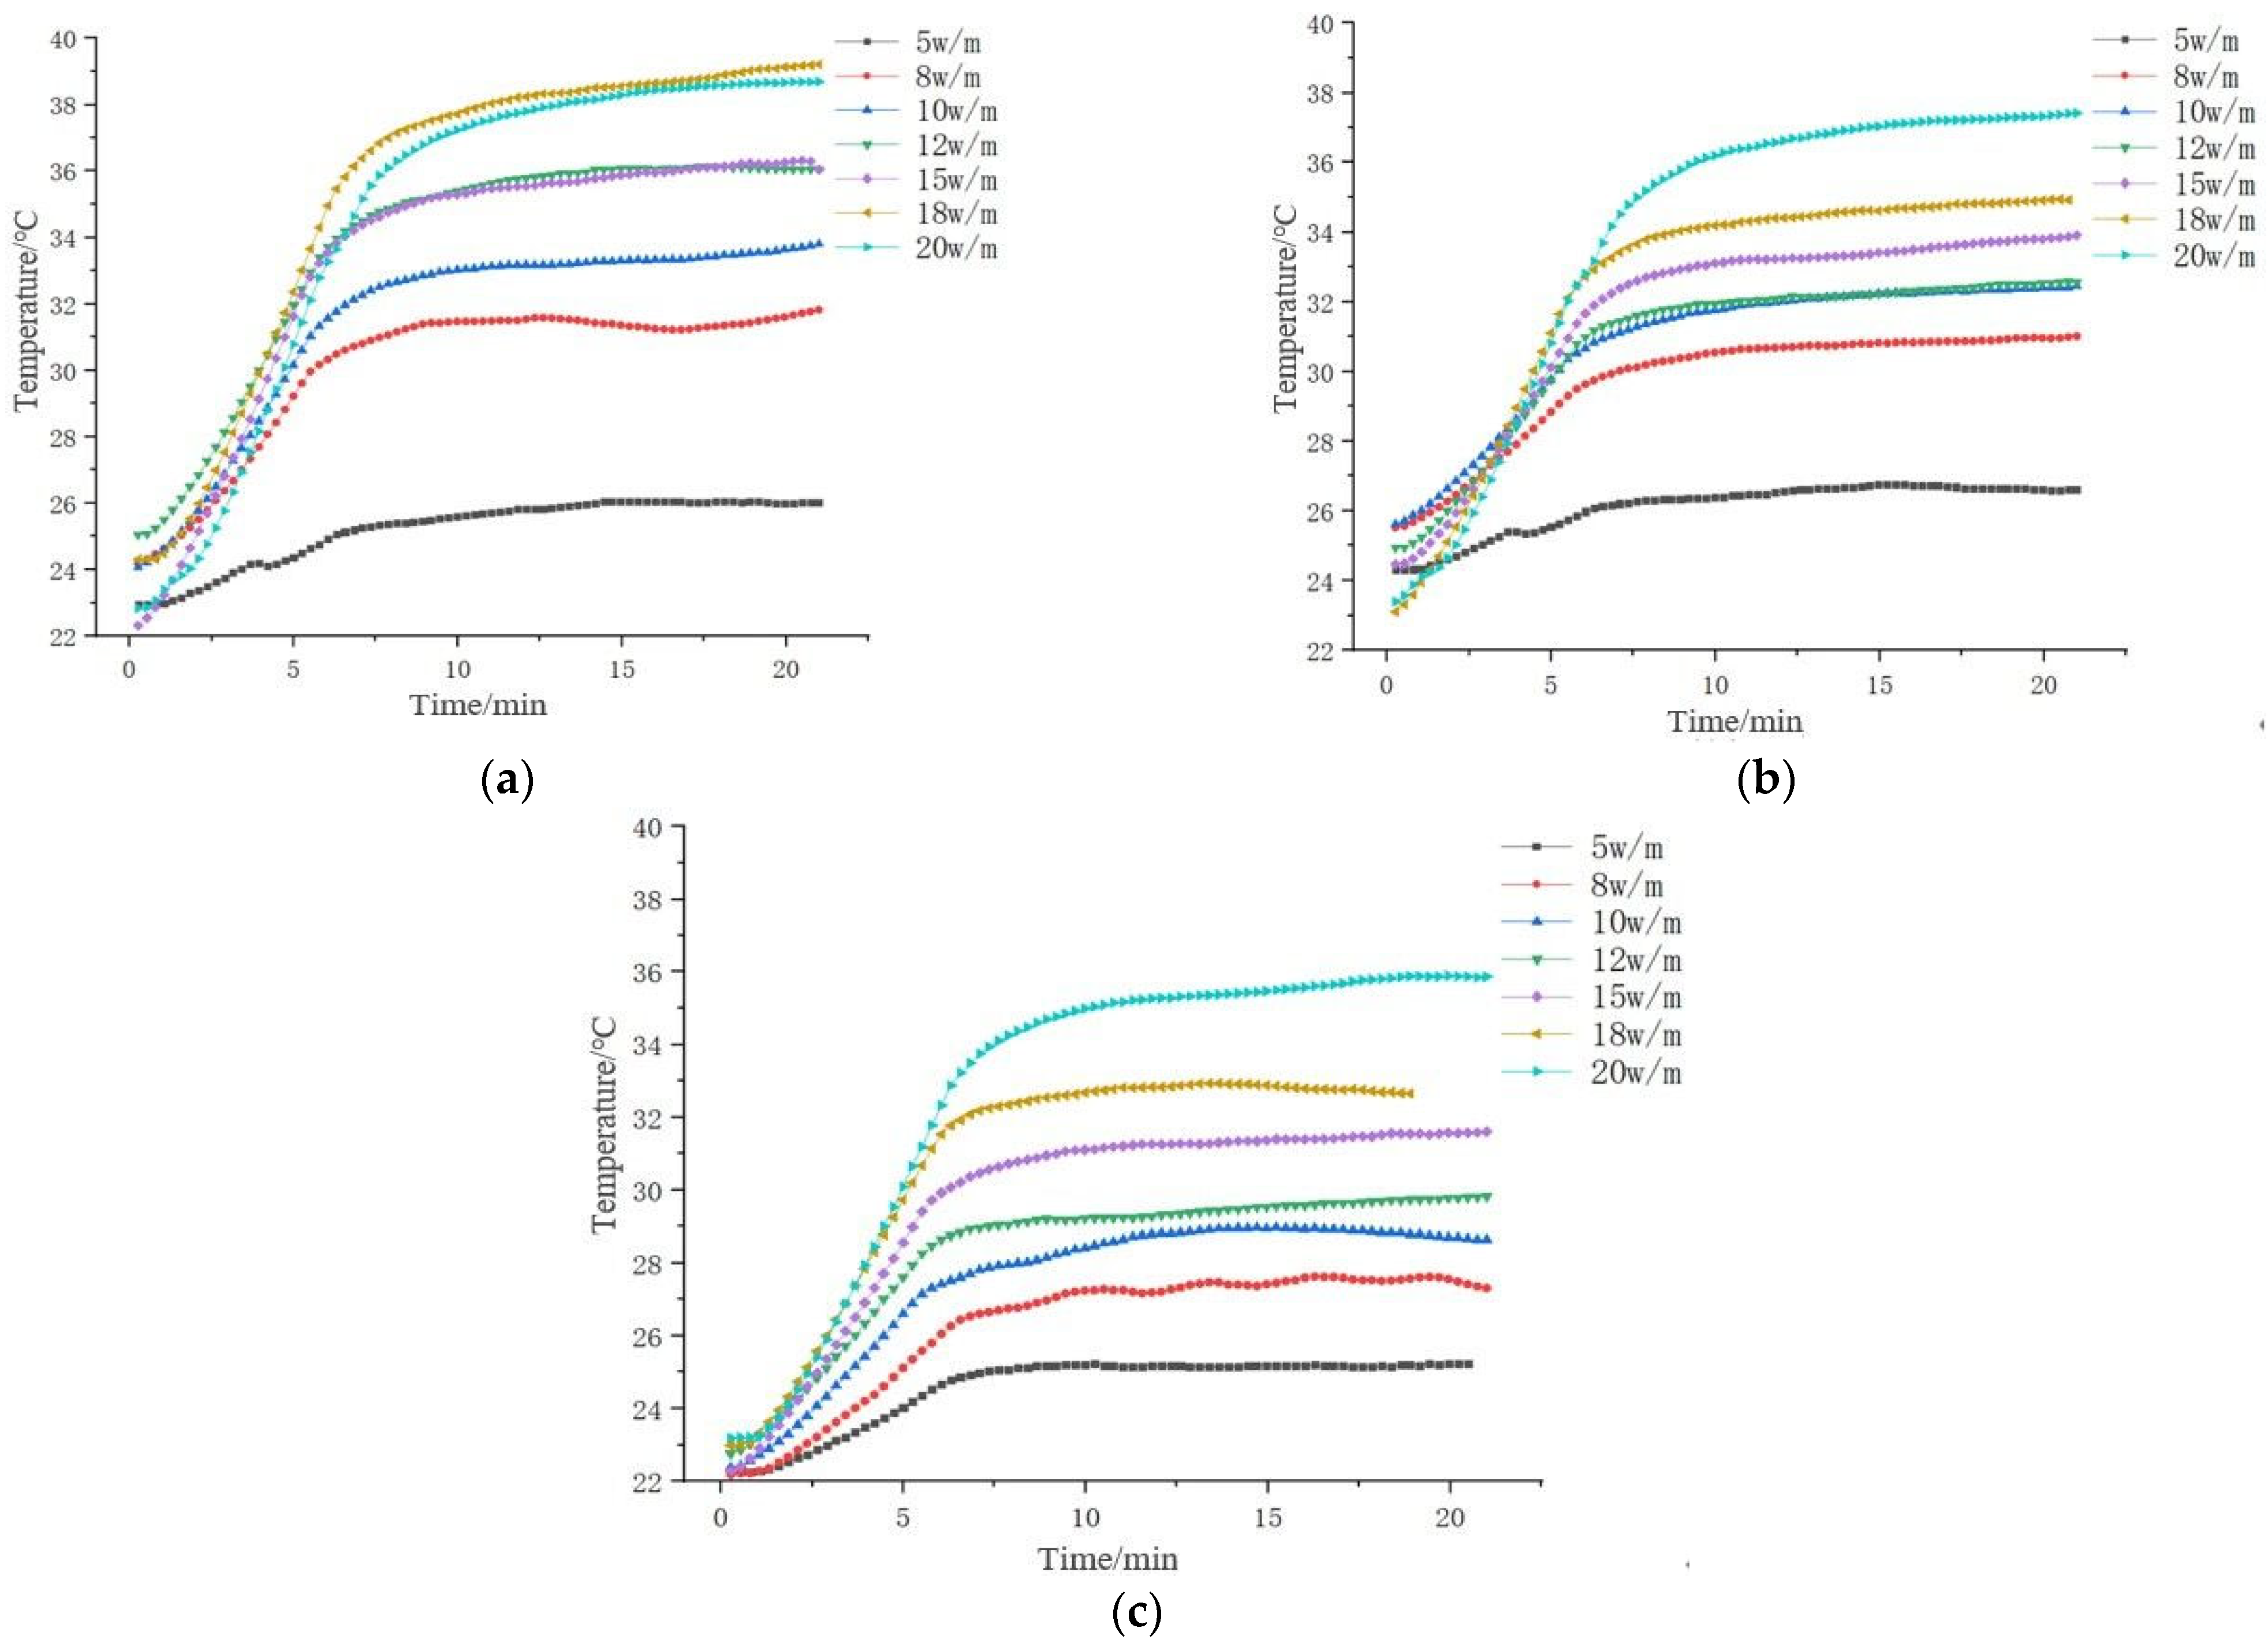
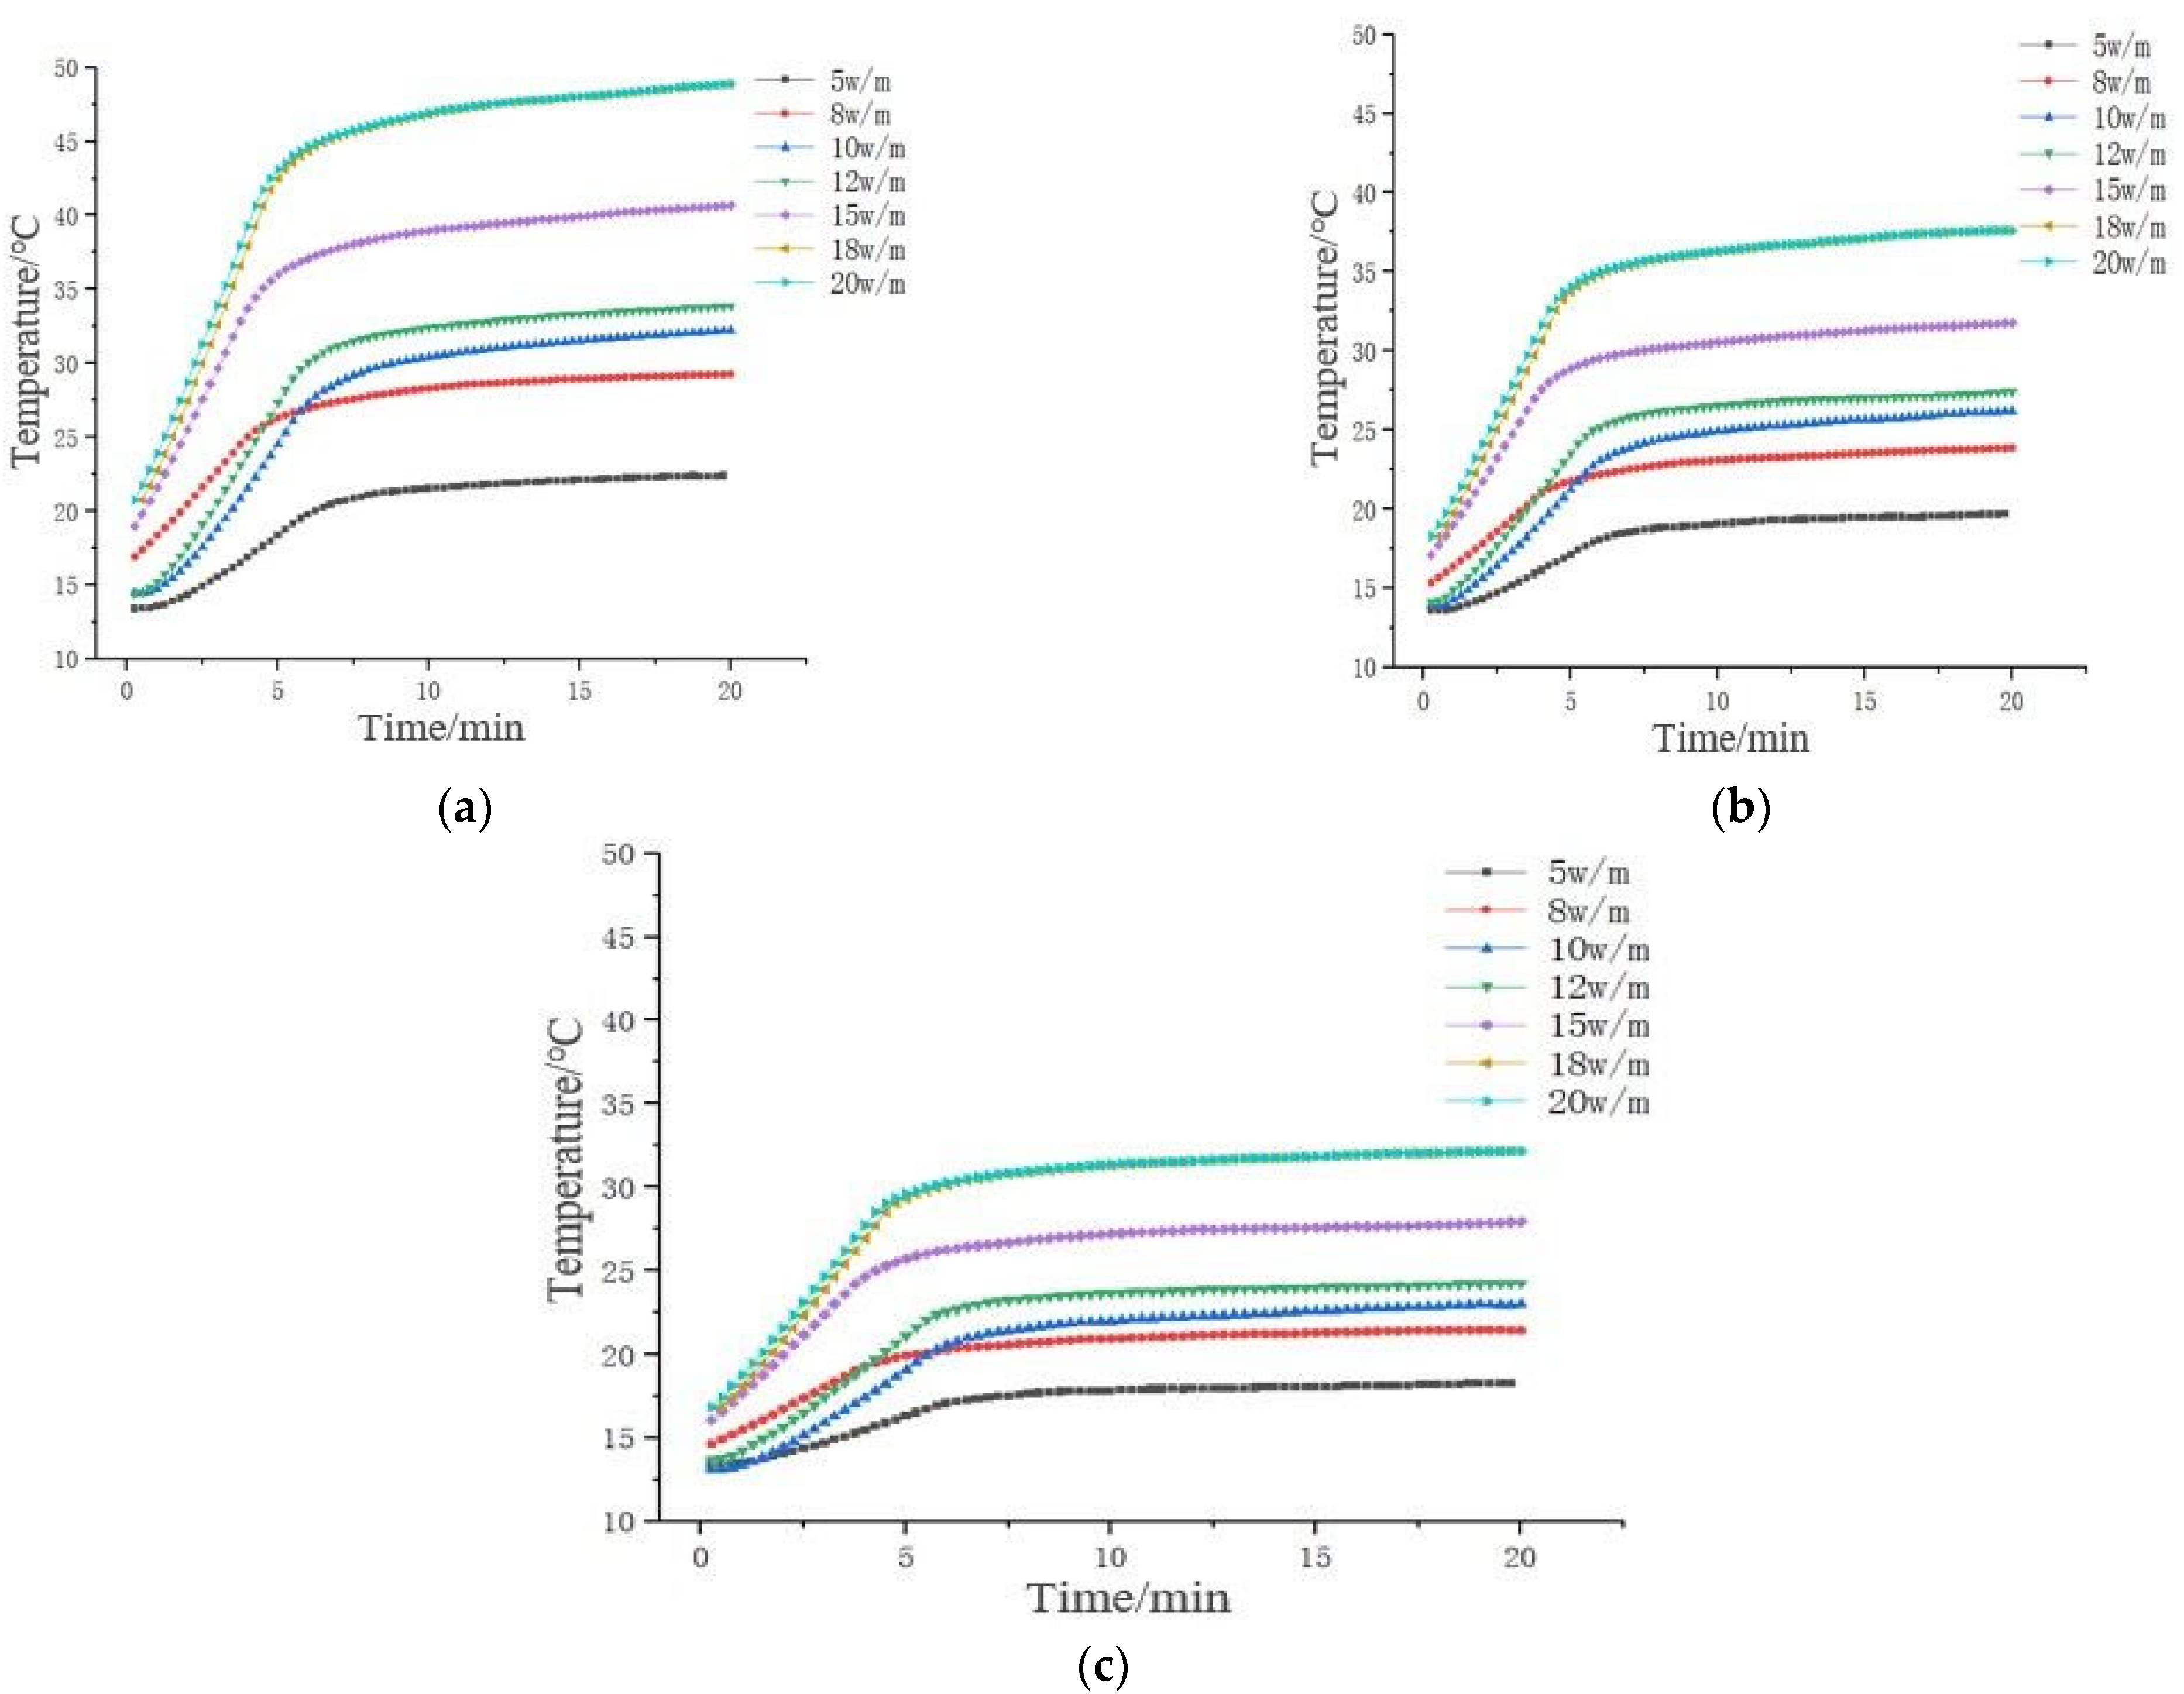
In the environment of different soil moisture contents, the temperature change curves of the optical cable under different heating powers are shown in Figure 10 and Figure 11. Figure 10 and Figure 11 show that the temperature rise law of the optical cable in the unsaturated medium also gradually increases first and then gradually stabilizes; the temperature characteristic values of the optical cable in the unsaturated medium all increase with the increasing heating power, and the heating is stable. The time is approximately 15 min.
The increases in the temperature of sand with different moisture contents and phosphorus slag under different heating powers are shown in Table 2 and Table 3. The saturated moisture contents of sand and phosphorus slag were determined to be 24% and 34%, respectively. Table 2 shows that when the heating power is 12 w/m, the increase in temperature of the optical cable in the sand with an 8% moisture content and with a 20% moisture content differs by 4.36 °C, and there is a significant temperature difference. The minimum heating power for effectively identifying the leakage of the optical cable is 12 w/m in sandy soil with an 8% moisture content. When the heating power reaches 20 w/m, the temperature rise of the optical cable in the sand with a 14% moisture content and 20% moisture content is only 1.35 °C, and there is no obvious temperature difference. This result shows that under the sandy soil with 14% moisture content, a heating power within 20 w/m cannot effectively identify the leakage.
It can be seen from Table 3 that when the heating power is 5 w/m, the increase in temperature of the optical cable in the phosphorus slag with a moisture content of 14% and a moisture content of 34% (saturated state) differs by approximately 4.05 °C, and there is a significant temperature difference. The minimum heating power for effectively identifying leakage is 5 w/m in phosphorus slag with a 14% moisture content. When the heating power reaches 12 w/m, the increase in temperature of the optical cable in the phosphorus slag with a 24% moisture content and a 34% moisture content (saturated state) differs by approximately 2.62 °C, and there is a significant temperature difference. The minimum heating power for effectively identifying the leakage of the optical cable is 12 w/m in phosphorus slag with a moisture content of 24%.
4. Monitoring Test and Quantitative Analysis of the Leakage Velocity of the Heatable Temperature-Sensing Optical Cable
4.1. Test Arrangement and Test Procedure
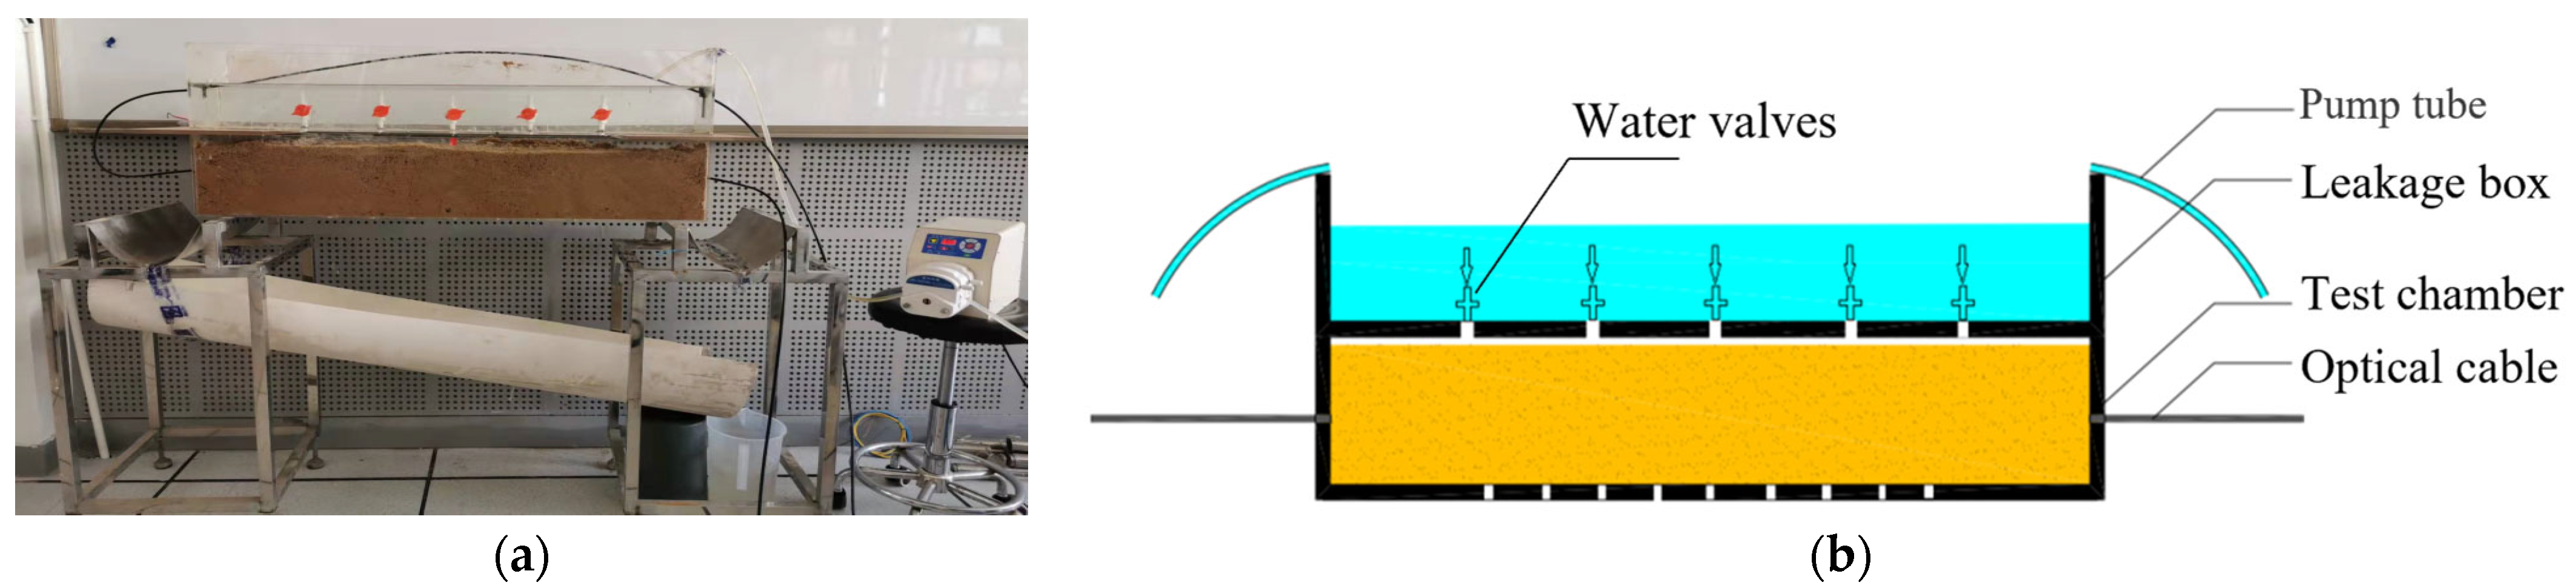
The test setup used to verify the quantitative analysis capability of leakage monitoring based on a heatable optical cable is shown in Figure 12. The seepage device is composed of a leakage box and a water valve, and a peristaltic pump is used to fill the water tank at a constant speed. The speed of water leakage is controlled by adjusting the water valve. There are three rows of holes at the bottom of the acrylic box buried in the sand, and a permeable cloth is placed in the bottom of the acrylic box. An inclined semicircular PVC pipe is placed below the box, and the measuring cylinder is placed at the end to measure the flow rate.
The test steps are as follows:
- (1)
- Fill the saturated sand medium in the acrylic box, bury the temperature-sensing optical cable in the acrylic box, and straighten and fix it;
- (2)
- Connect one end of the optical cable and the jumper together through the fusion splicer, and connect the other end of the jumper to the port of the temperature calibrator. The other port of the temperature calibrator can be connected to the channel port of the DTS demodulator for data communication. Connect one end of the line to the temperature calibration box and the other end to the USB interface corresponding to the DTS host;
- (3)
- Connect the copper wires at both ends of the heatable temperature-sensing optical cable to the DC power supply through external copper wires to form a heatable loop;
- (4)
- Before the simulated leakage starts, check all equipment to ensure that it is operating normally and collecting data synchronously;
- (5)
- Position the part of the optical cable in the acrylic box, which can be heated by a thermal drying gun; observe the real-time temperature data of the DTS demodulator and record the position data;
- (6)
- After the temperature drops to a stable level, turn on the water valve switch and calculate the flow rate through the volume of water in the measuring cylinder at the corresponding time. After the flow rate stabilizes, maintain the flow rate and apply different heating powers (5–10 w/m). Carry out heating, observe the real-time temperature data of the DTS demodulator, and stop heating after the temperature rises to a relatively stable level;
- (7)
- After the temperature drops and stabilizes, change the flow rate by adjusting the water valve, and repeat step (6);
- (8)
- Analyze the test data, compare and analyze the relationship between different flow velocities and temperature characteristic values, and establish a semiquantitative evaluation of leakage velocity.
4.2. Analysis of Test Results
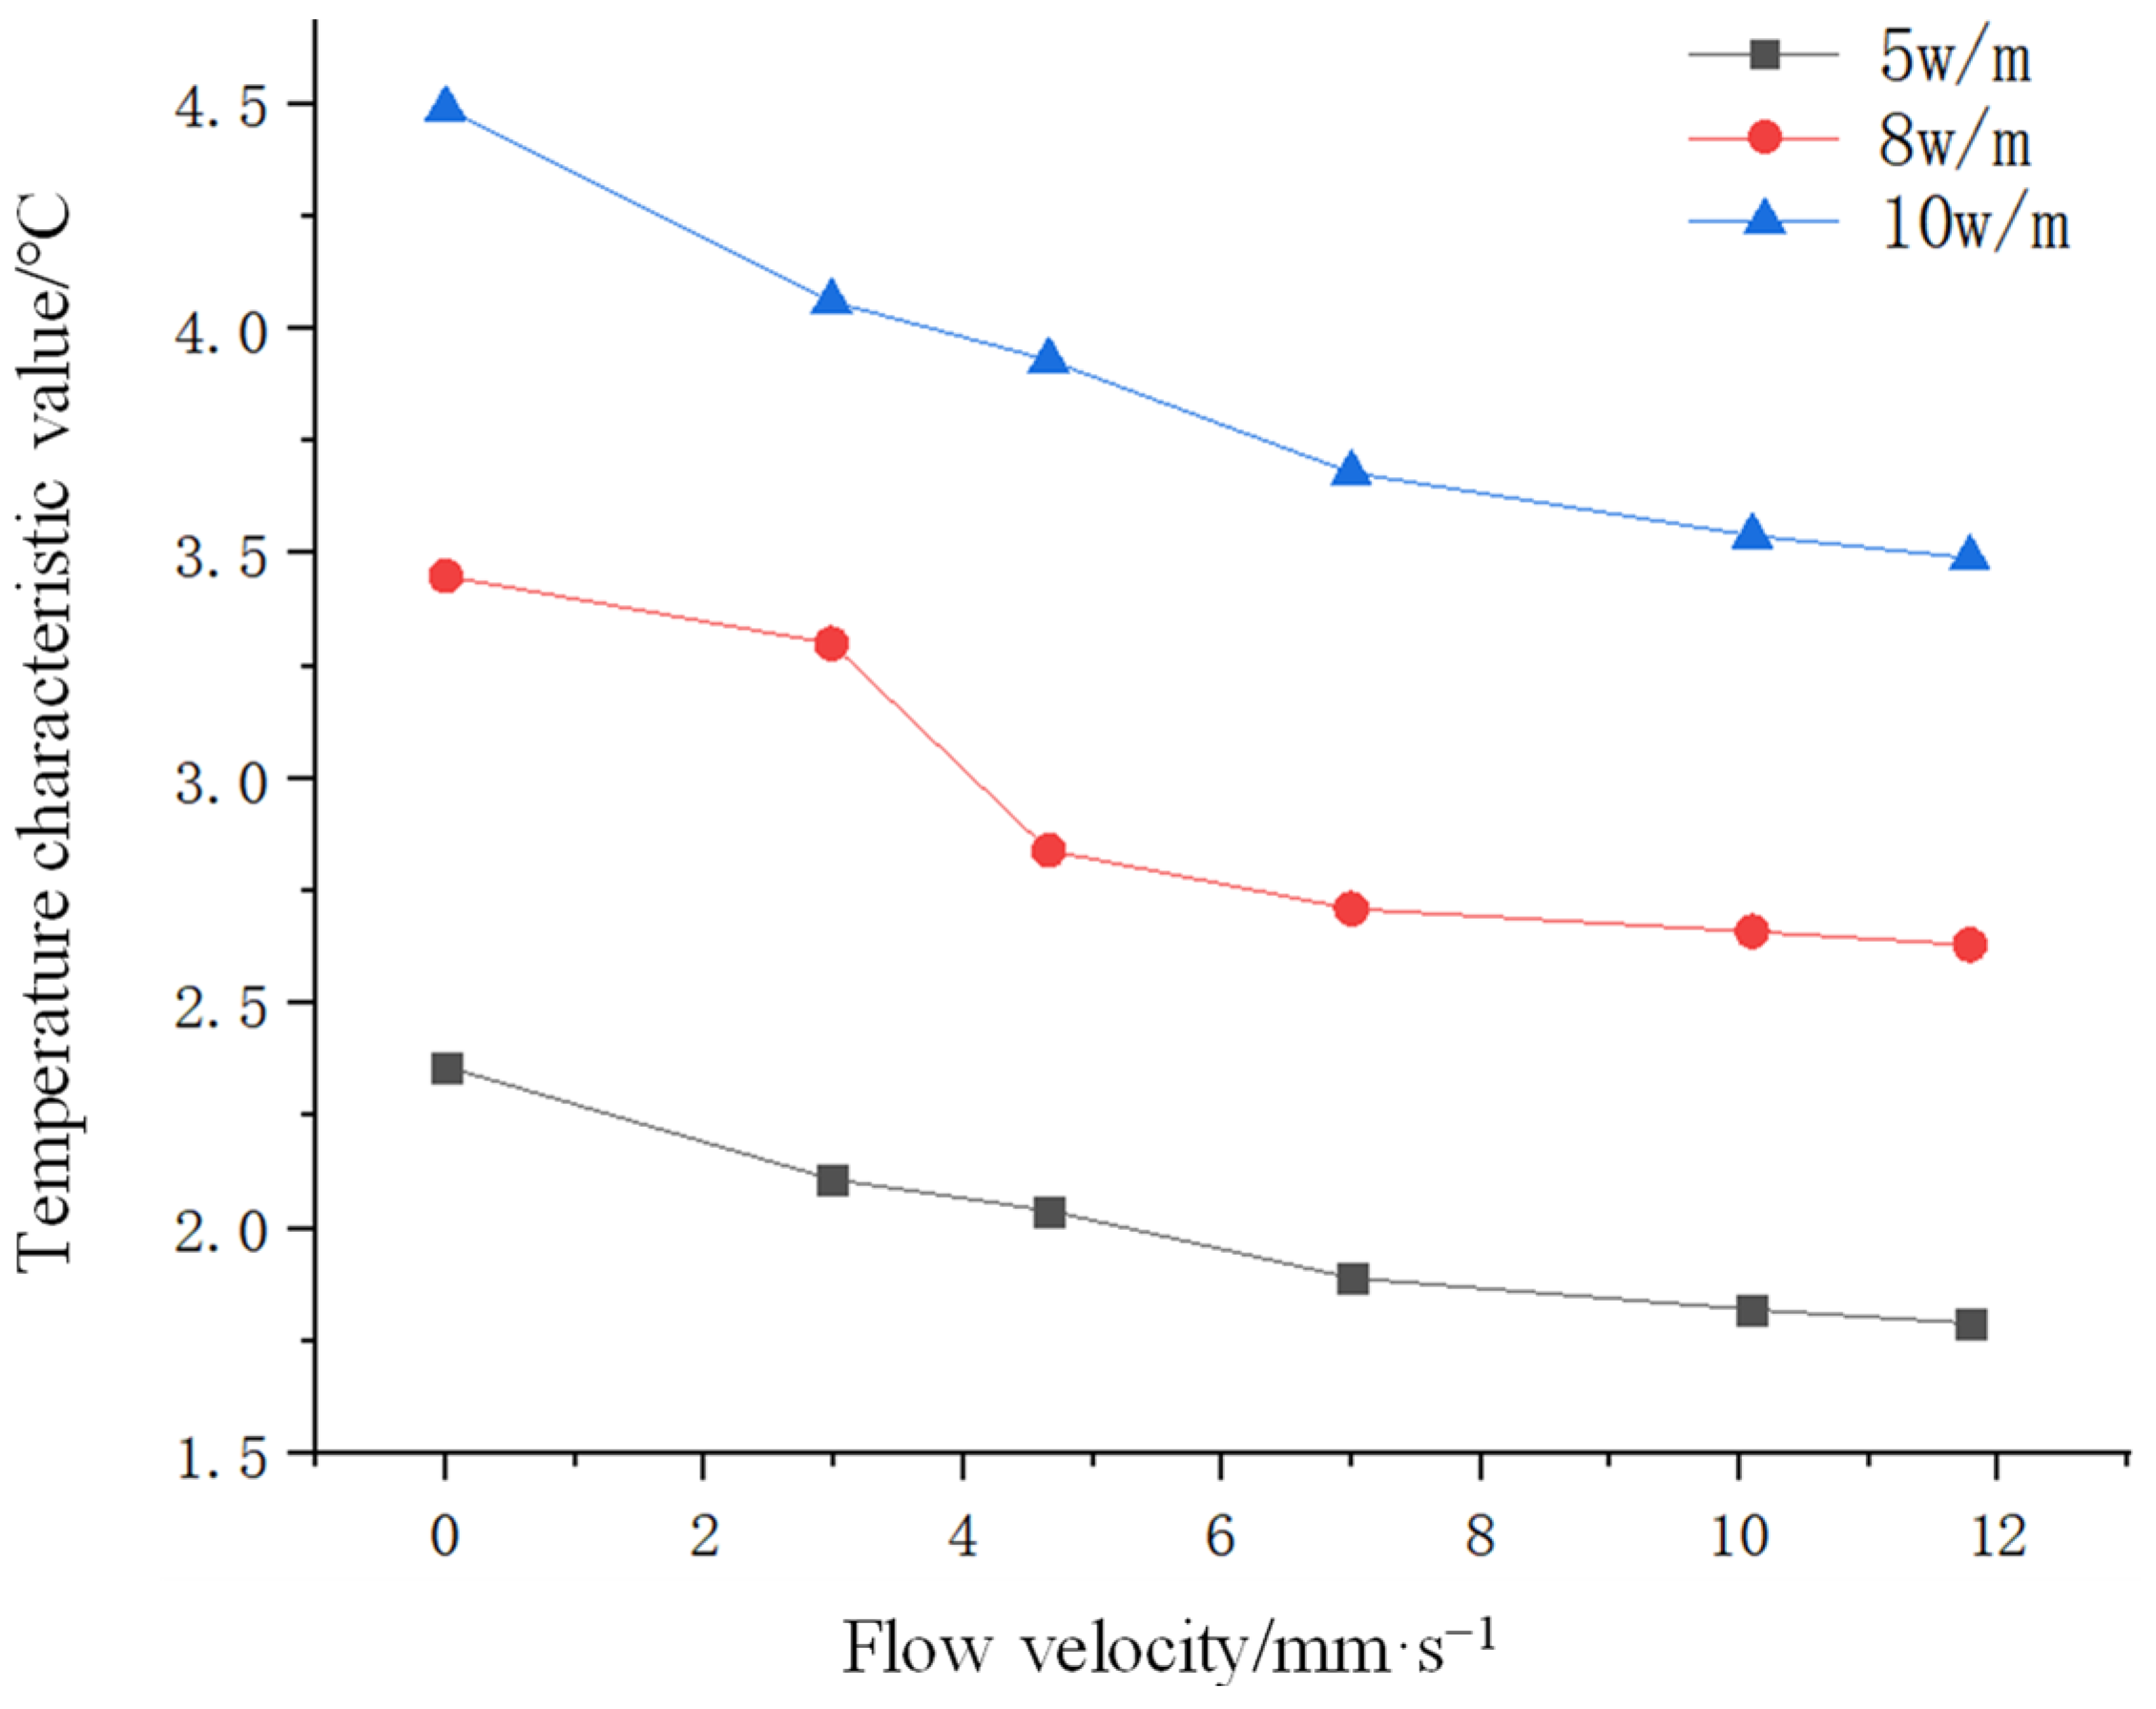
The increases in temperature of the optical cable under different flow rates are shown in Table 4 and Figure 13. Figure 13 shows that there is an obvious negative correlation between the leakage velocity and the temperature characteristic value.
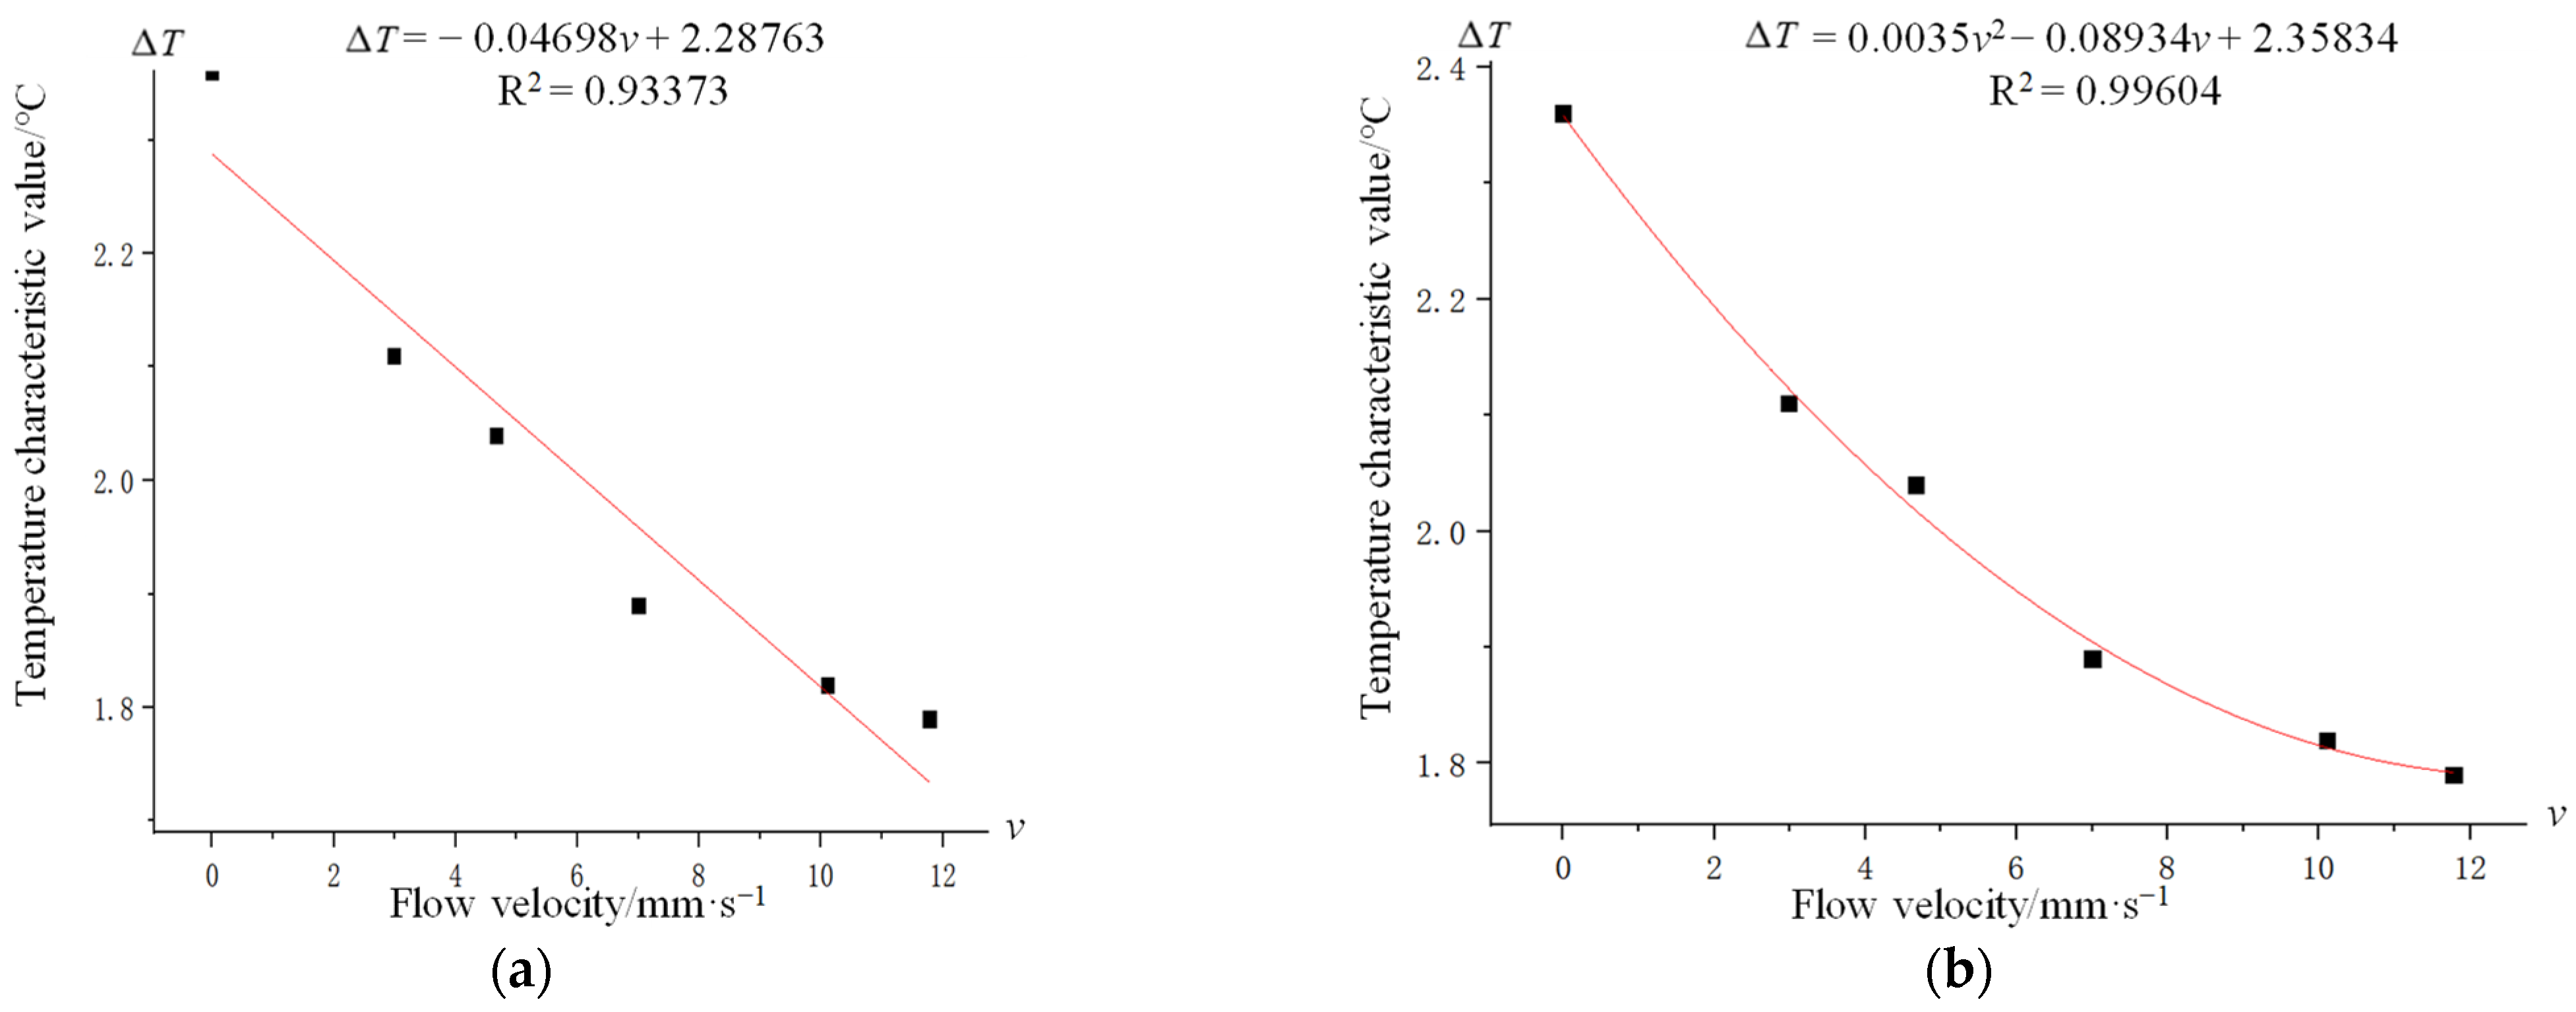
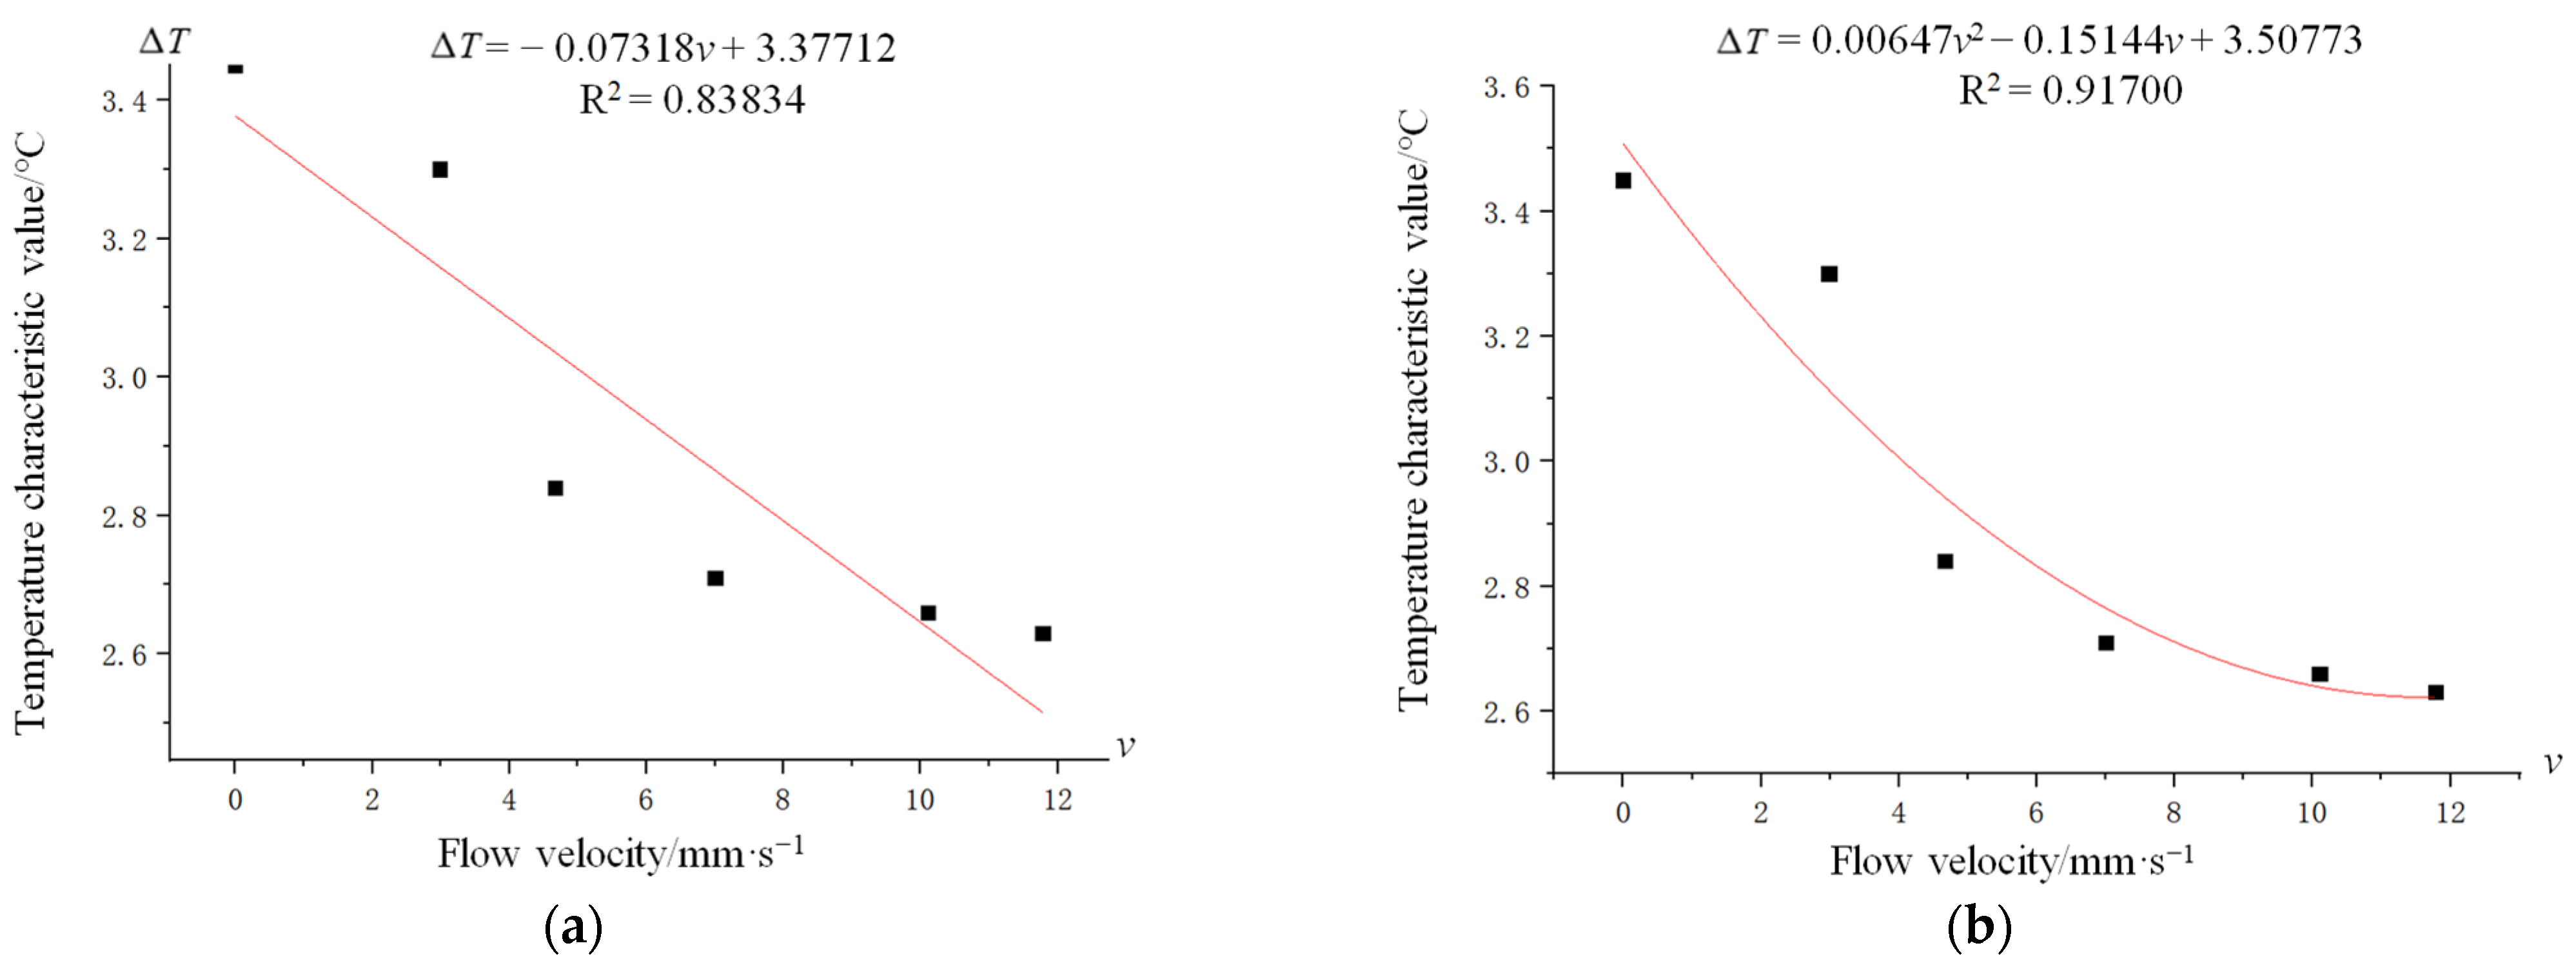
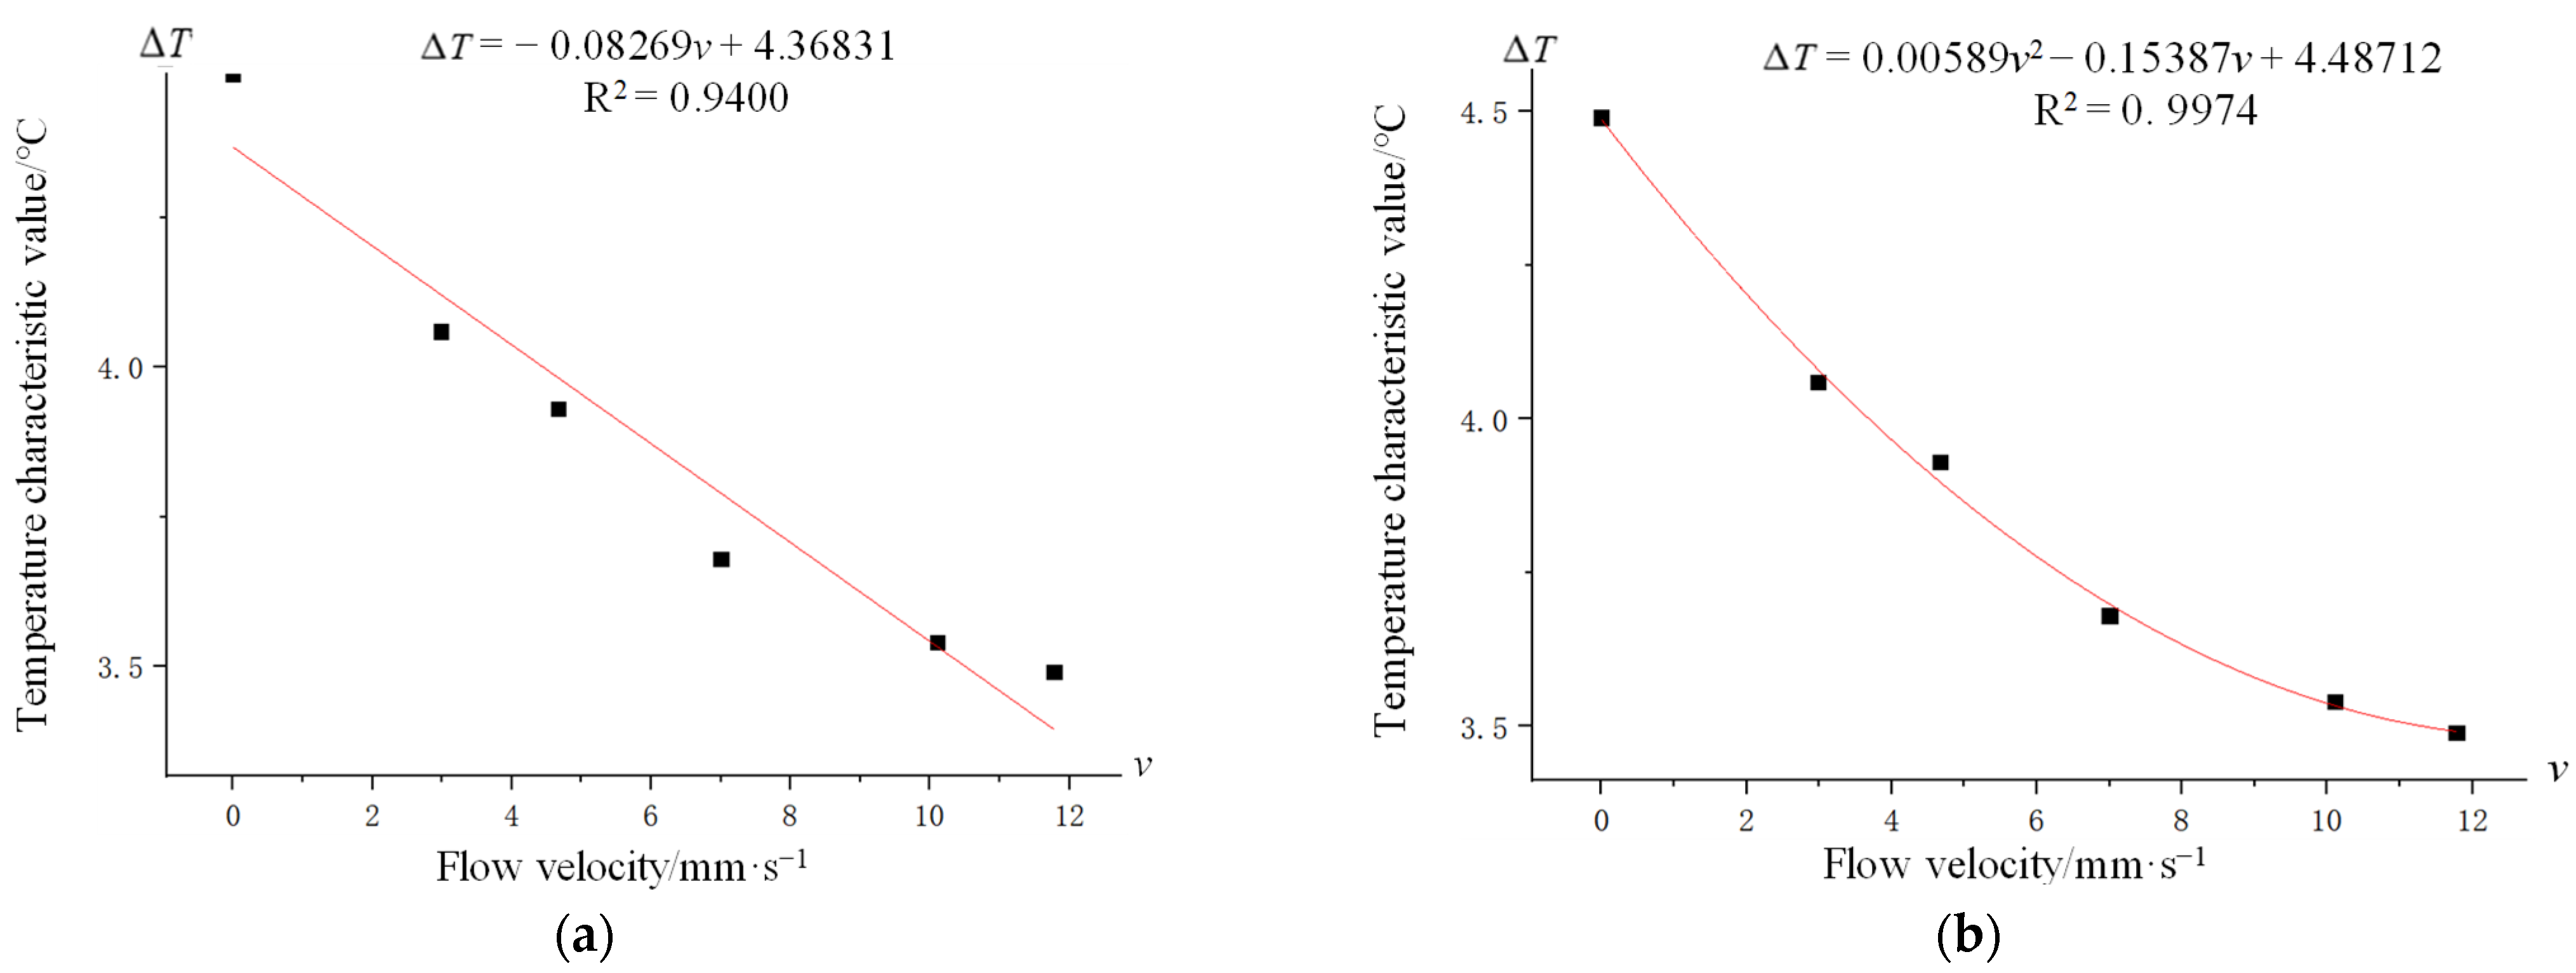
To further analyze the correlation between the flow rate and the temperature eigenvalues, the data under three heating powers were fitted, as shown in Figure 14, Figure 15 and Figure 16. Figure 14, Figure 15 and Figure 16 show that polynomial fitting is more in line with the laws of the experimental data. The comparison shows that the quadratic polynomial fitting curve has a high degree of fitting to the test data and is more reliable.
5. On-Site In Situ Test
The manganese slag silo project in Songtao County, Guizhou Province, China, was selected for an on-site simulated leakage test to test the effectiveness of leakage monitoring using the heatable optical cable in an actual project. As shown in Figure 17, the test area is a square area of 40 m × 40 m, and the optical cables are arranged along the area in an S-shape. The test simulates leakage by using a water pump to inject water into the reserved PE (polyethylene) pipe. The PE pipe is 40 m long and has 6 holes. The length of the heated optical cable in the test area is approximately 840 m, and the average resistance value is 15 Ω/km.
During the test, the two types of optical cables (normal type and heating type) are connected to the equipment, and their normal operation is debugged and checked. As shown in Table 5, the test of working conditions I~IV is carried out in turn to observe the variation law of the temperature measurement value and the leakage identification effect of the two types of temperature-sensing optical cables under the same leakage conditions.
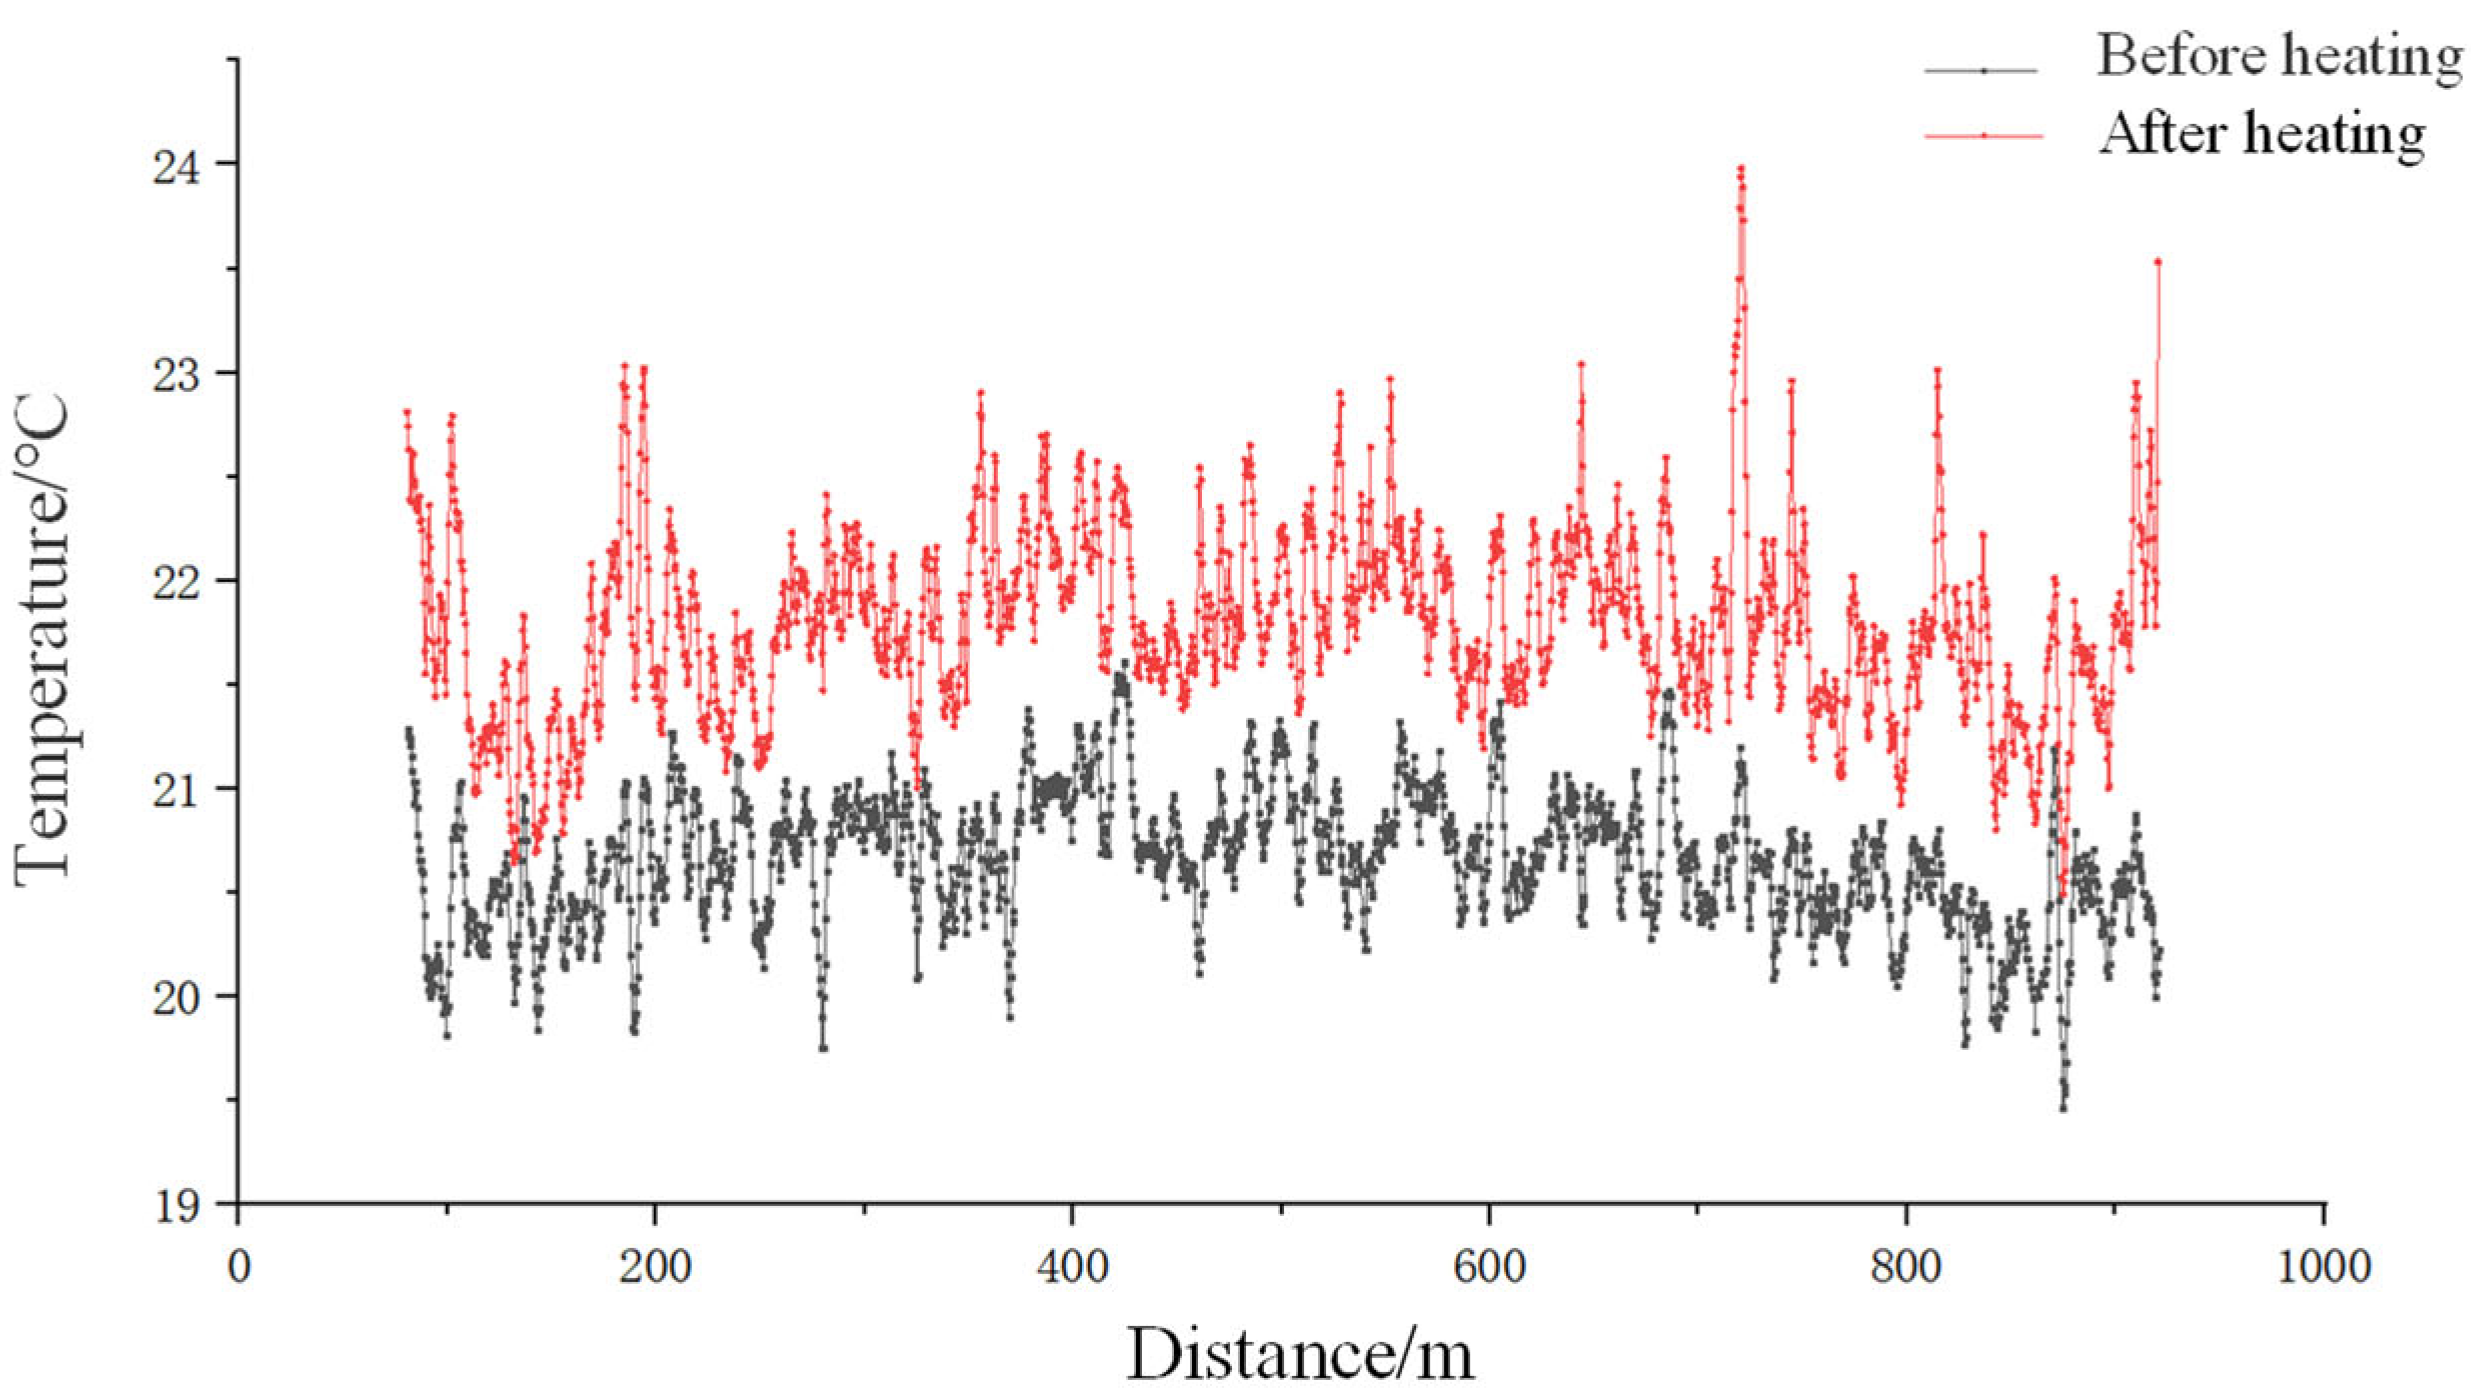
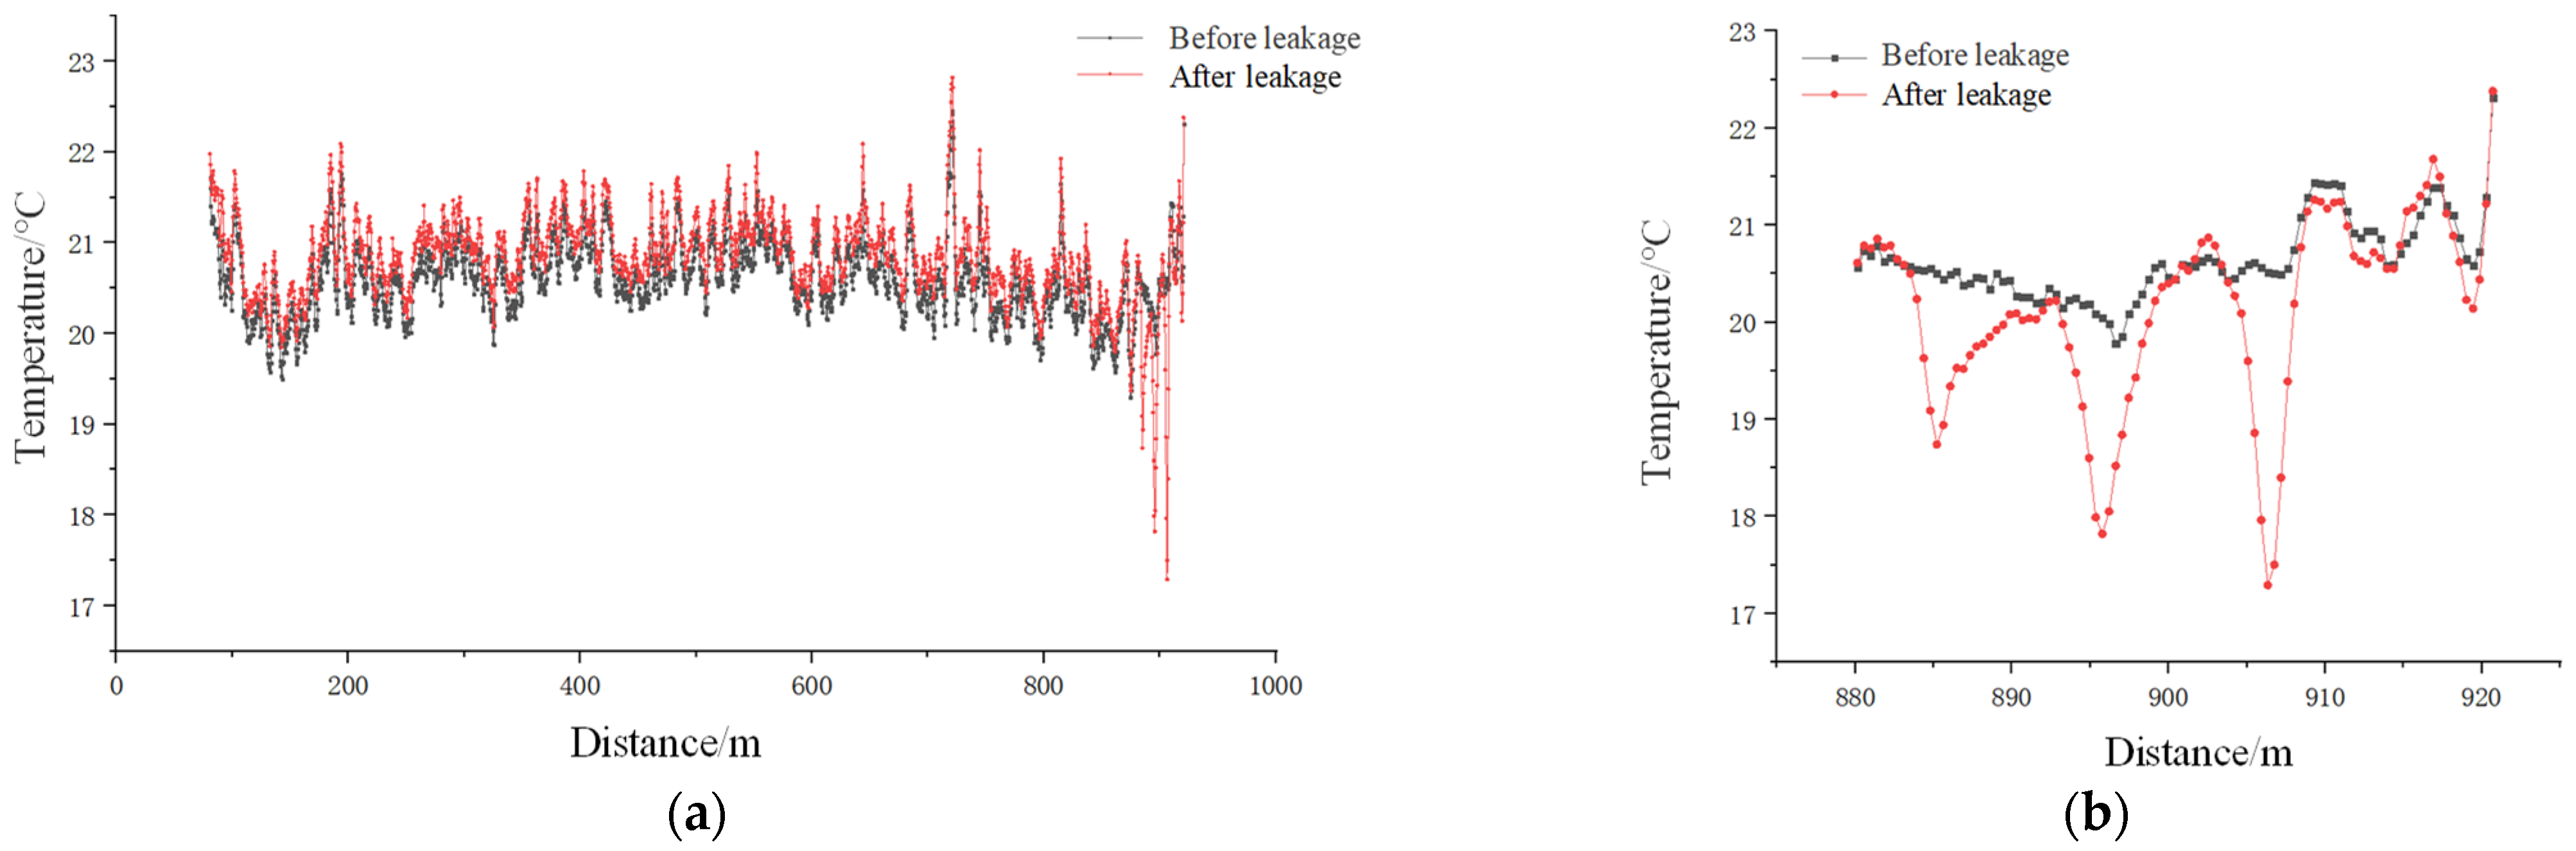
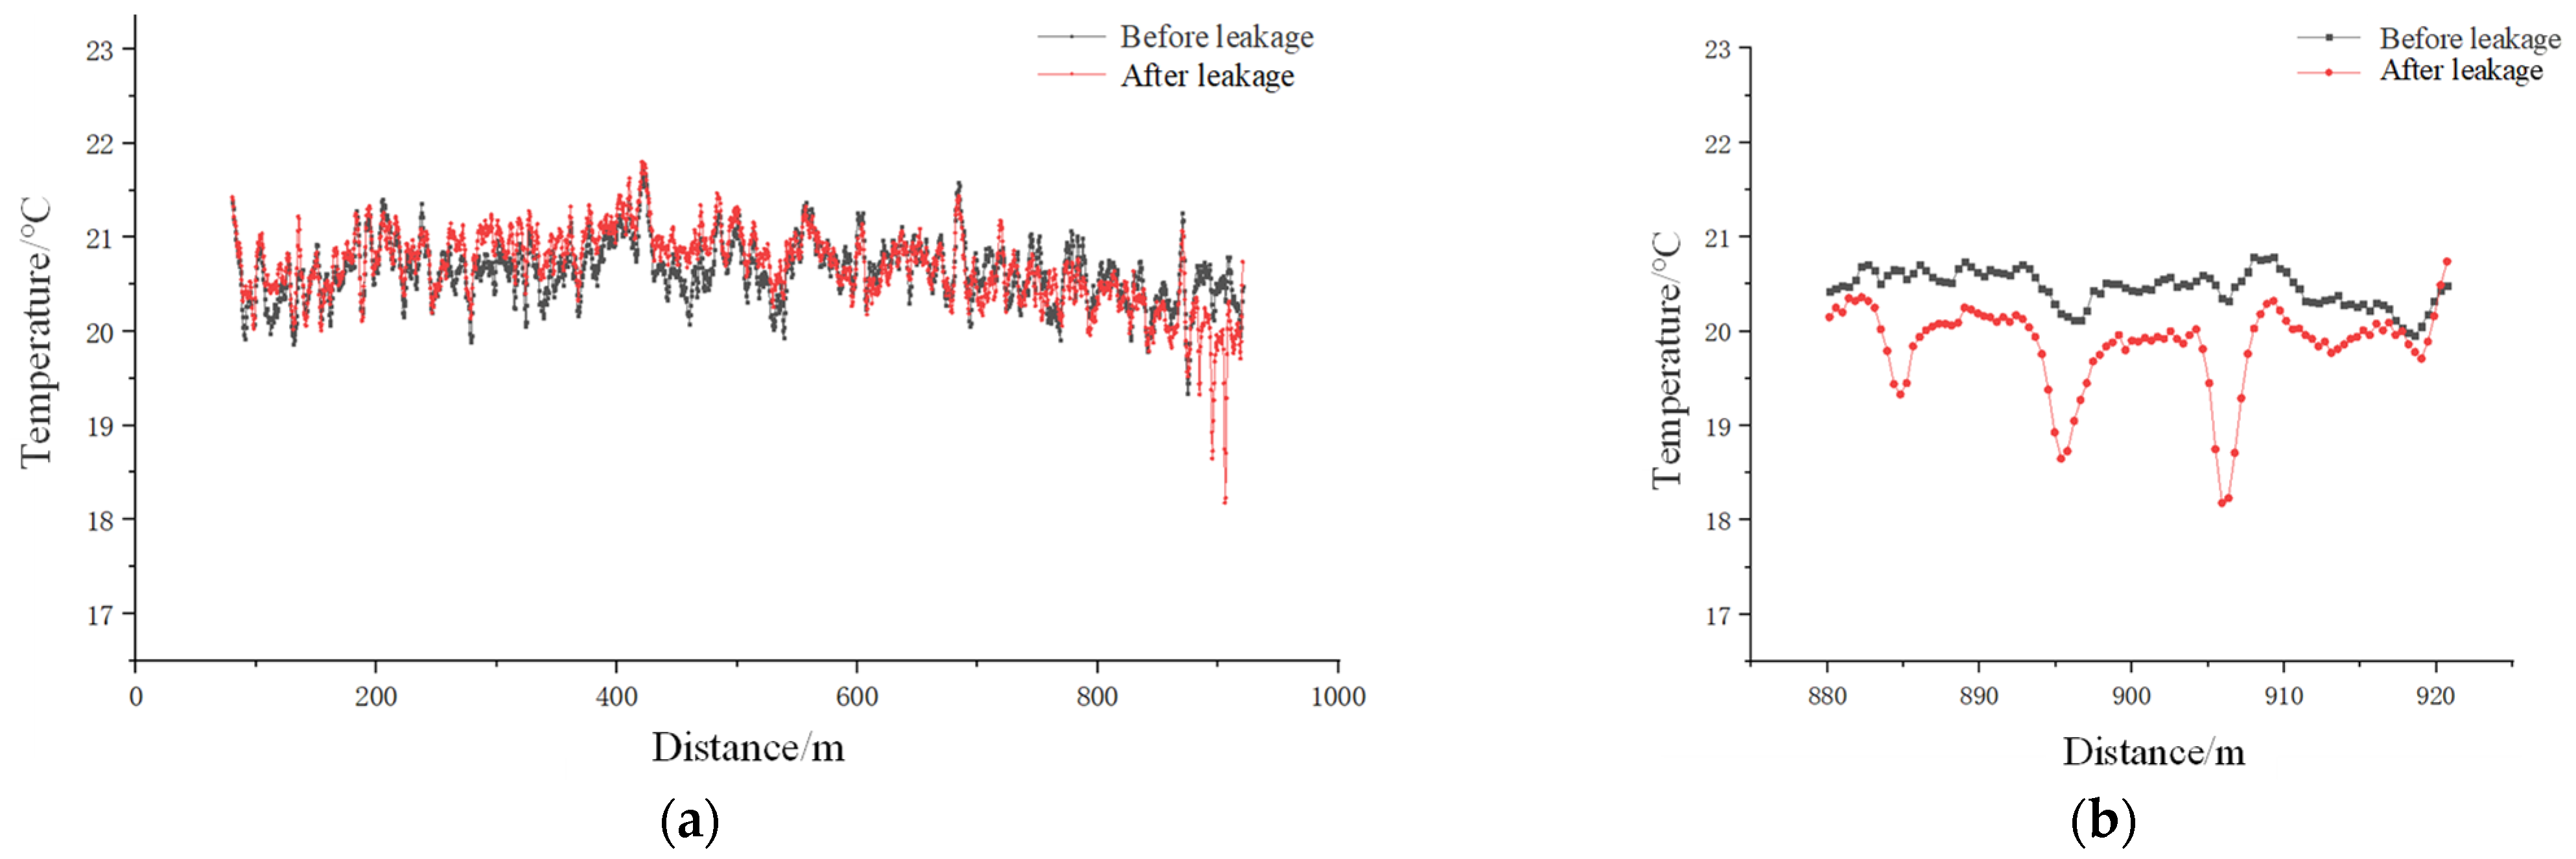
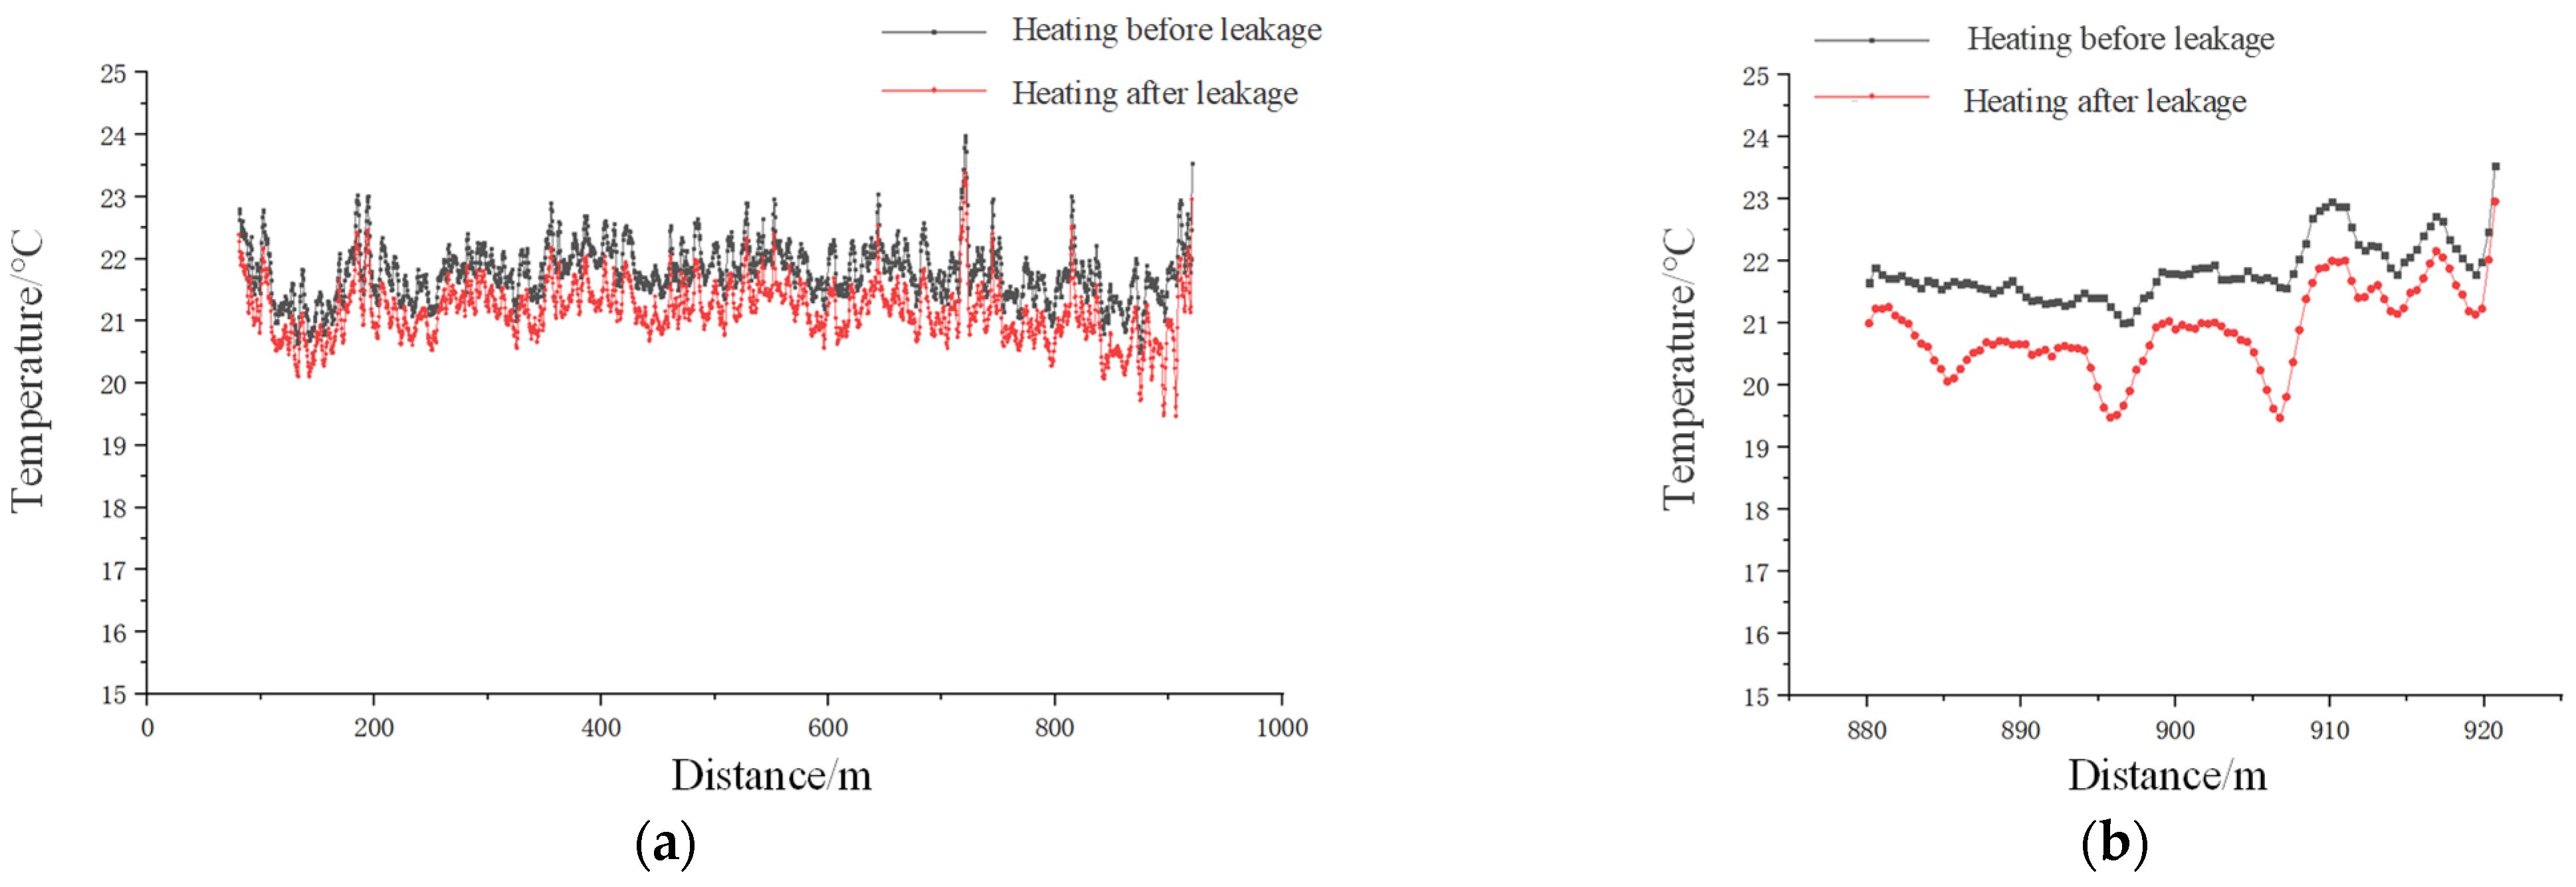
The test results of working Condition I are shown in Figure 18. Due to the power limitation of the equipment, the overall temperature of the heatable temperature-sensing optical cable after heating is only approximately 1 °C higher. The test results of working condition II are shown in Figure 19 and Figure 20. The temperature of the heatable cable drops significantly at the position of 880–920 m, with a drop of approximately 2–3.22 °C, while the temperature of the ordinary cable also drops at the position of 880–920 m, with a drop of 1.49–2.35 °C, which is 1.49–2.35 °C compared to the heatable cable. The temperature gradient of the heatable cable before and after the leakage is not obvious, mainly because the heating power is low, resulting in an insignificant heating effect, indicating an insignificant temperature gradient after leakage occurs, and the reason for the temperature change in the two optical cables is mainly due to the water temperature. The main reason for the temperature changes in the two types of optical cables is the temperature difference between the water and the soil, but it can be seen that the temperature gradient has expanded by heating.
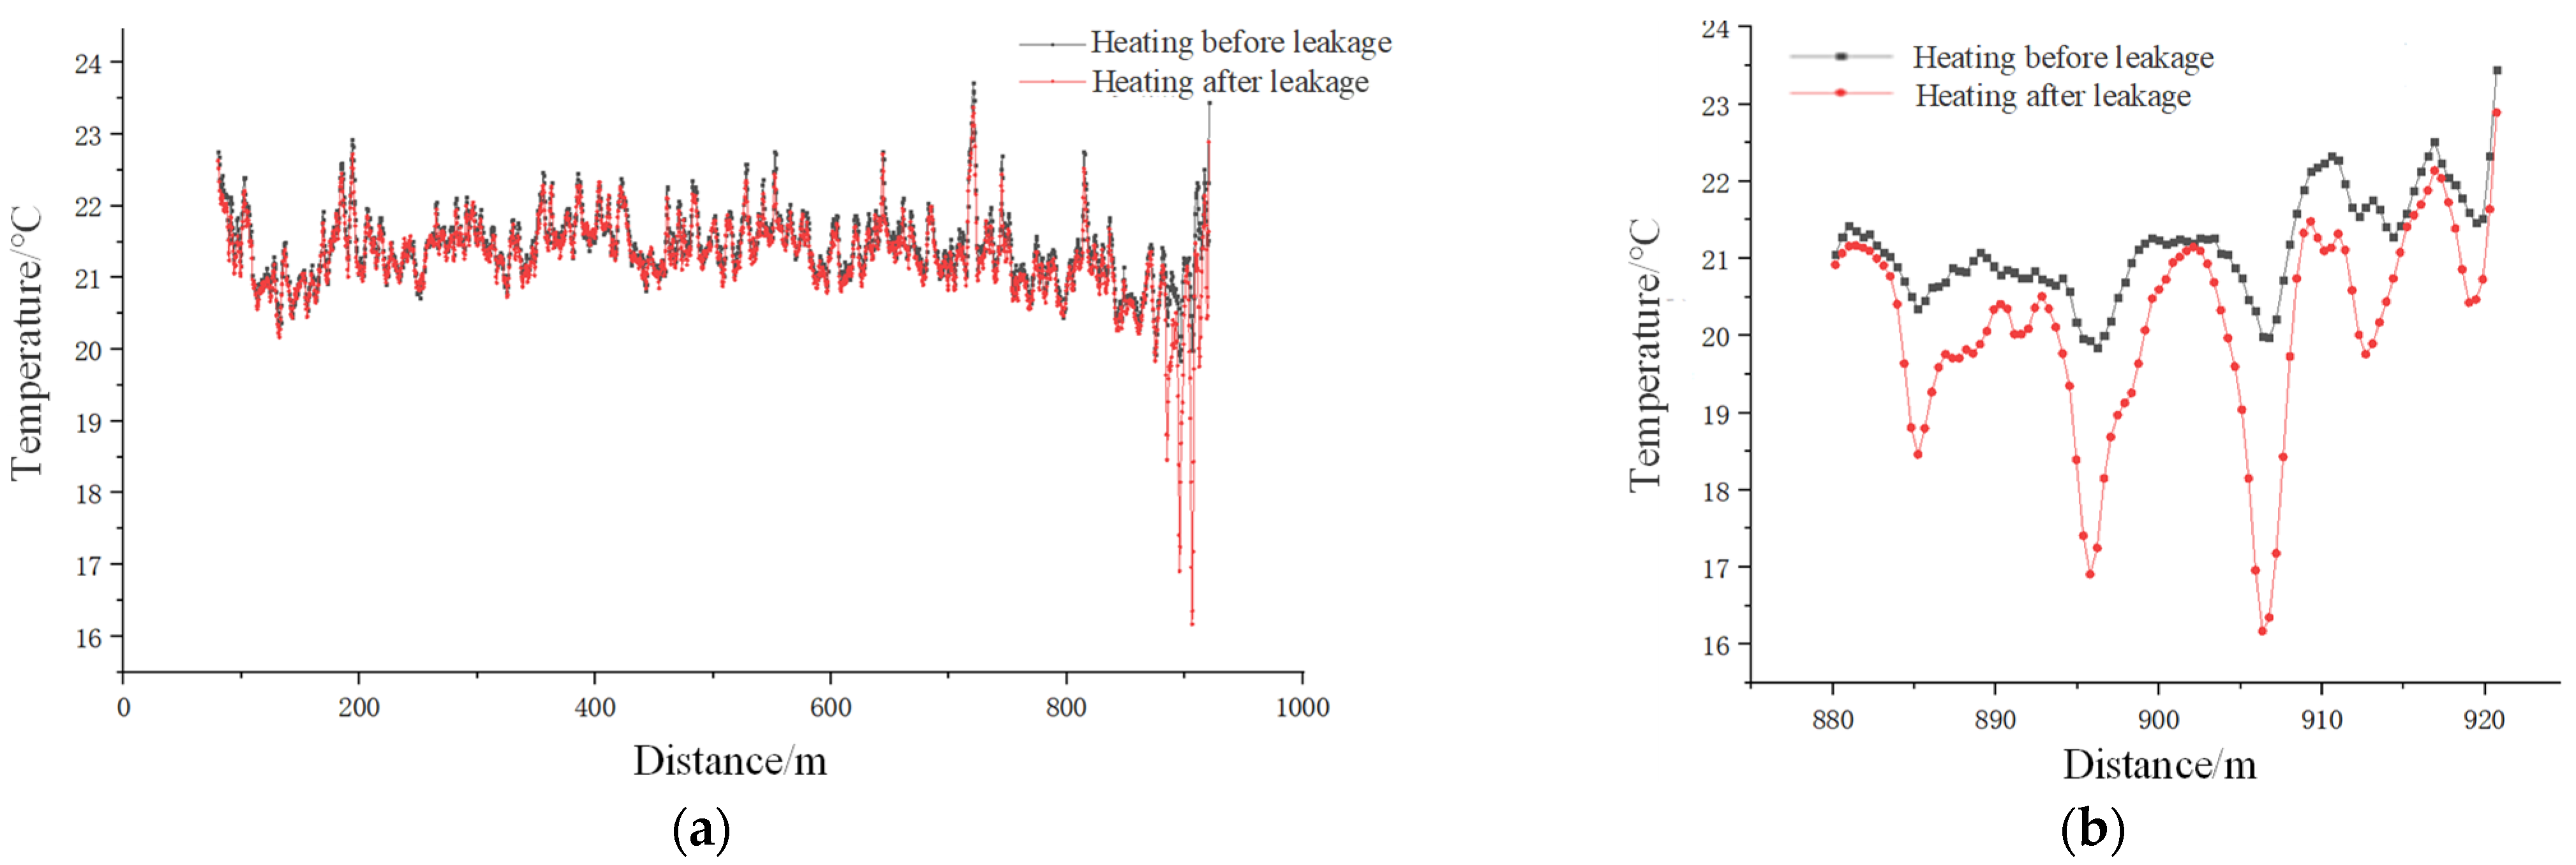
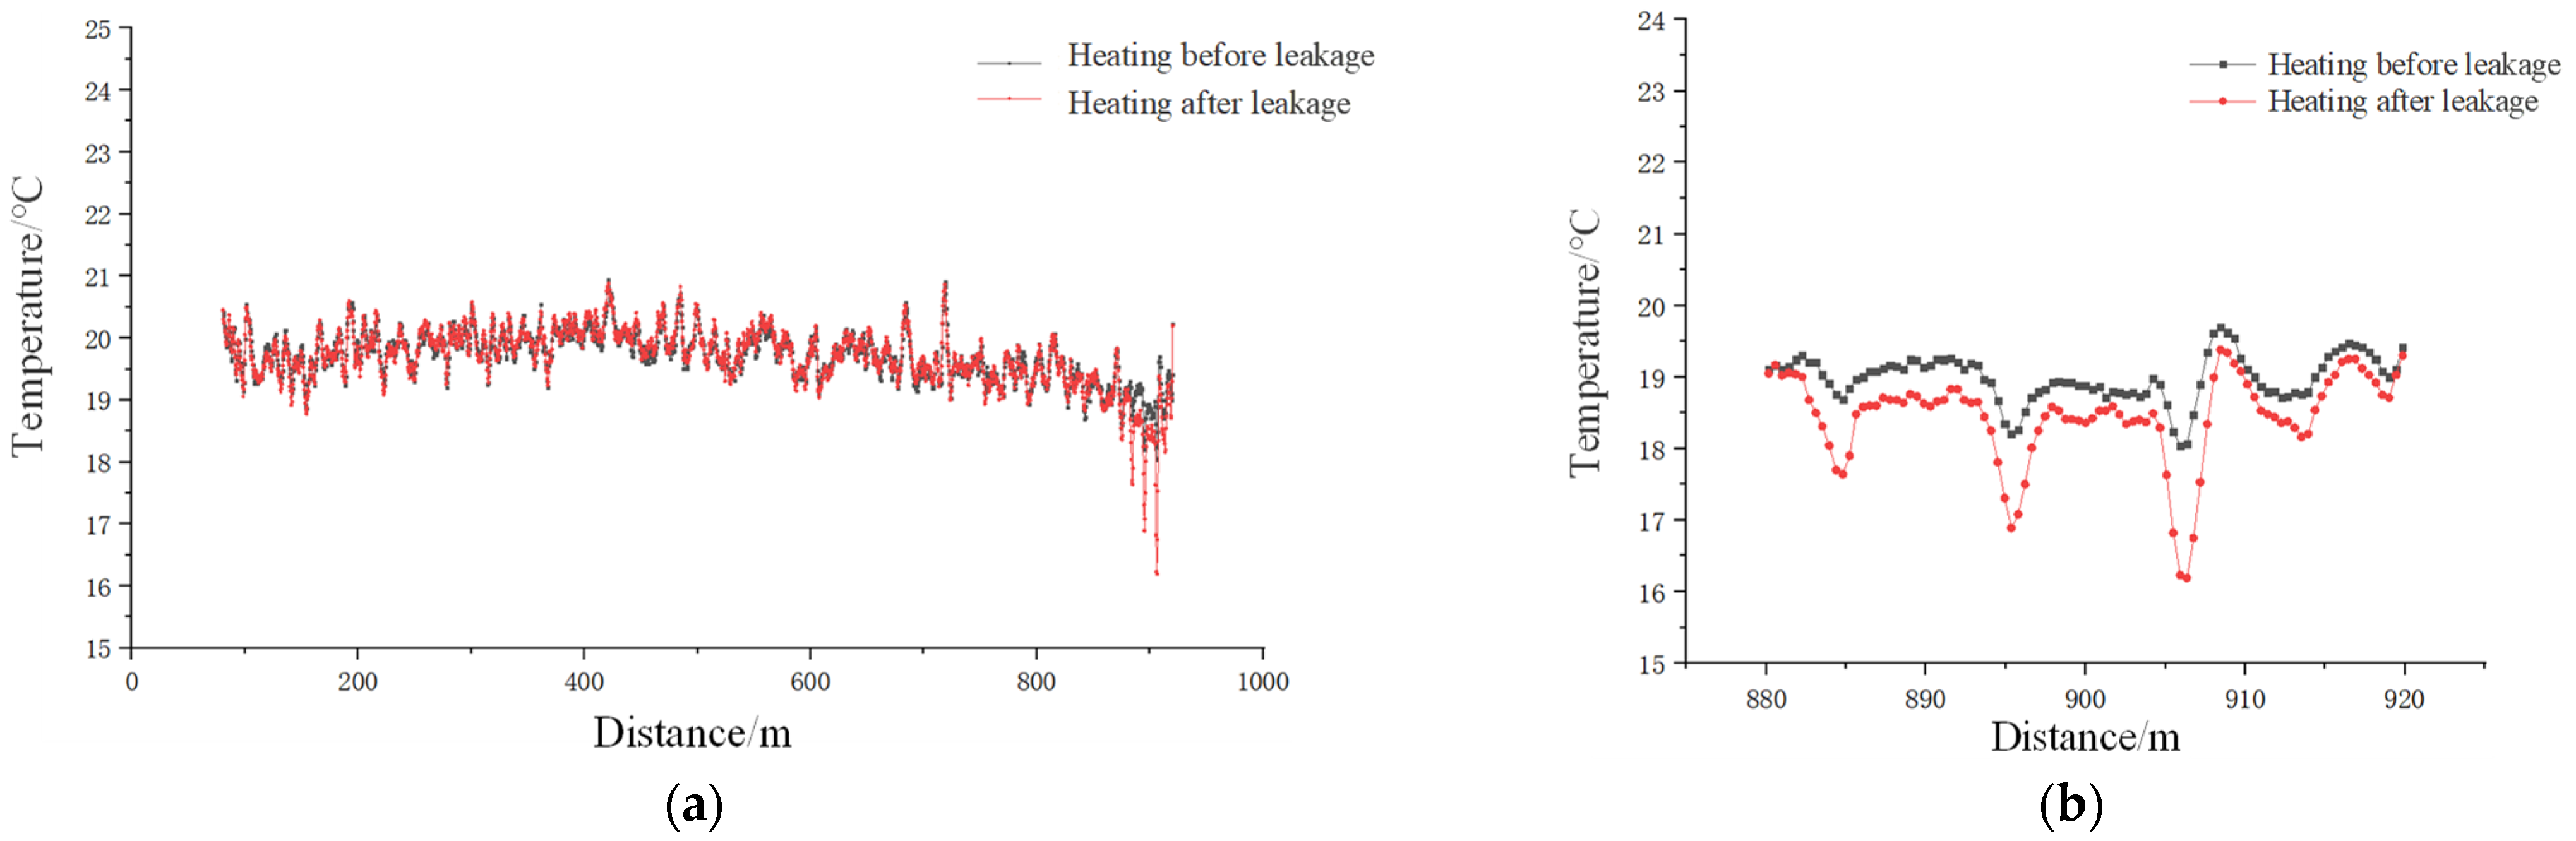
The results of working condition III are shown in Figure 21. The temperature change in the leaking section is larger when the optical cable is heated twice, before and after leaking, but the temperature change is smaller because the heating effect is not obvious. The results of Case IV are shown in Figure 22 and Figure 23. Consistent with the results of working condition II, the temperature dropped significantly at the leakage position. The temperature drop of the ordinary optical cable was 0.59–1.81 °C, while the temperature drop of the heatable cable reached 1.89–3.82 °C. The higher the value is, the better the recognition effect.
6. Discussion
- (1)
- In the experiment described in this paper, the permeability of phosphorus slag was worse than that of sand, and its response to leakage events was slower. Therefore, when laying temperature measurement cables, placing the cables in soil layers with good permeability or setting permeable soil layers around the cables when burying them should be considered to enhance their detection accuracy and response speed to leakage events.
- (2)
- Through the experiments conducted in this study, it was found that the temperature characteristics of optical cables in sand and slag with different moisture contents increased with the increase in heating power. Moreover, the temperature increase in the optical cable at the same power level basically decreased with the increasing moisture content. Specifically, when the moisture content of the sand medium itself is less than 8%, leakage occurs, and the minimum heating power for effectively identifying leakage using the heated optical cable is 12 w/m. When the moisture content of the sand medium itself is greater than 14%, leakage occurs, and a heating power within 20 w/m cannot effectively identify the leakage. When the moisture content of the slag medium itself is less than 14%, leakage occurs, and the minimum heating power for effectively identifying leakage using the heated optical cable is 5 w/m. When the moisture content of the slag medium itself is between 14% and 24%, leakage occurs, and the minimum heating power for effectively identifying leakage using the heated optical cable is 12 w/m. The heating power of the heated optical cable is directly related to its heating effect. If the heating power is too low, it may not meet practical needs, and if the heating power is too high, it will result in energy waste and overheating, which may cause damage to the facility. Currently, scholars have paid little attention to this issue, and in practical engineering, reasonable heating power can be selected through indoor model experiments to provide a basis for actual engineering measurement.
- (3)
- The establishment of a quantitative relationship between seepage velocity and temperature characteristic values is the basis for the quantitative monitoring of seepage. Currently, research in this field involves conducting measurement experiments in indoor models and then applying the analysis results of the indoor experimental data to actual engineering. This paper also adopts a similar approach, and the analysis of experimental data shows that the quadratic polynomial fitting curve has high reliability.
7. Conclusions
Through the experimental study of the feasibility of the heatable temperature-sensing optical cable in karst depression engineering applications, the following conclusions were drawn:
- (1)
- The leakage test results of the heatable temperature-sensing optical cable in different dry and unsaturated media show that the leakage identification effect of the heatable temperature-sensing optical cable is very obvious, which verifies the feasibility and precise positioning function of leakage identification of optical cables in dry media. Because phosphorus slag has worse water permeability than sand, the response speed to leakage events is slower.
- (2)
- In the unsaturated medium test, the difference in moisture content of the medium can be identified by heating the optical cable, and increasing the heating power can increase the identification effect in the range of moisture content identified.
- (3)
- In the semiquantitative identification test of leakage velocity, the temperature characteristic value under different conditions was measured by controlling the flow rate and heating power. The results showed that there was a significant negative correlation between leakage velocity and temperature characteristic value. The greater the flow rate is, the higher the temperature. The smaller the eigenvalue is, the more stable it is. By comparing the data, the quadratic polynomial fitting curve has high reliability.
- (4)
- The temperature behavior of two types of temperature-sensing optical cables (conventional type and heating type) under the same leakage conditions was studied through in situ tests. The degree of response of the heatable fiber optic cable to leakage is very significant, and the result is accurately identifying the location of the leakage.
Author Contributions
B.Y.: Conceptualization, Methodology, Writing—Original Draft; C.S.: Visualization, Writing—Review and Editing; H.P.: Data Curation, Investigation; F.G.: Resources, Formal analysis. All authors have read and agreed to the published version of the manuscript.
Funding
This research is supported by the major research project of Power China Guiyang Engineering Corporation Limited (YJZD2020-02).
Data Availability Statement
The data is confidential (provided upon request).
Acknowledgments
The authors are grateful to all participants for their efforts.
Conflicts of Interest
The authors declare no conflict of interest.
References
- Zhao, Z.R.; Zhang, L.Z. Research on seepage safety monitoring technology for dams. Water Resour. Hydropower Eng. Des. 2001, 3, 44–48. [Google Scholar]
- Yan, W.J. Technical improvement of dam seepage observation by measuring weir method in Yantan Hydropower Station. Hongshui River 2016, 35, 76–79. [Google Scholar]
- Wang, H.B. Application of high density resistivity method in the detection of embankment hidden danger. J. Zhejiang Univ. Water Resour. Electr. Power 2010, 22, 31–34. [Google Scholar] [CrossRef]
- Duan, X. Research on dam leakage detection based on temperature tracer method. Sci. Technol. Eng. 2014, 14, 140–143. [Google Scholar]
- Fang, C.G.; Ge, H.G.; Jia, Y.M. Technical problems of transient electromagnetic method used in the detection of hidden dangers of dike leakage. Dam Obs. Geotech. Tests 2001, 5, 21–24. [Google Scholar]
- Ren, A.W.; Ke, B.R.; Cheng, J.S. Cause analysis and non-destructive testing verification of reservoir leakage in karst area. J. Hydraul. Eng. 2014, 45, 119–124. [Google Scholar]
- Aufleger, M.; Goltz, M.; Dornstadter, J. Distributed fiber optic temperature measurements in embankment dams with central core new benchmark for seepage monitoring. In Proceedings of the International Symposium on Dams and Reservoirs under Changing Challenges during the 79th Annual Meeting of the International Commission on Large Dams, Lucerne, Switzerland, 1–3 June 2011. [Google Scholar]
- Aufleger, M.; Conrad, M.; Goltz, M. Innovative dam monitoring tools based on distributed temperature measurement. Jordan J. Civ. Eng. 2007, 1, 29–37. [Google Scholar]
- Li, R.Y.; Chen, X.P.; Wang, Z.W. Application of temperature indication method in seepage monitoring of Yangtze River levee. J. Yangtze River Sci. Res. Inst. 2000, 17, 48–57. [Google Scholar]
- Li, Y.X. Study on Multiparameter Monitoring of Embankment Based on Distributed Fiber-Optic Sensing Technology. Master’s Thesis, Nanjing University, Nanjing, China, 2021. [Google Scholar] [CrossRef]
- Wang, Y.H.; Cai, D.S.; Xiao, H.L. Application of DTS in leakage monitoring of concrete face rockfill dam. China Rural Water Hydropower 2006, 8, 101–102. [Google Scholar] [CrossRef]
- Wei, D.R.; Zhao, H.C.; Qin, Y.T. Leakage monitoring technology based on optical fiber temperature measurement. Zhejiang Hydrotech. 2004, 2, 19–21. [Google Scholar] [CrossRef]
- Qin, L.T.; Liu, J.M.; Xia, X.P. Distributed optical fiber temperature monitoring system and its application. Dam Saf. 2004, 01, 45–48. [Google Scholar] [CrossRef]
- Tan, Z.W.; Hu, L.Z. Study on Optical Fiber Seepage Monitoring Technology of the Vertical Core Rockfill Dam. Water Power 2011, 37, 83–85. [Google Scholar] [CrossRef]
- Harvie, W.B.; Peppler, R.A. Sensor-Enabled Geosynthetics Monitoring Stability and Leak Detection in Earthen Construction Technical Paper #159. In Proceedings of the World of Coal Ash Conference, Lexington, KY, USA, 22–25 April 2013. [Google Scholar]
- Wang, Z.H. Study on Seepage Monitoring Method of Soil and Stone Dam Based on Distributed of Optical Fiber Temperature Measurement Technology. Ph.D. Thesis, Xi’an University of Technology, Xi’an, China, 2019. [Google Scholar]
- Thiele, E.; Helbig, R.; Krebber, K. Dike Monitoring. In Proceedings of the 4th International Symposium on Flood Defense, Managing flood Risk Reliability and Vulnerability, Toronto, ON, Canada, 6–8 May 2008. [Google Scholar]
- Artieres, O.; Galian, M.; Royet, P. Fiber optics monitoring solution for canal dykes. In Proceedings of the Planc Mmx Congress, Liverpool, UK, 10–14 May 2010. [Google Scholar]
- Vogt, T.; Schneider, P.; Woernle, L.H. Estimation of seepage rates in a losing stream by means of fiber-optic high-resolution vertical temperature profiling. J. Hydrol. 2010, 380, 154–164. [Google Scholar] [CrossRef]
- Beck, Y.L.; Cunat, P.; Reboud, M. Improvement of leakage monitoring in dikes by the use of distributed fiber optics sensors. In Proceedings of the 6th International Conference on Scour and Erosion, Paris, France, 27–31 August 2012. [Google Scholar]
- Deng, X.W. Model Test of Leakage Monitoring Based on Distributed Optical Fiber Temperature Sensing Technology. Master’s Thesis, Hubei University of Technology, Wuhan, China, 2011. [Google Scholar]
- Liu, T.; Sun, W.J.; Kou, H.L. Experimental Study of Leakage Monitoring of Diaphragm Walls Based on Distributed Optical Fiber Temperature Measurement Technology. Sensors 2019, 19, 2269. [Google Scholar] [CrossRef] [PubMed] [Green Version]
Figure 1.
DTS temperature measurement principle.

Figure 2.
Schematic diagram of heat diffusion in soil after copper mesh is heated.

Figure 3.
Test equipment for the leakage monitoring indoor model: (a) Heatable cable structure; (b) DTS demodulator; (c) Temperature compensation box.
Figure 3.
Test equipment for the leakage monitoring indoor model: (a) Heatable cable structure; (b) DTS demodulator; (c) Temperature compensation box.

Figure 4.
Temperature measurement cable connection: (a) Jumper connection; (b) Copper wire connection.
Figure 4.
Temperature measurement cable connection: (a) Jumper connection; (b) Copper wire connection.

Figure 5.
Leakage monitoring test system: (a) Schematic diagram of the leakage device; (b) The actual layout of the leakage device; (c) Arrangement of temperature-measuring optical cables; (d) Holes at the bottom of the device.
Figure 5.
Leakage monitoring test system: (a) Schematic diagram of the leakage device; (b) The actual layout of the leakage device; (c) Arrangement of temperature-measuring optical cables; (d) Holes at the bottom of the device.

Figure 6.
Temperature variation curve of the leakage position under a heating power of 5 w/m.

Figure 7.
Temperature change curve under heating power of 10 w/m (dry sand): (a) Test section temperature distribution curve; (b) Temperature change curve at the leakage position.
Figure 7.
Temperature change curve under heating power of 10 w/m (dry sand): (a) Test section temperature distribution curve; (b) Temperature change curve at the leakage position.

Figure 8.
Temperature change curve under heating power of 10 w/m (dry phosphorus slag): (a) Temperature distribution curve of the test section; (b) Temperature change curve at the leakage position.
Figure 8.
Temperature change curve under heating power of 10 w/m (dry phosphorus slag): (a) Temperature distribution curve of the test section; (b) Temperature change curve at the leakage position.

Figure 9.
Temperature change phenomenon under a heating power of 10 w/m (dry phosphorus slag): (a) Early stage of leakage; (b) Water passing down; (c) The leakage spreads to the surroundings; (d) Phosphorus residue and water layer.
Figure 9.
Temperature change phenomenon under a heating power of 10 w/m (dry phosphorus slag): (a) Early stage of leakage; (b) Water passing down; (c) The leakage spreads to the surroundings; (d) Phosphorus residue and water layer.


Figure 10.
Temperature variation curve of sandy soil with different moisture contents under different heating powers: (a) Temperature curve of 8% moisture content; (b) Temperature curve of 14% moisture content; (c) Temperature curve of 20% moisture content.
Figure 10.
Temperature variation curve of sandy soil with different moisture contents under different heating powers: (a) Temperature curve of 8% moisture content; (b) Temperature curve of 14% moisture content; (c) Temperature curve of 20% moisture content.

Figure 11.
Temperature variation curve of phosphorus slag with different moisture content under different heating power: (a) Temperature curve of 14% moisture content; (b) Temperature curve of 24% moisture content; (c) Temperature curve of 34% moisture content.
Figure 11.
Temperature variation curve of phosphorus slag with different moisture content under different heating power: (a) Temperature curve of 14% moisture content; (b) Temperature curve of 24% moisture content; (c) Temperature curve of 34% moisture content.

Figure 12.
Leakage velocity monitoring test device: (a) The actual layout of the test device; (b) The schematic diagram of the test device.
Figure 12.
Leakage velocity monitoring test device: (a) The actual layout of the test device; (b) The schematic diagram of the test device.

Figure 13.
Temperature characteristic values at different flow rates.

Figure 14.
The data of heating power 5 w/m corresponding to the results of different fitting methods: (a) Linear fit; (b) Polynomial fit.
Figure 14.
The data of heating power 5 w/m corresponding to the results of different fitting methods: (a) Linear fit; (b) Polynomial fit.

Figure 15.
The data for the heating power of 8 w/m correspond to the results of different fitting methods: (a) Linear fit; (b) Polynomial fit.
Figure 15.
The data for the heating power of 8 w/m correspond to the results of different fitting methods: (a) Linear fit; (b) Polynomial fit.

Figure 16.
The data of heating power 10 w/m corresponding to the results of different fitting methods: (a) Linear fit; (b) Polynomial fit.
Figure 16.
The data of heating power 10 w/m corresponding to the results of different fitting methods: (a) Linear fit; (b) Polynomial fit.

Figure 17.
On-site in situ test layout: (a) Test area; (b) Distribution of optical cables and leakage pipes; (c) Test device.
Figure 17.
On-site in situ test layout: (a) Test area; (b) Distribution of optical cables and leakage pipes; (c) Test device.

Figure 18.
Temperature change in the optical cable before and after heating in working Condition I.

Figure 19.
Temperature change in the heatable optical cable under working condition II: (a) Temperature distribution along the route; (b) Temperature distribution in the leakage section.
Figure 19.
Temperature change in the heatable optical cable under working condition II: (a) Temperature distribution along the route; (b) Temperature distribution in the leakage section.

Figure 20.
Temperature change in the ordinary optical cable in working condition II: (a) Temperature distribution along the route; (b) The temperature distribution of the leakage section.
Figure 20.
Temperature change in the ordinary optical cable in working condition II: (a) Temperature distribution along the route; (b) The temperature distribution of the leakage section.

Figure 21.
Temperature comparison of the two heating times before and after the leakage of the heatable optical cable under working condition III: (a) Temperature distribution along the route; (b) Temperature distribution of leakage section.
Figure 21.
Temperature comparison of the two heating times before and after the leakage of the heatable optical cable under working condition III: (a) Temperature distribution along the route; (b) Temperature distribution of leakage section.

Figure 22.
Temperature change in heatable optical cable under working condition IV: (a) Temperature distribution along the route; (b) Temperature distribution of leakage section.
Figure 22.
Temperature change in heatable optical cable under working condition IV: (a) Temperature distribution along the route; (b) Temperature distribution of leakage section.

Figure 23.
Temperature change in ordinary optical cable under working condition IV: (a) Temperature distribution along the route; (b) Temperature distribution of leakage section.
Figure 23.
Temperature change in ordinary optical cable under working condition IV: (a) Temperature distribution along the route; (b) Temperature distribution of leakage section.


Table 1.
Model test conditions.
| Number | Media Type | Moisture Content |
|---|---|---|
| 1 | Sand | dry soil |
| 2 | 8% | |
| 3 | 14% | |
| 4 | 20% | |
| 5 | Phosphorus slag | dry soil |
| 6 | 14% | |
| 7 | 24% | |
| 8 | 34% (saturation) |
Table 2.
Temperature increase in sandy soil with different moisture contents under different heating powers.
Table 2.
Temperature increase in sandy soil with different moisture contents under different heating powers.
| Heating Power (w/m) | 8% Moisture Content Temperature Increase (°C) | 14% Moisture Content Temperature Increase (°C) | 20% Moisture Content Temperature Increase (°C) |
|---|---|---|---|
| 5 | 3.10 | 2.45 | 2.94 |
| 8 | 7.39 | 5.29 | 5.27 |
| 10 | 9.25 | 6.64 | 6.60 |
| 12 | 11.03 | 7.31 | 6.80 |
| 15 | 13.58 | 9.08 | 8.94 |
| 18 | 14.29 | 11.54 | 9.90 |
| 20 | 15.52 | 13.69 | 12.31 |
Table 3.
Temperature increase of phosphorus slag with different moisture contents under different heating powers.
Table 3.
Temperature increase of phosphorus slag with different moisture contents under different heating powers.
| Heating Power (w/m) | 14% Moisture Content Temperature Increase (°C) | 24% Moisture Content Temperature Increase (°C) | 34% Moisture Content Temperature Increase (°C) |
|---|---|---|---|
| 5 | 8.71 | 5.92 | 4.66 |
| 8 | 12.03 | 8.16 | 6.66 |
| 10 | 17.06 | 11.68 | 9.46 |
| 12 | 18.91 | 12.90 | 10.28 |
| 15 | 20.95 | 14.17 | 11.48 |
| 18 | 25.22 | 17.28 | 13.66 |
| 20 | 27.30 | 18.84 | 14.99 |
Table 4.
Temperature characteristic values of different flow rates under different powers.
| Heating Power (w/m) | Flow Velocity v (mm/s) | |||||
|---|---|---|---|---|---|---|
| 0.00 | 2.90 | 4.60 | 7.00 | 10.10 | 11.78 | |
| 5 | 2.36 | 2.11 | 2.04 | 1.89 | 1.82 | 1.79 |
| 8 | 3.45 | 3.30 | 2.84 | 2.71 | 2.66 | 2.63 |
| 10 | 4.49 | 4.05 | 3.93 | 3.68 | 3.54 | 3.49 |
Table 5.
Field test conditions.
| Condition Number | Content |
|---|---|
| I | Heat the cable to a stable temperature with 2 w/m heating power (the maximum power that the field device can provide) |
| II | Heat the cable at 2 w/m until the temperature stabilizes to simulate leakage |
| III | Stop heating and wait for the temperature to drop and stabilize, then reheat the optical cable with 2 w/m heating power to stabilize |
| IV | Simulate leakage again after heating stabilizes |
Disclaimer/Publisher’s Note: The statements, opinions and data contained in all publications are solely those of the individual author(s) and contributor(s) and not of MDPI and/or the editor(s). MDPI and/or the editor(s) disclaim responsibility for any injury to people or property resulting from any ideas, methods, instructions or products referred to in the content. |
© 2023 by the authors. Licensee MDPI, Basel, Switzerland. This article is an open access article distributed under the terms and conditions of the Creative Commons Attribution (CC BY) license (https://creativecommons.org/licenses/by/4.0/).
Share and Cite
MDPI and ACS Style
Yu, B.; Shen, C.; Peng, H.; Guo, F. Laboratory Model Test and Field In Situ Test of Distributed Optical Fiber Monitoring of Seepage in a Karst Depression Reservoir Basin. Water 2023, 15, 1477. https://doi.org/10.3390/w15081477
AMA Style
Yu B, Shen C, Peng H, Guo F. Laboratory Model Test and Field In Situ Test of Distributed Optical Fiber Monitoring of Seepage in a Karst Depression Reservoir Basin. Water. 2023; 15(8):1477. https://doi.org/10.3390/w15081477
Chicago/Turabian StyleYu, Bo, Chunyong Shen, Hao Peng, and Fawang Guo. 2023. "Laboratory Model Test and Field In Situ Test of Distributed Optical Fiber Monitoring of Seepage in a Karst Depression Reservoir Basin" Water 15, no. 8: 1477. https://doi.org/10.3390/w15081477
Note that from the first issue of 2016, this journal uses article numbers instead of page numbers. See further details here.